Emerging Markets

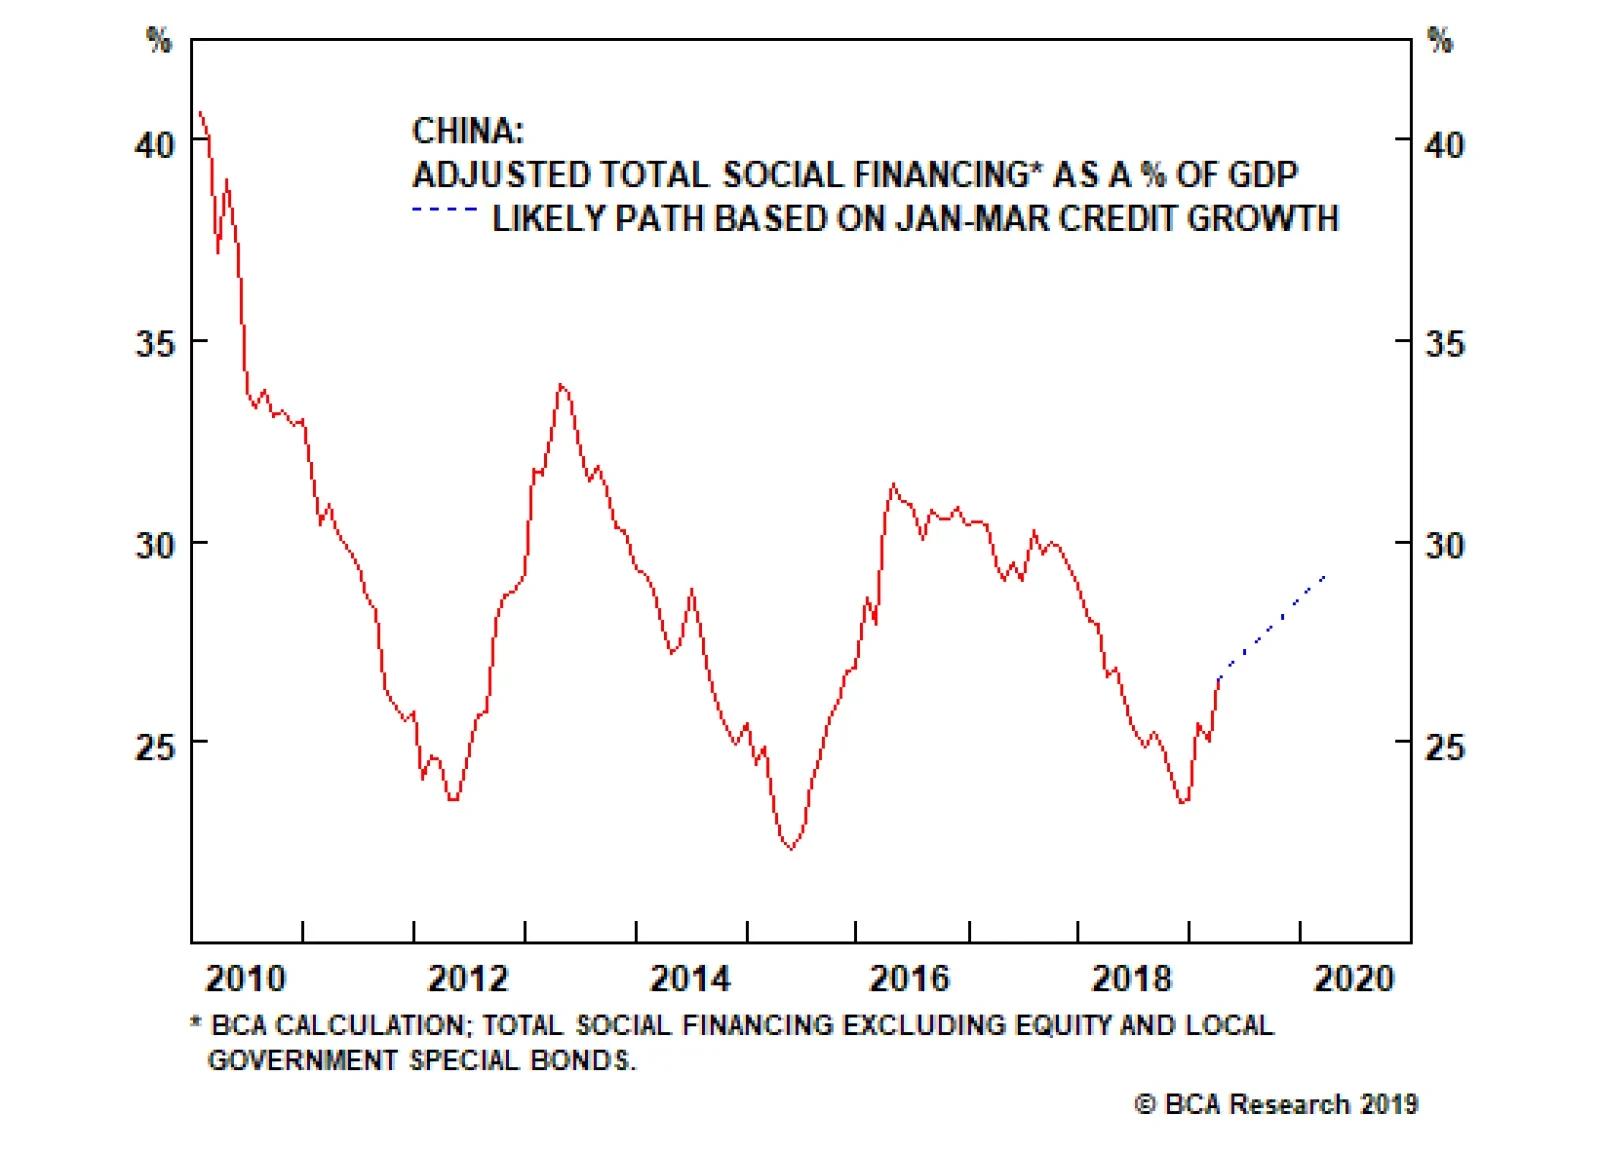
Highlights Chinese credit origination surpassed expectations in March. Credit growth is now clearly trending higher, and the latest data suggest that economic activity is rebounding. This bodes well for global growth. The conventional wisdom is that China’s releveraging efforts represent “short-term gain for long-term pain.” We disagree. For the most part, Chinese releveraging is inevitable, desirable, and sustainable. Credit growth is inevitable because rising debt is necessary for transforming the country’s copious savings into fixed-asset investment. It is desirable for ensuring that GDP growth stays close to trend. It is broadly sustainable because the interest rate at which the government and much of the private sector are able to borrow is well below the economy’s growth rate. In fact, under a plausible set of assumptions, faster credit growth in China could lead to a lower debt-to-GDP ratio. Stronger global growth later this year should weaken the U.S. dollar. We are closing our long DXY trade for a carry-adjusted gain of 16.4% and exiting our long USD/CNY trade for a loss of 3.1%. We are also taking profits on our short AUD/CAD, short EUR/CAD, and short EUR/RUB trades of 1.6%, 3.9%, and 8.6%, respectively, and initiating two new currency trades: short USD/RUB and long EUR/JPY. The combination of a weaker dollar and faster Chinese growth should benefit EM and European stocks. Gold hit our limit buy order of $1275/ounce and we are now long the yellow metal. Feature A Blockbuster Month For Chinese Credit Growth After turning cautious for about six months, we moved back to being bullish on global equities in late December. We also sold our put on the EEM ETF on January 3rd for a gain of 104% in anticipation of a wave of Chinese credit stimulus. Credit growth blew past expectations in January, but surprised on the downside in February. This made the March release particularly important. In the end, the March data did not disappoint those who were hoping for a solid reading. New CNY loans rose by RMB 1690 billion, above Bloomberg consensus estimates of RMB 1250 billion. Our adjusted aggregate financing measure, which excludes a number of items such as equity financing but includes local government bond issuance, rose by 12.3% year-over-year, up from 11.6% in February (Chart 1). China’s credit impulse leads the import component of its manufacturing PMI (Chart 2). The credit impulse bottomed in November 2018, which should feed into higher imports over the coming months. This week’s release of better-than-expected data on industrial production, retail sales, and housing activity all suggest that the rebound in Chinese growth is already afoot. Chart 1Chinese Credit Growth Is Rebounding...
Chinese Credit Growth Is Rebounding...
Chinese Credit Growth Is Rebounding...
Chart 2...Which Should Bode Well For Global Exports To China
...Which Should Bode Well For Global Exports To China
...Which Should Bode Well For Global Exports To China
Short-Term Gain For Long-Term Pain? At times like these, the bears are always ready with their standby argument: Sure, China may be stimulating, but all that credit growth will just make the debt bubble even bigger. Once the bubble bursts, there will be hell to pay. Long-term investors should steer clear of any growth-sensitive assets. It is a seductive argument. But it is wrong. Chinese releveraging is: 1) inevitable; 2) desirable; and 3) sustainable. The fundamental macroeconomic problem that China faces is that it consumes too little of what it produces. 1. Chinese Debt Growth Is Inevitable The fundamental macroeconomic problem that China faces is that it consumes too little of what it produces. The result is a national savings rate of 45%, by far the highest of any major economy (Chart 3). Chart 3China Still Saving A Lot
China Still Saving A Lot
China Still Saving A Lot
Chart 4From Exporting Savings To Investing Domestically And Building Up Debt
From Exporting Savings To Investing Domestically And Building Up Debt
From Exporting Savings To Investing Domestically And Building Up Debt
There was a time when China was able to export a large part of its excess production. Its current account surplus reached nearly 10% of GDP in 2007. As its economy has grown in relation to the rest of the world, running massive trade surpluses has become more difficult. This is especially true today, when the country is being targeted by the Trump administration and much of the international community for alleged unfair trade practices. As China’s ability to churn out large current account surpluses declined, the government moved to Plan B: propping up growth by recycling the country’s copious savings into fixed-asset investment. This process saw households park their savings in banks and other financial institutions which, in turn, lent the money out to companies and local governments in order to finance various investment projects. Not surprisingly, debt levels exploded higher (Chart 4). As China’s population ages and more workers leave the labor force, savings will decline. However, this is likely to be a slow process. In the meantime, further debt growth is inevitable. 2. Chinese Debt Growth Is Desirable In an ideal world, Chinese households would consume more of their incomes, leaving only enough savings to finance high-quality private and public investment projects. That is not the world we are living in. In a far-from-ideal world, we need to think about second-best solutions. Yes, a sizable share of Chinese investment spending goes towards projects of dubious value. Yet, the same could have been said about Japan’s fabled “bridges to nowhere.” One may regard the construction of a seldom-used bridge as a misallocation of capital. But what is the counterfactual? If the bridge had not been built, would the workers have found productive work? If not, then there also would have been a misallocation of capital – human capital – which is arguably a much more serious problem. In any case, keep in mind that the rate of return on private investment depends on the state of the economy. If an economy is suffering from chronic lack of demand, only the most worthwhile projects will be undertaken. As the economic outlook improves, the set of viable projects will expand. It is only when all excess private-sector savings have been depleted, and interest rates are rising, that public spending starts to crowd out private investment. 3. Chinese Debt Growth Is Sustainable Even if one accepts the proposition that China needs continued debt growth to maintain full employment, is it still possible that all this additional debt will push the economy into a full-blown debt crisis? Most self-professed “serious-minded” observers would say yes. But then again, many of these same observers were predicting that Japan was heading for a debt crisis when government debt reached 100% of GDP in the late 1990s. Today, Japan’s government debt-to-GDP ratio stands at about 240% of GDP, and yet interest rates remain at rock-bottom levels. China will avoid a debt crisis for the same reason Japan has been able to avoid one. Much of China’s debt stock is composed of state-owned enterprise, local government, and other forms of quasi-public sector debt. Credit policy in China is often indistinguishable from fiscal policy. Given the abundant supply of savings in the economy, most of this debt can be internally financed at fairly low interest rates. The standard equation for government debt dynamics says that the change in the debt-to-GDP ratio, D/Y, can be expressed as:1
Image
G - T is the primary budget deficit, r is the borrowing rate, and g is the growth rate of the economy (it is irrelevant whether r and g are defined in nominal or real terms, as long as they are both expressed the same way). China will avoid a debt crisis for the same reason Japan has been able to avoid one. The Chinese 10-year government bond yield is currently four percentage points below projected GDP growth over the next decade, which is one of the biggest gaps among the major economies (Chart 5). Arithmetically, this means that China can have as large a primary fiscal deficit as it wants. As long as r remains below g, the debt-to-GDP ratio will converge to a stable level. Chart 6 shows this point analytically.
Chart 5
Chart 6
In fact, it is possible that a permanently larger budget deficit could lead to a decline in the equilibrium debt-to-GDP ratio. How could that be? The answer is revealed by the equation above. If the debt-to-GDP ratio is fairly high to begin with and an increase in the primary budget deficit leads to higher inflation (and hence, lower real rates and/or faster nominal GDP growth), this could more than fully counteract the increase in the deficit. Chart 7Stronger Growth Coincided With Accelerating Inflation And Lower Real Rates
Stronger Growth Coincided With Accelerating Inflation And Lower Real Rates
Stronger Growth Coincided With Accelerating Inflation And Lower Real Rates
This is not just a theoretical curiosity. Historically, Chinese inflation has risen while real rates have fallen whenever GDP growth has accelerated (Chart 7). Given China’s high debt levels, even a modest amount of additional inflation could put significant downward pressure on the debt-to-GDP ratio.2 Of course, all this is predicated on the assumption that faster credit growth will not cause interest rates to rise above the growth rate of the economy. For the portion of China’s debt stock that is either directly or indirectly backstopped by the central government, this seems like a safe assumption. After all, if credit/fiscal stimulus is simply being undertaken in response to inadequate demand, there is no need for policymakers to hike rates. Things get trickier when we look at private debt. In the past, the government has encouraged state-owned banks to roll over souring loans for fear that a wave of defaults would undermine the economy and endanger social stability. More recently, however, policymakers have been backing away from this strategy due to the well-founded view that it encourages moral hazard. Faster growth in China in the second half of this year will lift Chinese imports. This will be welcome news for the rest of the world. We expect the authorities to continue taking steps to instill market discipline by allowing failing firms to, well, fail. Realistically, however, the transition to a full market-based economy will take quite a bit of time. In the interim, the government will keep cutting taxes and increasing on-budget spending in order to ensure that any decline in employment among failing firms is offset by employment growth elsewhere. In such an environment, neither a debt crisis nor a deep economic slowdown appear likely. Investment Conclusions Faster growth in China in the second half of this year will lift Chinese imports. This will be welcome news for the rest of the world.
Chart 8
Chart 9Germany Welcomes The Upturn In Chinese Credit Growth
Germany Welcomes The Upturn In Chinese Credit Growth
Germany Welcomes The Upturn In Chinese Credit Growth
While the U.S. will benefit from a revival in Chinese growth, Europe will gain even more (Chart 8). Germany, in particular, should see a pronounced acceleration in growth. China’s credit impulse leads Chinese automobile spending which, in turn, reliably leads euro area automobile exports, as well as overall exports (Chart 9). The recent rebound in the expectations component of the German ZEW index, as well as in the manufacturing output component of the April flash PMI, suggests that green shoots are starting to sprout (Chart 10). Italy should also benefit from the steep drop in bond yields since last October (Chart 11). Italian industrial production strongly surprised to the upside in February, suggesting that the euro area’s third biggest economy may have finally turned the corner. Chart 10Tentative Green Shoots Out Of Germany
Tentative Green Shoots Out Of Germany
Tentative Green Shoots Out Of Germany
Chart 11Italy: The Drop In Bond Yields Should Boost The Economy
Italy: The Drop In Bond Yields Should Boost The Economy
Italy: The Drop In Bond Yields Should Boost The Economy
The ECB will not hike rates this year even if growth shifts into higher gear, but the market will probably price in a bit more monetary tightening in 2020 and 2021. This should help lift the euro. We recommend that investors position themselves for this by going long EUR/JPY. Relatedly, we are closing our short EUR/CAD trade for a gain of 3.9%. The U.S. dollar tends to be a countercyclical currency, meaning that it moves in the opposite direction of the global business cycle (Chart 12). This countercyclicality stems from the fact that the U.S. is more geared towards services than manufacturing compared with most other economies (Chart 13). As such, when global growth accelerates, capital tends to flow from the U.S. to the rest of the world, translating into more demand for foreign currency and less demand for dollars. Chart 12The Dollar Is A Countercyclical Currency
The Dollar Is A Countercyclical Currency
The Dollar Is A Countercyclical Currency
Chart 13The U.S. Is A Low-Beta Play On Global Growth
The U.S. Is A Low-Beta Play On Global Growth
The U.S. Is A Low-Beta Play On Global Growth
A “patient” Fed and the prospect of stronger global growth in the second half of this year are bearish for the dollar. As such, we are closing our long DXY trade for a carry-adjusted gain of 16.4% and exiting our long USD/CNY trade for a loss of 3.1%. We are also closing our short AUD/CAD trade for a gain of 1.6%. Faster Chinese growth will boost metal prices, which is bullish for the Aussie dollar. Lastly, we are switching our short EUR/RUB trade (which is currently up 8.6%) into a short USD/RUB trade. A weaker greenback and stronger global growth will be manna from heaven for international stocks, especially when priced in U.S. dollars. Investors should prepare to move European and EM equities to overweight within a global equity portfolio during the coming weeks. A “patient” Fed and the prospect of stronger global growth in the second half of this year are bearish for the dollar. We are less keen on upgrading Japanese equities. While Japanese exporters will benefit from stronger Chinese growth, the domestic economy will be weighed down by the upcoming hike in the sales tax, which is slated to take place in October. Moreover, the yen is likely to experience headwinds as global bond yields rise in relation to JGB yields. Investors contemplating buying Japanese stocks should hedge any currency risk. Finally, the price of gold fell to $1275/ounce earlier this week, triggering our buy order. With the Fed on pause, the U.S. economy starting to overheat, and the dollar likely to trend lower, bullion could shine over the coming months. Peter Berezin, Chief Global Strategist Global Investment Strategy peterb@bcaresearch.com Footnotes 1 Please see Global Investment Strategy Weekly Report, “Is There Really Too Much Government Debt In The World?” dated February 22, 2019, for a fuller discussion of this debt sustainability equation.
Image
Strategy & Market Trends MacroQuant Model And Current Subjective Scores
Chart 14
Tactical Trades Strategic Recommendations Closed Trades
Highlights The political economy of oil will become even more complicated, following remarks by Russian Finance Minister Anton Siluanov over the weekend, which suggested policymakers there are considering another market-share war to crash prices to limit the growth of U.S. shales. The logic appears to be that by abandoning OPEC 2.0’s production-cutting deal and pushing Brent prices below $40/bbl once again for a year or so, Russia will severely reduce investment flow to the U.S. shale-oil patch, allowing it to retake global market share ceded mostly to Texas oil producers.1 The threat of a market-share war was proffered on top of stepped-up rhetoric by senior government officials – ranging from Igor Sechin, head of state-owned Rosneft Oil, to Kirill Dmitriev, CEO of the Russian Direct Investment Fund (RDIF) – indicating Russia will be pushing for higher production by OPEC 2.0 in 2H19 at the coalition’s upcoming June meeting. We agree with this assessment: The market will require OPEC 2.0 to lift production in 2H19, given our assessment of supply-demand balances. In our estimation, OPEC 2.0’s position has been strengthened considerably by policy-induced disruptions to the oil market.2 As such, we believe Russia’s threat of a market-share war is a feint, particularly since Russia has benefited greatly from higher prices (see below). Our balances and price forecasts this month are largely unchanged (Chart of the Week). We continue to expect Brent to average $75/bbl this year. For 2020, we expect Brent to average $80/bbl. WTI will trade $7 and $5/bbl lower (Chart 2). The balance of price risk has shifted slightly to the left side of the distribution, driven by policy risk and potential miscalculation by the dramatis personae on the international stage, chiefly leaders in the U.S., Russia and China. Chart of the WeekMarkets Continue To Track BCA Balances...
Markets Continue To Track BCA Balances...
Markets Continue To Track BCA Balances...
Chart 2...While Prices Continue Tracking BCA Forecasts
...While Prices Continue Tracking BCA Forecasts
...While Prices Continue Tracking BCA Forecasts
Highlights Energy: Overweight. Tensions in Libya could keep ~ 300k b/d of supply from reaching global markets via its Zawiya port near Tripoli. We closed our long June 2019 $70/bbl vs. short $75/bbl call spread last Thursday with a gain of 87.7%.3 Base Metals: Neutral. China’s latest credit data confirms our view the country’s credit cycle bottomed earlier this year: March Total Social Financing (TSF) increased CNY 2.8 trillion month-on-month vs. consensus expectation of CNY 1.7 trillion. This will support base metals in the coming months. We continue to expect Chinese authorities to expand credit in 2H19.Our long copper trade is up 0.7% since inception on March 7, 2019. We are closing out our tactical iron-ore trade – long 65% Fe vs. short 62% Fe at tonight’s close; it was up 22.9% at Monday’s close. Precious Metals: Neutral. Gold fell 4% from its February high on easing inflation concerns and as fears of an equity correction subsided. March U.S. PCE ex-food and -energy dropped to 1.79% yoy from 1.95% in February, while global equities rose 14% YTD. Our long gold recommendation is down 2.4% since last week, but is still up 3.6% since inception on May 4, 2017. Agriculture: Underweight. U.S. corn and wheat farmers are behind schedule in their spring planting, according to USDA data. The top four American corn-producing states had not started planting by last week, while spring and winter wheat producing states are 11% and 3% behind schedule, mostly due to weather conditions. While delays in planting are always cause for concern, we are still early in the planting season, which gives farmers time to catch up. Feature Policy uncertainty vis-à-vis global oil supply was elevated by Russian Finance Minister Anton Siluanov’s comments indicating policymakers are considering reviving an oil market-share war directed at U.S. shale-oil producers. Siluanov said prices could fall to $40/bbl or less, in the event. Russian President Vladimir Putin, who, among the policy elites of Russia, remains primus inter pares, has indicated he is satisfied with prices where they are now His remarks come on the back of statements from Russian government and oil company officials lobbying for higher output. These comments suggest there is a heavyweight Russian contingent fully supporting these demands for OPEC 2.0 to increase production in 2H19 when it meets in June. Otherwise, the threat implies, Russia will seriously consider leaving OPEC 2.0, and will launch its own market-share war against U.S. shale-oil production, led by the fast-growing Permian Basin in Texas. Thus far, Russian President Vladimir Putin, who, among the policy elites of Russia, remains primus inter pares, has indicated he is satisfied with prices where they are now – nicely above $70/bbl in the Brent market. He also wants to maintain cooperation with OPEC 2.0, particularly its other putative leader, KSA. We continue to believe, however, KSA and Russia become less comfortable with Brent prices moving sharply above $80/bbl.4 Nonetheless, the threat posed by the U.S. shales is non-trivial: In our latest balances estimates, we raised our 2H19 U.S. output estimates to 12.53mm b/d, and slightly decreased our 2020 estimates to 13.35mm b/d”, led by a 1.17mm b/d and 0.84mm b/d increase in shale output this year and next (Chart 3). Chart 3U.S. Oil Production Estimate Higher For Shales
U.S. Oil Production Estimate Higher For Shales And GOM
U.S. Oil Production Estimate Higher For Shales And GOM
However, Russia – and OPEC 2.0 generally – may be overestimating the rate of growth from U.S. shales going forward: In future research, we will be exploring the extent to which capital markets will restrain growth in the U.S. shales, as investors continue to demand higher returns. The days of growing shale production at any cost may be coming to an end. Russia’s Threat Is A Feint We believe Russia’s threat of a market-share war is a feint: A market-share war would damage the Rodina’s economy more than the balance sheets of U.S. shale producers, particularly those that hedge the first year or two of their production. The threat needs to be understood in the context of the deterioration of Russia’s position in Venezuela; the increasing tempo of U.S. military operations in its near abroad; and rapidly evolving global oil and gas trade flows, all of which are working against Russian interests and investments.5 The threat appears to be a not-too-subtle reminder of the havoc Russia still can create globally, should it choose to do so, as Vladimir Rouvinski noted recently re Russia’s Venezuela policy.6 Russia almost surely is better off under the production-cutting regime launched by OPEC 2.0 than it would be in another price war. Russia’s GDP elasticity to oil prices is more than twice that of KSA’s, which we demonstrated last week.7 This means, from an economic standpoint, it benefits more from higher prices than the Kingdom, based on our modeling. Russia’s oil is exported to refiners and trading companies who pay whatever price is clearing the market, versus KSA, which relies more on direct investments in end-use markets to serve captive demand, and whose GDP has a higher sensitivity to EM economic growth. Russia almost surely is better off under the production-cutting regime launched by OPEC 2.0 than it would be in another price war. The coalition’s production-cutting deal this year has reduced global supplies by 1.0mm b/d since the beginning of the year, lifting price from below $50/bbl to more than $70/bbl, in line with our forecast. These production cuts have been supported by strong global demand this year this, which, we expect, will persist in 2020. Of course, Russia could abandon the production-cutting deal with KSA, in the hope of severely reducing investment in U.S. shale-oil production. However, it also would accelerate the loss of foreign direct investment (FDI) in its own hydrocarbons sector, along with those of other OPEC 2.0 member states (Chart 4). Bottom Line: A Russian market-share war aimed at U.S. shale producers would run the very real risk of tanking Russia’s GDP and those of the rest of OPEC 2.0’s member states, as these economies lack the resilience and diversification of the U.S.’s GDP, particularly Texas’s. Even if its fiscal balances are in better shape now, Russia’s economy remains highly sensitive to Brent crude oil prices – moreso than KSA’s, and far moreso the U.S.’s (Chart 5).8 Chart 4Another Oil Market-Share War Would Crush OPEC 2.0 In-Bound FDI
Another Oil Market-Share War Would Crush OPEC 2.0 In-Bound FDI
Another Oil Market-Share War Would Crush OPEC 2.0 In-Bound FDI
Chart 5Russia Benefits More Than KSA From Higher Oil Prices
Russia Benefits More Than KSA From Higher Oil Prices
Russia Benefits More Than KSA From Higher Oil Prices
BCA’s Balances Mostly Unchanged Our updated balances reflect the lower Venezuelan and Iranian output reported by OPEC’s survey of secondary sources (Table 1). As we have noted previously, we believe OPEC 2.0’s spare capacity is sufficient to cover the loss of Venezuelan output, and the limited losses on Iranian exports imposed by U.S. sanctions (Chart 6). Beyond that, however, the market will be severely stretched if an unplanned outage removes significant production from global supply. Table 1BCA Global Oil Supply - Demand Balances (MMb/d, Base Case Balances)
Russia Posits Oil Market-Share War: Red Herring Or Real Threat?
Russia Posits Oil Market-Share War: Red Herring Or Real Threat?
On the supply side, we continue to expect OPEC and Russia to lift supply in 2H19, following the successful draining of global inventories (Chart 7). We expect OPEC ex-Iran, Libya and Venezuela, led by KSA, will lift 2H19 supply by ~ 400k b/d vs. 1H19 levels, while we expect Russia’s output to rise 200k b/d.
Chart 6
Chart 7Lower Inventories Require OPEC 2.0 Supply Increase In 2H19
Lower Inventories Require OPEC 2.0 Supply Increase In 2H19
Lower Inventories Require OPEC 2.0 Supply Increase In 2H19
We continue to expect oil demand to be supported by the renewed easing of monetary policy globally, which will redound to the benefit of EM demand, which also will benefit from the bottoming of China’s credit cycle. Indeed, the EIA added 130k b/d to its estimate of non-OECD demand for this year, on the back of stronger expected growth. We expect demand growth of 1.5mm b/d this year and 1.6mm b/d next year, with EM growth accounting for 1.1mm b/d of growth this year and 1.3mm b/d next year. In levels, global demand will average 101.8mm b/d and 103.4mm b/d in 2019 and 2020. Waivers On U.S. Iran Sanctions Will Be Extended We continue to expect waivers on U.S. sanctions of Iranian oil imports will be extended on May 2, owing to the still-tight supply conditions globally with Venezuela output collapsing and ~ 1mm b/d of Iranian oil already forced off the market. This has, as we’ve noted in our discussions of the New Political Economy of oil, strengthened OPEC 2.0’s hand. This will become apparent when the coalition meets in June to consider whether to increase production in 2H19, in line with our expectation. KSA, Russia and OPEC 2.0 member states will have sufficient data on hand to determine whether and by how much to lift output, in a manner that supports their GDPs. Indeed, on Wednesday, Russian Energy Minister Alexander Novak said, “We should do what is more expedient for us.”9 KSA and Russia appear to be managing production in a manner consistent with our forecasts of $75 and $80/bbl for Brent this year and next than not. We also expect U.S. President Donald Trump to try to jawbone OPEC 2.0 into increasing production again, as he did in 2H18. However, we expect those demands to fall on deaf ears, unless fundamental supply dislocations warrant such action. Bottom Line: OPEC 2.0’s strategy is working – it will have maximum flexibility re how it handles its production in 2H19, following the U.S. decision on waivers to its Iran oil-export sanctions on May 2. As we noted last month, KSA and Russia appear to be managing production in a manner consistent with our forecasts of $75 and $80/bbl for Brent this year and next than not. Robert P. Ryan, Chief Commodity & Energy Strategist rryan@bcaresearch.com Hugo Bélanger, Senior Analyst Commodity & Energy Strategy HugoB@bcaresearch.com Footnotes 1 OPEC 2.0 is the name we coined for the OPEC/Non-OPEC oil-producer coalition led by the Kingdom of Saudi Arabia (KSA) and Russia. It agreed in November to remove 1.2mm b/d off the market, in order to balance global supply and demand and reduce inventories. Please see “Russia, OPEC may ditch oil deal to fight for market share: Russian minister,” published April 13, 2019, for a re-cap of Siluanov’s remarks. 2 Please see “The New Political Economy of Oil,” published by BCA Research’s Commodity & Energy Strategy February 21, 2019; and “OPEC 2.0: Oil’s Price Fulcrum,” published March 21, 2019. It is available at ces.bcaresearch.com. 3 Please see “Oil steadies as market focuses on supply risks,” published April 15 2019 by reuters.com 4 Please see “Putin Says No Imminent Decision on Oil Output Cuts,” published April 10, 2019, by The Moscow Times. 5 Please see for example, “Pentagon developing military options to deter Russian, Chinese influence in Venezuela,” published by cnn.com April 15, 2019; “Destroyer USS Ross Enters Black Sea, Fourth U.S. Warship Since 2019,” published by news.usni.org April 15, 2019; and “U.S. LNG exports pick up, with Europe a major buyer,” published by reuters.com March 7, 2019. 6 Please see “Russian-Venezuelan Relations at a Crossroads” by Vladimir Rouvinski, published by the Wilson Center’s Kennan Institute in its February Latin American digest. 7 Please see “Sussing Out OPEC 2.0’s Production Cuts, U.S. Waivers On Iran Sanctions,” published by BCA Research’s Commodity & Energy Strategy April 11, 2019. It is available at ces.bcaresearch.com. 8 We discuss the impact of higher oil prices on Russia’s economy in last week’s report, which is cited in footnote 6 above. Russia’s GDP in 2017 was ~ U.S. $1.6 trillion, according to the World Bank, while the GDP of Texas was ~ $1.7 trillion, American Enterprise Institute. 9 Please see “Russia’s Novak: early to speak about options for oil output deal,” published reuters.com April 17, 2019. Investment Views and Themes Recommendations Strategic Recommendations Tactical Trades TRADE RECOMMENDATION PERFORMANCE IN 2019 Q1
Image
Commodity Prices and Plays Reference Table Trades Closed in 2019 Summary of Closed Trades
Image
Highlights In China, “helicopter” money and the socialist put are positive for growth in the medium term but will prove harmful for the economy over the long run. In the socialist put scenario, a buy-and-hold strategy is inappropriate for Chinese stocks. The enormous amount of money supply in China is “the sword of Damocles” on the yuan’s exchange rate. A new equity trade: Short Chinese banks / long U.S. banks. Take profits on our short Chinese property developers / long U.S. homebuilders equity position. Feature Last week’s China credit and money data affirmed that Chinese banks have engaged in another round of massive credit and money injection into the economy. In the first quarter alone, aggregate credit rose by RMB 8.5 trillion (US$1.3 trillion). Aggregate credit growth accelerated to 11.6%, well above first-quarter nominal GDP growth of 8% (Chart I-1). This is in spite of numerous pledges by many of China’s top policymakers that they have no plans to resort to “floodgate irrigation” style stimulus, and that credit/money growth will be kept on par with nominal GDP growth. Our credit and fiscal spending impulse has spiked up, pointing to a potential improvement in economic data in the months ahead (Chart I-2). Chart I-1China: No Deleveraging At All
China: No Deleveraging At All
China: No Deleveraging At All
What’s more, there is anecdotal evidence of a revival of housing demand in March, and that property developers have once again commenced bidding up land prices in certain parts of the country. Chart I-2China: Leading Economic Indicators
China: Leading Economic Indicators
China: Leading Economic Indicators
Regarding investment strategy, two weeks ago we put a stop-buy limit on the MSCI EM stock index at 1125. If this index breaks above this level we will turn tactically positive on EM risk assets. There is anecdotal evidence of a revival of housing demand in March, and that property developers have once again commenced bidding up land prices in certain parts of the country. Below are the pros and cons of upgrading the EM outlook at the current juncture. Pros The credit impulse in China leads both the mainland’s business cycle and the global manufacturing cycle by an average of nine months. Given its bottom was in December 2018, the trough in the mainland business and global industrial cycles should have been around August 2019 (Chart I-3). Chart I-3Global Manufacturing PMI Has Not Led Global Stocks
Global Manufacturing PMI Has Not Led Global Stocks
Global Manufacturing PMI Has Not Led Global Stocks
Our assessment has been that the bottom in EM equities that occurred in late December 2018 was too early. Our basis has been that the Chinese and global manufacturing cycles were not likely to bottom before August 2019, according to their previous relationship with China’s credit and fiscal spending impulse. Consequently, we have been expecting China-related plays in financial markets to experience a setback before a more sustainable buying opportunity emerged. However, as China’s credit recovery is now gaining momentum and infrastructure spending financed by local government special bonds is accelerating, the window of downside risk for share prices is narrowing. There have been no recent major stimulus measures directed at China’s property market, but it appears banks have substantially boosted mortgage loan origination and their financing of property developers by loosening lending standards. Easy financing for both homebuyers and property developers makes a revival in real estate more likely. The property market and construction activity are critical to the mainland’s business cycle. If green shoots in the property market multiply, the odds of an overall growth recovery will rise substantially. Finally, if the EM equity index breaks above our stop-buy limit, it would clear an important technical resistance level, confirming the sustainability of this rally (Chart I-4). Cons EM corporate profit growth is contracting in U.S. dollar terms, and the pace of contraction will deepen into the end of this year. This assessment is based on the previous decline in China’s credit impulse. The latter suggests a bottom in EM EPS in December 2019 (Chart I-5). It is still unclear whether EM share prices can ignore this profit contraction and advance through the entire year without major bumps. Chart I-4EM Stocks Are Facing Technical Resistance
EM Stocks Are Facing Technical Resistance
EM Stocks Are Facing Technical Resistance
Chart I-5EM Profits Will Continue Contracting
EM Profits Will Continue Contracting
EM Profits Will Continue Contracting
As of March, Chinese domestic smartphone sales (Chart I-6), as well as Korean, Japanese, Singaporean and Taiwanese exports to the mainland, are all still shrinking at double-digit rates from a year ago (Chart I-7). Chart I-6China: Consumer Spending In March Was Still Weak
China: Consumer Spending In March Was Still Weak
China: Consumer Spending In March Was Still Weak
Chart I-7Exports To China Contracted At A Double-Digit Rate In March
Exports To China Contracted At A Double-Digit Rate In March
Exports To China Contracted At A Double-Digit Rate In March
Our indicators for marginal propensity to consume for Chinese households and companies remain in a downtrend as of March (Chart I-8). An upturn in these indicators is needed to validate that the fiscal and credit stimulus is accompanied by a greater multiplier effect. Chart I-8China: Marginal Propensity To Spend By Consumers And Enterprises
China: Marginal Propensity To Spend By Consumers And Enterprises
China: Marginal Propensity To Spend By Consumers And Enterprises
Chart I-9Low Vol Precedes A ##br##Regime Shift
Low Vol Precedes A Regime Shift
Low Vol Precedes A Regime Shift
Finally, financial markets’ aggregate volatility is extremely low (Chart I-9). This is especially true for the currency markets (Chart I-10, top panel). Typically, this is a sign of both complacency and a forthcoming major regime shift in financial markets. Chart I-10The Dollar Is Poised To Break Out Or Break Down
The Dollar Is Poised To Break Out Or Break Down
The Dollar Is Poised To Break Out Or Break Down
We would be much more comfortable upgrading the EM outlook if the broad trade-weighted U.S. dollar broke down, corroborating the improvement in global/EM growth. So far, the greenback has been moving sideways along its 200-day moving average (Chart I-10, bottom panel). If the dollar breaks out, it would confirm the negative outlook for EM. Investors should closely watch foreign exchange markets and adjust their investment strategy accordingly. “Helicopter” Money Forever = A Socialist Put China’s forthcoming recovery is good news for financial markets. Nonetheless, the long-term outlook for the Chinese economy is deteriorating because the credit and money, as well as property bubbles, will keep expanding. First, China holds the world record with respect to corporate sector leverage (Chart I-11). Second, households in China are more leveraged than those in the U.S. (Chart I-12). Given that borrowing costs for households are higher in China than in the U.S., interest payments take up a larger share of Chinese households’ disposable income. Chart I-11Corporate Sector Leverage: China Holds The World Record
Corporate Sector Leverage: China Holds The World Record
Corporate Sector Leverage: China Holds The World Record
Chart I-12Chinese Households Are More Leveraged Than Americans
Chinese Households Are More Leveraged Than Americans
Chinese Households Are More Leveraged Than Americans
Third, contrary to popular belief, banks do not channel savings/deposits into credit. They create deposits/money supply when they lend to or buy assets from non-banks. Money supply is the sum of deposits and cash in circulation. Financial markets’ aggregate volatility is extremely low. This is especially true for the currency markets. In a nutshell, credit and money excesses in China are not natural outcomes of the nation’s high savings rate but are the result of reckless credit origination by China’s commercial banks. We have elaborated on this point in a series of reports we have written on credit, money and savings.1 When commercial banks originate a loan, they create new money and new purchasing power “out of thin air.” Nobody needs to save for a bank to make a loan or buy assets. Consequently, new purchasing power for goods and services boosts demand in the real economy and inflates asset prices. Chinese banks have literally been dropping “helicopter” money over the past 10 years. Since January 2009 – the onset of the country’s massive credit binge – banks have created 165 trillion yuan ($25 trillion) of new broad money, based on our measure of M3 broad money. This is triple of the $8.3 trillion broad money supply created in the U.S., the euro area and Japan combined during the same period (Chart I-13, top panel). Chart I-13Helicopter Money In China
Helicopter Money In China
Helicopter Money In China
China’s broad (M3) money supply now stands at 220 trillion yuan, equivalent to $32.5 trillion. What’s astonishing is that Chinese broad money is larger than the sum of broad money in both the U.S. and the euro area (i.e. all outstanding U.S. dollars and euros in the world combined) (Chart I-13, bottom panel). Yet China’s nominal GDP is only 38% of U.S. and euro area’s GDP combined. Credit and money excesses in China are not natural outcomes of the nation’s high savings rate but are the result of reckless credit origination by China’s commercial banks. In a market-based economy, the constraints on banks doing “helicopter” money are bank shareholders, regulators and central banks. Bank shareholders are the primary and largest losers from credit booms because they are highly exposed to non-performing loans. That is why they should be the first to cut credit flows to the economy when they sense non-payments on loans could rise. In China, neither bank shareholders nor bank regulators or the People’s Bank of China have prevented banks from expanding credit/money. Moreover, the authorities have not forced banks to acknowledge non-performing loans. This scenario – whereby banks expand credit without taking responsibility for collecting the loans – only occurs in a socialist system. This is the ultimate socialist put. China’s Potential Growth Roadmaps We have been arguing for several years that China is facing a historic choice between: (1) Moving toward a more market-based economic system that entails making creditors and borrowers take responsibility for their lending/borrowing and investment decisions. If lenders and borrowers are made explicitly accountable for their business/financial decisions, then credit flows will decelerate considerably, bankruptcies will mushroom and a period of deleveraging will be inevitable. However, the quality of capital allocation will improve, enhancing the country’s productivity and potential growth in the long run (Chart I-14).
Chart I-14
This is a scenario of medium-term pain, long-term gain. The recent ramp-up in credit growth does not suggest the authorities are willing to embrace this option. Chart I-15China: Structural Growth Tailwinds Have Dissipated
China: Structural Growth Tailwinds Have Dissipated
China: Structural Growth Tailwinds Have Dissipated
(2) “Helicopter money” and a socialist put scenario entails lower potential GDP growth and rising inflation. If China continues opting to keep the socialist put in place, its potential growth rate – which is equivalent to the sum of growth rates in productivity and the labor force – will drop significantly. In the long run, this socialist put discourages innovation and breeds capital misallocation, reducing productivity growth. In fact, the industrialization ratio is 85% – not 60% as many contend(Chart I-15, top panel). Further, China’s labor force growth has stalled and will be mildly negative in the years to come (Chart I-15, bottom panel). Together, these circumstances point to a slower potential growth rate. Meanwhile, recurring stimulus via “helicopter” money will create mini-cycles around a falling potential growth rate (Chart I-16). Below we discuss the investment strategy this scenario entails.
Chart I-16
Implications Of The Socialist Put For The Currency… Slowing productivity and rampant money/purchasing power creation ultimately lead to rising inflation. Higher inflation and low interest rates - required to sustain an ever-rising debt burden - are a recipe for currency depreciation. Chinese households and businesses are eager to diversify their copious and mushrooming renminbi deposits into foreign currencies and assets. The PBoC’s foreign exchange reserves of $3 trillion are equal to only 10% of the amount of yuan deposits and cash in circulation. Foreign exchange reserves’ coverage of local currency money supply is much higher in many other EM countries, including Brazil and Russia (Chart I-17). Chart I-17China's FX Reserves Cover Less Local Currency Deposits Than Peers
China's FX Reserves Cover Less Local Currency Deposits Than Peers
China's FX Reserves Cover Less Local Currency Deposits Than Peers
The enormous amount of money supply/deposits in China is “the sword of Damocles” on the yuan’s exchange rate in the long run. It is therefore inconceivable that China can fully open its capital account in the foreseeable future. On the contrary, capital account restrictions will be further tightened. Plus, the current account will become much more regulated so that there is no leakage of capital via trade transactions – such as over-invoicing of imports or under-invoicing of exports. The inability to repatriate capital when needed and structural RMB depreciation are the key risks to long-term investors in China’s onshore capital markets. …And Chinese Stocks In the socialist put scenario, a buy-and-hold strategy is inappropriate for Chinese stocks: Investors should attempt to play the resultant mini-cycles (Chart I-16). In reality, however, economic and especially financial market mini-cycles are not symmetric, and investors can make money only if they time them properly. In fact, this decade Chinese share prices – both in absolute terms and relative to global stocks – have experience wild swings (Chart I-18). Chart I-18Chinese Stocks Are Following Mini-Cycles
Chinese Stocks Are Following Mini-Cycles
Chinese Stocks Are Following Mini-Cycles
Concerning the current outlook for Chinese investable stocks, our take is as follows: On absolute performance, we will turn positive on Chinese share prices if our stop-buy on EM equities is triggered, as per our discussion above. As for their relative performance within EM and global equity portfolios, simply because the stimulus originates in China does not warrant an overweight position in Chinese stocks. The primary losers from credit bubbles are banks and other financial companies. The basis is that they will carry the burden of potential rising non-performing loans unless the government bails them out by purchasing bad assets at par. The latter has not been the case so far this decade. Hence, an underweight position in Chinese banks/financials is currently warranted. Furthermore, the large debtors in the non-financial corporate sector should also be underweighted. When a company increases its debt but its new investments produce little net new cash flow, its equity value declines. It is difficult to find so many high-return investment projects, especially in a slowing economy. Therefore, another round of considerable capital misallocation is currently underway, and shareholders of the companies that are undertaking these investments will end up losing. In a socialist system, shareholders typically do not make money. They lose money. This is the rationale to underweight Chinese stocks within both EM and global equity portfolios. Yet, there is a caveat: This framework may not be pertinent to the two largest companies in the Chinese investable equity index Ali-Baba and Tencent - each of which accounts for 13% of the index. These two companies score well on the above issues but face different non-macro hazards including regulatory, business model and other risks. Weighing the pros and cons, we recommend maintaining a market weight allocation in Chinese equities within an EM equity portfolio. This is the view of BCA’s Emerging Markets Strategy team, which differs from the recommendations of other BCA services that are currently advocating an overweight position in Chinese stocks within a global equity portfolio. A New Trade: Short Chinese Bank / Long U.S. Bank Stocks Chinese banks’ equity value will erode as they once again expand their balance sheets aggressively, as per our discussion above. Chinese banks’ EPS have been and will continue to be diluted by the need to raise more capital. U.S. banks are better capitalized, and their asset quality is much better. Since the 2007-08 credit crisis, they have been much more prudent in expanding their balance sheets. U.S. bank stocks have underperformed the S&P 500 index since August 2018 because of falling U.S. interest rate expectations. The odds are high that U.S. bond yields are bottoming and will rise considerably – because the drag from China’s slowdown on the global economy is diminishing. This will help U.S. bank stocks. Although Chinese bank stocks optically appear undervalued, they are “cheap” for a reason. The fact that they have been “cheap” since 2011 and have failed to re-rate confirms that they suffer from chronic problems that have not been addressed yet (Chart I-19). Finally, their relative performance is facing a major resistance level, and will likely relapse (Chart I-20). Chart I-19Chinese Banks Are Cheap##br## For A Reason
Chinese Banks Are Cheap For A Reason
Chinese Banks Are Cheap For A Reason
Chart I-20A New Trade: Short Chinese Banks / Long U.S. Banks
A New Trade: Short Chinese Banks / Long U.S. Banks
A New Trade: Short Chinese Banks / Long U.S. Banks
Take Profits On Short Chinese Property Developers / Long U.S. Homebuilders Position “Helicopter” money might be temporary positive for mainland property developers. In the meantime, share prices of U.S. homebuilders will be hurt due to rising U.S. bond yields. We are closing this position to protect profits. This recommendation has produced a 90% gain since its initiation on March 6, 2012. Arthur Budaghyan Chief Emerging Markets Strategist arthurb@bcaresearch.com Footnotes 1 Please see Emerging Markets Strategy Special Report "Misconceptions About China's Credit Excesses," dated October 26, 2016 and Emerging Markets Strategy Special Report "The True Meaning Of China's Great 'Savings' Wall," dated December 20, 2017, available at ems.bcaresearch.com Equity Recommendations Fixed-Income, Credit And Currency Recommendations
There are four non-trivial risks to a bullish relative stance towards Chinese stocks over the coming year. The trade deal between the U.S. and China falls through or substantially underwhelms. A full resumption of the trade war would definitely cause…
In an optimistic scenario, Chinese investable and domestic stocks have the potential to earn double-digit returns (12-15%) in US$ terms relative to global stocks over the coming year. Conservatively, our China Investment Strategy team expects high…
Our China Investment Strategy team uses monetary conditions, money, and credit growth to reliably predict Chinese “investment-relevant economic activity”. Chinese activity, in turn, has reliably led investable equity earnings growth, and we have therefore…
Dear Client, This Special Report is the full transcript and slides of a keynote presentation I recently gave to the Sovereign Investor Institute in London titled: 'The Biggest Risks To The Global Economy Are…' The short presentation pulls together several concepts and observations which identify the ‘weak links’ in the global economy. Therefore, the presentation should serve as a useful summary of the global economy’s current vulnerabilities. The report then explains how each of the risks translates into a European investment context. I hope you find it insightful. Best regards, Dhaval Joshi, Chief European Investment Strategist
Image
Feature Full Transcript And Slides
Image
Good morning Thank you for inviting me to give today’s keynote presentation under the title: ‘The Biggest Risks To The Global Economy Are…’ (Slide 1). I will not discuss all the risks out there, but the four risks that I will present are the ones that I think are the most significant. And the biggest of these four risks I will leave to the end. So let’s begin. Risk 1 is China’s Credit Cycle (Slide 2). You can see this very clearly in this slide (Slide 3) which shows the short-term accelerations and decelerations in credit within the world’s three largest economies – Europe, the United States, and China. In essence, it is showing how much new credit was created in the last six months compared with the preceding six months. Was it more credit creation or was it less, and how much more or less? Everything is in dollars to allow a fair comparison.
Image
Image
Now look at the red line. The red line is China. Just ten years ago, China’s credit cycle was irrelevant. It simply didn’t matter. But after the GFC, China’s short-term credit expansions and contractions suddenly became as large as those in Europe and the U.S. More recently, China’s cycle is dwarfing the others, so now it is the European and the U.S. credit cycles that are irrelevant! This means that whenever China’s short-term credit cycle turns down, as it did in late 2015, early 2017, and 2018, the global economy feels a chill. The point is that this short-term cycle is a near-perfect oscillator. Down-oscillations will occur every eighteen months or so, and any of them has the potential to turn nasty. Though we are currently in an up-oscillation, the next down-oscillation is due later this year. And I predict that it will pose a big risk to the global economy. Risk 2 is Trade Imbalances (Slide 4). This slide (Slide 5) has a mischievous title ‘Where President Trump Is Right About Europe’. The red line shows where the president is absolutely right: Europe is running a massive – a record-high – trade surplus with the United States. It is an undeniable fact. But the president is wrong about the underlying cause. The underlying cause is not unfair trade practices or tariffs, the underlying cause is the other line, the blue line, which shows the divergent monetary policies of the ECB and the Fed.
Image
Image
The trade imbalance and monetary policy divergence are moving together tick for tick, and the transmission mechanism is of course the exchange rate. The divergent monetary policies have depressed the euro, and a depressed euro obviously makes German cars cheaper for American consumers. That is the reason that the president is seeing so many BMWs driving down Fifth Avenue! My point is that these record-high imbalances are being used to justify economic nationalism – retaliatory tariffs, restricted trade, and potentially all-out trade wars. Alternatively, this chart suggests that the imbalances would correct with large-scale movements of exchange rates. But to me, either of these options poses a big risk to the global economy. Risk 3 Is Technological Disruption (Slide 6). To understand why, I want to introduce you to a concept known as Moravec’s Paradox (Slide 7). A professor of robotics, Hans Moravec, noticed something odd. He realized that things that we find very hard are actually very easy for AI. Things like complex mathematics, speaking multiple languages, or advance pattern recognition. Typically, as few people have these skills, they are well-paid skills.
Image
Image
Whereas things that we find very easy are incredibly difficult for AI. Things like human movement and recognizing, and responding to, emotional signals. Typically, as everybody has these skills, they are low-paid skills. Moravec’s Paradox means that the current wave of technological progress is much more disruptive than previous waves. The steam engine destroyed low-paid jobs, forcing workers up the income ladder. But the current wave of technology, led by AI, is destroying well-paid jobs forcing workers down the income ladder.
Image
You can see it in the data. While job creation in most major economies is on the face of it very strong, just look at what type of jobs are being created (Slide 8). Food delivery, bar work, care work and social work. Now you’ll agree that this is not highly paid work with career prospects! In essence, the current wave of technology is revealing a huge misallocation of capital. You might have invested huge amounts of time and money in say, becoming a linguist. Only to find that AI can translate languages much better than you – and your employment opportunities are limited to lower-income work. Well that misallocation of capital is very disruptive. In my opinion, it’s one of the main reasons why even though economies are growing and unemployment is very low, people don’t feel good. Making them susceptible to simplistic fixes such as ‘take back control’ and economic nationalism. My point is that the current wave of AI-led job disruption has much further to run, and the populist backlash will remain a big risk to the global economy. But now I want to turn to what I believe is the biggest risk of all. Risk 4 Is Higher Bond Yields (Slide 9). Most people believe that economic downturns cause financial market downturns. But the truth is the complete opposite: the causality almost always runs the other way! In the vast majority of cases, it is financial market imbalances and mispricing that cause economic downturns and crises. Take the last three economic downturns – in 2001, in 2008 and in 2011. They all had their roots in financial mispricing – the dot com bubble, the U.S. mortgage market, and euro area sovereign debt. Likewise for the Great Depression in the 30s, Japan’s recession in the early 90s. I could go on. You get the point… What is the financial vulnerability today that could cause an economic downturn? (Slide 10) The answer is that the very rich valuation of equities and other risk-assets is highly sensitive to bond yields. Which means that substantially higher bond yields pose a very big risk to the global economy.
Image
Image
You see, at very low bond yields, the bond price can no longer go up much but it can go down massively (Slide 11). The latest advances in financial theory now conclusively show that this unattractive ‘negative’ asymmetry is what defines ‘risk’ for investors. The crucial point is that at low bond yields, bonds become as risky, or more risky, than equities (Slide 12). And this necessarily means that equities no longer need to deliver a superior return, a risk-premium, over the low bond yield (Slide 13). As bond yields decline this means equity valuations get an exponential boost because both components of the equity’s required return – the risk-free component and the risk-premium component – are collapsing simultaneously (Slide 14).
Image
Image
Image
Image
But if bond yields rise substantially, the process would go into vicious reverse and equity valuations would fall off a cliff. Other risk-assets too, and bear in mind that if we include real estate – as we should – global risk-assets are worth $400 trillion, five times the size of the global economy! Our research shows that the point of vulnerability is if the global 10-year bond yield approaches 2 percent, which is about 50 basis points above where it stands right now. And that, to me, is by far the biggest risk to the global economy.
Image
So to summarise, the biggest risks to the global economy are: China’s credit cycle; trade imbalances and technological disruption and their associated populist backlash; and the biggest risk is higher bond yields (Slide 15). In the near future I think alarm bells should start to ring if China’s credit cycle has tipped into a down-oscillation and/or the global 10-year bond yield is 50 bps higher. Don’t worry, the alarm bells are not ringing right now but they might be later this year. Finally, given the title you gave me, this presentation has necessarily focussed on the key risks. But I don’t want you to get too negative. I also have another presentation called ‘The Biggest Positives For The Global Economy Are…’ And for balance, I hope you invite me to present that next time! Thank you. How Do The Risks Translate Into A European Investment Context? Risk 1: China’s Credit Cycle, is highly relevant to European investors, for two reasons. First, the European economy is very open, meaning that exports make a substantial contribution to GDP growth. This is especially true in Europe’s engine economy, Germany, but it is also important for other major economies like Sweden. And it is evidenced in large trade surpluses as, for example, illustrated in Slide 5. Therefore, whenever China’s credit cycle enters a down-oscillation, as it did last year, Germany cannot escape the nasty chill coming through its all-important net export channel. Second, the European equity market is over-exposed to global growth sensitive sectors and companies – specifically, Industrials, Materials, and Financials. These sectors tend to have a very high operational gearing to global growth. Meaning that a small change in global growth has a disproportionate effect on these companies’ profits and share price performance. The upshot is that in a credit cycle up-oscillation, Europe’s global-growth sensitive stock markets and sectors benefit from a sharp burst of outperformance. The opposite applies in a credit cycle down-oscillation. It follows that if China’s credit cycle is due to tip into a down-oscillation later this year, it would be time to close our successful relative overweighting to European equities and to the global growth sensitive cyclical sectors. Risk 2: Trade Imbalances, is also highly relevant to European investors, for the obvious reason that European economies – especially Germany – are running huge trade surpluses. This puts these economies squarely in the cross-hairs of a retaliatory salvo involving tariffs, trade barriers, or worse, an all-out trade war. Clearly, Europe’s ‘exporting champions’ are the most vulnerable to this risk. The issue is important for the exchange rate too. We showed conclusively that Europe’s trade imbalance is the consequence of the depressed euro. It follows that another way to correct this imbalance is via a stronger euro. In this sense, the fundamentals imply euro upside from here. Risk 3: Technological Disruption, manifests through disruption in the jobs market, the lack of feel good, and the ensuing backlash leading to populism and nationalism. This is particularly relevant to Europe because its collection of nations, each with its own political processes, provides more scope for a political tail-event. A lull in the major political-event cycle is a good thing for Europe. In this regard, the upcoming EU parliamentary elections is not a big risk given the EU parliament’s inability, by itself, to drive policy. The risk increases approaching a meaningful political event, and this includes the date of Brexit. Therefore, this risk is likely to rise somewhat towards the end of the year. Risk 4: Higher Bond Yields, is clearly very relevant to Europe because many of the core euro area bond yields are at their lower bound. This means that the negative asymmetry of returns has its maximum impact on, for example, German bunds. It follows that German bunds are a sell in the near-term. Nevertheless, the upside to yields is ultimately limited given the aforementioned vulnerability of risk-asset valuations to higher bond yields. Therefore, the better long-term strategy is to short German bunds relative to U.S. T-bonds. Finally, a 50 basis points rise in 10-year yields from current levels would be a trigger to flip to underweight European equities. Fractal Trading System* Crude oil is at a technical reversal level. The best way to play this is on a hedged basis versus metals: short WTI, long LMEX. Set the profit target at 5 percent with a symmetrical stop-loss. In other trades, we are pleased to report long AUD/CNY achieved its profit target at which it was closed. This leaves five open positions. For any investment, excessive trend following and groupthink can reach a natural point of instability, at which point the established trend is highly likely to break down with or without an external catalyst. An early warning sign is the investment’s fractal dimension approaching its natural lower bound. Encouragingly, this trigger has consistently identified countertrend moves of various magnitudes across all asset classes.
Short WTI / Long LMEX
Short WTI / Long LMEX
The post-June 9, 2016 fractal trading model rules are: When the fractal dimension approaches the lower limit after an investment has been in an established trend it is a potential trigger for a liquidity-triggered trend reversal. Therefore, open a countertrend position. The profit target is a one-third reversal of the preceding 13-week move. Apply a symmetrical stop-loss. Close the position at the profit target or stop-loss. Otherwise close the position after 13 weeks. Use the position size multiple to control risk. The position size will be smaller for more risky positions. * For more details please see the European Investment Strategy Special Report “Fractals, Liquidity & A Trading Model,” dated December 11, 2014, available at eis.bcaresearch.com Dhaval Joshi, Chief European Investment Strategist dhaval@bcaresearch.com Fractal Trading Model Recommendations Asset Allocation Equity Regional and Country Allocation Equity Sector Allocation Bond and Interest Rate Allocation Currency and Other Allocation Closed Fractal Trades Trades Closed Trades Asset Performance Currency & Bond Equity Sector Country Equity Indicators Bond Yields Chart I-1Indicators To Watch - Bond Yields
Indicators To Watch - Bond Yields
Indicators To Watch - Bond Yields
Indicators To Watch - Bond Yields
Indicators To Watch - Bond Yields
Indicators To Watch - Bond Yields
Indicators To Watch - Bond Yields
Indicators To Watch - Bond Yields
Indicators To Watch - Bond Yields
Indicators To Watch - Bond Yields
Indicators To Watch - Bond Yields
Indicators To Watch - Bond Yields
Interest Rate Indicators To Watch - Interest Rate Expectations
Indicators To Watch - Interest Rate Expectations
Indicators To Watch - Interest Rate Expectations
Indicators To Watch - Interest Rate Expectations
Indicators To Watch - Interest Rate Expectations
Indicators To Watch - Interest Rate Expectations
Indicators To Watch - Interest Rate Expectations
Indicators To Watch - Interest Rate Expectations
Indicators To Watch - Interest Rate Expectations
Indicators To Watch - Interest Rate Expectations
Indicators To Watch - Interest Rate Expectations
Indicators To Watch - Interest Rate Expectations
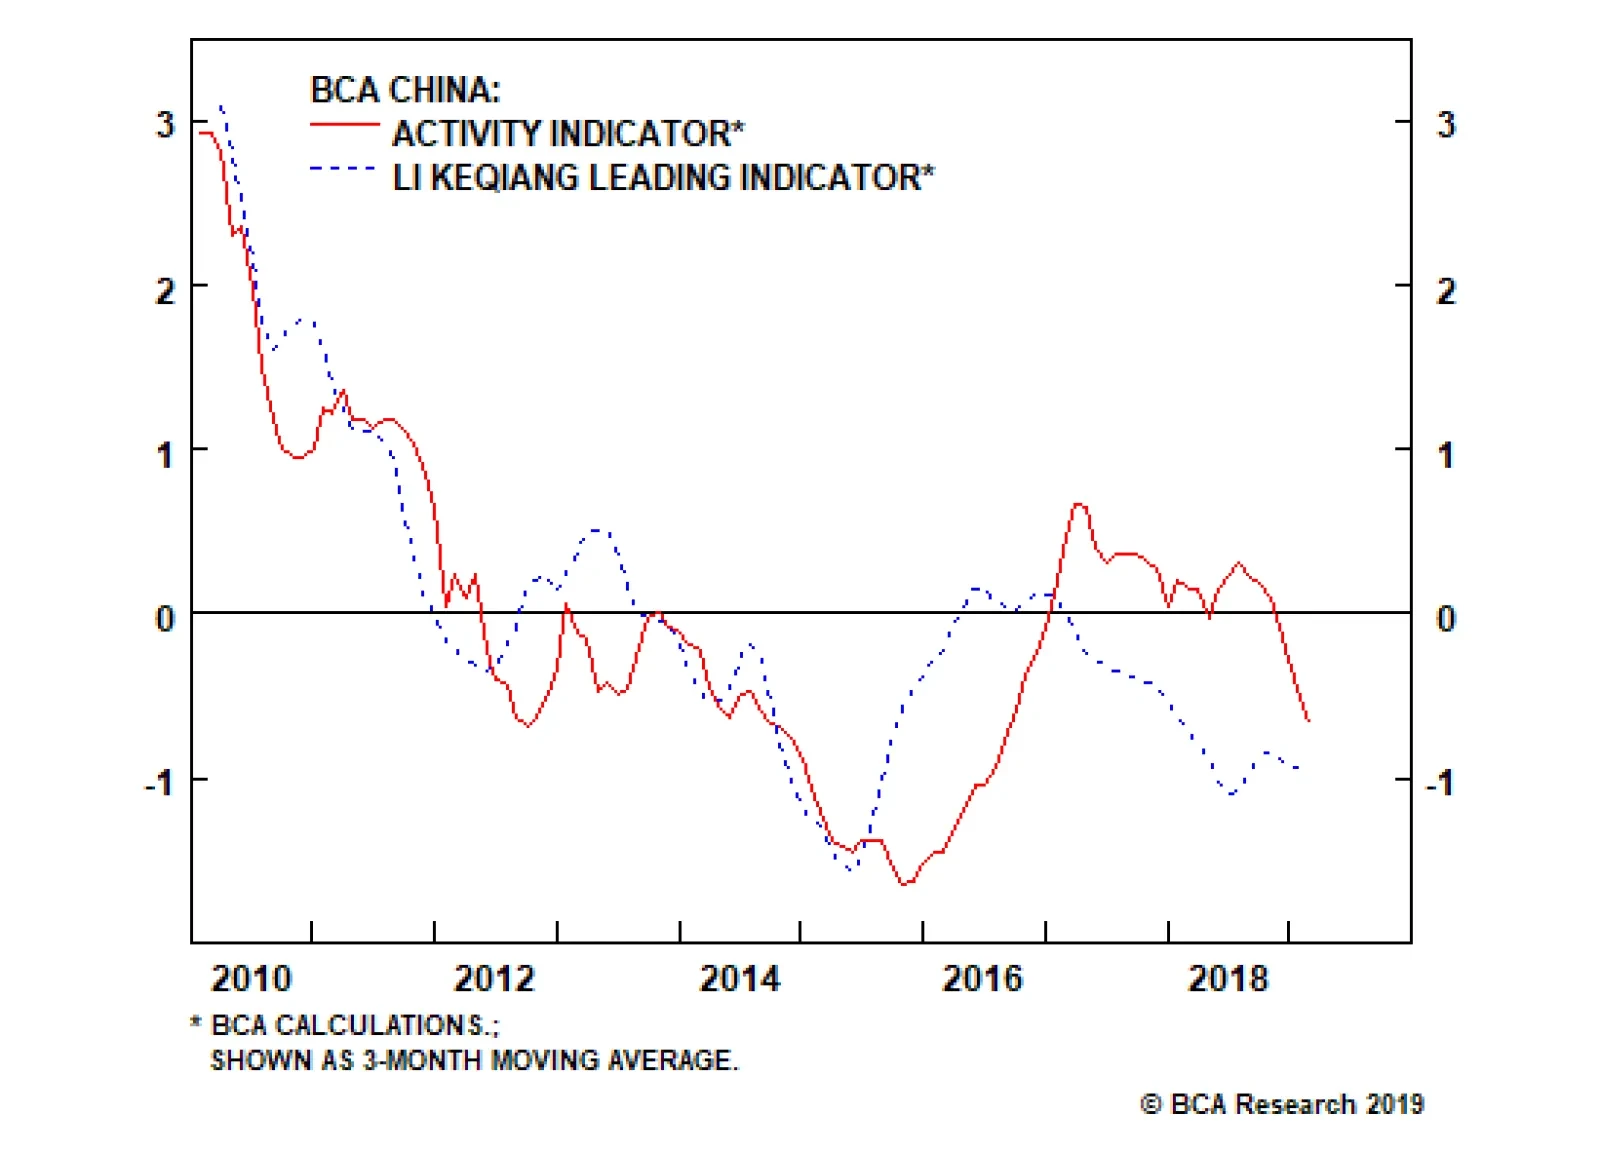
Highlights BCA’s China Investment Strategy team recommended that investors upgrade Chinese stocks to overweight (both investable and domestic) in a Special Alert last week. Investors had a legitimate macro fundamental basis to go overweight Chinese stocks as of February 15, but we hesitated to shift our stance due to several still-present risks and out of concern that the sheer magnitude of the spike in credit could cause a regulatory response that would constrain credit growth in future months. The March credit data has confirmed that Chinese policymakers have chosen to prioritize growth for now, but we are unconvinced that a shift back to controlling leverage is out of the question over the coming year. Investors should continue to monitor this and several other risks noted below. Despite having already rallied significantly this year, Chinese investable and domestic stocks have the potential to earn double-digit relative returns (12-15%) in an optimistic scenario in US$ terms versus global stocks over the coming year. Conservatively, we expect high single-digit relative returns (6-8%). Feature BCA’s China Investment Strategy team recommended that investors upgrade Chinese stocks to overweight (both investable and domestic) in a Special Alert last week.1 In this week’s report we address several issues concerning the outlook for the economy and for Chinese stocks in a Q&A format where we answer the questions of a hypothetical, representative investor. In particular, we will discuss how much relative equity upside investors can expect over the coming year, whether the recent pace of credit growth significantly increases the chance of another credit overshoot, and when investors should expect to see a pickup in actual economic activity. Q: First, a question about timing. Why did it take so long to recommend upgrading Chinese stocks? Haven’t Chinese equities been forecasting an economic recovery for several months? A: Prior to the release of the January total social financing data on February 15, investors had no legitimate macro fundamental basis to go overweight Chinese stocks and were instead responding to a relatively less important factor for the economy – the Sino/U.S. trade war. We placed Chinese stocks on upgrade watch in late-February, and waited for confirmation that the spike in credit was not a one-off surge to be reversed by policymakers dead set against “flood irrigation-style” stimulus. As investors are surely aware, no two economic or financial market cycles are exactly alike. This is particularly true in the case of China; its economy experienced a major structural shift a decade ago, and economic and financial market oscillations since then have been highly disparate. As part of our ongoing search to identify tools that reliably predict the Chinese economy, we presented detailed evidence in a November 2017 Special Report2 that suggested monetary conditions, money, and credit growth have been among the most reliable predictors of Chinese “investment-relevant economic activity” (Chart 1). Chinese activity, in turn, has reliably led investable equity earnings growth, and we have therefore followed this framework closely when judging the economic outlook and the attendant implications for investment strategy. Chart 1Monetary Conditions, Money, And Credit Growth Reliably Lead Chinese Economic Activity
Monetary Conditions, Money, And Credit Growth Reliably Lead Chinese Economic Activity
Monetary Conditions, Money, And Credit Growth Reliably Lead Chinese Economic Activity
Given that financial markets typically lead turning points in economic activity, many market participants have incorrectly suggested that the bottom in Chinese stocks in late-October reflected prescient expectations of a durable re-acceleration in Chinese credit growth. Rather, a detailed examination of the events of the past year highlights that the opposite is true: global investors, the most influential “buyer” of Chinese investable stocks, materially lagged or ignored important developments in leading economic indicators and focused instead on a relatively less important factor for the economy – the Sino/U.S. trade war. Two important pieces of evidence support this point: We prominently discussed the risk that a trade war would pose to China’s economy in the first-half of 2018,3 but we underscored numerous times that this risk was on top of an ongoing and much more concerning slowdown in leading indicators for China’s industrial sector. By June of last year our leading indicator for the Li Keqiang index had been in a downtrend for 16 months straight (Chart 2), and yet investors only sold Chinese investable stocks once President Trump began imposing tariffs against Chinese exports to the U.S. We placed Chinese stocks on downgrade watch at the end of March 2018,4 well in advance of the selloff versus global stocks, and deftly triggered the downgrade on June 20.5 Relative to the global benchmark, November 2018 represented the largest month of relative performance for Chinese investable stocks. At that time, there was zero credible evidence to suggest that a credit upturn was underway; in fact, money and credit growth weakened on a sequential basis for most of Q4. It is true that monetary policy eased significantly following the imposition of U.S. tariffs in June, but given the extent of the decline in interbank rates, this would have led to a bottom in relative performance in July or August if investors were willing to assume that China’s monetary transmission mechanism would work without impairment. November 2nd marks the clear inflection point for Chinese investable stocks and our BCA Market-Based China Growth Indicator (Chart 3), and in our view this proves beyond a doubt that investors have been solely focused on trade: on that day, news broke that President Trump wanted to make a deal with Xi Jinping at the G20 meeting in Argentina later that month, and had instructed aides to begin “drafting terms”.6 Chart 2Until Tariffs Arrived, Investors Completely Ignored The Decline In Leading Indicators
Until Tariffs Arrived, Investors Completely Ignored The Decline In Leading Indicators
Until Tariffs Arrived, Investors Completely Ignored The Decline In Leading Indicators
Chart 3It Was News Of A Trade Deal That Caused A Bottom In China-Related Assets
It Was News Of A Trade Deal That Caused A Bottom In China-Related Assets
It Was News Of A Trade Deal That Caused A Bottom In China-Related Assets
Besides recommending a tactical overweight stance on December 5,7 we generally failed to forecast and position for a meaningful détante in the trade war, and we acknowledge that this contributed to a period of missed potential outperformance. But our research suggests that a trade deal would have been irrelevant had the drivers of China’s relevant economic activity continued to deteriorate, and investors had no concrete signs to suggest otherwise prior to the release of the January total social financing data on February 15 (Chart 4). We conservatively forecast high single-digit relative returns versus global stocks, on the order of 6-8%. There is even more upside potential in an optimistic scenario. Chart 4Before February 15, There was No Basis To Confidently Project An Upturn In Credit
Before February 15, There was No Basis To Confidently Project An Upturn In Credit
Before February 15, There was No Basis To Confidently Project An Upturn In Credit
Starting on February 15, investors did have a legitimate macro fundamental basis to go overweight Chinese stocks. We responded to the January data by placing Chinese stocks on upgrade watch,8 but we hesitated to move to an outright cyclical overweight at that time due to several still-present risks (discussed below) and out of concern that the sheer magnitude of the spike in credit could cause a regulatory response, discreet or otherwise, that would constrain credit growth in future months. The public spat between Premier Li Keqiang and the PBOC over whether the January credit spike represented “flood irrigation-style” stimulus and the disappointing February credit data were both emblematic of these concerns, but ultimately the March credit data has confirmed that a significant credit expansion is underway. This has indeed raised the odds of a major credit overshoot, although we reiterate below why policymakers are likely to remain reluctant to allow one to occur. Q: Chinese investable stocks have already rallied 22% year-to-date in US$ terms; domestic stocks are up 37%. How much further upside can investors realistically expect? A: In an optimistic scenario, Chinese investable and domestic stocks have the potential to earn double-digit relative returns (12-15%) in US$ terms versus global stocks over the coming year. Conservatively, we expect high single-digit relative returns (6-8%). Chart 5 presents our earnings recession model for the MSCI China index. The recent improvement in credit, forward earnings momentum, and the new export orders component of the official manufacturing PMI have already caused the model probability to peak. The dotted line shows that the odds of a contraction in earnings over the coming year are set to fall very sharply if credit even just continues on a moderate expansion path, and assuming that the current values of the remaining model predictors stay constant. Chart 6 shows that while there has been an earnings “response” to the ongoing economic slowdown in China, the response has so far been less intense than what might be expected. While this raises a near-term risk for Chinese stocks if Q1 & Q2 earnings disappoint (see below), it also implies that the level of 12-month trailing earnings may not trend lower over the coming year. Chart 5The Odds Of An Earnings Decline Over The Next Year Have Peaked And Will Fall Further
The Odds Of An Earnings Decline Over The Next Year Have Peaked And Will Fall Further
The Odds Of An Earnings Decline Over The Next Year Have Peaked And Will Fall Further
Chart 6The 'Response' Of Earnings To A Slowing Economy Has Been Less Intense Than Expected
The 'Response' Of Earnings To A Slowing Economy Has Been Less Intense Than Expected
The 'Response' Of Earnings To A Slowing Economy Has Been Less Intense Than Expected
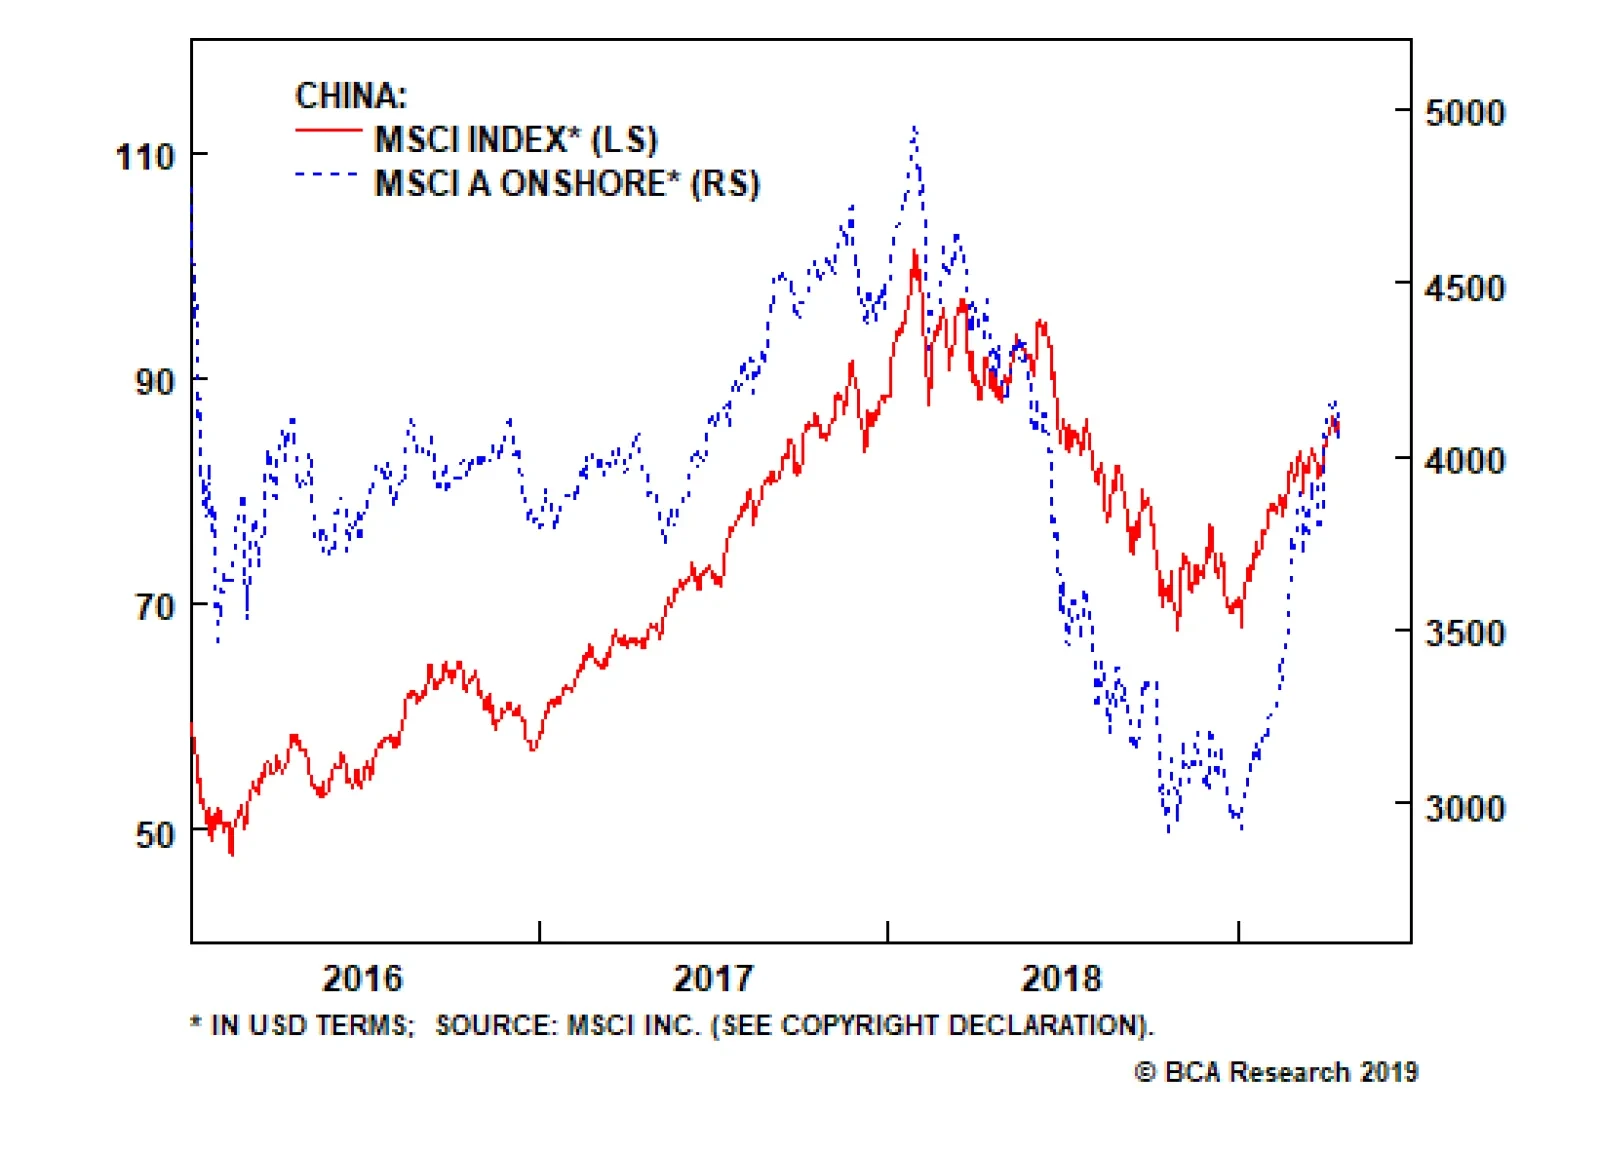
If Chinese earnings are largely stable over the next year, we think it is reasonable to expect that investable Chinese stock prices will re-approach or fully return to their early-2018 high. We noted in our March 27 Weekly Report that China’s potential to command a higher multiple than global stocks is probably capped barring a major structural improvement in earnings growth,9 but Chart 7 highlights that Chinese stocks were still cheaper than their global counterparts at their peak early last year. Chart 7Even At Their 2018 High, Chinese Stocks Were Cheaper Than Global Stocks
Even At Their 2018 High, Chinese Stocks Were Cheaper Than Global Stocks
Even At Their 2018 High, Chinese Stocks Were Cheaper Than Global Stocks
It is true that the multiple expansion that occurred for Chinese stocks in 2016 and 2017 was quite large, but in our view this was due to the index addition and growth of technology companies with potential structural growth stories (such as the “BAT” stocks) rather than due to a significant decline in the risk premium assigned to Chinese stocks. These firms are still present in the investable index, and we have no reason to believe that investors over the coming year will perceive their structural earnings potential to be any different than was the case early last year, which suggests that a forward P/E ratio of 14 to 14½ is again achievable. Domestic equities do not directly benefit from the “BAT effect”, but their realized earnings growth has been somewhat superior than the investable index over the past few years. In effect, we have no strong reasons to argue against a return of both domestic and investable forward multiples back to levels seen in early-2018. Chart 8 highlights that a return to these levels would imply a relative price return of about 12% for investable stocks and 14-15% for domestic stocks, in US$ terms. Several risks (highlighted below) underscore the possibility that Chinese stocks will trend higher but not fully return to their early-2018 levels over the coming year. Given this, we conservatively forecast high single-digit relative returns versus global stocks, on the order of 6-8%. As a final point, for investors focused on A-shares, we should note that our domestic equity call is based on the MSCI China A Onshore index, not the CSI 300 or the FTSE/Xinhua A50 index. While the former very closely tracks the latter two, Chart 9 highlights that the CSI 300 and the A50 have rebounded closer to their early-2018 highs than the MSCI China A Onshore index, suggesting that there is somewhat less upside potential for the former than the latter. Chart 8There Is Meaningful Further Upside Potential For Chinese Stocks Vs. Global
There Is Meaningful Further Upside Potential For Chinese Stocks Vs. Global
There Is Meaningful Further Upside Potential For Chinese Stocks Vs. Global
Chart 9A-Shares: Favor MSCI Indexes Over The CSI300 And The A50
A-Shares: Favor MSCI Indexes Over The CSI300 And The A50
A-Shares: Favor MSCI Indexes Over The CSI300 And The A50
Q: What specific trades would you recommend as a result of your change in stance towards Chinese stocks? A: We are making five changes to our trade book, four of which are directly linked to our upgrade recommendation. In addition, we are closing another trade related to iron ore, given that prices have risen to a multi-year high. We are opening the following new trades in response to our recommendation to upgrade Chinese stocks: Open long MSCI China Index / short MSCI All Country World Index (US$) Open long MSCI China A Onshore Index / short MSCI All Country World Index (US$) Open long MSCI China Growth Index / short MSCI All Country World Index (US$) Regarding the latter trade, we noted in a previous report that value stocks have been responsible for more of the rally in China’s investable market versus the global average than their growth peers, and Chart 10 highlights that a long China growth / short broad market trade is strongly correlated with China’s relative performance trend versus global stocks. This means that a long MSCI China Growth Index / short MSCI All Country World Index trade represents a higher octane version of our long MSCI China Index position, which we offer as a riskier trade for investors seeking maximum upside potential in response to a cyclical recovery in China’s economy. Chart 10China Growth: A High Octane Version Of The MSCI China Index
China Growth: A High Octane Version Of The MSCI China Index
China Growth: A High Octane Version Of The MSCI China Index
In addition to these new trades, we are closing the following two existing positions in our trade book: Long MSCI China Low-Beta Sectors / short MSCI China trade, initiated on June 27, 2018 and closed at a modest loss of 0.7% Long September 2019 iron ore futures / short September 2019 steel rebar futures trade initiated on October 17, 2018 and closed at a substantial gain of 22% We initiated our low-beta sectors position soon after we downgraded Chinese stocks in June of last year, which acted as a defensive trade for investors to play while waiting out a selloff in Chinese relative performance. The profit from the trade peaked at approximately 11% in early-October, but has since given back most of its gains. Lastly, we are closing our iron ore / steel rebar pair trade to lock in a healthy profit from the position. An improvement in Chinese economic growth would typically be bullish for iron ore prices, but they have recently surged to a multi-year high in response to supply restrictions. This implies that stronger demand over the coming 6-12 months may not necessarily be positive for prices if it is accompanied by easier supply-side conditions. Q: What are the risks facing Chinese relative equity performance over the coming year? A: A collapse in the trade talks or an underwhelming deal, a lagged and series decline in earnings per share, a sharp slowdown in credit growth after a trade deal is signed, and a meaningful lag between the upturn in credit and an improvement in Chinese “hard data”. There are four non-trivial risks to a bullish relative stance towards Chinese stocks over the coming year. In general, these scenarios pose a risk to the magnitude of an uptrend in Chinese relative performance, but in some cases could prevent Chinese relative performance from trending higher over the coming year (and thus bear monitoring). There are still four non-trivial risks to a bullish relative stance towards Chinese stocks over the coming year. The trade deal between the U.S. and China falls through or substantially underwhelms. Despite signs continuing to point to the likelihood of a deal, a meaningful breakdown in trade talks or an underwhelming deal clearly have the potential to derail an uptrend in Chinese relative performance given that global investors have (incorrectly) treated the conflict as the primary risk factor facing the Chinese economy. A full resumption of the trade war would definitely cause Chinese stocks to actively underperform until evidence presented itself that the inevitable policy response is stabilizing economic activity. An underwhelming deal would probably weigh on the magnitude of China’s outperformance, but would probably not constitute a threat on its own to an uptrend in relative performance unless the “deal” did not result in a significant removal of tariffs (which, to us, is the point of China participating in the negotiations in the first place). Chinese earnings per share decline significantly from current levels. We noted in Chart 6 on page 6 that the earnings “response” to the ongoing economic slowdown in China has been less intense than we expected. Our earnings recession model suggests that the odds of a contraction in earnings over the coming 12 months has fallen meaningfully, but that does not rule out further near-term weakness stemming from the slowdown in activity that has already occurred. Chart 11Any Further Weakness In EPS Growth Should Be Temporary
Any Further Weakness In EPS Growth Should Be Temporary
Any Further Weakness In EPS Growth Should Be Temporary
We noted earlier that Chinese economic and financial market oscillations have been highly disparate since 2010 (when the economy experienced a clear structural shift), and as such we are unable to confidently predict the magnitude of a decline in EPS in response to a given amount of weakness in China’s old economy. For now, the meaningful uptick in net earnings revisions as well as the stabilization in forward EPS momentum (Chart 11) suggests that any further weakness in EPS growth will be temporary, but a larger or more prolonged decline should be acknowledged as a serious risk to our stance. Chinese credit growth slows meaningfully after a U.S./China trade deal is signed. To the extent that Chinese policymakers are still serious about preventing significant further leveraging, it is possible that the recent pace of credit growth will slow following the signing of a trade deal. This could occur because of a shift to tighter monetary policy, or due to the use of informal “administrative controls” to limit the pace of further lending. Chart 12 highlights that the pace of credit growth in the first quarter, if sustained, would actually imply a credit overshoot; our recommendation to upgrade Chinese stocks was based on the assumption of a moderate credit expansion, and thus we would not be surprised (or worried) if the pace of credit growth slows somewhat. However, a more meaningful slowdown, particularly if coupled with signals from policymakers that a much slower pace of growth is desired, could pose a risk to our stance. A recovery in China’s “hard data”, i.e. its coincident activity measures, meaningfully lags the pickup in credit growth. The March credit data has made us sufficiently confident that a rebound in Chinese investment-relevant economic activity is forthcoming, but it is difficult to pinpoint exactly when the data will bottom and whether further near-term weakness is likely. On the latter point, we noted in our April 3 Weekly Report that coincident economic activity sharply converged in January and February with our leading indicator for China’s economy (shown in Chart 1 on page 2), as most if not all of the previously beneficial tariff front-running effect washed out of the data.10 This implies that future changes in activity measures are now more likely to reflect actual changes in underlying economic circumstances, but a lagged response may still occur and could weigh on investor sentiment towards Chinese stocks over the coming few months. Q: What is your best estimate as to when investors can expect to see a pickup in China’s “hard” economic data? A: China’s activity data is likely to bottom between now and the middle of the year, implying that activity will pickup in 2H2019. Chart 13 presents an average correlation profile of our BCA Li Keqiang leading indicator and its main credit component (adjusted total social financing, “TSF”, as a share of GDP) with four activity measures: 1) the Bloomberg Li Keqiang index, 2) nominal manufacturing output, 3) nominal total import growth in US$, and 4) nominal total import growth in RMB. Values to the left of the zero line show that the leading indicator / TSF as a share of GDP tend to lead the four activity measures, with the x-axis values showing by how many months. Chart 12Q1 Credit Growth, If Sustained, Would Lead To An Overshoot
Q1 Credit Growth, If Sustained, Would Lead To An Overshoot
Q1 Credit Growth, If Sustained, Would Lead To An Overshoot
Chart 13Our Indicators Tend To Lead Actual Economic Activity By 4-6 Months
Our Indicators Tend To Lead Actual Economic Activity By 4-6 Months
Our Indicators Tend To Lead Actual Economic Activity By 4-6 Months
China’s activity data is likely to bottom between now and the middle of the year. The chart suggests that our predictors tend to lead actual economic activity by 4-6 months on average, depending on the predictor and the activity measure in question. Our LKI leading indicator technically bottomed in June of last year, although the rise has since been narrowly-based and it has retreated since October. TSF as a share of GDP clearly bottomed in December, which implies that China’s activity data is likely to bottom between now and the middle of the year. This is consistent with our view that the global economy will improve in the second half of the year, as well as our recommendation to overweight Chinese stocks on a cyclical basis. The risk, as noted above, is that investors react negatively to any further weakness in China’s measures of economic activity before they durably bottom. Q: Final question – In your list of potential risks facing Chinese relative equity performance, you cited the issue of whether policymakers are serious about preventing significant further leveraging. It seems as if they are stepping away from that. Will they, and is this fundamentally justified? A: For now, Chinese policymakers have chosen to prioritize growth, out of fear that the economy will decelerate significantly and possibly spiral out of control. But we are unconvinced that a shift back to controlling leverage is out of the question over the coming year. Policymakers have good economic reasons to try and shift China’s economy away from extremely high rates of investment towards more consumption, and they are likely to see the act of restraining credit growth as furthering this goal. Arguably, this is one of the most important questions facing global investors over both cyclical and secular time horizons, and it is likely to feature prominently in our research over the coming year. The question of the sustainable growth rate of China’s debt is a controversial one, even among BCA strategists. While it is by no means a conclusive answer, we tackled the question in our October 31 Weekly Report,11 and came down on the side that China’s policymakers have good economic reasons to try and shift China’s economy away from extremely high rates of investment towards more consumption. To the extent that attempts to restrain credit growth further this goal, our sense is that it is more wisdom than folly. We noted three key points in our October report: First, while there is a strong empirical cross-country relationship between average rates of investment over the past half-century and the level of real per capita GDP today, that relationship also shows that China’s current rate of investment is nearly off the scale and thus probably cannot be sustained. Second, in 2014, based on the definition of the data from the Penn World Table (GDP share of gross capital formation at current purchasing power parity), China had maintained its investment share above 30% for 12 years. At first blush, there appears to be some precedent suggesting that China’s outsized investment run can go on for longer: among the 80 countries with data available since 1950, 14 of them have experienced a longer continuous run of investment as a share of GDP. However, Chart 14 shows that most of these concurrent experiences occurred in the 1960s and 1970s, when global exports as a share of GDP were rising from a very low base. This implies that historical examples of outsized investment runs have largely reflected export-driven catch-up stories, which bodes poorly for China’s ability to continue to invest at its recent massive scale given that global exports to GDP appear to have peaked. Chart 14High And Sustained Rates Of Investment Have Been Driven By Exports
High And Sustained Rates Of Investment Have Been Driven By Exports
High And Sustained Rates Of Investment Have Been Driven By Exports
Third, the historical relationship between investment and real per capita GDP captures the potential gains of profitable and rational investment (the accumulation of a “useful” stock of capital). But an unfortunate reality facing savers is that while one can certainly choose to save or invest, one cannot necessarily choose the accompanying rate of return. If China invests heavily at very low or negative rates of return, the idea that continued heavy investment will lead China out of the middle-income trap is very likely wrong. On the third point, there is good evidence to suggest that the marginal gains from investment in China have been falling. The private sector debt-to-GDP ratio features prominently in the case against profitable investment in China: despite a massive rise in investment and debt from 2002-2007, the ratio barely rose, because this debt was used to accumulate capital that verifiably delivered nominal GDP growth (Chart 15). Yet following 2010 the ratio rose sharply, implying that the returns from the investment that has taken place over the past decade have been (at least so far) considerably lower than those of the prior decade. Also, we noted in our August 29 Special Report that state-owned enterprises (SOEs) have accounted for a sizeable portion of the private sector leveraging that occurred after 2010,12 and that the marginal net return on borrowed funds for SOEs has become negative (Chart 16). A gap between the cost/return on borrowed funds strongly implies that the investment channeled through SOEs over the past several years does not represent, on balance, the accumulation of useful capital. Chart 15A Rise In Debt-To-GDP Inherently Implies That Investment Is Increasingly Unproductive
A Rise In Debt-To-GDP Inherently Implies That Investment Is Increasingly Unproductive
A Rise In Debt-To-GDP Inherently Implies That Investment Is Increasingly Unproductive
Chart 16Strong Evidence Against Productive SOE Investment
Strong Evidence Against Productive SOE Investment
Strong Evidence Against Productive SOE Investment
We believe that Chinese policymakers now understand the risks posed with extremely high and prolonged rates of investment. Whereas most modern central banks characterize their monetary policy decisions within the context of a trade-off between growth and inflation, Chinese policymakers now appear to face a trade-off between growth and leveraging. For now, they have chosen growth, out of fear that the economy will decelerate significantly and possibly spiral out of control. But we are unconvinced that a shift back to controlling leverage is out of the question over the coming year, particularly after a trade deal has been signed with the U.S. As noted above, this is a non-trivial risk to our recommendation to overweight Chinese stocks over the coming year, and thus bears monitoring To be continued! Jonathan LaBerge, CFA, Vice President Special Reports jonathanl@bcaresearch.com Footnotes 1 Please see China Investment Strategy Special Alert, “Upgade Chinese Stocks To Overweight”, dated April 12, 2019, available at cis.bcaresearch.com. 2 Please see China Investment Strategy Special Report, “The Data Lab: Testing The Predictability Of China’s Business Cycle”, dated November 30, 2017, available at cis.bcaresearch.com. 3 Please see China Investment Strategy Weekly Reports, “The Question That Won’t Go Away”, dated April 18, 2018, “China: A Low-Conviction Overweight”, dated May 2, 2018, “The Three Pillars Of China’s Economy”, dated May 16, 2018, and “A Shaky Ladder”, dated June 13, 2018, available at cis.bcaresearch.com. 4 Please see China Investment Strategy Weekly Report, “Chinese Stocks: Trade Frictions Make For A Tenuous Overweight”, dated March 28, 2018, available at cis.bcaresearch.com. 5 Please see China Investment Strategy Special Report, “Downgrade Chinese Stocks To Neutral”, dated June 20, 2018, available at cis.bcaresearch.com. 6 Please see “Trump Said To Ask Cabinet To Draft Possible Trade Deal With Xi”, Bloomberg News, November 2, 2018. 7 Please see China Investment Strategy Weekly Report, “2019 Key Views: Four Themes For China In The Coming Year”, dated December 5, 2018, available at cis.bcaresearch.com. 8 Please see China Investment Strategy Weekly Report, “Dealing With A (Largely) False Narrative”, dated February 27, 2019, available at cis.bcaresearch.com. 9 Please see China Investment Strategy Weekly Report, “Ready, Aim, But Don’t Fire (Yet)”, dated March 27, 2019, available at cis.bcaresearch.com. 10 Please see China Investment Strategy Weekly Report, “China Macro and Market Review”, dated April 3, 2019, available at cis.bcaresearch.com. 11 Please see China Investment Strategy Weekly Report, “Is China Making A Policy Mistake?”, dated October 31, 2018, available at cis.bcaresearch.com. 12 Please see China Investment Strategy Special Report “Chinese Policymakers: Facing A Trade-Off Between Growth And Leveraging”, dated August 29, 2018, available at cis.bcaresearch.com. Cyclical Investment Stance Equity Sector Recommendations
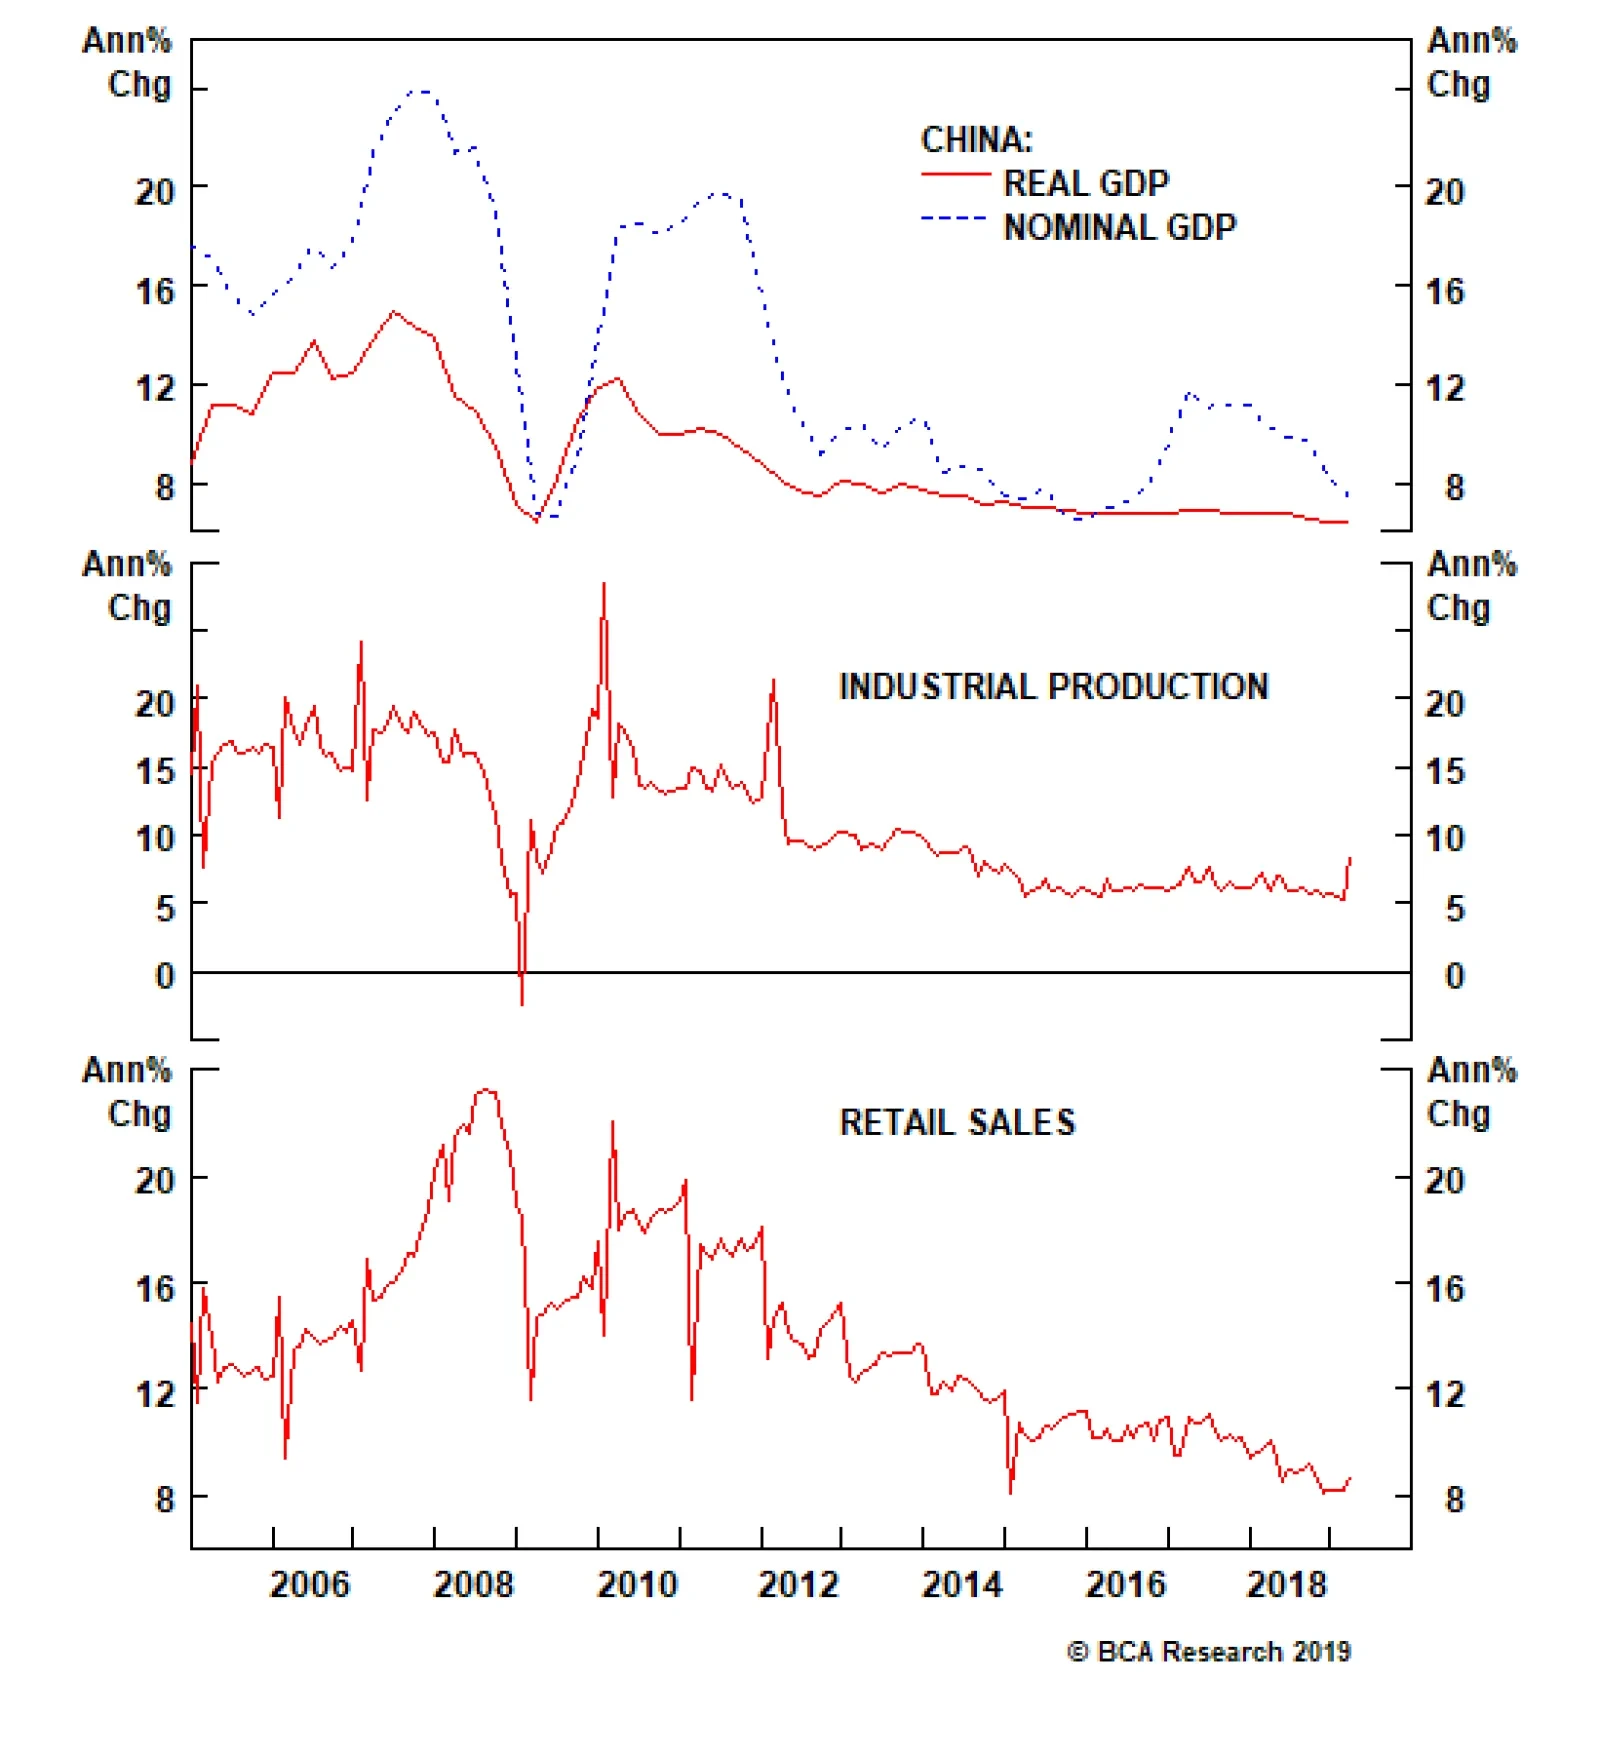
China’s real GDP growth for Q1 stabilized at 6.4% on an annual basis, beating expectations of a slight slowdown to 6.3%. Meanwhile, industrial production for March grew at 8.5% on an annual basis, the strongest print since July 2014. This is a genuine…
Highlights So what? Egyptian assets will benefit from improving fundamentals. Why? March credit data confirm China’s stimulus, supporting the commodity/EM complex. Oil price risks are also to the upside. In Egypt, investors will welcome constitutional changes that reinforce the regime and overall stability. Egypt is beginning to reap the rewards of painful IMF reforms enacted in late 2016. A large, under-invested labor market is a key structural risk that will weigh on Egypt’s long-term investment potential. We recommend an overweight stance in Egyptian sovereign (USD) bonds relative to EM. Feature Egypt is the world’s most populous Arab country and a geopolitical fulcrum at the critical juncture between Africa, Europe, and Asia. Its stability is particularly important at a time of rapid geopolitical change. The U.S. is deleveraging from the Middle East and regional powers are scrambling to fill the void. Popular discontent is toppling rigid authoritarian leaders, most recently in Algeria and Sudan. Displaced peoples have spilled into Europe in the recent past and could do so again if more regimes fail (Chart 1). In this week’s Special Report we take a close look at Egypt and show how its continued stabilization is a rare positive trend for the region and one that presents an investment opportunity in its own right. China’s March Credit data confirm that stimulus is surprising to the upside this year. Before proceeding, however, we make note of some key developments on the global front, especially our oil view: China’s Stimulus: China’s March credit data confirm that stimulus is surprising to the upside this year (Chart 2). The data will help galvanize expectations of firming global growth, supporting commodity prices and EM risk assets. We are long Chinese equities, Indonesian and Thai equities, and EM energy producer equities relative to the EM benchmark. Chart 1Asylum Seekers May Rise Amid Mideast Instability
Asylum Seekers May Rise Amid Mideast Instability
Asylum Seekers May Rise Amid Mideast Instability
Chart 2Chinese Credit Supports Economic Outlook
Chinese Credit Supports Economic Outlook
Chinese Credit Supports Economic Outlook
Iranian Sanctions: The Trump administration is increasing the pressure on Iran again and threatening to enforce sanctions strictly on oil exports. Exports have recovered somewhat since Trump issued waivers for key importers last fall and this means that 1.3mm bpd are still at risk if enforcement intensifies (Chart 3).
Chart 3
Libyan War: Libyan National Army leader, General Khalifa Haftar, has made a move for Tripoli after sweeping across the country’s south, jeopardizing the roughly 300,000 barrels per day exported from Zawiya, west of Tripoli. Egypt is one of Haftar’s geopolitical backers, along with the UAE, so Egypt’s improving domestic situation, discussed below, is a factor supporting Haftar’s ability to extend his control across western Libya, which poses a risk of unplanned oil outages this year. The combination of these factors will put upward pressure on oil prices in an environment where supplies are already limited. As a result, Bob Ryan, the head of BCA’s Commodity & Energy Strategy, believes that OPEC 2.0 will eventually follow Russia’s preferred path at this juncture and increase production. Russia and Saudi Arabia are comfortable with Brent crude above $70 per barrel, but will get nervous once prices rise above $80 and threaten to kill demand in emerging markets. An alteration of slated production cuts has not yet been agreed and prices remain well supported in the meantime, with Brent on track to average $75 per barrel in 2019 and $80 in 2020.1 We do not expect President Trump to impose “maximum pressure” on Iran in this context. We have long assumed the worst of Venezuelan production, i.e. that it will at least be cut in half to 500,000 bpd by end of year, and possibly fall to zero. Libyan outages could theoretically rise to the full 900,000 bpd, though the likely cap is 300,000 bpd. The removal of 1.3mm bpd of Iranian barrels would bring the combined production losses close to OPEC 2.0’s spare capacity of around 2.1mm bpd. Moreover, the Iranians have the ability to retaliate, which jeopardizes other output across the Middle East. The United States has a valuable tool in the Strategic Petroleum Reserve.2 But President Trump would still be taking an enormous risk with the economy in advance of an election year to enforce the maximum sanctions on Iran. So we maintain that he will largely keep the waivers in place on May 2. The real danger, from our point of view, comes if Trump is re-elected, as then he will be less constrained both politically (no chance of reelection) and economically (U.S. production going up) in pursuing his hawkish foreign policy against Iran. But that is a story for 2021. With that, we turn to Egypt. A Dream Deferred Earlier this year, the Egyptian parliament voted in favor of a series of proposed constitutional amendments that will further consolidate President Abdel Fattah al-Sisi’s power. Among the changes are the extension of the president’s term, allowing him in principle to rule for another 15 years. The proposed amendments will also expand the role of the military, enshrining a political role for it, thus solidifying its already preeminent position in Egyptian politics.3 These proposed changes bring the de facto Egyptian political environment close to its pre-2011 state – that is, the state of affairs before an estimated two million Egyptians rose in protest at Tahrir Square and removed President Hosni Mubarak from power, setting in motion a tumultuous decade. Sisi supporters argue that these changes will guarantee much needed stability and policy continuity to the Egyptian economy, allowing it to regain its footing. With GDP growth expected to near 6% by the middle of next year – the strongest since the 2011 revolution – it is no surprise that the aspirations of Egypt’s revolutionaries have become a dream deferred. Chart 4Improving Fundamentals Bode Well For Egyptian Equities
Improving Fundamentals Bode Well For Egyptian Equities
Improving Fundamentals Bode Well For Egyptian Equities
Instead, policymakers and ordinary citizens alike have focused on making ends meet – both in terms of the fiscal purse and the household bank account. Policy continuity is what is required for Egypt at this point in time: It is finally beginning to reap the rewards of the painful reforms enacted in late 2016 as part of the IMF program. Sisi’s own position is reinforced by the fact that he oversaw this process and has come out on the other side. While the proposed constitutional amendments will pass, and will be characterized as a step back into authoritarian rule, the stability will be favorable for investors, as it will support a more predictable near-term trajectory for the Egyptian economy. Egyptian assets have already started to reflect this reality, signaling that Egypt is transitioning into a new era that portends a more attractive investment climate. As such, Egyptian equities have picked up and have outperformed the broader EM index since December (Chart 4). Bottom Line: “Stability” is the catch-phrase of the Sisi regime. Constitutional amendments allowing the Egyptian president and military to amass far-reaching powers are likely to pass. While they mark a return to Egypt’s traditional authoritarian system, this will be welcomed by foreign investors who were otherwise hesitant to re-enter the Egyptian market during the turbulent aftermath of 2011 Egypt’s 2016-2019 Policy Mantra: No Pain, No Gain Since the 2011 revolution, the Egyptian economy has been defined by years of turmoil. The popular uprising and ensuing loss of security drove away tourists and foreign investors – key sources of hard currency – causing the central bank to chew through its foreign exchange reserves as it scrambled to stabilize confidence and the currency. High rates of poverty, unemployment, and inequality amid a growing public sector wage bill, over reliance on food imports and an overvalued currency were a recipe for an economic disaster. Public debt ballooned while the black market for foreign exchange thrived. Thus, the structural reforms (Box 1) that accompanied the November 2016 $12bn IMF loan – while painful – were necessary to transition the economy onto a more sustainable trajectory. Box 1 Structural Reforms Implemented Since 2016 The reforms that accompanied the IMF program are designed to improve fiscal consolidation, liberalize the foreign exchange market, and create a more business friendly investment climate. They include the following measures: The floating of the currency in November 2016 which resulted in the Egyptian pound losing half its value relative to the dollar. Given that Egyptians rely on imports for a large chunk of their consumption, the impact on household budgets and consumer prices have been massive (Chart 5). However, the inflation rate has since slowed to 14.4%, with the Central Bank of Egypt (CBE) targeting single-digit inflation by the end of next year. Similarly, it has stabilized the EGP/USD.4 Reductions to fuel subsidies have weighed on consumer expenditures. The target is full-cost recovery by the end of 2018-19 for almost all fuel products (except LPG and fuel oil used in bakeries and electricity generation). The introduction of a value-added tax (VAT) of 13% in 2016, which subsequently rose to 14%. The VAT will help generate revenue, by replacing the distortionary sales tax and broadening the tax base. Basic goods and services are exempt from the VAT in order to shield the poor from rising living costs. A reduction in utility subsidies to reduce state spending and instead channel funds to more productive uses. Authorities target the full elimination of electricity subsidies by 2020-21. Similarly, water and sewage subsidies have been cut. As of December 2018, Egypt ended a discounted customs exchange rate for non-essential imports. The monthly fixed customs exchange rate was introduced in 2017, following the 2016 currency devaluation, offering a favorable exchange rate to importers. In the second half of last year, the customs exchange rate was set at 16 EGP/USD while the market rate was EGP/USD 17.82-17.96. The non-essential imports include tobacco products, alcohol, pet food, and cosmetics. Other goods that will also be subject to the market rate include mobile phones, computers, furniture, shoes, cars, and motorbikes. The elimination of the repatriation mechanism for new inflows. The repatriation mechanism guaranteed the availability of foreign exchange for capital repatriation to portfolio investors that chose to sell foreign exchange to the central bank. Its elimination means that cash inflows and outflows by foreign portfolio investors will now impact the supply and demand of foreign currencies in the market. A new investment law was enacted in July 2017, which aims to promote domestic foreign investments by offering incentives and reducing bureaucracy. A new bankruptcy law was enacted in January 2018. Egypt ranks 101 out of 168 in the “Resolving Insolvency Index” of the Doing Business report. The law simplifies post-bankruptcy procedures and aims to reduce the need for companies to resort to courts in the case of bankruptcy. It also removes investment risk by abolishing imprisonment in bankruptcy cases. Chart 5FX Reform Was Inflationary
FX Reform Was Inflationary
FX Reform Was Inflationary
To mitigate the impact of these changes, especially on the lower and lower-middle income brackets, social programs have been expanded and improved, including: Takaful and Karama: An expansion of the cash transfer program, which now targets more than 10 million people, or ~10% of the population. Forsa: A program that helps create job opportunities for underprivileged youth by focusing on employment training. Mastoura: A program that lifts living standards and provides economic empowerment for Egyptian women by supplying microloans to fund projects. Sakan Karim: A program that aims to improve housing conditions of the poor by promoting access to clean drinking water and sanitation. Together, the structural reforms and targeted social programs will support the Egyptian economy by strengthening the business climate, attracting investment, and increasing employment. Since the beginning of the program, the country’s fiscal arithmetic has improved, inflation has been contained, and foreign exchange is no longer scarce. As a result, investor confidence has picked up. With the final $2bn tranche of the loan expected to be dispersed in the middle of 2019, the onus now lies on Egyptian policymakers to keep up the momentum. Bottom Line: With the IMF program now winding down, the continuity of reform implementation is squarely on the back of policymakers. With further structural policies in the pipeline, we expect policymakers to build on the macroeconomic gains of the past few years. Reaping The Rewards The most evident improvement following the reforms is seen in the fiscal purse. For the first time in over a decade, the primary balance is in surplus (Chart 6). The improvement reflects lower government spending commitments on the back of fiscal consolidation (Chart 7). Nevertheless, revenues remain weak, despite the implementation of the VAT, implying a need to improve tax collection and boost aggregate demand to raise taxable revenues. Chart 6Improving In Fiscal Arithmetic...
Improving In Fiscal Arithmetic...
Improving In Fiscal Arithmetic...
Chart 7...On Back Of Fiscal Consolidation
...On Back Of Fiscal Consolidation
...On Back Of Fiscal Consolidation
As policymakers continue reforming budgetary allocations, we expect the primary surplus to remain intact. This will alleviate some of the pressure on the overall budget, which, while still in deficit, has improved substantially. With the final $2bn tranche of the loan expected to be dispersed in the middle of 2019, the onus now lies on Egyptian policymakers to keep up the momentum. Nevertheless, the stock of public debt – whilst declining – remains elevated and will continue weighing on the overall budget (Chart 8). This is especially problematic for fiscal arithmetic since domestic interest rates are in the double digits and interest payments will tie down roughly half of government revenues. A combination of improving potential GDP, falling domestic interest rates, and continued prudence on debt is needed to stabilize Egypt’s debt dynamics. In fact, with the decline in both headline and core inflation, the Central Bank of Egypt has already embarked on a monetary easing cycle, cutting rates by 300 basis points since the beginning of last year (Chart 9). Although interest rates remain extremely high, lower borrowing costs will not only improve debt dynamics on the margin, but also encourage private sector credit, thus raising aggregate output and revitalizing domestic investment. Chart 8Debt Remains A Burden
Debt Remains A Burden
Debt Remains A Burden
Chart 9Continued Easing Will Boost Outlook
Continued Easing Will Boost Outlook
Continued Easing Will Boost Outlook
While inflation may accelerate in the coming months – on the back of a seasonal uptick in food prices during the month of Ramadan and the further removal of subsidies – we expect further cuts by the CBE in 2H2019 and 2020. Falling real wages due to fiscal consolidation also point to lower inflationary pressures (Chart 10). Unless Egypt manages to stabilize its debt dynamics, it will once again be forced to resort to debt monetization, which bodes ill for the currency as well as for inflation. The evidence to date points to an improvement (Chart 11). Chart 10Inflationary Pressures Are Contained
Inflationary Pressures Are Contained
Inflationary Pressures Are Contained
Along with the improvement in the fiscal account, Egypt’s external deficit has also narrowed on the back of the improvement in the macroeconomic climate (Chart 12). The contraction in the current account deficit has been bolstered by an expansion in exports, which grew more than 10% in 2018. Chart 11Authorities Resisting Urge To Monetize Debt
Authorities Resisting Urge To Monetize Debt
Authorities Resisting Urge To Monetize Debt
Chart 12External Deficit Contracting
External Deficit Contracting
External Deficit Contracting
Chart 13Natural Gas Exports Will be Supportive
Natural Gas Exports Will be Supportive
Natural Gas Exports Will be Supportive
Notably, the energy trade balance has benefitted from an increase in Egypt’s natural gas potential (Chart 13). The giant Zohr field – the largest gas discovery ever made in the Mediterranean – came on stream in December 2017, and will support Egypt’s self-sufficiency in gas after falling domestic production forced Egypt to cut most LNG exports in 2014. The location of the gas field also presents opportunities for Egypt to become a natural gas export hub in the region. The Zohr field is close to other major fields in Israel and Cyprus, which means economies of scale can be utilized in developing regional export infrastructure. Egypt’s LNG export plants in Damietta and Idku have a capacity of 19 billion cubic meters (bcm) per year, which have been mostly idle in recent years. Already, an agreement between Egypt and Cyprus this past December committed to the construction of a pipeline connecting the Aphrodite gas field to Egypt’s LNG facilities. Similarly, a rebound in revenues from tourism to near-pre-crisis levels has helped improve the external account (Chart 14). Going forward, we expect the decline in terrorism to support the rebound of foreign inflows from tourism (Chart 15). This will be a non-negligible source of cash as tourism now accounts for roughly half of all service receipts, up from less than a quarter just three years ago. However, given that the security situation is unpredictable, this sector remains vulnerable to downside risks. Chart 14Rebound In Tourism...
Rebound In Tourism...
Rebound In Tourism...
Chart 15
Another supportive source of inflows has been remittances from Egyptians living abroad. These continue to grow at a double-digit rate (Chart 16). Chart 16Recovery In Remittance Inflows
Recovery In Remittance Inflows
Recovery In Remittance Inflows
Chart 17Foreign Investment Will Be Supported...
Foreign Investment Will Be Supported...
Foreign Investment Will Be Supported...
However, the financial account has taken a hit recently as inflows from portfolio investments have come down quite sharply on the back of investor aversion to emerging markets last year (Chart 17). Given the Fed’s pause, China’s stimulus, and other factors, we expect a pickup in portfolio investment. What’s more, Egyptian authorities have been working on improving the business environment, reflected in Egypt’s rising rank in the ease of doing business and global competitiveness surveys (Chart 18). This should improve foreign direct investment, which remains relatively weak so far.
Chart 18
Chart 19Build Up In Central Bank Reserves
Build Up In Central Bank Reserves
Build Up In Central Bank Reserves
Of course, despite these improvements, Egypt still ranks relatively low on these measures. Thus continued efforts to improve the business environment will be necessary to make Egypt an attractive destination for businesses. Yet Egypt’s foreign reserves have picked up considerably, and more importantly its net reserves – which exclude the CBE’s foreign borrowings – have once again turned positive (Chart 19). Bottom Line: The rewards from Egypt’s structural reforms are evident in the improvements to its twin deficits. While continued policy prudence is necessary to maintain the momentum of these policies, we expect the EGP/USD to remain flattish for the remainder of the year. We expect continued policy easing as the CBE cuts rates at least one more time in the second half of the year on the back of slowing inflation. Ghosts Of Futures Past Political stability and an improvement in macroeconomic indicators will no doubt be supportive of the Egyptian economy and assets in the near term. However, several structural risks remain, and could derail its performance down the road. For one, Egypt remains heavily reliant on its external environment. This environment has been largely cooperative throughout Sisi’s term in office, but a global or EM downturn could cause investment to collapse. Meanwhile the cyclical rise in oil prices will weigh on the import bill and raise headline inflation. Improvements in the business environment should attract foreign directinvestment. Second, a rising dependency ratio will pose a burden on Egypt in the coming years (Chart 20). Furthermore, elevated female and youth unemployment keep the output gap wide. True, the current improvement in the overall labor market will help the country weather the demographic headwind. However, another chronic problem is the quality of the Egyptian labor market. The latest data from the World Bank shows that government spending on education is significantly lower than it is among EM peers (Chart 21). Similarly, health expenditure per capita has not picked up much in recent years and has actually fallen as a share of GDP. Chart 20Demographic Challenges Remain
Demographic Challenges Remain
Demographic Challenges Remain
Chart 21
This has manifested in relatively low labor productivity and highlights the need for investment in human capital to improve potential GDP and the necessity for funds to be channeled to these sectors. Fortunately, the reforms have freed up badly needed fiscal space for now. Another key concern is the bloated economic role of the state and military. This is a double whammy to the Egyptian economy as it reduces fiscal funds available for other uses, such as healthcare and education while constraining the private sector. The crowding out of the private sector is evident from the recipients of bank credit: loans to the government – beyond purchases of government securities – are growing at by nearly 50% y/y, while lending to other sectors is expanding at less than 15% y/y (Chart 22). Once again, however, there is evidence of improvement: bank investments in government securities have come down from their peak and now represent roughly a third of total bank assets (Chart 23). Accordingly, credit to the private sector has likely bottomed. Chart 22Private Sector Crowding Out Remains...
Private Sector Crowding Out Remains...
Private Sector Crowding Out Remains...
Chart 23...But Signs Of Improvement
...But Signs Of Improvement
...But Signs Of Improvement
One structural concern that is here to stay is the fact that the Egyptian military occupies an oversized share of the economy. Given that all companies of the Egyptian armed forces are exempt from taxes, they have an unfair advantage over the private sector. The military has an especially large presence in Egypt’s recent infrastructure mega-projects. These include $8.2 billion invested in an expansion of the Suez Canal as well as the construction of a new administrative capital, 45 km to the east of Cairo. The military budget is secret and connected industries are not subject to auditing. Preferential treatment in assigning government contracts and the ability to offer services at a cheaper rate have further expanded the military’s role in the economy. Bottom Line: Risks to our optimistic outlook on Egypt mostly come from any deterioration in the external environment. The Egyptian economy is also weakened by structural weaknesses such as a large, under-invested labor market. These structural risks are considerable and will weigh on the long term investment potential of Egypt. In the short term, however, Egypt appears to be a lucrative trade opportunity. Investment Implications Egyptian sovereign spreads will likely contract going forward on the back of an improvement in the economic outlook (Chart 24). Thus, we recommend an overweight stance in Egyptian sovereign bonds within the EM space. Chart 24Improved Fundamentals A Positive For Sovereign Bonds
Improved Fundamentals A Positive For Sovereign Bonds
Improved Fundamentals A Positive For Sovereign Bonds
Chart 25Equities Still Attractive
Equities Still Attractive
Equities Still Attractive
In the equities space, Egypt’s valuations look attractive relative to their Emerging Market and Frontier Market peers (Chart 25), despite the recent rally in recognition of the stability we outline here. Matt Gertken, Vice President Geopolitical Strategist mattg@bcaresearch.com Marko Papic Consulting Editor marko@bcaresearch.com Footnotes 1 Please see BCA Commodity & Energy Strategy Weekly Report, “Sussing Out OPEC 2.0’s Production Cuts, U.S. Waivers On Iran Sanctions,” April 11, 2019, available at www.bcaresearch.com. 2 The U.S. Strategic Petroleum Reserve (SPR) was created in 1975, in the wake of the Arab oil embargo, to protect the U.S. from supply disruptions. Faced with a “severe energy supply interruption” the U.S. president can authorize a maximum drawdown of 30 million barrels within a 60-day period, beginning 13 days after the decision. Notably, the SPR was tapped for 21 million barrels in 1990-91, during the Iraqi invasion of Kuwait, and for 30 million barrels in 2011, when Libyan production fell to zero amid the revolution. The current inventory is 649 million barrels of sweet and sour crude, which could last the U.S. 114 days of crude imports. As U.S. net oil imports decrease, the length of time that the SPR could substitute for net imports rises. 3 The Egyptian parliament voted in favor of the proposed changes on April 16. The changes will be put to a public referendum – as early as next week – before taking effect. The amendments seek to (1) extend presidential terms from four to six years, (2) permit President Sisi to run again after his current term ends in 2022 – as an exceptional case, (3) allow the president to select the heads of judicial bodies and to oversee a new council responsible for judicial affairs, and (4) enshrine in the constitution a political role for the army to preserve the constitution, democracy and – ironically – the civilian nature of the country. 4 The most recent appreciation this year raised fears that the CBE is once again intervening in the currency market through state-owned banks.