Emerging Markets
The news flow so far has been positive, with both U.S. President Donald Trump and Chinese President Xi Jinping publicly acknowledging they are closer to a deal. But with a still-ballooning U.S. trade deficit with China, Trump will want to take home a win. …
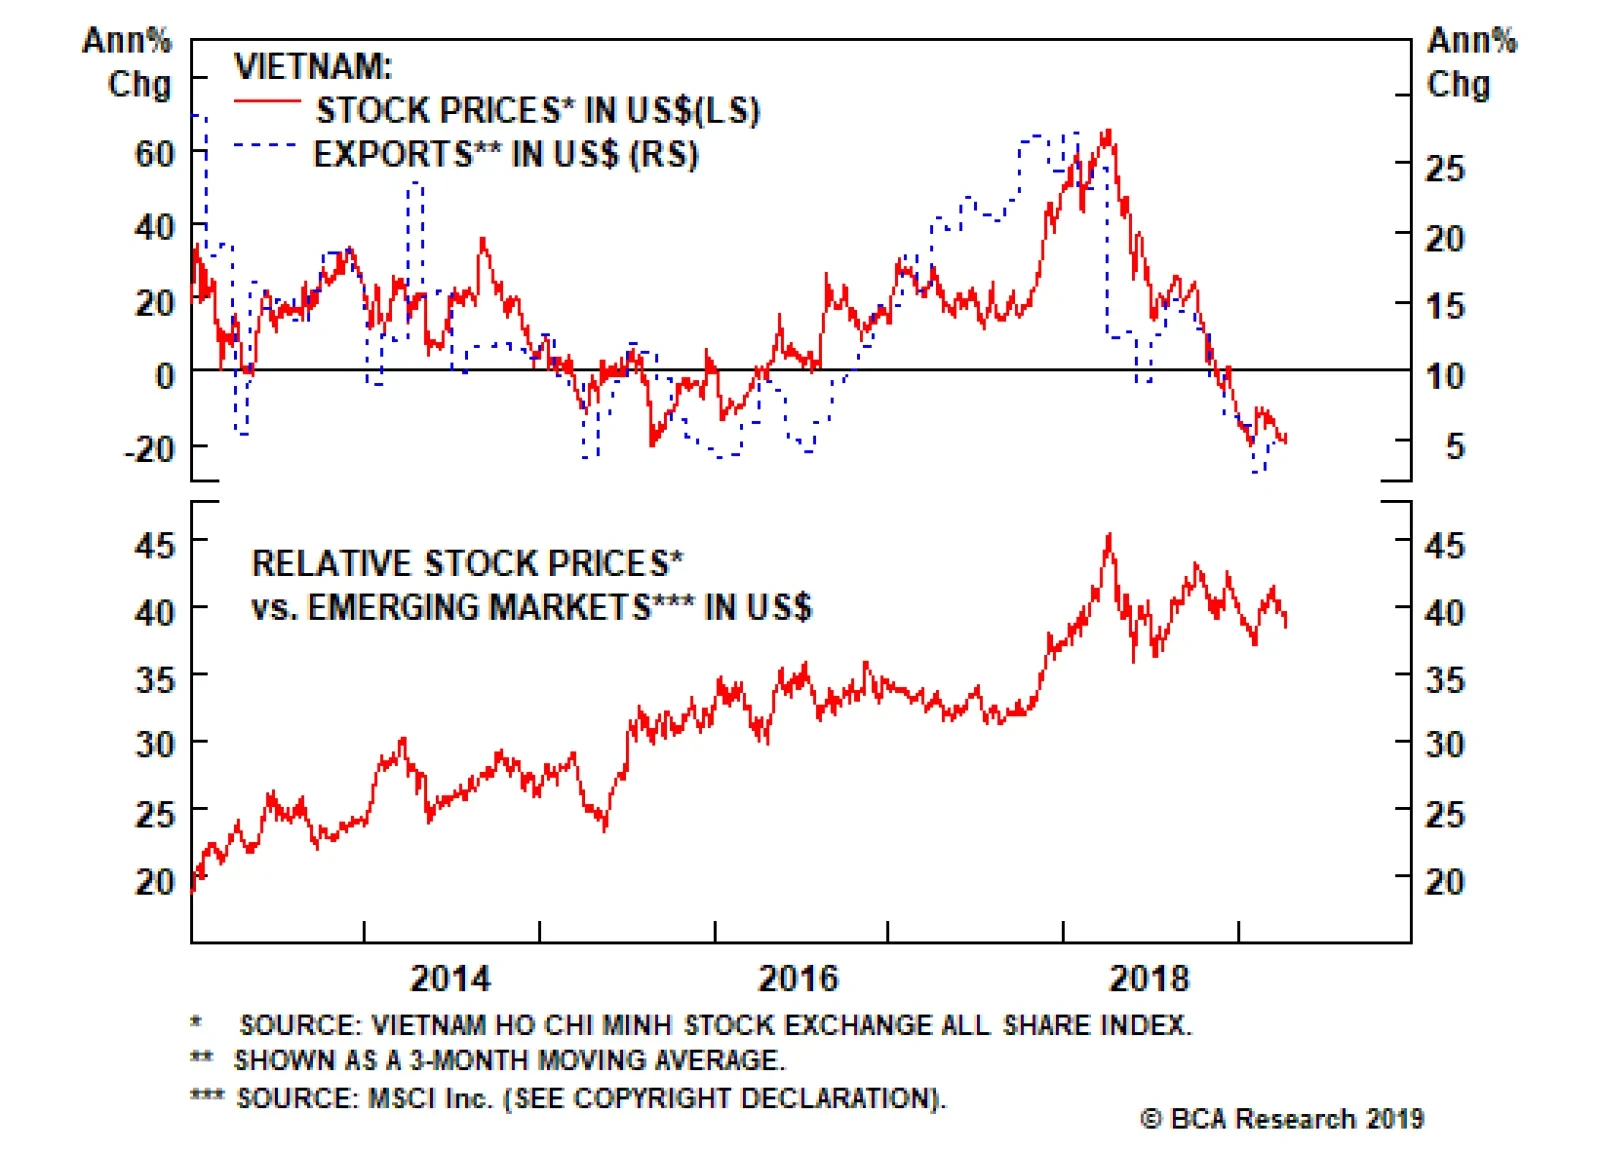
The significant deceleration in export growth alongside the selloff in broader emerging markets has generated a double-digit drop in Vietnamese stock prices over the past 12 months. Looking forward, a new upturn in Vietnamese equities is in the making. The…

We noted in our December 5 Weekly Report that a tactical overweight stance towards Chinese stocks (either the domestic or investable market) within a global equity portfolio was probably warranted over the following few months, but that the conditions for a cyclical overweight stance (6-12 months) were not yet present.1 More recently, we noted that an improvement in several economic indicators suggested that a strong March credit number could create these conditions, and tip the scales in favor of an upgrade recommendation for Chinese stocks over the coming year.2 Chart 1Leading Indicators Are Now Convincingly Bullish For Chinese Stocks
Leading Indicators Are Now Convincingly Bullish For Chinese Stocks
Leading Indicators Are Now Convincingly Bullish For Chinese Stocks
Chart 1 shows that today’s credit release has caused a meaningful improvement in the credit component of our leading indicator for the Chinese economy. Overall growth in the money supply remains weak, but monetary conditions are easy and have clearly helped support a rebound in credit growth. All told, today’s data has made us sufficiently confident in the Chinese macroeconomic outlook to recommend a cyclical (6-12 month) overweight towards Chinese stocks (both investable and domestic) versus the global benchmark. Several questions concerning both the outlook for the economy and for Chinese stocks remain, and we will review these issues at length in next week’s report. In particular, we will discuss how much relative equity upside investors can expect over the coming year, whether the recent pace of credit growth significantly increases the chance of another credit overshoot, and when investors should expect to see a pickup in actual economic activity. Stay tuned! Jonathan LaBerge, CFA, Vice President Special Reports jonathanl@bcaresearch.com 1 Please see China Investment Strategy Weekly Report “2019 Key Views: Four Themes For China In The Coming Year”, dated December 5, 2018, available at cis.bcaresearch.com. 2 Please see China Investment Strategy Weekly Report “China Macro And Market Review”, dated April 3, 2019, available at cis.bcaresearch.com.
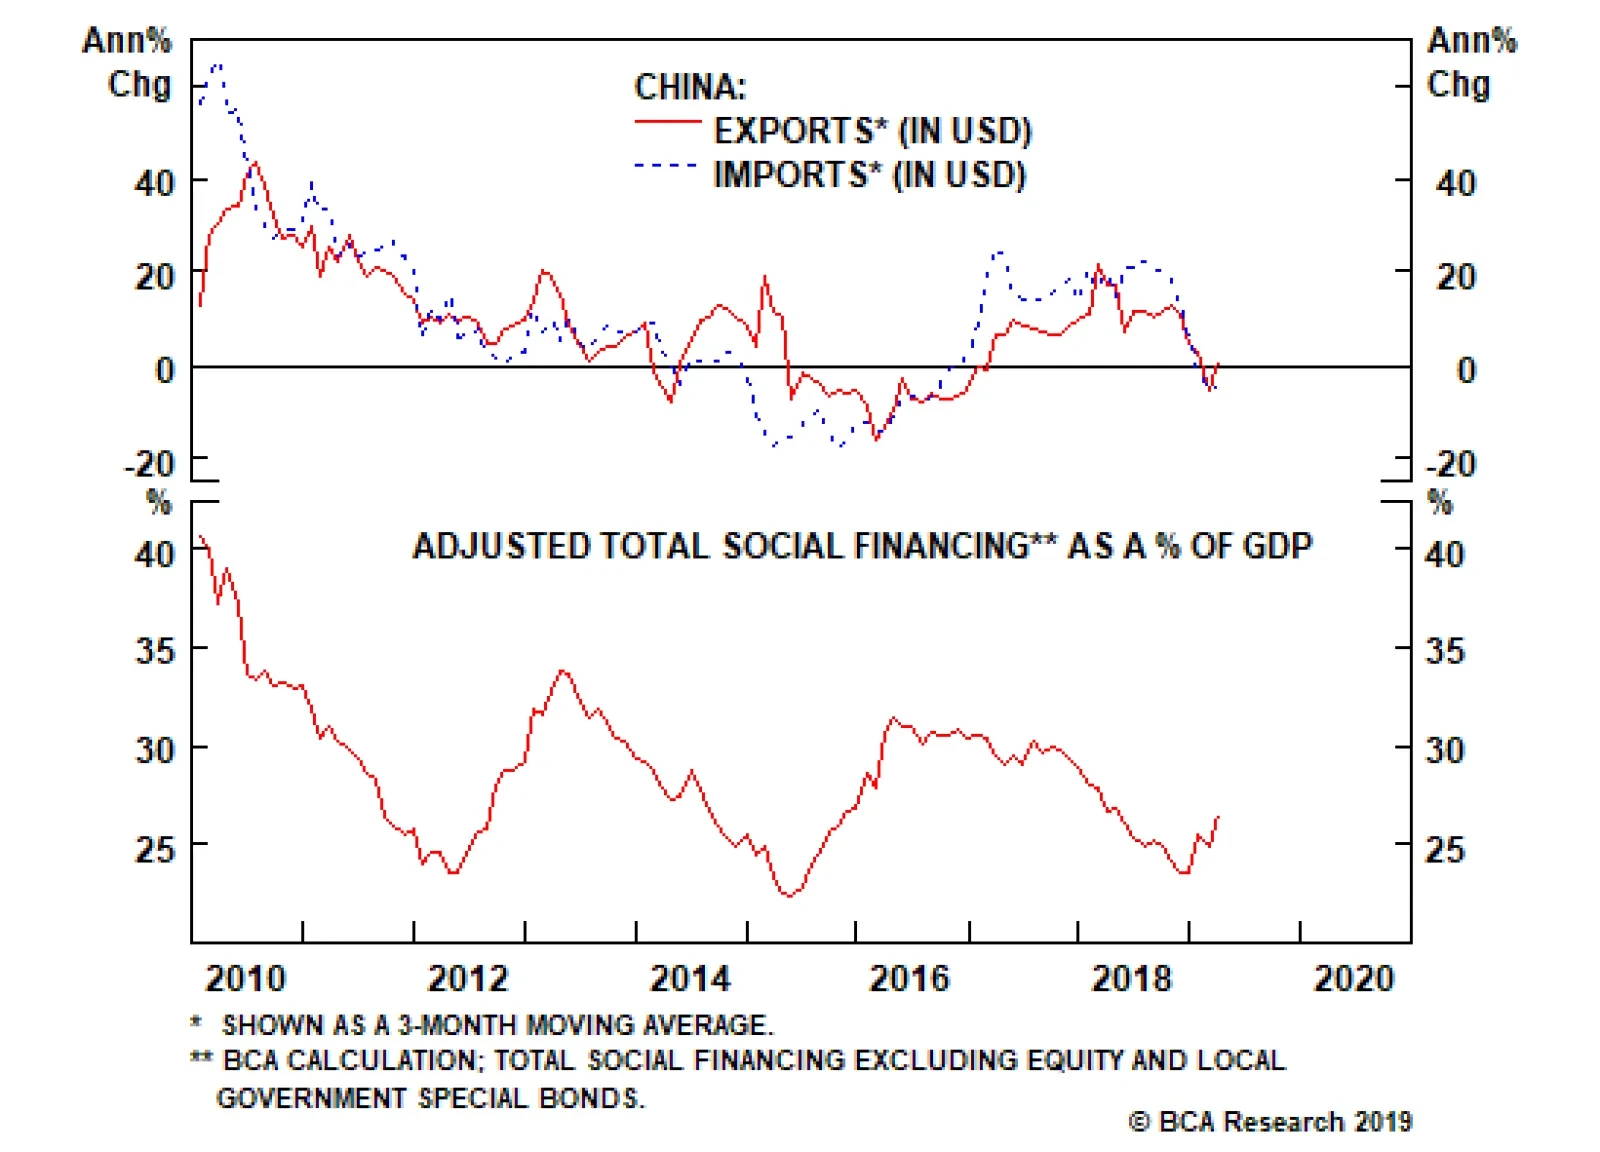
Overnight data out of China came out stronger than expected, significantly increasing the odds of a looming rebound in growth. Export growth came in at 14.2% year-on-year for the month of March, versus -20.8% for the previous month. Compositionally, the…
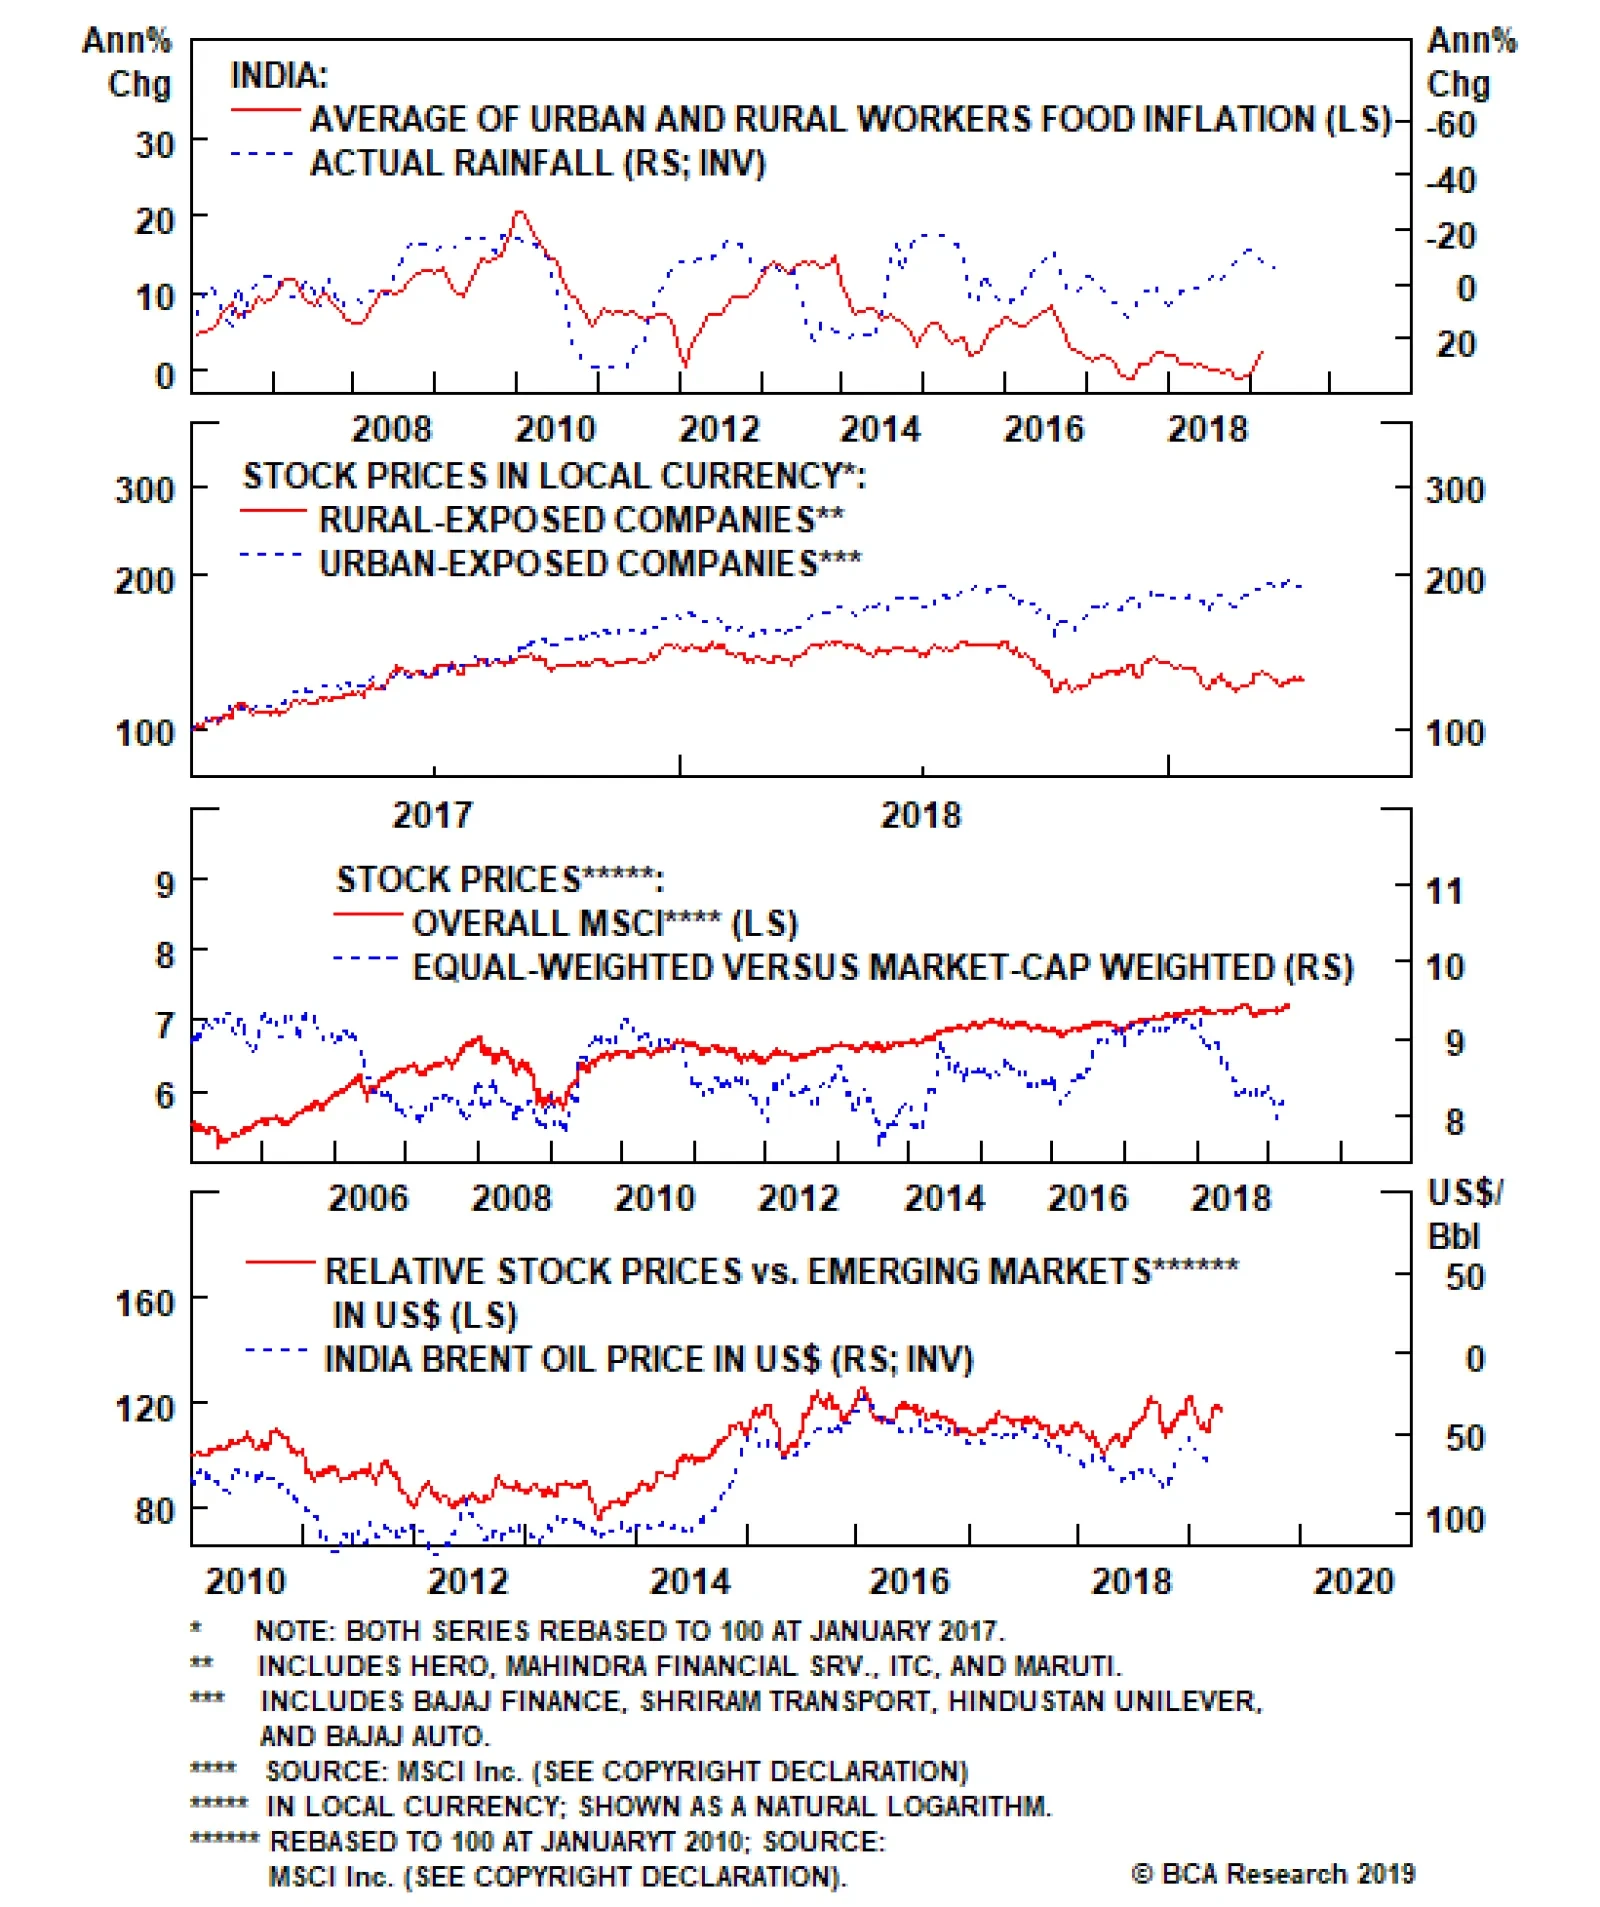
A window of risk for the Indian bourse remains. While Modi’s chances of winning the elections are reasonable, he and his party – the Bharatiya Janata Party, or BJP – may not win an outright majority in the lower house, as occurred in May 2014. The basis…
KSA has indicated it sees a need to extend OPEC 2.0’s production-cutting deal into 2H19, when the coalition’s ministers meet in June. Of late, Khalid al-Falih, KSA’s oil minister, is indicating no further cuts in the Kingdom’s output are needed, however. …
Highlights Evidence continues to mount that the Chinese economy is in a bottoming process. This suggests the path of least resistance for the RMB is up. Meanwhile, as the U.S. and China move closer to a trade deal, any geopolitical risk premium in the RMB will slowly erode. The ultimate catalyst for CNY longs will be depreciation in the U.S. dollar, which we believe is slowly underway. The ECB is turning more dovish at a time when euro area growth is hitting a nadir. This will be bullish for the euro beyond the near term. Our limit buy on the pound was triggered at 1.30. Target 1.45 with stops at 1.25. With the Aussie dollar close to the epicenter of Chinese stimulus, data down under is increasingly stabilizing. We are closing our short AUD/NOK position for a small profit. Feature Chart I-1The Chinese Yuan Is Pro-cyclical
The Chinese Yuan Is Pro-cyclical
The Chinese Yuan Is Pro-cyclical
In addition to the dovish shift by global central banks, most investors are rightly fixated on China at this juncture in the economic cycle. For one, it has been mostly responsible for the mini cycles in the global economy since 2014. And with improvements in both Chinese credit and manufacturing data in recent months, the consensus is drawing closer to the fact that we may be entering a reflationary window. Looking at risk assets, MSCI China is up 25% from its lows, while the S&P 500 is up 20%. Commodity prices are also rising, with crude oil hitting a new calendar-year high this week. The corollary is that if the improvement in Chinese data proves sustainable, it will propel these asset markets to fresh highs. The evolution of the cycle has important implications for the yuan exchange rate, because the RMB has been trading like a pro-cyclical currency in recent years. The USD/CNY has been moving tick for tick with emerging market equities, Asian currencies, and even some commodity prices (Chart I-1). Ever since its liberalization over a decade ago, the RMB may finally be behaving like a free-floating exchange rate. Therefore, a simple evaluation of how relative prices between China and the rest of the world evolve will be valuable input for the fair value of the RMB exchange rate. Reading the tea leaves from Chinese credit data can be daunting, but we agree with the assessment of our China Investment Strategy team that while the credit impulse has clearly bottomed,1 the magnitude of the rise is unlikely to be what we saw in 2015-2016. That said, a higher credit-to-GDP ratio also requires a smaller increase in credit growth to have an outsized effect on GDP. As such, monitoring what is happening with hard data in the economy concurrently – in particular, green shoots – could add valuable evidence to the reflation theme. A Repeat Of 2016? Cycle bottoms can be protracted and volatile, but also V-shaped. So it is useful when economic data is at a nadir to pay attention to any green shoots emerging, because by the time the last piece of pertinent economic data has turned around, it may well be too late to call the cycle. Admittedly, most measures of Chinese (and global) growth remain weak. But there have been notable improvements in recent months that suggest economic velocity may be picking up: Production of electricity and steel, all inputs into the overall manufacturing value chain, are inflecting higher. Intuitively, these tend to lead overall industrial production. Overall industrial production remains weak, but the production of electricity and steel, all inputs into the overall manufacturing value chain, are inflecting higher. Intuitively, these tend to lead overall industrial production (Chart I-2). Electricity production for the month of February grew 5% after grinding to a halt in 2015-2016. Production of steel also rose by 7%. If these advance any further, they will begin to exceed Q4 GDP growth, indicating a renewed mini-cycle. Chart I-2A Revival In Industrial Activity
A Revival In Industrial Activity
A Revival In Industrial Activity
Chart I-3Metal Prices Are Sniffing A Rebound
Metal Prices Are Sniffing A Rebound
Metal Prices Are Sniffing A Rebound
In recent weeks, both steel and iron ore prices have been soaring. Many commentators have attributed these increases to supply bottlenecks and/or seasonal demand. However, it is evident from both the manufacturing data and the trend in prices that demand is also playing a role (Chart I-3). Overall residential property sales remain soft, but evidence from tier-1 and even tier-2 cities is signalling that this may be behind us, given robust sales. Over the longer term, the ebb and flow of property sales has tended to be in sync across city tiers. A revival in the property market will support construction activity and investment. House prices have been rising to the tune of 10% year-on-year, and real estate stocks in China may be sniffing an eventual pick-up in property volumes (Chart I-4). Over the last 20 years or so, Chinese credit growth has been a reliable indicator for car sales with a lead of about six months. Government expenditures were already inflecting higher ahead of last month’s China National People’s Congress (NPC). Again, this suggests stimulus this time around may be more fiscal than monetary (Chart I-5). In addition to the recent VAT cut for manufacturing firms from 16% to 13%, a string of policy easing measures will begin to accrue, including a cut to social security contributions effective May 1st, and perhaps a pickup in infrastructure spending. Already, real estate infrastructure spending growth is perking up, with that in the mining sector soaring to multi-year highs. Chart I-4Real Estate Volumes Could Pick Up
Real Estate Volumes Could Pick Up
Real Estate Volumes Could Pick Up
Chart I-5The Fiscal Spigots Are Opening
The Fiscal Spigots Are Opening
The Fiscal Spigots Are Opening
Finally, Chinese retail sales including those of durable goods remain very weak. Car sales are deflating at the fastest pace in over two decades. But the latest VAT cut by the government is being passed through to consumers, with an increasing number of car manufactures cutting retail prices. Chart I-6Car Sales Typically Have V-Shaped Recoveries
Car Sales Typically Have V-Shaped Recoveries
Car Sales Typically Have V-Shaped Recoveries
Over the last 20 years or so, Chinese credit growth has been a reliable indicator for car sales with a lead of about six months (Chart I-6). The indicator right now suggests we could witness a coiled-spring rebound in Chinese car sales over the next few months. Bottom Line: Both Chinese stocks and commodity prices have been suggesting a bottoming process in the domestic economy for a while now. Incoming data is beginning to corroborate this view. This has important implications for both the Chinese yuan and other global assets. Capital Flows Improving domestic and external conditions will likely offset any renewed pressure on the Chinese yuan from capital outflows. Our China Investment Strategy team reckons that even after adjusting for cross-border RMB settlements and illicit capital outflows, there is less evidence of capital flight today than there was in 2015-2016.2 Chart I-7Offshore Markets Don't See RMB Weakness
Offshore Markets Don't See RMB Weakness
Offshore Markets Don't See RMB Weakness
Typically, offshore markets have had a good track record of anticipating depreciation in the yuan. Back in 2014, offshore markets started pricing in a rising USD/CNY rate, and maintained that view all the way through to 2018, when the yuan eventually bottomed. Right now, no such depreciation is being priced in (Chart I-7). The reason offshore markets in Hong Kong and elsewhere can be prescient is because more often than not, they are the destination for illicit flows out of China. For example, one of the often-rumored ways Chinese money has left the country is through junkets, key operators in Macau casinos.3 These junkets bankroll their Chinese clients in Macau while collecting any debts in China allowing for illicit capital outflows. This was particularly rampant ahead of the Chinese 2015-2016 corruption clampdown, when Macau casino equities were surging while equity prices in China remained subdued. Historically, both equity markets tend to move together, since over 70% of visitors to Macau come from China (Chart I-8). Right now, both the Chinese MSCI index and Macau casino stocks are rising in tandem, suggesting gains are more related to fundamentals than hot money outflows. Chart I-8Macau Casinos: A Good Proxy For Chinese Spending
Macau Casinos: A Good Proxy For Chinese Spending
Macau Casinos: A Good Proxy For Chinese Spending
A surge in illicit capital outflows could also be part of the reason for an explosion in sight deposits in Hong Kong ahead of the 2015-2016 clampdown (Chart I-9). Admittedly, most of these deposits were and still are due to cross-border RMB settlements, but it is also possible that part of these constituted hot money outflows. With these sight deposits rising at a more reasonable pace, it suggests little evidence of capital flight. Chart I-9The Chinese Government Has Clamped Down On Illicit Flows
The Chinese Government Has Clamped Down On Illicit Flows
The Chinese Government Has Clamped Down On Illicit Flows
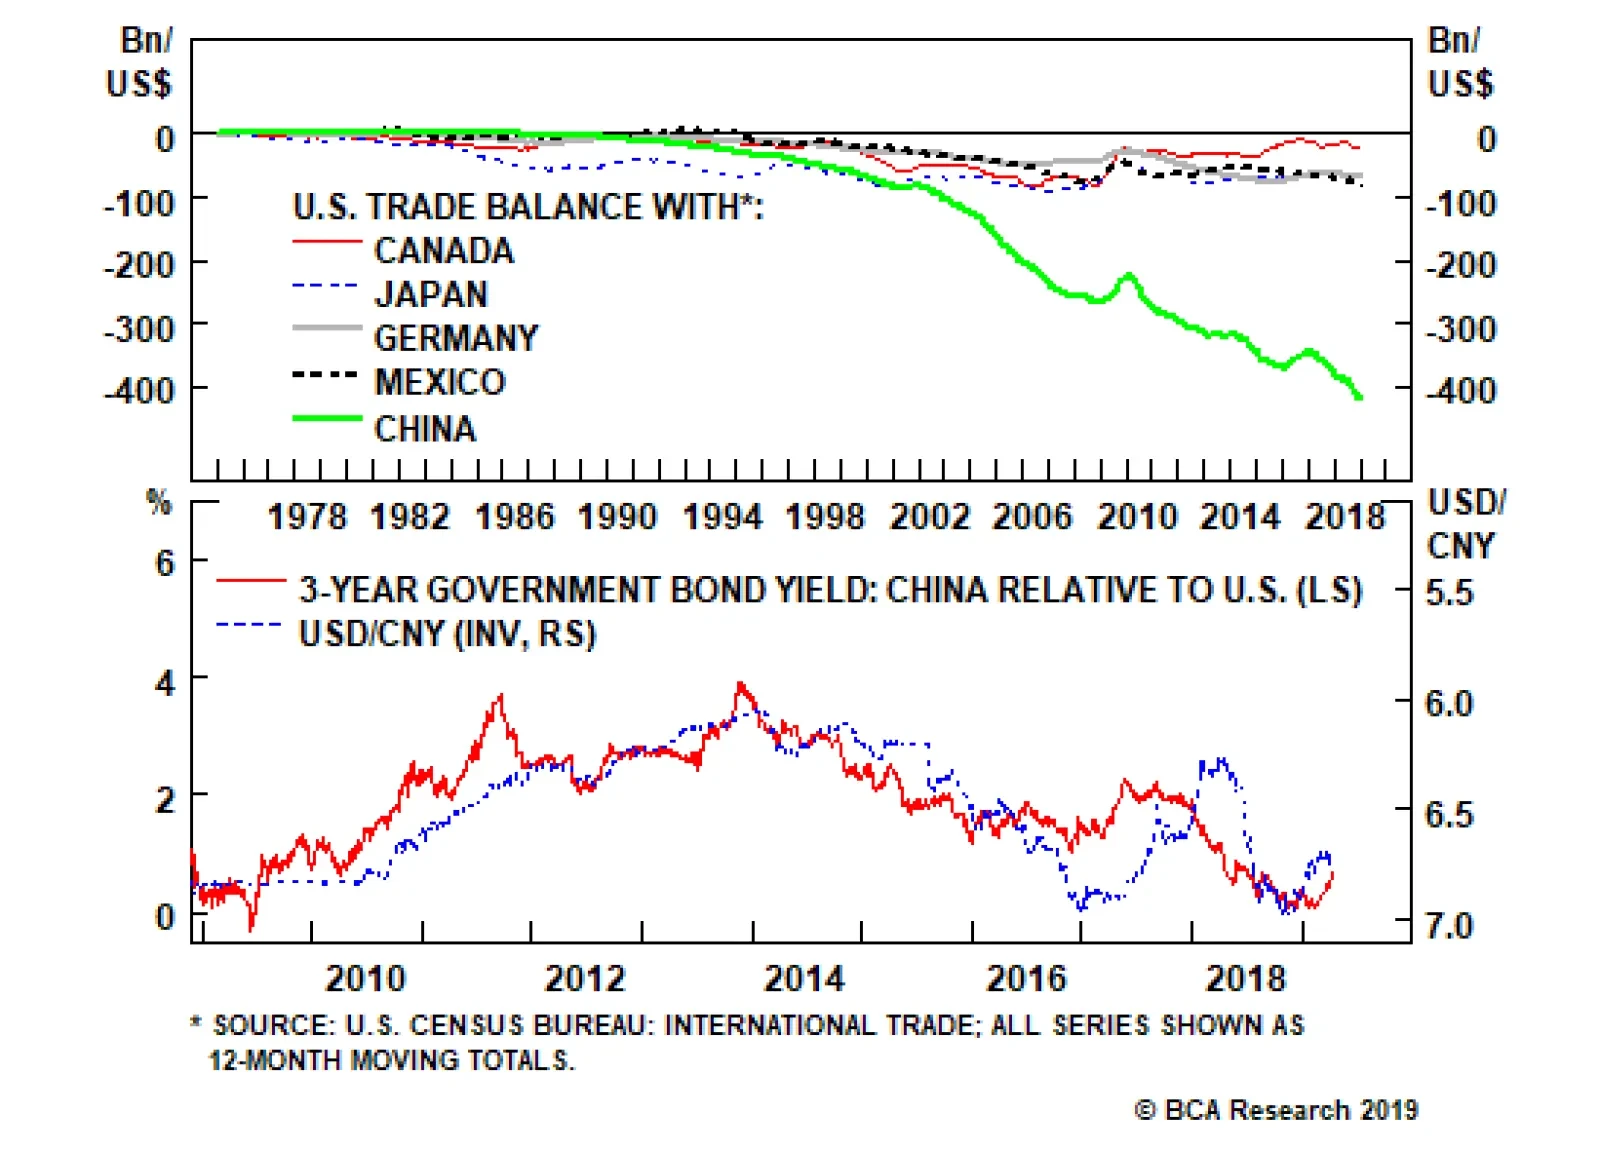
Trade Truce A trade truce between the U.S. and China will be the final catalyst for a stronger yuan. The news flow so far has been positive, with both U.S. President Donald Trump and Chinese President Xi Jinping publicly acknowledging they are closer to a deal. Even well-known China hawk Peter Navarro, head of the U.S. National Trade Council, has admitted that the two sides are in the final stages of talks. But with a still-ballooning U.S. trade deficit with China, Trump will want to take home a win (Chart I-10). Chart I-10Trump Needs To Take A Win Back To America
Trump Needs To Take A Win Back To America
Trump Needs To Take A Win Back To America
Concessions on the Chinese side so far seem reasonable, allowing us to speculate that there is a rising probability of a deal. They have agreed to increase agriculture and energy imports from the U.S. by about $1 trillion over the next six years, announced a cut on import tariffs, revised their Patent Law to improve protection of intellectual property, and provided a clear timeline for when foreign caps will be removed in sectors such as autos and financial services. These seem like very reasonable concessions that will allow Trump to go home and declare victory. Trade wars are usually synonymous with recessions. As such, there are acute political constraints inching both sides towards an agreement. For President Trump, a deteriorating U.S. manufacturing sector in the midwestern battleground states is a thorn in his side. For President Xi, rising unemployment is a key constraint. On the currency front, the details of any agreement are still unknown, but should Chinese economic fundamentals start to genuinely improve, it will put upward pressure under rates – and ergo the yuan (Chart I-11). A gradually rising yuan exchange rate will further assuage any doubts or concerns that Trump may have. Bottom Line: Our fundamental models show the yuan as undervalued by about 3%. This means China could allow its currency to gradually appreciate towards fair value, with little impact on the domestic economy or even exports. Given some green shoots in incoming economic data, little risk of capital flight, and the rising likelihood of a trade deal between the U.S. and China, our bias is that the path of least resistance for the Chinese RMB is up (Chart I-12). Chart I-11Rising Chinese Rates Will Favor The Yuan
Rising Chinese Rates Will Favor The Yuan
Rising Chinese Rates Will Favor The Yuan
Chart I-12The RMB Is Not Expensive
The RMB Is Not Expensive
The RMB Is Not Expensive
Another Dovish Shift By The ECB In another dovish twist, the European Central Bank kept monetary policy unchanged following this week’s meeting, while highlighting that it might be on hold for longer. Unsurprisingly, incoming data has been weak of late, which the ECB (like other central banks) blamed on the external environment. It did fall short of speculation that it will introduce a tiered system for its marginal deposit facility, which would have alleviated some cash flow pressures for euro area banks. Our bias is for the new Targeted Long Term Refinancing Operation (TLTRO III – in other words, cheap loans), to remain a better policy tool than a tiered central bank deposit system. In the case of a TLTRO, the ECB can effortlessly decentralize monetary policy, since liquidity gravitates towards the countries that need it the most. While a tiered system can allow a bank to offer higher rates and attract deposits, there is no guarantee that these deposits will find their way into new loans. It is also likely to benefit countries with the most excess liquidity. In the case of a TLTRO, the ECB can effortlessly decentralize monetary policy. Beyond any short-term volatility in the euro, we think the ECB’s dovish shift could be paradoxically bullish. If a central bank eases financing conditions at a time when growth is hitting a nadir, it is tough to argue that it is bearish for the currency. Meanwhile, fiscal policy is also set to be loosened. Swedish new orders-to-inventories lead euro area growth by about five months, and the recent bounce could be a harbinger of positive euro area data surprises ahead (Chart I-13). Chart I-13Euro Area Growth Will Recover
Euro Area Growth Will Recover
Euro Area Growth Will Recover
Bottom Line: European rates are further below equilibrium compared to the U.S., and the ECB’s dovish shift will help lift the euro area’s growth potential. Meanwhile, investors are currently too pessimistic on euro area growth prospects. Our bias is that the euro is close to a floor. House Keeping Our buy-stop on the British pound was triggered at 1.30. We recommend placing stops at 1.25, with an initial target of 1.45. As we argued last week,4 the odds of a hard Brexit continue to fall, with U.K. Prime Minister Theresa May explicitly saying this week that the path for the U.K. going forward is either a deal with the EU or with no Brexit at all. As we go to press, EU leaders have granted the U.K. an extension until the end of October, with a review in June. Chart I-14What Next For The Pound?
What Next For The Pound?
What Next For The Pound?
Back when the referendum was held in June 2016, even the pro-Brexit Tories, a minority in the party, promised continued access to the Common Market. Fast forward to today and there are simply not enough committed Brexiters in Westminster to deliver a hard exit. Given that the can has been kicked down the road, markets are likely to turn their focus on incoming economic data. On that front, economic surprises in the U.K. relative to both the U.S. and euro area are soaring (Chart I-14). Elsewhere, we are also taking profits on our short AUD/NOK position. Since 2015, the market has been significantly dovish on Australia, in part due to a more accelerated downturn in house prices and a marked slowdown in China. The reality is that the downturn in Australia has allowed some cleansing of sorts and has brought it far along the adjustment path relative to its potential. Any potential growth pickup in China will light a fire under the Aussie dollar, which is a risk to this position. Chester Ntonifor, Foreign Exchange Strategist chestern@bcaresearch.com Footnotes 1 Please see China Investment Strategy Special Report, titled “China: Stimulating Amid The Trade Talks,” dated February 20, 2019, available at fes.bcaresearch.com 2 Please see China Investment Strategy Special Report, titled “Monitoring Chinese Capital Outflows,” dated March 20, 2019, available at fes.bcaresearch.com 3 Farah Master, “Factbox: How Macau's casino junket system works,” Reuters, October 21, 2011. 4 Please see Foreign Exchange Strategy Weekly Report, titled “Not Out Of The Woods Yet,” dated April 5, 2019, available at bca.bcaresearch.com Currencies U.S. Dollar Chart II-1USD Technicals 1
USD Technicals 1
USD Technicals 1
Chart II-2USD Technicals 2
USD Technicals 2
USD Technicals 2
Recent data in the U.S. have been mostly positive: In March, 196K nonfarm jobs were created, surprising to the upside; unemployment rate stayed low at 3.8%, though average hourly earnings growth fell to 3.2% year-on-year. The factory orders in February contracted by 0.5% month-on-month. More importantly, headline consumer price inflation in March rose to 1.9% year-on-year, however this was mostly lifted by rising energy prices. Core inflation excluding food and energy dropped by 10 basis points to 2%. JOLTs job openings unexpectedly fell to 7.1 million in February, from 7.6 million. However, initial jobless claims fell to 196K. After a 3-month lull, producer prices are inflecting higher at a pace of 2.2% year-on-year for the month of March. DXY index fell by 0.44% this week. Global risk assets are on the rise this week. Meanwhile, the Fed minutes highlighted that members are in no rush to raise rates. Stalling interest rate differentials will be a headwind for the dollar. Report Links: Not Out Of The Woods Yet - April 5, 2019 Tug OF War, With Gold As Umpire - March 29, 2019 Into A Transition Phase - March 8, 2019 The Euro Chart II-3EUR Technicals 1
EUR Technicals 1
EUR Technicals 1
Chart II-4EUR Technicals 2
EUR Technicals 2
EUR Technicals 2
Recent data in the euro area have been positive: The Sentix Investor Confidence index continues to inflect higher, coming in at -0.3 from -2.2. German industrial production grew by 0.7% month-on-month in February. Trade balances improved across the euro area. In France, the trade deficit fell to €-4.0B in February. In Germany, the trade surplus increased to €18.7B. Italian retail sales increased by 0.9% year-on-year in February. On the inflation front, consumer price inflation in Germany and France both stayed at 1.3% year-on-year in March. EUR/USD rose by 0.57% this week. On Wednesday, the ECB has decided to leave policy unchanged as expected. Mario Draghi also highlighted more uncertainties and downside risks to the euro area amid the ongoing trade disputes. While the global trade war might add volatility to the pro-cyclical euro, easier financial conditions should eventually backstop growth. Report Links: Into A Transition Phase - March 8, 2019 A Contrarian Bet On The Euro - March 1, 2019 Balance Of Payments Across The G10 - February 15, 2019 The Yen Chart II-5JPY Technicals 1
JPY Technicals 1
JPY Technicals 1
Chart II-6JPY Technicals 2
JPY Technicals 2
JPY Technicals 2
Recent data in Japan have been negative: Preliminary cash earnings fell by 0.8% year-on-year in February, the only decline since mid-2017. Household confidence continues to tick lower, coming in at 40.5 in March. The trade balance in February came in at a surplus of ¥489.2B. Capex is rolling over. Machinery orders fell by 5.5% year-on-year in February. Machine tool orders remain extremely weak, at -28.5% year-on-year for the month of March. Lastly, the foreign investment in Japanese stocks increased to ¥1,463.7B. USD/JPY fell by 0.46% this week. In its April regional outlook, the BoJ downgraded most of the prefectures in Japan, with only Hokkaido that had an upgrade in the aftermath of the earthquake. As domestic deflationary pressures intensify, this will favor the yen. This also raises the probability the government defers the consumption tax hike. Report Links: Tug OF War, With Gold As Umpire - March 29, 2019 A Trader’s Guide To The Yen - March 15, 2019 Balance Of Payments Across The G10 - February 15, 2019 British Pound Chart II-7GBP Technicals 1
GBP Technicals 1
GBP Technicals 1
Chart II-8GBP Technicals 2
GBP Technicals 2
GBP Technicals 2
Recent data in the U.K. have been strong: In February, manufacturing production increased by 0.6% year-on-year; industrial production also increased by 0.1% year-on-year, both surprising to the upside. Both were deflating in January. The goods trade balance in February fell to £-14.1B, however the total trade balance came in at a smaller deficit of £4.86B. Monthly GDP also came in higher at 2% year-on-year in February. House prices gains have pared the increase of previous years, but the Halifax house price index still increased by 2.6% year-on-year for the month of March. GBP/USD rose by 0.41% this week. Theresa May got an extension for Brexit to October 31. Meanwhile, U.K. data have been stronger than consensus recently. We are long GBP/USD from 1.30, with a 0.6% profit. Report Links: Not Out Of The Woods Yet - April 5, 2019 A Trader’s Guide To The Yen - March 15, 2019 Balance Of Payments Across The G10 - February 15, 2019 Australian Dollar Chart II-9AUD Technicals 1
AUD Technicals 1
AUD Technicals 1
Chart II-10AUD Technicals 2
AUD Technicals 2
AUD Technicals 2
Recent data in Australia have continued to improve: Investment lending for homes in February grew by 2.6%. Home loans in February increased by 2% month-on-month, surprising to the upside. Westpac consumer confidence came in at 100.7 in April, increasing by 1.9%. AUD/USD surged by 0.64% this week. The RBA Deputy Governor Guy Debelle hinted that a wait-and-see approach for interest rates seemed like the appropriate path, signaling that policy will continue to be accommodative. Meanwhile, the Australian dollar is probably anticipating better upcoming data from China, as it is Australia’s largest trading partner. If the world’s second largest economy can turn around, the Aussie dollar is likely to grind higher. Report Links: Not Out Of The Woods Yet - April 5, 2019 Into A Transition Phase - March 8, 2019 Balance Of Payments Across The G10 - February 15, 2019 New Zealand Dollar Chart II-11NZD Technicals 1
NZD Technicals 1
NZD Technicals 1
Chart II-12NZD Technicals 2
NZD Technicals 2
NZD Technicals 2
There was little data out of New Zealand this week: The food price index came in at 0.5% month-on-month in March, shy of the estimate of 1.3%. NZD/USD plunged after rising by 0.5% initially this week, returning flat. Incoming data in New Zealand is likely to lag its commodity currency counterparts pushing the kiwi relatively lower. Our long AUD/NZD position is now 0.7% in the money since entry last Friday. Report Links: Not Out Of The Woods Yet - April 5, 2019 Balance Of Payments Across The G10 - February 15, 2019 A Simple Attractiveness Ranking For Currencies - February 8, 2019 Canadian Dollar Chart II-13CAD Technicals 1
CAD Technicals 1
CAD Technicals 1
Chart II-14CAD Technicals 2
CAD Technicals 2
CAD Technicals 2
Recent data in Canada have been negative: On the labor market front, the participation rate in March fell slightly to 65.7%; 7,200 jobs were lost, underperforming the estimated creation of 1,000 jobs; unemployment rate was unchanged at 5.8%. On the housing market front, starts in March increased by 192.5K year-on-year, underperforming the expected 196.5K; building permits dropped by 5.7% month-on-month in February. USD/CAD rebounded quickly after falling by 0.7% earlier this week, offsetting the loss. While the dovish shift by the BoC and looser fiscal policy, together with rising oil prices are likely to be growth tailwinds, the data disappointment coming from the housing market and overall economy limit upside in the CAD. Report Links: A Shifting Landscape For Petrocurrencies - March 22, 2019 Into A Transition Phase - March 8, 2019 Balance Of Payments Across The G10 - February 15, 2019 Swiss Franc Chart II-15CHF Technicals 1
CHF Technicals 1
CHF Technicals 1
Chart II-16CHF Technicals 2
CHF Technicals 2
CHF Technicals 2
There was scant data in Switzerland this week: The foreign currency reserves came in at 756B CHF in March. Unemployment rate in March was unchanged at 2.4%, in line with expectations. USD/CHF appreciated by 0.44% this week. With the euro area economy slowly recovering, the franc is likely to underperform as risk appetite rises. We are long EUR/CHF for a 0.1% profit. Report Links: Balance Of Payments Across The G10 - February 15, 2019 A Simple Attractiveness Ranking For Currencies - February 8, 2019 Waiting For A Real Deal - December 7, 2018 Norwegian Krone Chart II-17NOK Technicals 1
NOK Technicals 1
NOK Technicals 1
Chart II-18NOK Technicals 2
NOK Technicals 2
NOK Technicals 2
Recent data in Norway have been strong, with inflation grinding higher: Headline consumer price inflation increased to 2.9% year-on-year in March; core inflation also rose to 2.7% year-on-year, both surprising to the upside. Producer price index grew by 5.2% year-on-year in March, outperforming expectations. USD/NOK depreciated by 1.16% this week. The improving domestic economy, rising oil prices, and the tick up in inflation are all the reasons why we favor the Norwegian krone. We are playing the NOK via a few pairs, notably long NOK/SEK and short AUD/NOK, which are currently 3.11% and 0.75% in the money, respectively. Report Links: A Shifting Landscape For Petrocurrencies - March 22, 2019 Balance Of Payments Across The G10 - February 15, 2019 A Simple Attractiveness Ranking For Currencies - February 8, 2019 Swedish Krona Chart II-19SEK Technicals 1
SEK Technicals 1
SEK Technicals 1
Chart II-20SEK Technicals 2
SEK Technicals 2
SEK Technicals 2
Recent data in Sweden have been mixed: Industrial production fell to 0.7% year-on-year in February, lower than the previous reading of 3%. New manufacturing orders contracted by 2.8% year-on-year in February. However, the leading manufacturing new orders to inventory ratio is rising suggesting we might be near a bottom. Consumer price inflation came in higher at 1.9% year-on-year in March. USD/SEK fell by 0.21% this week. We remain bullish on the Swedish krona due to its cheap valuation and the imminent pickup in the euro area economy. Report Links: Balance Of Payments Across The G10 - February 15, 2019 A Simple Attractiveness Ranking For Currencies - February 8, 2019 Global Liquidity Trends Support The Dollar, But... - January 25, 2019 Trades & Forecasts Forecast Summary Core Portfolio Tactical Trades Closed Trades
Highlights OPEC 2.0 will meet in June to decide whether to continue its production cuts into 2H19. Once again, the leaders are sending conflicting signals – KSA is subtly indicating OPEC 2.0’s 1.2mm b/d of production cuts will need to be extended to year-end. Russia, not so much. Much will depend on whether the U.S. extends waivers on Iran oil-export sanctions when they expire May 2. Not surprisingly, Trump administration officials also are not providing much in the way of forward guidance to markets, other than to insist they want Iran’s exports at zero. Our modeling indicates OPEC 2.0 – the producer coalition led by the Kingdom of Saudi Arabia (KSA) and Russia – will need to raise production in 2H19, as markets tighten on the back of Venezuela’s collapse, continued unplanned outages (most recently in Libya) and still-strong demand. This aligns our view somewhat with that of Russia. That said, OPEC 2.0’s leaders – and member states – all benefit from higher prices, as we show below. Some, like Russia, more so than others – e.g., KSA, hard as that is to reconcile with their respective stances on production cuts. But none benefits if EM demand is crushed by high prices. It’s a delicate balancing act, given the aggregate GDP of EM commodity-importing countries exceeds that of commodity-exporting countries (Chart of the Week).1 Chart of the WeekEM Commodity Importers Dominate Aggregate EM Oil Demand
EM Commodity Importers Dominate Aggregate EM Oil Demand
EM Commodity Importers Dominate Aggregate EM Oil Demand
We continue to expect Brent to trade at $75/bbl this year and $80/bbl next year, given our expectation for global supply and demand. KSA and Russia remain the fulcrum of the oil market, as we argued recently, and anticipating their decision-making process remains the critical task for understanding the new political economy of oil.2 Highlights Energy: Overweight. U.S. Secretary of State Mike Pompeo demanded opposing forces in Libya cease fighting this week. The country recently lifted oil production over 1mm b/d, but renewed fighting threatens this output. Base Metals: Neutral. China’s National Development & Reform Commission (NDRC) earlier this week tee’d up markets to expect higher infrastructure and transportation spending, which lifted steel and iron ore markets. Markets continue to tighten on the back of the Vale high-grade iron-ore supply losses, which could lift prices above $100/MT in the short term. Precious Metals: Neutral. Central banks continued buying gold in February, the World Gold Council reported this week. Central-bank holdings rose a net 51 tonnes in February bringing total additions to 90 tonnes in the first two months of the year. Agriculture: Underweight. The USDA lifted its estimate of global ending stocks for corn by 5.5mm tons for the 2018/19 crop year. With total use estimates unchanged at 1.13 billion tons, this raises ending stocks-to-use estimates, which will continue to exert downward pressure on prices. Feature KSA and Russia share a common feature in that both are petro states, and thus heavily dependent on crude and product exports to fund their governments and economies. Both suffered a near-death experience during the 2014-16 oil-market-share war launched by OPEC, and both have seen their GDPs slowly recover, following the successful production-cutting agreements they jointly engineered to drain excess inventories and restore balance to the market beginning in 2017 and renewed this year (Chart 2). Russia’s GDP gets more than twice the lift from higher Brent prices than KSA’s does. At first blush, it would be logical to assume KSA’s and Russia’s GDPs are driven by the same economic forces of oil supply and demand. In broad terms, they are. Both benefit from higher oil prices, given they are predominantly petro-economies, although Russia tends to benefit more as prices rise (Chart 3). In the post-GFC era, we find that a 1% increase in Brent prices lifts Russia’s GDP ~ 0.07%, while KSA’s goes up ~ 0.03%. Another way of saying this is Russia’s GDP gets more than twice the lift from higher Brent prices than KSA’s does. Chart 2KSA, Russia GDPs Recover, Following OPEC 2.0 Production Cuts
KSA, Russia GDPs Recover, Following OPEC 2.0 Production Cuts
KSA, Russia GDPs Recover, Following OPEC 2.0 Production Cuts
Chart 3Russia Benefits More From Higher Brent Prices
Russia Benefits More From Higher Brent Prices
Russia Benefits More From Higher Brent Prices
Looking a bit deeper into KSA’s and Russia’s GDPs’ sensitivities to Brent prices, we modeled income growth for both using our Brent forecast (Table 1), the futures markets’ forward curve and compare both to the World Bank’s expectation (Chart 4, bottom panel). KSA tends to benefit more from higher EM oil demand, with its GDP rising almost 1% for every 1% increase in EM oil demand. Table 1BCA Global Oil Supply - Demand Balances (MMb/d, Base Case Balances)
Sussing Out OPEC 2.0's Production Cuts, U.S. Waivers On Iran Sanctions
Sussing Out OPEC 2.0's Production Cuts, U.S. Waivers On Iran Sanctions
Given our expectation for EM GDP growth (Chart of the Week), we expect KSA’s GDP to show relatively strong growth with GDP up ~ 5.4% this year and ~ 3.5% next year, propelled partly by higher oil prices (Chart 4, top panel). KSA tends to benefit more from higher EM oil demand, with its GDP rising almost 1% for every 1% increase in EM oil demand. Russia’s GDP goes up ~ 0.25% for every 1% increase in EM oil demand. We expect Russia’s GDP to dip then recover in 4Q19, then rise 3.5% by the end of 3Q20 before tapering off toward the end of 2020. This is not surprising given the trajectory for Brent prices in our forecasts and in the futures curves, and the sensitivity of Russia’s GDP to oil prices.We found a similar impact of EM oil demand on Russia and KSA GDPs when controlling for EM FX rates instead of Brent prices (Chart 5).3 Chart 4Higher Oil Prices Will Lift KSA's And Russia's GDPs
Higher Oil Prices Will Lift KSA's And Russia's GDPs
Higher Oil Prices Will Lift KSA's And Russia's GDPs
Chart 5While KSA Benefits More From Higher EM Demand
While KSA Benefits More From Higher EM Demand
While KSA Benefits More From Higher EM Demand
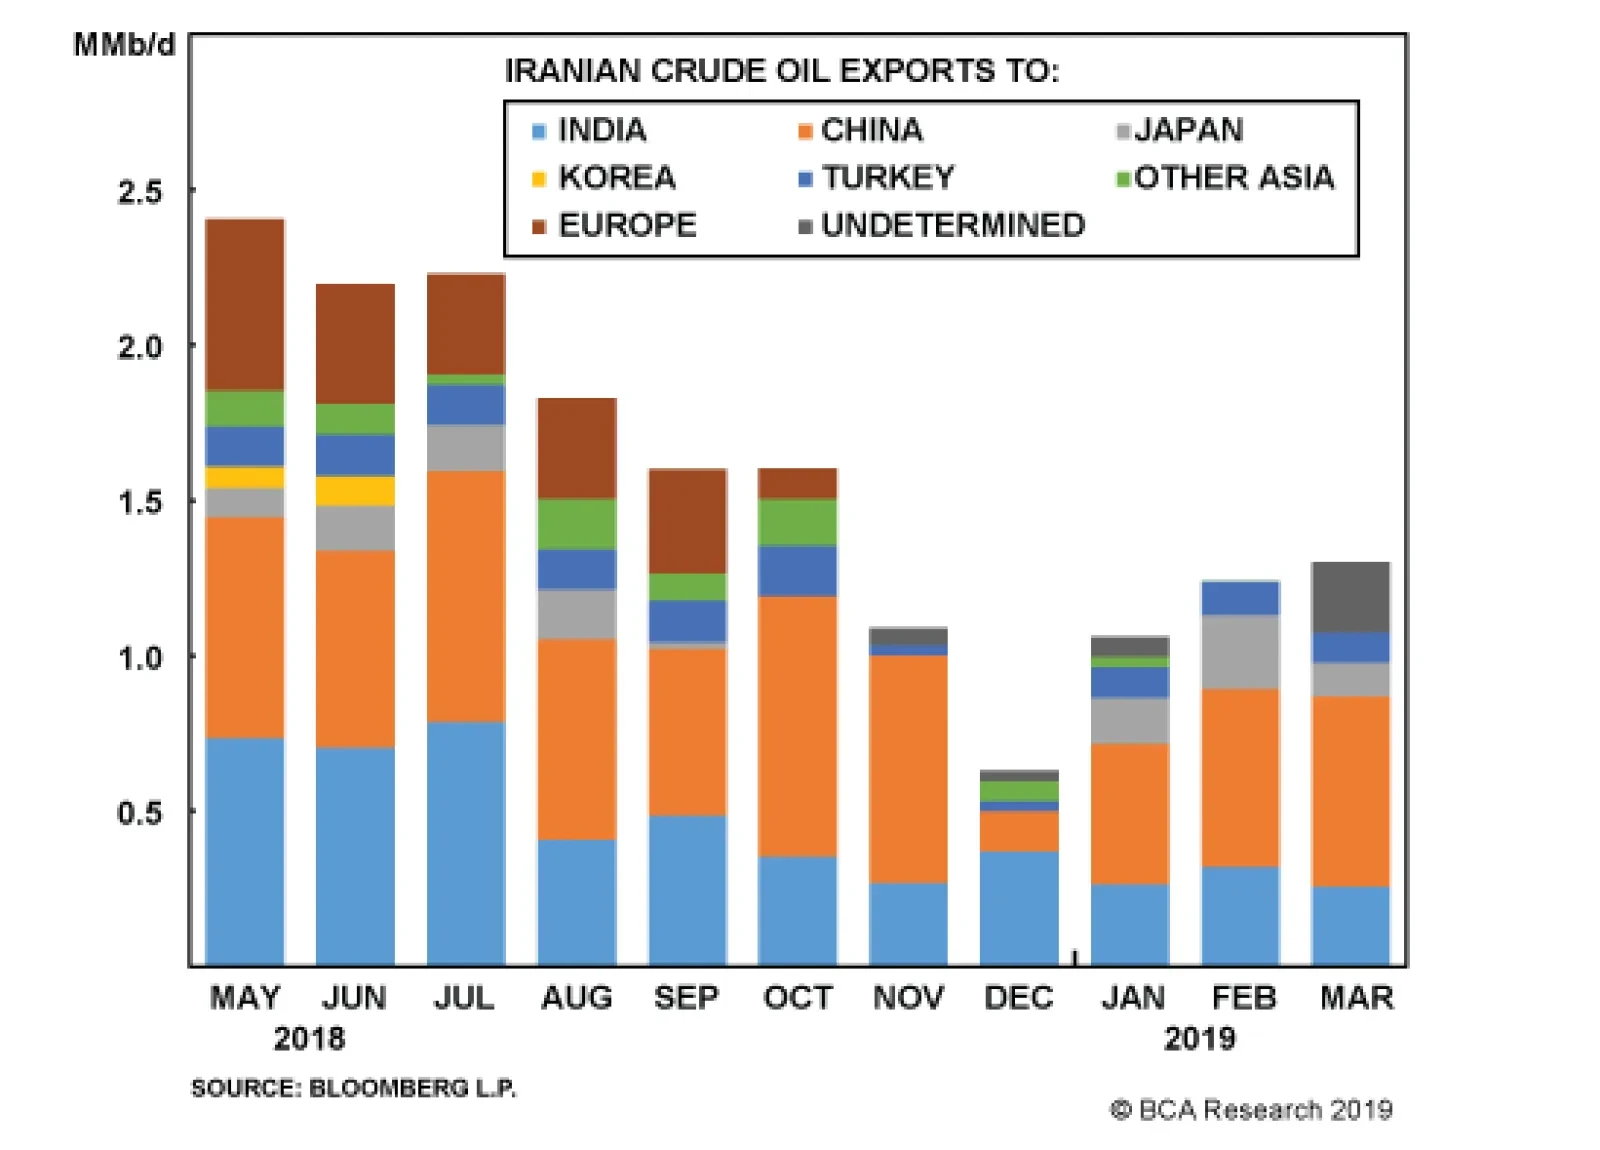
U.S. Waivers Dictate OPEC 2.0’s Decision On Production KSA has indicated it sees a need to extend OPEC 2.0’s production-cutting deal into 2H19, when the coalition’s ministers meet in June. Of late, Khalid al-Falih, KSA’s oil minister, is indicating no further cuts in the Kingdom’s output are needed, however. Russia’s a bit of a cipher. President Vladimir Putin this week stated Russia will continue to cooperate with KSA vis-à-vis managing production, although his energy minister, Alexander Novak, has indicated he sees no reason for extending OPEC 2.0’s production deal. Both sides are waiting on fundamental data, and the decision of the U.S. on its waivers on Iranian oil-export sanctions. There’s also the ever-likely collapse of Venezuela to consider, and renewed violence in Libya, both of which argue against letting the waivers expire. The Trump administration has no incentive to risk inducing an oil shock on the global economy. The countries granted waivers on U.S. sanctions against Iranian crude oil imports appear to be exercising their option to lift additional barrels, based on data showing loadings out of Iran increased for the fourth consecutive month (Chart 6 and Table 2).4 Loadings out of Iran rose to 1.30mm b/d in March, from 1.24mm b/d in February.
Chart 6
Table 2Iran Exports By Country 2018-2019 (‘000 b/d)
Sussing Out OPEC 2.0's Production Cuts, U.S. Waivers On Iran Sanctions
Sussing Out OPEC 2.0's Production Cuts, U.S. Waivers On Iran Sanctions
Bottom Line: We continue to expect U.S. waivers on Iranian oil sanctions will be extended to year end in some form. The collapse of Venezuela and renewed violence in Libya show how tenuously balanced oil markets are at present. Going into a general election in the U.S. next year, the Trump administration has no incentive to risk inducing an oil shock on the global economy. When they meet in June, ministers from OPEC 2.0 member states will be ideally set up to respond to the Trump administration’s decision on waivers for Iranian oil imports, which expire May 2. We are closing our June 2019 $70 vs. $75/bbl call spread, as the position is close to expiry. Robert P. Ryan, Chief Commodity & Energy Strategist rryan@bcaresearch.com Footnotes 1 In the post-GFC world, we find total EM oil demand rises ~ 0.4% for each 1% rise in EM commodity-importers’ GDP, while it only rises ~ 0.3% for each 1% rise in EM commodity exporters’ GDP, based on our modeling. According to World Banks’ constant 2010 USD series, EM commodity importers’ GDP represented 66% of total EM GDP in 2018, up from 56% in 2010. The EM income elasticity of oil demand has remained at roughly ~ 0.60 from 2000 to now, meaning a 1% increase in EM GDP – hence EM income – lifts oil demand by ~ 0.6%. This has been remarkably stable pre-GFC, post-GFC and from 2000 to now. 2 The new political economy of oil is a continuing theme in our research. For an extended discussion of this theme, please see “The New Political Economy of Oil,” and “OPEC 2.0: Oil’ Price Fulcrum,” published by BCA Research’s Commodity & Energy Strategy on February 21 and March 21, 2019. Both are available at ces.bcaresearch.com. 3 When using EM FX rates instead of Brent prices as an explanatory variable, we find KSA’s GDP still increases a little more than 1% for every 1% increase in EM oil demand, but Russia’s rises closer to 0.6%. NB: All GDP measures use historical World Bank data, and BCA Research estimates using the Bank’s projections in constant 2010 USD. We proxy EM oil demand using non-OECD oil consumption. KSA’s production is crude oil only, while Russia’s production is crude and liquids. 4 For a discussion of the waivers’ optionality, please see our BCA Research’s Commodity & Energy Strategy Weekly Report “OPEC 2.0: Oil’ Price Fulcrum,” published on March 21, 2019, available at ces.bcaresearch.com. Investment Views and Themes Recommendations Strategic Recommendations Tactical Trades Trade Recommendation Performance In 2019 Q1
Image
Commodity Prices and Plays Reference Table Trades Closed in 2019 Summary of Closed Trades
Image
This should temper enthusiasm regarding the long-term durability of the trade truce, highlighting that China’s credit data is the more important factor for the 12-month horizon, though the trade issue is an impediment that needs to be removed for a…
Our China Investment Strategy has highlighted that the BCA Activity Indicator has now fully registered the negative impact of trade tariffs as well as the broader slowdown. President Xi Jinping is not truly a modern-day Chairman Mao Zedong. While he has…