Emerging Markets
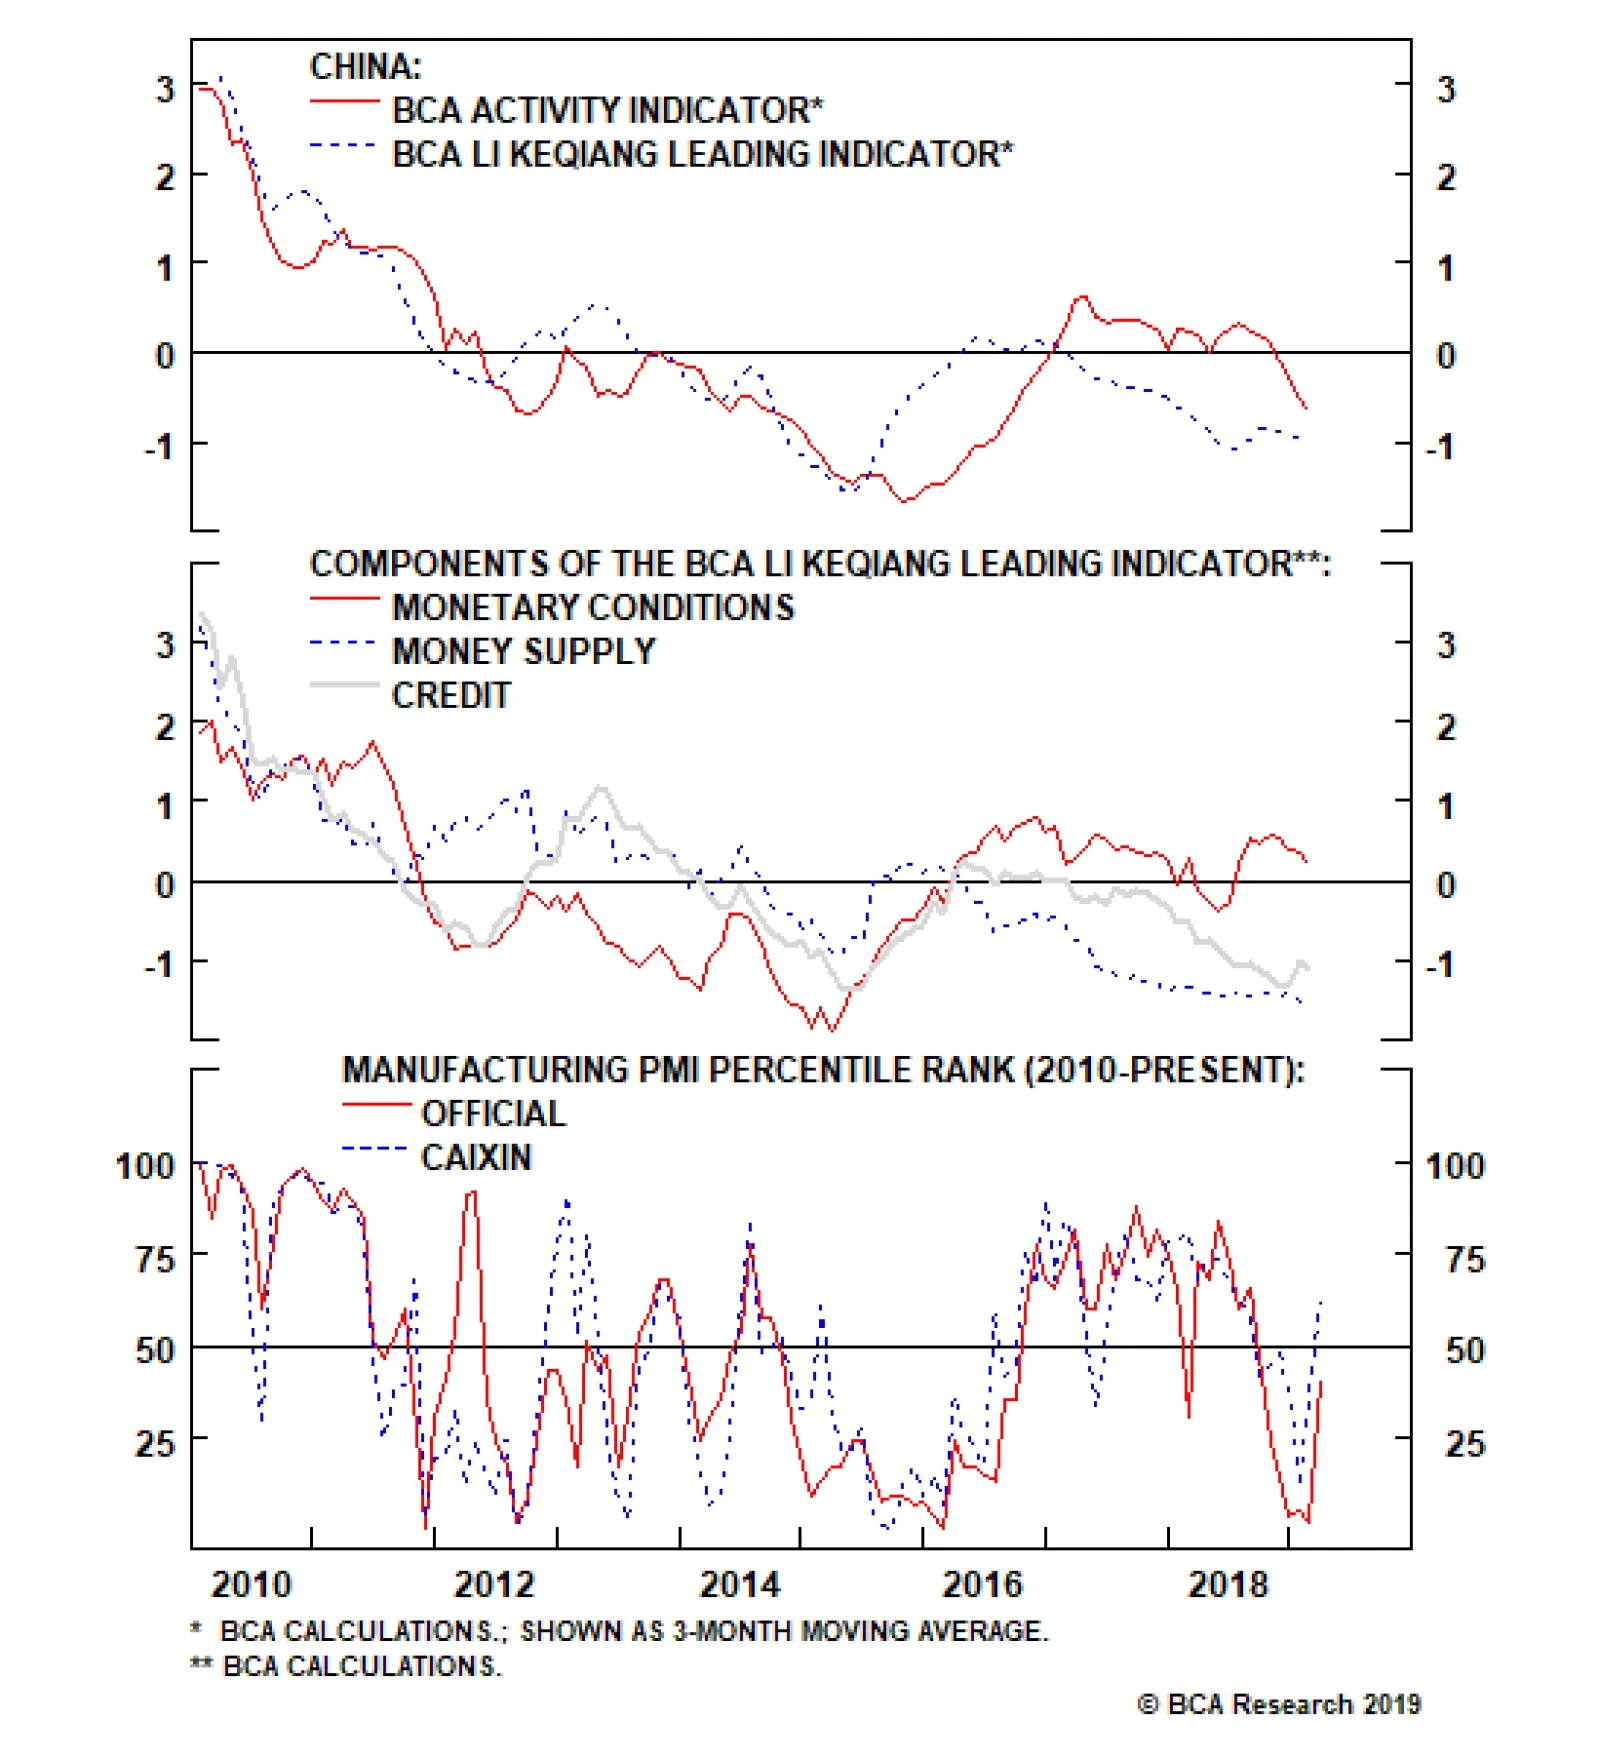
The first panel of the chart above shows that coincident economic activity sharply converged in January and February with our China Investment Strategy team’s leading indicator for China’s economy, as we had argued many times over the past several months was…
Stocks are overvalued, overexposed to the financial sector, and vulnerable if global growth does not stabilize. The most important trend since the near collapse of Indonesia in the late 1990s has been the stabilization of the secular democratic political…
While losing the local elections will not upset the balance in parliament, it is a rebuke to Erdogan over his economic policy and a warning to the AKP for the future. Erdogan does not face general elections until 2023. But judging by his response to the first…
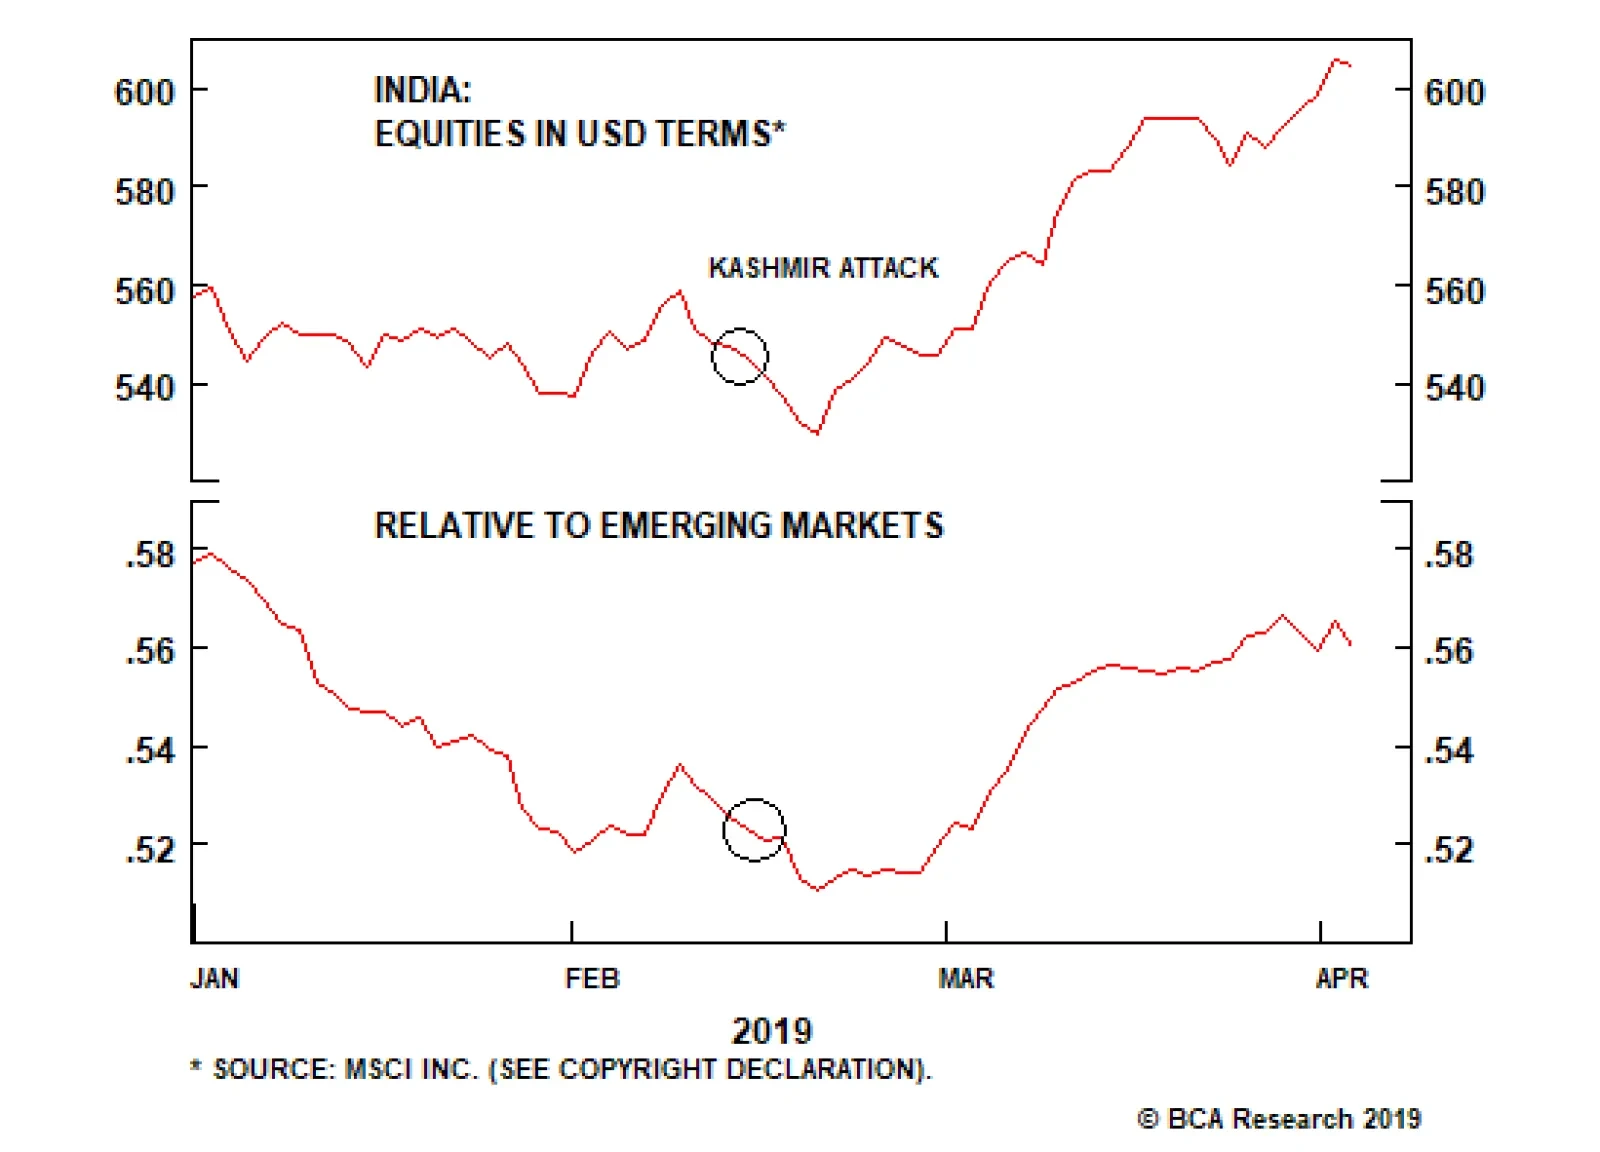
The attack was theatrical but the subsequent rally-around-the-flag effect gave Modi and his Bharatiya Janata Party (BJP) a badly needed popular boost. The market rallied on the back of Modi’s higher chances of reelection. Additional clashes with Pakistan…

Highlights So what? EM elections bring opportunities as well as risks. Why? Emerging market equities will benefit as long as China’s stimulus does not fizzle. Modi is on track to win India’s election – which is a positive – though risks lie to the downside. Thailand’s next cycle of political instability is beginning, but we are still cyclically overweight. Indonesia will defy the global “strongman” narrative – go overweight tactically. Populism remains a headwind to Philippine and Turkish assets. Wait for Europe to stabilize before pursuing Turkish plays. Feature Chart 1Risks of China's Stimulus Have Shifted To The Upside
Risks of China's Stimulus Have Shifted To The Upside
Risks of China's Stimulus Have Shifted To The Upside
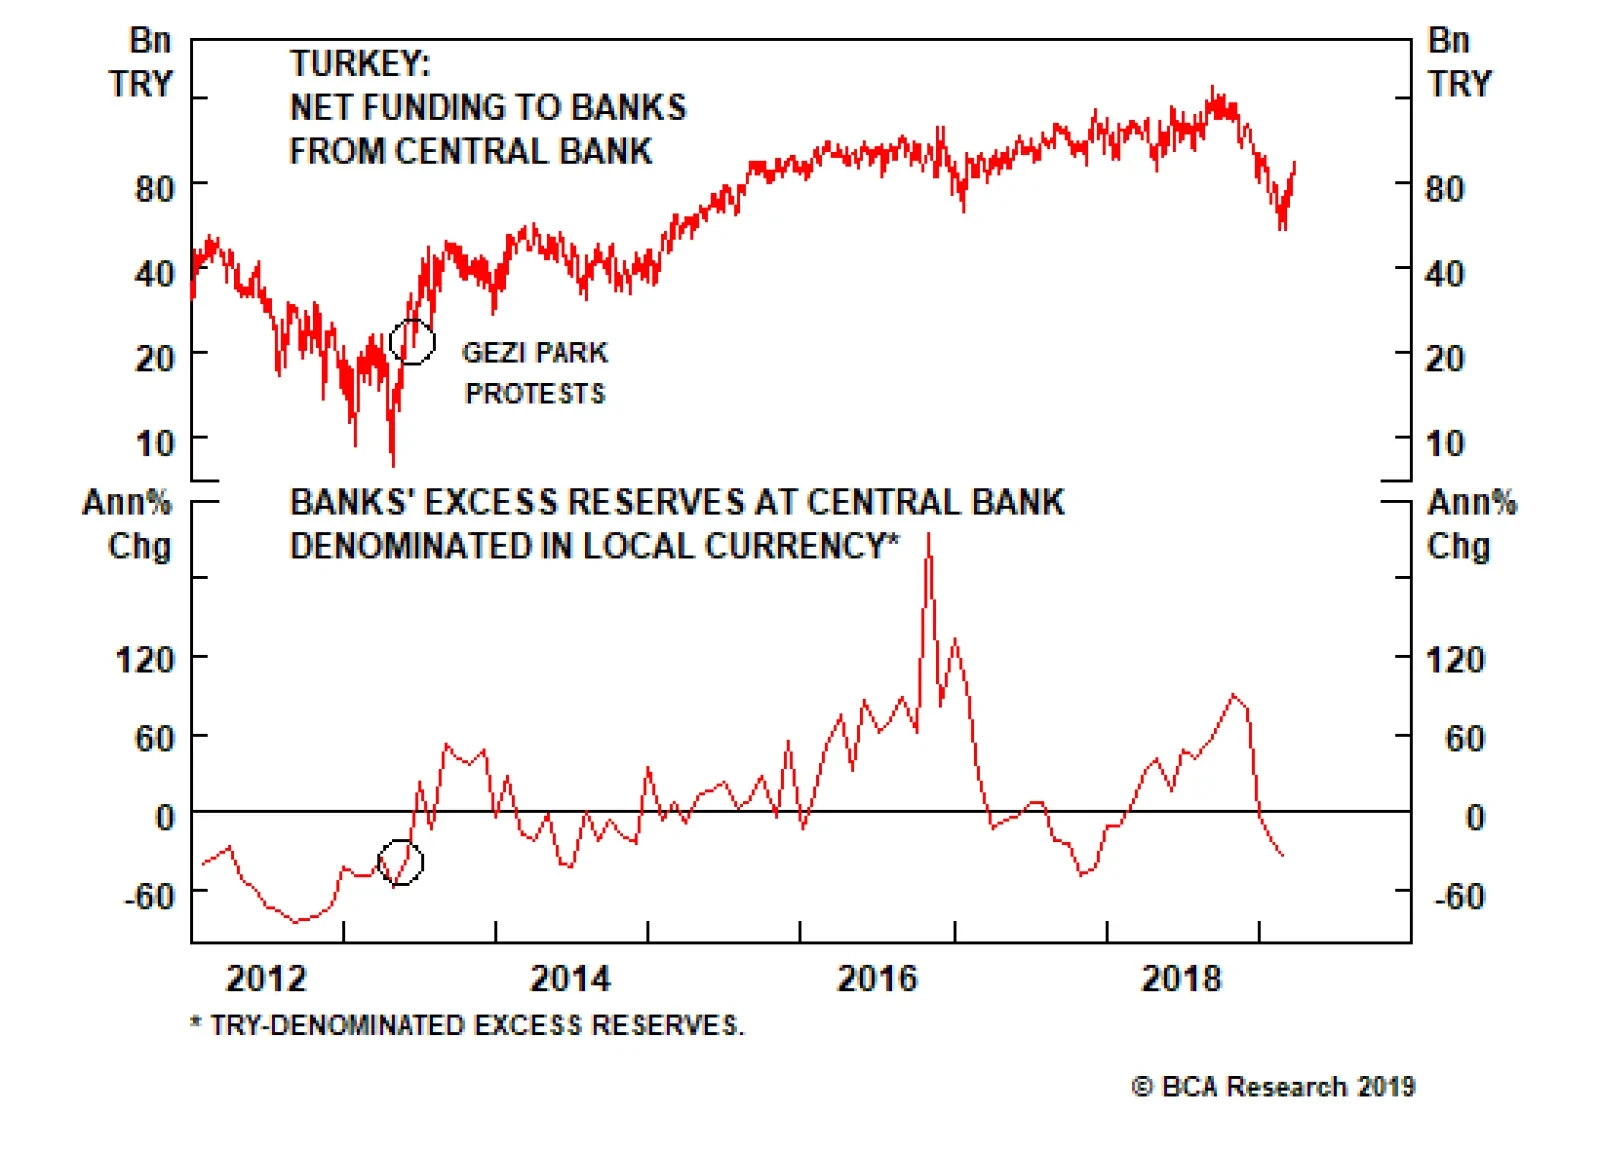
China’s official PMIs in March came at just the right time for jittery emerging market investors awaiting the all-important March credit data. EM equities, unlike the most China-sensitive plays, have fallen back since late January, after outperforming their DM peers since October (Chart 1). This occurred amid a stream of negative economic data and policy uncertainties: China’s mixed signals, prolonged U.S.-China trade negotiations, the Fed’s extended “pause” in rate hikes, the inversion of the yield curve, Brexit, and general European gloom. We have been constructive on EM plays since February 20, when we determined that the risks of China’s stimulus had shifted to the upside. However, several of the EM bourses that are best correlated with Chinese stimulus are already richly valued (the Philippines, Indonesia, Malaysia, etc). The good news is that a series of elections this spring provide a glimpse into the internal politics of several of these countries, which will help determine which ones will outperform if we are correct that global growth will find its footing by Q3. First, A Word On Turkey … More Monetary Expansion On The Way Local elections in Turkey on March 31 have dealt a black eye to President Recep Tayyip Erdogan. His ruling Justice and Development Party (AKP) has lost control of the capital Ankara for the first time since 2004. Erdogan has also (arguably) conceded the mayoralty of Istanbul, the economic center of the country, where he first rose to power in 1994. Other cities also fell to the opposition. Vote-counting is over and the aftermath will involve a flurry of accusations, investigations, and possibly unrest. Erdogan’s inability to win elections with more than a slim majority is a continual source of insecurity for him and his administration. This weekend’s local elections reinforce the point. The AKP alone failed to cross 45% in terms of popular votes. Combined with its traditional ally – the Nationalist Movement Party (MHP) – it received 51.6% of the total vote (in the 2015 elections, the two parties combined for over 60% of the vote). While losing the local elections will not upset the balance in parliament, it is a rebuke to Erdogan over his economic policy and a warning to the AKP for the future. Erdogan does not face general elections until 2023. But judging by his response to the first serious challenge to his rule – the Gezi Park protests of May 2013 – his reaction will be to double down on unorthodox, populist economic policy. Chart 2Erdogan Will Respond With Populist Politics
Erdogan Will Respond With Populist Politics
Erdogan Will Respond With Populist Politics
Back in 2013, the government responded to the domestic challenge through expansive monetary policy. The central bank gave extraordinary liquidity provisions to the banking system. Chart 2 clearly shows that the liquidity injections began with the Gezi protests. These provisions only paused in 2016-17, when global growth rebounded on the back of Chinese stimulus and EM asset prices rose, supporting Turkey’s currency and enabling the central bank to hold off. Today, the severe contraction in GDP (by 3% in Q4 2018), with a negative global backdrop, will likely end Erdogan’s patience with tight monetary policy.1 To illustrate how tight policy has been, note that bank loan growth denominated in lira is contracting at a rate of 17% in real terms. Given the authorities’ populist track record, rising unemployment will likely lead to further “backdoor” liquidity easing. A new bout of unorthodox monetary policy will be negative for domestic bank equities, local-currency bonds, and the lira. As one of the first EM currencies and bourses to begin outperforming in September 2018, Turkey has been at the forefront of the EM mini-rally over the past six months. But with global growth still tepid, this mini-cycle is likely to come to an end for the time being. Watch for the bottoming in Chinese followed by European growth before seeking new opportunities in Turkish assets. Erdogan’s domestic troubles could also prompt him to renew his foreign combativeness, which raises tail risks to Turkish risk assets, such as through U.S. punitive measures. Last year, Erdogan responded to the economic downswing by toning down his belligerent rhetoric and mending fences with Europe and the U.S. However, a reversion to populism may require him to seek a convenient distraction. The U.S. is withdrawing from Syria and the Middle East, leaving Turkey in a position where it needs other relationships to pursue its interests. Russia is a key example. Currently Erdogan is bickering with the U.S. over the planned purchase of a missile defense system from Russia. But the consequence is that relations with the U.S. could deteriorate further, potentially leading to new sanctions. Bottom Line: Turkey is still in the grip of populist politics and will respond to the recession and domestic discontent with easier monetary policy which would bode ill for the lira and lira-denominated assets. The stabilization of the European economy is necessary before investors attempt to take advantage of the de-rating of Turkish assets. India: Focus On Modi’s Political Capital We have long maintained that Modi is likely to stay in power after India’s general election on April 11-May 19. His coalition has recovered in public opinion polling since the Valentine’s Day attack on Indian security forces in Indian Kashmir (Chart 3). The government responded to the attacks by ordering airstrikes on February 26 against Pakistani targets in Pakistani territory for the first time since 1974. The attack was theatrical but the subsequent rally-around-the-flag effect gave Modi and his Bharatiya Janata Party (BJP) a badly needed popular boost. The market rallied on the back of Modi’s higher chances of reelection. Modi is the more business-friendly candidate, as opposed to his chief rival, Rahul Gandhi of the Indian Congress Party. Nevertheless, election risks still lie to the downside: Modi and his party are hardly likely to outperform their current 58% share of seats in the lower house of parliament, since the conditions for a wave election – similar to the one that delivered the BJP a single-party majority in 2014 – do not exist today. While the range of outcomes is extremely broad (Chart 4), the current seat projections shown in Chart 3 put Modi’s coalition right on the majority line. Meanwhile his power is already waning in the state legislatures.
Chart 3
Chart 4
Thus Modi’s reform agenda has lost momentum, at least until he can form a new coalition. This will take time and markets may ultimately be disappointed by the insufficiency of the tools at his disposal in his second term. Indian equities are the most expensive in the EM space, and only more so after the sharp rally in March on the back of the Kashmir clash and Modi’s recovering reelection chances (Chart 5). Additional clashes with Pakistan are not unlikely during the election season, despite the current appearance of calm. This is because Modi’s patriotic dividend in the polls could fade. Since even voters who lack confidence in Modi as a leader believe that Pakistan is a serious threat (Chart 6), he could be encouraged to stir up tensions yet again. This would be playing with fire but he may be tempted to do it if his polling relapses or if Pakistan takes additional actions. Chart 5...And Lofty Valuations
...And Lofty Valuations
...And Lofty Valuations
Chart 6
Further escalation would be positive for markets only so long as it boosts Modi’s chances of reelection without triggering a wider conflict. Yet the standoff revealed that these two powers continue to run high risks of miscalculation: their signaling is not crystal clear; deterrence could fail. Thus, further escalation could become harder to control and could spook the financial markets.2 Even if Modi eschews any further jingoism, his lead is tenuous. First, the economic slowdown is taking a toll – even the official unemployment rate is rising (Chart 7) and the government has been caught manipulating statistics. There is no time for the economy to recover enough to change voters’ minds. Opinion polls show that even BJP voters are not very happy about the past five years. They care more about jobs and inflation than they do about terrorism, and a majority thinks these factors have deteriorated over Modi’s five-year term (Chart 8). Chart 7Manipulated Stats Can't Hide Deteriorating Economy
Manipulated Stats Can't Hide Deteriorating Economy
Manipulated Stats Can't Hide Deteriorating Economy
Chart 8
If the polling does not change, Modi will win with a weak mandate at best. A minority government or a hung parliament is possible. A Congress Party-led coalition, which would be a market-negative event, cannot be ruled out. The latter especially would prompt a big selloff, but anything short of a single-party majority for Modi will register as a disappointment. Bottom Line: There may be a relief rally after Modi is seen to survive as prime minister, but his likely weak political capital in parliament will be disappointing for markets. The market will want additional, ambitious structural reforms on top of what Modi has already done, but he will struggle to deliver in the near term. While we are structurally bullish, in the context of this election cycle – which includes rising oil prices that hinder Indian equity outperformance – we urge readers to remain underweight Indian equities within emerging markets. Thailand: An Outperformer Despite Quasi-Military Rule
Chart
A new cycle of political instability is beginning in Thailand as the country transitions back into civilian rule after five years under a military junta. However, this is not an immediate problem for investors, who should remain overweight Thai equities relative to other EMs on a cyclical time horizon. The source of Thai instability is inequality – both regional and economic. Regionally, 49% of the population resides in the north, northeast, and center, deprived of full representation by the royalist political and military establishment seated in Bangkok (Map 1). Economically, household wealth is extremely unevenly distributed. Thailand’s mean-to-median wealth ratio is among the highest in the world (Chart 9). Eventually these factors will drive the regional populist movement – embodied by exiled Prime Minister Thaksin Shinawatra and his family and allies – to reassert itself against the elites (the military, the palace, and the civil bureaucracy). New demands will be made for greater representation and a fairer distribution of wealth. The result will be mass street protests and disruptions of business sentiment and activity that will grab headlines sometime in the coming years, as occurred most recently in 2008-10 and 2013-14.
Chart 9
Chart 10Social Spending Did Not Hinder Populism
Social Spending Did Not Hinder Populism
Social Spending Did Not Hinder Populism
The seeds of the next rebellion are apparent in the results of the election on March 24. The junta has sought to undercut the populists by increasing infrastructure spending and social welfare (Chart 10), and controlling rice prices for farmers. Yet the populists have still managed to garner enough seats in the lower house to frustrate the junta’s plans for a seamless transition to “guided” civilian rule. The final vote count is not due until May 9 but unofficial estimates suggest that the opposition parties have won a majority or very nearly a majority in the lower house. This is despite the fact that the junta rewrote the constitution, redesigned the electoral system to be proportional (thus watering down the biggest opposition parties), and hand-picked the 250-seat senate. Such results point to the irrepressible population dynamics of the “Red Shirt” opposition in Thailand, which has won every free election since 2001. Nevertheless, the military and its allies (the “Yellow Shirt” political establishment) are too powerful at present for the opposition to challenge them directly. The junta has several tools to shape the election results to its liking in the short run.3 It would not have gone ahead with the election were this not the case. As a result, the cycle of instability is only likely to pick up over time. Investors should note the silver lining to the period of military rule: it put a halt to the spiral of polarization at a critical time for the country. The unspoken origin of the political crisis was the royal succession. The traditional elites could not tolerate the rise of a populist movement that flirted with revolutionary ideas at the same time that the revered King Bhumibol Adulyadej drew near to passing away. This combination threatened both a succession crisis and possibly the survival of the traditional political system, a constitutional monarchy backed by a powerful army. With the 2014 coup and five-year period of military rule (lengthy even by Thai standards), the military drew a stark red line: there is no alternative to the constitutional monarchy. The royalist faction had its bottom line preserved, at the cost of an erosion of governance and democracy. The result is that going forward, there is a degree of policy certainty. Chart 11Thai Confidence Has Bottomed
Thai Confidence Has Bottomed
Thai Confidence Has Bottomed
Chart 12Strong Demand Sans Risk Of Being Overleveraged
Strong Demand Sans Risk Of Being Overleveraged
Strong Demand Sans Risk Of Being Overleveraged
The long-term trend of Thai consumer confidence tells the story (Chart 11). Optimism surged with the election of populist Thaksin in the wake of the Asian Financial Crisis in 2001. The long national conflict that ensued – in which the elites and generals exiled Thaksin and ousted his successors, and the country dealt with a global financial crisis and natural disasters – saw consumer confidence decline. However, the coup of 2014 and the royal succession (to be completed May 4-6 with the new king’s coronation) has reversed this trend, with confidence trending upward since then. Revolution is foreclosed yet the population is looking up. Military rule is generally disinflationary in Thailand and this time around it initiated a phase of private sector deleveraging. Yet the economy has held up reasonably well. Private consumption has improved along with confidence and investment has followed, albeit sluggishly (Chart 12). The advantage is that Thailand has had slow-burn growth and has avoided becoming overleveraged again, like many EM peers. Chart 13Thailand Outperformed EM Despite Military Interference
Thailand Outperformed EM Despite Military Interference
Thailand Outperformed EM Despite Military Interference
Furthermore, Thailand is not vulnerable to external shocks. It has a 7% current account surplus and ample foreign exchange reserves. It is not too exposed to China, either economically or geopolitically: China makes up only 12% of exports, while Bangkok has no maritime-territorial disputes with Beijing in the South China Sea. In fact, Thailand maintains good diplomatic relations with China and yet has a mutual defense treaty with the United States (the oldest such treaty in Asia). It is perhaps the most secure of any of the Southeast Asian states from the point of view of the secular U.S.-China conflict. Finally, if our forecast proves wrong and political instability returns sooner than we expect, it is important to remember that Thailand’s domestic political conflicts rarely affect equity prices in a lasting way. Global financial crises and natural disasters have had a greater impact on Thai assets over the past two decades than the long succession crisis. Thailand has outperformed both EM and EM Asia during the period of military interference, though democratic Indonesia has done better (Chart 13). Bottom Line: Thailand’s political risks are domestic and stem from regional and economic inequality, which will result in a revived opposition movement that will clash with the traditional military and political elite. This clash will eventually create policy uncertainty and political risk. But it will need to build up over time, since the military junta has strict control over the current environment. Meanwhile macro fundamentals are positive. Indonesia: Rejecting Strongman Populism We do not expect any major surprises from the Indonesian election. Instead, we expect policy continuity, a marginal positive for the country’s equities. However, stocks are overvalued, overexposed to the financial sector,4 and vulnerable if global growth does not stabilize.
Chart 14
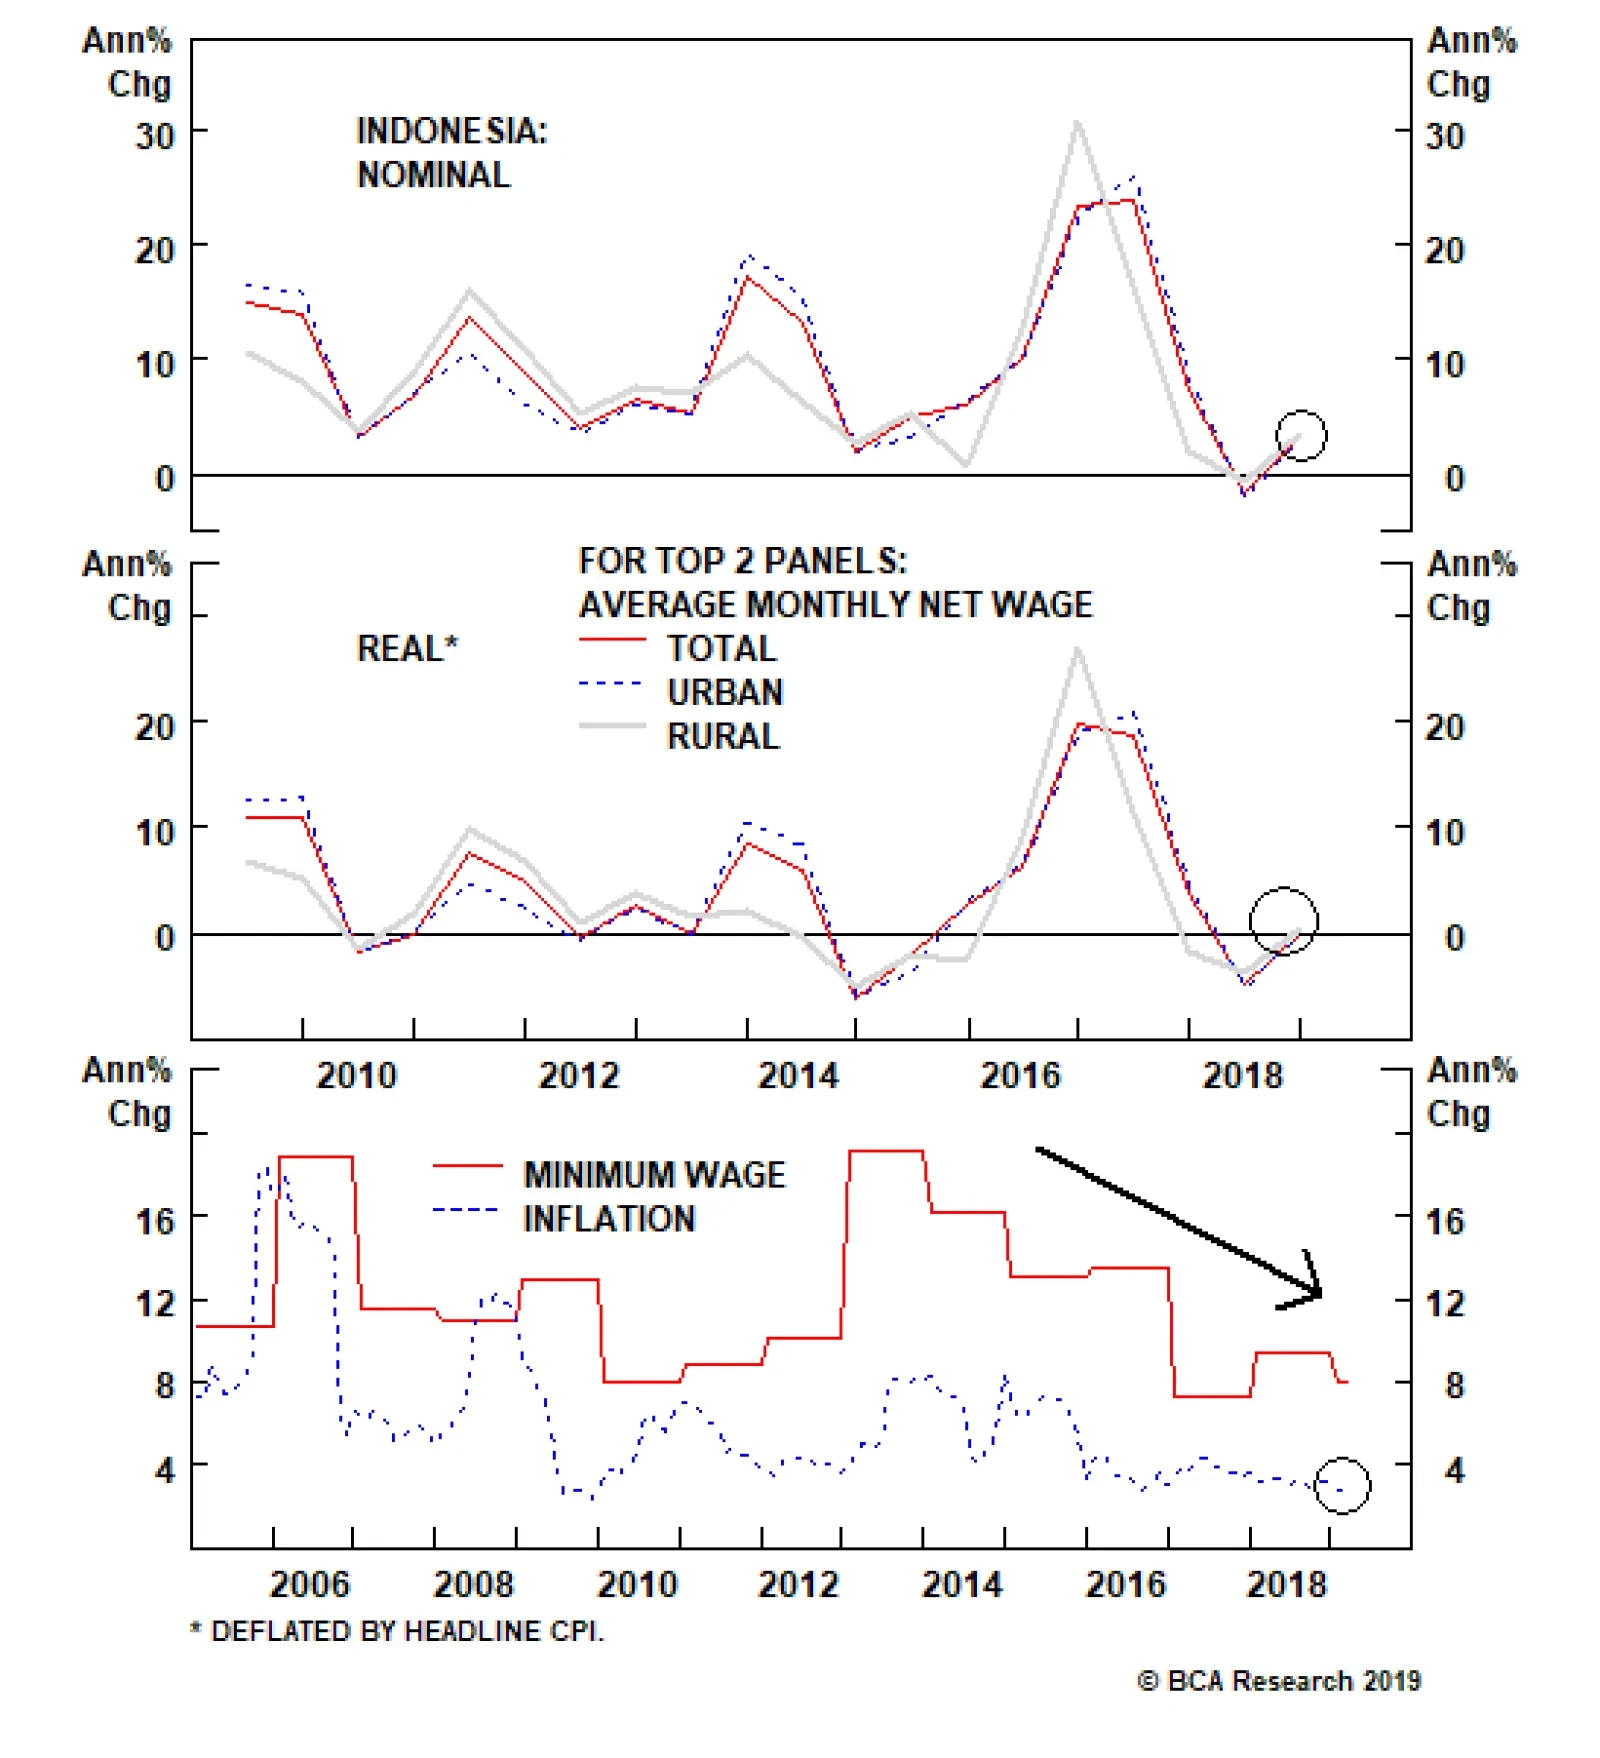
The most important trend since the near collapse of Indonesia in the late 1990s has been the stabilization of the secular democratic political system and peaceful transition of power. That trend looks to continue with President Joko Widodo’s likely victory in the election on April 17. President Jokowi defeated former general Prabowo Subianto in the 2014 election and has maintained a double-digit lead over his rival in the intervening years (Chart 14). Prabowo is a nationalist and would-be strongman leader who was accused of human rights violations during the fall of his father-in-law Suharto’s dictatorship in 1998. Emerging market polls are not always reliable but a lead of this size for this long suggests that the public knows Prabowo and does not prefer him to Jokowi. In fact he never polled above 35% support while Jokowi has generally polled above 45%. The incumbent advantage favors Jokowi. Household consumption is perking up slightly and consumer confidence is high (see Chart 11 above). Wages have received a big boost during Jokowi’s term and are now picking up again, in real as well as nominal terms and for rural as well as urban workers. Jokowi’s minimum wage law has not resulted in extravagant windfalls to labor, as was feared, and inflation remains under control (Chart 15). Government spending has been ramped up ahead of the vote (and yet Jokowi is not profligate). All of these factors support the incumbent. Real GDP growth is sluggish but has trended slightly upward for most of Jokowi’s term. Chart 15Favorable Economic Conditions Support Incumbent Jokowi
Favorable Economic Conditions Support Incumbent Jokowi
Favorable Economic Conditions Support Incumbent Jokowi
Chart 16
Jokowi has been building badly needed infrastructure with success and has been attracting FDI to try to improve productivity (Chart 16). This is the most positive feature of his government and is set to continue if he wins. A coalition in parliament has largely supported him after an initial period of drift. The biggest challenge for Jokowi and Indonesia are lackluster macro fundamentals. For instance, twin deficits, which show a lack of savings and invite pressure on the currency, which has been very weak. The twin deficits have worsened since 2012 because China’s economic maturation has forced a painful transition on Indonesia, which it has not yet recovered from.
Chart 17
There is some risk to governance as Jokowi has chosen Ma’ruf Amin, the top cleric of the world’s largest Muslim organization, as his running mate. Jokowi wants to counteract criticisms that he is not Islamic enough (or is a hidden Christian), which cost his ally the governorship of Jakarta in 2017. However, Jokowi is not a strongman leader like Erdogan in Turkey, whose combination of Islamism and populism has been disastrous for the country’s economy. As mentioned, Jokowi will be defeating the would-be strongman Prabowo, who has also allied with Islamism. In fact, Indonesia is a relatively secular and modern Muslim-majority country and Amin is the definition of an establishment religious leader. The security forces have succeeded in cracking down on militancy in the past decade, greatly improving Indonesia’s stability and security as a whole (Chart 17). Governance is weak on some measures in Indonesia, but Jokowi is better than the opposition on this front and neither his own policies nor his vice presidential pick signals a shift in a Turkey-like, Islamist, populist direction. Bottom Line: We should see Indonesian equities continue to outperform EM and EM Asia as long as China’s stimulus efforts do not collapse and global growth picks up as expected in the second half of the year. Peaceful democratic transitions and economic policy continuity have been repeatedly demonstrated in Indonesia despite the inherent difficulties of developing a populous, multi-ethnic archipelago. Nationalism is a constant risk but it would be more virulent under Jokowi’s opponent. The Philippines: Embracing Strongman Populism
Chart 18
The May 13 midterm elections mark the three-year halfway point in President Rodrigo Duterte’s presidential term. Duterte is still popular, with approval ratings in the 75%-85% range. These numbers likely overstate his support, but it is clearly above 50% and superior to that of his immediate predecessors (Chart 18). Further, his daughter’s party, Faction for Change, has gained national popularity, reinforcing the signal that he can expand his power base in the vote. The senate is the root of opposition to Duterte. His supporters control nine out of 24 seats. But of the twelve senators up for election, only three are Duterte’s supporters. So he could make gains in the senate which would increase his ability to push through controversial constitutional reforms. (He needs 75% of both houses of parliament plus a majority in a national referendum to make constitutional changes.) In terms of the economy, we maintain the view that Duterte is a true “populist” – pursuing nominal GDP growth to the neglect of everything else. His fiscal policy of tax cuts and big spending have supercharged the economy but macro fundamentals have deteriorated (Chart 19). He has broken the budget deficit ceiling of 3%, up from 2.2% in 2017. His reflationary policies have turned the current account surplus into a deficit, weighing heavily on the peso, which peaked against other EM currencies when he came to power in 2016 (Chart 20). Inflation peaked last year but we expect it to remain elevated over the course of Duterte’s leadership. He has appointed a reputed dove, Benjamin Diokno, as his new central banker. Chart 19Reflationary Policies Created Twin Deficits...
Reflationary Policies Created Twin Deficits...
Reflationary Policies Created Twin Deficits...
Chart 20...And Twin Deficits Weigh On The Peso
...And Twin Deficits Weigh On The Peso
...And Twin Deficits Weigh On The Peso
Rule of law has deteriorated, as symbolized by the removal of the chief justice of the Supreme Court for questioning Duterte’s extension of martial law in Mindanao. Duterte also imprisoned his top critic in the senate, Leila de Lima, on trumped-up drug charges. He tried but failed to do so with Senator Antonio Trillanes, a former army officer and quondam coup ring-leader who has substantial support in the military. The army is pushing back against any prosecution of Trillanes, and against Duterte’s ongoing détente with China, prompting Duterte to warn of the risk of a coup. Duterte’s China policy is to attract Chinese investment while avoiding a conflict in the South China Sea. His administration has failed to downgrade relations with the U.S. thus far, but further attempts could be made. This strategy could make the Philippines a beneficiary of Chinese investment if it succeeds. However, China knows that the Philippine public is very pro-American (more so than most countries) and that Duterte could be replaced by a pro-U.S. president in as little as three years, so it is not blindly pouring money into the country. Pressure to finance the current account deficit will persist. If pro-Duterte parties gain seats in the senate the question will be whether he comes within reach of the 75% threshold required for constitutional changes. His desire to change the country into a federal system has not gained momentum so far. He claims he will stand down at the end of his single six-year term but he could conceivably attempt to use any constitutional change to stay in power longer. If the revision goes forward, it will be a hugely divisive and unproductive use of political capital. Bottom Line: The Philippine equity market is highly coordinated with China’s credit cycle and so should benefit from China’s stimulus measures this year (as well as the Fed’s backing off). Nevertheless, Philippine equities are overvalued and macro fundamentals and quality of governance have all deteriorated. Duterte’s emphasis on building infrastructure and human capital is positive, but the means are ill-matched to the ends: savings are insufficient and inflation will be a persistent problem. We would favor South Korea, Thailand, Indonesia, and Malaysia over the Philippines in the EM space. Investment Implications We expect China’s stimulus to be significant and to generate increasingly positive economic data over the course of the year. China is a key factor in the bottoming of global growth, which in turn will catalyze the conditions for a weaker dollar and outperformance of international equities relative to U.S. equities. Caveat: In the very near term, it is possible that China plays could relapse and EM stocks could fall further due to the fact that Chinese and global growth have not yet clearly bottomed. We are structurally bullish India, but recommend sitting on the sidelines until financial markets discount the disappointment of a Modi government with insufficient political capital to pursue structural reforms as ambitious as the ones undertaken in 2014-19. Go long Thai equities relative to EM on a cyclical basis. Stay long Thai local-currency government bonds relative to their Malaysian counterparts. Go long Indonesian equities relative to EM on a tactical basis. Maintain vigilance regarding Russian and Taiwanese equities: the Ukrainian election, Russia’s involvement in Venezuela, and the unprecedented Taiwanese presidential primary election reinforce our view that Russia and Taiwan are potential geopolitical “black swans” this year. Matt Gertken, Vice President Geopolitical Strategy mattg@bcaresearch.com Footnotes 1 See BCA Emerging Markets Strategy, “Turkey: Brewing Policy Reversal?” March 21, 2019, available at www.bcaresearch.com. 2 See Sanjeev Miglani and Drazen Jorgic, “India, Pakistan threatened to unleash missiles at each other: sources,” Reuters, March 16, 2019, available at uk.reuters.com. 3 The junta can disqualify candidates and rerun elections in the same district without that candidate if the candidate is found to have violated a range of very particular laws on campaigning and use of social media. Also, the Election Commission is largely an instrument of the Bangkok establishment and can allocate seats according to the junta’s interests. 4 See BCA Emerging Markets Strategy, “Indonesia: It Is Not All About The Fed,” March 7, 2019, available at www.bcaresearch.com. Geopolitical Calendar
Highlights The meaningful improvement in the March manufacturing PMIs (both Caixin and official) all but confirms that a rebound in Chinese economic activity is forthcoming. The odds that investors will look through any near-term economic and/or earnings weakness are directly related to the likely magnitude of the expansion in credit over the coming year, and our research points to the need for the recent pace of credit growth to be sustained in order to stabilize the outlook for earnings. Barring a substantial breakdown in trade talks between China and the U.S., a strong March total social financing release would likely tip the scales in favor of a recommendation to increase Chinese investable stock exposure within a global equity portfolio to overweight. Feature Tables 1 and 2 highlight key developments in China’s economy and its financial markets over the past month. On the growth front, coincident economic activity has sharply converged with our leading indicator for China’s economy, which we highlighted was likely to occur. Looking forward, while we await the March total social financing release later this month for a better sense of the likely magnitude in credit growth over the coming year, the meaningful improvement in the March manufacturing PMIs (both Caixin and official) all but confirms that a rebound in Chinese economic activity is forthcoming. Table 1China Macro Data Summary
China Macro And Market Review
China Macro And Market Review
Table 2China Financial Market Performance Summary
China Macro And Market Review
China Macro And Market Review
The likely magnitude of the uptrend in credit is important from an investment strategy perspective, as we have highlighted that weak coincident activity raises the risk of a lagged but meaningful further decline in Chinese earnings per share over the coming few months. The odds that investors will look through any near-term economic and/or earnings weakness are directly related to the ultimate size of the expansion in credit, and our research points to the need for the recent pace of credit growth to be sustained in order to stabilize the outlook for earnings. But the bottom line for investors is that we recently placed Chinese investable stocks (i.e. the MSCI China Index) on upgrade watch, and the March PMI is a step in the direction of a recommendation to increase equity allocation to overweight within a global stock portfolio. Investors should closely watch the March total social financing data (due to be released in mid-April); a strong release, barring a substantial breakdown in trade talks between China and the U.S., would likely tip the scales in favor of a move to overweight. In reference to Tables 1 and 2, we provide several detailed observations concerning developments in China’s macro and financial market data below: Chart 1 shows that coincident economic activity sharply converged in January and February with our leading indicator for China’s economy, as we had argued many times over the past several months was likely to occur. In our view, most if not all of the previously beneficial tariff front-running effect has probably washed out of the data, implying that future changes in activity measures are now more likely to reflect actual changes in underlying economic circumstances. Chart 1A Convergence That We Predicted
A Convergence That We Predicted
A Convergence That We Predicted
The components of our LKI leading indicator continue to point to divergent outcomes for the Chinese economy (Chart 2). Monetary conditions have weakened somewhat over the past few months, but remain quite easy relative to history. The credit components bounced in January but are still weak relative to their history, whereas money growth is extremely weak and has shown no sign of improvement. Barring a major rise in the RMB, a continuation in the recent pace of credit growth would likely be enough to cause our leading indicator to trend higher, particularly if money growth begins to pick up. Chart 2An Uptrend In Credit Growth Will Push Our Leading Indicator Higher
An Uptrend In Credit Growth Will Push Our Leading Indicator Higher
An Uptrend In Credit Growth Will Push Our Leading Indicator Higher
We noted in our March 13 Weekly Report that growth in residential floor space started was unsustainably strong,1 and the January/February data update confirmed this view. Growth in starts has decelerated by 10 percentage points from December to February, highlighting that housing construction cannot permanently decouple from sales volume and that a further deceleration is possible unless sales growth (which is currently negative) begins to pick up. The PMI rebound in March registers as one of the most important macro developments since the release of the January total social financing data. Both the Caixin and official manufacturing PMI data came in solidly positive for March, rising relative to their February values and surprising consensus expectations to the upside. Chart 3 highlights that the March Caixin data has pushed the series above its post-2010 median, whereas the official PMI has risen to its 40th percentile from essentially its lowest point in the past decade. In our view, the PMI rebound registers as one of the most important macro developments since the release of the January total social financing data, in that it all but confirms that a rebound in (still depressed) Chinese economic activity is forthcoming. Chart 3A Very Sharp Rebound In Both Manufacturing PMIs
A Very Sharp Rebound In Both Manufacturing PMIs
A Very Sharp Rebound In Both Manufacturing PMIs
Despite having rallied significantly from their low, Chinese stocks (both investable and domestic) remain approximately 20% below their early-2018 high in US$ terms. This is in contrast to global stocks, which are only 7% shy of their 2018 high. If Chinese equities can avoid a major earnings recession, this discrepancy underscores that there is further upside for stock prices in relative terms over the coming 6-12 months. For the A-share market, however, Chart 4 highlights a potential near-term roadblock for continued outperformance versus global stocks. The chart highlights that the relative performance trend is now bumping up against the upper end of a declining trend channel that has been in place for almost 4 years, a bearish pattern that is in stark contrast to that of the investable market. Conversely, a break outside of this channel would warrant attention, as it could signal a secular change in trend for the domestic equity market. Chart 4Is The Four Year Downtrend In A-Share Relative Performance Over?
Is The Four Year Downtrend In A-Share Relative Performance Over?
Is The Four Year Downtrend In A-Share Relative Performance Over?
Chart 5 highlights that the strange combination of consumer staples and real estate stocks have been the clear sector winners over the past month, both in the investable and domestic markets. Signs of stabilization in consumer spending explains staples outperformance, but the rally in real estate stocks is more difficult to explain given the weakness in housing fundamentals referenced above. For now, our bias is to believe that real estate stocks are benefitting as a value play, given their deep discount relative to both their respective broad markets and their global peers. Chart 5A Sharp Rebound In Staples And Real Estate Stocks
A Sharp Rebound In Staples And Real Estate Stocks
A Sharp Rebound In Staples And Real Estate Stocks
China’s 7-day interbank repo rate has increased somewhat over the past month, raising speculation that the PBOC may soon proceed with a generalized cut to the reserve requirement ratio. In our view, the trend in the 3-month interbank repo rate has been more important over the past few years, as it has closely correlated since late-2016 with average interest rates in the economy and sharp declines in the rate last year preceded the pickup in credit growth observed in January. Still, additional easing from the PBOC could be significant for market participants, as it would likely be greeted positively by investors and could further stoke the belief that Chinese credit growth may overshoot to the upside over the coming 6-12 months. A stronger RMB versus the euro will be welcome news for European exporters. In contrast to a significant improvement in domestic equity prices and investor sentiment, Chinese onshore corporate bond spreads have actually inched higher over the past month. While the rise has been comparatively small (8 basis points), spreads now stand at roughly a third of their 12-month range. A rising trend in onshore corporate bond spreads is not consistent with a slower pace of defaults over the coming 6-12 months, suggesting that at least some headwinds facing the Chinese economy will remain over the coming year if the recent trend in spreads continues. While CNY-USD has been largely flat over the past month, CNY-EUR has continued to rise and is now within striking distance of its 2018 high (Chart 6). This is not likely welcome news for Chinese exporters with close ties to Europe, but it may help provide a much-needed trade boost to the European economy over the coming year, whose manufacturing PMI has recently fallen to a six-year low. Chart 6A Stronger CNY-EUR Cross Will Help Boost Chinese Imports From Europe
A Stronger CNY-EUR Cross Will Help Boost Chinese Imports From Europe
A Stronger CNY-EUR Cross Will Help Boost Chinese Imports From Europe
Jonathan LaBerge, CFA, Vice President Special Reports jonathanl@bcaresearch.com Footnotes 1 Please see China Investment Strategy Weekly Report, “China Macro And Market Review”, dated March 13, 2019, available at cis.bcaresearch.com Cyclical Investment Stance Equity Sector Recommendations
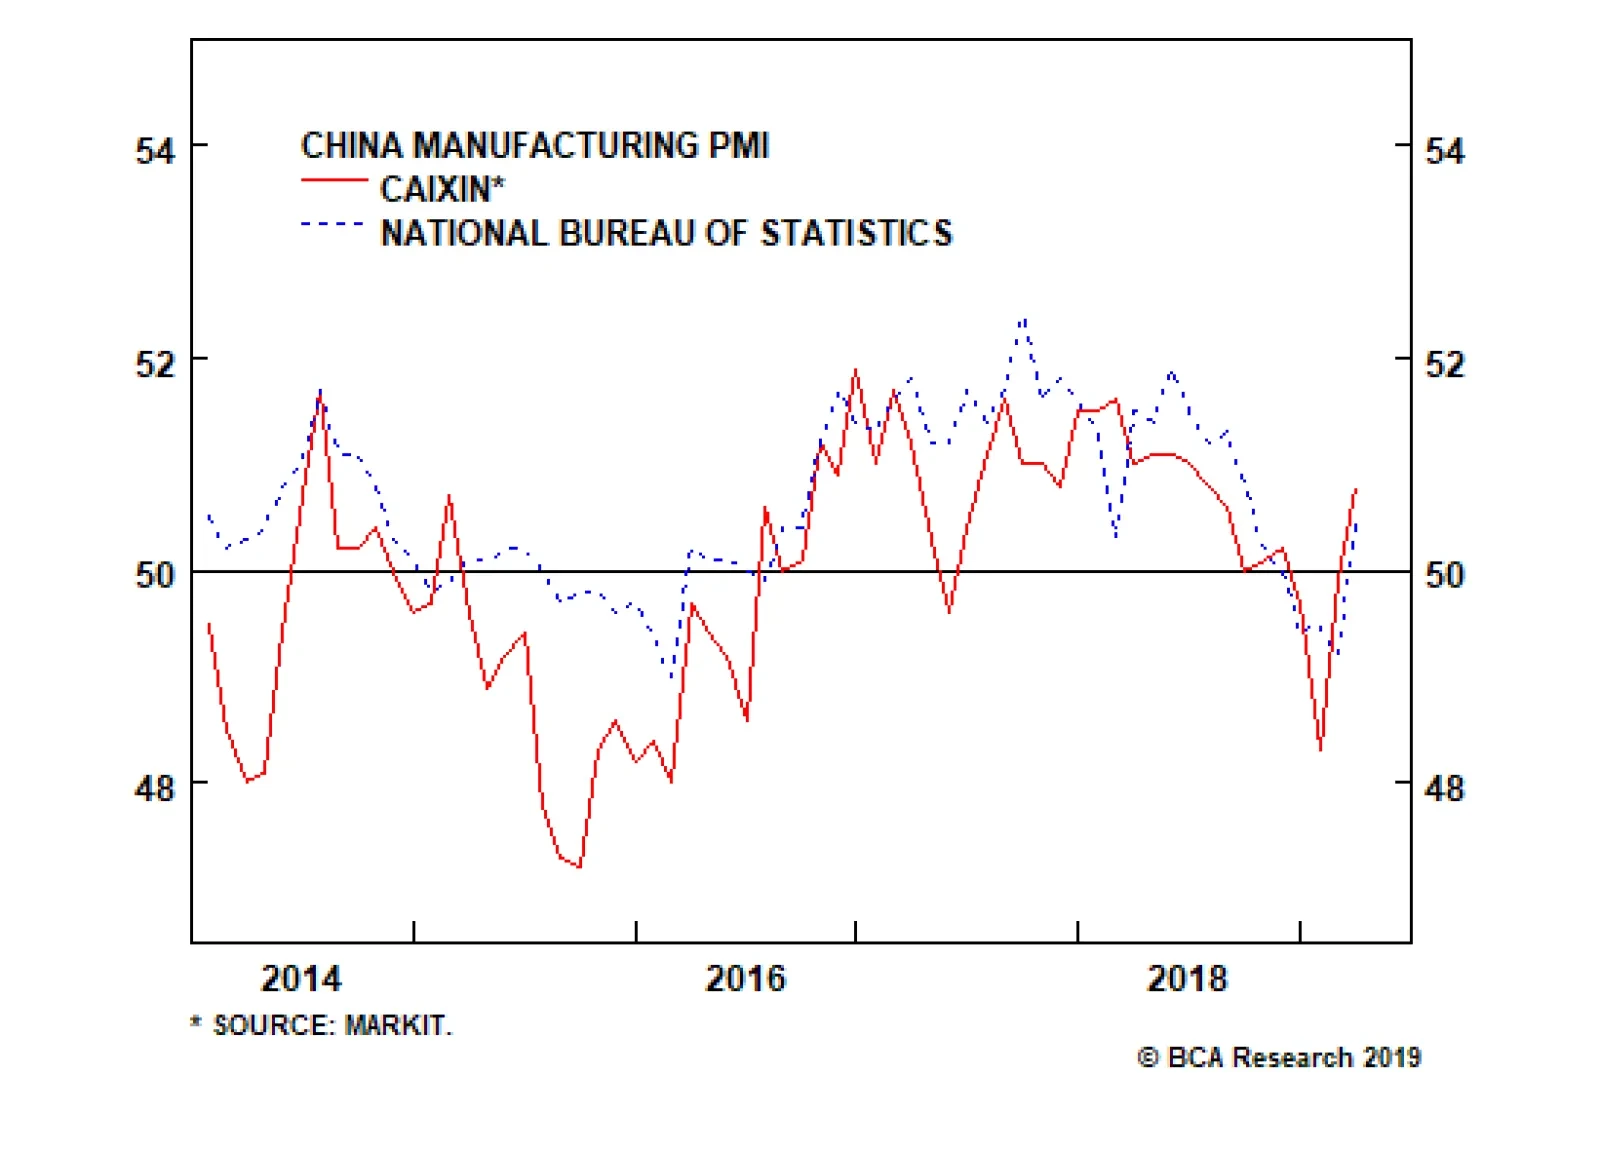
The NBS Manufacturing PMI, which carries a larger weight toward state-owned enterprises, rebounded to 50.5 from 49.2. Its new orders, new export orders, imports, and purchases quantity components all improved significantly. Meanwhile, the Caixin manufacturing…
Highlights U.S. growth remains robust, despite some temporary softness in recent months. Ex U.S., growth continues to fall but, with China probably now ramping up monetary stimulus, should bottom in the second half. Central banks everywhere have turned more dovish, partly in an attempt to push up inflation expectations. The combination of resilient growth and easier monetary policy should be good for global equities. We remain overweight equities versus bonds. Bond yields have fallen sharply everywhere. However, with U.S. inflation still trending up, and central banks unlikely to turn any more dovish this year, yields are unlikely to fall much further in 2019. We recommend a slight underweight on duration. We remain overweight U.S. equities, but are on watch to upgrade the euro zone and Emerging Markets when we have stronger conviction about China’s stimulus. Given structural headwinds in both Europe and EM, this would probably be only a tactical upgrade. We have been tilting our equity sector recommendations in a more cyclical direction, last month raising Industrials and Energy to overweight. We also prefer credit over government bonds within the fixed-income category, though we warn that spreads will not fall much further given weak corporate fundamentals. Feature Recommended Allocation
Quarterly - April 2019
Quarterly - April 2019
Overview Don’t Fight The Doves The performance of risk assets essentially comes down to a battle between growth and monetary policy/interest rates. Last September, despite the fact that global economic growth was clearly slowing, the Fed sounded hawkish; this triggered an 18% drop in global equities in Q4. But, since late last year, all major developed central banks have turned more dovish, culminating in March’s decision of the ECB to push back its guidance for its first rate hike, and the FOMC’s wiping out its two planned hikes for 2019. But, at the same time, U.S. economic growth is showing resilience, and we see the first “green shoots” of a cyclical pickup in growth outside the U.S. This is an environment in which risk assets should continue to perform well. Why did the Fed back off? The most likely explanation is that it wants to give itself more room to act come the next recession. Inflation expectations have become unanchored, with 10-year breakevens over the past decade steadily below a level that would be consistent with the Fed achieving its 2% core PCE inflation target in the long run. In the period since the Fed formally introduced this (supposedly “symmetrical”) target in 2012, it has exceeded it in only four months (Chart 1). Around recessions over the past 50 years, the Fed has on average cut rates by 655 basis points (Table 1). It sees little risk, therefore, in letting the economy “run a little hot” and allowing inflation to rise somewhat above 2%. This would reanchor expectations, and eventually get nominal short- and long-term rates higher before the next recession. Chart 1Market Doesn’t Believe The Fed’s Target
Market Doesn't Believe The Fed's Target
Market Doesn't Believe The Fed's Target
Table 1Fed Won’t Be Able To Cut This Much Next Time
Quarterly - April 2019
Quarterly - April 2019
Chart 2Financial Conditions Now Much Easier
Financial Conditions Now Much Easier
Financial Conditions Now Much Easier
Chart 3Housing Market Bottoming Out
Housing Market Bottoming Out
Housing Market Bottoming Out
Meanwhile, U.S. growth seems to be stabilizing at a decent level after signs of weakness late last year caused by tighter financial conditions, a slowdown elsewhere in the world, and the six-week government shutdown. An easing of financial conditions since the beginning of the year should help to keep U.S. GDP growth above trend at around 2.0-2.5% this year (Chart 2). Most notably, interest-rate sensitive areas of the economy that were under pressure last year, especially housing, are showing signs of bottoming (Chart 3). Consumption also should be robust, given strong wage growth, consumer confidence close to historic record high levels, and amid no signs of a deterioration in the labor market (Chart 4). Chart 4No Signs Of Weaker Labor Market
No Signs Of Weaker Labor Market
No Signs Of Weaker Labor Market
Chart 5Some 'Green Shoots' For Global Growth
Some "Green Shoots" For Global Growth
Some "Green Shoots" For Global Growth
A key question for us over the next few months will be when to shift allocations to more cyclical, higher-beta equity markets such as the euro area and Emerging Markets. These have underperformed year-to-date despite the strong risk-on market. China’s nascent reflationary stimulus will decide the timing and level of conviction of this shift. As we explain in detail on page 6, we think the jury is still out on whether China is injecting liquidity on anything like the same scale as it did in 2016. Even if it is, historically it has taken six to 12 months before the effect showed through via a rebound in global trade, commodity prices, and other China-related indicators. The first early signs of a bottoming are emerging: Chinese fixed-asset investment and the Caixin Manufacturing PMI beat expectations last month, the German ZEW Expectations indicator has started to recover, and the diffusion index of the Global Leading Economic Indicator (which often leads the LEI itself by a few months) has picked up (Chart 5). We are on watch to shift our allocation1 but, given the long-term structural headwinds against both Europe and EM, we need to be more convinced about the strength of Chinese stimulus before doing so. The seeds of recession are sown in expansions. Eventually, we see the newly dovish Fed falling behind the curve. The Fed Funds Rate is still below the range of estimates of the neutral rate – hard though this is to estimate in real time (Chart 6). If the economy remains as strong as we expect, sometime next year inflation could begin rising to uncomfortable levels (and asset bubbles start to be of concern), which would push the Fed back into hiking mode. Given that the market is pricing in Fed rate cuts, not hikes, and that the Fed can hardly sound any more dovish than it does now without moving to an outright easing path, it seems to us that long-term rates are very unlikely to fall from here (Chart 7). Chart 6Fed Still Below Neutral
Fed Still Below Neutral
Fed Still Below Neutral
Chart 7Can The Fed Get Any More Dovish Than This?
Can The Fed Get Any More Dovish Than This?
Can The Fed Get Any More Dovish Than This?
In this environment, therefore, we continue to expect global equities to outperform bonds over the next 12 months. However, a recession is possible in 2021 triggered by the Fed late next year needing to put its foot abruptly on the brake. What Our Clients Are Asking Chart 8Ex-U.S. Equities Driven By China Stimulus
Ex US Equities Driven By China Stimilus
Ex US Equities Driven By China Stimilus
When Is The Time To Switch Allocations To Europe And EM? It is slightly surprising that the 12% rally in global equities this year has been led by the low-beta U.S., up 13%, rather than Europe (up 9%) or emerging markets (up 9% - and much less if the strong Chinese market is excluded). Is it time to switch to these underperforming, more cyclical markets? Our answer is, not yet. Global growth ex-U.S. continues to weaken. It is likely to bottom sometime in the second half, as a result of Chinese growth stabilizing. However, the jury is still out on whether the increase in Chinese credit creation in January was a one-off, or major policy reversal. Even if it is the latter, a revival in global growth (and cyclical markets) has typically lagged Chinese stimulus by 6-12 months (Chart 8, panel 1). There are also significant structural headwinds for both the euro zone and Emerging Markets which make us reluctant to overweight them unless there are clear cyclical reasons to do so. Both have lagged global equities fairly consistently since the Global Financial Crisis, with only brief outperformance during periods of economic acceleration, such as in 2016 and 2012 (panel 2). The euro zone remains challenged by its banking system. Loan growth has been stagnant for years, and banks remain undercapitalized relative to their U.S. peers, and highly fragmented (panels 3 and 4). Emerging markets are hampered by their high level of foreign-currency debt (which makes them highly sensitive to U.S. financial conditions), dependence on China, and lack of structural reform. We could see ourselves shifting our recommendation from the U.S. to the euro area and EM, and becoming outright bearish on the U.S. dollar (a counter-cyclical currency), over the coming months if we find confirmation of a bottoming of global cyclical growth and become more confident in the size of China’s stimulus. But given the structural headwinds, and the steady underperformance of these markets, we need stronger evidence first. Chart 9Oil, Positioning, And Housing
Oil, Positioning, And Housing
Oil, Positioning, And Housing
Why Is The 10-Year Bond Yield So Depressed? Despite U.S. equities rallying back to within 4% of a record high, the U.S. Treasury bond yield has fallen further this year (Chart 9, panel 1). Moreover, the 3-month/10-year yield curve has briefly inverted. Besides the Fed’s recent more dovish turn, what has depressed bond yields? We would pin the cause on the following factors: Dampened inflation expectations: Over the past few years the 10-year yield has been closely correlated with the oil price via inflation expectations. A temporary supply shock in Q4 caused oil prices to decline sharply. But tighter supply this year should allow the oil price to recover further. This should cause a rise in inflation expectation (panel 2). Trade positioning: Late last year, speculative short positions in government bonds were at their highest levels since 2015. However, the Q4 equity selloff pushed investors to cover their positions; these are now close to neutral (panel 3). Home Sales: Housing data has been weak over the past few quarters, with both existing and new home sales declining. But there are now signs of recovery: mortgage applications have started to pick up, which should in turn push home sales higher (panel 4). This should also allow for a rise in bond yields. Our key take-away from March’s FOMC meeting, when the tone turned decidedly dovish, is that the Fed is focusing on re-anchoring inflation expectations, which should push nominal yields higher. We think the market is very pessimistic by pricing in 42 and 56 bps of rate cuts over the next 12 and 24 months respectively. It would take a significant further weakening of economic data to make the Fed’s stance turn even more dovish and for nominal yields to fall even further. How Will U.S. Corporate Bonds Perform In The Next Recession? Historically high levels of U.S. corporate debt, as well as declining credit quality in the investment-grade space, have started to worry investors (Chart 10). Specifically, investors are worried that, when the next default cycle comes, a large portion of investment-grade debt will be downgraded to junk, forcing fund managers who are constrained to hold certain credit qualities to sell. These worries seem to be justified. Investment-grade bonds of lower credit quality tend to experience large increases in migration to junk status during credit recessions (Chart 11). Given the current composition of the U.S. investment-grade corporate bond universe, a credit recession would imply a downgrade to junk status of 4.6% of the index if we assume similar behavior to previous recessions. Depending on the speed of the selloff, such a downgrade could also have grave consequence for liquidity. According to the Securities Industry and Financial Markets Association (SIFMA), average daily turnover in the U.S. corporate bond market was 0.34% in 2018. Thus, it is not hard to envision a situation where forced selling could surpass normal levels of liquidity. However, it is hard to tell what would be the effect of such a fire-sale on credit spreads, given that they tend to widen in recessions regardless. While this asset class could perform poorly in the next recession, we don’t expect that its weakness will translate to the real economy. Leveraged institutions such as banks hold just 18% of corporate credit. Furthermore, despite being at all-time highs, U.S. nonfinancial corporate debt to GDP is still at a much healthier level than in other countries (Chart 12). Chart 10Declining Quality In Investment Grade
Declining Quality In Investment Grade
Declining Quality In Investment Grade
Chart 11
Chart 12U.S. Corporate Debt Levels Are Healthy Relative To The Rest Of The World
U.S. Corporate Debt Levels Are Healthy Relative To The Rest Of The World
U.S. Corporate Debt Levels Are Healthy Relative To The Rest Of The World
Chart 13A Value Rebound?
A Value Rebound
A Value Rebound
Chart 14
Is It Time To Favor Value Over Growth Again? Since it peaked in May 2007, the ratio of global value to growth has attempted to rebound several times amid a sustained downtrend (Chart 13). Due to the cyclical nature and the neutral relative valuation of the value/growth indexes, we have preferred to use sector positioning (cyclicals vs. defensives) to implement a value/growth style tilt in our global portfolio since March 20162 (Chart 13, panel 1). Lately, we have received many requests on the topic of the value-versus-growth-ratio. After reaching a historical low in August 2018, the value/growth ratio slightly rebounded in Q4 2018 before reversing some of its gains so far this year. Additionally, the value/growth valuation gap as measured by both price-to-book and forward P/E has reached a historically low level (Chart 13, panel 4). As we have often noted, the sector composition of both the value and growth indexes changes over time.2 Chart 14 shows the current sector weights of S&P Pure Value and Pure Growth Indexes.3 It’s clear that now a bet on Pure Value versus Pure Growth is essentially a bet on Financials (which account for 35% of the Pure Value index) versus Tech and Healthcare (which together account for 38% of the Pure Growth index) - see also Chart 13, panel 2. Given the cyclical nature of the value/growth ratio and also the sector concentration, it’s not surprising that the value/growth play is also a play on euro area versus U.S. equities (Chart 13, panel 3). Currently, we are neutral on Financials and Tech, while overweight Healthcare in our global sector portfolio, and we are putting the euro area on an upgrade watch (see page 14). Therefore, maintaining a neutral stance between value and growth is in line with our sector and country views. However, a close watch for a possible upgrade of value is also warranted given the extreme valuation measures. Global Economy Overview: U.S. growth has slowed recently, though it remains more robust than in the more cyclical economies in Europe and emerging markets. Central banks almost everywhere have recently turned dovish. However, China’s increased monetary stimulus should help global growth bottom out in H2. This could lead the Fed and central banks in other healthy economies to return to a rate-hiking path. U.S.: The U.S. economy has been weak in recent months. The Citigroup Economic Surprise Index (Chart 15, panel 1) has collapsed, and the Fed NowCasts point to only 1.3-1.7% QoQ annualized GDP growth in Q1 (compared to 2.2% in Q4). But the slowdown is mostly due to the six-week government shutdown (which probably took 1% off growth), some seasonal adjustment oddities (which leave Q1 as the weakest quarter almost every year), and tighter financial conditions in H2 2018 which have now largely reversed. The manufacturing and non-manufacturing ISMs in February were still healthy at 54.2 and 59.7 respectively. Consumption (propelled by strong employment growth and accelerating wages) and capex remain strong (panel 3). BCA expects GDP growth in 2019 to be around 2.0-2.5%, still above trend. Euro Area: The European economy continues to slow, driven by weak exports to emerging markets, troubles in the banking sector, and political uncertainty. Q4 GDP growth was only 0.8% QoQ annualized, and the manufacturing PMI has fallen to 47.6 (with Germany as low as 44.7). But there are some early signs of an improvement. The ZEW Expectations index for Germany has bottomed (Chart 16, panel 1), fiscal policy should boost euro area growth this year by around 0.5 percentage points, and wage growth has begun to accelerate. The key remains Chinese stimulus, whose positive effects should help European exports recover sometime in H2. Chart 15U.S. Growth Slowing But Still Robust
U.S. Growth Slowing But Still Robust
U.S. Growth Slowing But Still Robust
Chart 16Signs Of Bottoming In Global Ex-U.S.?
Signs Of Bottoming In Global Ex-U.S.?
Signs Of Bottoming In Global Ex-U.S.?
Japan: Japan also remains highly dependent on a Chinese stimulus. Machine tool orders (the best indicator of capex demand from China) fell by 29% YoY in February. Despite stronger wage growth, now 1.2% YoY, inflation shows no signs of moving up towards the Bank of Japan’s target of 2%: ex energy and food CPI inflation is still only 0.4%. The biggest risk in 2019 is October’s planned consumption tax hike from 8% to 10%. Prime Minister Abe has said that he will cancel this only in the event of a shock on the scale of Lehman Brothers’ bankruptcy. The government has put in place measures to soften the impact (most notably a 5% rebate on purchases at small retailers after October 1 paid for electronically), but consumption is still likely to fall significantly. Emerging Markets: China seems to have ramped up its monetary stimulus, with total social financing in January and February combined up 12% over the same months last year. Recent data have shown signs of a stabilization of growth: the manufacturing PMI rebounded to 49.9 in February from 48.3, and fixed-asset investment beat expectations at 6.1% YoY in January and February combined. Nonetheless, the size of liquidity injection is likely to be smaller than in previous episodes such as 2016, since Premier Li Keqiang and the PBOC have warned of the risk of excessive speculation. Elsewhere, some emerging economies (notably Brazil and Mexico) have showed signs of recovery after last year’s deterioration, whereas others (such as South Africa, Indonesia, and Poland) continue to suffer. Interest rates: Central banks worldwide have generally turned more dovish in recent months, with the Fed and ECB both moving to signal no rate hikes this year. This has pushed down long-term rates globally, with 10-year bond yields falling below 0% again in Germany and Japan. However, with global growth likely to bottom over the next few months, rates may not stay at current depressed levels. U.S. inflation, in particular, continues to trend up, and the Fed’s target PCE inflation measure is likely to exceed 2% over coming months. We see the Fed turning more hawkish by year-end, and long rates globally more likely to rise than fall from current levels. Global Equities Chart 17Watch Earnings
Watch Earnings
Watch Earnings
Remain Cautiously Optimistic: We added risk in our January Portfolio Update4 by putting cash back to work in global equities, and then in the March Portfolio Update5 we reduced the underweight in EM equities and increased the tilt to cyclicals at the expense of defensives, to hedge against a continuing acceleration in Chinese credit growth. All these came after our risk reduction in July 2018.6 GAA’s portfolio approach has always been to take risks where they are most likely to be rewarded. BCA’s macro view is that global economic growth data is likely to be on the weak side in the coming months, but will pick up in the second half. This implies that equities are likely to rally again after a period of congestion within a trading range, supporting a cautiously optimistic portfolio allocation for the next 9-12 months. At the asset-class level, our positioning of overweight equities versus bonds while neutral on cash, reflects the “optimistic” side of our allocation. However, the rebound in global equities since the December sell-off has been driven completely by a valuation re-rating, while earnings growth has been revised down sharply. (Chart 17). As such, within global equities, our preference for low-beta countries (favoring DM versus EM, and favoring the U.S over the rest of DM) reflects the “cautious” aspect of our allocation. Our macro view hinges largely on what happens to China. There are signs that China may have abandoned its focus on deleveraging, yet it is too early to tell if it has switched back to a reflationary path. Therefore, our global equity sector overlay has a slight cyclical tilt by overweighting Industrials and Energy, which are among the main beneficiaries of Chinese reflationary policies or a positive resolution to U.S.-China trade negotiations. Chart 18Warming Up To The Euro Area
Warming Up To The Euro Area
Warming Up To The Euro Area
Euro Area Equities: On Upgrade Watch We have favored U.S. equities relative to the euro area since July 2018.7 Since then, the U.S. has outperformed the euro area by 11% in USD terms and by 8% in local currency terms, with the difference being attributed to the weakness of the euro versus the U.S. dollar. Given BCA’s view on the global economy and the U.S. dollar, however, we are watching closely to switch our recommendation between the U.S. and euro area equities, for the following reasons: First, as shown in Chart 18, panel 1, the relative performance between the euro area and the U.S. is highly correlated with the EUR/USD exchange rate. BCA believes that the U.S. dollar is set for a period of weakness starting in the second half of the year,8 which bodes well for the outperformance of euro area equities. Second, relative earnings growth between the euro area and the U.S. is driven by the underlying strength of the economies, as represented by PMIs (panel 2). Both the relative earnings growth and relative PMI have stopped falling and have begun to bottom in favor of the euro area; Third, even though the euro area’s beta has been declining while that of the U.S. has increased, euro area beta is still higher than that in the U.S., making it more of a beneficiary of a global growth recovery; However, the relative valuation of euro area equities to their U.S. counterparts is now neutral not at the extreme level which historically has been a good entry-point into eurozone equities (panel 4). Chart 19Becoming Less Defensive
Becoming Less Defensive
Becoming Less Defensive
Global Sector Allocation: Gradually Becoming Less Defensive GAA’s sector portfolio took profits on its pro-cyclical positioning and went defensive in July 20189 and remained so until the March Monthly update10 when we upgraded Energy and Industrials to overweight from neutral, while downgrading Consumer Staples two notches to underweight from overweight (Chart 19). The upgrade of Industrials was mainly a hedge against further acceleration in China’s credit growth. But why did we upgrade Energy to overweight yet maintained an underweight in Materials? Long-term GAA clients know that, in terms of global sector allocation, we have structurally favored the oil-related Energy sector to the metals-related Materials sector since October 2016, because oil supply/demand is more global in nature while the supply/demand of metals, especially industrial metals, is closely linked to China (see also the Commodity section of this Quarterly on page 18). From a cyclical perspective, the relative performance of the two sectors has historically closely correlated with the relative prices of oil and metals, as shown in panel 2. This is not surprising because changes in forward earnings for the two sectors are also closely linked to change in the corresponding commodity prices (panels 3 and 4). BCA’s Commodity and Energy Strategy service has an overweight rating on oil and a neutral stance on metals, implying that the growth in the oil price will outpace that of metal prices, which suggests that the Energy sector will outperform the Materials sector (panel 2). Government Bonds Maintain Slight Underweight On Duration. Global equities have recovered 16% since reaching the low of 2018 on December 24, yet the global bond yield has decreased by 21 bps over the same period. While the directional movement of bond yields is somewhat puzzling given such strong performance in equities (see page 7 for some explanations), it’s evident that the bond markets have been driven by the recent weakness in global growth (Chart 20, panel 3), and are pricing out any expectation of rate hikes over the coming year in major developed economies. Given the surprisingly dovish tone at the March FOMC meeting and BCA’s House View that global economic growth will rebound in the second half, bond yields are now highly exposed to any hawkish shift in central bank policies and any recovery in inflation expectations. As such, it’s still appropriate to maintain a slight underweight on duration over the next 9-12 months. Favor Linkers Vs. Nominal Bonds. Depressed inflation expectations have been one reason why global bond yields have decoupled from equities. However, the crude oil price, which closely correlates with inflation expectations, has stabilized. BCA’s Commodity & Energy Strategy service expects Brent crude to end 2019 at US$75 per barrel (Chart 21). This implies a significant rise in inflation expectations in the second half of the year, supporting our preference for inflation-linked bonds over nominal bonds. However, TIPS are no longer cheap. For those who have not already moved to overweight TIPS, we suggest “buying TIPS on dips”. Inflation-linked bonds (ILBs) in Australia and Japan are also still very attractive versus their respective nominal bonds. Overweighting ILBs in those two markets also fits well with our macro themes. Chart 20Rates: Likely More Upside Risk
Rates: Likely More Upside Risk
Rates: Likely More Upside Risk
Chart 21Favor Inflation Linkers
Favor Inflation Linkers
Favor Inflation Linkers
Corporate Bonds Chart 22Tactical Upside Remains For Credit
Tactical Upside Remains For Credit
Tactical Upside Remains For Credit
In February, we raised credit to overweight within a fixed-income portfolio while underweighting government bonds. So far, this has proven to be the right decision, as corporate bonds have generated excess returns of 90 basis points over duration-matched Treasuries. We based our positioning on the mounting evidence that global growth is turning up: credit impulses are starting to rebound in several major economies, monetary conditions have eased, and our diffusion index of global leading indicators has rebounded sharply, indicating that there remains tactical upside for global credit (Chart 22– panel 1 and 2). When will we close our tactical overweight? Our U.S. Bond Strategy Service has set a target for spreads of U.S. corporate bonds with different credit ratings. According to their targets, which denote the median spread typical of late-cycle environments, there is still some room for further spread compression in non-AAA credits (Chart 22 – panel 3 and 4). However, the upside is limited and, if spreads keep tightening, we will probably close our position by the end of Q2. On a cyclical horizon, the fundamentals of corporate health are still a headwind, with both the interest-coverage and liquidity ratio for U.S. investment-grade corporates standing near 10-year lows.11 Moreover, we expect these ratios to deteriorate further, as corporate profits will likely come under pressure due to increasing wage growth. Finally, we expect that the Fed will turn more hawkish by the end of 2019, turning monetary policy from a tailwind to a headwind. Thus, we recommend investors to remain overweight, but be ready to turn bearish in the back end of the year. Commodities Chart 23Prefer Oil, Watch Metals
Prefer Oil, Watch Metals
Prefer Oil, Watch Metals
Energy (Overweight): Stable demand, declining Venezuelan production due to U.S. sanctions, instability and possible outages in Libya, Iraq, and Nigeria, alongside the GCC’s commitment to cut output through year-end, should support oil prices and allow further upside (Chart 23, panels 1 & 2). While U.S. crude production is on the rise, bottlenecks in its export capabilities should limit market oversupply. Crude supply shocks should outweigh any slowdown in demand, specifically from emerging markets. BCA’s energy strategists expect Brent to average $75 and $80 throughout 2019 and 2020 respectively, and for the gap between WTI and Brent to narrow significantly. Industrial Metals (Neutral): China, the world’s largest consumer, still plays a big role in the direction of industrial metals. Year-to-date, metals prices have been supported partly by a more stable dollar. For now, we maintain a neutral stance until we see confirmation that Chinese stimulus will trigger further upside to metal prices perhaps in the second half. However, a lack of sustained Chinese demand, alongside weaker global growth over the next few months, would weigh down on metal prices (panel 3). Precious Metals (Neutral): Gold has reversed its downslide and rallied by over 10% from its Q4 2018 low. With the market pricing out any Fed rate hikes this year, rising inflation expectations, a weaker USD by year-end, and lower real rates should help gold outperform other commodities in this late-cycle phase. We recommend an allocation to gold as an inflation hedge, as well as a hedge against geopolitical risks (panel 4). Currencies Chart 24The End Of The Dollar Bull Market
The End Of The Dollar Bull Market
The End Of The Dollar Bull Market
U.S. Dollar: Our bullish stance on the dollar has proven to be correct, as the trade-weighted dollar has appreciated by 5% in the past 12-months thanks to the slowdown in global growth. However, the two reasons for the growth slowdown – Fed tightening and Chinese deleveraging – have started to ease. On March 20 the Fed revised its forward guidance to no rate hikes in 2019 and only one rate hike in 2020. Meanwhile, Chinese total social financing relative to GDP has bottomed, indicating that Chinese authorities have opted for a pause in their deleveraging campaign (Chart 24, panel 1). These developments will likely boost global growth and hurt the countercyclical greenback. Therefore, we recommend investors to slowly shift to a cyclical underweight on the dollar. Euro: Most of the factors that dragged the euro down last year are fading: political risk in Italy has eased, fiscal policy is moving from a headwind to a tailwind, and the relative LEI between the EU and the US has started to pick up (panel 2). Moreover, we see little scope for euro area monetary policy to turn any more dovish versus the U.S., since forward rate expectations currently stand near 2014 lows (panel 3). Thus, we expect the euro to be one of the best performing currencies this year. Yen: Easy monetary policy by global central banks will boost asset prices and reduce volatility, creating a risk-on environment that is typically negative for the yen (panel 4). Moreover, the IMF still projects Japan to have a negative fiscal drag of 0.7% this year, which will force the BoJ to prolong its yield curve control regime. As a result, we expect the yen to be one of the worst performing currencies this year. Alternatives Intro: Investors’ allocation to alternatives is on the rise as we get closer to the end of the business cycle along with increasing realized volatility in traditional assets. In the alternatives assets space, we recommend thinking about allocations through three buckets: 1) return enhancers, means of outperforming traditional equity, fixed income, and mixed-asset strategies; 2) inflation hedges, means of preserving capital throughout periods of elevated inflation; and 3) volatility dampeners, means of reducing drawdowns and portfolio volatility during periods of market drawdowns. Return Enhancers: In our July and October 2018 Quarterly reports, we recommended investors trim back on PE allocations and reallocate towards hedge funds. Growing competition in the PE space has pushed up multiples. Given where the business cycle currently is, we favor macro hedge funds, as they tend to outperform in this sort of environment as well as in downturns and recessions (Chart 25, panel 1). Inflation Hedges: In our July 2018 Quarterly, we recommended investors pare back their real estate allocations, given the backdrop of a slowdown/sideways trend in the sector, and specifically within the retail segment. Given that the end of the current cycle is likely to be accompanied by elevated levels of inflation, we recommend clients to modestly allocate to commodity futures on the likelihood of a softer dollar and rising energy prices (panel 2). Volatility Dampeners: We continue to recommend both farmland and timberland since they have lower volatility than other traditional and alternative asset classes (panel 3). While timberland is more impacted by economic growth via the housing market, farmland has a near-zero correlation with economic growth. We do not favor structured products due to their unattractive valuations. Chart 25Prefer Hedge Funds Over Private Equity
Prefer Hedge Funds Over Private Equity
Prefer Hedge Funds Over Private Equity
Risks To Our View Our economic outlook is quite sanguine. What would undermine this scenario? Many investors have become nervous about the inversion of the U.S. yield curve. And we have shown in the past that an inversion of the 3-month/10-year yield curve has been a reliable indicator of recessions 12-18 months ahead.12 Its inversion in March, then, is a concern. But note that the indicator works only using a three-month moving average (Chart 26); the curve often inverted for a brief period without signaling recession. We expect long-term rates to rise from here, steepening the curve. But a prolongation of the current inversion would clearly be a worrying signal. The direction of China continues to play a key role in defining the macro picture. Our current allocation is based on the view that China is doing some monetary and fiscal stimulus but that, at the current pace, it will be much smaller than in 2016 (Chart 27). The weak response of money supply growth suggests, as Premier Li Keqiang has complained, that the liquidity is mostly going into speculation (note that A-shares have risen by 20% this year) rather than into the real economy. The March Total Social Financing data, released in mid-April, will give a better read of the degree of the reflation. If it is bigger than we expect, this would suggest a quicker shift into euro area and Emerging Market equities than we currently advocate. The U.S. dollar remains a key driver of asset allocation. The dollar is a counter-cyclical currency and, with global growth slowing, has continued to appreciate moderately this year (Chart 28). We see a weakening of the dollar later this year, when global growth picks up. But if this were to happen more quickly or dramatically than we expect – not impossible given the currency’s over-valuation and crowded long-dollar positions – EM stocks and commodity prices, given their strong inverse correlation with the dollar, could bounce sharply. Chart 26Yield Curve Inversion
Yield Curve Inversion
Yield Curve Inversion
Chart 27How Much Is China Reflating?
How Much Is China Reflating?
How Much Is China Reflating?
Chart 28Dollar Is Counter-Cyclical
Dollar Is Counter-Cyclical
Dollar Is Counter-Cyclical
Garry Evans, Chief Global Asset Allocation Strategist garry@bcaresearch.com Xiaoli Tang, Associate Vice President xiaolit@bcaresearch.com Juan Manuel Correa Ossa, Senior Analyst juanc@bcaresearch.com Amr Hanafy, Research Associate amrh@bcaresearch.com Footnotes 1 Please see the Equities Section of this Quarterly on page 14 for more details. 2 Please see Global Asset Allocation “GAA Quarterly,” dated March 31, 2016 available at gaa.bcaresearch.com 3 Please see https://us.spindices.com/documents/methodologies/methodology-sp-us-style.pdf 4 Please see Global Asset Allocation “Monthly - January 2019,” dated January 2, 2019 available at gaa.bcaresearch.com 5 Please see Global Asset Allocation “Monthly - March 2019,” dated March 1, 2019 available at gaa.bcaresearch.com 6 Please see Global Asset Allocation “Quarterly - July 2018,” dated July 2, 2018 available at gaa.bcaresearch.com 7 Please see Global Asset Allocation “Quarterly - July 2018,” dated July 2, 2018 available at gaa.bcaresearch.com 8 Please see Global Investment Strategy Weekly Report, “What’s Next For The Dollar?” dated March 15, 2019 available at gis. bcaresearch.com 9 Please see Global Asset Allocation “Quarterly - July 2018,” dated July 2, 2018 available at gaa.bcaresearch.com 10 Please see Global Asset Allocation “Monthly Portfolio Update,” dated March 1, 2019 available at gaa.bcaresearch.com 11 Based on BCA’s Global Fixed Income Strategy’s bottom-up health monitor. 12 Please see Global Asset Allocation Special Report, “Can Asset Allocators Rely On Yield Curves?” dated June 15, 2018 available at gaa.bcaresearch.com GAA Asset Allocation
Dear Client, Instead of our regular Weekly Report, this week we are sending you a Special Report written on February 20 by our Geopolitical Strategy service colleagues that discusses China’s recent stimulating efforts. We have only made a few minor revisions to account for the past month’s events. We trust that you will find this Special Report useful and insightful. Best regards, Anastasios Avgeriou, U.S. Equity Strategist Highlights So What? China’s January-February credit data suggest that stimulus is here. Why? China’s early-year credit and fiscal policies suggest that stimulus risks are to the upside. January-February credit was a blowout number and fiscal spending is up. Equity bourses in South Korea and Russia are the most likely to benefit from Chinese stimulus. Industrial metals such as copper will also benefit – with a delay. Feature New credit data for China in January-February improves the chances that Beijing’s stimulus measures will overshoot this year, causing China’s economy to bottom in 2019 and jumpstart global growth. In our annual outlook for this year we argued that while China was stimulating the economy, the magnitude of stimulus would be the decisive factor for the global macro environment in 2019. We argued that the type of stimulus would remain primarily fiscal – tax cuts for households and small and medium-sized enterprises – and hence that it would be modest as fiscal easing would merely offset relatively weak credit growth. This view stemmed from our assessment of the Xi Jinping administration, highlighted in April 2017, as an “elitist” (not populist) administration. Its policy priorities are to discipline the Chinese economy, and in particular to contain systemic financial risk, which President Xi has cited as a national security threat. This view is not wrong, but the latest data clearly show that Xi has decided to pause these painful efforts at limiting leverage and rebalancing China’s economy. Witness January-February’s decisive uptick in both total social financing (total private credit) and local government bond issuance (Chart 1). Chart 1Higher Risk Of An Overshoot
Higher Risk Of An Overshoot
Higher Risk Of An Overshoot
A massive spike in new credit is the single most important criterion in our “Checklist For A Stimulus Overshoot.” Thus, from a policy perspective, we are now at higher risk of an overshoot (Table 1). Not only credit as a whole but also informal lending saw a surge in January-February, implying that the government is relenting in its crackdown on the shadow banks. The approval of local government bond issuance for early in the year – and the People’s Bank of China’s announcement of a “Central Bank Bills Swap” program – reinforce this policy shift.1 Table 1Checklist For A Chinese Stimulus Overshoot In 2019
China: Stimulating Amid The Trade Talks
China: Stimulating Amid The Trade Talks
A stimulus overshoot is positive for Chinese demand in the short run but negative for potential GDP in the long run. A “traditional” credit surge of this nature cannot be surgically targeted at SMEs or households. It will go to state-owned enterprises, privileged corporations, property developers, and the like, which have always had the advantage in China’s financial system. SOEs have taken a much larger share of new loans than private companies in recent years,2 and the only silver lining of this trend was the possibility that tighter credit controls would discipline the SOEs. That silver lining is now fading, barring some new and surprising development on the reform front. China needs to create 26 trillion renminbi in new credit over the course of the year to avoid a corporate earnings contraction. These January-February numbers put China on track to do just that (Chart 2), assuming that President Xi and U.S. President Donald Trump agree to a short-term, framework trade deal this year. Chart 2On Track To Avoid An Earnings Contraction
On Track To Avoid An Earnings Contraction
On Track To Avoid An Earnings Contraction
Of course, a few caveats are in order. First, January-February’s credit number is only one data point and credit growth is always abnormally strong in the first month of the year. Early in the year, banks seek to expand their assets rapidly in a bid to get as much market share as possible before administrative credit quotas kick in. Because of Chinese New Year, it is best to combine January and February data to get a sense of the rate of credit expansion in the first part of the year. This year’s January-February numbers are very strong relative to previous years (Chart 3) and the context is more accommodative than the 2017 January-February credit surge, when authorities were beginning to tighten rather than ease macroprudential policy. Still a rapid rate of credit expansion will have to be sustained in the coming months in order to meet the 26 trillion RMB requirement highlighted above.
Image
Second, there is some risk that China’s households and private businesses will not respond as positively today as in the past. The intensification of Communist Party control over the society and economy, President Xi’s cancellation of term limits, and the strategic confrontation with the United States have created a bearish sentiment in the private sector. Our Emerging Markets Strategy would point out that if the propensity to consume, and money velocity,3 do not accelerate, then a surge in new credit may fail to ignite a reacceleration in China (Chart 4). Chart 4Chinese Are Holding On To Their Money
Chinese Are Holding On To Their Money
Chinese Are Holding On To Their Money
Still, what we now know is that Xi Jinping and his top economic adviser, Vice Premier Liu He, are not initiating the “assault phase of reform” that their predecessors initiated in the late 1990s in order to cleanse China’s economy of bad loans and zombie companies. Instead, they are likely reestablishing the “Socialist Put” in order to reverse the current deceleration, demonstrate China’s continued economic might and face down the United States’ threat of tariffs. Bottom Line: China’s stimulus measures are increasingly likely to overshoot, with positive implications for both Chinese and global growth. China is still facing a corporate earnings recession, but the odds of averting it are increasing. Trade Deadline More Likely To Be Extended What of the trade war? First, we would warn clients that China’s annual credit origination is a much bigger factor for the global economy than China’s exports to the United States (Chart 5). The trade war can escalate from here and yet, if China’s stimulus works as it has in the past, the results will be manageable for China’s economy save for Chinese companies expressly exposed to the U.S. economy through exports. In reality, both the U.S. and China are now effectively stimulating their economies and in this sense global trade as a whole will benefit regardless of bilateral tariffs. Chart 5Watch China Credit, Not So Much The Trade War
Watch China Credit, Not So Much The Trade War
Watch China Credit, Not So Much The Trade War
But it is possible that just as global equity markets ignored China’s economic slowdown and only sold off when the tariffs were levied (Chart 6), they may not continue to rally much on China’s credit data. Given the already considerable rally in global risk assets since October, markets may not be satisfied merely with one or two months of solid credit data out of China without a clear resolution to the trade conflict. After all, if a collapse in U.S.-China trade talks portends a new Cold War, then institutional investors may be justified in taking a wait-and-see approach despite China’s credit cycle upswing. Chart 6Will Equities Ignore China Data (Again)?
Will Equities Ignore China Data (Again)?
Will Equities Ignore China Data (Again)?
In the past, we have highlighted that the U.S. and China are not economically prohibited from engaging in a trade war – the export exposure is too small – and China’s new stimulus reinforces this point. However, President Trump is concerned about causing a sell-off in the tech sector and hence the broad equity market which could translate into a bear market and raise the probability of a recession occurring prior to November 2020. Meanwhile, in China, given Beijing’s reported trade concessions, there is apparently a desire to pacify the relationship and discourage U.S. unilateral tariffs and sanctions that could become seriously destabilizing for the Chinese economy and society. The need to have a happy 2021 centenary celebration for the Communist Party may factor into policymakers’ thinking. The latest news flow is mildly positive for the odds of getting a framework deal sometime this year. President Trump visited the Chinese negotiators in Washington, D.C. while President Xi reciprocated with the American negotiators in Beijing. A new round of two-week shuttle diplomacy is beginning. Trump has extended the tariff ceasefire and the two sides reportedly have arrived at an agreement on currency and are drafting written agreements on other areas of dispute. China’s National People’s Congress has passed a new Foreign Investment Law that ostensibly guarantees many of the American demands on forced tech transfer, intellectual property theft, and discriminatory treatment of U.S. companies (Table 2). Table 2New Foreign Investment Law Would Be A Positive For U.S.-China Negotiations
China: Stimulating Amid The Trade Talks
China: Stimulating Amid The Trade Talks
However, Presidents Trump and Xi have yet to schedule a new summit, which is probably necessary for a final deal. And there are murmurs from the press suggesting that China’s new law and other concessions are not going to satisfy the U.S. negotiators on the critical point of “structural changes” and a verification process. This leaves us inclined to change our trade war probabilities to increase the odds of an extension (Table 3). The improvement in U.S. financial conditions and China’s stimulus, if anything, make it more likely that negotiations will be extended, as both sides feel their economic and financial constraints less acutely. Table 3Updated Trade War Probabilities
China: Stimulating Amid The Trade Talks
China: Stimulating Amid The Trade Talks
Bottom Line: Global and Chinese risk assets should rally on China’s credit uptick, but the lack of resolution of the trade war could continue to inhibit animal spirits – and the odds of a March 1 resolution are declining. Who Are The Equity Winners Of China’s Stimulus? China’s strong January-February credit number is supportive of global equity markets. That much is obvious. But which equity markets will benefit the most? In what follows we examine the relationship between Chinese credit and MSCI equity returns of various countries. We find that Malaysian, Australian, South Korean, and Indonesian equities are the most highly correlated with Chinese credit growth and are thus most likely to benefit from the recent upturn (Chart 7). On the other hand, France and Italy stand out as countries whose bourses are more insulated.
Chart 7
Out of the markets that are positively correlated, South Korea and Russia stand out as relatively cheap (Chart 8). Thus we expect these equities to do especially well. By contrast, while Indonesia and the Philippines are highly leveraged to China, these markets are currently relatively expensive. BCA’s Emerging Markets Strategy is currently overweight Korean and Russian equities within the EM space, neutral Turkey (although recently upgraded from underweight), and underweight Indonesia and the Philippines.
Chart 8
In addition to credit stimulus, we expect Chinese household consumption to also gain support going forward. This will likely be driven by policy stimulus targeting the consumer specifically and is best exemplified by the recently announced tax cuts (Chart 9), which we expect to trickle down to greater consumer demand and growth in retail sales. Our base case calls for 8%-10% growth in household consumption over the coming 12 months, up from the current 3.5%.
Chart 9
However, consumer sentiment in China is weak. BCA’s Emerging Markets Strategy’s proxy for household marginal propensity to spend ticked up recently, after falling since early last year (see Chart 4 above). A resumption in the decline would highlight that households are increasingly unwilling to spend, which would translate into weaker retail sales despite policy efforts to boost consumption. Such a scenario – in which credit growth accelerates without a substantial uptick in consumer spending – is plausible, given that it occurred between mid-2015 and mid-2016 (Chart 10). In any case, whether Chinese stimulus comes in the form of the traditional credit channel, or instead in the form of fiscal stimulus to household consumption, the same equity markets will generally benefit the most (Chart 11). Chart 10...But Flattish Retail Sales Are Also A Possibility
...But Flattish Retail Sales Are Also A Possibility
...But Flattish Retail Sales Are Also A Possibility
Chart 11
Indeed, global equity markets react the same way regardless of the type of stimulus implemented. For instance, MSCI returns for the Philippines, Sweden, Malaysia, Indonesia, and Turkey are more closely correlated to both Chinese credit growth and retail sales growth compared to Italy, Japan, and France. The same conclusion is reached when we look at the correlations between Chinese credit growth or consumption growth and individual MSCI sectors such as industrials and consumer discretionary (Chart 12).
Chart 12
The relatively stronger correlation between Chinese credit growth and equity returns – as opposed to Chinese retail sales and equity returns – can be put down to the nature of Chinese imports. While industrial goods account for the bulk of China’s purchases of foreign goods, consumer goods excluding autos make up only 15% of China’s imports (Table 4). However, as Chart 12 illustrates, the relationship between China’s retail sales growth and global equities is much tighter in the case of the consumer discretionary sector, whether the latter is compared to global industrials sectors or the overall MSCI index. Table 4Import Composition Of Chinese Imports
China: Stimulating Amid The Trade Talks
China: Stimulating Amid The Trade Talks
Equity market exposure to China is not always in line with the extent of each country’s trade exposure to China (Chart 13).
Chart 13
There are some clear exceptions – most notably Mexico, which has the highest correlation coefficient with Chinese credit and consumption variables since 2010. However, this is likely due to idiosyncratic factors.4 Correlation does not imply causation, and we cannot conclude with certainty that Mexican equities will outperform amid China’s new round of stimulus. Nevertheless, given that Mexico is a very deeply liquid market that benefits amid EM bull markets, this may not be entirely coincidental. The correlations between global equity markets and Chinese credit peak two months after the stimulus measures are first implemented (Chart 14). This is more or less in line with adjusted total social financing’s correlation versus industrial metals. However, BCA’s Commodity & Energy Strategy has shown that copper’s correlations versus other measures of Chinese money and credit peak after roughly three quarters (Chart 15).5 This is evident in both the 2012 and 2015-16 stimulus episodes in which the bottom in copper prices lagged the bottom in China’s credit growth. Thus we may witness a rebound in equity markets on the back of China’s credit splurge before we see an improvement in annual returns on copper prices.
Chart 14
Chart 15Copper Rallies Lag China Credit Stimulus
Copper Rallies Lag China Credit Stimulus
Copper Rallies Lag China Credit Stimulus
Bottom Line: South Korean and Russian equities are best positioned to benefit from the positive surprise in China’s credit data. France and Italy are the worst positioned. Copper prices will rebound with a delay. Investment Implications BCA’s Geopolitical Strategy recommends that investors stay long Chinese equities ex-tech relative to the emerging market benchmark. This is a tactical call initiated in August 2018 that is now becoming a cyclical call on the basis of the credit upswing. We also remain long the “China Play Index,” a basket of China-sensitive assets. A rebound in China’s credit data and stronger global growth will support copper demand. Prices are still 15% below the mid-2018 peak and are poised to benefit in this environment, especially given that global inventories are already falling. BCA’s Geopolitical Strategy recommends that investors go long copper. Meanwhile, BCA’s China Investment Strategy recommends (for now) staying only tactically overweight Chinese equities relative to the global benchmark, pending higher conviction that the pace of credit growth will be strong enough to overwhelm the negative ramifications of a continued deceleration in actual activity over the coming few months on sentiment and 12-month forward earnings expectations. Over the long run, Geopolitical Strategy would look to underweight Chinese equities, as we are not optimistic about China’s productivity and potential GDP. This is because of the negative structural consequences of continuing the Socialist Put (i.e., bad loans, zombie companies, trade protectionism). We would expect CNY/USD to remain relatively buoyant in the context of both trade negotiations with the U.S. and fiscal-and-credit stimulus. The trade talks can hardly succeed if CNY/USD is falling. Depending on whether and how soon China’s stimulus results in a durable economic bottom, global growth could stabilize and the USD could see a substantial countertrend selloff. Matt Gertken, Vice President Geopolitical Strategy mattg@bcaresearch.com Roukaya Ibrahim, Editor/Strategist roukayai@bcaresearch.com Footnotes 1 Please see Emerging Markets Strategy Special Report titled “China: Prepping A Bazooka?” dated February 14, 2019 available at ems.bcaresearch.com 2 Please see Nicholas Lardy, “The State Strikes Back: The End Of Economic Reform In China?” Peterson Institute For International Economics, January 29, 2019, available at piie.com. 3 Please see Emerging Markets Strategy Weekly Report titled “Dissecting China’s Stimulus,” dated January 17, 2019 available at ems.bcaresearch.com 4 The 2012 election of President Enrique Peña Nieto caused Mexican equities to outperform their EM counterparts. Similarly in 2015-16, U.S. outperformance relative to EM also supported Mexico relative to EM because Mexico’s economy is highly leveraged to its northern neighbor. In both periods Mexico’s outperformance was not caused by – but instead coincided with – Chinese credit stimulus. These idiosyncratic events biased the correlation between Mexico’s equity markets and Chinese credit growth to the upside. 5 Please see Commodity & Energy Strategy Weekly Report titled “Trade Wars, China Credit Policy Will Roil Global Copper Markets,” dated June 21, 2018, available at ces.bcaresearch.com.
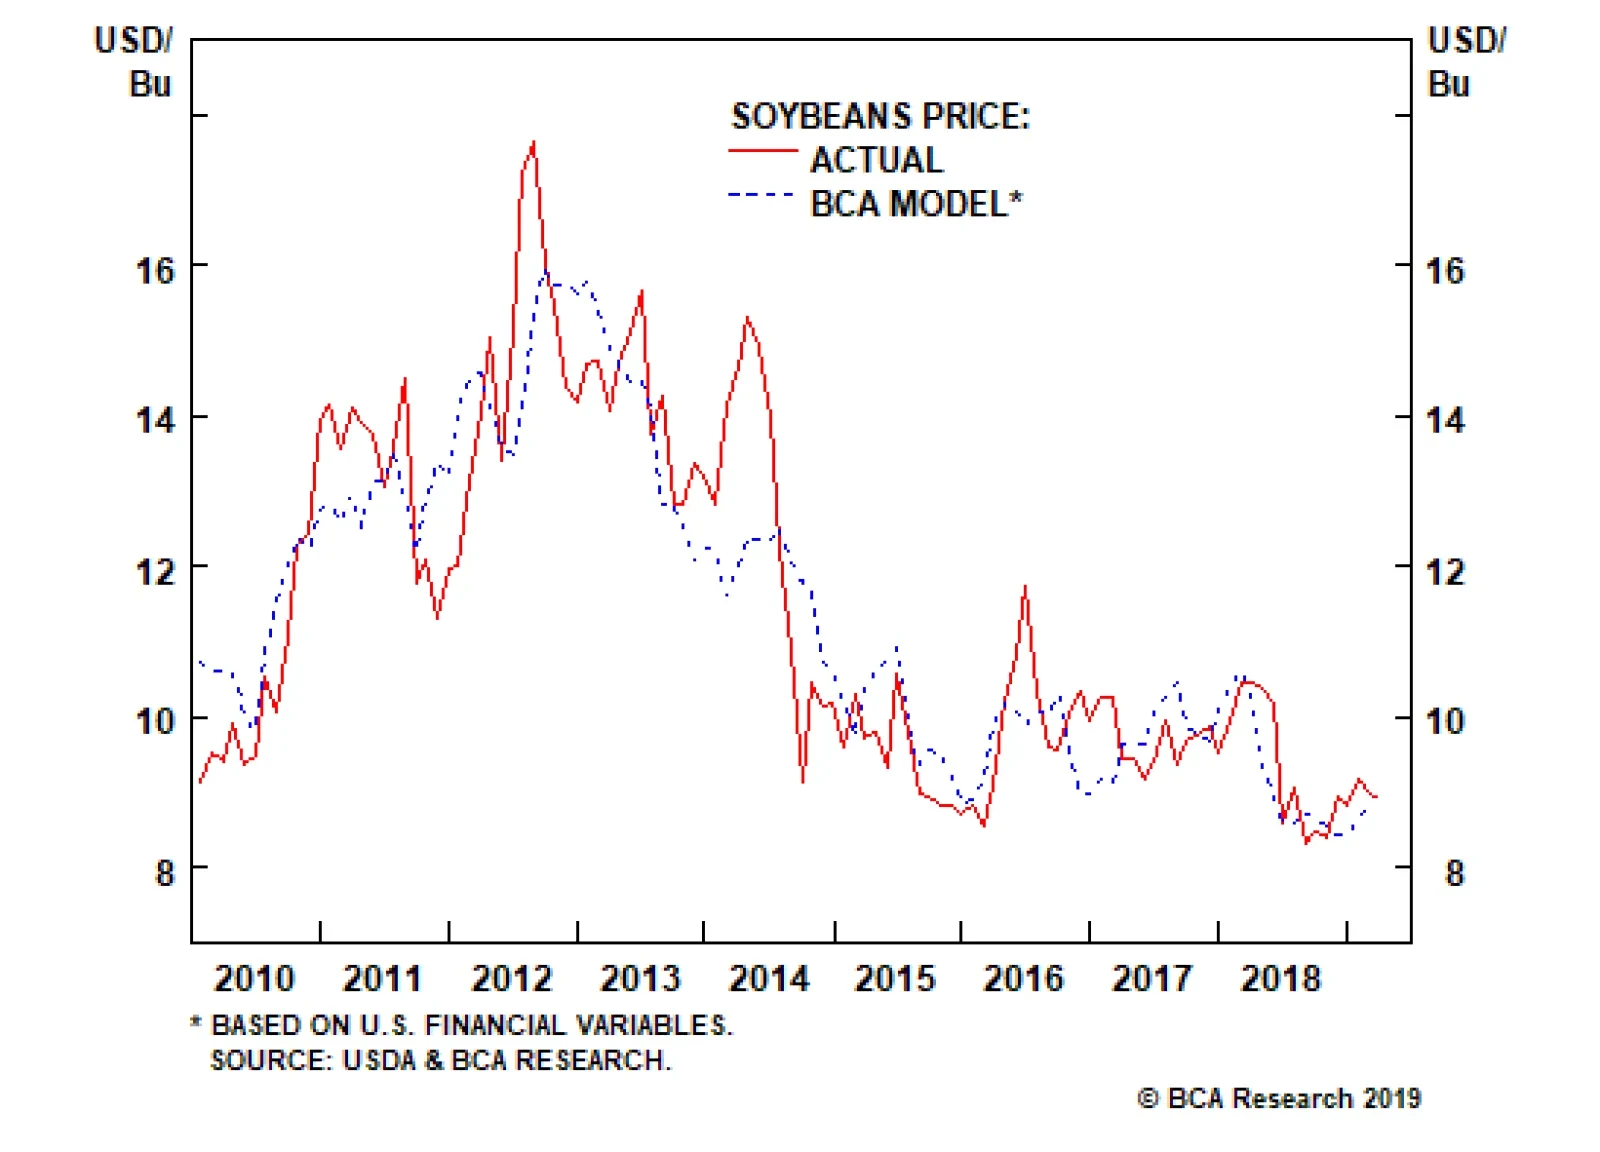
Aside from U.S. financial conditions and supply-demand balances, U.S. trade policy has also been roiling ag markets since China slapped U.S. soybeans with 25% tariffs in mid-2018. In fact, since the escalation of the trade dispute, soybean prices have been…