Emerging Markets

Highlights Global equities and other risk assets will trade sideways with elevated volatility over the coming weeks before grinding higher for the remainder of the year, as global growth finally accelerates after a series of false starts. We now see the Fed raising rates more slowly than we had previously envisioned, but ultimately having to scramble to hike rates in order to quell inflation. The fed funds rate will probably plateau at 4% in 2021, implying nine quarter-point hikes more than the market is currently discounting. Over a 12-month horizon, investors should overweight global equities, underweight government bonds, and maintain a neutral allocation to cash. The dollar will peak in the second quarter and then weaken over the remainder of the year and into 2020, before starting to strengthen again late next year. Investors should prepare to temporarily upgrade EM and European stocks over the coming weeks, while increasing exposure to cyclical equity sectors. Industrial metals and oil will strengthen over the course of the year. Gold should be bought on any dip. Investors should begin to de-risk their portfolios in late-2020 in anticipation of a recession in 2021.
Chart 001
Feature Here We Go Again? After having become more defensive last June, we turned bullish on stocks following the December post-FOMC meeting plunge. As stocks continued to rebound, we tempered our optimism. In the beginning of March, we wrote that “having rallied since the start of the year, global stocks will likely enter a ‘dead zone’ over the next six-to-eight weeks as investors nervously await the proverbial green shoots to sprout.”1 Last Friday’s release of disappointing European PMI data poured some herbicide on the green shoots thesis. Germany’s manufacturing PMI hit a six-year low, with the new orders component registering the weakest reading since the Great Recession. This took the 10-year German bund yield into negative territory for the first time since 2016. The U.S. 10-year Treasury yield also fell to a 15-month low, causing the 3-month/10-year curve to invert. Historically, an inverted yield curve has been a reliable predictor of U.S. recessions (Chart 1). Chart 1Yield Curve Inversions, Recessions, And The Term Premium
Yield Curve Inversions, Recessions, And The Term Premium
Yield Curve Inversions, Recessions, And The Term Premium
President Trump’s decision to appoint TV commentator Stephen Moore to the Fed’s Board of Governors did not help matters. Recommended by fellow supply-side “economist” Larry Kudlow, Moore is best known for dismissing concerns over the state of the housing market in 2007, his spot-on 2010 prediction that QE would cause hyperinflation, and his belief that the Trump tax cuts would lead to a smaller budget deficit. Global Growth Will Accelerate In The Second Half Of The Year Given all these worrisome developments, is it time to turn cyclically bearish on the economic outlook and risk assets again? We do not think so. While the next few weeks could be challenging for equities – a risk that our MacroQuant model is currently flagging – sentiment should improve as global growth finally accelerates after a series of false starts. Indeed, some positive signs are already visible: The diffusion index of our global leading economic indicator, which tracks the share of countries with rising LEIs, has moved higher (Chart 2). It leads the global LEI. Service sector PMIs have also generally improved, suggesting that the weakness in global growth remains concentrated in trade and manufacturing. And even on the trade front, a few forward-looking indicators such as the Baltic Dry Index and the weekly Harpex shipping index, which measures global container shipping activity, have bounced off their lows. We would downplay the signal from the yield curve, as it currently is severely distorted by a negative term premium. If the 10-year Treasury term premium were back to where it was in 2004, the 3-month/10-year slope would be more than 200 bps steeper, and nobody would be talking about this issue. In fact, given today’s term premium, the curve would have almost certainly inverted in 1995. Anyone who got out of stocks back then would have missed out on one of the greatest bull markets in history. It should also go without saying that some of the decline in the U.S. 10-year yield reflects a positive development: The Fed has turned more dovish! If one looks at the 10-year/30-year portion of the yield curve, it has actually steepened. This is a sign that the market is seeing the Fed’s actions as being reflationary in nature. There is no clear causal mechanism by which an inverted yield curve slows economic activity, apart from it potentially becoming a self-fulfilling prophecy where the yield-curve inversion scares investors, thereby leading to a tightening in financial conditions (Chart 3). Such “doom loops” are conceptually possible, but as we discussed earlier this year, they are unlikely to occur in the current environment.2 At any rate, financial conditions have eased since the start of the year. This should boost growth in the coming months. Chart 2Global Growth May Be ##br##Starting To Stabilize
Global Growth May Be Starting To Stabilize
Global Growth May Be Starting To Stabilize
Chart 3Easier Financial Conditions Since The Start Of The Year Bode Well For Global Growth
Easier Financial Conditions Since The Start Of The Year Bode Well For Global Growth
Easier Financial Conditions Since The Start Of The Year Bode Well For Global Growth
Chinese Credit Growth Set To Rise Global growth has been weighed down by a slowing Chinese economy. Last year’s deleveraging campaign led to a significant deceleration in investment spending, which had negative repercussions for capital equipment and commodity producers all over the world (Chart 4). Historically, China has loosened the reins on the financial sector whenever credit growth has fallen towards nominal GDP growth (Chart 5). It appears we have reached this point. Despite a weak seasonally-distorted February print, credit growth has finally accelerated on a year-over-year basis. Chart 4China: The Deleveraging Campaign Had Adverse Effects On Investment Spending
China: The Deleveraging Campaign Had Adverse Effects On Investment Spending
China: The Deleveraging Campaign Had Adverse Effects On Investment Spending
Chart 5Historically, China Has Scaled Back On Deleveraging When Credit Growth Has Fallen Close To Nominal GDP Growth
Historically, China Has Scaled Back On Deleveraging When Credit Growth Has Fallen Close To Nominal GDP Growth
Historically, China Has Scaled Back On Deleveraging When Credit Growth Has Fallen Close To Nominal GDP Growth
We do not expect Chinese credit growth to rise as much as in past releveraging cycles. However, this is because the economy is in better shape, not because there is some intrinsic constraint to increasing debt from current levels. China’s elevated savings rate has kept interest rates well below trend nominal GDP growth, which is the key determinant of debt sustainability (Chart 6).3 As long as the central government maintains an implicit guarantee on most local and corporate debt, as it is currently doing, default risk will remain minimal. In any case, given that total debt stands at 240% of GDP, even a one percentage-point increase in credit growth would generate a hefty 2.4% of GDP in credit stimulus. The Chinese credit impulse leads imports by about six-to-nine months (Chart 7). This bodes well for global trade in the second half of the year. Chart 6China's High Savings Rate Has Kept Interest Rates Well Below Trend Nominal GDP Growth
China's High Savings Rate Has Kept Interest Rates Well Below Trend Nominal GDP Growth
China's High Savings Rate Has Kept Interest Rates Well Below Trend Nominal GDP Growth
Chart 7Global Trade Will Benefit From A Chinese Reflationary Impulse
Global Trade Will Benefit From A Chinese Reflationary Impulse
Global Trade Will Benefit From A Chinese Reflationary Impulse
A Lull In The Trade War? A de-escalation in the trade war would help matters. As a self-professed master negotiator, Donald Trump needs to secure a deal with China before next year‘s presidential election, while also convincing American voters that the agreement was concluded on favorable terms for the United States. Reaching a deal with China early on in his term would have been risky for Trump if it had failed to bring down the bilateral trade deficit – an entirely likely outcome given how pro-cyclical U.S. fiscal policy is. At this point, however, Trump could crow about making a great deal with China while reassuring voters that the product of his brilliance will be realized only after he has been re-elected. Thus, the likelihood that Trump will seek to strike a deal has risen. For their part, the Chinese want as much negotiating leverage as they can muster. This means being able to convincingly demonstrate that their economy is strong enough to handle the repercussions from turning down a trade deal that fails to serve their interests. Since the credit cycle is the dominant driver of Chinese growth, this requires putting the deleveraging campaign on the backburner. Faster Global Growth And Stronger Domestic Demand Will Benefit Europe Stronger Chinese growth will help the European export sector later this year. The export component of the Chinese Caixin PMI has moved up from its lows. It leads the euro area PMI by about three months. Meanwhile, euro area domestic demand will benefit from a more accommodative fiscal policy and lower bond yields. The decline in bond yields will be especially helpful to Italy. The spike in yields and loss of business confidence following the election of a populist government last March plunged the economy into recession (Chart 8). Now that the 10-year BTP yield has fallen more than 100 bps from its highs, the Italian economy should start to perk up. The ECB will not raise rates this year even if domestic growth speeds up, but the market will probably price in a few rate hikes in 2020 and beyond. This will allow for a modest re-steepening of yield curves in core European bond markets, which should be positive for long-suffering bank profits. Brexit remains a concern. The ongoing saga has reached the farcical stage where: 1) The U.K. has voted to leave the EU; but 2) Parliament has voted to stay in the EU unless it reaches a satisfactory deal with Brussels; while 3) rejecting the only deal with Brussels that was on offer. Given that most British voters no longer want Brexit (Chart 9), we think that the government will kick the proverbial can down the road until a second referendum is announced or a “soft Brexit” deal is formulated. Either outcome would be welcomed by markets. Chart 8Italian Bond Yields Are A Headwind No More
Italian Bond Yields Are A Headwind No More
Italian Bond Yields Are A Headwind No More
Chart 9U.K.: In The Case Of A Do-Over, The Remain Side Would Likely Win
U.K.: In The Case Of A Do-Over, The Remain Side Would Likely Win
U.K.: In The Case Of A Do-Over, The Remain Side Would Likely Win
What Will The Fed Do?
Chart 10
Last year’s “Christmas Crash” clearly shifted the Fed’s reaction function in a more dovish direction. We do not expect Jay Powell to raise rates over the next few months, but a reacceleration in global growth is likely to prompt the Fed to tighten anew in December. The Fed will continue raising rates once per quarter in 2020, before accelerating the pace of tightening in 2021 in response to rising inflation. In all, we see the fed funds rate increasing to around 4% by the end of this cycle. This represents nine quarter-point hikes more than the market is currently discounting (Chart 10). We were stopped out of our short fed funds futures trade, but we recommend that clients short the June-2021 fed funds futures or a similar instrument. The U.S. Economy: Great Again Fundamentally, the U.S. economy is on solid ground and can handle higher interest rates. Unlike a decade ago, the housing market is in good shape (Chart 11). The homeowner vacancy rate stands near a record low. Judging by FICO scores, the quality of mortgage lending remains high. The labor market is also firm, with job openings hitting another record high in February (Chart 12). The combination of a healthy housing and labor market is invariably good for consumers. Chart 11U.S. Housing Fundamentals Are Solid
U.S. Housing Fundamentals Are Solid
U.S. Housing Fundamentals Are Solid
Chart 12The U.S. Labor Market Is Firm
The U.S. Labor Market Is Firm
The U.S. Labor Market Is Firm
Chart 13
The personal savings rate currently stands at 7.6%, notably higher than one would expect based on the ratio of household net worth-to-disposable income (Chart 13). A decline in the savings rate would allow consumer spending to increase more quickly than income. With the latter being propped up by rising wages, this will be bullish for consumption. Capital spending intentions have dipped over the past few months, but remain elevated by historic standards (Chart 14). The real nonresidential capital stock has grown by an average of only 1.7% since the start of the recovery, down from 3% in the pre-recession period (Chart 15). A cyclical upswing in productivity growth, rising labor costs, and low levels of spare capacity should all motivate businesses to invest in new plant and equipment. Chart 14Capital Spending Intentions Have Softened, But Remain Elevated
Capital Spending Intentions Have Softened, But Remain Elevated
Capital Spending Intentions Have Softened, But Remain Elevated
Chart 15There Is Room For More U.S. Capital Investment
There Is Room For More U.S. Capital Investment
There Is Room For More U.S. Capital Investment
Corporate Debt: How Much Of A Risk? Chart 16U.S. Corporate Debt Is Not Extreme By Global Standards
U.S. Corporate Debt Is Not Extreme By Global Standards
U.S. Corporate Debt Is Not Extreme By Global Standards
Corporate debt levels have increased significantly in recent years, while underwriting standards have deteriorated, as evidenced by the proliferation of covenant-lite loans. Nevertheless, the situation is far from dire. Relative to other countries, U.S. corporate debt is quite low (Chart 16). At 143% of GDP, corporate debt in France is twice that of the United States. This is not to suggest that everything is fine in the French corporate sector; but the fact is that France has not had a corporate debt crisis. This signals that the U.S. is not at imminent risk of one either. Netting out cash, U.S. corporate debt as a share of GDP is at the same level it was in 1989, a year in which the fed funds rate was close to nine percent. The ratio of corporate net debt-to-EBITD remains reasonably low. The interest coverage ratio is above its historic average. In addition, corporate assets have also risen quite briskly over the past few years, which has kept the corporate debt-to-asset ratio broadly stable (Chart 17). The corporate sector financial balance – the difference between corporate income and spending – is still in positive territory at 1% of GDP. Every recession in the past 50 years began when the corporate sector financial balance was in deficit (Chart 18). Chart 17U.S. Corporate Debt: How High?
U.S. Corporate Debt: How High?
U.S. Corporate Debt: How High?
Chart 18Corporate Sector Financial Balance Still In Surplus
Corporate Sector Financial Balance Still In Surplus
Corporate Sector Financial Balance Still In Surplus
Unlike mortgages, which are often held by leveraged institutions, most corporate debt is held by unleveraged players such as pension funds, insurance companies, mutual funds, and ETFs. Bank loans account for only 18% of nonfinancial corporate sector debt, down from 40% in 1980 (Chart 19). The share of leveraged loans held by banks has declined from about 25% a decade ago to less than 10% today. Moreover, banks today hold much more high-quality capital than in the past (Chart 20). This makes corporate debt less systemically important for the economy. Chart 19Banks Have Reduced Their Exposure To The Corporate Sector
Banks Have Reduced Their Exposure To The Corporate Sector
Banks Have Reduced Their Exposure To The Corporate Sector
Chart 20U.S. Banks Are Well Capitalized
U.S. Banks Are Well Capitalized
U.S. Banks Are Well Capitalized
One of the reasons we turned more bullish on risk assets in December was because stocks had plunged and corporate spreads widened without much follow-through in financial stress indices. For example, the infamous TED spread barely budged (Chart 21). Chart 21TED Spreads Are Well Behaved, Indicating No Major Signs Of Financial Stress
TED Spreads Are Well Behaved, Indicating No Major Signs Of Financial Stress
TED Spreads Are Well Behaved, Indicating No Major Signs Of Financial Stress
Everyone Agrees With Larry Given the lack of major imbalances in the U.S. economy, why do investors believe that the Fed cannot raise rates further even though the Fed funds rate in real terms is barely above zero? The answer is that investors appear to have bought into Larry Summers’ secular stagnation thesis, which posits that the neutral rate of interest is much lower today than it was in the past. We have some sympathy for this thesis, but it is important to remember that it is a theory about the long-term determinants of interest rates such as productivity and demographic trends. The theory says little about the cyclical drivers of interest rates, including the amount of spare capacity in the economy, the stance of fiscal policy, credit growth, and wage trends. Earlier this decade, when we were still very bullish on bonds, one could have plausibly argued that the economy needed extremely low interest rates: The output gap was still large; the deleveraging cycle had just begun; home and equity prices were depressed; wage growth was anemic; and fiscal policy had turned restrictive after a brief burst of stimulus during the Great Recession. Far From Neutral? All of the forces mentioned above have either fully or partially reversed course over the past few years. Take fiscal policy as one example. The IMF estimates that the U.S. structural budget deficit averaged 3.3% of GDP in 2014-15. In 2019-20, the IMF reckons the deficit will average 5.6% of GDP. To what extent has easier fiscal policy raised the U.S. neutral rate of interest? Let us conservatively assume that every $1 of additional fiscal stimulus adds $1 to aggregate demand. In this case, fiscal policy has added 2.3% of GDP to aggregate demand over the past five years. Suppose that a one-percentage point increase in aggregate demand raises the neutral rate of interest by 1%, which is in line with the specification of the Taylor Rule that former Fed Chair Janet Yellen favored. This implies that fiscal policy alone has raised the neutral rate by over two percentage points. The discussion above suggests that cyclical factors may have pushed up the neutral rate considerably, even if long-term structural factors are still dragging it down. Since the Fed is supposed to set interest rates with an eye on what is appropriate for the economy over the next year or two, rates may end up staying too low for too long. This will cause the economy to overheat, eventually leading to a surge in inflation. The Inflation Boogeyman The good news is that none of our favorite indicators point to a major imminent inflationary upswing (Chart 22): Despite higher tariffs, consumer import price inflation has slowed; core intermediate producer price inflation has decelerated; the prices paid components of the ISM and regional Fed surveys have plunged; inflation surprise indices have rolled over; and both survey and market-based measures of inflation expectations remain below where they were last summer. In keeping with these developments, BCA’s proprietary Pipeline Inflation Indicator has fallen to a two-and-a-half-year low. Wage growth has accelerated, but productivity growth has increased by even more. As a result, unit labor cost inflation has been coming down since the middle of last year. Unit labor costs lead core CPI inflation by about 12 months (Chart 23). This implies that consumer price inflation is unlikely to reach uncomfortably high levels at least until the second half of next year. Chart 22No Symptoms of An Imminent Major Inflationary Upswing In The U.S. ...
No Symptoms of An Imminent Major Inflationary Upswing In The U.S. ...
No Symptoms of An Imminent Major Inflationary Upswing In The U.S. ...
Chart 23... And Decelerating Unit Labor Costs Will Dampen Inflationary Pressures For The Time Being
... And Decelerating Unit Labor Costs Will Dampen Inflationary Pressures For The Time Being
... And Decelerating Unit Labor Costs Will Dampen Inflationary Pressures For The Time Being
At that point, risks are high that inflation will move up. This could force the Fed to start raising rates aggressively in early-2021, a course of action that will push up the dollar and cause equities and spread product to sell off. The resulting tightening in financial conditions will probably plunge the U.S. and the rest of the world into recession in mid-to-late 2021. Stay Bullish Global Equities For Now, Turn Defensive Late Next Year Chart 24Analyst Expectations Are Quite Muted
Analyst Expectations Are Quite Muted
Analyst Expectations Are Quite Muted
The two-stage Fed tightening cycle discussed above – gradual rate hikes starting in December and continuing into 2020, and more aggressive hikes thereafter in response to rising inflation – shapes our investment views over the next few years. The Key Financial Market Forecasts Chart at the beginning of this publication provides a rough sketch of where we think the main asset classes are heading. We suspect that equities and other risk assets will be able to digest the first stage of rate tightening, albeit with heightened volatility around the time when the Fed starts preparing the market for another hike later this year. Unlike last September, earnings estimates are much more conservative. Bottom-up estimates foresee EPS rising by 3.9% in the U.S. and 5.4% in the rest of the world in 2019 (Chart 24). The combination of faster growth, easier financial conditions, and ongoing share buybacks implies some upside to these numbers. Perhaps more importantly, unlike in September, the Fed will only start hiking rates if the economy is performing well. Powell erred in saying that “rates were a long way from neutral” just when the U.S. economy was starting to slow. Had he uttered those words when U.S. growth was still accelerating, investors would have probably disregarded them. Jay Powell won’t make the same mistake again. Rather, he will make a different one: He will let the economy overheat to the point where the Fed finds itself clearly behind the curve and forced to scramble to catch up. The resulting stagflationary environment – where growth is slowing due to a shortage of available workers and inflation is on the upswing – will be toxic for equities and other risk assets. While it is difficult to be precise about timing, we recommend that investors maintain a modestly pro-risk stance over the next 12-to-18 months. However, they should pare back exposure to equities and spread product late next year before the Fed ramps up the pace of rate hikes. Prepare To Temporarily Upgrade International Stocks The U.S. stock market tends to be “low beta” compared to other bourses. If global growth accelerates in the second half of this year, international stocks will outperform their U.S. counterparts. We sold our put on the EEM ETF for a gain of 104% on Jan 3rd, and now recommend being outright long EM equities. We will be looking to upgrade both EM and European equities to overweight in the coming weeks in currency-unhedged terms once we see more confirmatory evidence of a global growth revival. We have mixed feeling about Japanese stocks. Stronger global growth will benefit Japanese multinationals, but firms focused on the domestic market may suffer if the government goes ahead and raises the sales tax in October. We would hold off upgrading Japanese stocks for the time being. At the global sector level, we pared back our defensive tilt earlier this year, after having turned more cautious last summer. We recommend that investors overweight energy and industrials. We are also warming up to financials and materials. The former will benefit from a steepening in yield curves later this year as well as from faster credit growth. The latter will gain from a more robust Chinese economy. We would maintain a neutral allocation to health care, info tech, and communication services. Real estate and utilities will both suffer once bond yields start moving higher. Classically defensive sectors such as consumer staples will also underperform. Global Bond Yields Likely To Rise Global bond yields are likely to rise over the next 12-to-18 months as growth surprises on the upside. Yields will continue rising into the first half of 2021 as inflation accelerates. Unlike in past risk-off episodes, Treasurys will not provide much of a safe haven in the lead up to the next recession. As noted above, one of the reasons that bond yields are so low today is because the term premium is very depressed. The cumulative effect of Fed bond purchases has probably depressed the term premium, but the bigger impact has stemmed from the fact that investors see Treasurys as an insurance policy against various macro risks. Investors are accustomed to thinking that when an economy slides into recession, equity prices will fall, the housing market will deteriorate, wage gains will recede, job prospects will worsen, but at least the value of their bond portfolio will go up! The problem with this reasoning is that it is only valid when the Fed is hiking rates in response to stronger growth. If the Fed is hiking rates because inflation is getting out of hand, Treasury yields could end up rising while stocks are falling. This was actually the norm between the late-1960s and early-2000s (Chart 25). Chart 25Treasury Yields Could Rise While Stocks Fall
Treasury Yields Could Rise While Stocks Fall
Treasury Yields Could Rise While Stocks Fall
If Treasurys lose their safe-haven status, the term premium will move higher. A vicious circle could develop where rising bond yields weaken the stock market, causing investors to flood out of both stocks and bonds and into cash, leading to even higher bond yields and lower equity prices. Investors should maintain a modest short duration stance towards Treasurys over the next 12 months, and then move to maximum underweight duration in mid-2020 as inflation starts to break out. Going long duration will only make sense once the Fed has raised interest rates into restrictive territory and the economy slides into recession. That is not likely to occur until the second half of 2021. Regionally, we favor European, Canadian, Australian, New Zealand, and especially Japanese government bonds over the next 12 months relative to U.S. Treasurys. The U.S. economy is at the greatest risk of overheating. In currency-hedged terms, the 10-year U.S. Treasury yield is among the lowest in the world (Table 1). Japanese 10-year bonds, for example, offer 2.72% in currency-hedged terms, while German bunds command 2.94%. Table 1Bond Markets Across The Developed World
Second Quarter 2019 Strategy Outlook: From Dead Zone To End Zone
Second Quarter 2019 Strategy Outlook: From Dead Zone To End Zone
The U.S. Dollar: Heading Towards A Soft Patch Gauging the outlook for the U.S. dollar is a bit tricky. Even though the Fed will only be raising rates gradually over the next 12 months, it will still hike more than what is discounted by markets. With most other central banks still sitting on the sidelines, short-term rate differentials are likely to move in favor of the greenback. That said, aside from Japan, stronger global growth will likely prompt investors to price in a few more rate hikes in other developed economies in 2020 and beyond. Consequently, long-term yield differentials may not widen by as much as short-term differentials. Perhaps more importantly, the U.S. dollar is a countercyclical currency, meaning that it moves in the opposite direction of global growth (Chart 26). This countercyclicality stems from the fact that the U.S. economy is more geared towards services than manufacturing compared with the rest of the world (Chart 27). As such, when global growth accelerates, capital tends to flow from the U.S. to the rest of the world, translating into more demand for foreign currency and less demand for dollars. Chart 26The Dollar Is A Countercyclical Currency
The Dollar Is A Countercyclical Currency
The Dollar Is A Countercyclical Currency
Chart 27The U.S. Is A Low-Beta Play On Global Growth
The U.S. Is A Low-Beta Play On Global Growth
The U.S. Is A Low-Beta Play On Global Growth
If global growth picks up in the back half of this year, the dollar will likely peak in the second quarter and weaken over the remainder of 2019 and into 2020. The dollar’s trajectory may thus follow a similar course to the one in 2017, a year in which the Fed raised rates four times, but the broad trade-weighted dollar nevertheless managed to weaken by 7%. Chart 28The Yen Is A Risk-Off Currency
The Yen Is A Risk-Off Currency
The Yen Is A Risk-Off Currency
As was the case in 2017, the euro will probably gain ground later this year against the U.S. dollar as will most EM and commodity currencies. However, just as the Japanese yen failed to participate in the rally that most currencies experienced against the dollar in 2017, it will struggle to gain much traction against the greenback. The yen is a “risk-off” currency and thus tends to fall whenever global risk assets rally (Chart 28). In addition, the yen will suffer if global bond yields move up relative to JGB yields later this year, as will likely be the case if the BoJ is forced to prolong its yield curve control regime in the face of tighter fiscal policy. We would go long EUR/JPY on any break below 123. After First Weakening, The Dollar Will Rally Again Late Next Year As the U.S. economy encounters ever more supply-side constraints in 2020, growth will slow and inflation will accelerate. The Fed will respond by hiking rates more quickly than inflation is rising. The resulting increase in real interest rates will put upward pressure on the dollar. In this stagflationary environment, equities will tumble and credit spreads will widen. Tighter U.S. financial conditions will reverberate around the world, causing global growth to decelerate even more than it would have otherwise. This will further turbocharge the dollar. The greenback will only peak once the Fed starts cutting rates in late-2021. Commodities: Getting More Bullish A weaker dollar later this year, along with stronger global growth led by a resurgent China, will be bullish for commodities. BCA’s commodity strategists recommend going long copper at current prices. They are also maintaining their bullish bias towards oil. They expect Brent to average $75/bbl this year and $80/bbl in 2020. Higher U.S. shale output will be offset by delays in building out deepwater export facilities, which will keep supply fairly tight. In past reports, we discussed the merits of buying gold as an inflation hedge. However, we held back from doing so because of our bullish dollar view. Now that we see the dollar peaking over the next few months, we would be buyers of gold on any break below $1275/ounce. Peter Berezin, Chief Global Strategist Global Investment Strategy peterb@bcaresearch.com Footnotes 1 Please see Global Investment Strategy Weekly Report, “Gretzky’s Doctrine,” dated March 1, 2019. 2 Please see Global Investment Strategy Weekly Report, “Low Odds Of An FCI Doom Loop,” dated January 4, 2019. 3 Please see Global Investment Strategy Weekly Report, “Is There Really Too Much Government Debt In The World?” dated February 22, 2019. Strategy & Market Trends MacroQuant Model And Current Subjective Scores
Chart 29
Tactical Trades Strategic Recommendations Closed Trades
Highlights Just when it looked like the agricultural complex was starting to perk up, it was slapped down again. After crawling its way back from a mid-2018 crash – retracing more than half of its decline – the CCI Grains and Oilseeds index plummeted in February, declining by nearly 9% (Chart Of The Week). The decline was broad-based, but was led by wheat, which was dragged down by muted demand and accounted for most of the index’s decline. Looking forward, we expect U.S. financial conditions and developments on the trade-war front to remain the main forces driving ag prices. Ample inventories will provide the cushion necessary to moderate the impact of potential supply-side shocks. Highlights Energy: Overweight. Venezuela suffered another power outage earlier this week, indicating the deterioration of its infrastructure is accelerating. While officials claim to have restored power, we expect more such outages going forward, which will severely reduce the country’s production and export capacity. Separately, Aramco announced it will buy 70% of Sabic, a Saudi state-owned petchem producer, for $69 billion, according to the Wall Street Journal. Base Metals: Neutral. China’s MMG Ltd was set to declare force majeure following protests at its Las Bambas mine in Peru earlier this week. The mine produces ~ 385k MT p.a., most of which goes to China. Precious Metals: Neutral. The inversion of the U.S. yield curve put a bid into the gold market this week, as investors sought a safe-haven refuge. Continued weakness in bond yields, and accommodative central banks responding to low inflation expectations globally will continue to support gold. Agriculture: Underweight. A more patient Fed will be supportive of ag prices in 2H19, as we discuss below. Feature Chart of the WeekWheat Had A Rough Start To 2019
Wheat Had A Rough Start To 2019
Wheat Had A Rough Start To 2019
A Patient Fed Will Support Ags In 2H19 While differences across ag markets will arise due to idiosyncratic supply shocks and targeted trade policies, a common determinant of ag price movements more generally is U.S. financial conditions. Since our last assessment of global ag markets, Fed policymakers have adopted a much more patient approach to monetary policy.1 In line with the pause in the Fed’s rates-normalization policy, financial conditions have eased considerably (Chart 2). We believe this will, ceteris paribus, bring relief to commodity markets in general, ags in particular, in the second half of this year. Chart 2Easier Financial Conditions Bode Well For Ags
Easier Financial Conditions Bode Well For Ags
Easier Financial Conditions Bode Well For Ags
The bulk of this relief will be transmitted through the impact of a weaker dollar. Since the dollar is a countercyclical currency, its weakness implies an improvement in global growth. This more solid economic backdrop is associated with greater aggregate demand, particularly in EM economies, as well as demand for agricultural products. The lagged effects of financial tightening, weak Chinese credit growth and the trade war will persist in 2Q19. Furthermore, when the USD weakens against the currencies of ag exporting countries, farmers there are incentivized to hoard or cut exports – thus reducing supply – awaiting periods when a stronger greenback will raise their profits. At the same time, ags priced in USD become relatively more affordable for importing nations, incentivizing them to raise consumption. The net impact of this contraction in supply amid greater demand will pull up prices – illustrated by the relatively tight inverse relationship between ag prices and the dollar (Chart 3). Chart 3A Weaker USD Will Be A Tailwind In 2H19
A Weaker USD Will Be A Tailwind In 2H19
A Weaker USD Will Be A Tailwind In 2H19
Going into mid-2019, we expect global economic indicators to continue to be uninspiring. The lagged effects of financial tightening, weak Chinese credit growth and the trade war will persist in 2Q19. However, as these factors fade and give way to an improvement in global economic conditions and easier financial conditions, we expect the dollar to peak around mid-year. As such, a resurgence in global growth in the second half of the year will be reflected in an improvement in the value of the currencies of major ag exporters ex-U.S. (Chart 4). Ceteris paribus, this also benefits ag prices. Chart 4Weak Local Currencies Supporting Farm Profits, Incentivizing Production
Weak Local Currencies Supporting Farm Profits, Incentivizing Production
Weak Local Currencies Supporting Farm Profits, Incentivizing Production
China’s Economy Remains Central Our outlook hinges on developments in the Chinese economy. Peter Berezin – our Chief Global Investment Strategist – expects Chinese authorities to not only stabilize credit growth, but also increase it, creating room for improvement in the world’s second largest economy.2 This combination of supportive global growth and a softer dollar bodes well for ag prices in 2H19. The Fed pause and associated easing in U.S. financial conditions will support global growth, causing the U.S. dollar to weaken – a bullish force for ag markets. Apart from the currency impact, easy financial conditions are supportive of global growth. A rise in income levels of emerging economies will support demand for goods and services generally, and agricultural commodities specifically.3 The market now expects 36 and 51 basis points of rate cuts over the coming 12 and 24 months, respectively. Similarly, following last week’s FOMC meeting, the median Fed dot indicates no rate hikes this year from the U.S. central bank, and only one in 2020. While our Global Investment Strategists would not be surprised to see a hike this year, the noticeably less hawkish tone in the Fed’s forward guidance and dot plots are positive for ag markets.4 Looking beyond that into late-2020 or early 2021, a potential pick-up in inflation will force the Fed to take a more hawkish stance, and once again support the U.S. dollar. This will weigh down on ag prices over the strategic time horizon. Bottom Line: The Fed pause and associated easing in U.S. financial conditions will support global growth, causing the U.S. dollar to weaken – a bullish force for ag markets. However, this is unlikely to occur before mid-year. In the meantime, a stronger dollar on the back of the lagged effects of growth dampening events in 2018, will remain a headwind. Ample Inventories Will Cushion Against Supply Shocks Putting aside the more or less uniform impact of U.S. financial conditions, individual supply-demand fundamentals will manifest as idiosyncratic risks and opportunities. The USDA has been revising its projections for ending stocks higher in its monthly World Agricultural Supply and Demand Estimates (WASDE) across the board since it released the first projections for the 2018/2019 crop year last May. However, we find that solely on the back of fundamentals, soybeans are more likely to resist upward pressure from easier U.S. financial conditions in 2H19 vs. wheat and corn. The USDA’s latest projections for the current crop year indicate that global bean markets are well supplied. Expectations of a global surplus this crop year – for the seventh consecutive year – will add to the growing cushion (Chart 5). Chart 5Beans Surplus Will Add To the Glut
Beans Surplus Will Add To the Glut
Beans Surplus Will Add To the Glut
Since May, global ending bean stocks have been revised higher by a total of 20.47mm MT. The change in projections comes on the back of upward revisions to production and beginning stocks, compounded by downward revisions to consumption. The latter will likely contract further if the U.S. and China do not reach an agreement on the trade front (see below). Consequently, unless a weather disruption weakens supply, we expect soybean inventories to stand at record highs relative to consumption at the end of the current crop year. In the case of wheat, the impact on prices will likely be marginal. The global balance is expected to shift to a deficit in the current marketing year, following five years of surplus (Chart 6). While this is a positive for wheat prices, given that global inventory levels are relatively elevated – capable of supporting 37% of consumption – and the current deficit is relatively small, we do not expect the deficit to pressure prices in the near term. Chart 6Elevated Wheat Inventories Will Cushion Against Minor Deficit
Elevated Wheat Inventories Will Cushion Against Minor Deficit
Elevated Wheat Inventories Will Cushion Against Minor Deficit
Despite continued downward revisions to the USDA’s wheat production projections, expectations of ending stocks have actually risen on the back of downward revisions to consumption. Similarly, corn fundamentals are also unlikely to sway prices much. The grain is expected to remain in deficit for the second consecutive year, which will pull inventories down off their 2016/17 peak to be capable of covering ~27% of global consumption (Chart 7). Despite this contraction in availability, global supplies remain relatively elevated, especially compared to the 2003 to 2012 period. Thus unless there is a significant supply shock, we don’t expect much support from fundamentals. Chart 7A Global Corn Deficit ...
A Global Corn Deficit ...
A Global Corn Deficit ...
Unlike wheat demand, which has been downgraded, the USDA has revised corn consumption up relative to the first projections for the crop year released last May. Nevertheless, stronger expectations of consumption have been overwhelmed by upward revisions to production and beginning inventory levels. Given that world inventories already are bloated, we do not expect the likely deficit in wheat and corn supplies this crop year to pressure prices much to the upside. Since the mid-1990s, U.S. farmers had been planting more corn and wheat at the expense of soybean acreage (Chart 8). On a global level, while wheat remains more popular in terms of acreage, it is generally trending downwards, while corn and soybean plantings are trending up. However, over the longer term, U.S. farmers are expected to dedicate more land to corn relative to soybeans. Chart 8... Will Be Met By Rising U.S. Acreage
... Will Be Met By Rising U.S. Acreage
... Will Be Met By Rising U.S. Acreage
Bottom Line: Given that world inventories already are bloated, we do not expect the likely deficit in wheat and corn supplies this crop year to pressure prices much to the upside. Similarly, a global glut in soybean supplies will only add to swelling inventories. The Trade War And Soybeans: It Ain’t Over Till It’s Over Aside from U.S. financial conditions and supply-demand balances, U.S. trade policy has also been roiling ag markets since China slapped U.S. soybeans with 25% tariffs in mid-2018. In fact, since the escalation of the trade dispute, soybean prices have been moving largely in response to developments on the trade front (Chart 9). As developments since the G20 Summit in Buenos Aires last December have been more favorable, soybean markets are on the path to recovery. Chart 9Markets Optimistic Of A Trade War Resolution
Markets Optimistic Of A Trade War Resolution
Markets Optimistic Of A Trade War Resolution
So far, even though U.S. soybean exports to China picked up over the past two months, total U.S. exports still lag levels typical for this time of year (Chart 10). This comes despite U.S. efforts to raise shipments to other trading partners. Furthermore, U.S. exports will now be in direct competition with the Brazilian crop, which usually dominates trade flows at this time of year (Chart 11).
Chart 10
While the U.S. tariff hike from 10% to 25% on $200bn of Chinese goods has been postponed, a resolution to the trade war has yet to occur. The path to a resolution is fraught with risks.
Chart 11
While the U.S. tariff hike from 10% to 25% on $200bn of Chinese goods has been postponed, a resolution to the trade war has yet to occur. The path to a resolution is fraught with risks. The Trump-Xi meeting that was expected to occur in late-March was postponed; the next most likely date for a meeting is at the G20 summit in end-June. This leaves another 3 months of trade uncertainty. Nevertheless, our models indicate that soybeans are now priced at fair value, based on U.S. financial variables – absent a trade war (Chart 12).
Chart 12
Furthermore, the premium priced into Brazilian beans above those traded on the CBOT has returned to its historical average (Chart 13). Thus, we do not expect a further reduction in the premium in the event Sino-U.S. trade negotiations are successful. Chart 13Premium For Brazilian Beans Has Normalized
Premium For Brazilian Beans Has Normalized
Premium For Brazilian Beans Has Normalized
Rather, markets will be disappointed if the U.S. and China are unable to conclude a deal. This would put CBOT prices at risk and support the premium on those traded in Brazil. Given that our geopolitical strategists assign a non-negligible 30% probability that the trade war escalates further, we believe markets are overly optimistic that a deal will be concluded.5 If the trade war drags on and turns into a multi-year conflict, soybean markets will likely take a more meaningful hit. According to the USDA’s latest long-term projections released earlier this month, China’s soybean imports were projected to rise 32.1mm MT during the 2018-28 period – a massive downward revision from the 46mm MT expected for the 2017-2027 period contained in the previous long-run projections. Furthermore, outbreaks of African swine fever in China may put demand there at risk. Over 100 cases have so far been reported in China, with several cases already reported in Vietnam as well. This threatens to depress China’s need for soybean as animal feed, regardless of what happens on the trade front. Bottom Line: A positive outcome from the U.S.-China trade negotiations is not a given. Nevertheless, soybean markets are treating it as such. Our geopolitical strategists assign 30% odds that a final deal falls through. This non-negligible probability threatens to cause soybean prices to relapse anew, should Sino-U.S. trade negotiations break down. Roukaya Ibrahim, Editor/Strategist Commodity & Energy Strategy RoukayaI@bcaresearch.com Footnotes 1 Please see “2019 Key Views: Policy-Induced Volatility Will Drive Markets,” published by BCA Research’s Commodity & Energy Strategy December 13, 2018. It is available at ces.bcaresearch.com. 2 Please see BCA Research’s Global Investment Strategy Weekly Report titled “What’s Next For The Dollar,” dated March 15, 2019, available at gis.bcaresearch.com. 3 Please see BCA Research’s Commodity & Energy Strategy Weekly Report titled “Global Financial Conditions Will Drive Grain Prices In 2018,” dated November 30, 2017, available at ces.bcaresearch.com. 4 Please see BCA Research’s Global Investment Strategy Weekly Report titled “Questions From The Road,” dated March 22, 2019, available at gis.bcaresearch.com. 5 Please see BCA Research’s Geopolitical Strategy Special Report titled “China-U.S. Trade: A Structural Deal?,” dated March 6, 2019, available at gps.bcaresearch.com. Investment Views and Themes Recommendations Strategic Recommendations Tactical Trades Commodity Prices and Plays Reference Table Trades Closed in 2019 Summary of Trades
Image
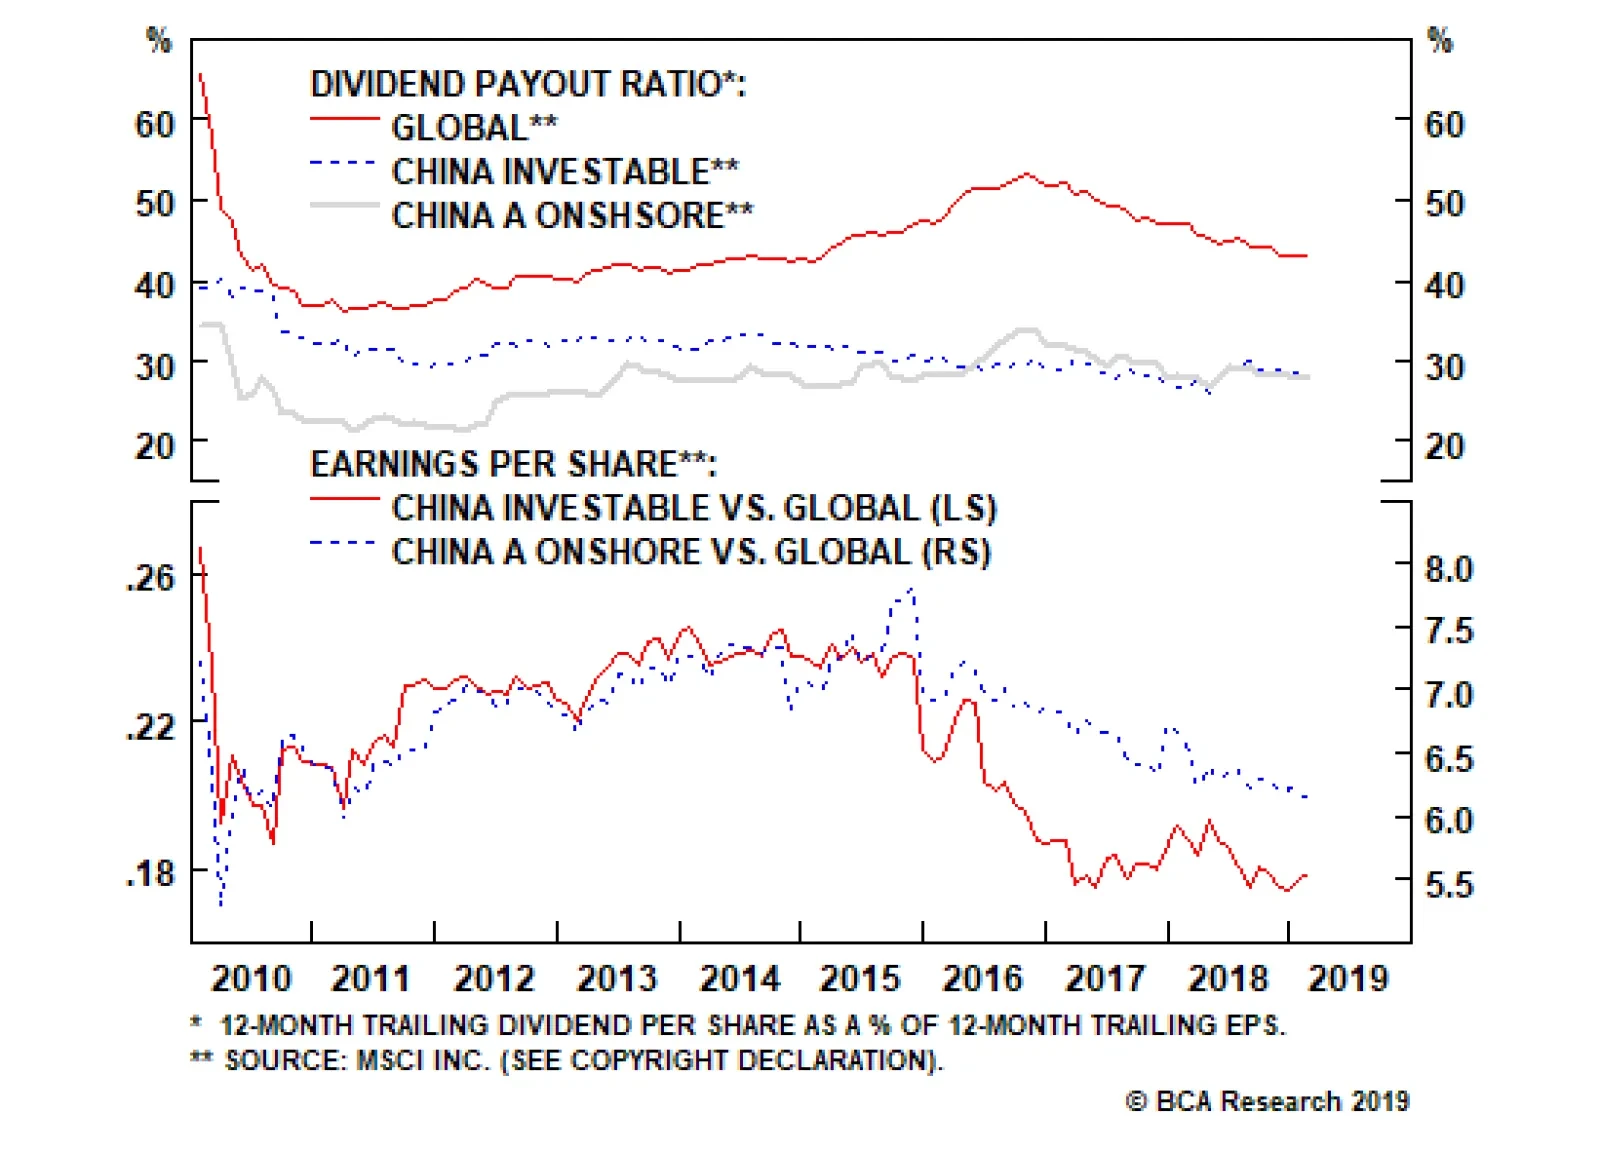
In a world where many financial assets are chronically expensive and where Chinese policymakers appear to be responding to weaker economic activity, some investors question whether Chinese stocks deserve to be priced at a discount. Our China Investment…
Certainly, several positive developments are pointing towards domestic demand meaningfully improving. Chinese monetary conditions have become extremely easy, credit is no longer contracting and even surged in January, the Caixin PMI rose markedly in February,…
Highlights Taiwan’s semiconductor sector is facing both cyclical and structural headwinds. Semiconductor exports will continue to contract over the next six months or so, on retrenching global demand. In the long run, Taiwan is facing increasing competition from Korea in the high-end supply, and from mainland China in the medium- to low-end supply of the semiconductor market. The latest rebound in Taiwanese share prices is unsustainable, and they are about to relapse anew. Within an EM equity portfolio, we recommend staying neutral on Taiwanese stocks for now. Feature Taiwan’s exports and manufacturing are in full-blown recession. The equity market has rebounded after a major selloff last year. However, the overall manufacturing PMI and its export sub-component are extremely weak, and do not justify the latest share-price rebound (Chart I-1). Chart I-1Taiwanese Equities: Unsustainable Rally
Taiwanese Equities: Unsustainable Rally
Taiwanese Equities: Unsustainable Rally
Are manufacturing activity and exports about to recover? Or will the stock market rally fade? Our answer is the latter. There are currently no signs suggesting a recovery in exports is imminent. Moreover, the engine of the economy – the semiconductor sector – is facing both cyclical and structural headwinds. We remain negative on Taiwanese stocks in absolute terms. Within an EM equity portfolio, we recommend a market-weight allocation to Taiwanese stocks for now. Importance Of Semiconductors Over the past 15 years, the semiconductor sector has become the cornerstone of the Taiwanese economy. The Taiwanese economy is highly dependent on its external sector, as exports contribute to nearly 70% of GDP. As such, Taiwan’s business cycle has often been closely associated with its export sector. This means the region’s growth outlook relies on both external demand (a cyclical factor) and the competitiveness of its export sector (more of a structural factor). Over the past 15 years, the semiconductor sector has become the cornerstone of the Taiwanese economy. It contributes to over one-third of the region’s total exports, up from 22% in 2009 (Chart I-2). Chart I-2Semiconductor: Cornerstone Of Taiwanese Economy
Semiconductor: Cornerstone of Taiwanese Economy
Semiconductor: Cornerstone of Taiwanese Economy
Consistently, tech stocks also account for the lion’s share of the Taiwanese stock market, representing nearly 60% of the MSCI Taiwan Index and 47% of the Taiwanese Stock Exchange (TSE) index in market-value terms. There have been two key forces behind the significant growth of Taiwan’s semiconductor sector: booming global demand for smartphones/tablets and increasing competitiveness among domestic semiconductor companies. However, looking forward, the Taiwanese manufacturing sector and its semiconductor exports are facing a double-whammy: cyclical weakness in global demand and a relative decline in Taiwan’s export ability. In the context of a negative structural outlook, a cyclical downtrend engenders substantial deterioration in manufacturing, and by extension corporate profitability. Cyclical Downturn In Global Semiconductor Demand The outlook for the Taiwanese semiconductor industry remains poor. The global semiconductor industry has already been in a cyclical downtrend since early 2018. Global smartphone sales are shrinking. Both DRAM and NAND prices have been falling (Chart I-3). Chart I-3Falling Memory Chips Prices
Falling Memory Chips Prices
Falling Memory Chips Prices
The freefall in Taiwan's new export orders seems to entail a further contraction in exports (Chart I-4). Chart I-4A Further Contraction In Exports Is Likely
A Further Contraction In Exports Is Likely
A Further Contraction In Exports Is Likely
Importantly, exports of electronics parts lead Taiwanese tech EPS growth, and currently point to an impending contraction in corporate earnings (Chart I-5). Chart I-5An Impending Contraction In Corporate Earnings
An Impending Contraction In Corporate Earnings
An Impending Contraction In Corporate Earnings
The outlook for the Taiwanese semiconductor industry remains poor. First, Taiwanese semiconductor producers are highly vulnerable to any further downside in global smartphone demand. There are two major pure-play wafer manufacturers in Taiwan: Taiwan Semiconductor Manufacturing Company (TSMC) and United Microelectronics (UMC). TSMC and UMC are the world’s largest and fourth-largest dedicated integrated circuit (IC) foundries, respectively. The smartphone sector has been the main revenue source for both companies, accounting for a 45% share for TSMC and 40% for UMC. Global smartphone demand is likely to decline further in 2019, as major markets such as mainland China and advanced economies have entered the saturation phase of mobile-phone demand. DRAMeXchange expects global smartphone production volume for 2019 to fall by 3.3% from last year following a 4% drop in 2018 (Chart I-6). Chart I-6Global Smartphone Demand Started A Downtrend
Global Smartphone Demand Started A Downtrend
Global Smartphone Demand Started A Downtrend
Smartphone sales in mainland China remain in deep contraction after two consecutive years of declines (Chart I-7). Odds are that smartphone shipments will remain sluggish amid the ongoing economic slump in the mainland’s economy. Chart I-7Smartphone Sales In Mainland China Are In A Deep Contraction
Smartphone Sales In Mainland China Are In A Deep Contraction
Smartphone Sales In Mainland China Are In A Deep Contraction
In addition, Taiwan’s TSMC is the sole chip supplier for Apple iPhones. A further decline in Apple smartphone shipments will reduce the company’s revenue and profits, damaging the region’s growth outlook. Mainland China now can produce top-notch quality smartphones at relatively cheaper selling prices. This will further crowd out higher-priced products from Apple, Samsung and others (Chart I-8). Chart I-8Apple Has Been Losing Market Share In Global Smartphone Market
Apple Has Been Losing Market Share In Global Smartphone Market
Apple Has Been Losing Market Share In Global Smartphone Market
Second, the significant surge in bitcoin prices greatly boosted cryptocurrency mining activity in 2016-‘17 as miners quickly expanded their computing power. This boosted demand for graphic process unit (GPU) chips and in turn brought higher revenue for Taiwan chipmakers between June 2016 and early 2018. However, with the bust in bitcoin prices (Chart I-3 on page 3), demand from cryptocurrency mining has vanished and is unlikely to revive soon. Indeed, Taiwan chipmakers have suffered from last year’s plunge in cryptocurrency mining activity. According to TSMC, revenue from the cryptocurrency mining-related high-performance computing (HPC) sector contracted by double digits in 2018. Given that HPC demand is the second-biggest source of revenue for TSMC, with 32% share, TSMC revenue will be curtailed as HPC chip demand will continue to decline on weak bitcoin prices. Last, developments in new technologies, such as foldable smartphones, artificial intelligence, fifth-generation (5G) mobile networks and the so-called Internet of Things (IoTs) could only produce a modest pick-up in semiconductor demand. Most of these developments are still in their infancy and early stages. Hence, their growth will not be large enough to make a cyclical difference in global semiconductor demand. For example, the foldable smartphone that Huawei recently announced is indeed appealing. However, a lack of stability in panel supply and quite-high selling prices will limit sales. WitsView, a division of TrendForce, predicts that the market penetration rate of the foldable phone will be only 0.1% in 2019, and could rise to 1% in 2020 if more panel providers join the game, enabling a significant reduction in panel costs. Moreover, these categories together account for only ~23% of TSMC’s revenue; their modest growth will not be able to make up for the losses from the smartphone and HPC sectors within Taiwan’s economy. Besides, there has been a slowdown in demand from high-growth areas such as data center servers, as well as the automotive and industrial sectors. Putting it all together, odds are that global semiconductor demand will only materially recover in 2020. By that time, more-mature 5G technology and the increasing adoption of the 5G network and 5G-related products may be able to shift global semiconductor demand from the current downturn to a cyclical uptrend. Hence, the cyclical weakness in global semiconductor demand is likely to persist over the next six months. Consequently, Taiwan’s major types of semiconductor production will likely remain in contraction, and inventory levels will stay elevated (Chart I-9 and Chart I-10). Chart I-9Taiwan: Semiconductor Output Contraction Will Likely Continue
Taiwan: Semiconductor Output Contraction Will Likely Continue
Taiwan: Semiconductor Output Contraction Will Likely Continue
Chart I-10Taiwan: Semiconductor Inventory Are Elevated
Taiwan: Semiconductor Inventory Are Elevated
Taiwan: Semiconductor Inventory Are Elevated
Bottom Line: There are no signs of an imminent recovery in exports. A Potential Decline In Taiwan’s Semiconductor Competitiveness Taiwan wafer manufacturers are facing an increasing threat from their Korean and mainland China competitors. Leadership in advanced process technologies has been a key factor in Taiwan’s strong market position in the global semiconductor industry. With cutting-edge technologies, Taiwan has been the global wafer capacity leader since 2015. As of last year, it held about 22% of global installed wafer capacity (Chart I-11).
Chart I-11
However, Taiwan wafer manufacturers are facing an increasing threat from their Korean and mainland China competitors. Korean Chipmakers While Taiwan will remain highly competitive in 7 nanometer (nm) and 10 nm wafer production, it is facing fierce competition from Korea. Manufacturing technologies designated by smaller nanometer numbers tend to have faster speeds and be more power-efficient than technologies designated by larger numbers. TSMC was the first company in the world to mass-produce 7 nm node wafers. Its 7 nm deep ultraviolet lithography (DUV) node has been in mass production since April 2018, producing chips for AMD, Apple, HiSilicon, and Xilinx. Beginning at the end of this month, TSMC will be ready to begin mass production of 7nm wafers using extreme ultraviolet lithography (EUV). The switch from 7nm DUV to 7nm EUV allows for fewer defects and fewer steps required during the production process. The company also aims to boost volume production of its 5 nm nodes in early 2020 and has a target of 3 nm wafers for 2022. Last year, wafer revenue from 7nm and 10nm chips accounted for 9% and 11% of TSMC’s total revenue, respectively (Chart I-12).
Chart I-12
Samsung has been closely following TSMC in terms of technological innovation. It started mass production of EUV-based 7nm chips last October, with a plan of risk production1 of 5nm wafers in 2019 and a target of 4nm wafers in 2022. Meanwhile, IBM announced last December that it signed an agreement with Samsung to produce its next-generation processors with Samsung’s 7nm technology. As Samsung seeks to diversify its revenue source away from memory chips, which last year contributed to about 80% of its operating profit, the company has been determined to ramp up the development of its foundry business. It aims to replace TSMC as the world’s largest foundry producer by 2030. In the near term, Samsung aims to secure a 25% market share in the global pure-play foundry market by 2023, a rise from 19% currently. Last year, Samsung surpassed Taiwan’s UMC to become the world’s second-largest dedicated chipmaker. Moreover, Samsung’s capital spending has been and will continue to be much higher than TSMC. Over the course of 2017 and 2018, Samsung spent about $46.9 billion on semiconductor capital expenditures, more than double TSMC’s $21 billion. Hence, the competition between TSMC and Samsung in the high-end chip market will intensify in the coming years. Chipmakers In Mainland China The competition between TSMC and chipmakers from mainland China is also escalating. Chart I-12 shows that 80% of TSMC’s wafer revenue comes from bigger node wafers (bigger than 10 nm). Taiwan’s second-biggest chipmaker, UMC, only produces wafers equal to or bigger than 28 nm. Therefore, the chip market using less-advanced technology than 10 nm will be the main battlefield between Taiwanese and mainland China’s chipmakers. Before 2014, there were few wafer manufacturers in mainland China, and those that did exist were too weak to compete with giant market players like TSMC. In 2014, the Chinese central government made a move to foster development within the local IC industry. Since then, the authorities have poured significant amounts of capital into semiconductor foundries, as well as companies focused on memory production, chip design and related equipment and materials. Semiconductor Manufacturing International Corporation (SMIC) is the world’s fourth-largest dedicated wafer manufacturer, and is the largest in mainland China. While 28nm will likely remain a large part of its business, SMIC plans to go into production on its 14 nm technology in the first half of 2019. The company is also working on 10nm and 7nm nodes with the use of EUV. SMIC currently counts HiSilicon and Qualcomm as customers, manufacturing smartphone chips with medium-to-low technology. As mainland China aims to increase its self-sufficiency rate for ICs significantly over the next five to 10 years, the nation’s producers will significantly expand their wafer capacity. Mainland China is likely to reduce its semiconductor imports from Taiwan considerably in the coming years, especially wafer imports. According to IC Insights, nine 300mm wafer fabs2 are scheduled to open worldwide in 2019, with five of them in mainland China. Based on another set of data from SEMI, the number of 200mm wafer fabs in the world will increase from 194 in 2017 to 203 by 2022, with an additional 56 established fabs planning to expand their manufacturing capacity. Mainland China is expected to account for 44% of the growth. In comparison, Taiwan only accounts for about 10% of the growth. Mainland China currently accounts for over 30% of Taiwanese electronic parts exports (wafers, PCBs, mainboards and others). As mainland China continues to build new wafer manufacturing capacity and gradually improve its existing technology, it will switch its consumption from imports to domestic production. Consequently, mainland China is likely to reduce its semiconductor imports from Taiwan considerably in the coming years, especially wafer imports (Chart I-13). This is structurally bearish for Taiwanese semiconductor companies. Chart I-13Mainland China’s Semiconductor Imports From Taiwan Will Drop
Mainland China’s Semiconductor Imports From Taiwan Will Drop
Mainland China’s Semiconductor Imports From Taiwan Will Drop
Bottom Line: Taiwan is facing increasing challenges from Korea in terms of defending its market share in the high-end wafer market. Meanwhile, Taiwan is also set to lose market share in the medium-to-low market to wafer producers from mainland China. What About The Rest Of The Economy? The rest of the economy is exhibiting mixed signals, with contracting major non-semiconductor export sectors but decent household consumption and property market. Table 1 shows Taiwan’s top 10 exported products, with the top three attributing to over half of total exports. Besides the semiconductor sector, exports of the other two major products – electrical machinery products and machinery – are beginning to contract (Chart I-14).
Chart I-
Chart I-14Taiwan: Contracting Non-Semiconductor Exports
Taiwan: Contracting Non-Semiconductor Exports
Taiwan: Contracting Non-Semiconductor Exports
However, the domestic economy seems to be running well at present. Production of construction materials in volume terms is growing rapidly, accompanied by a rebound in building permits granted (Chart I-15). While employment growth is decent, average wage growth has been quite strong (Chart I-16). With persistent contraction in exports and inflation very low, the central bank could cut rates in 2019. Chart I-15Decent Domestic Demand
Decent Domestic Demand
Decent Domestic Demand
Chart I-16Strong Wage Growth
Strong Wage Growth
Strong Wage Growth
Ongoing contraction in semiconductor exports will likely slow domestic demand with a time lag. In fact, the inverted 5-year/6-month yield curve is indeed signaling an economic slump in Taiwan (Chart I-17). Chart I-17Inverted Yield Curve Signals Continuing Economic Slump Ahead
Inverted Yield Curve Signals Continuing Economic Slump Ahead
Inverted Yield Curve Signals Continuing Economic Slump Ahead
Investment Recommendations The latest rebound in Taiwanese stocks is unsustainable and share prices will relapse again. Within an EM equity portfolio, we recommend maintaining a market-weight allocation to Taiwan for now. We are reluctant to downgrade Taiwan to underweight because some other emerging markets and sectors within the EM universe have a poorer outlook. In addition, Taiwanese shares have already underperformed the EM benchmark since last September (Chart I-18). Chart I-18Taiwanese Stocks: Staying Neutral Within EM
Taiwanese Stocks: Staying Neutral Within EM
Taiwanese Stocks: Staying Neutral Within EM
The Taiwanese currency is cheap (Chart I-19). The region has a massive current account surplus and foreigners do not hold any local bonds, which is very different from many other EM countries. Hence, Taiwan is less vulnerable to capital outflows than many current-account-deficit EM economies. The latter could be forced to raise rates, which will place pressure on their banks as well as on domestic demand. In contrast, Taiwan has the ability to cut rates. Chart I-19TWD Is Cheap
TWD Is Cheap
TWD Is Cheap
Ellen JingYuan He, Associate Vice President Emerging Markets Strategy ellenj@bcaresearch.com 1 "Risk Production" means that a particular silicon wafer fabrication process has established a baseline in terms of process recipes, device models, and design kits, and has passed standard wafer level reliability tests. 2 A fab, sometimes called foundry, is a semiconductor fabrication plant where devices such as integrated circuits are manufactured. Equity Recommendations Fixed-Income, Credit And Currency Recommendations
Highlights Driven by its fear that deflation is a more intractable danger than inflation, the Federal Reserve has enshrined its pause for the remainder of 2019 in order to lift inflation expectations. Since the U.S. business cycle expansion is not over, the Federal Reserve’s plan to put policy on hold this year raises the odds that the economy will overheat. Global growth is set to bottom during the second quarter in response to easier financial conditions. Accommodative policy, rebounding global economic activity and a softening dollar will boost risk asset prices during the remainder of the year. Safe-haven bonds, including Treasurys, will underperform cash over the coming 12 to 18 months. The rally in risk assets will ultimately prove the last hurrah as the Fed will resume tightening later this year or in 2020, and a bear market lies down the road. Only investors with tactical investment horizons should aggressively play this rally. Those with longer investment horizons should use this rally to lighten up their exposure to risk. Feature Introduction Following the introduction of the word “patience” into the Federal Reserve’s lexicon, a move lower in the so-called Fed dots was to be anticipated. The FOMC now expects no rate increases in 2019 and only one hike in 2020. The interest rate market remains skeptical that the Fed will be able to deliver on its forecast. For now, the OIS curve is pricing in a 75% probability of a cut this year, and rates at 1.9% by the end of 2020. With the 10-year/3-month yield curve inverting last week and the U.S. Leading Economic Indicator still decelerating, it is no wonder that investors are betting on the Fed becoming ever more dovish (Chart I-1). BCA is inclined to take the Fed at its word – the next move will be a hike, not a cut. This call rests on our view of the business cycle: The fed funds rate is still somewhat below neutral, U.S. economic activity can expand further, and global growth is likely to trough soon. The current dovish inclination of global central banks will only nurture the cycle a little bit longer. Consequently, we continue to recommend a positive stance on stocks for the coming quarters, while keeping in mind that the cycle is long in the tooth, and that beyond this last climb lies a significant bear market. The U.S. Business Cycle Has Further To Run… The Fed remains data dependent, but this now means that depressed inflation expectations in the private sector need to be vanquished before the hiking can resume (Chart I-2). With the view that low realized inflation has curtailed expectations now common across major central banks, this implies that a temporary overshoot in actual core PCE will be tolerated in order to lift expectations. Chart I-1Worrisome Signs For Growth
Worrisome Signs For Growth
Worrisome Signs For Growth
Chart I-2The Fed Wants To Lift Inflation Expectations
The Fed Wants To Lift Inflation Expectations
The Fed Wants To Lift Inflation Expectations
Since consumer prices are a lagging variable, lifting both realized and anticipated inflation will only be possible if we move ever further along the business cycle, further pressuring the economy. Our base case remains that the risk of a recession is low in 2019, and is even receding in 2020. First, U.S. credit-dependent cyclical spending currently constitutes only 25.3% of potential GDP. As Chart I-3 illustrates, this is in line with its historical average, and well below the levels recorded near the end of previous business cycles. This suggests that the amount of vulnerability caused by misallocated capital is not yet in line with previous cycles. It also indicates that the share of output generated by the sectors most sensitive to higher rates is also low. Chart I-3U.S. Cyclical Spending: Limited Signs Of Vulnerability
U.S. Cyclical Spending: Limited Signs Of Vulnerability
U.S. Cyclical Spending: Limited Signs Of Vulnerability
Second, the consumer remains in good shape. Households have deleveraged, and debt-service payments relative to disposable income are still near multi-generational lows (Chart I-4). Moreover, thanks to a saving rate of 7.6%, consumer spending is likely to move in line or even outperform income growth. On this front, the outlook is also good. As Chart I-5 demonstrates, the link between wages and salaries relative to the employment-to-population ratio for prime-age workers – a measure of labor utilization unaffected by the demographic changes that have muddied the interpretation of the unemployment rate – is still as tight as it was 20 years ago. Thus, as long as the labor market does not suddenly collapse, wage growth will continue to accelerate, supporting household income and consumption. Chart I-4Household Balance Sheets Are Solid
Household Balance Sheets Are Solid
Household Balance Sheets Are Solid
Chart I-5
Third, at 0.4% of GDP, the fiscal thrust remains positive. In other words, fiscal policy will still add to GDP in 2019. Fourth, we do not see the traditional symptoms associated with a fed funds rate above neutral. After dipping sharply in the second half of 2018, mortgage for purchase applications are back near their cycle highs (Chart I-6). Moreover, the performance of homebuilders’ equities relative to the broad market has begun to rebound, which is inconsistent with a fed funds rate above neutral. Chart I-6Mortgage Applications Do Not Suggest Policy Is Tight
Mortgage Applications Do Not Suggest Policy Is Tight
Mortgage Applications Do Not Suggest Policy Is Tight
Fifth, there is scope for the contribution from housing sector activity to morph from a negative to a positive. A fed funds rate below neutral historically is correlated with an improving housing market. Rising mortgage rates from 3.8% to 4.6% depressed home sales and construction output, and the fall in mortgage rates over the past x month 4.3% should stimulate housing activity (Chart I-7). Chart I-7Residential Activity Will Rebound This Year
Residential Activity Will Rebound This Year
Residential Activity Will Rebound This Year
Bottom Line: U.S. first-quarter GDP growth will be dismal, but one quarter does not make a trend. The low degree of economic vulnerability in the U.S., and the likelihood that the fed funds rate will stay below neutral for a while suggest that growth should rebound to the 2-2.5% range and should remain above-trend for the remainder of 2019. … And Global Growth Will Soon Trough As the cliché goes, it is darkest before the dawn. This is a fitting description of the world economy outside the U.S. right now. Global trade is depressed, global PMIs are moribund and nothing feels good. But it is exactly when nothing is going well that one needs to wonder what may cause the outlook to turn for the better. Thankfully, green shoots are emerging. To begin with, central banks around the world have taken a more dovish slant. This dovish forward guidance is nurturing global activity via a significant easing in global financial conditions, which is undoing the severe brake-pumping imposed on global growth in the fourth quarter of 2018 (Chart I-8). Chart I-8Global Financial Conditions Are Easing
Global Financial Conditions Are Easing
Global Financial Conditions Are Easing
This more dovish forward guidance has helped our Financial Liquidity Index, which sharply deteriorated through 2009, rebound. Historically, this presages an improvement in the BCA Global Leading Economic Indicator (Chart I-9). Improving liquidity conditions have already been reflected in lower real rates around the globe, creating a reflationary impulse. EM financial conditions are responding positively, pointing to an upcoming pick-up in industrial activity, as measured by our Global Nowcast (Chart I-10). Chart I-9Improving Global Liquidity Backdrop
Improving Global Liquidity Backdrop
Improving Global Liquidity Backdrop
Chart I-10A Tailwind From EM?
A Tailwind From EM?
A Tailwind From EM?
Our Global LEI diffusion Index has begun to reflect some of these developments. After forming a trough in 2018, more than 50% of the countries in our Global LEI are currently experiencing a sequential improvement in their LEIs. We are now entering the normal lag after which a broadening growth impulse converts into aggregate activity moving higher (Chart I-11). Most interestingly, investors do not seem to be anticipating such a rebound. There is therefore room for growth surprises around the world. Chart I-11Scope For Growth Surprises
Scope For Growth Surprises
Scope For Growth Surprises
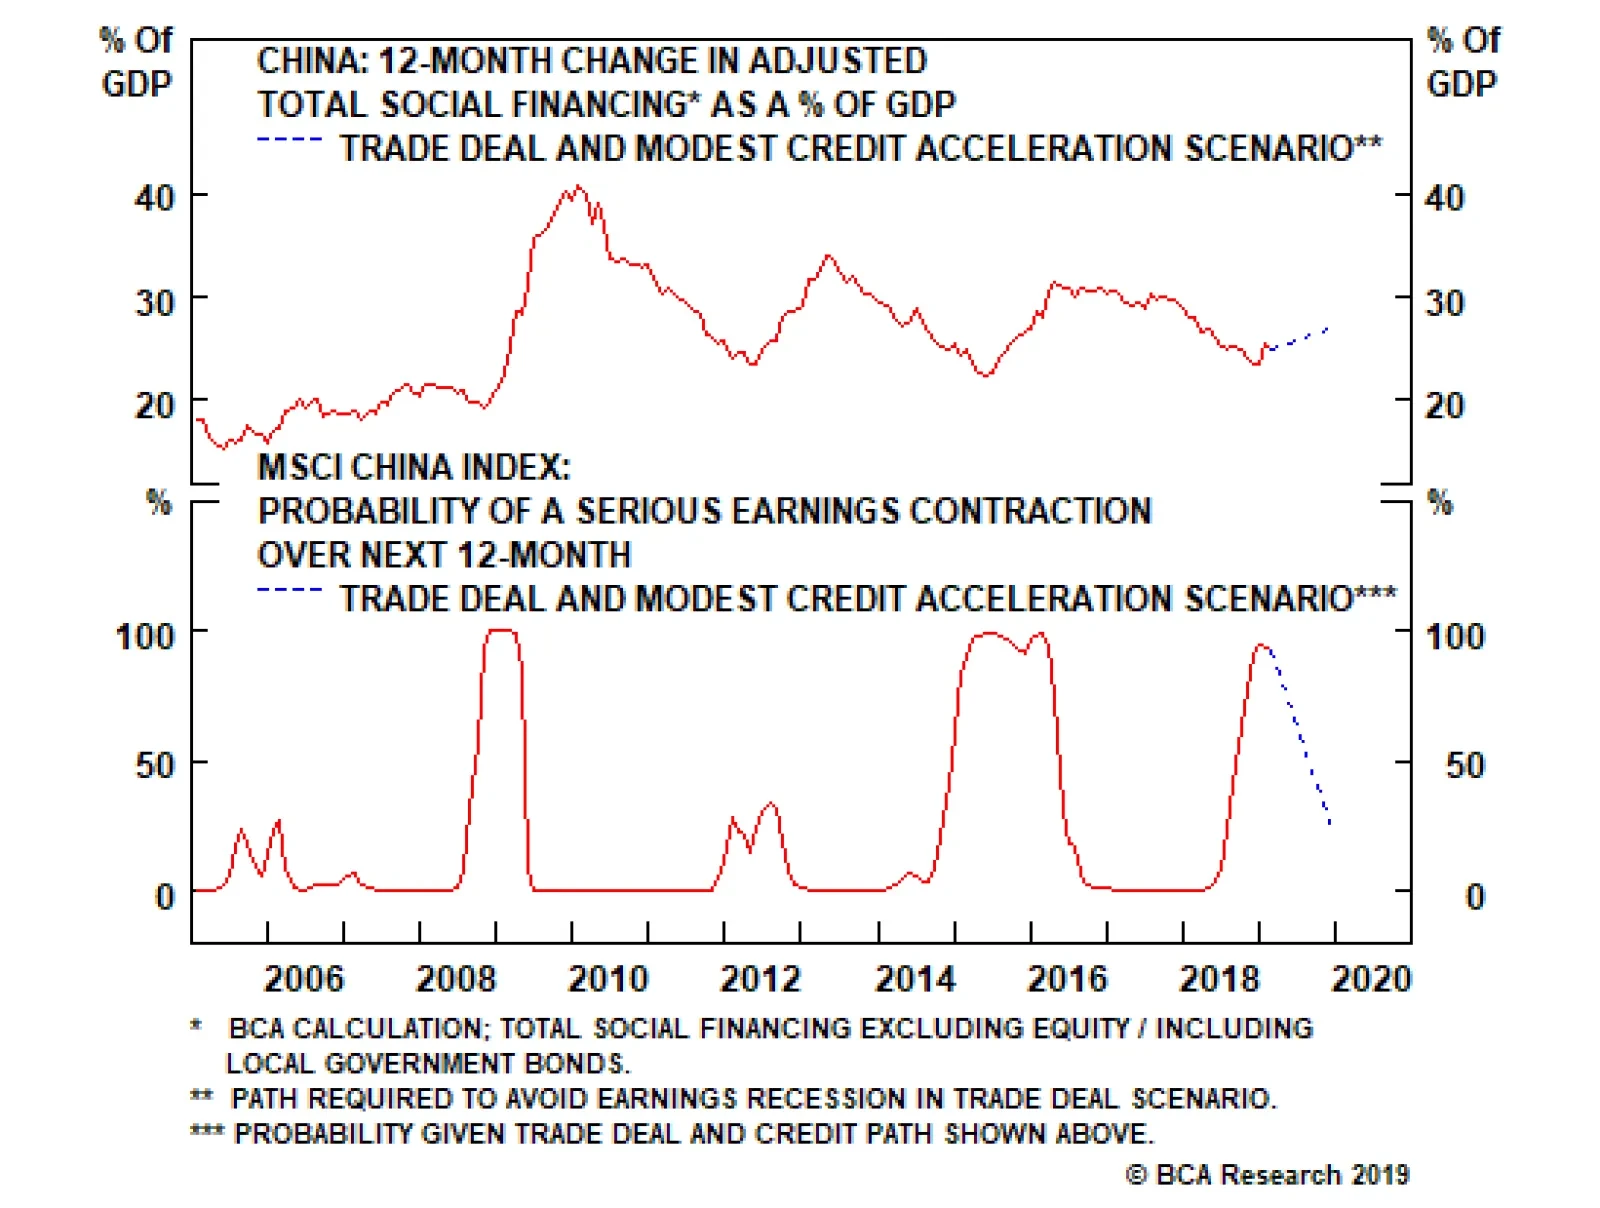
China has a role to play in this story, will likely morph from a headwind to global growth to a positive. Positive may be a strong word, but at the very least, we expect China to stop detracting from global growth. Premier Li-Keqiang recently put the accent on stability and preserving employment, suggesting Chinese policymakers are likely to de-emphasize deleveraging over the coming 12-18 months. For Chinese growth to improve, deleveraging does not even have to stop. As both theory and history have shown, a slower pace of deleveraging means that the credit impulse moves back into positive territory and growth re-accelerates, even if only temporarily (Chart I-12). Chart I-12Growth Can Improve Even If Deleveraging Continues
Growth Can Improve Even If Deleveraging Continues
Growth Can Improve Even If Deleveraging Continues
As a thought experiment, if Chinese leverage were to stabilize this year and nominal growth were to hit 8% – the lower bound of the real GDP target of 6-6.5% and inflation of 2% – the Chinese credit impulse would surge to more than 10% of GDP (Chart I-13)! We are not forecasting such a large rebound in the impulse, but this exercise clearly shows that if the Chinese authorities – who are cutting taxes and trying to ease credit conditions for small- and medium-sized enterprises – want to favor stability and employment for just one year, the impact on growth will be non-negligible, even if deleveraging continues. Since domestic demand responds to the credit impulse, and imports sport an elevated beta to domestic demand, Chinese imports are likely to soon morph from a negative to something more neutral – maybe even a small positive for the rest of the world. Chart I-13A Thought Experiment
A Thought Experiment
A Thought Experiment
Finally, as weak as Europe is right now, it will likely be an important source of positive surprises in the second half of the year. To begin with, Europe is much more sensitive to EM growth conditions than the U.S. (Chart I-14). In the same way as Europe felt the full force of the deceleration in global trade last year, it will benefit from any improvement in trade this year.
Chart I-14
A myriad of idiosyncratic shocks rammed through the euro area last year, worsening an already difficult situation. The new WLTP emission standards caused German auto production to collapse by nearly 20%. Nonetheless, as contracting domestic manufacturing orders and a large inventory pullback in the final quarter of last year suggest, the inventory overhang has been worked off (Chart I-15, top panel). Chart I-15Passing European Idiosyncratic Shocks
Passing European Idiosyncratic Shocks
Passing European Idiosyncratic Shocks
Just as critically, Italy’s technical recession should end soon. The country’s economic malaise reflected the tightening in financial conditions that followed the violent battle between Rome and Brussels early last year. Ultimately, Rome folded: The budget deficit is 2.3% of GDP, not above 6%, and threats of leaving the union have been abandoned. Consequently, financial conditions are easing. Italian bond auctions are massively oversubscribed this year, and rising bond prices are supporting the solvency of the Italian banking system. The last hurdle affecting Europe was the fact that funding stress in the Italian and Spanish banking systems have been directly addressed by the TLTRO-III announced three weeks ago by the European Central Bank. Spanish and Italian banks have to refinance EUR 425 billion of TLTRO-II this June, in a year where a sizeable amounts of European bank bonds also needs to be refinanced. This is simply too much. With the ECB again bankrolling Italian and Spanish financial institutions, funding stress in the periphery can decline. Consequently, the European credit impulse, which had formed a valley in 2018 Q1, can continue its ascent (Chart I-15, bottom panel). Bottom Line: Investors expect little from the global economy outside the U.S., yet easing liquidity and financial conditions, a temporary shift in Chinese policy preferences and passing idiosyncratic shocks in Europe all point to improvement in global economic activity. U.S. Inflation Expectations Will Allow The Fed To Resume Rate Hikes Above-potential growth in the U.S. and rebounding economic activity in the rest of the world are consistent with higher – not lower – U.S. inflation. First, rebounding global growth is normally associated with a weakening dollar (Chart I-16). This time will not be different, especially as U.S. equity valuations relative to global stocks suggest that investors are particularly pessimistic on non-U.S. growth. A weaker dollar will lift import prices, commodity prices, and goods prices, helping inflation move higher. Chart I-16The USD Is Counter-Cyclical
The USD Is Counter-Cyclical
The USD Is Counter-Cyclical
Second, the change in the velocity of the money of zero maturity in the U.S. is consistent with a further strengthening in core inflation (Chart I-17). Chart I-17The Fisher Equations Points To Gently Rising Inflation
The Fisher Equations Points To Gently Rising Inflation
The Fisher Equations Points To Gently Rising Inflation
Third, above-trend U.S. growth in the context of elevated capacity utilization is also consistent with rising inflation (Chart I-18). Chart I-18Elevated U.S. Capacity Utilization
Elevated U.S. Capacity Utilization
Elevated U.S. Capacity Utilization
If these three forces can cause core PCE inflation to move slightly above 2% in the second half of 2019, this will likely result in inflation expectations firming. Moreover, the combination of positive growth surprises around the world and easy monetary and liquidity conditions will prove supportive of asset prices globally, implying further easing in global and U.S. financial conditions. This set of circumstances will allow the Fed to shift its tone toward the end of 2019, in order to crystalize additional hikes in 2020. Additionally, we estimate the U.S. terminal policy rate to be around 3.25%. In fact, a longer-than-originally-anticipated Fed pause reinforces confidence in this assessment, even if it means that it will take longer to reach the terminal level than we previously thought. Bottom Line: Our growth outlook is consistent with robust inflation and improving inflation expectations. This means we disagree with interest rate markets and anticipate the Fed will resume its hiking campaign instead of cutting rates next year. Moreover, easier-for-longer policy also strengthens our view that the fed funds rate can end this cycle near 3.25%. Stay Positive On Risk Assets For Now… Most bear markets are linked to recessions. It follows that if the U.S. business cycle can be extended and the Fed remains on the easy side of neutral for longer, then the S&P 500 has more upside (Chart I-19). So do global equities. Chart I-19Low Bear-Market Risk
Low Bear-Market Risk
Low Bear-Market Risk
This view is reinforced by the fact that buy-side analysts and investors alike have aggressively curtailed their expectations for EPS growth this year, to 3.9% for the U.S. and 4.9% outside the U.S. Yet, our profit model suggests that U.S. EPS growth is likely to come in at around 8.1% this year. Earnings revisions are pro-cyclical. Hence, our expectation that the BCA global Leading Economic Indicator meaningfully revives in the second half of 2019 points toward analysts having ample room to revise global earnings higher in the second half of the year (Chart I-20). Chart I-20Global Profit Margins Will Improve If Growth Rebounds
Global Profit Margins Will Improve If Growth Rebounds
Global Profit Margins Will Improve If Growth Rebounds
Moreover, global valuations experienced a reset last year. Despite a rebound, the forward P/E ratio for the MSCI All-Country World Index remains in line with 2014 levels, 12.5% lower than at their apex last year. When looking at the U.S., our composite valuation index has also improved meaningfully (Chart I-21). This improvement in valuations increases the probability that a bottom in global growth will lift stock prices. Chart I-21Large Improvement In The Equity / Risk Reward Ratio
Large Improvement In The Equity / Risk Reward Ratio
Large Improvement In The Equity / Risk Reward Ratio
Our Monetary Indicator further reinforces this message. After being a headwind for stocks over the past eight quarters, now that the Fed has paused and is essentially guaranteeing low real rates for an extended period, this gauge is growing more supportive of further equity price gains (Chart I-22). Chart I-22Stock-Friendly Monetary Backdrop
Stock-Friendly Monetary Backdrop
Stock-Friendly Monetary Backdrop
A below-benchmark duration exposure for fixed-income portfolio still makes sense, even if the Fed has prolonged its pause. As per our U.S. Bond Strategy service’s “Golden Rule Of Treasury Investing,” if the Fed increases rates more than the market has priced in 12 months prior, Treasurys underperform cash (Chart I-23). Even if the Fed does nothing this year, it will still be more than the OIS curve is currently pricing in. Moreover, the dollar is likely to soften and the Fed is increasingly taking the risk of falling behind the realized inflation curve. This should create upside not only for inflation breakevens but also for term premia, which are depressed everywhere across the G-10. The yield curve should modestly steepen in this environment. It may take a bit more time than we originally expected, but safe-haven bond yields are trending higher, not lower. Chart I-23The Golden Rule Of Treasury Investing
The Golden Rule Of Treasury Investing
The Golden Rule Of Treasury Investing
Spread products are also likely to continue to do well. Easy monetary policy, a soft U.S. dollar, an ongoing U.S. business expansion, an upcoming rebound in global growth and rising asset values all point toward a delay of the inevitable wave of defaults. Corporate bonds may offer poor value and credit quality has deteriorated, but an end to the business cycle and a tighter Fed will be key to catalyzing these poor fundamentals. We are not there yet. The Brexit saga continues to have the potential to unsettle markets. Nonetheless, we would fade any broad market sell-off linked to poor British headlines. As Marko Papic writes in this month's Special Report, despite continued political uncertainty in Westminster this year, the risk of a no-deal Brexit is dwindling by the minute, and political logic suggests that there is a high probability that the U.K. will ultimately remain in the EU in two to three years. Bottom Line: After the reset in valuations and earning expectations last year, markets should continue their ascent. The Fed has showed that its “put” is alive and well. This will both favor risk-taking and extend the duration of the business cycle. If global growth can rebound in the second quarter, it will create fertile ground for strong asset prices over the bulk of 2019. Treasury yields will also exhibit upside, even if achieving these higher rates will take more time now. … But Beware What Lurks Below The benign outlook for this year masks that the rally in risk assets is living on borrowed time. A Fed willingly falling behind the curve may fan speculative flames this year, but it doesn’t mean that policy will stay easy forever. On the contrary, the inevitable rise in inflation will push rates higher down the road and the unavoidable recession will ultimately materialize, most likely somewhere around 2021. Since asset valuations will only grow more inflated between now and then, a bigger fall will ultimately ensue. Our Composite Valuation Indicator may currently be flashing a positive signal, but dynamics within its components already point to brewing trouble down the road (Chart I-24). First, the balance sheet group of indicators has showed no improvement. In other words, without last year’s rebound in profitability, stocks would not be as attractively valued as the overall indicator suggests. Chart I-24Disconcerting Internal Dynamics
Disconcerting Internal Dynamics
Disconcerting Internal Dynamics
Second, the interest rate group is currently flattering aggregate valuations. To remain supportive of higher returns ahead, this group depends on interest rates staying constrained. Here, the Fed will play a particularly perverse role. Its willingness to tolerate inflationary pressures right now means lower rates today at the price of a higher cost of capital tomorrow. Once it becomes obvious that the Fed is falling behind the curve – something more likely to happen once inflation expectations normalize – safe-haven yields will rise sharply. The interest rate group will suddenly look a lot less supportive than it does today. Third, the profit components of our valuation indicator may look healthy today, but this will not remain the case. At 31.7%, EBITD margins are currently extraordinary elevated. In fact, if the profit margins were to normalize to their historical average, the Shiller P/E would skyrocket to 40.3 from 29.9 today, implying the stock market may be just as expensive as it was at the start of 2000. For margins to remain wide, wages will have to stay depressed relative to selling prices (Chart I-25). However, the combination of an economy at full employment and the Fed goosing economic growth points to rising wages. Since the pass-through from wages to prices is below 100%, unless productivity rises more than labor costs, profitability will suffer and P/E ratios will start sending the same message as the price-to-sales ratio, a multiple that currently stands near record highs. Chart I-25Rising Wages Will Ultimately Hurt Profits
Rising Wages Will Ultimately Hurt Profits
Rising Wages Will Ultimately Hurt Profits
Valuations are not the only danger lurking for stocks: Spread products will morph from a tailwind to a headwind for equities. Whether or not it steepens a bit this year, the yield curve’s previous big flattening already points toward rising financial market volatility (Chart I-26). The Fed’s recent dovish tilt can keep the VIX and the MOVE compressed for a while longer. However, since inflation expectations will ultimately move higher, likely within a year or so, the Fed will once again tilt to the hawkish side, and volatility will follow its path of least resistance higher. Carry trades of all kinds will suffer, and spreads will widen. The deteriorating credit quality this cycle, with BBB and lower-rated issues constituting 60.1% of the corporate universe, could make this widening more violent than normal. This phenomenon will hurt stocks. Chart I-26Volatility Is A Coiled Spring
Volatility Is A Coiled Spring
Volatility Is A Coiled Spring
Finally, the improvement in global growth this year is likely to prove temporary. China may want to slow the pace of deleveraging this year, but pushing debt loads lower and reforming the economy remains Beijing’s number one priority on a multi-year horizon. China has created USD 26 trillion worth of yuan since 2008, making the Chinese money supply larger than the euro area’s and the U.S.’s together. As a result, China’s incremental output-to-capital ratio continues to trend lower, implying large misallocation of capital (Chart I-27). State-owned enterprises, the recipients of much of the credit created over the past 10 years, now generate lower RoAs than their cost of borrowing, an unmistakable sign of poorly allocated funds. Chart I-27The Biggest Threat To China's Long-Term Prosperity
The Biggest Threat To China's Long-Term Prosperity
The Biggest Threat To China's Long-Term Prosperity
Correcting this structural impediment will require the Chinese credit impulse to once again move back into negative territory. This means that unless Chinese policymakers abandon their efforts to prise the country off easy credit, Chinese growth will morph back into a headwind for the world somewhere in 2020, i.e. not so late as to encourage excesses, but not so early as to sharply slow the economy ahead of the Communist Party’s one-hundredth birthday in July 2021. In 2018, the global economy nearly ground to a halt after China had shifted from stimulus to policy tightening. The next time around, we doubt that a global recession will be avoided. The second half of 2020 may set up to be one tumultuous period. Bottom Line: In all likelihood, global risk assets should perform well this year, but we are living on borrowed time. In the background, equity valuations are deteriorating meaningfully, a phenomenon that will worsen once the Fed’s desired outcome comes to fruition: higher inflation. Wage pressures and higher interest rates will reveal how fully rotten stock valuations genuinely are. Compounding this effect, higher volatility and a resumption of China’s deleveraging efforts will likely achieve the coup de grace for stocks in the second half of 2020. Conclusion The FOMC wants to lift inflation expectations in order to defuse any lingering deflationary risk. Consequently, the Fed’s pause will last longer than we originally anticipated, but terminal rates are likely to climb higher than would have otherwise been the case. Before last week’s Fed meeting, the U.S. was already set to grow above trend. Now, the Fed will only extend the business cycle further, fanning greater inflationary pressures in the process. This potentially misguided reflationary impulse, which is echoed around the world, will contribute to a rebound in global growth that will become fully evident by the summer. Consequently, we expect risk assets to climb to new highs over the coming 12 months. Treasurys will likely underperform cash over that timeframe, as interest rate markets are currently too sanguine. Investors are facing a real dilemma. On one hand, the potential for elevated stock market returns is high over the coming 12 months. On the other, poor valuations will only grow more onerous, and the Fed will ultimately have to tighten policy even more following the on-hold period. Moreover, Chinese policymakers are unlikely to ignore the pressing danger created by misallocating capital for an extended period of time. Consequently, the outlook for long-term returns is deteriorating. As a result, we recommend more tactically minded investors to stay long stocks, with a growing preference for international equities that are both cheaper and more exposed to global growth than U.S. ones. However, longer-term asset allocators should use this period of strength to progressively move out of stocks and into safer alternatives. Mathieu Savary Vice President The Bank Credit Analyst March 28, 2019 Next Report: April 25, 2019 II. The State Of Brexit So What? It makes sense for long-term investors to buy the GBP. However, short-term investors should instead buy the 2-year call while selling 3-month ones. Why? The U.K. electorate is not staunchly Euroskeptic. In fact, Bregret has already set in. Volatility is the only sure bet over the tactical and strategic time horizons. The most likely scenario is that Theresa May either resigns and is replaced by a soft-Brexit Tory, or that she agrees to a long-term extension to give the U.K. time to call a new election. Brexit is unsustainable over the secular time horizon. Our low-conviction view is that in the long term, the U.K. will remain inside the European Union. The hour is late in the ongoing Brexit saga. The original deadline, once spoken of with religious reverence, will be tossed aside for one, potentially two, extensions. In this analysis, we attempt to consider the state of Brexit from multiple time horizons. First, we offer our tactical view, what will happen in the next several weeks and months. Second, we offer our strategic view, surveying the Brexit process to the end of the year. Third, we consider the secular view and attempt to answer the question of whether the U.K. will ever fully exit the EU. We then assign investment recommendations across the three time horizons. How Did We Get Here? In March 2016, three months ahead of the fateful June referendum, BCA’s Geopolitical Strategy and European Investment Strategy published a joint report on the topic that drew three conclusions: The probability of Brexit was understated by the market. “According to our modeling results, roughly 64% of Tory undecided voters would have to swing to the “Stay” camp in order to ensure that the vote crosses the 50% threshold in favour of continued EU membership … Conventional wisdom suggests that the probability of Brexit is around 30%, anchoring to the 1975 referendum results. Our own analysis of current polling data suggests that it is much closer to 50%, as in too close to call.” The biggest loser of Brexit, domestically, would be the Conservative Party. “The risk is that the British populace realizes that leaving the EU was a sub-optimal result and that little sovereignty was recovered. As such, there could be a backlash against the Tories in the next general election. In this scenario, the winner would not necessarily be UKIP, but rather the Jeremy Corbyn-led Labour Party – as close to the Michael Foot-led opposition in the early 1980s as any Labour Leadership.” The EU would survive, intact, with no further “exits.” “European integration is therefore a gambit for relevance by Europe’s declining powers. Brexit will not create centrifugal forces that tear the EU apart, and could in fact enhance the sinews that bind EU member states in a bid for 21st century geopolitical relevance.” Thus far, all three predictions have proven prescient. Not only was the probability of Brexit understated, but the electorate actually voted to exit the EU.1 The Conservative Party has wrapped itself into an intellectual pretzel trying to deliver on a referendum that the pro-Brexit Tories – a minority in the party – promised would not mean losing access to the Common Market. And the EU has not only seen no other “exits,” but has held firm and united in the negotiations with the U.K. while witnessing an increase in the support for its troubled currency union, both in the Euro Area in aggregate as well as in crisis-ridden Italy (Chart II-1). Chart II-1The Euro Area Stands Unified
The Euro Area Stands Unified
The Euro Area Stands Unified
The net assessment we conducted in 2016 correctly gauged what the Brexit referendum was about and what it was not about. Our view was that behind the angst lay factors too general to be laid at the feet of European integration. Decades of supply-side reforms combined with competition from emerging economies led to a sharp rise in U.K. income inequality (Chart II-2), the erosion of its manufacturing economy (Chart II-3), and the ballooning of the country’s financial sector (Chart II-4). As a result, the U.K.’s income inequality and social mobility were, in 2016 as today, much closer to those of its Anglo-Saxon peer America than to those of its continental European neighbors (Chart II-5). Chart II-2Brits Saw Inequality Surge
Brits Saw Inequality Surge
Brits Saw Inequality Surge
Chart II-3Manufacturing Jobs Collapsed
Manufacturing Jobs Collapsed
Manufacturing Jobs Collapsed
Chart II-4The Financial Bubble Burst
The Financial Bubble Burst
The Financial Bubble Burst
Chart II-5
The underlying economic angst has continued to influence British politics since Brexit. Campaigning on an anti-austerity platform in the summer of 2017, the Labour Party leader Jeremy Corbyn nearly won the general election, only underperforming the Conservative vote by 2% (Chart II-6). The election was supposed to politically recapitalize Theresa May and allow her to lead the U.K. out of the EU. But the failure to secure a single-party majority created the political math in the House of Commons that is today preventing the prime minister from executing on Brexit. There are simply not enough committed Brexiters in Westminster to deliver on the relatively hard Brexit – no access to the EU Common Market or customs union – that Prime Minister May has put on offer (Chart II-7).
Chart II-6
Chart II-7
The decision not to pursue a customs union arrangement with the EU is particularly disastrous. As our colleague Dhaval Joshi – Chief Strategist of BCA’s European Investment Strategy – has pointed out, remaining in the customs union would have protected the cross-border supply chains that are vital to many U.K. businesses and would have avoided a hard customs border on the island of Ireland.2 However, the slim margin of the Tory victory in 2017 has boosted the influence of the 20-to-40 hard-Brexiters in the party. They pushed Theresa May to the extreme, where a customs union arrangement – let alone access to the Common Market – became politically unpalatable. Had the British electorate genuinely wanted “Brexit über alles,” or the relatively hard Brexit on offer today, the margin of victory for Leave would have been greater. Furthermore, the electorate would not have come so close to giving the far-left Corbyn – who nonetheless supports the softest-of-soft Brexits – a majority in mid-2017. The slim margin of victory effectively tied May’s hands in her subsequent negotiations with both the EU and her own party. But there was more to the 2016 referendum than just general malaise centered on the economy and inequality. There were idiosyncratic events that provided tailwinds for the Leave campaign. Or, as we put it in 2016: Certainly, a number of ills have befallen the continent in quick succession: the euro area sovereign debt crisis, Russian military intervention in Ukraine, rampant migrant inflows from Africa and the Middle East, and terrorist attacks in France. It is no surprise that the U.K. populace wants to think twice about tying itself even more closely to a Europe apparently on the run from the Four Horsemen of the Apocalypse. The two issues we would particularly focus on were the migrant crisis and terrorist attacks in Europe. Data ahead of the referendum clearly gave credence to the view that the influx of migrants was raising “concerns about immigration and race.” This angst was primarily focused on EU migrants who came to the U.K. legally (Chart II-8), but the influx of millions of migrants into the EU in 2015 – peaking at 172,000 in the month of October – certainly bolstered the anxiety in the U.K. (Chart II-9).3 Chart II-8EU Migrants A Source Of Anxiety In 2016
EU Migrants A Source Of Anxiety In 2016
EU Migrants A Source Of Anxiety In 2016
Chart II-9The Refugee Crisis Boosted Brexit Vote
The Refugee Crisis Boosted Brexit Vote
The Refugee Crisis Boosted Brexit Vote
Terrorism was another concern. In the 18 months preceding the referendum, continental Europe experienced 13 deadly terror attacks. Two were particularly egregious: the November 2015 Paris terror attack that led to 130 deaths, and the March 2016 Brussels terror attack that led to 32 deaths. Both the migration and terror crises, however, were temporary and caused by idiosyncratic variables with short half-lives. BCA’s Geopolitical Strategy argued that both would eventually abate. The migration crisis would subside due to firming European attitudes towards asylum seekers and the exhaustion of the supply of migrants as the Syrian Civil War drew to its tragic close. The extremist Islamic terror attacks would dwindle due to the decrease in the marginal utility of terror that has been observed in previous waves of terrorism (Chart II-10). Neither forecast was popular with our client base, but both have been spot on. Chart II-10Fewer Attacks Due To Declining Marginal Utility Of Terror
Fewer Attacks Due To Declining Marginal Utility Of Terror
Fewer Attacks Due To Declining Marginal Utility Of Terror
The point is that the British electorate was never as Euroskeptic as the Euroskeptics cheering on Brexit thought. Support for EU integration has waxed and waned for decades (Chart II-11). Instead, a combination of macro-malaise caused by the general plight of the middle class – the same factors that have given tailwinds to populist policymakers across developed markets – and idiosyncratic crises in the middle of this decade created the context in which the public voted to leave the EU. Whatever the vote was for, we can say with a high degree of certainty that it was not in favor of the current deal on offer, a relatively hard Brexit. After all, the pro-Leave Tories almost universally campaigned in favor of remaining in the Common Market post-Brexit.4 Chart II-11Data Does Not Support Euroskeptic U.K.
Data Does Not Support Euroskeptic U.K.
Data Does Not Support Euroskeptic U.K.
Today, Bregret has clearly set in. Not only on the specific issue of whether the U.K. should leave the EU – where the gap between Bremorseful voters and committed Brexiters is now 8% (Chart II-12), a 12% swing since just after the referendum – but also on the more existential question of whether U.K. citizens feel European (Chart II-13). Chart II-12Bregret Has Set In...
Bregret Has Set In...
Bregret Has Set In...
Chart II-13...And Brits Feeling More European
...And Brits Feeling More European
...And Brits Feeling More European
The political reality of Bregret is the most important variable in predicting Brexit. Not only is it difficult for Prime Minister May to deliver her relatively hard Brexit in Westminster due to the mid-2017 electoral math, but it is especially the case when the electorate does not want it. Yes, the mid-2016 referendum is an expression of a democratic will that must be respected. But no policymaker wants to respect the referendum at the cost of disrespecting the current disposition of the median voter, which is revealed through polls. Doing so will cost them in the next election. Reviewing “how we got here” is essential in forecasting the tactical, strategic, and secular time horizons in the ongoing Brexit imbroglio. To this task we now turn. Bottom Line: The U.K. electorate is not staunchly Euroskeptic: data clearly support this fact. The Brexit referendum simply came at the right time for the Leave vote, as the secular forces of middle-class discontent combined with idiosyncratic crises of migration and terror. Three years following the referendum, the discontent remains unaddressed by British policymakers while the idiosyncratic crises have abated. As such, Bregret has set in, creating a new reality that U.K. policymakers must respond to if they want to retain political capital. Where Are We Going? The Tactical And Strategic Time Horizons The EU has offered a two-step delay to the Article 50 deadline of March 29. The first option is a delay until May 22, but only if Theresa May successfully passes her Brexit plan through Westminster. The second option is a delay until April 12. This would come in effect if the House of Commons rejects the deal on offer. The short time frame is supposed to pressure London to come up with the next steps, which the EU has inferred would either be to get out of the bloc without a deal or to plan for a long-term extension. Although there are no official conditions to awarding a long-term extension, it is clear that the EU only envisages three options: Renegotiate the terms of Brexit, to include either a customs union or full Common Market membership (a softer Brexit); Hold a general election to break the impasse; Hold another referendum. The EU is suggesting that it could deny the U.K. an extension if London does not come back with a plan. There are two reasons why we would call the EU’s bluff. First, it is likely an attempt to help May get the deal through the House of Commons by creating a sense of urgency. Second, the European Court of Justice (ECJ) ruled in December 2018 that the U.K. could “revoke that notification unilaterally, in an unequivocal and unconditional manner, by a notice addressed to the European Council in writing.”5 The only requirement is that the notification be sent to Brussels prior to March 29 (or, in the case of a mutually agreed upon extension, prior to April 12). It is increasingly likely that, after the deal on offer fails, Theresa May will have to go “hat-in-hand” to the EU to ask for a much longer extension. She will have until April 12 to ask for that extension, but it would require participation in the European Parliamentary (EP) elections on May 23. Prime Minister May has said that the U.K. will not hold those elections. We beg to differ. Not holding the election would allow the EU to end the U.K.’s membership in the bloc, which would by default mean contravening the Parliament’s will to reject a no-deal Brexit (which it did in a rebuke to the government in March). As such, the U.K. will absolutely hold an EP election in May. Yes, it will be a huge embarrassment to the Conservative government. And we would venture that the election would turn out a huge pro-EU majority from the U.K., given that it is the Europhile side of the aisle that is now excited and activated, further embarrassing the ruling government. The most likely scenario, therefore, is that Theresa May either resigns and is replaced by a soft-Brexit Tory, or that she agrees to a long-term extension to give the U.K. time to call a new election. As we have been arguing throughout the year, the only way to break the impasse without calling a referendum – is to call a new election. A new election would be contested almost exclusively on the issue of Brexit – unlike the 2017 election, which Jeremy Corbyn managed to be almost exclusively contested on the issue of austerity. As such, the winner would have a clear political mandate to pursue the Brexit of their choice. If it is Jeremy Corbyn, this would mean a second referendum, given his recent conversion to supporting one. If Theresa May remains prime minister, it would be her relatively hard Brexit option; if another Tory replaces her, it would potentially be a softer Brexit. Intriguingly, Theresa May is coming up to the average “expiry date” of a “takeover” prime minister, which is 3.3 years (Chart II-14).
Chart II-14
Why do we think that Theresa May would be replaced with a soft Brexit Tory? Because there are simply not enough members of parliament in the Conservative Party caucus to elect a hard Brexiteer. Furthermore, the current deal on offer, which is a form of hard Brexit, clearly has no chance of passing in the House of Commons. Theresa May herself did not support the Leave campaign, but she converted into a hard Brexiteer due to the pressures in the Conservative Party caucus. If, on the other hand, we are wrong and the Conservative Party elects a hard Brexit Tory as leader, the odds of losing the election to the Labour Party would increase. Furthermore, the impasse in the House of Commons would not be resolved as Theresa May would be replaced by a prime minister with essentially the same approach to Brexit. Confused? You are not alone. Diagram II-1 illustrates the complexity of the tactical (0-3 months) and strategic (3-12 months) time horizons. There are so many options over the next six months alone that we ran out of space in our diagram to consider the consequences of the general election.
Chart II-
Needless to say, an election would induce volatility in the market as it would put Jeremy Corbyn close to the premiership. While he has now promised a second referendum, his government would also implement policies that could, especially in the short term, agitate the markets. Our forecasts of the currency moves alone suggest that volatility is the only sure bet over tactical and strategic time horizons. We do not have a high-conviction view on a directional call on the pound or U.K. equities. However, global growth concerns, combined with political uncertainty, should create a bond-bullish environment. Bottom Line: Over the course of the year, political uncertainty will remain high in the United Kingdom. A general election is the clearest path to breaking the current deadlock. However, it is not guaranteed, as Labour’s recent decline in the polls appears to be reversing since Jeremy Corbyn finally succumbed to the demands that he support a new referendum (Chart II-15). Chart II-15Labour Party Revives On Referendum Support
Labour Party Revives On Referendum Support
Labour Party Revives On Referendum Support
The Secular Horizon BCA Geopolitical Strategy believes that the median voter is the price maker in the political market place. Politicians are merely price takers. This is why Theresa May’s notion that the sanctity of the 2016 referendum cannot be abrogated is doubly false. First, she cannot truly claim from the slim 52%-48% result that U.K. voters want her form of Brexit. The referendum therefore may be a sacred expression of the democratic will, but her “no customs union” Brexit option is not holy water: It is an educated guess at best, pandering to hard Brexit Tories (a minority of the electorate) at worst. Given that 48% of the electorate wanted to remain in the EU and that a large portion of Brexit voters wanted a Common Market membership as part of Brexit, it is mathematically obvious that the softest of soft Brexit options was the desire of the median voter in June 2016. Furthermore, polling data (presented in Chart II-12 and Chart II-13 on page 28) now clearly show that the median voter is migrating away from even the softest of soft Brexit options to the “Stay” camp. Bregret has set in and a strong plurality of voters no longer supports Brexit. The question behind Chart II-12 is unambiguous. It clearly asks, “In hindsight, do you think Britain was right or wrong to vote to leave the EU?” What does all of this infer for the long term, or secular, horizon? First, an election this year could usher in a Labour government that delivers a new referendum. At this time, given the polling data and the geopolitical context, sans terror and migration crises, we would expect such a referendum to lead to a win for the Stay camp. Second, an election that produces a soft Brexit prime minister or negotiated outcome would allow the U.K. to leave the EU in an orderly fashion. A new Tory prime minister, pursuing a soft Brexit outcome, could even entice some Labour MPs to cross the aisle and support such an exit from the bloc. However, over a secular time horizon of the next two-to-three years, we doubt that a soft Brexit outcome would be viable. Investors have to realize that the vote on leaving the EU does not conclude the U.K. long-term deal with the bloc. That negotiating phase will last during the transition phase, over the next two-to-three years, and would conclude in yet another Westminster vote – and likely crisis – at the end of the period. If this deal entails membership in the Common Market, our low- conviction view over the long term is that it will ultimately fail. Take the financial community’s preferred soft Brexit option, the so-called super soft “Norway Plus” option. A Norway Plus option would entail the highest loss of sovereignty imaginable, given that the U.K. would essentially pay full EU membership fees with no ability to influence the regulatory policies that London would have to abide by. There is also a debate as to whether London would be able to constrict immigration from the EU under that option over the long term, a key demand of Brexiters.6 As such, the only viable option would be to switch to a customs union relationship. However, we fear that even this option may no longer be available to U.K. policymakers. Conservative Party leaders have wasted too much time and lost too much of the public’s good will. With only 40% of the electorate now considering Brexit the correct decision, it is possible that even a customs union arrangement will be unacceptable by the end of the transition period. Aside from the electorate’s growing Bregret, there is also the economic logic – or lack thereof – behind a customs union. A customs union would ensure the unfettered transit of goods between the U.K. and the continent, but not of services. This arrangement greatly favors the EU, not the U.K., as the latter has a wide (and growing) deficit in goods and an expanding surplus in services with the bloc (Chart II-16). Chart II-16Services Are Key For The U.K.
Services Are Key For The U.K.
Services Are Key For The U.K.
The only logic behind selecting a customs union over the Common Market is that a customs union would allow the U.K. to conclude separate trade deals with the rest of the world. While that may be a fantasy of the few remaining laissez-faire free traders in the U.K. Conservative Party, the view hardly represents the desire of the median voter. Other than a potential trade deal with the U.S., it is practically inconceivable to expect the U.K. electorate to support a free trade agreement with China or India, both of which would likely entail an even greater loss of blue-collar jobs. Even a trade deal with the U.S. would likely face political opposition, given that the U.K. is highly unlikely to be given preferential treatment by an economy seven times its size.7 The fact of the matter is that the Conservative Party has wasted its window of opportunity to push a hard, or moderately hard (customs union), Brexit through Parliament. Bregret has set in, as the doyens of Brexit increasingly pursued an unpopular strategy. On the other hand, a Brexit that retains the U.K. membership in the Common Market has never had much logic to begin with. Where does this leave the U.K. in the long term? Given the time horizon and the uncertainty on multiple fronts, our low-conviction view is that it leaves the U.K. inside the European Union. Bottom Line: The combination of increasing Bregret, lack of economic logic behind a customs union membership alone, and the lack of a political logic behind a Common Market membership, suggests that Brexit is unsustainable over the secular time horizon. This imperils the ultimate deal between the U.K. and the EU, which we think will not be able to pass the House of Commons in two-to-three years when it comes up for approval. This is a low-conviction view, however, as political realities can change. Support for Brexit could turn due to exogenous factors, such as a global recession that renews the Euro Area economic imbroglio or a major geopolitical crisis. Both are quite likely over the secular time horizon. Investment Implications Today, cable is cheap, trading at an 18% discount to its long-term fair value as implied by purchasing-power parity models (Chart II-17). The growing probability that the U.K. may, down the road, remain in the European Union means that, at current levels the pound is indeed attractive, especially against the U.S. dollar. Chart II-17Cable Attractive On Higher Odds Of Bremain
Cable Attractive On Higher Odds Of Bremain
Cable Attractive On Higher Odds Of Bremain
However, when it comes to short-term dynamics, the picture is much murkier. The low probability of a no-deal Brexit implies limited downside. However, the path to get the U.K. to abandon the current relatively hard Brexit is also one that involves a new election. This implies that before a resolution is reached, multiple scenarios are possible, including one where Corbyn becomes the next prime minister. Jeremy Corbyn could be the most left-of center leader of any G-10 nation since Francois Mitterrand in France in the early 1980s. Mitterrand’s audacious nationalization and left-leaning policies were met with a collapse in the French franc (Chart II-18). Chart II-18A Left-Wing Leader Bodes Ill For The Currency
A Left-Wing Leader Bodes Ill For The Currency
A Left-Wing Leader Bodes Ill For The Currency
Global growth also has an impact on cable. Despite all the noise around Brexit, the reality remains that exports constitute 30% of U.K. GDP, a larger contribution to output than in the euro area. This means that if global growth deteriorates, GBP/USD will face another headwind. If, however, global growth improves, then cable would face a new tailwind. Since BCA is of the view that global growth will likely trough by the summer, we are inclined to be positive on the pound. Netting out all those factors, it makes sense for long-term investors to buy the GBP, using the dips along the way to build a larger position in this currency. Even on a six-to-twelve-month basis, the path of least resistance for cable is likely upward. The problem is that risk-adjusted returns are likely to be poor as volatility will remain very elevated. We therefore recommend that short-term investors instead buy the 2-year call while selling 3-month ones (Chart II-19). Chart II-19Volatility Will Be A Challenge For Short Term Investors
Volatility Will Be A Challenge For Short Term Investors
Volatility Will Be A Challenge For Short Term Investors
Marko Papic Senior Vice President Chief Geopolitical Strategist Mathieu Savary Vice President The Bank Credit Analyst III. Indicators And Reference Charts Equities have had a volatile month of March, something that was bound to happen after the violent rally witnessed from the end of December to the end of February. When a rally is being tested, it always make sense to review our indicators to gauge whether or not a trend change is in the offing. Generally, our indicators remain broadly positive. Our Willingness-to-Pay (WTP) indicators for the U.S. and the euro area continue to improve. Meanwhile, it has begun to hook back up in Japan. The WTP indicators track flows, and thus provide information on what investors are actually doing, as opposed to sentiment indexes that track how investors are feeling. The current readings in major advanced economies thus suggest that investors are still inclined to add to their stock holdings. Our Revealed Preference Indicator (RPI) has however once again deteriorated, suggesting that the period of churn in global equities prices could last a bit longer. This indicator is essentially saying that in order to resume their ascent, stocks need a bit more time to digest their previous surge. The RPI combines the idea of market momentum with valuation and policy measures. It provides a powerful bullish signal if positive market momentum lines up with constructive signals from the policy and valuation measures. Conversely, if constructive market momentum is not supported by valuation and policy, investors should lean against the market trend. According to BCA’s Composite Valuation Indicator, an amalgamation of 11 measures, the U.S. stock market remains slightly overvalued from a long-term perspective. Nonetheless, despite this year’s rally, the S&P 500 offers a much more attractive risk/reward profile than it did in the fall. Moreover, our Monetary Indicator has shifted out of negative territory for stocks, and is now decisively in stimulative territory. The Fed’s dovish forward guidance last week only reinforces the message from this indicator. Our Composite Technical Indicator for stocks had broken down in December, but it is finally flashing a buy signal. This further confirms that the current period of churn is most likely to ultimately make way for a continued rally in the S&P 500. The 10-year Treasury yield remains within its neutral range according to our valuation model. Moreover, our technical indicator flags a similar picture. This means that without signs of improvements in global growth, price action alone will not be enough to lift bond yields higher. That being said, since BCA expects that over the next 24 months, the Fed will lift rates more than the OIS curve anticipates, and since the term premium is incredibly low, once green shoots for global growth become evident, bonds could suffer a violent selloff. The U.S. dollar is still very expensive on a PPP basis. Our Composite Technical Indicator is not as overbought as it once was, but it is far from having reached oversold levels either. This combination suggests that the greenback could experience further downside this year. However, for this downside to materialize, global growth will first have to stabilize. EQUITIES: Chart III-1U.S. Equity Indicators
U.S. Equity Indicators
U.S. Equity Indicators
Chart III-2Willingness To Pay For Risk
Willingness To Pay For Risk
Willingness To Pay For Risk
Chart III-3U.S. Equity Sentiment Indicators
U.S. Equity Sentiment Indicators
U.S. Equity Sentiment Indicators
Chart III-4Revealed Preference Indicator
Revealed Preference Indicator
Revealed Preference Indicator
Chart III-5U.S. Stock Market Valuation
U.S. Stock Market Valuation
U.S. Stock Market Valuation
Chart III-6U.S. Earnings
U.S. Earnings
U.S. Earnings
Chart III-7Global Stock Market And Earnings: Relative Performance
Global Stock Market And Earnings: Relative Performance
Global Stock Market And Earnings: Relative Performance
Chart III-8Global Stock Market And Earnings: Relative Performance
Global Stock Market And Earnings: Relative Performance
Global Stock Market And Earnings: Relative Performance
FIXED INCOME: Chart III-9U.S. Treasurys And Valuations
U.S. Treasurys And Valuations
U.S. Treasurys And Valuations
Chart III-10Yield Curve Slopes
Yield Curve Slopes
Yield Curve Slopes
Chart III-11Selected U.S. Bond Yields
Selected U.S. Bond Yields
Selected U.S. Bond Yields
Chart III-1210-Year Treasury Yield Components
10-Year Treasury Yield Components
10-Year Treasury Yield Components
Chart III-13U.S. Corporate Bonds And Health Monitor
U.S. Corporate Bonds And Health Monitor
U.S. Corporate Bonds And Health Monitor
Chart III-14Global Bonds: Developed Markets
Global Bonds: Developed Markets
Global Bonds: Developed Markets
Chart III-15Global Bonds: Emerging Markets
Global Bonds: Emerging Markets
Global Bonds: Emerging Markets
CURRENCIES: Chart III-16U.S. Dollar And PPP
U.S. Dollar And PPP
U.S. Dollar And PPP
Chart III-17U.S. Dollar And Indicator
U.S. Dollar And Indicator
U.S. Dollar And Indicator
Chart III-18U.S. Dollar Fundamentals
U.S. Dollar Fundamentals
U.S. Dollar Fundamentals
Chart III-19Japanese Yen Technicals
Japanese Yen Technicals
Japanese Yen Technicals
Chart III-20Euro Technicals
Euro Technicals
Euro Technicals
Chart III-21Euro/Yen Technicals
Euro/Yen Technicals
Euro/Yen Technicals
Chart III-22Euro/Pound Technicals
Euro/Pound Technicals
Euro/Pound Technicals
COMMODITIES: Chart III-23Broad Commodity Indicators
Broad Commodity Indicators
Broad Commodity Indicators
Chart III-24Commodity Prices
Commodity Prices
Commodity Prices
Chart III-25Commodity Prices
Commodity Prices
Commodity Prices
Chart III-26Commodity Sentiment
Commodity Sentiment
Commodity Sentiment
Chart III-27Speculative Positioning
Speculative Positioning
Speculative Positioning
ECONOMY: Chart III-28U.S. And Global Macro Backdrop
U.S. And Global Macro Backdrop
U.S. And Global Macro Backdrop
Chart III-29U.S. Macro Snapshot
U.S. Macro Snapshot
U.S. Macro Snapshot
Chart III-30U.S. Growth Outlook
U.S. Growth Outlook
U.S. Growth Outlook
Chart III-31U.S. Cyclical Spending
U.S. Cyclical Spending
U.S. Cyclical Spending
Chart III-32U.S. Labor Market
U.S. Labor Market
U.S. Labor Market
Chart III-33U.S. Consumption
U.S. Consumption
U.S. Consumption
Chart III-34U.S. Housing
U.S. Housing
U.S. Housing
Chart III-35U.S. Debt And Deleveraging
U.S. Debt And Deleveraging
U.S. Debt And Deleveraging
Chart III-36U.S. Financial Conditions
U.S. Financial Conditions
U.S. Financial Conditions
Chart III-37Global Economic Snapshot: Europe
Global Economic Snapshot: Europe
Global Economic Snapshot: Europe
Chart III-38Global Economic Snapshot: China
Global Economic Snapshot: China
Global Economic Snapshot: China
Mathieu Savary Vice President The Bank Credit Analyst Footnotes 1 At the time of publication of our March report, we still had a low-conviction view that the vote would swing towards Stay at the last moment. 2 Please see BCA Research European Investment Strategy Weekly Report, “Important Message From The Currency Markets,” dated March 14, 2019, available at eis.bcaresearch.com. 3 Trying to play up the threat of unchecked migration, the U.K. Independence Party ran a famous campaign poster showing hundreds of refugees on a road under the title of “Breaking Point – The EU has failed us all.” Despite the fact that the U.K. accepted only around 10,000 Syrian refugees since the 2015 crisis. Germany has accepted over 700,000 while Canada – which is located across the Atlantic Ocean on a different continent – accepted over 40,000. Even the impoverished Serbia has accepted more Syrian refugees than the U.K. 4 One of the most prominent Leave supporters, Boris Johnson, famously quipped after the referendum result that “There will continue to be free trade and access to the single market.” 5 Please see The European Court of Justice, “Judgement Of The Court,” In Case C-621/18, dated December 10, 2018, available at curia.europa.eu. 6 Proponents of the Norway Plus option point out that Article 112(1) of the European Economic Area (EEA) Agreement allows for restriction of movement of people within the area. However, these restrictions are intended to be used in times of “serious economic, societal or environmental difficulties.” It certainly appears to be an option for London to restrict EU migration, but it is not clear whether Europe would agree for this to be a permanent solution. Liechtenstein has been using Article 112 to impose quantitative limitations on immigration for decades, but that is because its tiny geographical area is recognized as a “specific situation” that justifies such restrictions. 7 President Donald Trump may want to give the U.K. preferential trade terms on the basis of the filial Anglo-Saxon relationship alone, but it is highly unlikely that the increasingly protectionist Congress would do the same. There is also no guarantee that President Trump will be around to bring such trade negotiations across the finish line. EQUITIES:FIXED INCOME:CURRENCIES:COMMODITIES:ECONOMY:
Highlights The odds of a continued earnings contraction have not yet fallen to the point that would warrant an overweight stance towards Chinese versus global stocks over the coming 6-12 months. While we maintain Chinese stocks on upgrade watch and may recommend increasing exposure soon, the bottom line for investors is that it is still too early for us to confidently project a sustained uptrend. While most investors attribute the chronic discount of Chinese stocks relative to the global average as being due to a sizeable equity risk premium, our analysis suggests that China’s low payout ratio and mediocre earnings growth are the true causes. This implies that China’s re-rating potential is capped barring a major structural improvement in earnings growth. Investors should pay close attention to the details of a U.S./China currency stability pact that will reportedly be included in any trade deal between the two countries. Such a pact may set up an important natural experiment for CNY/USD, and could be a revelatory event for China’s exchange rate regime. Feature Last week’s FOMC meeting dominated the headlines of the financial press, and for good reason. The Fed surprised investors with a material downgrade to their expected path of the federal funds rate over the next three years, a shift that largely reflected concerns about global growth. The subsequent inversion of the U.S. 10-year / 3-month yield curve in response to the very disappointing euro area flash manufacturing PMI for March confirms that many investors remain convinced that Fed policy is too tight and that easing is likely over the coming year.1 On the positive side, investor concerns that reflationary policy is needed in the U.S. and euro area are likely overblown: the plunge in the euro area PMI at least in part reflects the near-term uncertainty over the possibility of a hard Brexit (which will probably be avoided), whereas the Fed is pausing at a level of real interest rates that is well below real GDP growth, which means that monetary policy is still stimulative for the U.S. economy (Chart 1). Chart 1U.S. Monetary Policy Is Still Stimulative
U.S. Monetary Policy Is Still Stimulative
U.S. Monetary Policy Is Still Stimulative
But Chart 2 highlights that a generalized slowdown in global growth is responsible for at least part of the sharp weakness in Chinese export growth over the past few months, which we had been mostly attributing to a catch-up phase following a (perversely and ironically) beneficial tariff front-running effect that had temporarily boosted trade growth last year. Chart 2Global Weakness At Least Partly Responsible For A Sharp Export Slowdown
Global Weakness At Least Partly Responsible For A Sharp Export Slowdown
Global Weakness At Least Partly Responsible For A Sharp Export Slowdown
Ongoing weakness in the global economy, were it to persist, would imply that China’s external demand outlook is even less encouraging than we had previously assumed. This would raise the stakes for a trade deal with the U.S. to be agreed upon soon, as well as a continued uptrend in the pace of Chinese credit growth. Investors should closely watch the new export orders component of the March NBS manufacturing PMI later this week for signs that exporter sentiment is improving, as well as the overall Caixin PMI to confirm that smaller firms continue to benefit from the PBOC’s targeted easing efforts. When Should Investors Upgrade Chinese Stocks On A Cyclical Basis? In our view, most global investors have been focused on the wrong risk factor for Chinese stocks for the better part of the past year. In the wake of the near-vertical February rise in Chinese domestic stocks, the most common question we have received from clients is whether they should be increasing their cyclical exposure to Chinese stocks in general, and A-shares in particular. In response to the January surge in credit we placed Chinese stocks on upgrade watch in our February 27 Weekly Report,2 but we are not yet ready to recommend an outright cyclical overweight. Investors should be at the ready and aiming, but should not yet fire. In our view, most global investors have been focused on the wrong risk factor for Chinese stocks for the better part of the past year. We have noted in several previous reports that investors have focused nearly exclusively on the U.S.-China trade war since the beginning of 2018, and have largely ignored a slowing domestic economy (Chart 3). Given this, it is not surprising that a sharp improvement in the odds of a deal (which occurred at the beginning of November) has led to a material rally over the past few months versus global stocks. Chart 3The Prospect Of A Trade Deal Has Been The Primary Driver Of China-Related Assets
The Prospect Of A Trade Deal Has Been The Primary Driver Of China-Related Assets
The Prospect Of A Trade Deal Has Been The Primary Driver Of China-Related Assets
In fact, we predicted in our December 5 Weekly Report that positive sentiment about a deal would boost the relative performance of Chinese stocks over the coming few months, and recommended a tactical overweight stance at that time.3 A cyclical (i.e. 6-12 month) overweight, however, is a different story. Sentiment alone rarely drives financial markets over a 1-year time horizon, meaning that investors need to have some degree of confidence that domestic demand will meaningfully improve over the next 12 months to justify a cyclical upgrade. Certainly, we acknowledge that there have been several positive developments pointing to such an outcome. Chinese monetary conditions have become extremely easy, credit is no longer contracting and surged in January, the Caixin PMI rose notably in February, and some form of a trade deal remains the most likely outcome of the ongoing talks. In addition, Chinese stocks still remain significantly below their 2018 peak (Chart 4), meaning that there is still material potential upside if Chinese earnings do not contract. Chart 4Chinese Stocks Still Have Room To Rise If The Earnings Outlook Stabilizes
Chinese Stocks Still Have Room To Rise If The Earnings Outlook Stabilizes
Chinese Stocks Still Have Room To Rise If The Earnings Outlook Stabilizes
A moderate credit expansion appears to be underway, but coincident activity continues to weaken and earnings appear to have more downside. However, there are also several reasons to be cautious cyclically: Chart 5The Past Three Months Imply A Moderate Credit Uptrend
The Past Three Months Imply A Moderate Credit Uptrend
The Past Three Months Imply A Moderate Credit Uptrend
Chart 6Chinese Coincident Economic Activity Continues To Weaken
Chinese Coincident Economic Activity Continues To Weaken
Chinese Coincident Economic Activity Continues To Weaken
Chinese and U.S. policymakers have not only failed to set a date for an agreement to be signed by President’s Xi and Trump, but recent new reports suggest that momentum may be slowing and that a meeting may be postponed until June or later.4 Even if the deal does not fall through, material further delays could cause investors to get anxious and vote with their feet. Such a selloff could be violent, given the extremely sharp rise in domestic stock prices over the past six weeks. The evidence so far points to a moderate expansion in credit (Chart 5), reflecting the fact that policymakers are still somewhat concerned about financial stability and the need to prevent significant further leveraging of the private sector. This means that the odds are not yet in favor of a credit “overshoot” like what occurred in 2015/2016, implying that the pickup in growth is likely to be comparatively weaker this time around. Since 2010, monetary conditions and money & credit growth appear to be the best predictors of investment-relevant Chinese economic activity.5 While a moderate credit expansion appears to be underway, there has been no discernable pickup in money growth.6 This discrepancy likely means that the recent improvement in credit has occurred due to non-bank financial institutions, further suggesting that this economic recovery will probably be less powerful and less broad-based than during past cycles. While a moderate expansion in credit does suggest that China’s economy will bottom at some point in the coming months, coincident economic activity continues to decelerate (Chart 6). A continuation of this trend, particularly if coupled with an investor “crisis of faith” in the trade talks, could lead to a very significant retracement in Chinese equity prices before durably bottoming for the year. Trailing EPS growth is decelerating, but it has yet to contract on a year-over-year basis as would be implied by the net earnings revisions ratio (Chart 7) and the coincident activity indicators shown in Chart 6. Chinese investable EPS fell 30% during the 2015/2016 episode (20% for domestic stocks), implying meaningful further downside even if economic activity does not weaken as significantly over the coming months. Chart 7Net Earnings Revisions Point To More Downside For Earnings
Net Earnings Revisions Point To More Downside For Earnings
Net Earnings Revisions Point To More Downside For Earnings
Chart 8 presents a helpful way for investors to make a net assessment of all of the factors highlighted above. The chart shows our earnings recession model for the MSCI China Index, and shows what is likely to occur if a trade deal causes a full recovery in Chinese exporter sentiment, China’s export-weighted RMB stays roughly at current levels, and the very recent pace of credit growth (Dec-Feb) continues along its trend. Chart 8A Trade Deal And A Moderate Credit Expansion Will Likely Stabilize The Earnings Outlook
A Trade Deal And A Moderate Credit Expansion Will Likely Stabilize The Earnings Outlook
A Trade Deal And A Moderate Credit Expansion Will Likely Stabilize The Earnings Outlook
This scenario, were it to occur, would reduce the odds of a continued earnings contraction to the point that we would be comfortable recommending an overweight stance towards Chinese versus global stocks over the coming 6-12 months. While such a recommendation could come as soon as mid-April, the bottom line for investors is that it is still too early for us to confidently project this outcome. Should Chinese Stocks Be Priced At A Premium Or A Discount To Global Stocks? Most investors attribute the discount applied to Chinese stocks to a high equity risk premium (ERP), but our work paints a different picture. Besides questions about the appropriate cyclical allocation to Chinese stocks, the recent spike in interest among global investors towards A-shares has also led to a renewed focus about the degree to which Chinese stocks are cheap versus the global average. In a world where many financial assets are chronically expensive and Chinese policymakers appear to be responding to weaker economic activity, some investors question whether Chinese stocks deserve to be priced at a discount (Chart 9). Our sense is that most investors attribute the discount to a high equity risk premium (ERP) stemming from the enormous rise in Chinese non-financial corporate debt over the past decade, but our research paints a different picture. Chart 9The Chinese Equity Discount: A High ERP, Or Something More Sinister?
The Chinese Equity Discount: A High ERP, Or Something More Sinister?
The Chinese Equity Discount: A High ERP, Or Something More Sinister?
One way of analyzing the risk premium of an equity market is to use the well-known constant Gordon growth model. Equation 1 below presents the theoretically justified 12-month trailing P/E ratio as a function of the payout ratio, the risk-free rate, the ERP, and the long-term dividend growth rate (which is equal to the long-term earnings growth rate given a constant payout ratio). Equations 2 and 3 re-arrange equation 1 to express the ERP and long-term growth rate, respectively, on the left-hand side of the equation. Equation 1: P0/E0 = (D1/E0)/(rf + ERP – g) Equation 2: ERP = [(D1/E0)/(P0/E0)] + g - rf Equation 3: g = rf + ERP-[(D1/E0)/(P0/E0)] To illustrate the approach, Chart 10 applies equation 2 to the U.S. equity market and compares it with the annual dividend discount model equity risk premium published by Professor Aswath Damodaran from New York University’s Stern School of Business,7 a well-known expert in the theory and practice of asset valuation. While there are some differences in the level of the series owing to slightly different methodologies, the overall profile of the two series is generally similar. Chart 10Our DDM Methodology For The U.S. Generates Results Similar To Other Important Estimates
Our DDM Methodology For The U.S. Generates Results Similar To Other Important Estimates
Our DDM Methodology For The U.S. Generates Results Similar To Other Important Estimates
Proxying the market’s long-term growth expectations in a large, mature economy such as the U.S. is materially easier than is the case in an emerging market such as China. As such, instead of solving for the equity risk premium directly when judging whether China’s discount is “deserved”, we use equation 3 to solve for the implied long-term growth rate given an assumed (and very conservative) ERP range of 2-3%, using the global P/E ratio. In other words, we ask the following question: what kind of earnings growth do Chinese stocks need to achieve over the long run in order to justify the same earnings multiple as the global average, given an equity risk premium of 2-3%? Chart 11 presents the answer to this question, for both the domestic and the investable market. We use domestic 10-year bond yields as the risk-free rate in the case of the A-share market, and U.S. 10-year bond yields in the case of the MSCI China index as a proxy for the global risk-free rate. Finally, in each panel, the dashed horizontal lines denote the actual compound annual growth rate in earnings per share for each market, since the year noted next to each line. Chart 11A Low But Still Difficult L/T Earnings Hurdle Rate To Be Priced In Line With Global Stocks
A Low But Still Difficult L/T Earnings Hurdle Rate To Be Priced In Line With Global Stocks
A Low But Still Difficult L/T Earnings Hurdle Rate To Be Priced In Line With Global Stocks
Two important points are apparent from the chart: The required growth rate for both markets to be priced in line with global stocks are quite low, well below Chinese nominal GDP growth. At first blush, this might suggest that the valuation discount applied to China reflects a sizeable equity risk premium that could shrink over the coming 6-12 months (i.e. a beneficial re-rating of Chinese stocks). Since 2010 or 2011, actual growth rates in EPS are materially above the required growth range in both markets. However, over more recent time horizons, particularly 2013 and later, actual earnings growth has not only been below the range but has also been extremely poor in absolute terms. This is particularly true for the investable market, which has actually recorded negative growth in 12-month trailing EPS since 2014 or 2015. A dividend discount model approach suggests that the Chinese equity market discount is justified, barring a major structural improvement in earnings growth. Chart 12 highlights the problem with China’s stock market in a nutshell. For both the investable and domestic equity markets, the dividend payout ratio is well below the global average. This is a normal circumstance for small companies with high growth potential; firms re-invest a high portion of their earnings back into the company in order to build out their asset base and deliver even higher earnings in the future. Chart 12The Chinese Discount Visualized: A Low Payout Ratio, And Mediocre Earnings Growth
The Chinese Discount Visualized: A Low Payout Ratio, And Mediocre Earnings Growth
The Chinese Discount Visualized: A Low Payout Ratio, And Mediocre Earnings Growth
But panel 2 of Chart 12 shows that relative earnings for Chinese stocks versus the global average have not trended higher over the past decade, meaning that a higher earnings retention ratio among Chinese stocks has not led to a superior earnings profile. In response, global investors have rightly discounted Chinese stocks versus their global peers, a circumstance that is likely to continue unless Chinese earnings growth materially and sustainably improves. Our analysis implies that there is a natural limit to how far Chinese equities can ultimately be re-rated barring a major structural improvement in the economy, a factor that we may eventually have to contend with were we to recommend a cyclical overweight stance. Capped re-rating potential is unlikely to prevent Chinese stocks from trending higher in relative terms if economic fundamentals warrant an uptrend, but it may suggest that the duration or magnitude of the rise may be shorter than many investors hope. A Sino-U.S. Trade Deal: A Natural Currency Experiment In The Making? What explains the link between CNY-USD and the interest rate differential between the two countries? Finally, a brief note on the RMB. Since June 2018, changes in CNY-USD appear to have been closely aligned with the magnitude of proposed tariffs as a share of Chinese exports to the U.S., as would be implied in a simple open economy model with flexible exchange rates. Chart 13shows the levels implied by this framework in a variety of tariff scenarios, calculated based on the percent decline from the peak in the exchange rate in 1H 2018. As noted in our March 13 Weekly Report,8 CNY-USD today is consistent with the current tariff regime, implying potential upside if a trade deal with the U.S. rolls back some of the tariffs that have been imposed. Chart 13A Simple Equilibrium Framework Suggests CNY-USD May Rise Materially Further If Tariffs Are Rolled Back
A Simple Equilibrium Framework Suggests CNY-USD May Rise Materially Further If Tariffs Are Rolled Back
A Simple Equilibrium Framework Suggests CNY-USD May Rise Materially Further If Tariffs Are Rolled Back
However, Chart 14 shows that CNY-USD has been closely correlated with the interest rate differential between the two countries for several years, with the relationship having recently become a leading one. Chart 14 highlights that CNY-USD has moved higher than the rate differential would imply (painting the opposite picture as that shown in Chart 13), suggesting that the currency is more likely to depreciate than appreciate over the coming 6-12 months barring tighter monetary policy in China or outright rate cuts in the U.S. Chart 14Will Policymakers Or Rate Differentials Drive CNY-USD Over The Coming Year?
Will Policymakers Or Rate Differentials Drive CNY-USD Over The Coming Year?
Will Policymakers Or Rate Differentials Drive CNY-USD Over The Coming Year?
The relationship shown in Chart 14 is surprising, and we have struggled to understand the exact dynamics at play. As we highlighted in a September report,9 many global investors take the relationship for granted, given the strong historical link between interest rate differentials and exchange rates in developed countries. However, a major problem that arises in explaining Chart 14 is the fact that uncovered interest rate arbitrage (or the “carry trade”) cannot easily occur or cannot occur at all when one or both countries involved maintains capital controls. It is an important conundrum, and one that we have not been able to solve. From our perspective, there are only two scenarios that explain the close relationship between the exchange rate and interest rate differentials between the two countries: The relationship is causal, implying that capital flows in and out of the country are sufficiently large to enable a carry trade. The two series are correlated because of a third factor related in some way to the other two. In our view, scenario 1 is not likely. Capital is flowing out of China, but at a much slower rate than before,10 and the relationship shown in Chart 14 did not break down following China’s capital crackdown in 2015/2016. Ruling out scenario 1 necessarily implies that scenario 2 is correct. Our best guess concerning the missing third factor is that Chinese policymakers are looking to the rate differential as a guide to set the exchange rate, in order to mimic a market-based exchange rate in support of China’s goals to progressively liberalize (and internationalize) the currency. If true, this implies that China has full control of their exchange rate regardless of the prevailing interest rate differential, but that they are often choosing to follow what the differential implies. This is significant, because if Chinese and U.S. negotiators do agree to a “yuan stability pact” as has been reported in the press, a trade deal may set up an important natural experiment for the currency. In our view, a major upward move in the rate differential is unlikely over the coming year, implying that CNY-USD will persistently deviate from the relationship shown in Chart 14 if President Trump is not inclined to tolerate any real weakness in the RMB over the coming year. While the details of the currency agreement and the trade agreement more generally could allow for some decline in CNY-USD if coupled with an offsetting benefit for the U.S. (such as materially higher U.S. exports to China for some period), our bias is to believe that President Trump does not want to see a stronger dollar over the coming year in the lead-up to the 2020 election. If true, investors should pay close attention to the behavior of CNY-USD, as it is stands to be a revelatory event for China’s exchange rate regime. Jonathan LaBerge, CFA, Vice President Special Reports jonathanl@bcaresearch.com 1 Please see U.S. Bond Strategy and Global Fixed Income Strategy Weekly Reports “The New Battleground For Monetary Policy” and “Forward Guidance On Steroids”, dated March 26, 2019, for a detailed update on our view for Fed rate hikes and how investors should interpret the recent inversion in the yield curve. 2 Please see China Investment Strategy Weekly Report, “Dealing With A (Largely) False Narrative”, dated February 27, 2019, available at cis.bcaresearch.com 3 Please see China Investment Strategy Weekly Report, “2019 Key Views: Four Themes For China In The Coming Year”, dated December 5, 2018, available at cis.bcaresearch.com 4 Please see “Some U.S. Officials Said To See China Walking Back Trade Pledges”, Bloomberg News, dated March 19, 2019, and “Donald Trump-Xi Jinping meeting to end US-China trade war may be pushed back to June, sources say”, South China Morning Post. 5 Please see China Investment Strategy Special Report, “The Data Lab: Testing The Predictability Of China’s Business Cycle”, dated November 30, 2017, available at cis.bcaresearch.com 6 Please see Emerging Markets Strategy Weekly Report, “EM: A Sustainable Rally Or A False Start?”, dated March 7, 2019, available at ems.bcaresearch.com 7 Please see Professor Damodoran’s website for more information on his estimates of the equity risk premium. 8 Please see China Investment Strategy Weekly Report, “China Macro And Market Review”, dated March 13, 2019, available at cis.bcaresearch.com 9 Please see China Investment Strategy Weekly Report, “Moderate Releveraging And Currency Stability: An Impossible Dream?”, dated September 5, 2018, available at cis.bcaresearch.com 10 Please see China Investment Strategy Special Report, “Monitoring Chinese Capital Outflows”, dated March 20, 2019, available at cis.bcaresearch.com Cyclical Investment Stance Equity Sector Recommendations
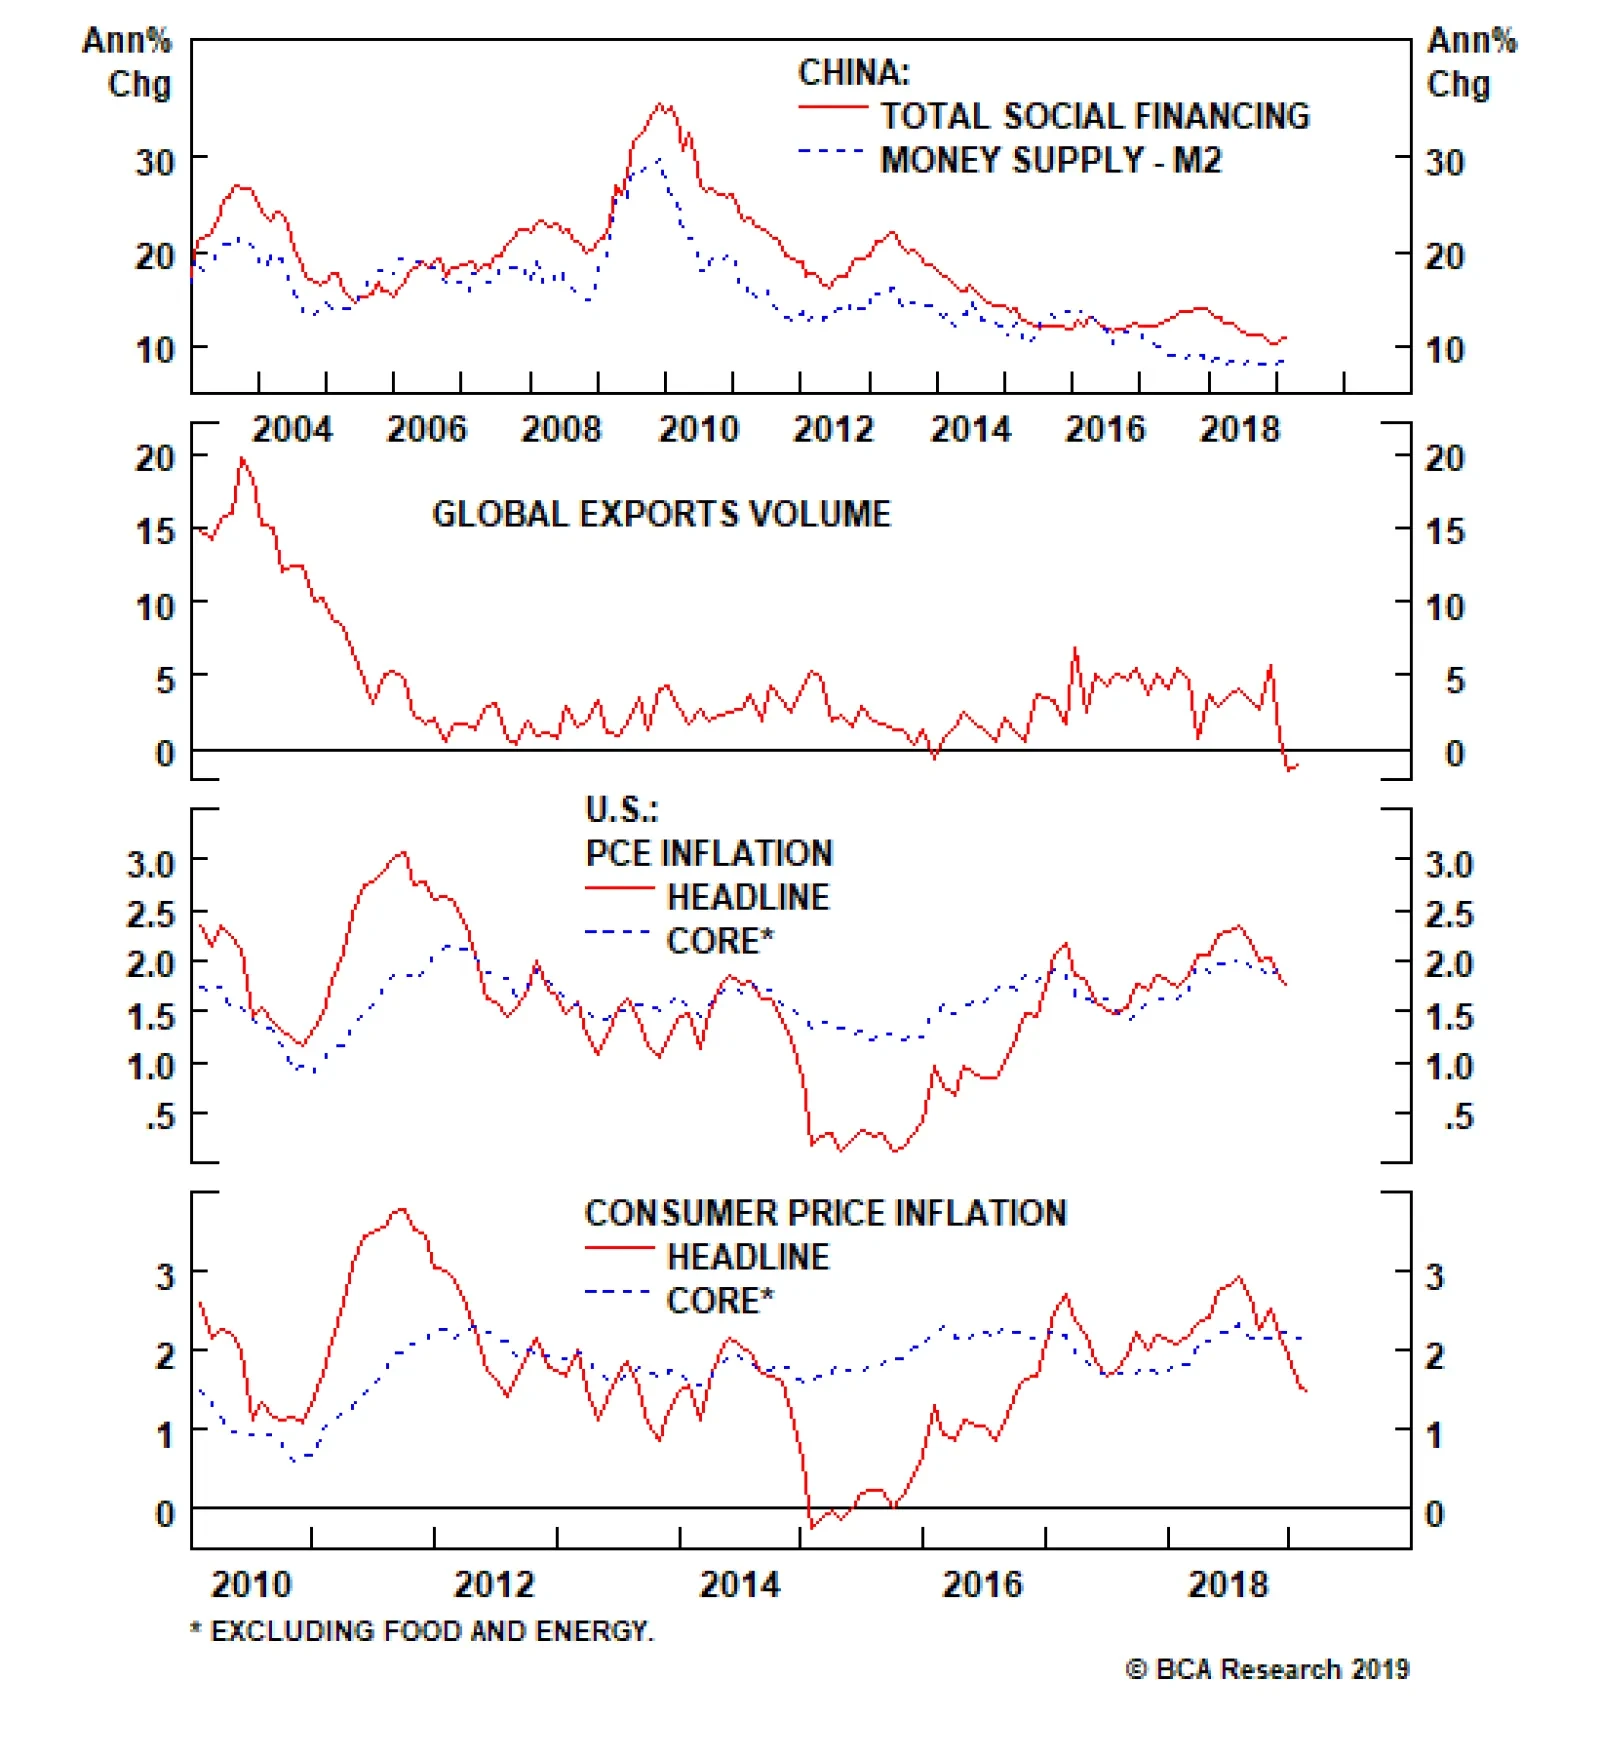
Our U.S. Investment Strategy team’s real-time view of the Fed’s turn to patience in early January was that it was a logical response to the sharp, sudden tightening of financial conditions imposed by the fourth-quarter sell-off in stocks and corporate bonds.…
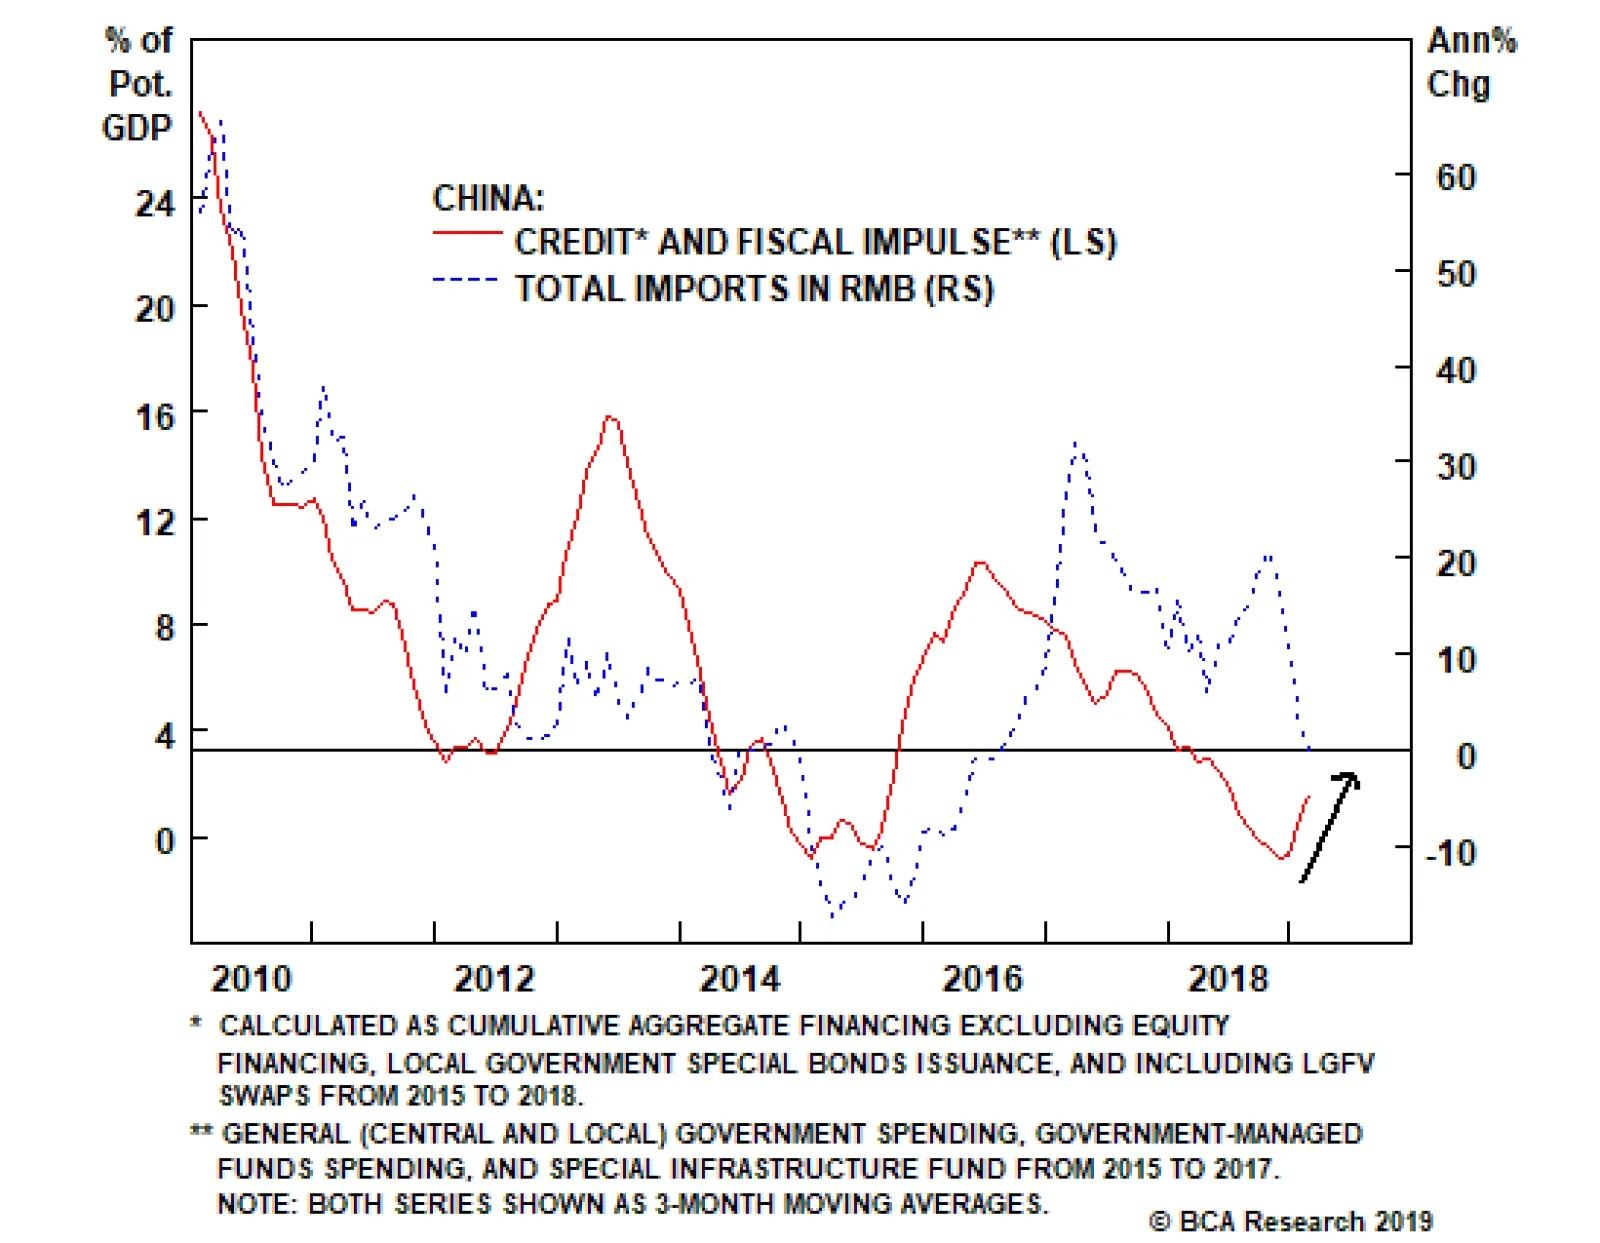
Chinese manufacturing output continues to decelerate. Retail sales remain lackluster, with auto sales showing little evidence of improvement. Property prices are still rising, but floor space sold has begun to contract. Fixed-asset investment has held up so…

Clearly the president will benefit from being vindicated in such an authoritative way. He will not only avoid any mushrooming scandal, which can hurt a president seeking reelection, but will also gain sympathy from at least some voters for having been falsely accused. While Mueller technically did not exonerate Trump from charges of obstruction of justice, he also did not make any such charges. This means that House Democrats could conceivably still use the Mueller report’s evidence of potential obstruction to impeach Trump. But if they do they will fail. Attorney General Anthony Barr and his deputy, Rod Rosenstein, have both determined that there was no obstruction. With the special counsel having ruled out any collusion or even coordination with Russia, Trump will remain secure among grassroots Republicans. Hence the senators in his party will not convict him and any impeachment trial will be a charade. Thus to some extent Trump’s odds of reelection must be going up. Right? Wrong. The problem is that any positive impact on Trump’s reelection odds from the Mueller report ultimately matters much less than the inversion of the yield curve on March 22. This curve is the most reliable indicator of forthcoming economic recession. If the inversion is deep and persistent then it makes an election year recession probable. Presidents can survive a grand scandal, but they live or die by recessions. There have only been two presidents in the post-Civil War era who won reelection despite a recession in the calendar year of the election. These were William McKinley in 1900 and Theodore Roosevelt in 1904. Yet in 1900, the recession was drawing to a close and economic conditions were better than when McKinley first took office in 1896. And in 1904, the recession technically ended in August, before the fall campaign began. In ten other cases the ruling party has lost the White House amid a recessionary environment. In recent decades yield curve inversion precedes recessions by anywhere from five to sixteen months. The average is eleven months. This means that if the 10yr/3mo signal proves accurate once again, Trump would get extremely lucky to see the economy rebounding by the fall campaign. Granted, the yield curve could send a false signal. For instance, some take the view that the term premium is historically low for structural reasons and that this makes inversion easier and less indicative than in the past. However, when it comes to politics, President Trump cannot afford to assume that this time is different. It is already clear from his waivers on Iranian oil sanctions and trade negotiations with China that he lives in great fear of the business cycle expiring before November 3 next year, when it will be very long-in-the-tooth. Trump is also more vulnerable to recession than the usual president. He is a self-styled commercial leader – a CEO president and Washington outsider who staked his credibility on the claim that he will create jobs and grow the economy. Trump can possibly survive an election with a large trade deficit or a surge in immigrants on the southern border because these developments would highlight the very policy concerns that he did so much to emphasize: they would not necessarily invalidate his approach. But if unemployment is rising, it is hard to see how this president, let alone any other, could wriggle out of it. If he tries to shift the blame to the Federal Reserve or China in any concrete way, the equity market will riot and exacerbate the downturn. The takeaway is, first, that we should continue to see President Trump show relative risk aversion on market-relevant matters like Iran, China, and the “stimulus cliff” affecting the U.S. budget next fiscal year. Second, that if the current economic wobbles pass and the economic expansion gets a new breath of life, then Trump’s chances of retaining the White House will soar. Trump’s reelection odds have important investment consequences. His reelection will entail policy continuity and the maintenance of a low-tax, deregulatory environment that encourages animal spirits and pads corporate earnings. The more likely it appears that Trump will lose the White House, the more animal spirits will sag. A Democratic win will mean yet another violent vacillation in U.S. policy, like 2016, which will cause a spike in policy uncertainty. It will also bring a probable increase in taxes (including possibly the corporate rate) and regulations across a range of sectors. If a Democrat wins in 2020, he or she will most likely have a fairly left-wing agenda, due to trends in the party, and whoever takes the White House will likely also take the Senate. Since the same goes for the House, a presidential win will deliver full Democratic control of the executive and legislative branches: a window of minimal political constraints in which a sweeping piece of legislation can be enacted, like in 2009 or 2017.
Image
In short, a Trump loss would not only mean the end of the status quo but likely a united government in favor of a rather left-leaning Democratic agenda. If the market has reason to believe a recession is looming, and that a recession will occasion a lurch to the “anti-business” side of the Left, then the impact on investment decisions and capex intentions will be negative and immediate. Economic policy uncertainty has nowhere to go but up. Matt Gertken, Geopolitical Strategist mattg@bcaresearch.com