Emerging Markets

We continue to expect copper prices to increase in the near term, as China’s credit cycle bottoms and DM central banks soften their monetary-policy stance. Fiscal and monetary stimulus in China also will be supportive of base metals prices going forward. The evolution of the Sino - U.S. trade negotiations remains a risk to our view, given how important the outcome of these talks will be for investors’ expectations and sentiment. Markets appear to be discounting a positive outcome. Anything that scuppers these talks – or results in a no-deal outcome – will be a negative for base metals, copper in particular. Our tactical long copper position is up by 1.2% since we initiated it last week. Highlights Energy: Overweight. Russian oil companies are expected to keep production lower until July, when the current OPEC 2.0 production-cutting agreement now in place expires. We expect the deal will be extended to year-end.1 Separately, the risk of a complete shutdown in Venezuela’s oil industry rose significantly, as a power failure in most of the country all but eliminated potable water supplies and significantly reduced oil exports. Base Metals/Bulks: Neutral. High-grade iron-ore prices got a boost this week as Vale was ordered to temporarily suspend exports from its primary port at Guaiba Island terminal in Rio de Janeiro state, according to Metal Bulletin’s Fastmarkets.2 The price-reporting agency’s 62% Fe Iron Ore Index rose $1.46/MT at $85.25/MT Tuesday. Precious Metals: Neutral. Spot gold is back above $1,300/oz, on the back of monetary policy easing among important central banks. This also is supporting base metals globally (see below). Ags/Softs: Underweight. Grain markets continue to drift sideways, awaiting definitive news re Sino - U.S. trade talks, specifically when presidents Xi and Trump will meet to finalize a deal (see below). Separately, wheat and corn inventories are expected to rise on the back of higher supplies and lower exports, the USDA forecast in its latest world supply-demand estimates. Feature Recent data releases confirm our view that global growth will remain weak in 1Q19 and early 2Q19. This will continue to put downward pressure on cyclical commodities – chiefly base metals and oil (Chart of the Week). Chart of the WeekGlobal Growth Slows In 1Q19
Global Growth Slows In 1Q19
Global Growth Slows In 1Q19
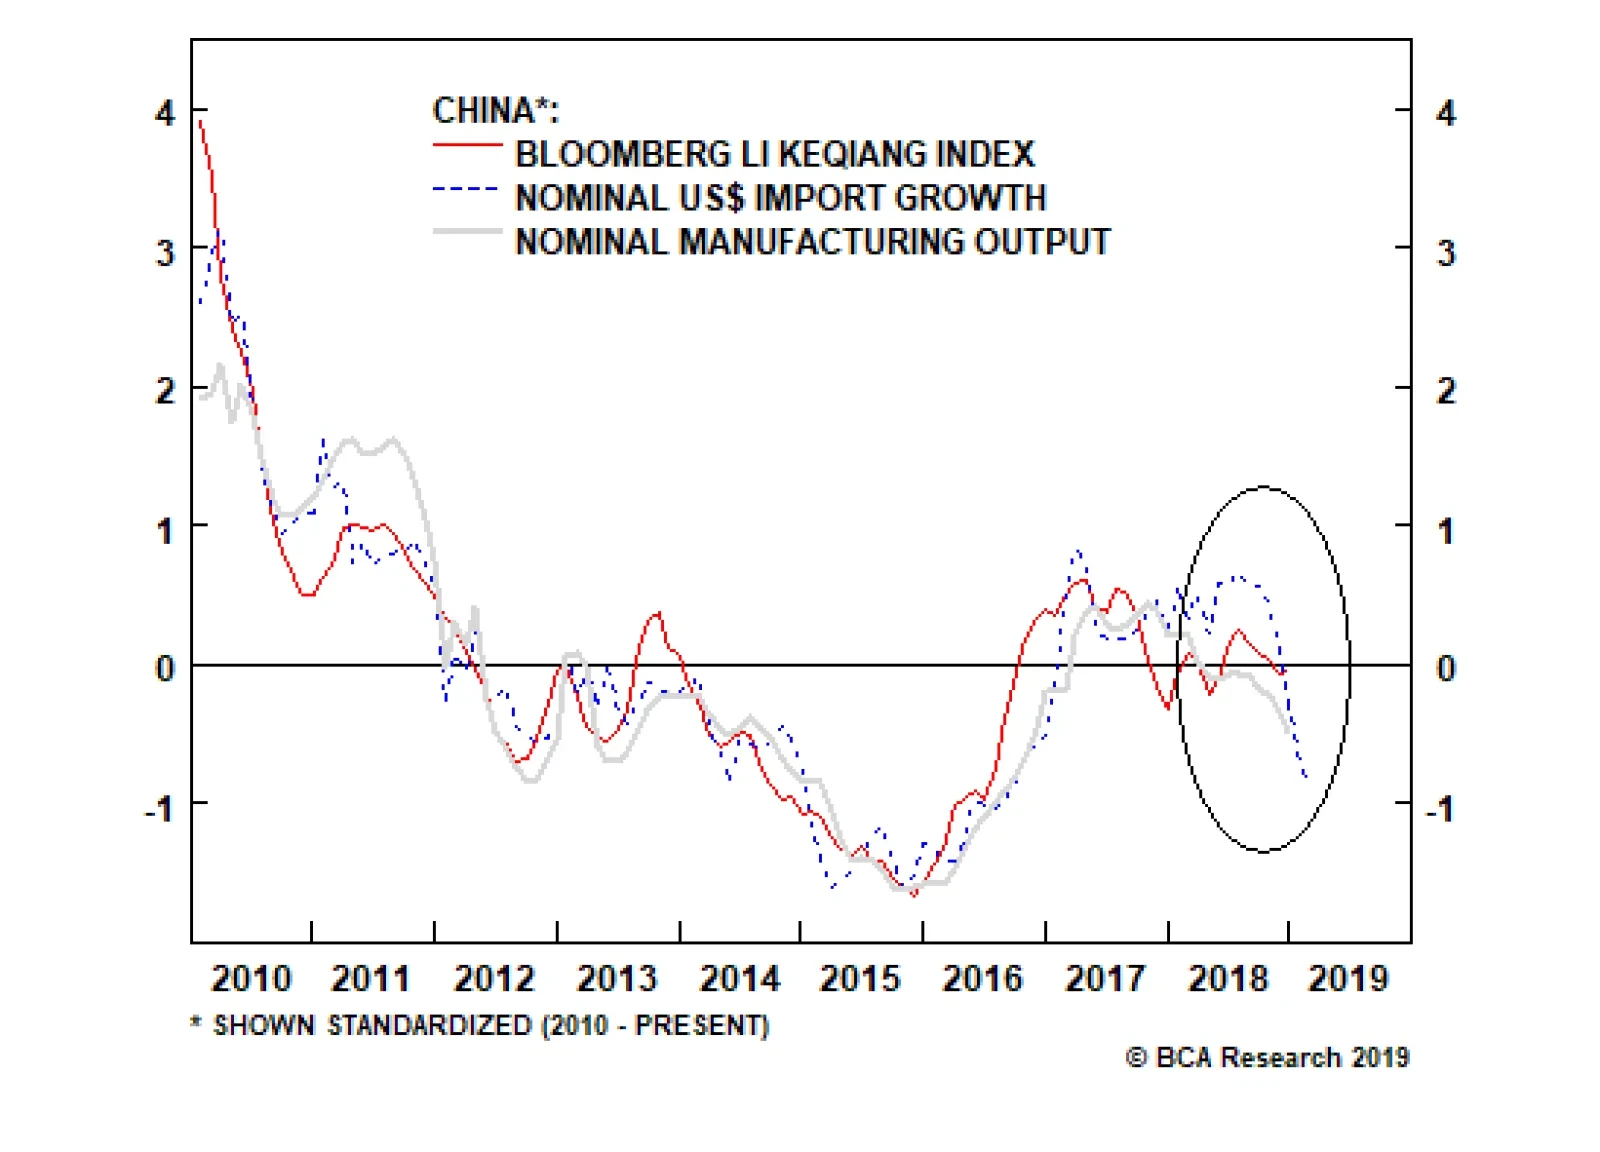
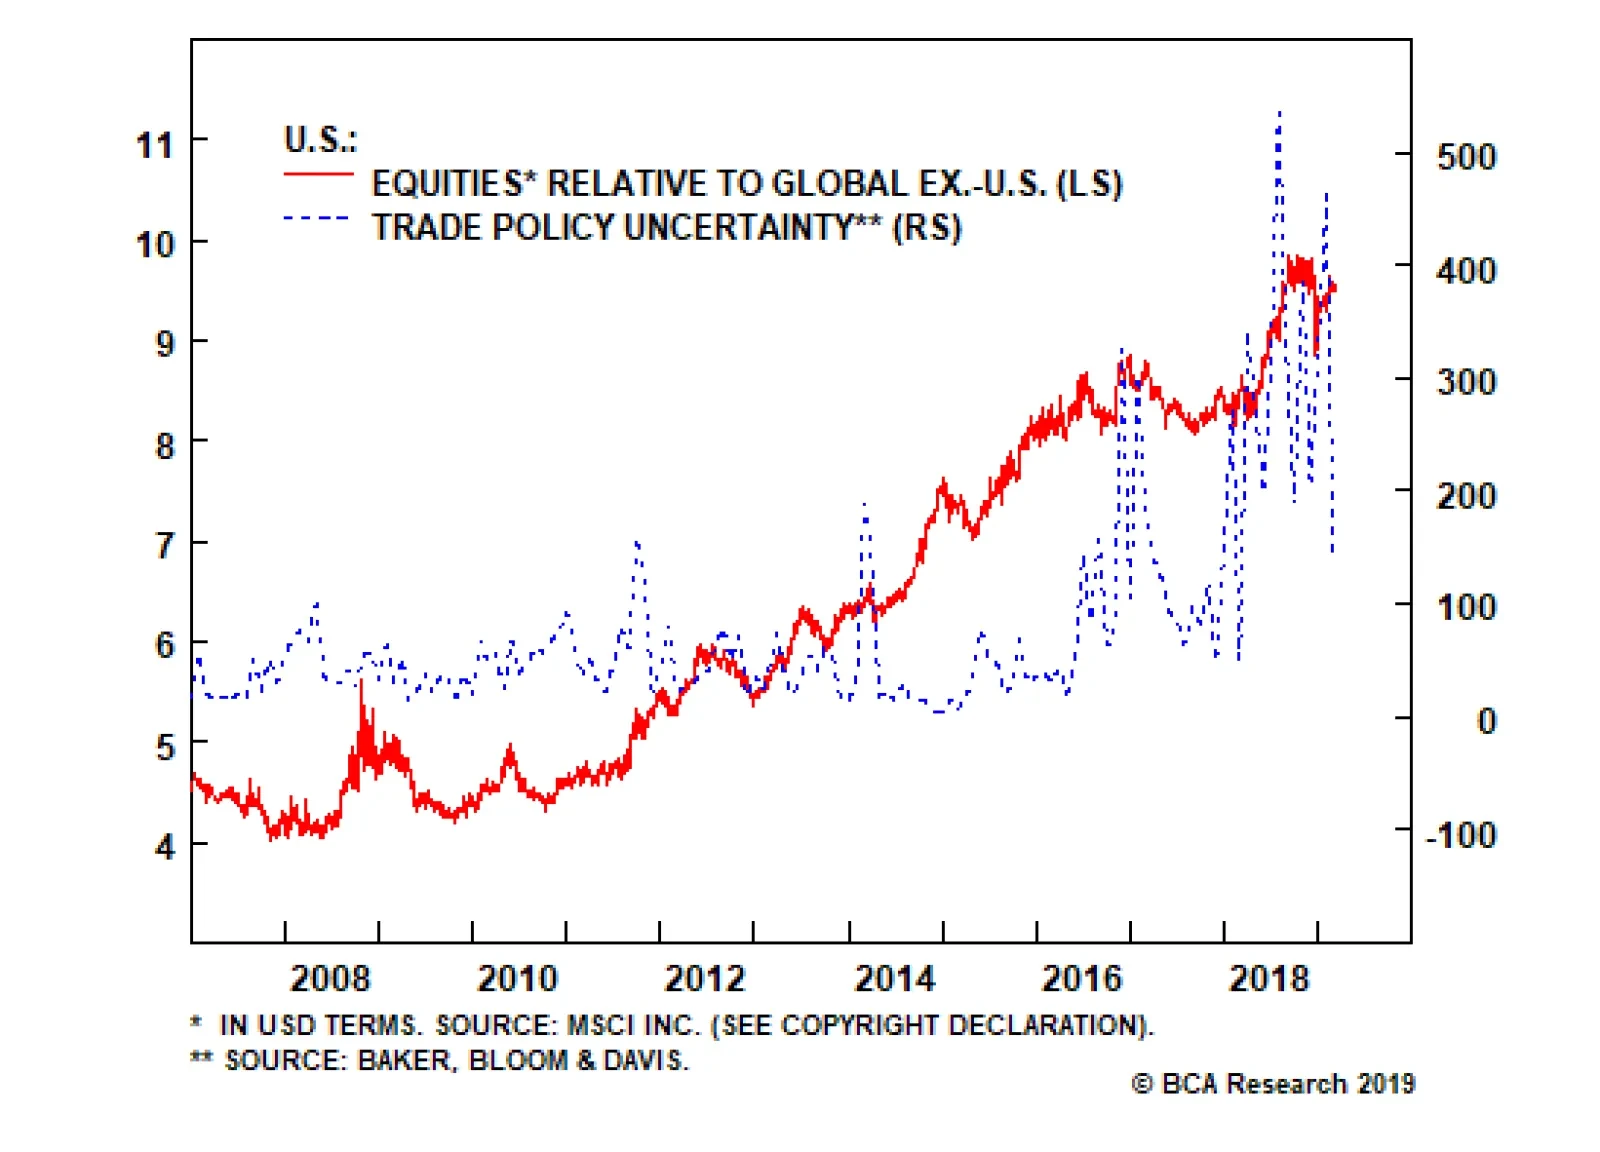
The persistence of the slowdown provoked major central banks to adopt a dovish stance in the short-term. This is easily seen in the recent actions by the U.S. Fed, the European Central Bank (ECB), the Bank of Canada (BoC) and the Reserve Bank of Australia (RBA), all of which have communicated a pause in their rate normalization policies.3 At the moment, the frail global growth is partly balanced by expectations of a positive outcome re the ongoing Sino - U.S. trade negotiations (Chart 2). In the coming months, we expect the effect of accommodative DM monetary policy combined with an expansion in China’s credit (more on this below) and fiscal stimulus – i.e., tax cuts announced earlier this month amounting to almost $300 billion (~ 2 trillion RMB) meant to support policymakers’ GDP growth targets – will go a long way toward reversing the earlier contraction. The effect of these policy decisions will be apparent in 2H19. Chart 2China Growth To Hook Higher
China Growth To Hook Higher
China Growth To Hook Higher
China’s Credit Cycle Bottomed In December 2018 The evolution of China’s credit cycle remains a central pillar to our view commodity demand growth in 2H19 will surpass consensus expectations. The massive growth reported in China’s January credit statistics revived investors’ expectations that China’s banks will re-open the credit valves as they did in 2016.4 In our view, this number does signal a bottom in China’s credit cycle, and implies Chinese – and indirectly EM – growth will bottom sometime this year. However, we still are not expecting a complete blowout credit expansion this year. We continue to believe Chinese policymakers will focus on stabilizing credit in 1H19 with moderate increases in supply, and start increasing stimulus in 2H19 or 2020 in order to maximize its effect later in 2020 ahead of the 100th anniversary of the founding of the Chinese Communist Party (CCP) in 2021. The soft February credit number released this week supports this argument.5 China’s Credit Cycle Matters For Base Metals Demand The relationship between China’s credit cycles and base metal prices endures and remains robust. We measure China’s aggregate credit using bank and non-bank claims on non-financial enterprises, households, local and central governments, and non-bank financial institutions. This corresponds to adding outstanding central and local government bonds to China’s Total Social Financing (TSF).6 The annual change in aggregate credit – or its impulses – do not perfectly capture the cycles in global base metal demand. These variables provide interesting signals about the direction and magnitude of movements in credit, however, they do not track base metals’ price cycles accurately and consistently (Chart 3). Chart 3Metals Price Cycles Don't Track Changed In China's Credit
Metals Price Cycles Don't Track Changed In China's Credit
Metals Price Cycles Don't Track Changed In China's Credit
To decompose this variable into its trend and cycle, we use a proxy of the credit cycle constructed using the Hodrick-Prescott and Hamilton filters, and the standardized 12-month credit impulse (Chart 4).7 Chart 4China's Credit Cycle Proxy
China's Credit Cycle Proxy
China's Credit Cycle Proxy
We find that our credit cycle proxy Granger causes base metal prices, import volume and industrial activity (Table 1).8 On average, it leads these variables by 4-6 months (Chart 5). Hence, we believe our credit cycle proxy provides valuable information about future commodity demand in China. Table 1China Credit Cycle Correlations
Bottoming Of China's Credit Cycle Bullish For Copper Over Near Term
Bottoming Of China's Credit Cycle Bullish For Copper Over Near Term
Chart 5
In fact, when regressing copper prices and the LMEX against it, we found that 60% and 58% of the variation in copper prices and the LMEX, can be explained by the linear relationship with our China credit cycle proxy, respectively (Chart 6). Chart 6China's Credit Cycle and Metals Prices
China's Credit Cycle and Metals Prices
China's Credit Cycle and Metals Prices
Given the leading property of China’s credit cycles with respect to industrial activity and metal prices, we included this new proxy in our Global Industrial Activity (GIA) index.9 This improves the correlation of our index with copper prices (Chart 7). Chart 7Credit Cycle Improves BCA's GIA
Credit Cycle Improves BCA's GIA
Credit Cycle Improves BCA's GIA
Currently, our models suggest copper prices should increase in the coming months as China’s credit cycle bottoms and DM central banks soften their monetary policy stance. The evolution of the China-U.S. trade negotiations remains a risk to our view as the outcome will weigh on investors’ expectations and sentiment. China’s Vs. DMs’ Credit Cycles Between 2009 and 2014, China’s credit cycle lagged the U.S. and EU’s broad money cycles (Chart 8). This counter-cyclicality is partly explained by its elevated level of exports to the U.S. and of hard goods to Europe. When the global economic cycle works in China’s favor – i.e., when the Fed and ECB are accommodative or fiscal stimulus is deployed in either or both regions – China’s exports rise as U.S. and EU aggregate demand increases. This typically reduces the need for endogenous fiscal or monetary stimulus within China. Chart 8China's Credit Cycle Lags U.S., EU Money Cycles
China's Credit Cycle Lags U.S., EU Money Cycles
China's Credit Cycle Lags U.S., EU Money Cycles
On the other hand, when the global economic cycle contracts and fiscal and monetary policy ex China becomes a headwind, Chinese policymakers typically need to deploy fiscal and monetary policy to keep growth going, or at least avoid a contraction in their economy. Between 2016 and 2017, DM and China credit cycles aligned and increased simultaneously. Taking into account the 4-to-6-month lag between the time credit supply is increased and commodity demand rises, this created bullish conditions for metals and oil from 2H16 to 1H18, pushing copper prices up by 60%. In 2018, both regions’ cycles rolled over. Base metals markets currently are experiencing the consequences of this contraction in credit availability and tightening of financial conditions generally. Going forward, we expect China will step in to raise domestic demand and offset the impact of the decline in credit availability elsewhere, which is affecting demand for its exports in the short-term. In the medium-term, the U.S. and EU, along with India, do not appear to be inclined to absorb Chinese exports to the extent they did in the past, which means the pivot to domestically generated growth through consumer- and services-led demand is the most viable alternative Chinese policymakers have to keep growth on target. Bottom Line: The dovish turn of major DM central banks combined with a bottoming of China’s credit cycle will support cyclical commodities at the margin in the coming months. During the second half of this year, we expect a more significant pick up in China’s credit, setting the stage for a year-end rally in base metal prices. As a consequence, the impact of China’s credit growth on base metals demand could diminish compared to previous stimulus targeting industrial demand. Hugo Bélanger, Senior Analyst Commodity & Energy Strategy HugoB@bcaresearch.com Robert P. Ryan, Chief Commodity & Energy Strategist rryan@bcaresearch.com Footnotes 1 Please see “Russia’s oil companies ready to cut output until July: TASS,” published by reuters.com March 12, 2019. 2 Please see Fastmarkets MB’s Daily Steel, March 12, 2019. 3 Please see “Pervasive Uncertainty, Persuasive Central Banks,” published by BCA Research’s Global Fixed Income Strategy March 12, 2019. It is available at gfis.bcaresearch.com. 4 Please see “China Macro And Market Review,” published by BCA Research’s China Investment Strategy March 13, 2019. It is available at cis.bcaresearch.com. 5 See footnote 4 above. 6 For more details please see “EM: A Sustainable Rally Or A False Start?” published by BCA Research’s Emerging Market Strategy March 7, 2019. It is available at ems.bcaresearch.com. 7 Hamilton notes the HP filter can be problematic. In general, we agree with critics of the filter (i.e. it results in spurious dynamics that are unrelated with the true data-generating process, it has an end-point bias which affects its real-time properties, and it is highly dependent on the parameter selection). However, there are some arguments in support of using the HP filter to proxy the credit cycle. First, as long as there are no clear theoretical foundation for an accurate measurement of the credit cycle, empirical validation should remain the number one criteria by which one selects its proxy. Second, credit cycles vary in duration and this weakens the ability to construct a reliable proxy. The usual parameter used with the HP filter favors short-term cycles (i.e. ~ 2 years) while the Hamilton filter focuses on medium-term cycles (i.e. ~ 5 years). Therefore, both can convey useful information. Third, China’s aggregate credit variable in level has a quasi-linear trend and is roughly approximated by a trend-stationary process with breaks in the trend and constant. Such a process should converge in limit when decomposed using the HP filter. Please see James D. Hamilton (2018), “Why You Should Never Use the Hodrick-Prescott Filter,” The Review of Economics and Statistics, vol 100(5), pages 831-843. and Phillips, Peter C. B. and Jin, Sainan (2015), “Business Cycles, Trend Elimination, and the HP filter,” Cowles Foundation Discussion Paper No. 2005. 8 Granger causality refers to a statistical technique developed by Clive Granger, the 2003 Nobel Laureate in Economics, which is used to determine whether one variable can be said to have caused (or predicted) another variable, given the past performance of each. Using standard econometric techniques, Granger showed one variable can be shown to have “caused” another, and that two-way causality also can be demonstrated (i.e., a feedback loop between the variables can exist based on the historical performance of each). 9 Please see “Oil, Copper Demand Worries Are Overdone,” published by BCA Research’s Commodity & Energy Strategy February 14, 2019. It is available at ces.bcaresearch.com. Investment Views and Themes Recommendations Strategic Recommendations Tactical Trades Commodity Prices and Plays Reference Table Trades Closed in 2019 Summary of Trades
Image
Highlights Analysis on South Africa is published below. The “EM” label does not guarantee a secular bull market. None of the individual EM bourses has outperformed DM on a consistent basis over the past 40 years. EM share performance in both absolute terms and relative to DM has exhibited long-term cycles of around seven to 10 years. Getting these cycles right is instrumental to successful investing in EM. EM investing is predominantly about exchange rates. From a long-term (structural) perspective, EM equities are only modestly cheap in absolute terms but are very cheap versus the U.S. Feature We often receive questions from asset allocators about the long-term outlook for EM equities and currencies. The general perception among longer-term allocators is that while EMs may underperform over the short term, they always outperform developed markets (DM) in the long run. Consistently, the overwhelming majority of investors’ long-term return forecasts ascribe the highest potential return to EM equities and bonds among various regions and asset classes. This week we focus on the historical long-term performance of EMs. Contrary to popular sentiment, our findings show that EM stocks and currencies have not outperformed their U.S./DM peers in the past 40 years – as long as EMs have existed as an asset class. Hence, there is no guarantee that EM share prices and currencies will always outperform their DM counterparts on a secular basis going forward. Notably, EM share performance in both absolute terms and relative to DM has exhibited long-term cycles of around seven to 10 years. Getting these cycles right is instrumental to successful investing in EM. At the moment, the odds are that the current bout of EM equity and currency underperformance is not yet over, and more downside is likely before a major upturn emerges. The “EM” Label Does Not Guarantee A Secular Bull Market EM share prices have been in a wide trading range since 2010 (Chart I-1), despite the 10-year bull market in the S&P 500. Chart I-1Lost Decade For EM Stocks
Lost Decade for EM Stocks
Lost Decade for EM Stocks
Remarkably, there is no single EM bourse that has been in a bull market during this decade (Chart I-2 and Chart I-3). This proves that this has indeed been a “lost” decade for EM. Chart I-2Individual EM Bourses: A Very Long-Term Perspective
Individual EM Bourses: A Very Long-Term Perspective
Individual EM Bourses: A Very Long-Term Perspective
Chart I-3Individual EM Bourses: A Very Long-Term Perspective
CHART 2B Individual EM Bourses: A Very Long-Term Perspective
CHART 2B Individual EM Bourses: A Very Long-Term Perspective
Historically, secular bull markets have been followed by bear markets not only in the boom-bust economies of Latin America, EMEA and Southeast Asia but also in former Asian tiger economies including Korea, Taiwan and Singapore (Chart I-4). This is despite the fact that per-capita real income has been growing rather rapidly in these Asian economies. Chart I-4Former Asian Tigers: Long-Term Equity Performance
Former Asian Tigers: Long-Term Equity Performance
Former Asian Tigers: Long-Term Equity Performance
Remarkably, China and Vietnam have been exhibiting similar dynamics over the past 20 years – rapid per-capita real income growth and poor equity market returns (Chart I-5). Chart I-5China And Vietnam: Stock Prices And GDP Per Capita
China And Vietnam: Stock Prices And GDP Per Capita
China And Vietnam: Stock Prices And GDP Per Capita
The message from all of these charts is as follows: Periods of industrialization and urbanization – even if successful – do not always entail structural bull markets. The U.S. fits this pattern as well. During the period between 1870 and 1900, the U.S. was experiencing industrialization and urbanization along with many productivity enhancements such as the steam engine, electricity and infrastructure construction. Even though America’s prosperity and real income per-capita levels surged during this period, corporate earnings per share and stock prices were rather flat (Chart I-6). Chart I-6The U.S. In The Late 1800s: Stocks, Profits And GDP
The U.S. In The Late 1800s: Stocks, Profits and GDP
The U.S. In The Late 1800s: Stocks, Profits and GDP
Hence, rising per-capita real income and prosperity do not translate into higher share prices on a consistent basis. This is not to say that no country can ever deliver healthy stock market gains in the long run. Some certainly will, and it is our job to identify and expose these to clients. The point is that the “emerging market” status does not guarantee a structural bull market. Asset Allocation: Play Cycles Chart 7 illustrates that EM relative equity performance versus DM in general and the U.S. in particular has gone through several major swings over the past 40 years. Remarkably, none of the individual EM bourses has outperformed DM on a consistent basis over this time frame (Chart I-8A and I-8B). Chart I-7EM Versus DM: Relative Total Equity Returns
EM Versus DM: Relative Total Equity Returns
EM Versus DM: Relative Total Equity Returns
Chart I-8ANo Single EM Bourse Has Outperformed DM In Past 40 Years
No Single EM Bourse Has Outperformed DM In Past 40 Years
No Single EM Bourse Has Outperformed DM In Past 40 Years
Chart I-8BNo Single EM Bourse Has Outperformed DM In Past 40 Years
No Single EM Bourse Has Outperformed DM In Past 40 Years
No Single EM Bourse Has Outperformed DM In Past 40 Years
Failure to outperform DM stocks is not only inherent for bourses in twin-deficit and inflation-prone regions/countries such as Latin America, Russia, Turkey, South Africa and South East Asia (including India), but it has also been true for share prices in rapidly growing countries such as China and Vietnam (Chart I-9). Chart I-9Chinese And Vietnamese Stocks Have Not Outperformed DM
Chinese And Vietnamese Stocks Have Not Outperformed DM
Chinese And Vietnamese Stocks Have Not Outperformed DM
Remarkably, equity markets in the former Asian tigers – Korea, Taiwan and Singapore – have also failed to outperform their DM peers in the past 40 years (Chart I-10). This is in spite of the fact that real income per-capita growth in these Asian nations has by far outpaced that in both the U.S. and DM (Chart I-11). Chart I-10Former Asian Tigers Have Not Outperformed DM Equities...
Former Asian Tigers Have Not Outperformed DM Equities...
Former Asian Tigers Have Not Outperformed DM Equities...
Chart I-11…Despite Economic Outperformance
GDP Per Capita In Asian Tigers Has Massively Outperformed U.S. ...Despite Economic Outperformance
GDP Per Capita In Asian Tigers Has Massively Outperformed U.S. ...Despite Economic Outperformance
Evidently, the assumption that EM stocks will outperform DM equities on the back of higher potential growth rates is not validated by historical data. First, higher potential growth does not always ensure robust realized GDP growth. Second, even if real GDP-per-capita growth rises considerably, this does not always guarantee superior equity market returns. Some of the reasons for this include productivity benefits being transferred to employees rather than to shareholders, chronic equity dilution, and a misallocation of capital that boosts economic growth at the expense of shareholders. Bottom Line: EM relative stock performance versus DM has been fluctuating in well-defined long-term cycles. In our view, EM relative equity performance has not yet reached the bottom in this downtrend. We downgraded EM stocks in April 2010 and have been recommending a short EM equities / long S&P 500 strategy since December 2010 (please refer to Chart I-7 on page 5). EM Investing Is Primarily About Exchange Rates Exchange rates hold the key to getting EM equity cycles right for international investors. As demonstrated in Chart I-12, historically the bulk of EM equity return erosion has been due to currency depreciation. Chart I-12EM Investing Is All About Exchange Rates
EM Investing Is All About Exchange Rates
EM Investing Is All About Exchange Rates
Exchange rates of structurally weak EM economies depreciate chronically. Common reasons include lack of productivity growth, high inflation, current account deficits, uncontrolled fiscal expansion, and reliance on volatile foreign portfolio flows. Periods of currency depreciation also occur in emerging Asian economies that have low inflation and typically run current account surpluses. Chart I-13 shows spot rates for Korea, Taiwan and Singapore versus the SDR which is a weighted average of USD, the euro, JPY, GBP, and CNY.1 Chart I-13Former Asian Tiger Currencies: Wide Fluctuations
Former Asian Tiger Currencies: Wide Fluctuations
Former Asian Tiger Currencies: Wide Fluctuations
None of these Asian-tiger currencies has consistently appreciated versus the SDR. As in the case of share prices, there have been multi-year exchange rate swings. Further, U.S. dollar total returns on EM local bonds are also primarily driven by their currencies (Chart I-14). Consequently, the cycles in EM local currency bonds match EM exchange rate cycles. Chart I-14Total Return On Local Currency Bonds
Total Return On Local Currency Bonds
Total Return On Local Currency Bonds
EM credit spread fluctuations are also by and large contingent on their exchange rates. Credit spreads on EM sovereign and corporate U.S. dollar bonds gauge debt servicing risk. The latter is highly influenced by exchange rates. Currency depreciation (appreciation) increases (decreases) debt servicing costs thereby affecting credit spreads. Bottom Line: Exchange rate fluctuations are driven by macro crosscurrents, making macro an indispensable know-how for EM investing. We maintain that EM currencies are susceptible to renewed weakness against the U.S. dollar as China’s growth continues to weaken, weighing on EM growth and thereby their respective exchange rates (Chart I-15). In turn, the U.S. dollar is a countercyclical currency and does well when global growth decelerates. Chart I-15EM Currencies Are Pro-Cyclical
EM Currencies Are Pro-Cyclical
EM Currencies Are Pro-Cyclical
Valuations: The Starting Point Matters… In recent years, a long-term bullish case for EM equities and currencies has often been made on the grounds of cheap valuations. Chart I-16 illustrates the equity market-cap weighted real effective exchange rate for EM ex-China, Korea and Taiwan – a measure that is pertinent for both EM equity and fixed-income investors.2 It reveals that EM currency valuations are only slightly below their historical mean. Chart I-16EM Ex-China, Korea, Taiwan Currencies Are Modestly Cheap
EM Ex-China, Korea, Taiwan Currencies Are Modestly Cheap
EM Ex-China, Korea, Taiwan Currencies Are Modestly Cheap
As to the CNY, KRW and TWD, their valuations are not at an extreme, and the CNY holds the key. The main long-term risk to the RMB is capital outflows from Chinese households and companies as discussed in February 14 report. For long-term investors, the pertinent equity valuation yardstick is the cyclically adjusted P/E (CAPE) ratio. The idea behind the CAPE model is to remove cyclicality of corporate profits when computing the P/E ratio – i.e., to look beyond a business cycle. Hence, the CAPE ratio is a structural valuation model – i.e., it works in the long term. Only investors with a time horizon greater than three years should use this valuation measure in their investment decisions. Our CAPE model gauges equity valuations under the assumption of per-share earnings converging to their trend line. The latter is derived by a regression of the cyclically adjusted EPS in real U.S. dollar terms on time. The EM CAPE ratio presently stands at 0.5 standard deviations below its historical mean (Chart I-17). This means EM stocks are modestly cheap from a long-term perspective. Meanwhile, the U.S.’s CAPE ratio is very elevated (Chart I-18). Chart I-17EM Equities Are Modestly Cheap From AA1 Structural Perspective
EM Equities Are Modestly Cheap From A Structural Perspective
EM Equities Are Modestly Cheap From A Structural Perspective
Chart I-18U.S. Stocks Are Expensive From AA1 Structural Perspective
U.S. Stocks Are Expensive From A Structural Perspective
U.S. Stocks Are Expensive From A Structural Perspective
On a relative basis, EMs are very attractive relative to U.S. stocks (Chart I-19). This entails that the probability of EM stocks outperforming U.S. equities is very high from a secular perspective – longer than three years. Chart I-19EM Equities Are Cheap Versus U.S. From AA1 Structural Perspective
EM Equities Are Cheap Versus U.S. From A Structural Perspective
EM Equities Are Cheap Versus U.S. From A Structural Perspective
Nevertheless, a caveat is in order. Our CAPE model assumes that EPS in real U.S. dollar terms will rise at the same pace as it has historically. The slope of the time trend – the historical compound annual growth rate (CARG) of EPS in inflation-adjusted U.S. dollar terms – is 2.8% for EM and 2% for the U.S. Please note that we determined the earnings time trend (trend line) using historical ranges – 1983 to present for EM, and 1935 to present for the U.S. Hence, these CAPE models assume that EM EPS will grow 0.8 percentage points (2.8% minus 2%) faster than U.S. corporate EPS in inflation-adjusted U.S. dollar terms, as they have done historically. Under this assumption, EM stocks are considerably cheaper than the U.S. market. That said, in the medium term, corporate earnings are the key driver of EM share prices, and contracting profits pose a risk to EM performance, as discussed in our February 21 report. Bottom Line: From a long-term perspective, EM equities and currencies are only modestly cheap in absolute terms. Based on our CAPE ratio model, EM stocks are very cheap versus the U.S. However, the CAPE ratio is a structural valuation measure, and only investors with a time horizon of longer than three years should put considerable emphasis on it. …But Beware Of A Potential Value Trap If for whatever reason there is a change in the slope of the EM EPS long-term trend – i.e., per-share earnings fail to expand in the coming years at their historical rate, as discussed above, our CAPE model would be invalidated. In such a case, EM share prices are unlikely to enter a secular bull market in absolute terms and outperform their U.S. counterparts structurally. The key to sustaining the current upward slope in the long-term trajectory of EPS in real U.S. dollar terms is for EM/Chinese companies to undertake corporate restructuring and increase efficiency. Critically, recurring Chinese credit and fiscal stimulus as well as cheap and abundant money from international investors have not fostered corporate restructuring in China, nor in other EM countries. The basis is that easy and cheap financing and economic growth propped-up by periodic Chinese stimulus has made companies complacent, undermining their productivity and efficiency. The ultimate outcome will be weak corporate profitability over the long run. Another long-term risk to corporate earnings in China and some other EMs is the expanding role of the state in the economy. In these circumstances, China/EM corporate profitability will also suffer over the long run. The basis is that in any country the private sector is better than the government in generating strong corporate earnings. Bottom Line: Without structural reforms and corporate restructuring in EM/China, EM stocks are unlikely to outperform their DM peers on a secular basis. Investment Conclusions The medium-term EM outlook remains poor for the reasons we elaborated on in last week’s report titled, EM: A Sustainable Rally or A False Start? Further, investor sentiment on EM is very bullish, and positioning in EM equities and currencies is elevated (Chart I-20). We continue to recommend underweighting EM stocks, credit markets and currencies versus their DM counterparts and the U.S. in particular. Chart I-20Investors Are Very Bullish On EM
Investors Are Very Bullish On EM
Investors Are Very Bullish On EM
From a long-term perspective, EM equity and currency valuations are modestly cheap. However, a durable long-term expansion in EM economies is contingent on a sustainable bottom in Chinese growth. The latter hinges on deleveraging and corporate restructuring in China, neither of which have occurred to a meaningful extent. For EM equity portfolios, we presently recommend overweighting Mexico, Brazil, Chile, central Europe, Russia, Thailand and Korean non-tech stocks. Our current (not structural) underweights are South Africa, Indonesia, India, the Philippines, Hong Kong and Peru. Within the EM equity space, two weeks ago we booked triple-digit profits on our strategic long positions in EM tech versus both the overall EM index and EM materials stocks, respectively. These positions were initiated in 2010. The basis for these strategic recommendations was our broader theme for the decade of being long what Chinese consumers buy, and short plays on Chinese construction, which we initiated on June 8, 2010. This week we are closing our long central European banks / short euro area banks equity position. We recommended it on April 6, 2016, and it has produced a 14% gain since then. Arthur Budaghyan Chief Emerging Markets Strategist arthurb@bcaresearch.com South Africa: Debt Deflation Or Currency Depreciation? South Africa’s public debt dynamics are on an unsustainable track. Two prerequisites for public debt sustainability are (1) for interest rates to be below nominal GDP growth or (2) continuous robust primary fiscal surpluses. Hence, a government can stabilize its debt-to-GDP ratio by either having nominal GDP above its borrowing costs, or by running persistent and sizable primary fiscal surpluses. Neither of these two stipulations are presently satisfied in South Africa. The gap between government local currency bond yields and nominal GDP growth is at its widest in over the past 10 years (Chart II-1). Meanwhile, the primary fiscal deficit is 0.75% of GDP (Chart II-2). Chart II-1South Africa: An Unsustainable Gap
South Africa: An Unsustainable Gap
South Africa: An Unsustainable Gap
Chart II-2South Africa Has Not Had A Primary Fiscal Surplus In A Decade
South Africa Has Not Had A Primary Fiscal Surplus In A Decade
South Africa Has Not Had A Primary Fiscal Surplus In A Decade
Faced with very low real potential GDP growth stemming from the economy’s poor structural backdrop, the authorities in South Africa ultimately have two choices to stabilize the public debt-to-GDP ratio: Tighten fiscal policy substantially, trying to achieve persistent large primary budget surpluses; or Inflate their way out of debt, which would require a large currency depreciation to boost nominal GDP growth above borrowing costs. With this in mind, we performed a simulation on public debt, assuming fiscal tightening but no substantial currency depreciation (Table II-1). The first scenario uses the 2019 consolidated budget government assumptions and projections for nominal GDP, government revenues and expenditures, i.e., it is the government's scenario. In this scenario, the public debt-to-GDP ratio rises only to 58% by the end of the 2021-‘22 fiscal year.
Chart II-
However, government forecasts always end up being optimistic. We believe this scenario is implausible due to its overestimation of nominal GDP, and hence government revenue growth. As the government tightens fiscal policy, nominal GDP growth and ultimately government revenue will disappoint substantially. For the second scenario, we used government projections for fiscal spending in the coming years, but our own estimates for nominal GDP and government revenue growth. Notably, excluding interest payments and fiscal support for ailing state-owned enterprises like Eskom, nominal growth of government expenditures in the current year is at 7.5%, and estimated to be 6.8% the next two fiscal years. That is why we project nominal GDP and government revenue growth to be very weak. The basis of our assumption is as follows: Barring considerable currency depreciation, as the authorities undertake substantial fiscal tightening in the next three years, nominal GDP and consequently government revenue growth will plunge. Importantly, government revenues exhibit a non-linear relationship with nominal GDP – government revenues fluctuate much more than nominal GDP (Chart II-3). Chart II-3Government Revenues Are 'High-Beta' On Nominal GDP Growth
Government Revenues Are 'High-Beta' On Nominal GDP Growth
Government Revenues Are 'High-Beta' On Nominal GDP Growth
As government revenue growth underwhelms, the primary deficit will widen and the public debt-to-GDP ratio will escalate, reaching 70% of GDP by the end of the 2021-‘22 fiscal year, according to our projections (Table II-1). Overall, without considerably lower interest rates and material currency depreciation, the government’s financial position will enter a debt deflation spiral. Fiscal tightening will hurt nominal growth damaging fiscal revenues. As a result, the fiscal deficit will widen – not narrow – and the debt-to-GDP ratio will rise. Therefore, the only feasible option for South Africa to stabilize public debt is to reduce interest rates dramatically and depreciate the currency. This will engender higher inflation and nominal growth, thereby boosting government revenues and capping the public debt burden. At 10%, the share of foreign currency debt as part of South Africa’s public debt is low. Hence, currency depreciation will do less damage to public debt dynamics than keeping interest rates at high levels. On the whole, the rand is a very structurally weak currency, and is bound to depreciate due to deteriorating public debt dynamics. Chart II-4 plots the real effective exchange rate of the rand based on CPI and PPI. It is evident that its valuation is not yet depressed. Chart II-4The Rand Is Modestly Cheap
The Rand Is Modestly Cheap
The Rand Is Modestly Cheap
Meanwhile, cyclical headwinds also warrant currency depreciation (Chart II-5). Chart II-5Widening Trade Deficit Warrants Currency Depreciation
Widening Trade Deficit Warrants Currency Depreciation
Widening Trade Deficit Warrants Currency Depreciation
Market Recommendations Continue shorting the ZAR versus the U.S. dollar and the MXN. Consistent with the negative outlook for the exchange rate, investors should underweight South African local currency government bonds and sovereign credit within respective EM portfolios. Finally, we recommend EM equity portfolios remain underweight South African equities. Andrija Vesic, Research Analyst andrijav@bcaresearch.com Arthur Budaghyan Chief Emerging Markets Strategist arthurb@bcaresearch.com Footnotes 1 Special Drawing Rights. The value of the SDR is based on a basket of five currencies: the U.S. dollar, the euro, the Chinese renminbi, the Japanese yen, and the British pound sterling. 2 We exclude these three currencies since their bourses have very large equity market cap in the EM stock index and, hence, would make any aggregate currency measure unrepresentative for the rest of EM. Equity Recommendations Fixed-Income, Credit And Currency Recommendations
Over the past month, the most notable development in China’s equity market has been the near-vertical outperformance of A-shares versus the global benchmark. A catch-up period for A-shares was arguably warranted given the sustained rally in investable stocks…
China released a February update for several data series overnight, the first data point following the Lunar New Year holiday. Several observations are noteworthy: Overall fixed-asset investment (FAI) picked up modestly, from 5.9% to 6.1%. The uptick was…
Highlights February’s credit release earlier this week confirmed that credit growth is not yet on a “blowout” trajectory. If maintained, the recent pace of credit expansion implies a moderate credit cycle, not a large acceleration like what occurred in 2015/2016. We agree that a trade deal between China and the U.S. is likely to occur, but a sustained, cyclical (i.e. 6-12 month) rise in Chinese relative equity performance requires stability in the outlook for earnings, which have not yet reflected the ongoing economic slowdown. A confirmed meeting date between Presidents Trump & Xi coupled with more evidence that a moderate credit expansion is underway would likely lead us to upgrade our cyclical stance towards Chinese investable stocks (to overweight). Feature Tables 1 and 2 on pages 2 and 3 highlight key developments in China’s economy and its financial markets over the past month. On the growth front, data releases later this week will provide a crucial read on the pace of the slowdown in coincident economic activity. The ongoing weakness in trade and producer prices suggests that activity has continued to decelerate as the previously beneficial trade frontrunning effect washes out of the data. While we agree that January’s gargantuan credit number means that growth will bottom at some point this year, the February data released earlier this week highlights that credit growth is not yet on a “blowout” trajectory. If maintained, the recent pace of credit expansion implies a moderate credit cycle, not a large acceleration like what occurred in 2015/2016. Table 1China Macro Data Summary
China Macro And Market Review
China Macro And Market Review
Table 2China Financial Market Performance Summary
China Macro And Market Review
China Macro And Market Review
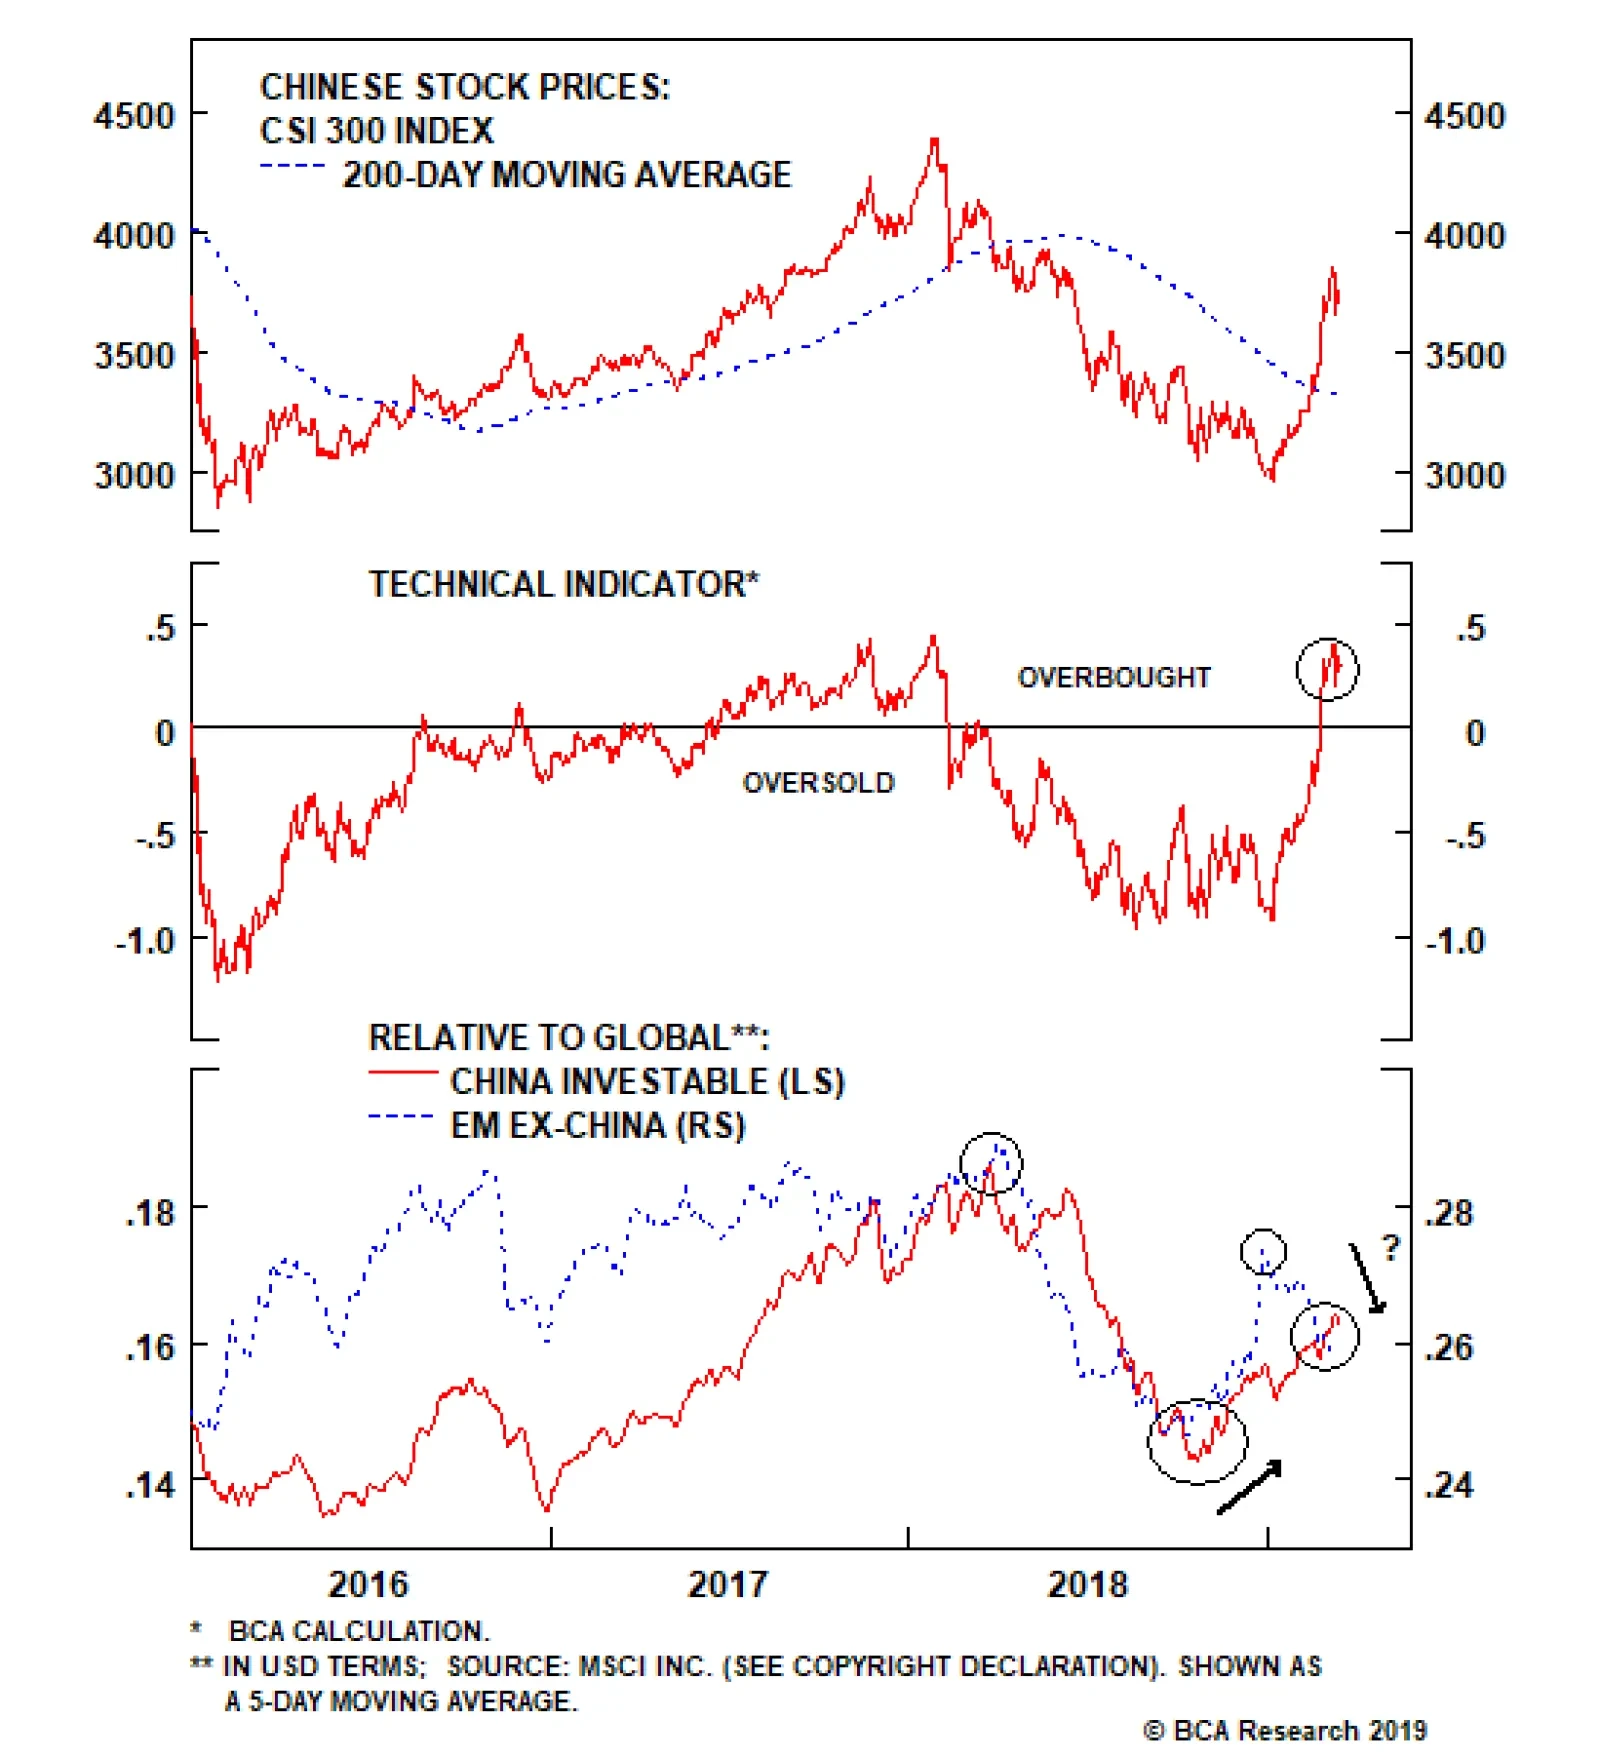
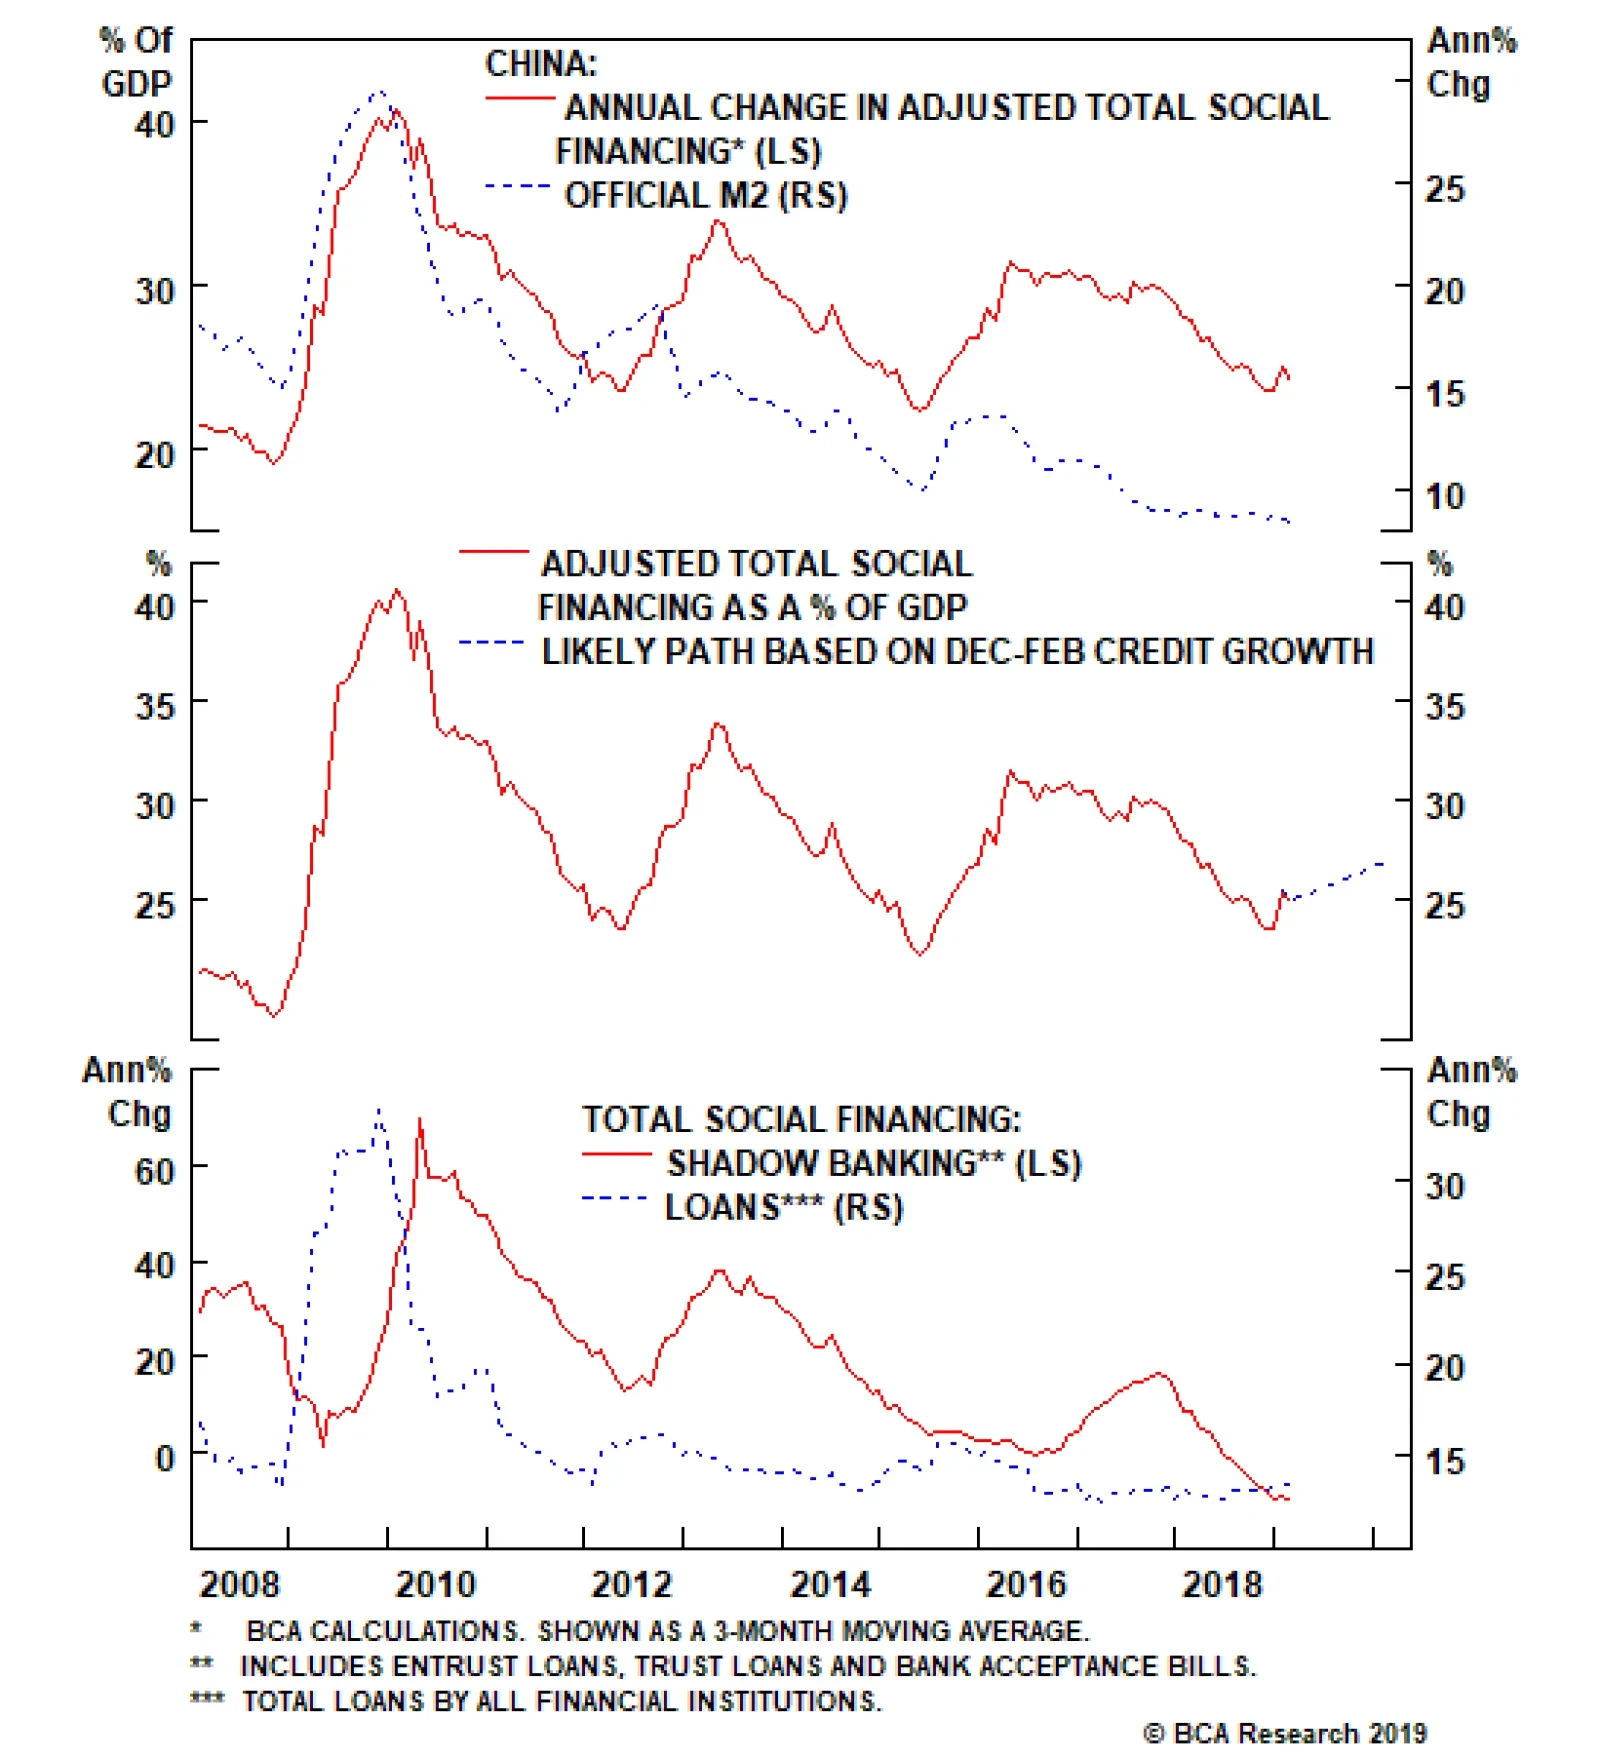
From an investment strategy perspective, we recommended in our February 27 Weekly Report that investors place Chinese investable stocks on upgrade watch, but that an immediate shift to a cyclical overweight was not yet warranted. The recent outperformance of investable stocks vs. the global benchmark largely reflects global investor expectations of a trade deal between China and the U.S. in the very near future, which we agree is likely to occur. But we have underscored that a sustained, cyclical (i.e. 6-12 month) rise in Chinese relative equity performance requires stability in the outlook for earnings, which have not yet reflected the slowdown that is underway. Barring a substantial trade-deal-driven rise in the RMB (which would dampen profits further and raise the bar for credit), a confirmed meeting date between Presidents Trump & Xi coupled with further evidence that a moderate credit expansion is underway would likely lead us to upgrade our cyclical stance towards Chinese investable stocks (to overweight). In reference to Tables 1 and 2, we provide several detailed observations concerning developments in China’s macro and financial market data below: The January and February data for several measures of coincident activity, including both measures of the Li Keqiang index (LKI) that we track, are set to be updated tomorrow. However, a number of data series that have been released over the past two months point to a continued deceleration: growth in rail cargo volume ticked down in January, producer prices are on the cusp of deflation, and nominal import and export growth decelerated again in February (measured either in US$ or RMB terms). The four components of our LKI leading indicator available for February have all sequentially declined, including the growth in adjusted TSF and adjusted TSF as a share of GDP. Credit had surged in January, but ticked down in February. Chart 1 illustrates the likely path of adjusted TSF as a share of GDP if the average pace of credit growth over the past three months is sustained. The chart implies that credit will have durably bottomed, but that the pace of advance will be weaker than that experienced in past cycles. Chart 1The Recent Pace Of Growth Implies A Moderate Credit Cycle
The Recent Pace Of Growth Implies A Moderate Credit Cycle
The Recent Pace Of Growth Implies A Moderate Credit Cycle
January and February data for residential floor space started and sold will also be updated tomorrow, and it will be important to see whether the gap that has emerged between construction and sales has persisted. Floor space sold has reliably led starts since 2010, and we recently highlighted that the PBOC pledged supplementary lending program has led sales since 2015. The pace of PSL decelerated further in February, suggesting that the outlook for sales (which are already in negative YoY territory) is deteriorating. Based on the leading relationships that we have identified, residential construction volume is unsustainably strong. The seemingly inconsistent messages between the NBS and Caixin manufacturing PMIs in February (down and up, respectively) may in fact reflect the PBOC’s focus on easing financial conditions for small businesses. While the NBS PMI includes a much broader sample of firms than the Caixin PMI, the latter focuses heavily on private sector SMEs. Given this, February’s data may suggest that the export outlook is improving, but we would caution against the conclusion that the overall manufacturing sector has bottomed until both PMIs are clearly rising. Over the past month, the most notable development in China’s equity market has been the near-vertical outperformance of A-shares versus the global benchmark. A catch-up period for A-shares was arguably warranted given the sustained rally in investable stocks since early-November, but Chart 2 highlights that the speed of the recent rise has pushed relative A-share performance quickly into overbought territory. At a minimum, a period of consolidation over the coming few weeks is likely. Chart 2Too Far, Too Fast
Too Far, Too Fast
Too Far, Too Fast
The relative performance of EM stocks ex-China is one of the equity components of our BCA Market-Based China Growth Indicator, which has recovered over the past few months. However, Chart 3 highlights that the performance of EM ex-China reliably led Chinese investable stocks since the beginning of last year, and are now raising a red flag. A near-term relapse in investable equity performance would be consistent with our view that earnings face further downside risk over the coming few months. Chart 3EM Ex-China Is Flashing A Warning Sign For Chinese Investable Stocks
EM Ex-China Is Flashing A Warning Sign For Chinese Investable Stocks
EM Ex-China Is Flashing A Warning Sign For Chinese Investable Stocks
Within the investable equity market, our low-volatility sector portfolio remains in an uptrend versus the broad market, although the composition of this portfolio has shifted significantly over the past few weeks. Financials, industrials, and energy stocks now account for 86% of our long MSCI China Low-Beta Sectors / short MSCI China trade, which is likely surprising to many investors given their traditionally cyclical characteristics. Chart 4 highlights that the relative performance of our low-beta trade has exhibited a reliably counter-cyclical message; this, in combination with the fact that it remains above its 200-day moving average, signals that it is still premature to shift to a cyclical overweight stance favoring Chinese stocks. Chart 4No Green Light Yet From Low-Vol Stocks
No Green Light Yet From Low-Vol Stocks
No Green Light Yet From Low-Vol Stocks
Value stocks have been responsible for more of the rally in China’s investable market versus the global average than their growth peers (Chart 5). This underscores that at least part of the rise in investable performance has been due to a relative valuation trade, rather than strong conviction that the Chinese economy will strengthen materially over the coming year. Chart 5The Rally Has Been Led By Cheap Stocks
The Rally Has Been Led By Cheap Stocks
The Rally Has Been Led By Cheap Stocks
Table 2 highlights that the 3-month interbank repo rate is down materially from its 12-month high, a decline that is now passing through into lower bank lending rates. According to the PBOC, the weighted average lending rate declined 30 basis points in Q4, after having been essentially unchanged in Q3. The decline validates our model for predicting the rate, which had been calling for a non-trivial decline. Despite the continual expression of concern in the financial press about rising onshore corporate bond defaults, spreads on SOE corporate bonds have been steady over the past 6 months. Spreads remain elevated when compared with late-2016 levels, but the recent trend in spreads does not suggest that domestic financial conditions are getting tighter. Chart 6 shows that the recent rise in CNY-USD is consistent with a tariff-based framework that we had presented for the exchange rate several times last year. While the rate was on its way to breaking through the psychologically important level of 7 for USD-CNY, trade talks with the U.S. have helped the rate rise to a point that is consistent with the current tariff regime. CNY-USD has already overshot to the upside based on interest rate differentials, but Chart 6 implies that further gains may occur if tariff rollbacks are part of an eventual deal with the U.S. Chart 6CNY-USD May Rise Materially Further If Tariffs Are Rolled Back
CNY-USD May Rise Materially Further If Tariffs Are Rolled Back
CNY-USD May Rise Materially Further If Tariffs Are Rolled Back
Jonathan LaBerge, CFA, Vice President Special Reports jonathanl@bcaresearch.com Cyclical Investment Stance Equity Sector Recommendations
China’s much-watched new Total Social Financing (TSF) data slowed to only RMB703 billion in February, compared to RMB4.6 trillion in January (and consensus expectations of RMB1.45 trillion). M2 money supply growth also slowed to 8.0% year-on-year, down from…
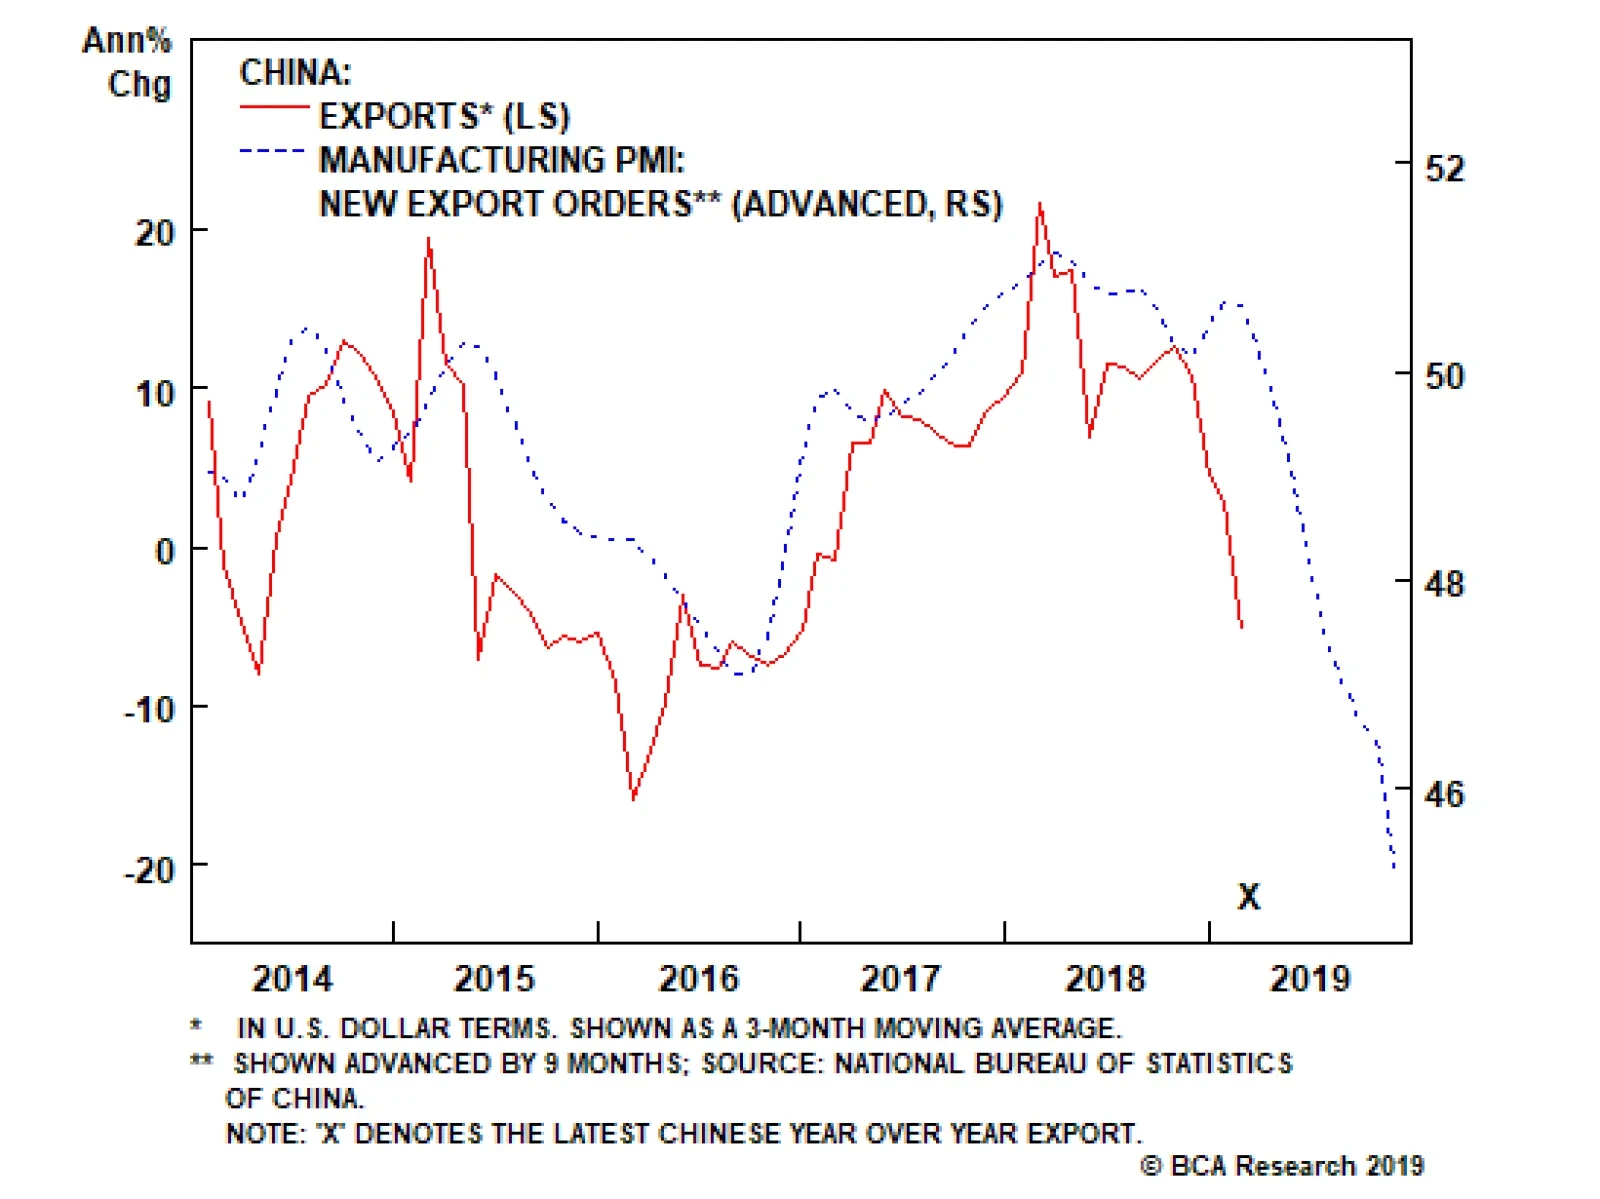
Last year, despite weak domestic activity and slowing global trade, Chinese exports remained very strong, even growing at a 19% annual rate in October. BCA’s China Investment Strategy service argues that this reflected front-running of the U.S. tariffs on…
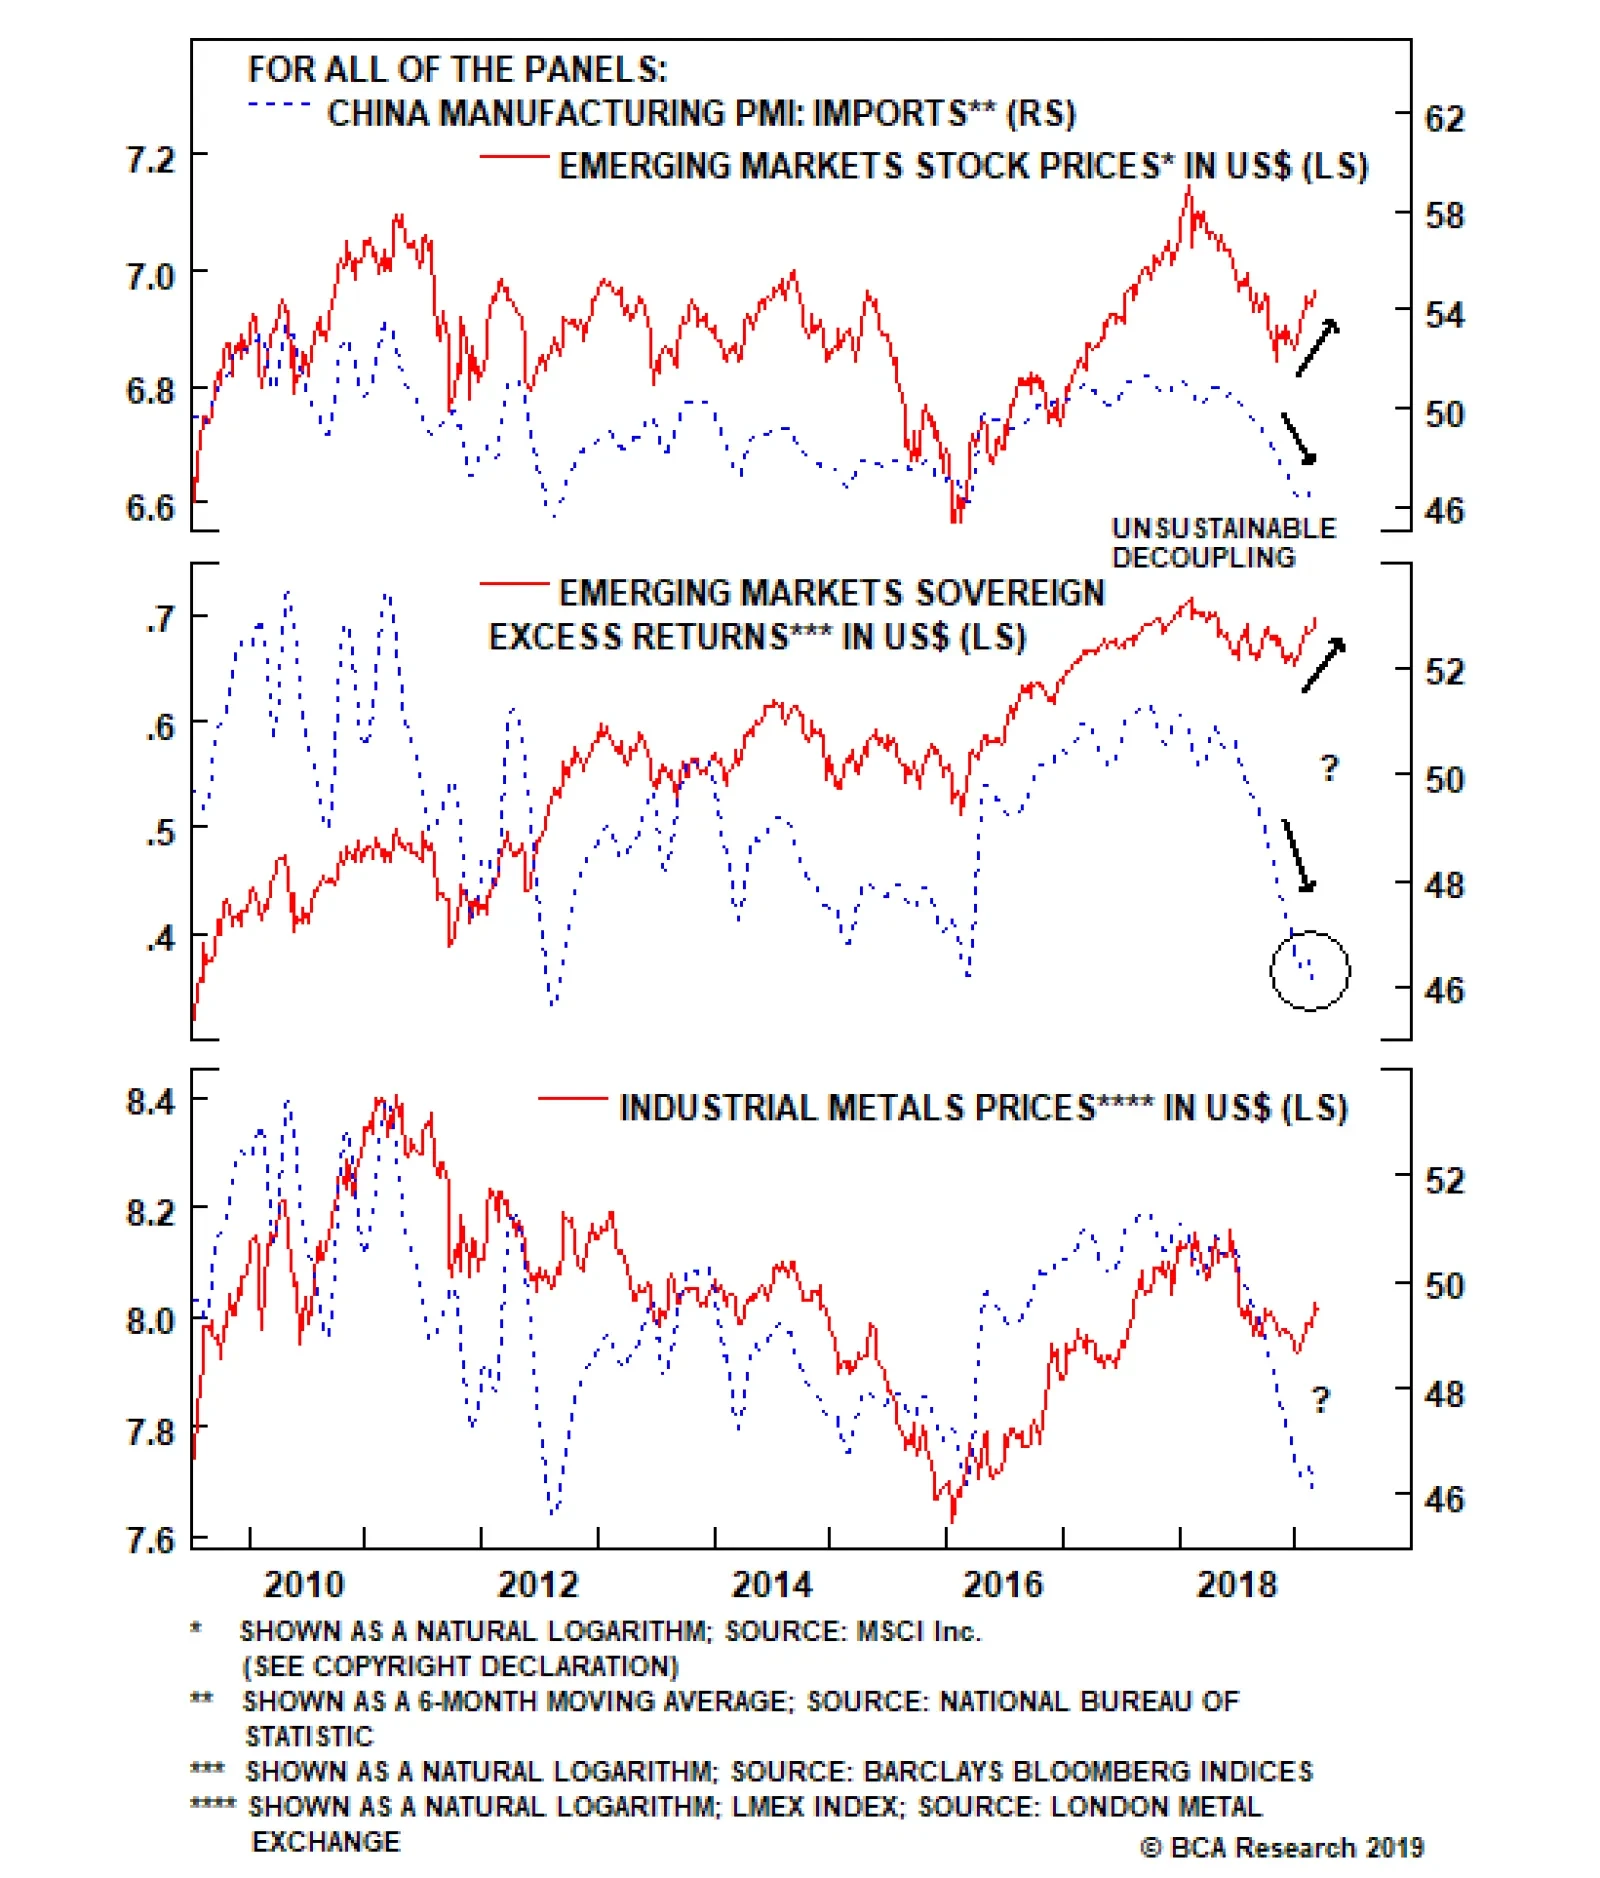
China influences the rest of the world via its imports. A closer look at the indicators that correlate with EM risk assets and commodities do not justify the recent EM rebound. In particular: The import sub-component of China’s NBS manufacturing PMI…
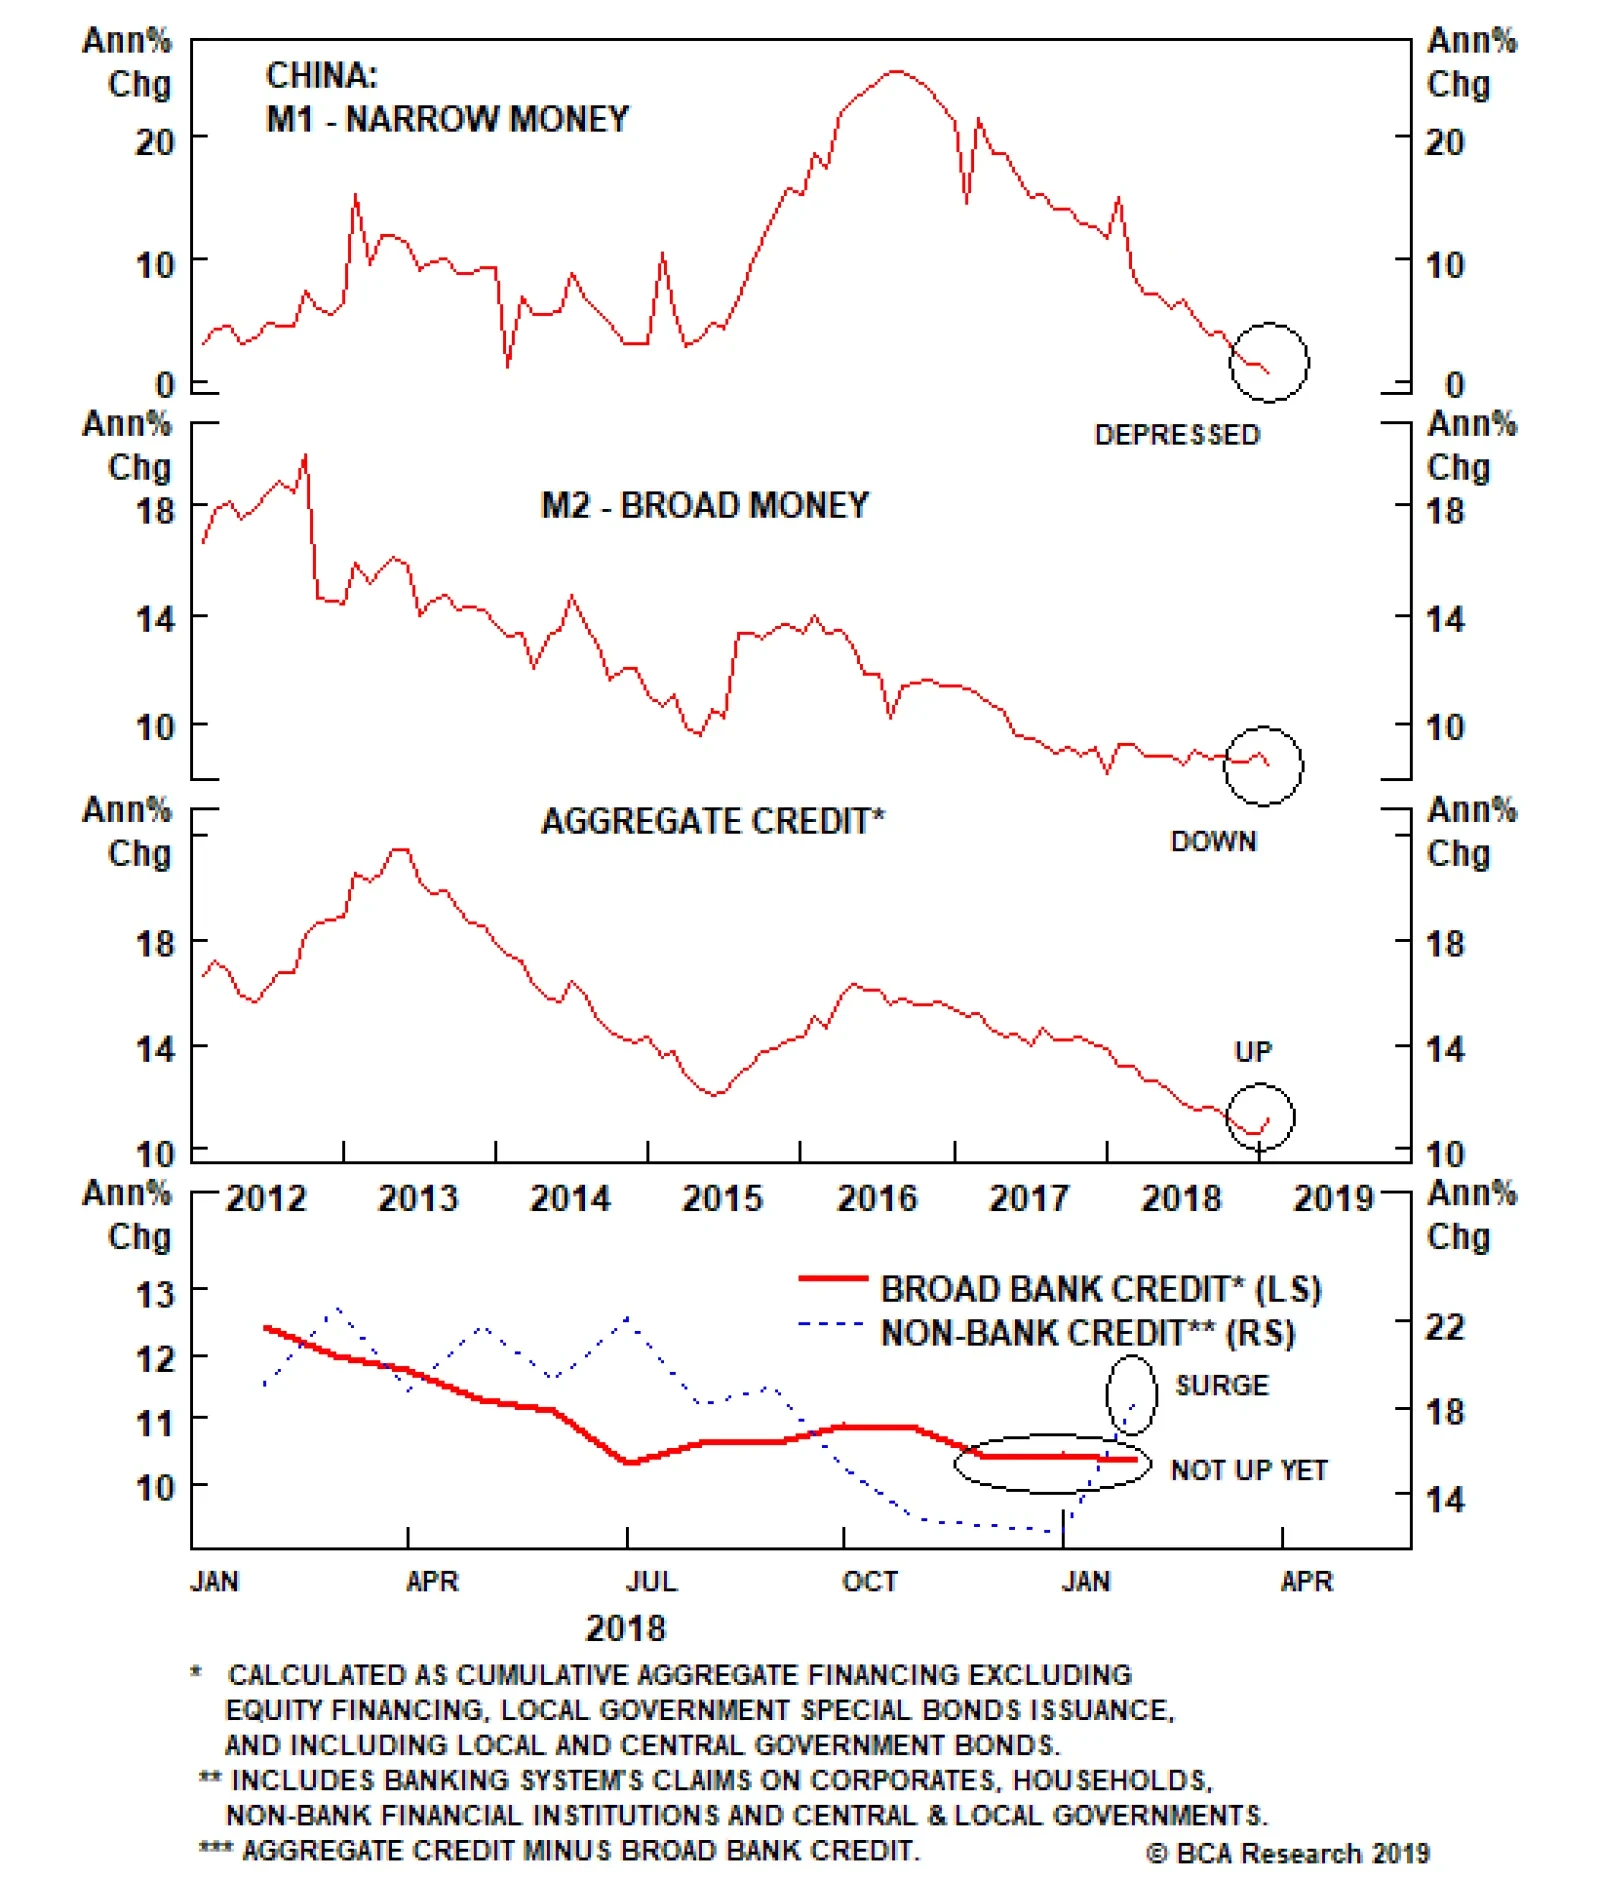
Even though narrow money (M1) has historically been an excellent indicator for China/EM business cycles, the most recent (January) print – M1 annual growth rate registered a record low – was distorted due to technical/seasonal factors, and should be ignored. …
Democrats as well as Republicans voiced support for Lighthizer as the top negotiator due to his strict stance on China’s trade practices. The takeaway is that Trump needs deep concessions from China – what the top Democrat on the committee called “a…