Emerging Markets
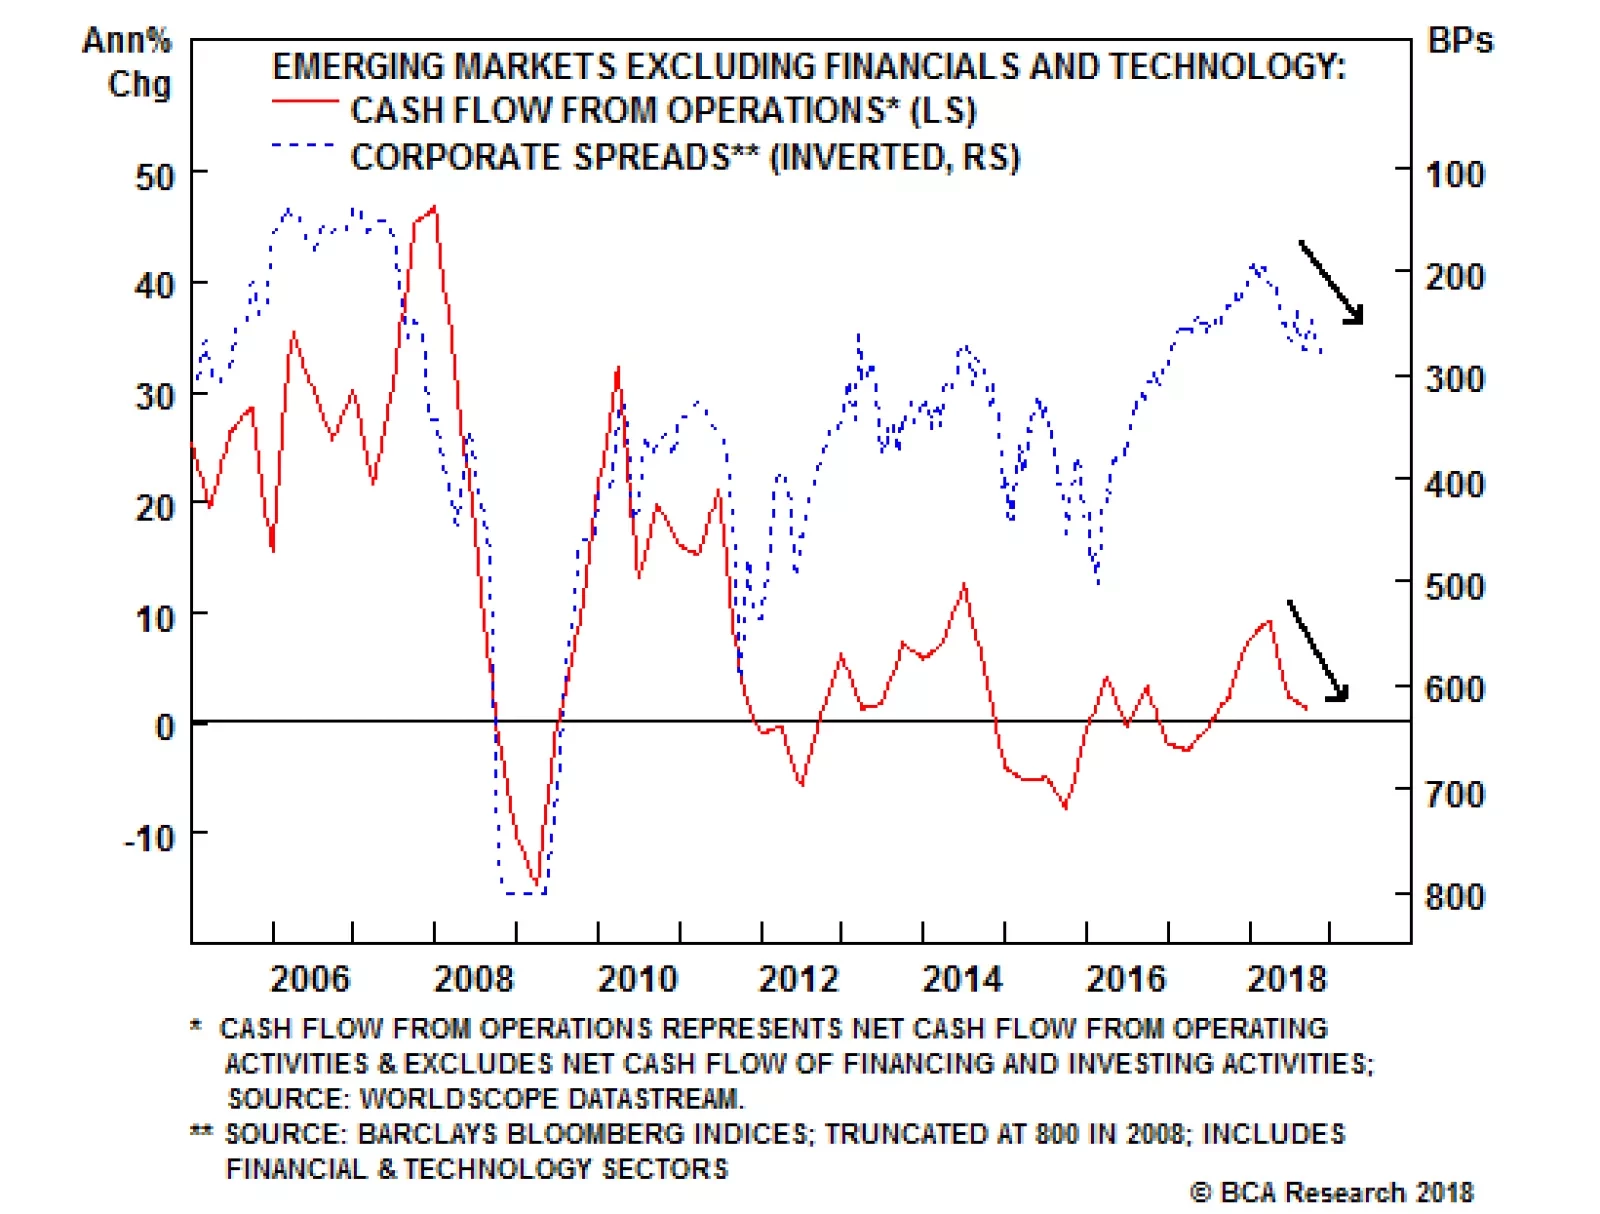
Cyclical swings in EM corporate and sovereign credit spreads are driven by changes in borrowers’ revenues, cash flow, and profits. When global and EM growth accelerate, revenue and free cash flow improve, causing credit spreads to narrow (see chart). The…
A major slump in emerging economies would undoubtedly drag down global equities. In the ensuing synchronized bear market, the more defensive healthcare sector would almost certainly outperform financials, and under these circumstances the direction of…
Our European Investment Strategy team has consistently argued that regional equity views often boil down to relative sector performance. For instance, the performance of U.S. versus euro area stocks tracks the relative performance of technology versus…
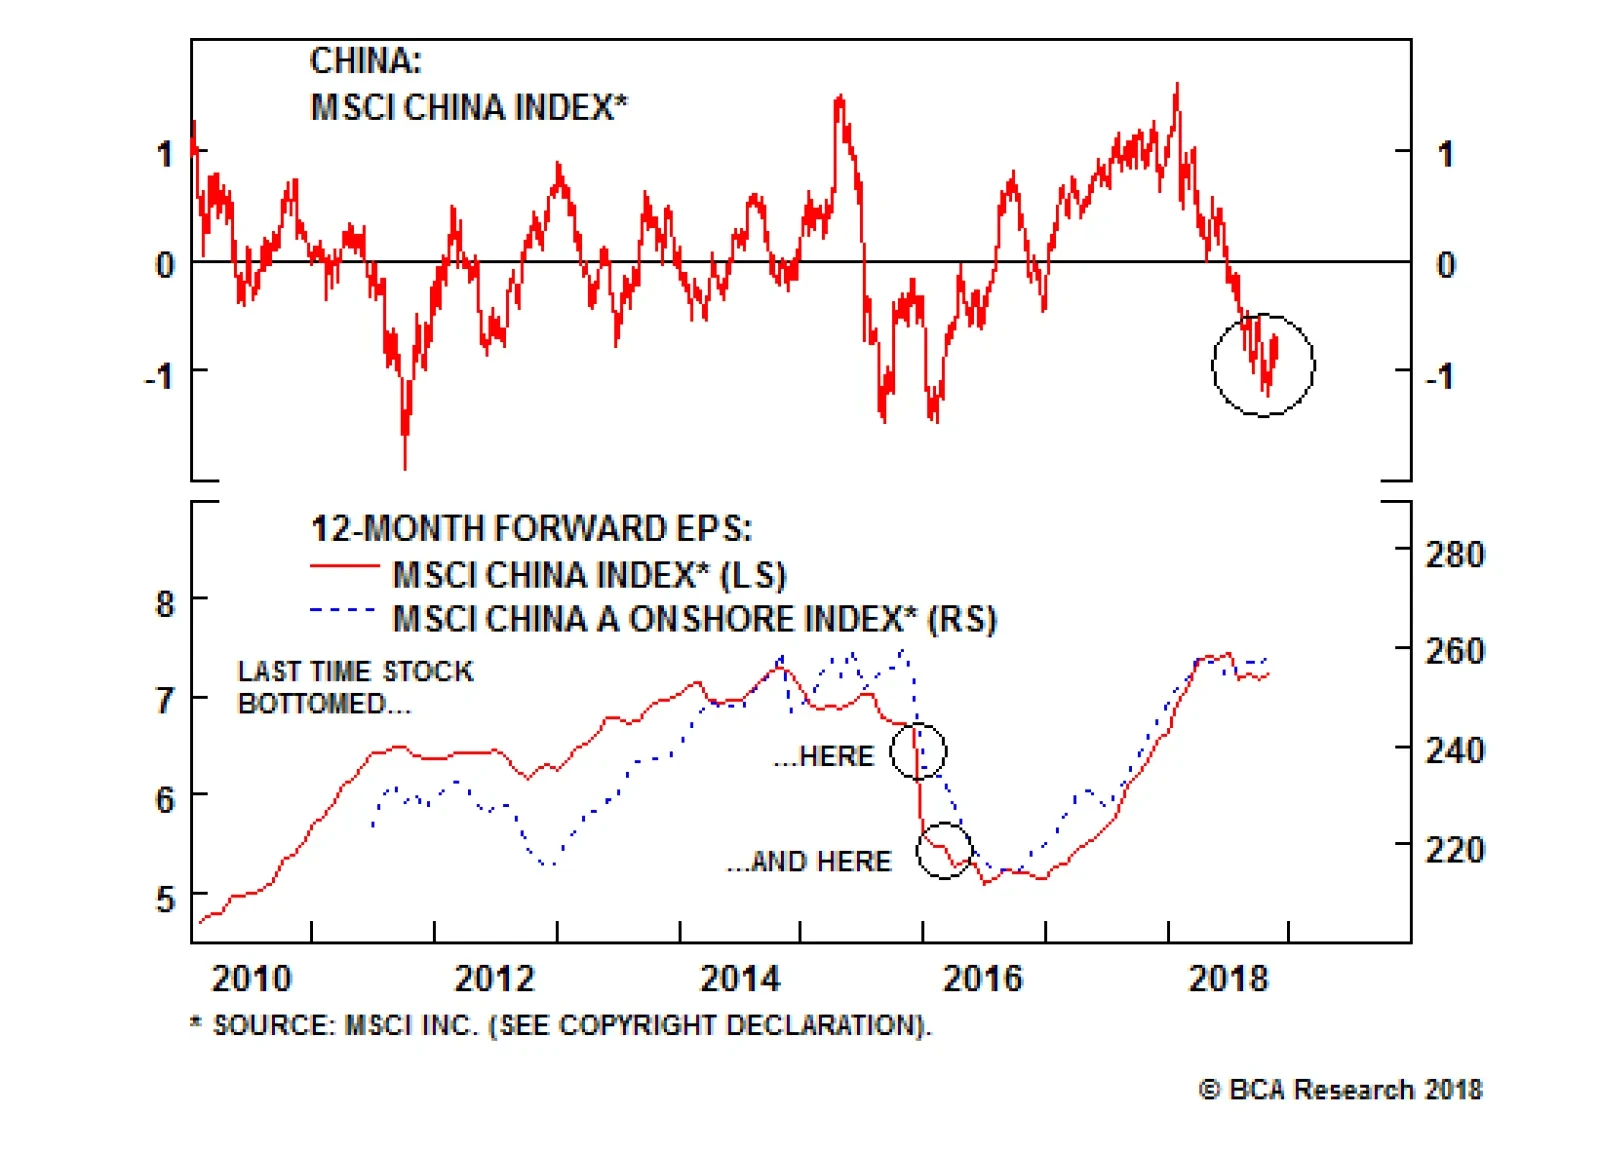
Very oversold conditions often reflect extreme pessimism toward an asset class, and therefore can represent great buying opportunities. As Nathan Rothschild famously said, “the time to buy is when there’s blood in the streets.” Both the on-shore and…
Last week’s flurry of optimism about an apparently meaningful resumption in U.S.-China trade talks were somewhat offset by less-positive comments from President Xi and Vice President Pence at the APEC summit over the weekend. Nonetheless, our geopolitical…
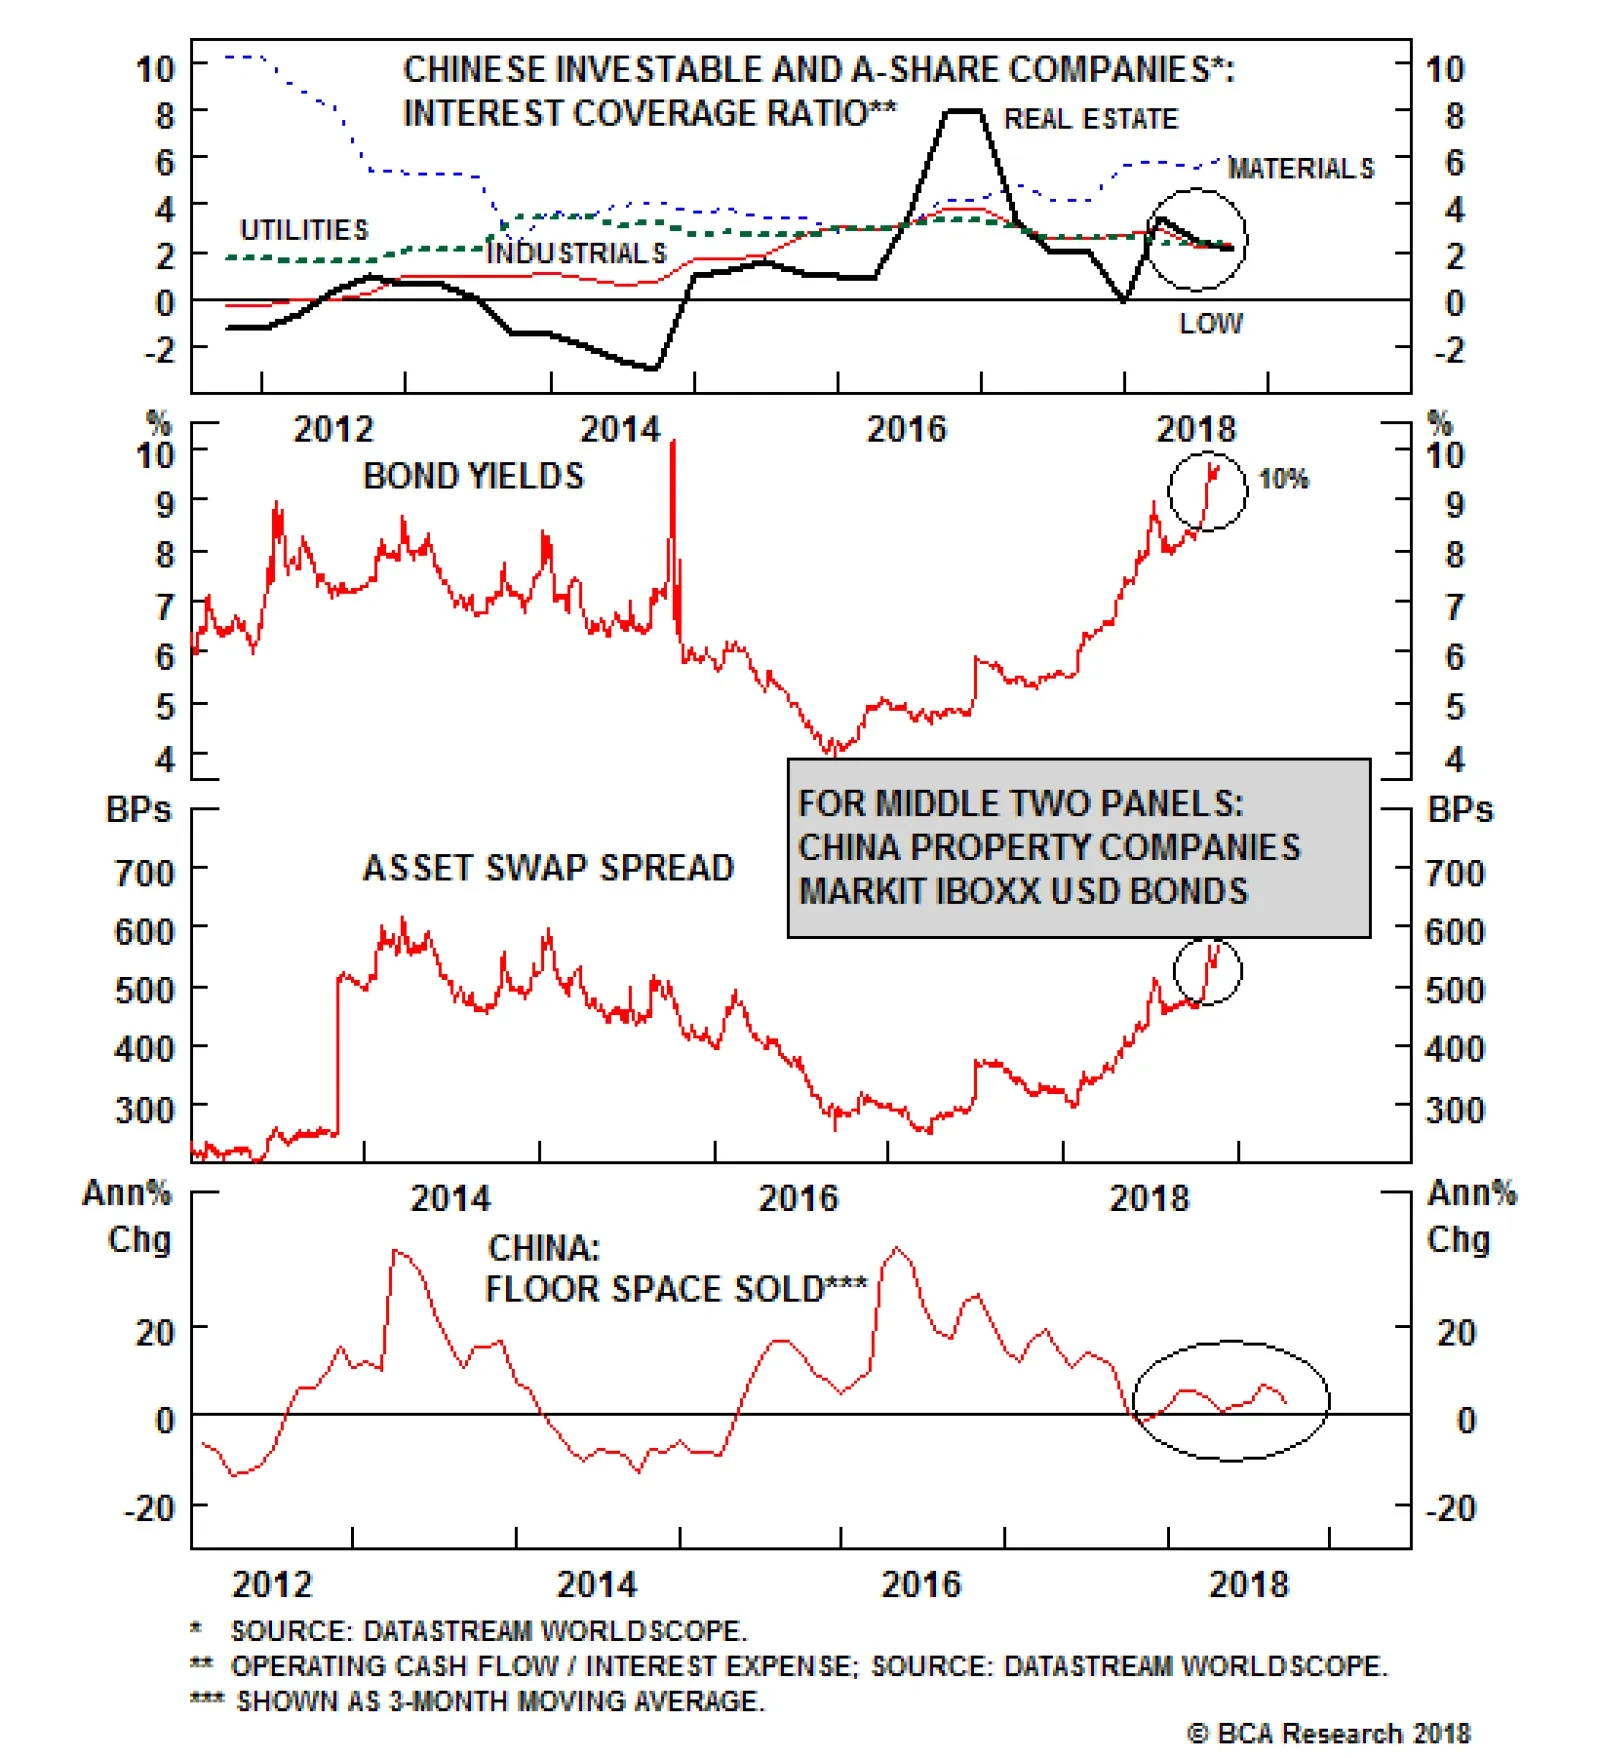
Chinese property developers are heavily indebted. Consistently then, the interest coverage ratio for real estate firms is extremely low (see chart, top panel). The bad news does not end there. The middle two panels of the chart above shows that offshore…
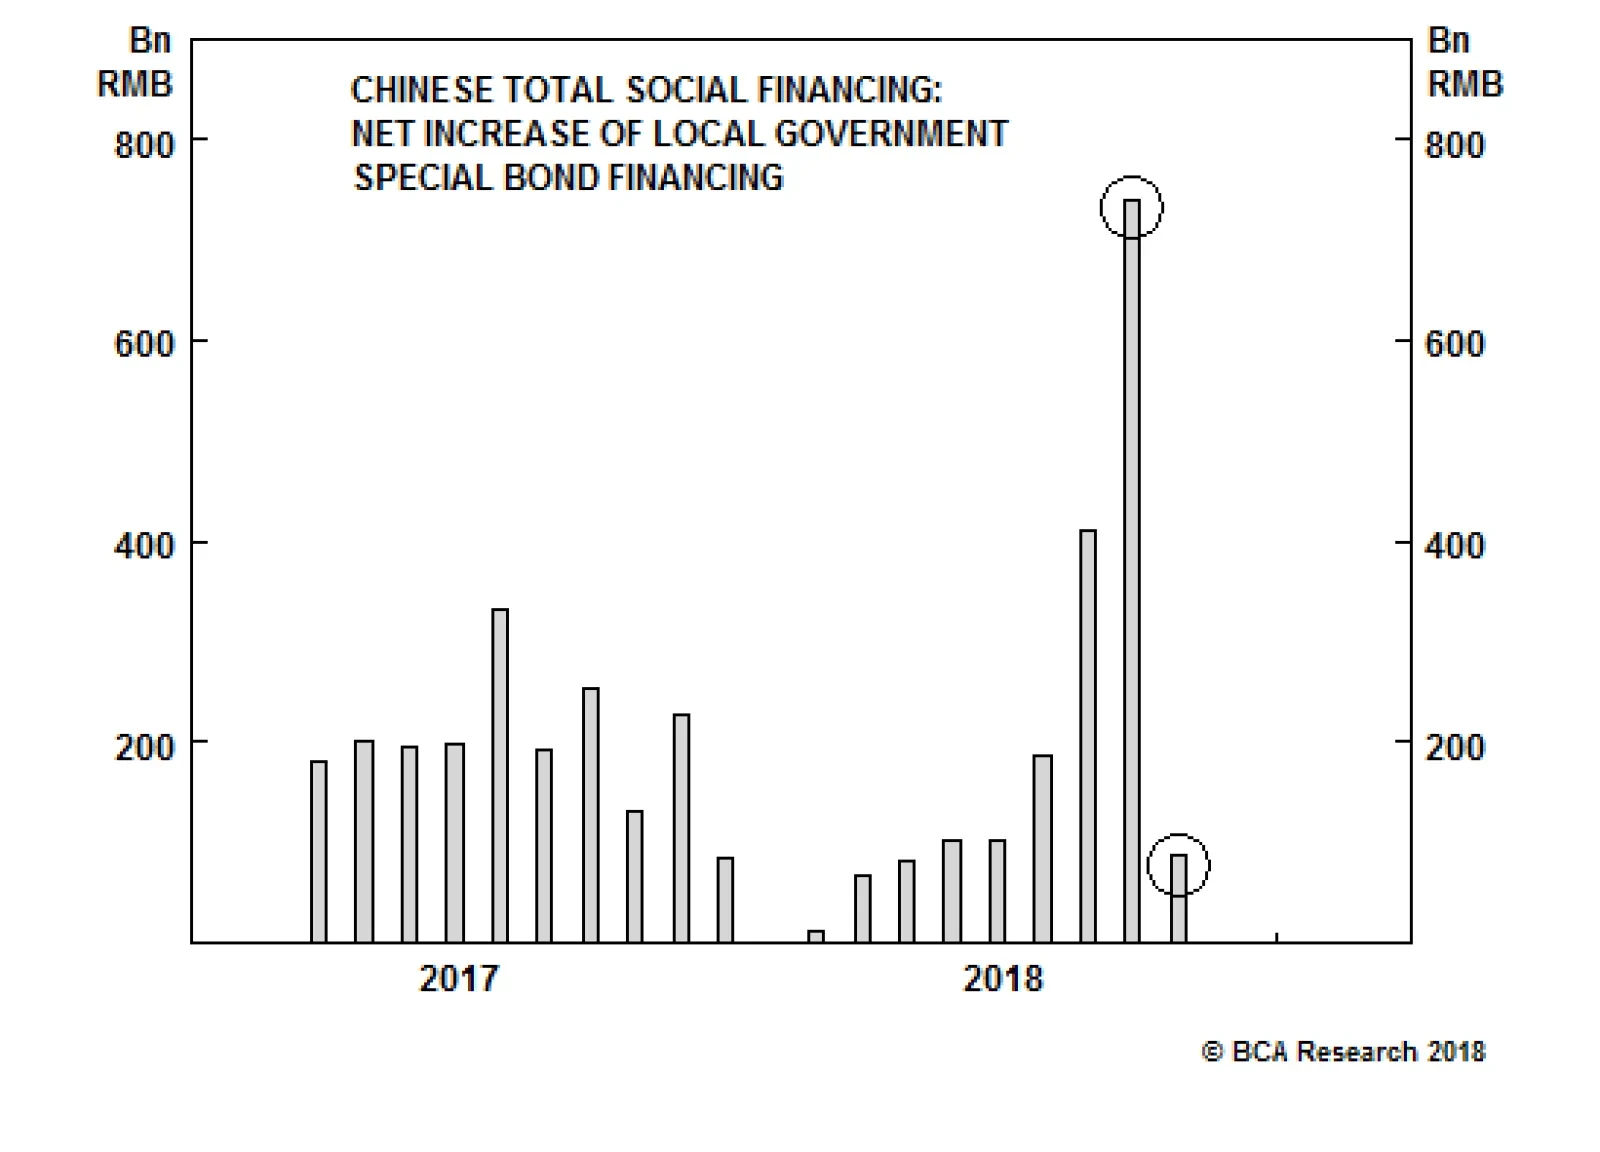
October’s credit data was highly significant for investors. The weaker-than-expected numbers validated the view that our China strategists espoused in a recent report.1 They noted that the surge in the 3-month rate of change of adjusted total social financing…
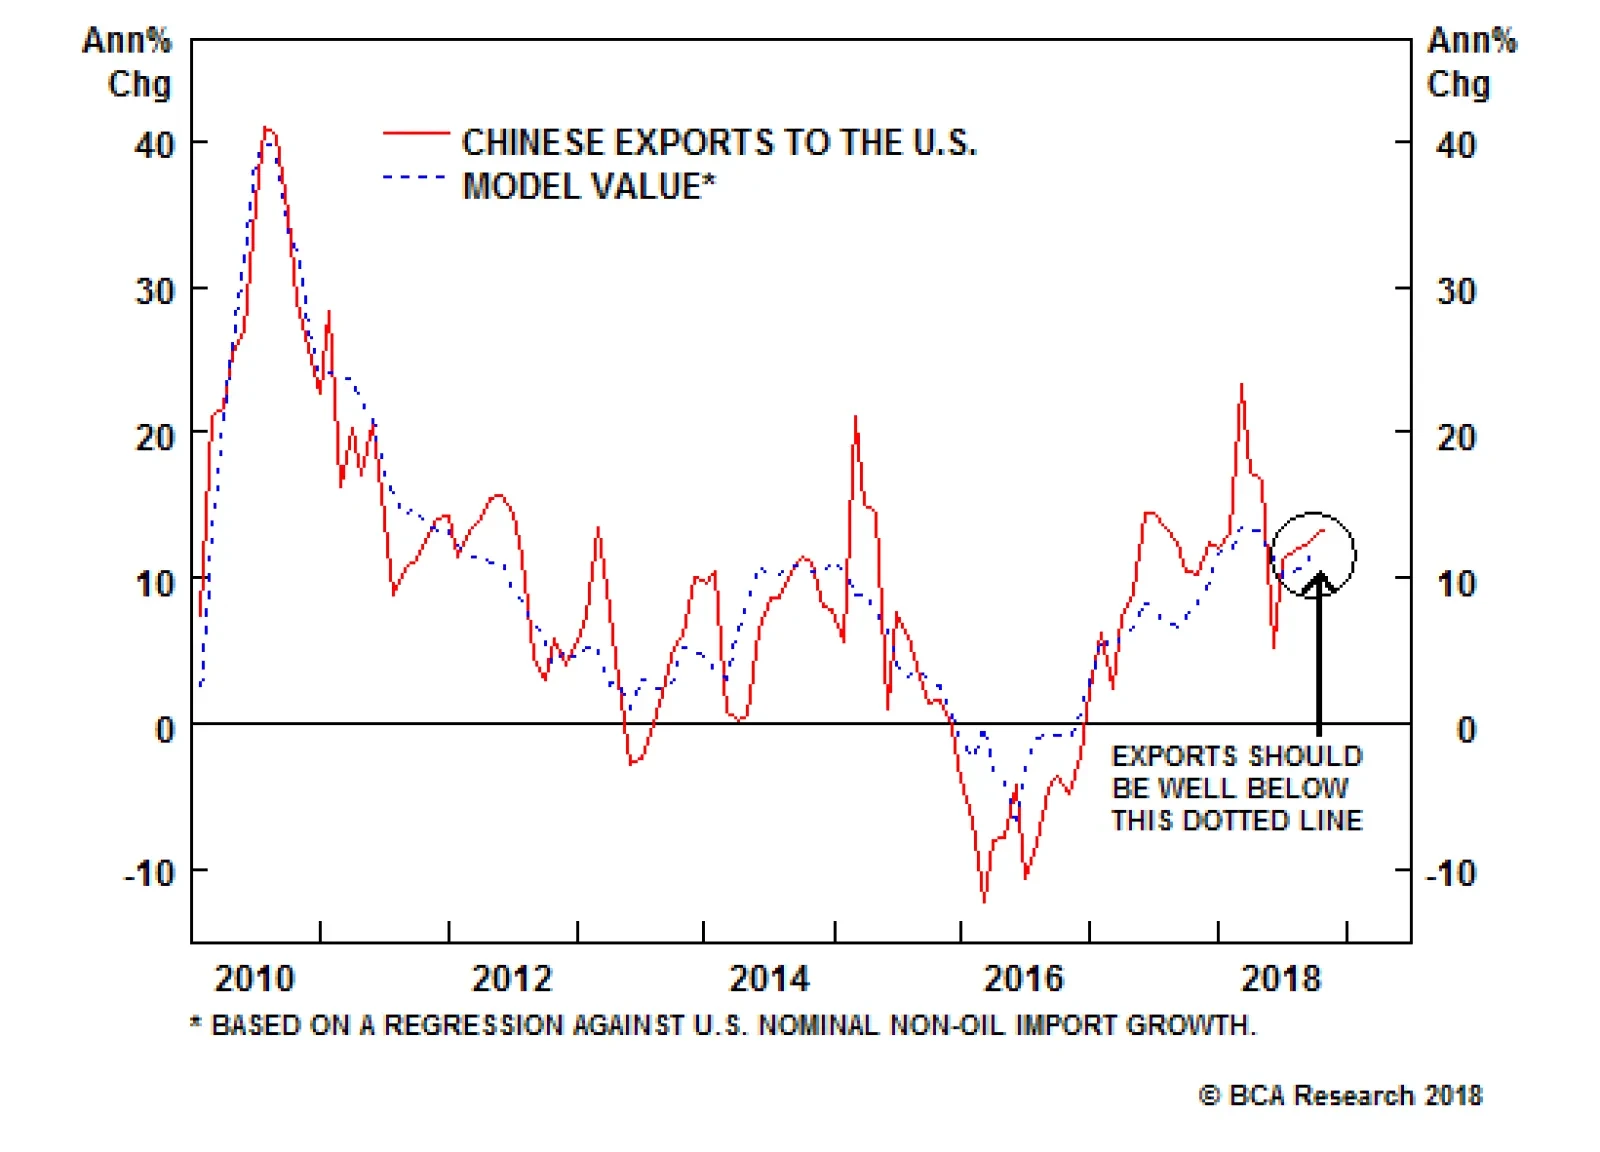
China’s strong October trade data (released earlier this month) likely frustrated investors, as it revealed that market participants will have to wait for clarity on the magnitude and duration of the upcoming shock to exports. The strong October trade data…

Highlights Structurally, EM corporate leverage is elevated and the interest coverage ratio is low. Cyclically, China/EM growth slowdown will lead to corporate spread widening. Rising U.S. dollar corporate bond yields in EM herald lower share prices. The recent underperformance in Mexican financial markets versus their EM peers is not sustainable. We reiterate our overweight position in Mexico. In Indonesia, the central bank is attempting to fight the Impossible Trinity, a battle that by definition cannot be won. Investors should keep underweighting this market. Feature This report focuses on the corporate health of emerging market (EM) companies, as well as the outlook for corporate bonds. We review the key drivers behind credit spreads and provide an up-to-date snapshot of overall corporate health. We also illustrate the travails in China's offshore corporate bond market, which are of high importance to the broad EM outlook. With respect to scope of coverage and data comparability, please refer to Box 1. BOX 1 Data Relevance And Its Application As there is no aggregate financial dataset for EM corporate bond issuers, we use corporate financial data provided by Worldscope for the EM equity universe - the constituents of the MSCI EM equity index. While from an individual country perspective this makes a difference, from an EM sector perspective the differences are not substantial. Excluding the technology sector, it is often the case that the same companies have both publicly traded stocks and bonds. This is especially true in sectors such as basic materials, energy, industrials, telecom, utilities and financials. This is why, in this report, we focus our attention on sectors rather than countries, and why we examine the EM companies' financial health excluding technology and banks. Banks' relevant financial ratios vary greatly from those of non-banks. For the technology sector, the largest tech names in the equity space have minimal bonds outstanding, so using financial data from the equity space for credit analysis is inappropriate. In short, the analysis below on corporate health is pertinent to both equity and corporate bond investors. However, its emphasis is on creditworthiness and ability to service debt, which is more attuned to credit investors. Drivers Of EM Credit Spreads Cyclical swings in EM corporate and sovereign credit spreads are driven by changes in borrowers' revenues, cash flow and profits. Hence, the business cycle is one of the important drivers of corporate creditworthiness. When global and EM growth accelerate, revenue and free cash flow improve, causing credit spreads to narrow (Chart I-1). The EM business cycle drives EM sovereign spreads too (Chart I-2). Chart I-1EM Corporates: Cash Flow From Operations And Credit Spreads
bca.ems_sr_2018_11_22_s1_c1
bca.ems_sr_2018_11_22_s1_c1
Chart I-2EM Sovereign Spreads Move In Tandem With Business Cycle
EM Sovereign Spreads Move In Tandem With Business Cycle
EM Sovereign Spreads Move In Tandem With Business Cycle
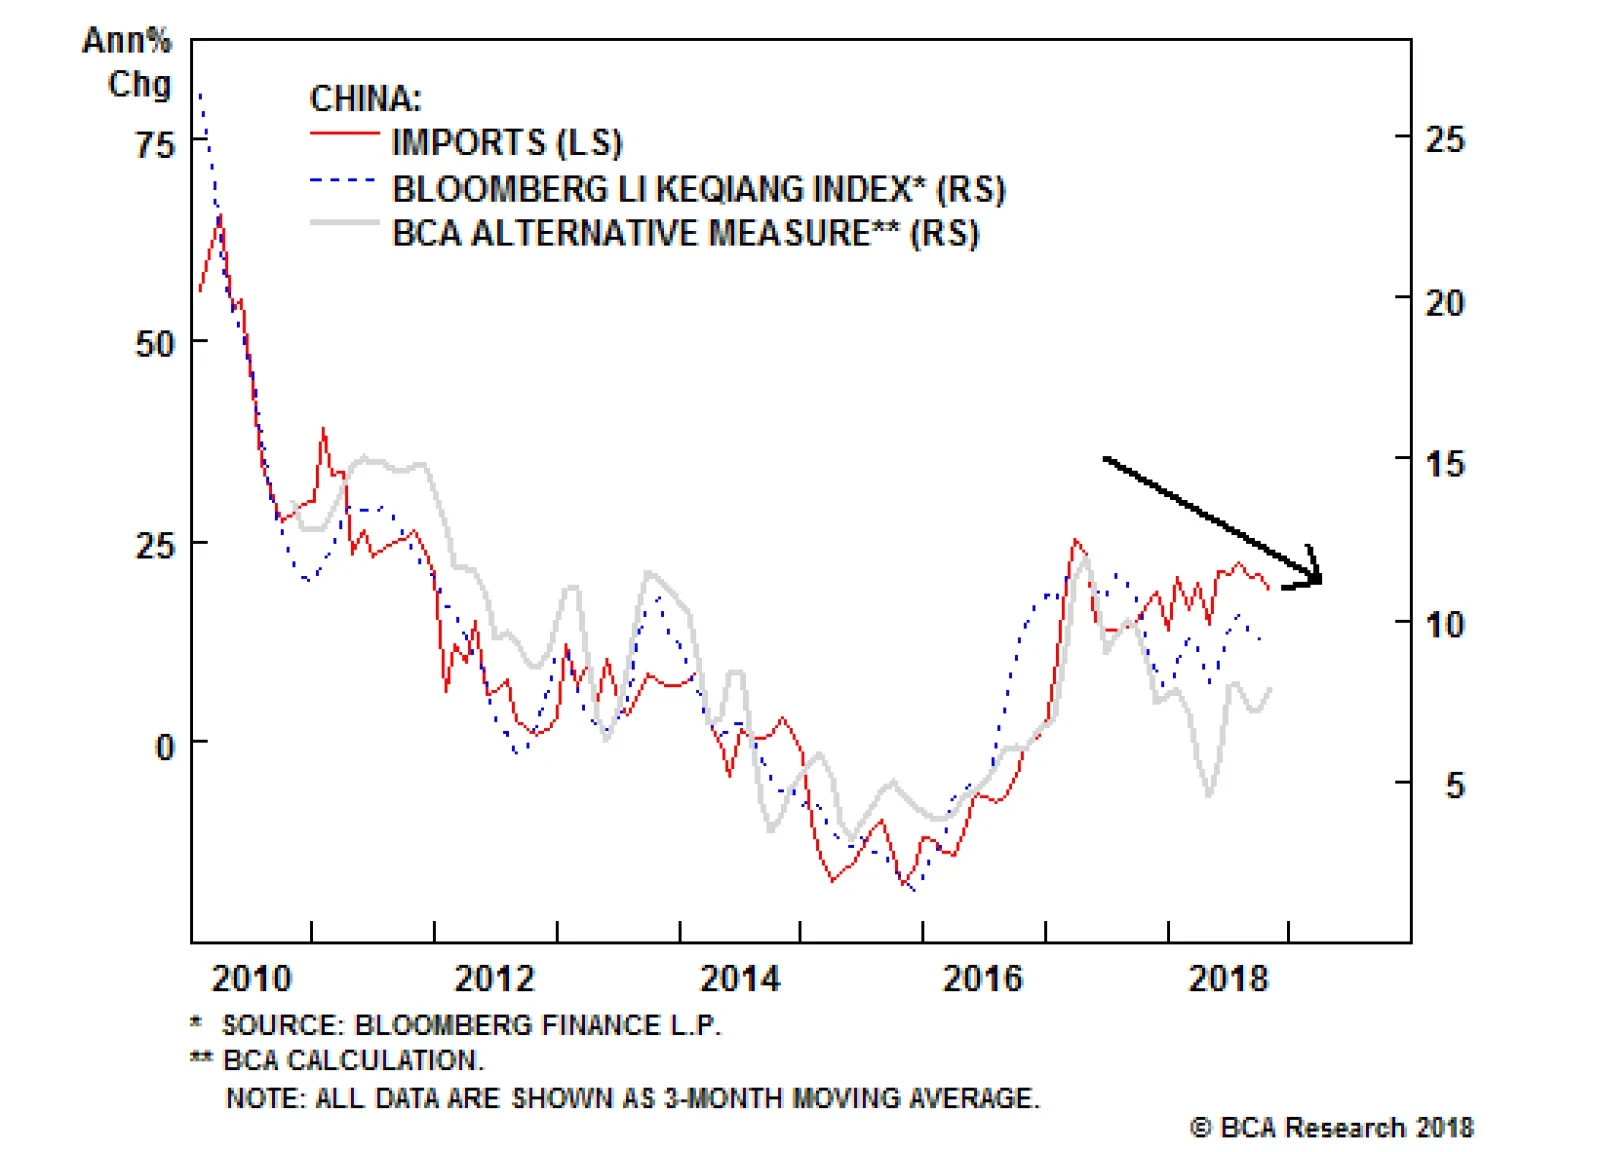
This is why we spend a lot of time gauging the global business cycle outlook and cover this topic extensively in our reports. For now, the growth outlook for China/EM and global trade remains gloomy: Chart I-3China Is A Major Risk For EM Profits
China Is A Major Risk For EM Profits
China Is A Major Risk For EM Profits
China's credit and fiscal spending impulse projects further weakness in the mainland's business cycle and EM corporate earnings (Chart I-3). China's slowdown is no longer limited to the industrial sector - household spending growth has downshifted considerably since early this year, as we discussed in last week's report.1 Weakening sales of consumer goods and autos in China are one of the primary reasons behind the ongoing slump in the global technology and semiconductor sectors. Consistently, plunging growth in Taiwanese electronics exports points to both weaker global trade and EM tech earnings in the months ahead (Chart I-4). In short, even though we have excluded technology from our analysis of corporate financial health, hardware tech companies' profits remain at risk. The latter is not relevant for EM corporate bond investors, but it is critical for the EM equity space. Chart I-4Taiwanese Shipments Foreshadow A Relapse In EM Tech Earnings
Taiwanese Shipments Foreshadow A Relapse In EM Tech Earnings
Taiwanese Shipments Foreshadow A Relapse In EM Tech Earnings
Other pertinent financial market indicators for EM credit spreads are commodities prices, EM exchange rates and EM local rates. The basis is as follows: (1) Energy and materials make up 25% of the J.P. CEMBI EM corporate bond index, and commodities prices drive their revenues and in turn credit spread fluctuations (Chart I-5, top panel); (2) Outside the resource sector, corporate bond issuers by and large do not feature exporters, and their capacity to service foreign currency debt is greatly affected by exchange rate movements (Chart I-5, bottom panel); (3) Financials make up 30% of the J.P. CEMBI EM corporate bond index, and their credit spreads are greatly influenced by domestic interest rates and banking system health (Chart I-6). We exclude financials from our corporate health analysis because their financial ratios differ vastly from those of non-financials. Chart I-5Drivers Of Credit Spreads: Commodities And Currencies
Drivers Of Credit Spreads: Commodities And Currencies
Drivers Of Credit Spreads: Commodities And Currencies
Chart I-6EM Bank Credit Spreads Will Widen If Local Bond Yields Rise
EM Bank Credit Spreads Will Widen If Local Bond Yields Rise
EM Bank Credit Spreads Will Widen If Local Bond Yields Rise
Overall, we expect global trade to weaken, commodities prices to drop further and EM currencies to depreciate. The latter will push up local interest rates. In turn, several EM banking systems remain saddled with bad assets from previous credit booms that have not been recognized, and banks have not been recapitalized. These factors point to a widening in bank credit spreads. All in all, EM corporate and sovereign spreads will widen further. A Snapshot Of EM Corporate Health The following financial ratios - which are calculated for EM companies excluding technology and financials - do not justify currently tight corporate spread. Leverage measured as net debt (total debt minus cash assets) divided either by EBITDA or cash flow from operation2 (CFO) remains elevated (Chart I-7, top panel). Among 9 sectors, only energy, basic materials and consumer discretionary have seen their leverage fall over the past two years. Chart I-7EM Corporate Health: Leverage And Interest Coverage Ratios
EM Corporate Health: Leverage And Interest Coverage Ratios
EM Corporate Health: Leverage And Interest Coverage Ratios
Interest coverage ratios computed as EBITDA- or CFO- to- interest expense are well below their 2007 and 2011 levels (Chart I-7, middle panel). These figures corroborate that neither EM corporate indebtedness nor companies' ability to service debt using cash from operations is back to levels that prevailed before the global financial crisis in 2008 when EM financial markets were in a secular uptrend. Crucially, this is inconsistent with presently still-tight EM corporate spreads (Chart I-7, bottom panel). This mispricing, in our opinion, reflects the global search for yield that was induced by the crowding out of investors from DM bond markets by global central banks' QE programs. A contraction in corporate profits and cash flows from operation - for the reasons discussed above - will cause issuers' credit matrixes to deteriorate. With respect to cross-sectional analysis, Table I-1 presents interest coverage ratios (computed as an average of EBITDA- and CFO-to-interest expense ratios) for mainstream countries and all sectors. The cells in red present pockets of distress where the interest coverage ratio is below 3. The cells in blue illustrate segments where moderate financial stress is present: these are sectors with an interest coverage ratio of above 3 but below 5.5. Table I-1Interest Coverage Ratios
EM Corporate Health And Credit Spreads
EM Corporate Health And Credit Spreads
On a positive note, the rally in commodities and cutbacks in capex have allowed energy and basic materials companies to drastically improve their leverage and interest coverage ratios in the past 2 years. However, even though their present financial health is great, their cash flow from operations is set to deteriorate again as commodities prices continue to relapse. The key motive behind our negative view on credit markets in Latin America, Russia, the Middle East and Africa - which is de facto the EM universe excluding emerging Asia - is because with the exception of Turkey, they are very exposed to commodities prices. As commodities prices drop and these nations' currencies depreciate, their sovereign and corporate credit spreads will widen. We are not implying that these issuers are facing default risks. Simply, lower revenues from commodities and higher debt servicing costs due to currency depreciation warrant a re-pricing of risk. Within credit portfolios, we recommend favoring defensive low-beta credit, excluding banks, versus riskier high-beta ones. We are underweight EM banks within the EM equity space and recommend the same strategy for the EM credit universe. Based on the matrix in Table I-1, credit portfolios should overweight consumer services, tech, energy and basic materials and underweight industrials, utilities and healthcare. China's Corporate Health And Credit Market There has been little deleveraging among Chinese companies. On the contrary, the country's massive credit and fiscal stimulus in 2016 bailed out many indebted companies, lifting corporate debt levels and augmenting the misallocation of capital. In particular: Chart I-8China's Corporate Debt Is Enormous
China's Corporate Debt Is Enormous
China's Corporate Debt Is Enormous
China's corporate debt remains enormous, at $19.5 trillion, or RMB 140 trillion. It is the highest in the history of any country (Chart I-8). Some 95% of corporate debt is in local currency terms. My colleague Jonathan LaBerge from China Investment Strategy has calculated that Chinese state-owned enterprises' adjusted return on assets, has fallen below the cost of capital (Chart I-9). This indicates that these companies have for now exhausted profitable investment opportunities and should arguably scale back on their investment expenditures. Further borrowing and investing by these enterprises will augment the amount of bad assets held by Chinese banks and reduce the country's overall productivity and hence, potential growth. Yet, denying these debtors financing will result in a major slump in capex, and probably labor market weakness. Chart I-9Chinese SOEs: Capital Misallocation
Chinese SOEs: Capital Misallocation
Chinese SOEs: Capital Misallocation
Chart I-10Leverage And Interest Coverage For Chinese Companies
Leverage And Interest Coverage For Chinese Companies
Leverage And Interest Coverage For Chinese Companies
Dissecting sectoral data, indebtedness is elevated for industrials, utilities and property developers. Consistently, the interest coverage ratio is extremely low for industrials, utilities and property developers (Chart I-10). Financial health of Chinese materials has improved tremendously due to de-capacity reforms - the shutdown of excess capacity that has boosted both steel and coal prices. Interestingly, this has occurred at the expense of utilities and some other heavy consumers of steel and coal. Notably, steel and coal prices are beginning to relapse (Chart I-11). For reasons discussed in our previous report,3 these commodities prices will drop further and will hurt producers' cash flow and profits, causing their creditworthiness to deteriorate. Chart I-11Steel And Thermal Coal Prices
Steel And Thermal Coal Prices
Steel And Thermal Coal Prices
Offshore corporate bond yields and spreads are surging, foreshadowing rising borrowing costs and reduced availability of financing (Chart I-12A). The problem is especially acute for property developers (Chart I-12B). In a nutshell, Chinese corporate U.S. dollar bond yields are at their highest levels of the past five-six years. The same is true for emerging Asian corporate bond issuers. Chart I-12AChinese Offshore Aggregate Corporate Bonds
Chinese Offshore Aggregate Corporate Bonds
Chinese Offshore Aggregate Corporate Bonds
Chart I-12BChinese Offshore Property Developers
Chinese Offshore Property Developers
Chinese Offshore Property Developers
Not only do Chinese corporate bonds now account for 32.5% of EM and 56% of emerging Asian corporate bond indexes, but investment expenditures by Chinese companies are also critical to companies elsewhere in Asia and globally. Chinese gross fixed capital formation accounts for 6% and 5.4% of global GDP in nominal and real terms, respectively. By contrast, these numbers are 4.6% and 4.3% for the U.S. We have deliberated at great length on why China's growth will likely continue to downshift, despite the policy stimulus, and we will not repeat our arguments today.4 The financial health of Chinese companies will worsen due to dwindling sales and cash generation. This, along with less credit/financing available onshore and offshore, will erode their capacity to undertake large investment expenditures. Consequently, capital expenditures in general and construction in particular will suffer substantially. This is the main rationale behind our negative view on resources, raw materials and industrials worldwide. Investment Observations And Conclusions Apart from Turkey and Argentina, there has been no liquidation and capitulation in EM assets in general and the credit space in particular. It would be unusual if this extended selloff ends without capitulation. EM credit markets appear technically vulnerable. In particular, the excess returns on EM sovereign and corporate bonds are splintering below their 200-day moving averages (Chart I-13). Odds are there will be more downside. Chart I-13A Bad Signal
A Bad Signal
A Bad Signal
Rising U.S. dollar corporate bond yields in both EM overall and in emerging Asia herald lower share prices (Chart I-14). So long as the drop in U.S. Treasury yields is offset by widening EM credit spreads, EM corporate bond yields will continue to rise and EM share prices will sell off. However, as and when EM corporate (or sovereign) yields start falling, irrespective of whether because of declining U.S. Treasury yields or narrowing EM credit spreads, EM equity prices will rally. EM sovereign and corporate bond yields are an imperative indicator to watch for equity investors. Chart I-14Rising Corporate Yields = Lower Share Prices
Rising Corporate Yields = Lower Share Prices
Rising Corporate Yields = Lower Share Prices
We continue to recommend defensive positioning in EM sovereign and corporate bonds. In terms of asset allocation, EM dollar-denominated sovereign and corporate bonds should not be compared with EM local currency bonds or equities or U.S. Treasurys.5 These are credit instruments, and they should be a part of a credit portfolio with U.S. and European corporate bonds. Credit portfolios should presently be underweight EM sovereign and corporate bonds relative to U.S. corporate bonds (Chart I-15A & Chart I-15B). Chart I-15AEM Sovereign Credit Versus U.S. Credit: Relative Excess Returns
EM Credit Versus U.S. Credit: Relative Excess Returns
EM Credit Versus U.S. Credit: Relative Excess Returns
Chart I-15BEM Corporate Credit Versus U.S. Credit: Relative Excess Returns
EM Credit Versus U.S. Credit: Relative Excess Returns
EM Credit Versus U.S. Credit: Relative Excess Returns
Arthur Budaghyan, Senior Vice President Emerging Markets Strategy arthurb@bcaresearch.com Andrija Vesic, Research Analyst andrijav@bcaresearch.com Mexico: Is The Underperformance Overdone? Despite having a sound macroeconomic backdrop,6 Mexican financial markets have lately substantially underperformed their emerging market peers due in large part to domestic politics. Odds are that Mexican risk assets will continue to sell off in absolute terms, especially given the broad turmoil in the EM universe, which we expect to continue. That said, the recent underperformance of Mexican markets versus their EM peers is overdone, and odds are that Mexican stocks, local bonds and sovereign credit will outperform their EM peers over the coming six to 12 months: First, the Mexican authorities have been pursuing orthodox macro policies, including very tight monetary and fiscal policies. The central bank hiked its policy rate again last week in the face of a currency relapse, and the fiscal stance has been tight. Currently, the real policy rate is 4% and the 10-year local currency government bond yield is 5.5%, both deflated by core consumer price inflation (Chart II-1, top and middle panel). Real rates are very high by historical standards and are now above most other EMs. Chart II-1Mexico: Tight Monetary And Fiscal Policies
Mexico: Tight Monetary And Fiscal Policies
Mexico: Tight Monetary And Fiscal Policies
The government's non-interest expenditures deflated by core consumer price inflation have been contracting (Chart II-1, bottom panel). Such a tight monetary and fiscal policy mix will not change considerably with AMLO taking the office and it should benefit the currency. We expect the peso to start outperforming its EM peers on a total-return basis. Second, the Mexican peso is very cheap - close to one standard deviation below fair value, according to the unit labor cost-based real effective exchange rate (Chart II-2). The latter is our favorite currency valuation measure. Chart II-2The Mexican Peso Is Cheap
The Mexican Peso Is Cheap
The Mexican Peso Is Cheap
Third, economic growth is improving, as the effects from monetary and fiscal tightening are diminishing (Chart II-3). This should at the margin support Mexican financial markets versus their EM peers where growth is slowing. Chart II-3Mexico: A Moderate Cyclical Recovery
Mexico: A Moderate Cyclical Recovery
Mexico: A Moderate Cyclical Recovery
Fourth, Mexico's business cycle is much more leveraged to the U.S. economy than to China's. In line with our view that U.S. growth will fare better than China's growth, the Mexican economy will likely outperform other EMs that are more leveraged to China. Finally, an important rationale behind our recommendation to maintain an overweight stance on Mexico is that Mexican risk assets are defensive plays within the broad EM universe. In other words, whenever there is broad EM turbulence and an ensuing flight to quality, Mexican risk assets tend to outperform their EM peers. This is even more likely to happen now that Mexican sovereign spreads are already elevated and local currency government bonds offer a very attractive yield relative to other EMs (Chart II-4). Chart II-4Mexican Domestic And U.S. Dollar Bonds Offer Value
Mexican Domestic And U.S. Dollar Bonds Offer Value
Mexican Domestic And U.S. Dollar Bonds Offer Value
Still, a few words are warranted on the recent domestic political developments. Our view is that the latest measures announced by the incoming administration regarding the new airport and banking fees are more indicative of a strategy to test the markets before the AMLO administration takes office, rather than declaring war against both markets and investors. It is noteworthy how fast the AMLO government came out after each of these announcements to calm investors. This suggests to us that fears of Mexico taking an irreversible sharp political turn to the left are overblown. AMLO is likely to be pragmatic and deliberate in the way he pushes forward his policies. In a nutshell, our bias is that these announcements represent an attempt by the AMLO administration to promote competition and reduce rent-seeking activities in the economy. This can be negative for shareholders of incumbent large companies, as it will hurt corporate profits of oligopolies. However, in the long term these polices will be positive for overall economic growth as they will reduce the cost of doing business, appease structural inflation and boost the nation's competitiveness. From a structural perspective, these policies are positive for the currency and local bonds. One way to play this theme is to favor small-cap over large-cap companies. Given the oligopolistic structure of some industries, Mexican large-cap companies are much more likely to be hurt by the incoming administration's open competition policies than small-cap companies. As such, small-caps will likely outperform large-caps in Mexico over at least the next six to 12 months (Chart II-5). Moreover, small-caps are currently trading at a significant discount compared to large-caps, with the former trading at multiples that are half of the latter. Chart II-5Mexico: Small-Caps Will Outperform Large-Caps
Mexico: Small-Caps Will Outperform Large-Caps
Mexico: Small-Caps Will Outperform Large-Caps
Investment Conclusion Dedicated EM investors should overweight Mexican equities, local currency bonds and sovereign credit within their respective universes. Concerning the exchange rate, we are maintaining our long MXN / short ZAR position. Stephan Gabillard, Senior Analyst stephang@bcaresearch.com Indonesia: Defying The Impossible Trinity? Indonesian stocks are attempting to rally and have lately outperformed the EM equity benchmark. The outlook for this bourse remains negative and we recommend investors to fade this rally and outperformance. Critically, Indonesian domestic interbank rates and corporate U.S. dollar bond yields are rising. Historically, this is a negative signal for share prices (Chart III-1, rates and yields are shown inverted). Chart III-1Rising Rates/Yields = Falling Stocks
Rising Rates/Yields = Falling Stocks
Rising Rates/Yields = Falling Stocks
Weakening rupiah and rising interest rates are forcing the central bank (BI) into a policy dilemma: Should it defend the currency and allow interest rates to rise further or should it cap interest rates and let the currency find a market equilibrium? It appears the BI is trying to do both - to stop the currency from depreciating, while also capping or bringing down interbank rates simultaneously. This defies the Impossible Trinity thesis which stipulates that a central bank of a country with an open capital account has to choose between controlling either the exchange rate or interest rates. On the surface, it would seem that the BI has been focused on targeting a stable rupiah. The monetary authorities have sold foreign exchange reserves (Chart III-2, top panel), and raised the key policy rate. Chart III-2Aggressive Monetary Policy Tightening...
Aggressive Monetary Policy Tightening...
Aggressive Monetary Policy Tightening...
Selling of foreign exchange reserves is a form of tightening as it drains the banking system's excess reserves at the central bank. Shrinking interbank liquidity, however, pushes up interbank rates and borrowing costs (Chart III-2, bottom panel). Higher borrowings costs not only make the currency more appealing to investors, but they also curb domestic demand and, thereby, improve the current account balance. This is an ultimate mechanism of how policy tightening leads to exchange rate stability. Yet the full picture of BI's policies is a lot murkier. While on the one hand, the central bank has sold its foreign exchange reserves and hiked policy rates to defend the rupiah, it has also offset some of the tightening by injecting local currency reserves into the banking system. Chart III-3 shows that the BI purchased/redeemed back central bank certificates from commercial banks, which has led to a sharp increase in commercial banks' excess reserves. Chart III-3... And Liquidity Injections By Central Bank
... And Liquidity Injections By Central Bank
... And Liquidity Injections By Central Bank
Central bank liquidity injections are akin to monetary easing aimed at capping or even bringing down interbank rates. Hence, they come as a contradiction to the central bank's restrictive policies. If the BI chooses to stabilize the rupiah, then interbank rates and borrowing costs in general will have to rise and the economy will take a hit. Corporate earnings will then contract which will be bearish for the equity market. If the central bank opts to cap interbank rates, it has to inject as much liquidity (excess reserves) into the banking system as required. In this scenario, the currency could depreciate triggering capital flight and selloffs in equity and local bond markets. The BI can continue the muddle-through policy - offsetting or sterilizing its foreign exchange interventions by turning the backdoor liquidity taps on. These injections of local currency liquidity into the banking system could encourage speculation against the rupiah and allow banks to lend more, maintaining robust imports and a large current account deficit. It is not certain, but if the market perceives that interest rates are lower than warranted, the currency could very well depreciate amid this policy mix. In this scenario, the result could be a mix of gradual currency depreciation and somewhat higher interest rates. Financial markets will still do poorly in dollar terms. Overall, odds are high that the rupiah will resume its depreciation and interest rates will move higher. Indonesia's balance of payment dynamics remain a risk to the exchange rate. The current account deficit is still large and exports are heading south (Chart III-4). Chart III-4Current Account Deficit Is Large
Current Account Deficit Is Large
Current Account Deficit Is Large
First, Chart III-5 illustrates that the sharp slowdown in the average manufacturing PMIs of Japan, Korea, Taiwan and Germany are pointing to an imminent contraction in Indonesian export volumes. Chart III-5Exports Are Heading South
Exports Are Heading South
Exports Are Heading South
Second, thermal coal prices seem to be breaking down. Chart III-6 shows that the stock price of Adaro - a large Indonesian coal producing company - has already fallen by 45% in U.S. dollar terms since January, and is heralding a dismal outlook for coal prices. Chart III-6Coal Prices Are To Break Down
Coal Prices Are To Break Down
Coal Prices Are To Break Down
Lower coal prices will shrink Indonesia's coal export revenues. The latter accounts for 12% of total Indonesian exports. In terms of the outlook for banks, which is a key equity sector, their share prices have been surprisingly resilient. Rising interest rates, however, will cause their NPLs to move higher hurting banks' profits, and pulling their share prices down (Chart III-7). Chart III-7Bank Stocks Are At Risk
Bank Stocks Are At Risk
Bank Stocks Are At Risk
Finally, overall Indonesian equity valuations are still not attractive either in absolute terms or relative to the EM benchmark. Meanwhile, foreigners own 32% of the equity market and 37% of local currency bonds. As the rupiah slides, foreigners will rush to the exits, amplifying the currency depreciation. Bottom Line: The path of least resistance for the rupiah is down. Continue underweighting Indonesian equities and bonds and continue shorting the rupiah versus the U.S. dollar. Ayman Kawtharani, Associate Editor ayman@bcaresearch.com Footnotes 1 Please see Emerging Markets Strategy Weekly Report, "On Domino Effects And Portfolio Outflows," dated November 15, 2018, available at ems.bcaresearch.com. 2 Cash flow from operations represents net cash flow from operating activities & excludes net cash flow financing and investing activities. 3 Please see China Investment Strategy Special Report, "Revisiting China's De-Capacity Reforms," dated October 17, 2018, available at cis.bcaresearch.com. 4 Please see Emerging Markets Strategy Weekly Report, "China: Stimulus, Deleveraging And Growth," dated October 25, 2018, available at ems.bcaresearch.com. 5 Please see Emering Markets Strategy Weekly Report, "Strategic Asset Allocation For Emerging Markets," dated May 7 2013, available at ems.bcaresearch.com. 6 Please see Emerging Markets Strategy Special Report, "A Mexican Standoff - Markets Vs. AMLO," dated June 28 2018, available at ems.bcaresearch.com. Equity Recommendations Fixed-Income, Credit And Currency Recommendations
Highlights The relative performance of developed market (DM) versus emerging market (EM) equities just corresponds to the relative performance of healthcare versus financials. On a six month horizon, DM will underperform EM. Within Europe, overweight Poland, Hungary and Czech Republic, but steer clear of energy-heavy Russia. Wait for the 10-year BTP yield to move closer to 3 percent before buying Italian assets, either in absolute or relative terms. Buy the pound on any sharp sell-offs during the Brexit psychodrama. Our medium-term expected value of pound/euro equals 1.18. Chart of the WeekDeveloped Vs. Emerging Markets = Healthcare Vs. Financials
Developed Vs. Emerging Markets = Healthcare Vs. Financials
Developed Vs. Emerging Markets = Healthcare Vs. Financials
Feature They say that to capture the Zeitgeist at any moment, all you need to do is name the top five companies in the world. So here are the top five companies in the developed equity markets (DM): Apple, Microsoft, Google, Amazon, and Facebook (Table I-1). Table I-1Developed Markets: Top 5 Companies
DM Versus EM, And Two European Psychodramas
DM Versus EM, And Two European Psychodramas
These five names do perfectly capture the spirit of our time and should not surprise you. Now look at the top five companies in the emerging equity markets (EM): Tencent, Taiwan Semiconductor, Samsung Electronics, Alibaba, and Naspers (Table I-2). Table I-2Emerging Markets: Top 5 Companies
DM Versus EM, And Two European Psychodramas
DM Versus EM, And Two European Psychodramas
What may surprise you is that technology titans dominate in EM markets too. In fact, the technology sector's weighting in EM, at 25 percent, is even larger than in DM, at 19 percent. If technology looms even larger in EM than in DM, what is the defining sector difference between the two regions? The answer is that emerging markets have almost no healthcare stocks, and an offsetting substantial overweighting to financials (Table I-3). Table I-3Developed Markets Versus Emerging Markets: Sector Weights
DM Versus EM, And Two European Psychodramas
DM Versus EM, And Two European Psychodramas
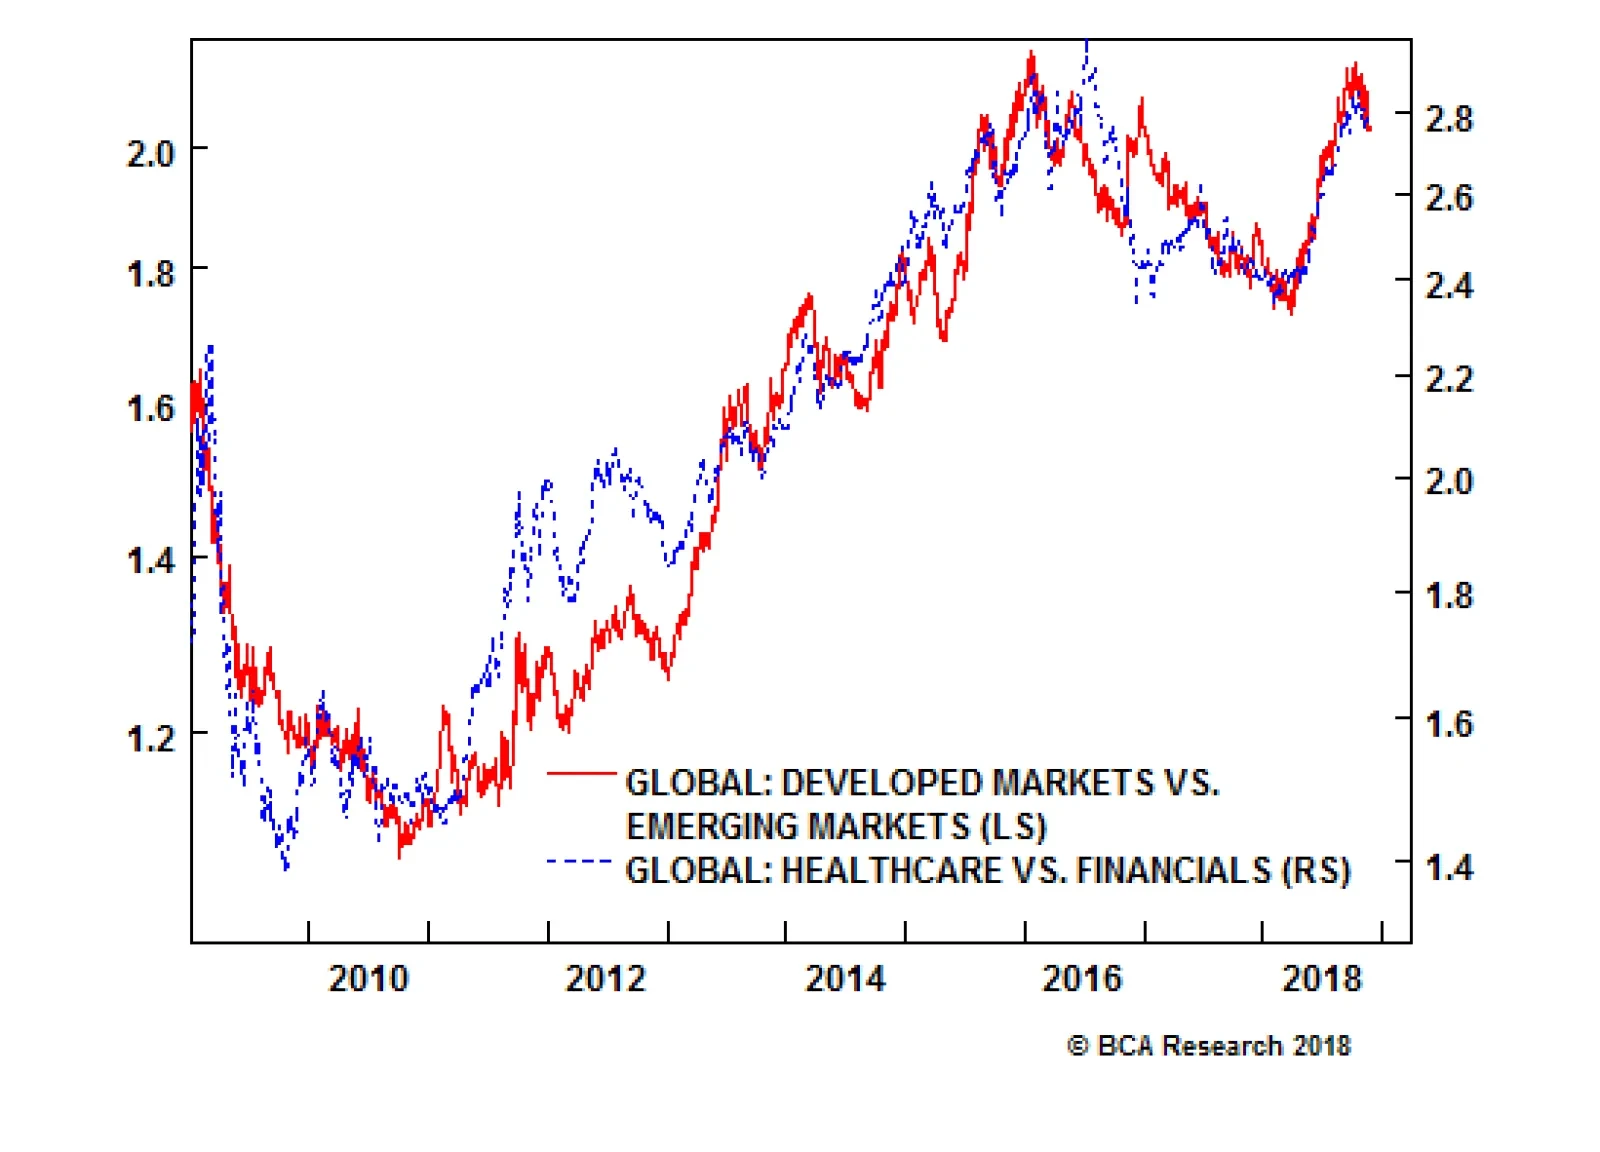
Developed Vs. Emerging Markets = Healthcare Vs. Financials The following is a very different way of looking at the DM versus EM investment decision and, as such, may differ from the BCA house view. As we have demonstrated time and time again on these pages, an equity market's dominant sector skew is of critical importance to investors (Chart I-2). This is because equity sector skews almost always drive regional and country relative performance. Crucially, this fundamental truth applies at the highest level too: the relative performance of DM versus EM. The Chart of the Week should leave you in absolutely no doubt that the relative performance of DM versus EM just corresponds to the relative performance of healthcare versus financials. Chart I-2Developed Versus Emerging Markets: Sector Weight Differences
DM Versus EM, And Two European Psychodramas
DM Versus EM, And Two European Psychodramas
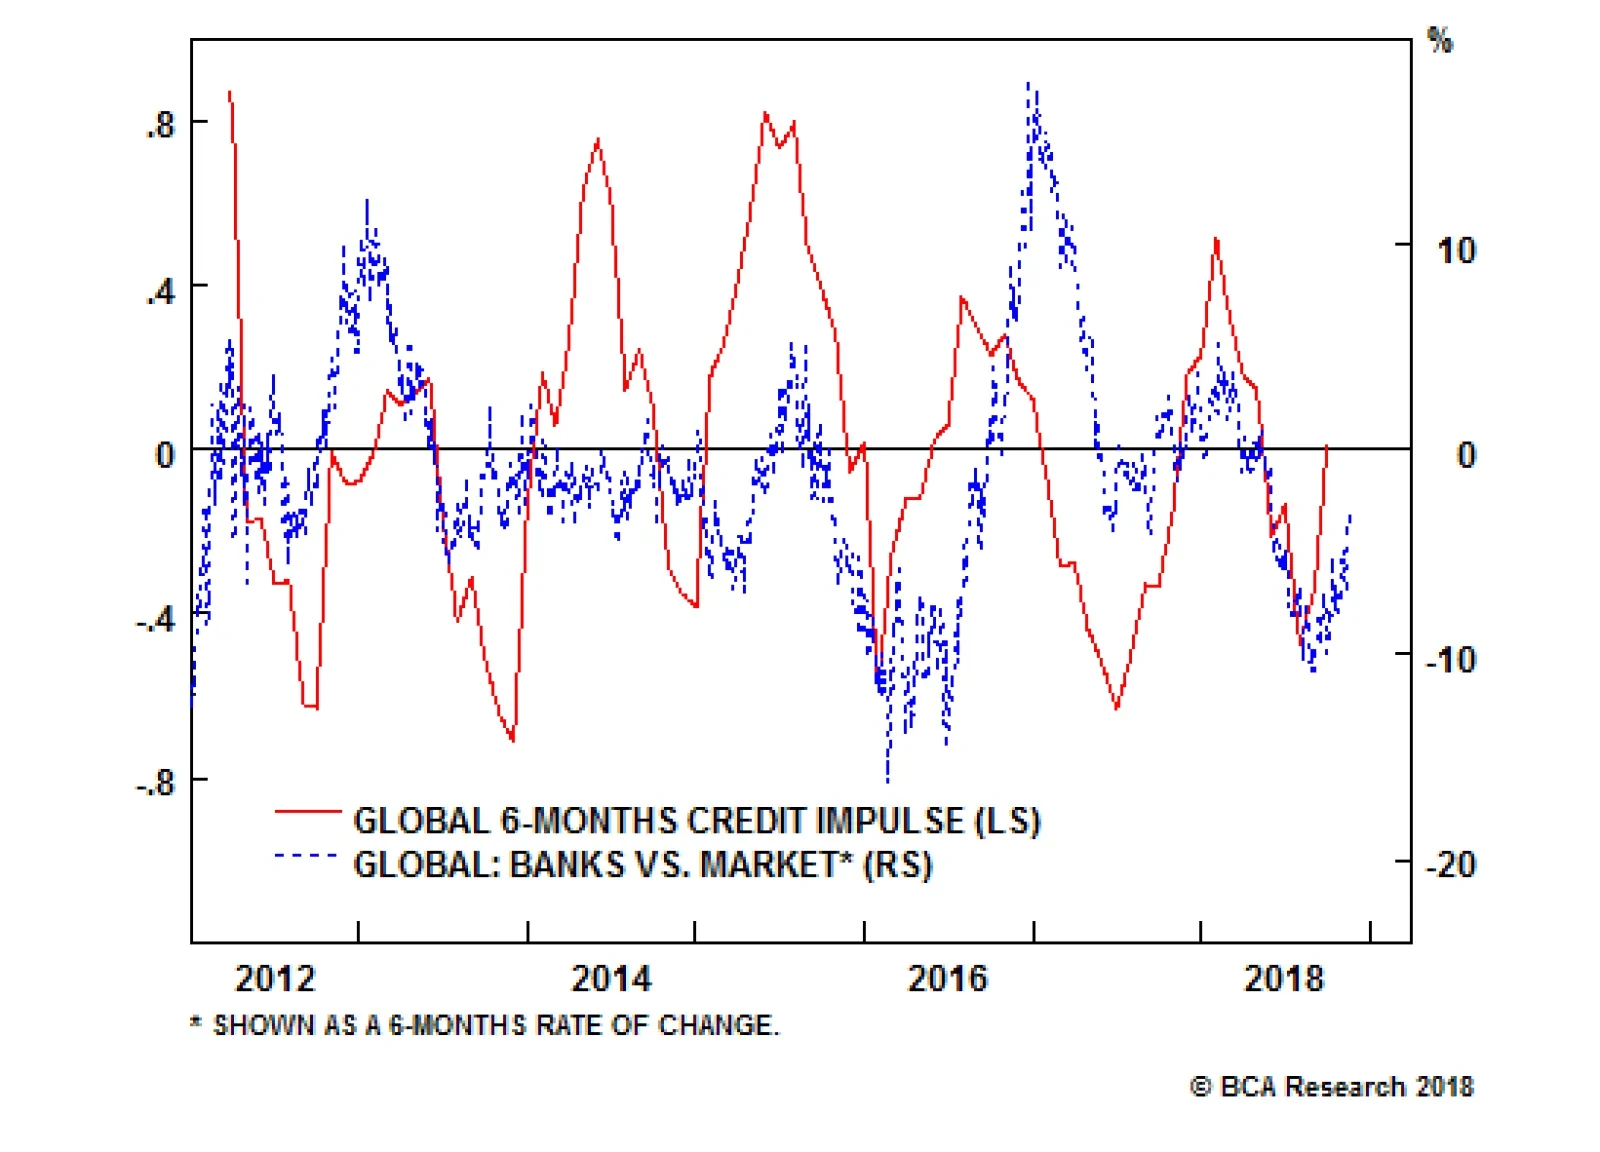
Nevertheless, this striking observation raises a fascinating question: what is the direction of causality? Does healthcare versus financials drive DM versus EM, or in fact does DM versus EM drive healthcare versus financials? The answer is sometimes the former, and at other times the latter. For example, a major slump in emerging economies would undoubtedly drag down global equities. In the ensuing synchronized bear market, the more defensive healthcare sector would almost certainly outperform the financials, and under these circumstances the direction of causality would clearly be from DM versus EM to global sector performance. On the other hand, absent a major bear market, if a reappraisal of sector relative valuations and growth prospects caused a rotation in sector leadership, the causality would run in the other direction: from global sector performance to DM versus EM. Such a reappraisal of sector relative valuations and growth prospects appears to be underway at the moment, and is likely to persist for the next few months. This is because the very sharp down-oscillation in global credit growth which occurred from February through September has now clearly flipped into an up-oscillation. For investors, these oscillations in global credit growth provide excellent tactical opportunities because the oscillations are very regular and therefore predictable; and the cyclical versus defensive sector performance closely tracks the oscillations. So after healthcare's strong outperformance versus financials from February through September, sector relative performance has now flipped into a reverse configuration (Chart I-3). Chart I-3An Up-Oscillation In Global Credit Growth Technically Favours Financials
An Up-Oscillation In Global Credit Growth Technically Favours Financials
An Up-Oscillation In Global Credit Growth Technically Favours Financials
To be clear, this is likely a tactical opportunity lasting no more than six months or so. Nevertheless, from a DM versus EM perspective, it would imply a countertrend move within a structural trend - in which the outperformance of DM versus EM temporarily ends, or even flips into an underperformance (Chart I-4). Chart I-4An Up-Oscillation In Global Credit Growth Technically Favours EM
An Up-Oscillation In Global Credit Growth Technically Favours EM
An Up-Oscillation In Global Credit Growth Technically Favours EM
For European equity investors, the important implication is that developed Europe versus emerging Europe closely tracks broad DM versus broad EM (Chart I-5). Of course, 'emerging Europe' is a misnomer because Poland, Hungary, Czech Republic, and even Russia are developed economies and markets. Nevertheless, as they fall within the MSCI EM index, they tend to move with EM. Chart I-5Developed Europe Vs. Emerging Europe = Developed Markets Vs. Emerging Markets
Developed Europe Vs. Emerging Europe = Developed Markets Vs. Emerging Markets
Developed Europe Vs. Emerging Europe = Developed Markets Vs. Emerging Markets
The upshot is that on a tactical horizon, emerging Europe is likely to outperform developed Europe. However, given our high conviction view that non-energy commodities will continue to outperform energy, focus on Poland, Hungary and Czech Republic and steer clear of energy-heavy Russia. European Psychodrama 1: Italy Vs. The EU In the low-level game of chicken between Italy and the EU Commission over Italy's 2019 budget, the bond market will determine who swerves first. If the 10-year BTP yield rises and stays well above 4 percent, the weakened capital position of Italian banks from lower bond prices combined with deteriorating funding conditions will weigh on bank lending and economic growth. This will put pressure on the Italian government to swerve first and concede ground to the EU's demands. That said, it is hard to know the exact level of yields at which the government would reach its pain threshold. On the other hand, if the 10-year BTP yield falls and stays well below 3 percent, the bond market's insouciance would embolden the Italian government. Moreover, this apparent vote of confidence would be based on sound economics. Italy likely has a very high fiscal multiplier, meaning that a modest increase in its budget deficit to 2.4 percent would more than pay for itself through higher economic growth. Under these circumstances the EU would be under pressure to swerve first and give Italy some room for manoeuvre. The long-term investment opportunity is the Italy versus Spain sovereign 10-year yield spread. At 200 bps, the spread is at its all-time widest, and incongruous with the vanishing gap between the non-performing loans ratios in Italy and Spain. Nevertheless, our recommendation is to wait for the 10-year BTP yield to move closer to 3 percent before buying Italian assets, either in absolute or relative terms (Chart I-6). Chart I-6Remain Neutral Italian Assets Until The 10-Year BTP Yield Moves Closer To 3 Percent
Remain Neutral Italian Assets Until The 10-Year BTP Yield Moves Closer To 3 Percent
Remain Neutral Italian Assets Until The 10-Year BTP Yield Moves Closer To 3 Percent
European Psychodrama 2: Brexit In the psychodrama called Brexit, every new plot twist and turn has the potential to move the pound up or down by a few cents in a day. The next such major twist is the passage of the withdrawal bill through the U.K. parliament in early December. The ultra Brexiteer Conservative MPs and Northern Ireland Unionists will almost certainly vote against the agreement that Theresa May has forged with Brussels. This is because the agreement conjures up the Brexiteers' worst nightmare: a potentially indefinite customs union with the EU27, making it impossible for the U.K. to strike free trade deals with the rest of the world. Hence, for Theresa May to get her agreement through parliament, she will require the support of a substantial number of Labour MPs. But the substantial numbers just aren't there. The upshot is that she is likely to lose the vote, at which point the pound will tumble. For medium-term investors, this would be the moment to buy the pound, and we now explain why. On a six month horizon, the crucial question is: what will happen when the Article 50 process for the U.K. to leave the EU expires at 11pm on March 29, 2019? There are only three possibilities: 1. The U.K. doesn't leave the EU. At this advanced stage on the timeline, not leaving the EU on March 29 2019 effectively means an extension of the Article 50 process. This would require the U.K. to apply for an extension, and for the EU27 to agree to it. But realistically, the EU27 would only agree to it to facilitate a general election and/or a second referendum which could reverse Brexit. Probability = 45%. With the parliamentary arithmetic pointing to a rejection of May's Brexit deal as it stands, an amendment to the withdrawal bill forcing a second referendum, or a lost vote of no confidence in the government could lead to this outcome. Pound/euro = 1.20, because of the realistic prospect of reversing Brexit (Chart I-7). Chart I-7British Public Opinion On Brexit Is Shifting
Long Emerging Markets Vs. Developed Markets
Long Emerging Markets Vs. Developed Markets
2. The U.K. enters a transition period to leave the EU with a negotiated agreement. Theresa May's proposed withdrawal deal, or a variation of it, is approved by the U.K parliament (and the EU27) Probability = 45%. Appropriate amendments to the withdrawal agreement might sufficiently reduce the parliamentary rebellion. Pound/euro = 1.20 because the removal of the 'no deal' outcome would liberate the BoE to hike interest rates. 3. The U.K. crashes out of the EU with 'no deal'. Probability = 10%. This outcome would be the result of a gridlock in the U.K. parliament, with no majority formed for any Brexit strategy. Unlikely, but not impossible. Pound/euro = 1.00 because the U.K. economy would face months of severe disruption and uncertainty. Based on these three possible outcomes on March 29 2019, our expected value of pound/euro equals 1.18. Meaning that any sharp sell-off during the ongoing psychodrama constitutes a medium-term buying opportunity. Dhaval Joshi, Senior Vice President Chief European Investment Strategist dhaval@bcaresearch.com Fractal Trading Model* Supporting the thesis in the main body of this report, the 130-day fractal dimension of EM versus DM recently hit its lower bound, suggesting an oversold extreme and a likely countertrend move. For a short-term trade, position for a 2.5% profit with a symmetrical stop-loss. In other trades, long Portugal / short Hungary hit its stop-loss and is closed, leaving four open trades. For any investment, excessive trend following and groupthink can reach a natural point of instability, at which point the established trend is highly likely to break down with or without an external catalyst. An early warning sign is the investment's fractal dimension approaching its natural lower bound. Encouragingly, this trigger has consistently identified countertrend moves of various magnitudes across all asset classes. Chart I-8
Long Emerging Markets Vs. Developed Markets
Long Emerging Markets Vs. Developed Markets
The post-June 9, 2016 fractal trading model rules are: When the fractal dimension approaches the lower limit after an investment has been in an established trend it is a potential trigger for a liquidity-triggered trend reversal. Therefore, open a countertrend position. The profit target is a one-third reversal of the preceding 13-week move. Apply a symmetrical stop-loss. Close the position at the profit target or stop-loss. Otherwise close the position after 13 weeks. Use the position size multiple to control risk. The position size will be smaller for more risky positions. * For more details please see the European Investment Strategy Special Report "Fractals, Liquidity & A Trading Model," dated December 11, 2014, available at eis.bcaresearch.com Fractal Trading Model Recommendations Asset Allocation Equity Regional and Country Allocation Equity Sector Allocation Bond and Interest Rate Allocation Currency and Other Allocation Closed Fractal Trades Trades Closed Trades Asset Performance Currency & Bond Equity Sector Country Equity Indicators Bond Yields Chart II-1Indicators To Watch - Bond Yields
Indicators To Watch - Bond Yields
Indicators To Watch - Bond Yields
Chart II-2Indicators To Watch - Bond Yields
Indicators To Watch - Bond Yields
Indicators To Watch - Bond Yields
Chart II-3Indicators To Watch - Bond Yields
Indicators To Watch - Bond Yields
Indicators To Watch - Bond Yields
Chart II-4Indicators To Watch - Bond Yields
Indicators To Watch - Bond Yields
Indicators To Watch - Bond Yields
Interest Rate Chart II-5Indicators To Watch - Interest Rate Expectations
Indicators To Watch - Interest Rate Expectations
Indicators To Watch - Interest Rate Expectations
Chart II-6Indicators To Watch - Interest Rate Expectations
Indicators To Watch - Interest Rate Expectations
Indicators To Watch - Interest Rate Expectations
Chart II-7Indicators To Watch - Interest Rate Expectations
Indicators To Watch - Interest Rate Expectations
Indicators To Watch - Interest Rate Expectations
Chart II-8Indicators To Watch - Interest Rate Expectations
Indicators To Watch - Interest Rate Expectations
Indicators To Watch - Interest Rate Expectations