Emerging Markets

Highlights So What? A collapse in Venezuelan oil production could cause Brent prices to average $92/bbl next year. Why? Venezuelan oil output is in freefall. Years of mismanagement constrain its production potential, severely denting government revenues. External debt is sky-high. Venezuela faces challenges in repaying its obligations. China and Russia are unlikely to provide the large-scale subsidies necessary to stabilize the regime over a long period. The United States is unlikely to lift sanctions anytime soon. Rather they may expand them. Feature "PDVSA is red, red from top to bottom." - Former Energy Minister Rafael Ramírez "It has been an interesting activity, working without payment." - Sergio Requensa, President of the Corporation of Intermediary Industries, on volunteer groups trying to boost oil output. Global oil prices have fallen by 28.5% since their peak on October 4. While the world awaits OPEC 2.0's meeting on December 6 in Vienna, it is important to remember that global spare capacity is low while serious supply risks loom in many corners of the world. One such risk is the deterioration of Venezuela's economic, political and social situation, which has already precipitated steady declines in oil production (Chart 1). The odds of halting or reversing this trend are razor thin. The Nicolás Maduro government has managed to hobble along, but there is no firm basis for projecting a stabilization either of the regime or oil output. Although it is possible that Venezuela will secure enough ad hoc funding to survive another year, we have no solid grounds for arguing that it will. Chart 1On A Downward Spiral
On A Downward Spiral
On A Downward Spiral
In our dominant scenario of steadily declining Venezuelan output, we forecast Brent to average $82/bbl in 2019. The event of a complete collapse could push Brent prices as high as $92/bbl next year (Chart 2). Chart 2A Production Collapse Would Trigger A Price Spike
A Production Collapse Would Trigger A Price Spike
A Production Collapse Would Trigger A Price Spike
Venezuelan Production In Freefall While Venezuelan authorities have stopped reporting official economic data, declining oil production offers clear evidence of a deepening crisis. Venezuela is a founding member of OPEC and was once one of the most prosperous Latin American countries. Decades of gross mismanagement have pushed the country into crisis. Estimated to hold the world's largest crude oil reserves (Chart 3), Venezuela's potential role in global oil markets is massive. Its oilfields have, in the past, accounted for 4% of global oil supply, but have dwindled down to 1% so far this year (Chart 4). Nevertheless, Venezuela's role should not be underestimated. Price risks could be to the upside - on the back of a collapse in output - or to the downside in the unlikely event of production restoration. For now, we project monthly declines will average 35k b/d over the coming year, ending at 681k b/d by the end of 2019. Chart 3Venezuala's Potential Is Unrivaled...
Venezuela: What Cannot Go On Forever Will Stop
Venezuela: What Cannot Go On Forever Will Stop
Chart 4...But Not Captured By Its Dwindling Production
Venezuela: What Cannot Go On Forever Will Stop
Venezuela: What Cannot Go On Forever Will Stop
Continued deterioration in supply comes on the back of decades of economic mismanagement at the hands of former President Hugo Chávez and his United Socialist Party of Venezuela. The failed 2002 coup attempt and related labor strikes at Petróleos de Venezuela, S.A. (PDVSA) - the state-owned oil and gas company - led to the firing of thousands of employees and their replacement with Chávez loyalists, Chavistas. This event politicized the country's economic engine, catalyzing a steady loss in capital and technical expertise. Furthermore, regulations imposed on the energy sector are unfavorable to international investors. For example, the 2001 Hydrocarbons Law stipulated a massive rise in royalties paid by foreign companies - increasing from a range of 1%-17% to 20%-30%. Today, taxes per barrel in Venezuela are the highest among the major producers and form the largest cost component per barrel of oil and gas (Chart 5). Chart 5High Tax Rate Is Unattractive
Venezuela: What Cannot Go On Forever Will Stop
Venezuela: What Cannot Go On Forever Will Stop
Other damaging state actions include: A law requiring PDVSA to hold at least 60% equity in joint ventures with foreign firms investing in the Venezuelan oil sector; The nationalization of the Orinoco Belt - a highly fertile region home to the world's largest petroleum deposits; Government expropriation of foreign assets; Payment failures to international oil service companies. These events ultimately culminated in today's production freefall, which has continued despite the rebound in oil prices after 2015. Needless to say, falling revenues are deadly for petro states. Caracas relies on oil sales for 95% of the government's revenue. Falling rig counts are an ominous sign (Chart 6). Chart 6An Ominous Sign
An Ominous Sign
An Ominous Sign
To make matters worse, export figures actually understate the dire economic situation. The U.S. EIA estimates that roughly half of Venezuela's oil exports are not generating cash! The Venezuelan government has mortgaged much of its production in exchange for loans from China and Russia in recent years. Under these loans-for-oil schemes, the government secured emergency funding to keep its ailing economy afloat, but sacrificed the long-term ability to ensure its own liquidity. This arrangement also includes shipments to the Vadinar refinery in India, which is owned by Russia's Rosneft (Chart 7). Chart 7U.S. Exports Are Main Source Of Revenue
U.S. Exports Are Main Source Of Revenue
U.S. Exports Are Main Source Of Revenue
This leaves exports to the U.S. as the main source of revenue for the Venezuelan government. The result is a Catch-22: With fewer oil barrels to go around, Venezuela can either satisfy its foreign creditors to keep open the possibility of future lines of credit, or it can sell to the U.S. in return for badly needed cash. For the moment, Venezuela is opting for cash. Despite having been cut by ~20% since last year, exports to the U.S. appear to have hit a floor. According to EIA data, after coming in at 13.21mm bbl in February, they have rebounded slightly averaging 19mm bbl/month since June. This is occurring despite ongoing production declines. This is ultimately unsustainable, as the evidence of mismanagement goes beyond production facilities: A breakdown in domestic refining facilities has necessitated an increase in Venezuela's imports of U.S. crude. The lighter oil is needed as a diluent - to blend with Venezuela's heavy crude, facilitating transportation. This is forcing Venezuela's economy to divert scarce hard currency to these imports. In fact, imports have picked up even amid declining oil production and the deepening economic crisis. Earlier this year, PDVSA's Caribbean assets fell under risk of being handed over to ConocoPhillips as compensation for Chavez's 2007 nationalization of Conoco's facilities. These Caribbean assets include storage facilities, refineries, and export terminals on the islands of Bonaire, Curacao, St. Eustatius, and Aruba. Terminals there account for 17% of the company's exports - mainly destined for Asia (Table 1). To prevent this transfer, Venezuela has agreed to pay the American company $2 billion in compensation, $345 million of which has been paid. If these payments cannot be met, the Caribbean assets will be in jeopardy once again - and Conoco is by no means the only company preparing lawsuits to claim assets in the event of further defaults. Table 1Caribbean Assets At Risk Of Seizure
Venezuela: What Cannot Go On Forever Will Stop
Venezuela: What Cannot Go On Forever Will Stop
Similarly, CITGO - PDVSA's U.S. refiner and crown jewel - is at risk to being handed over to creditors. A loss of control of CITGO would disrupt one of the most reliable sources of cash for Venezuela. While U.S. sanctions prevent CITGO from sending dividends to Venezuela, it is so far still allowed to purchase Venezuelan crude. CITGO's assets include three U.S. refineries with a total capacity of 750k b/d. To complicate matters, several creditors are claiming stakes in the refiner: Crystallex International, a Canadian mining company whose Venezuelan assets were nationalized in 2011, is making claims on CITGO. In August, a U.S. federal judge ruled in favor of Crystallex, giving it permission to seize shares of PDV Holding Inc., which owns CITGO. However, the judge also issued a temporary stay on Crystallex - which is planning to auction the shares - until an appeal is decided. If the appeal is in favor of Crystallex it will encourage additional asset grabs by aggrieved foreign companies. PDVSA has offered bond investors a 51% claim on CITGO to push back maturing payments to 2020. The remaining 49% of CITGO was put up as collateral for a $1.5 billion loan from Rosneft. The risk - which intensifies with each missed payment - is that as Venezuela defaults on its debts, more of its facilities will be seized, further reducing its production, refining, and export potential. This would ultimately accelerate the total collapse of Venezuelan output. Bottom Line: Venezuelan oil production is steadily crumbling. Almost two decades of mismanagement have preceded this outcome and, as such, it cannot be reversed easily. We expect monthly declines to average 35k b/d, with the probability of a complete collapse in output rising with each passing day. A Macroeconomic Mess Venezuelans today are paying the price for the unsustainable external debt amassed over the past decade (Chart 8). Estimates of external debt place it around a staggering $150-$200 billion! Sovereign and PDVSA bonds due next year are estimated to be about $9 billion (Chart 9). This does not even account for payments due from other forms of debt (Table 2). Chart 8Debt Levels Are Unsustainable
Debt Levels Are Unsustainable
Debt Levels Are Unsustainable
Chart 9It's Payback Time
Venezuela: What Cannot Go On Forever Will Stop
Venezuela: What Cannot Go On Forever Will Stop
Table 2Yikes!
Venezuela: What Cannot Go On Forever Will Stop
Venezuela: What Cannot Go On Forever Will Stop
Total reserves leave little room for optimism (Chart 10). They now stand at less than $10 billion, down from $43 billion less than a decade ago. Chart 10Reserves Cannot Lend Support
Reserves Cannot Lend Support
Reserves Cannot Lend Support
In projecting the country's ability to make payments in 2019, we looked at several oil-price and production scenarios. All scenarios point to default, as shown in Table 3. Even in the optimistic scenario in which production is flat (which is highly unlikely given that it has been declining at an average monthly rate of 47k b/d so far this year), the country needs $14.8 billion in foreign exchange reserves to cover rising PDVSA expenses plus debt-service costs and its total import bill. This will put Venezuela $6 billion in the red. Table 3All Roads Lead To Default
Venezuela: What Cannot Go On Forever Will Stop
Venezuela: What Cannot Go On Forever Will Stop
This forecast would become even more somber if we were to include payments due on other forms of debt (e.g. private bonds, loans, etc), for which there is no published repayment schedule. Stability is entirely out of reach for the Venezuelan government alone. Maduro's recovery plan announced earlier this year will do nothing to combat the root of the crisis. For instance, the launch of a cryptocurrency - the "petro" - that is backed by five billion barrels of oil reserves, to which the bolivar will be pegged, is not a viable solution.1 In fact, Venezuela's policy options are extremely limited. Only a massive show of support from China and Russia can realistically bring about a substantial improvement. This would require a commitment to pay: (1) debt servicing and import costs; (2) the operating costs of PDVSA and the funds needed to preserve CITGO and other critical assets; (3) the funding of new investment required to revive the oil sector. Over the past decade, China and Russia have provided loans worth ~ $60 billion and ~ $20 billion, respectively. Of these loans, an estimated $28.1 billion and $9.1 billion remain outstanding for China and Russia, respectively.2 Venezuela has paid off not quite half of its debts to these powerful patrons. The last Chinese loan was in 2016. China stopped the credit tap throughout 2017 and most of 2018 amid Venezuelan instability. While China expressed its intention to extend a $5 billion loan in September, this amount is small by comparison with the double-digit billions of loans and direct investment that China provided annually from 2009-15. It would not cover Venezuela's shortfall of funding in our three scenarios even if it were devoted entirely to paying immediate obligations. Moreover, the Chinese loan has not been finalized.3 Thus, China's diplomatic "return" to Venezuela suggests that Beijing is not willing to provide the large-scale subsidies necessary to stabilize the regime over a long period. Indeed, China's state oil firm Sinopec has joined other foreign companies in suing Venezuela for unpaid debts!4 Moreover, Chinese and Russian funds are hardly likely to exceed the large amount invested over the past decade - and those amounts did not prevent Venezuela from falling into its current crisis. Russia is no longer capable of fully financing a satellite state in the way the Soviet Union financed Cuba in the twentieth century. It is hoping that China will foot most of the bill. While China is probably able to do so in cash terms, it is so far unwilling to pay the strategic price of setting up a Soviet-style power struggle with the United States in violation of the Monroe Doctrine.5 Indeed, plowing tens of billions of additional dollars into Venezuela may be unwise if the U.S. reverts back to its tried and tested strategy of directly intervening in the domestic affairs of Latin American countries. Venezuela, being in South America and on the Atlantic coast, is too far away for China to secure in the event of a showdown with the United States. As such, Beijing must understand that any investment in Venezuela could one day become stranded capital in a traditionally American sphere of influence. In fact, China is concentrated on building its own sphere of influence in Asia. While Venezuela is nominally part of the expansive Belt and Road Initiative, the latter is ultimately directed at making China's outward investment more coherent and expanding influence on the Eurasian continent. Neither of these aims is all that favorable for Venezuela. While China certainly wants privileged access to Venezuelan oil, it does not "need" Venezuelan crude for supply security in the way that is often implied. It frequently re-sells the oil on global markets. Nevertheless, Russia and China can offer debt restructuring and relief. Out of the $9 billion outstanding that is owed to Russia, Moscow has agreed to restructure $3.15 billion to be paid over ten years. Other such restructuring deals could be forthcoming (although, notably, China did not agree to a restructuring when Maduro visited in September). Restructuring will not work with U.S. bondholders. The U.S. imposed sanctions on August 24, 2017 seem to prevent U.S. holders of Venezuelan bonds from participating in such arrangements. The U.S. Office of Foreign Assets Control is unlikely to lift sanctions anytime soon.6 More likely, the United States will expand sanctions, as U.S. National Security Advisor John Bolton indicated in a speech in Miami on November 2. There he dubbed Venezuela, Cuba, and Nicaragua the "troika of tyranny" in the western hemisphere. Possible sanctions include: First, the Trump administration has moved to restrict purchases of Venezuelan gold, as the government has been increasing exports to Turkey (and likely China).7 Trump is considering putting Venezuela on the list of state sponsors of terrorism, which will cut off aid and loans. Second, the financial sanctions announced in 2017 could be expanded to cover existing debts, the trading of government and PDVSA bonds on secondary markets, and CITGO's newly issued debt - all areas that the Department of Treasury has so far exempted. Third, sanctions on tanker insurance could impede Venezuela's ability to transport its oil to international destinations. Venezuela does not have the tanker capacity to ship its own oil. Fourth, in the most extreme case, restrictions on U.S. imports of crude oil could punish the Maduro administration. The U.S. is reluctant to exacerbate the humanitarian crisis and deal with its second-round effects. But it could ultimately use its leverage as importer to insist that its companies are compensated, one way or another, for Venezuelan defaults. Technically alternative buyers could absorb Venezuela's heavy crude, but the loss of the U.S.'s cash-generating imports would pile more pressure onto an already wobbling regime. Bottom Line: Venezuela has been relying on ad hoc funding to survive thus far. Loans in exchange for oil are now eating up its revenues. President Maduro's recovery plan does not address the root causes of the ongoing macroeconomic mess. All scenarios point to insolvency. A Regime Change Is In Order Hyperinflation and the absence of basic necessities have left Venezuelans pessimistic about their country's future (Chart 11). This is not surprising: A staggering 87% of households are estimated to be below the national poverty line, most of whom are in extreme poverty. GDP per capita is half the level it was only a decade ago (Chart 12). These are the ingredients of a revolutionary brew. Chart 11The Outlook Isn't Rosy
The Outlook Isn't Rosy
The Outlook Isn't Rosy
Chart 12Purchasing Power Has Been Slashed By Half
Purchasing Power Has Been Slashed By Half
Purchasing Power Has Been Slashed By Half
The deepening humanitarian and economic crisis is causing one of the largest outflows of emigrants in recent years. According to the United Nations, 2.6 million Venezuelans live abroad and 1.9 million of them have left since 2015 (Chart 13). Chart 13Venezuelans Are Fleeing
Venezuela: What Cannot Go On Forever Will Stop
Venezuela: What Cannot Go On Forever Will Stop
The crisis has naturally translated into a massive shift in public opinion against the regime (Chart 14). Maduro's reelection for a second term in May occurred in an environment in which the opposition boycotted the elections and voter turnout was reported at just 46.1%, hardly half of the 80% rate in 2013. Venezuelans have also lost faith in the armed forces and police, which have buttressed the current regime (Chart 15). Chart 14Maduro Lacks Support
Maduro Lacks Support
Maduro Lacks Support
Chart 15Loss Of Faith In Security Institutions
Loss Of Faith In Security Institutions
Loss Of Faith In Security Institutions
Opposition parties do not have the power to force a transition to a new government, but under today's extreme circumstances they are not as divided as they were in the past. They all support regime change, domestic resistance, and international pressure. All have refused to participate in any dialogue unless it is to discuss the terms of Maduro's resignation. This means that a fracture within the regime, or an external factor like U.S. action, could tip the balance. Could a military coup provide the way out of the current morass? Ultimately, yes, in the sense that the military is the ultimate arbiter of Venezuelan society over the course of history. But short-term investors should not hold their breath. The Maduro regime has managed to survive as long as it has by ceding ever more power to the army, meaning that, in a sense, the coup has already occurred. Food distribution and oil production are now directly under the control of the military. Once the regime becomes completely fiscally defunct, military leaders may pin the blame on Maduro and reshape or expunge the Socialist Party. The timing, however, is nearly impossible to predict other than to emphasize that the current situation is unsustainable and we do not believe that Beijing will ride to the rescue. One foreboding sign is that Maduro has authorized hikes to domestic gasoline prices, which are heavily subsidized. A hike of this nature prompted the Caracazo social unrest in 1989, which helped motivate the attempted coups of 1992. Another option may be direct U.S. action. While the U.S. has been reluctant to intervene in Latin America since the short-lived, albeit successful, 1989 intervention in Panama, President Trump did raise the idea of a "military option" in August 2017.8 While Trump's comments were largely ignored, and subsequently opposed by the Pentagon itself, the reorientation of U.S. policy towards confronting China may convince the U.S. defense and intelligence establishment to view Venezuela through the prism of a new Cold War. As such, and especially if the humanitarian crisis grows, investors should not completely dismiss the possibility of a U.S. military-backed coup in Venezuela.9 Bottom Line: Opposition parties are not as divided as they were in the past, in a sign that the current regime is failing to maintain control. Given the unsustainability of the economic situation and the military's ever-growing role, odds are in favor of an army takeover at some point. The relevant takeaway for investors is that things will have to get worse before that occurs - adding pressure on global oil supply and leading to additional debt defaults. Investment Implications Declining Venezuelan oil production will continue weighing on global supply. We model monthly production declines of 35kb/d as the dominant scenario in our supply-demand balances. On this basis, we expect Brent to average $82/bbl in 2019 and WTI to trade $6/bbl below that. A complete collapse in Venezuelan production next year could push prices much higher - up to $92/bbl and $86/bbl for Brent and WTI, respectively. While an eventual production collapse is inevitable, Venezuela may be able to hobble along for another year through ad hoc funding. Thus, a premium will be priced into global oil markets in 2019 on the back of falling Venezuelan production - and the risk of its collapse. Roukaya Ibrahim, Editor/Strategist Geopolitical Strategy RoukayaI@bcaresearch.com Matt Gertken, Vice President Geopolitical Strategy mattg@bcaresearch.com Pavel Bilyk, Research Associate pavelb@bcaresearch.com Juan Egaña, Research Associate juane@bcaresearch.com Footnotes 1 The U.S. is already considering sanctions targeting the cryptocurrency. Please see Franco Ordonez, "Top lawmakers in Congress push tough new measures against Venezuela," September 24, 2018, available at www.mcclatchydc.com. For the text of an earlier proposal please see "Venezuela Humanitarian Relief, Reconstruction, and Rule of Law Act of 2018," introduced into the Senate by Senator Robert Menendez (D, NJ) on the foreign relations committee, S. 3486 at www.congress.gov. 2 Please see "Venezuela: Deuda externa per capita del sector público," Prodavinci, available at especiales.prodavinci.com. 3 Please see "China y Rusia desconfían del régimen chavista y aumentan la supervisión de sus inversiones en Caracas," PD América, October 31, 2018, available at www.periodistadigital.com. 4 Please see Jonathan Wheatley, "Sinopec settles with Venezuela's PDVSA, ending 5-year dispute," Financial Times, December 12, 2017, available at www.ft.com. 5 The Monroe Doctrine was reinforced specifically in relation to Venezuela by the "Roosevelt Corollary" in 1902-03. Recently the United States has reasserted the Monroe Doctrine in the face of a widespread perception that China has gained strategic ground on the continent, namely in Venezuela. Please see Vice President Mike Pence, "Remarks by Vice President Pence on the Administration's Policy Toward China," the White House, October 4, 2018, available at www.whitehouse.gov. 6 On the contrary, sanctions are expanding. Please see U.S. Treasury Department, "Treasury Targets Venezuelan President Maduro's Inner Circle and Proceeds of Corruption in the United States," September 25, 2018, available at home.treasury.gov. 7 Please see the White House, "Executive Order Blocking Property of Additional Persons Contributing to the Situation in Venezuela," November 1, 2018, available at www.whitehouse.gov. 8 Please see Jeremy Diamond, "Trump asked advisers about invading Venezuela in 2017," CNN, July 5, 2018; and Dan Merica, "Trump says he won't rule out military option in Venezuela," CNN, August 11, 2017, both available at www.cnn.com. 9 Even the Secretary General of the Organization of American States, Luis Almagro, has refused to rule out any options, including military intervention. Pro-Maduro commentators have claimed that the U.S., along with Colombia and other enemies of the regime, supported the apparent attempt to assassinate Maduro by drones in August this year. Please see "Venezuela President Maduro survives 'drone assassination attempt,'" BBC, August 5, 2018, available at www.bbc.com. The New York Times has also reported that the Trump administration sent officials to "listen" to rebel Venezuelan military officers proposing a coup attempt. Please see Ernesto Londono and Nicholas Casey, "Trump Administration Discussed Coup Plans With Rebel Venezuelan Officers," NYT, September 8, 2018, available at www.nytimes.com. We Read (And Liked)... The Great Leveler: Violence And The History Of Inequality From The Stone Age To The Twenty-First Century Professor Walter Scheidel's opus - The Great Leveler - introduces the "Four Horsemen" of equality: warfare, revolution, state collapse, and pandemics.10 These four factors, he argues, explain all significant levelling of wealth and income throughout history. And by history, Scheidel really means all of human history. The thesis behind The Great Leveler is that only through the "aid" of the Four Horsemen has wealth ever been distributed more evenly in human societies. In every grand passage in history, one of the four terrible afflictions has tipped the scales away from capital and landholders and in favor of laborers. Otherwise, when there is not war, revolution, state collapse, or pandemics, capital and landholders acquire sufficient wealth and political capital to stave off any attempts at leveling. Scheidel's focus on World War I and II is particularly interesting. He controversially argues that the prosperity and equality that prevailed in the western world after these wars was to a great extent the product of government measures imposed in order to win the conflict. These included nationalization, direct intervention in production, fiscal policy, and inflationary monetary policy. Mass mobilization necessary to wage and win a total war left western societies, and Japan, "levelled" by the time the wars ended. BCA Research was honored to have Professor Scheidel attend our annual Investment Conference in Toronto this September. In the talk, he warned the room full of investors to "be careful what you wish for," since the suppression of inequality has "only ever brought forth sorrow." Furthermore, Scheidel rejected the hypothesis that wealth and income inequality bring about their own demise. They usually grow unchecked until one of the Four Horsemen appears exogenously. The takeaway from Scheidel's work is that income and wealth inequality are, according to the scales of human history, essentially part of human existence. As such, one should neither fret too much about them nor worry that they will lead to serious efforts to curb them. There are two weaknesses in this argument. First, the book is primarily a treatise on medieval history. The vast amount of empirical evidence that Scheidel has carefully collected occurred before societies became democratic, and specifically before universal suffrage. While Scheidel focuses on the effects of the world wars in the twentieth century as the causes of modern leveling, he barely mentions the role played by the spread of the electoral franchise during and after the conflicts. And it is true that democracy has not prevented the rise of income inequality in much of the developed world since the 1980s - that is, since the laissez-faire revolution. However, the end to that story is yet to be written. Which brings us to the second weakness: Scheidel dismisses GINI coefficient data on income inequality. It does not support his thesis. For example, his tables show that the "market GINI" of many western European countries is as high as that in the United States. However, after accounting for redistributive effects, it is in many cases significantly lower. Instead, Scheidel focuses on the wealth accruing to the top 1%. But again, continental European countries have experienced much lower concentration of wealth than the laissez-faire economies of the U.K. and the United States. Yes, there is growth in concentration even in the social democracies of Europe, but it is at a much slower pace than in the countries that have been the most committed adherents of the Reagan-Thatcher revolution. The greatest failing of Scheidel's thesis is that it lacks nuance when it comes to the modern era. Its parsimony over the course of human history is astounding and commendable - it is what makes this a true magnum opus of social science. However, the real world is rarely as parsimonious. The facts are quite different from the theory. Chart 1 shows that the wealth accruing to the top 10% of income distribution in France was higher in the 1950-1970 era than in the U.S., and much higher than in the United Kingdom. Then, the supply-side revolution took hold in the Anglo-Saxon world, while France pursued policies that sought to reverse the causes of the May 1968 social angst. The shift in wealth distribution was jarring. Chart 1No Horsemen Here, Just Social Democracy
No Horsemen Here, Just Social Democracy
No Horsemen Here, Just Social Democracy
From this one example we can draw two conclusions. First, Scheidel is wrong when he says that the march of income inequality is inevitable. It clearly has not been in western Europe in recent memory. Second, Scheidel is also wrong when he argues that the march of income inequality is irreversible. France was once a right-of-center country ruled by elites who saw revenues accrue to their capital and wealth holdings. Then, all hell broke loose in the country, with teenage Baby Boomers joining up with common workers in a (relatively) bloodless socialist revolution. Rather than adopt laissez-faire capitalism with vigor, French policymakers adopted wealth and income taxes that reversed the rising share of income accruing to the top 10%. Only today, after decades of a deliberately orchestrated and significant leveling, are policymakers in France looking in a different direction. Scheidel claims that his book is pessimistic, but that of course depends on the audience. Our audiences tend to be made up of investors, i.e. of savers. As such, Scheidel's thesis is in fact joyous! A historical opus that proves, without a doubt, that income inequality is irreversible short of apocalypse!? Sounds too good to be true! It is. Marko Papic, Senior Vice President Chief Geopolitical Strategist marko@bcaresearch.com 10 Princeton: Princeton University Press, 2017, 504 pages.
Highlights The October credit and housing market data present a gloomy picture for Chinese domestic demand. Trade remains buoyant, but exports are set to decline materially over the coming months. Many investors are focused too much on external demand and not enough on Chinese domestic demand. China's old economy has been deteriorating for two years, and it is unlikely that exchange rate depreciation alone will reverse this trend. A review of the drivers of credit growth during China's last mini-cycle upswing underscore that the country's monetary transmission mechanism is impaired. This suggests that investors are exposed to fiscal and regulatory policy inertia, as well as time lags once policymakers decide to aggressively stimulate. Chinese stocks may present an excellent buying opportunity over the coming year, but that point has not yet been reached. Stay neutral for now. Feature China's October trade data (released earlier this month) was a frustrating one for investors, as it revealed that market participants will have to wait even further for clarity on the magnitude and duration of the upcoming shock to exports. The strong October trade data has even led to some market participants questioning whether export growth will decelerate at all, a view that we strongly disagree with. It is true that there is no direct reason to expect that the impact of U.S. import tariffs will affect China's non-U.S. exports. But Chart 1 shows that Chinese exports to the U.S. are currently running above the pace that would be predicted by the overall trend in U.S. non-oil imports, a circumstance that is highly unlikely to continue in the face of mutual tariff imposition. Negative export "alpha" would imply a growth rate materially below the dotted line in Chart 1. As such, even though Chinese exports to the U.S. account for only 20% of total exports, the impact of an eventual "reversion to fundamentals" is likely to substantially effect the overall trend in Chinese export growth. Chart 1Export Frontrunning To The U.S. Continues
Export Frontrunning To The U.S. Continues
Export Frontrunning To The U.S. Continues
Given the integrated nature of global trade, persistently strong export growth is also very likely supporting imports. Chart 2 shows that import growth has been closely correlated with domestic industrial activity since 2010, but is now running approximately 10-12 % above would normally be expected. This implies that China's overall trade momentum will weaken considerably over the coming months, which is likely to reverberate through key trade linkages in emerging markets and commodity-producing developed markets. Chart 2Current Import Growth Appears Unsustainable
Current Import Growth Appears Unsustainable
Current Import Growth Appears Unsustainable
October's credit data was also highly significant, as it validated the view that we espoused in our recent report.1 We noted in response to the September credit release that a surge in the 3-month rate of change of adjusted total social financing (TSF) was driven by front-loaded fiscal spending that would not last. Chart 3 shows that special local government bond issuance in October fell by 650 bn RMB relative to the prior month, suggesting that (net) new fiscal stimulus will be required in order for local government bond issuance to materially boost overall credit growth. Chart 3September Was Not The Start Of A New Trend In LG Bond Issuance
September Was Not The Start Of A New Trend In LG Bond Issuance
September Was Not The Start Of A New Trend In LG Bond Issuance
Finally last week's housing data release highlighted that residential sales and construction momentum is faltering (Chart 4), which was likely triggered in part by prior reductions in the PBOC's pledged supplementary lending (PSL) program. We noted in a September Special Report that the pullback in the PSL would negatively impact the housing market on a cyclical basis,2 and October's data certainly supports this view. Chart 4The Housing Market Slowed In October
The Housing Market Slowed In October
The Housing Market Slowed In October
Don't Pin Any Hopes On A Trade "Ceasefire" Against this gloomy economic backdrop market participants have actually been incrementally positive about China over the past few weeks, in anticipation of a possible détente with the U.S. Last week's flurry of optimism about an apparently meaningful resumption in trade talks were somewhat diminished by comments from President Xi and Vice President Pence at the APEC summit over the weekend, but our geopolitical strategists believe that the odds of a short-term "tariff ceasefire" occurring at the G20 summit later this month are genuinely non-trivial (possibly as high as 30-40%). We define a "ceasefire" in this case as a commitment to refrain from any further protectionist action during a renewed period of negotiations, not an immediate and substantive deal that ends the trade war. We agree that any positive actions on the trade front are likely to lead to a short-term boost to Chinese stock prices (and global risk assets more generally). But the key question for investors is whether this will lead to a durable rally lasting several months. In our opinion, three factors argue against this view: A ceasefire probably will not lead to an agreement: There is no indication that either the U.S. or China has changed their positions concerning the dispute, with China reportedly having simply restated their previous offer in advance of the G20 summit. On the U.S. side, attempts to restart negotiations may reflect the desire to give China "one last chance" before moving to impose tariffs on all Chinese imports, which the administration may be planning as a rhetorical counter to any domestic pushback from rising consumer goods prices (the "Walmart effect"). A ceasefire will not roll back tariffs already in place: It is unlikely that the U.S. would impose tariffs on all remaining imports from China (the "third round") while negotiations are taking place. But a near-term shock to Chinese exports is still likely, because the existing tariffs on the first and second round would not be rolled back until a deal is successfully negotiated. It is even possible (albeit unlikely) that the administration will move ahead with the planned increase in the second round tariff to 25% at the end of the year despite the presence of negotiations. A ceasefire alone will not reverse the ongoing slowdown in Chinese domestic demand: The trade war between the U.S. and China is occurring against a backdrop of weaker Chinese domestic demand, a point that we have highlighted numerous times over the past year. As shown in Chart 2 above, the growth momentum of China's old economy peaked well before the trade war began, and a temporary "stay of execution" on the trade front is unlikely to change the downtrend in domestic activity. This last point is important, as it appears that many global investors are focused almost exclusively on China's negative external demand outlook and not nearly enough on weak domestic demand. Chart 5 vividly illustrates this point, by contrasting our new Market-Based China Growth Indicator with our leading indicator for the Li Keqiang Index. Our market-based China Growth Indicator is very similar to the highly informative China Play Index created by BCA's Foreign Exchange Strategy service to hedge against a possible countertrend correction in the U.S. dollar,3 but it is somewhat broader, has four asset class subcomponents, and has been built on a deviation from trend basis (see Box 1 for a description). Chart 5The Market Has Lagged The Macro Data Over The Past Three Years
The Market Has Lagged The Macro Data Over The Past Three Years
The Market Has Lagged The Macro Data Over The Past Three Years
Box 1 Introducing The BCA Market-Based China Growth Indicator Chart A1 presents the BCA Market-Based China Growth Indicator, along with its four asset class subcomponents: currencies, commodities, equities, and rates/fixed-income. The purpose of the indicator is to act as a broad proxy of investor expectations for Chinese growth, and to illustrate which asset classes are providing the strongest/weakest growth signals. Chart A1Investors Are Incrementally Positive, But Rates Caution Against Over Optimism
Investors Are Incrementally Positive, But Rates Caution Against Over Optimism
Investors Are Incrementally Positive, But Rates Caution Against Over Optimism
Table A1 presents a list of the series included in each of the asset class subcomponents, all of which were tested to ensure that they were coincident or lead the Bloomberg Li Keqiang index. The indicator is made up of an equally-weighted average of the four asset class subcomponents, and each series is equally-weighted within its respective subcomponent (meaning that the 17 series do not have equal weights in the overall indicator). Table A1Components Of The BCA Market-Based China Growth Indicator
Trade Is Not China's Only Problem
Trade Is Not China's Only Problem
Chart A1 highlights that the commodity and equity subcomponents are currently providing the most positive signals, whereas the currency component is in line with the overall indicator. The rates component, which provided the earliest warning sign this cycle that Chinese growth was likely to decelerate, remains the weakest element of the indicator and has not been rising over the past few weeks (in contrast to the other components). The chart shows that price signals from China-related assets generally followed or even anticipated our LKI leading indicator prior to 2015, but that the reverse has been true over the past three years. The gap between the two indicators became extreme earlier in the year, and only closed once investors began to react to the emergence of the trade war. But the key point from the chart is that trade is not China's only problem, as our LKI leading indicator shows that Chinese monetary conditions, money, and credit growth have been deteriorating for the better part of the past two years. Monetary Policy: Pushing On A String? One bullish China narrative that currently prevails in the marketplace is that the odds of "big bang" stimulus rise materially in lockstep with any further deterioration in the macro data. Most recently, several China analysts have speculated that the PBOC will soon cut its benchmark policy rate, which would be an unmistakable sign that the monetary policy dial has been turned towards "maximum reflation". Ultimately, we agree with the view that investors hold a put option issued by the Chinese government, but we have strenuously argued that the strike price is considerably lower than many think. On top of this, investors face another risk, namely a circumstance where the exercise price of the China put is even lower than the government intends it to be. This situation could arise if the PBOC decides to fire its bazooka, but the resulting decline in interest rates does not materially boost credit growth. Such a scenario prevailed in the U.S. several years following the global financial crisis, when many investors characterized the Fed's efforts to boost (or at least stabilize) credit growth as "pushing on a string". Chart 6 illustrates that this actually occurred in China during its last mini-cycle upswing, raising the odds of a repeat incident that results in a meaningful lag between the approval of big bang stimulus and its reflationary effect on financial markets. The chart shows the annual change in total social financing as a share of 4-quarter trailing GDP, including and excluding local government bond issuance (both measures exclude equity financing). Chart 6No Major Acceleration In "Standard" Credit Growth In 2015-2016...
No Major Acceleration In "Standard" Credit Growth In 2015-2016...
No Major Acceleration In "Standard" Credit Growth In 2015-2016...
While adjusted TSF excluding local government bonds technically accelerated as a share of GDP from 2015 to late last year, the rise was tepid at best (in contrast to the 2012/2013 episode). It is clear from the chart that most of the acceleration in overall credit during the 2015/2016 period came from a surge in local government bond issuance, not from "standard" credit. This is an important observation, given that interest rates declined significantly over the period (Chart 7). Chart 7...Despite A Substantial Easing In Monetary Policy
...Despite A Substantial Easing In Monetary Policy
...Despite A Substantial Easing In Monetary Policy
From a theoretical perspective, an atypical divergence between interest rates and credit growth can occur either because of abnormal loan demand or loan supply. Chart 8 suggests that it was the latter in China in 2015/2016: loan demand reportedly rose for small/micro, medium, and large enterprises (particularly among small/micro), but the trend in loan approval barely budged (unlike in 2011/2012 when it rebounded sharply). In short, Chart 8 provides support for the view that Chinese banks did not meaningfully ease lending standards during the 2015/2016 episode, despite a substantial easing in monetary policy and (ultimately) a substantial improvement in economic conditions. Chart 8Loan Demand Responded To Lower Rates, But Lending Standards Did Not
Loan Demand Responded To Lower Rates, But Lending Standards Did Not
Loan Demand Responded To Lower Rates, But Lending Standards Did Not
Chart 9 highlights that this almost certainly occurred because of a sharp deterioration in reported bank asset quality that began in 2014. The chart shows that both the non-performing loan and special mention loan ratios rose significantly during this period, the sum of which has only modestly declined. We highlighted the potential for NPL recognition to weigh on credit growth in our two-part joint Special Report with BCA's Geopolitical Strategy service,4 as long as the ongoing financial regulatory crackdown is even half-heartedly implemented. While Chart 8 shows that loan approval modestly ticked higher in Q3, it provides no evidence of stealth easing in financial regulation. Chart 9Banks Did Not Rush To Lend Because Of Deep Concerns Over Asset Quality
Banks Did Not Rush To Lend Because Of Deep Concerns Over Asset Quality
Banks Did Not Rush To Lend Because Of Deep Concerns Over Asset Quality
The key conclusion for investors from these observations is as follows: while China can certainly decide to stimulate aggressively in response to too-weak economic conditions, an impaired monetary transmission mechanism implies that there may be a lag, possibly a substantial one, between the decision to stimulate and its reflationary impact on financial markets. This is of crucial importance to investors aiming to maximize risk-adjusted returns over a 6-12 month time horizon, and weighs heavily on our recommendations. Investment Strategy Recommendations Chart 10 shows our Li Keqiang leading indicator within its component range, a chart that remains at the core of our efforts to predict China's business cycle. The indicator has been built in such a way that a decision of policymakers to push for more local government bond issuance (like in 2015/2016), or an improvement in the efficacy of China's monetary transmission mechanism, are likely to be captured by one or more of its components. Chart 10Only A Narrow Pickup In Our LKI Leading Indicator
Only A Narrow Pickup In Our LKI Leading Indicator
Only A Narrow Pickup In Our LKI Leading Indicator
As we noted in our November 7 Weekly Report,5 the rise in the indicator has been driven by its two monetary conditions components, which have in turn mostly been driven by the substantial weakness in the RMB over the past four months. Given that the ultimate impact of the U.S. tariffs on Chinese exports remains obscured by trade frontrunning, it is unclear if China's exchange rate depreciation will be sufficiently reflationary even to counter the upcoming export shock, let alone reverse the ongoing domestic demand slowdown. As a result, investors should be closely watching for signs of a pickup in money & credit growth, which for now remain absent. Put differently, macrofundamental support for the equity market is lacking. Despite this, Chart 11 highlights that both Chinese A-shares and the investable market are deeply oversold, which in combination with expectations of further monetary stimulus and the potential for a tariff ceasefire have many investors chafing at the bit to go long either market (or both!) over a 6-12 month time horizon. Chart 11Chinese Stocks Are Quite Oversold...
Chinese Stocks Are Quite Oversold...
Chinese Stocks Are Quite Oversold...
Our advice is simply to wait. A trade ceasefire is unlikely to generate more than a short-term boost to stock prices, and our indicators provide the best bet to monitor whether an impaired banking system is responding to any further easing in monetary policy. Finally, while we agree that stocks have priced in a meaningful decline in earnings, that earnings adjustment process has yet to even begin. Chart 12 illustrates the point where Chinese stocks bottomed in relation to the last major decline in earnings, suggesting that stocks need both a valuation discount and earnings clarity before putting in a durable bottom. The latter is missing and may stay missing for several months, highlighting that an outright long position remains premature. Stay tuned! Chart 12...But We Have Yet To Even Begin The Earnings Adjustment Process
...But We Have Yet To Even Begin The Earnings Adjustment Process
...But We Have Yet To Even Begin The Earnings Adjustment Process
Jonathan LaBerge, CFA, Vice President Special Reports jonathanl@bcaresearch.com Footnotes 1 Pease see China Investment Strategy Weekly Report "Is China Making A Policy Mistake?", dated October 31, 2018, available at cis.bcaresearch.com. 2 Pease see China Investment Strategy Special Reports "China's Property Market: Where Will It Go From Here?", dated September 13, 2018, available at cis.bcaresearch.com. 3 Pease see BCA Foreign Exchange Strategy Weekly Report "The Dollar And Risk Assets Are Beholden To China's Stimulus", dated August 3, 2018, available at fes.bcaresearch.com. 4 Pease see China Investment Strategy Special Reports "China: How Stimulating Is The Stimulus?", dated August 8, 2018, and "China: How Stimulating Is The Stimulus? Part Two", dated August 15, 2018, available at cis.bcaresearch.com. 5 Pease see China Investment Strategy Weekly Report "Checking In On The Data", dated November 7, 2018, available at cis.bcaresearch.com. Cyclical Investment Stance Equity Sector Recommendations
According to the 21st century’s encyclopedia, Wikipedia, “a domino effect or chain reaction is the cumulative effect produced when one event sets off a chain of similar events…It typically refers to a linked sequence of events where the time between…
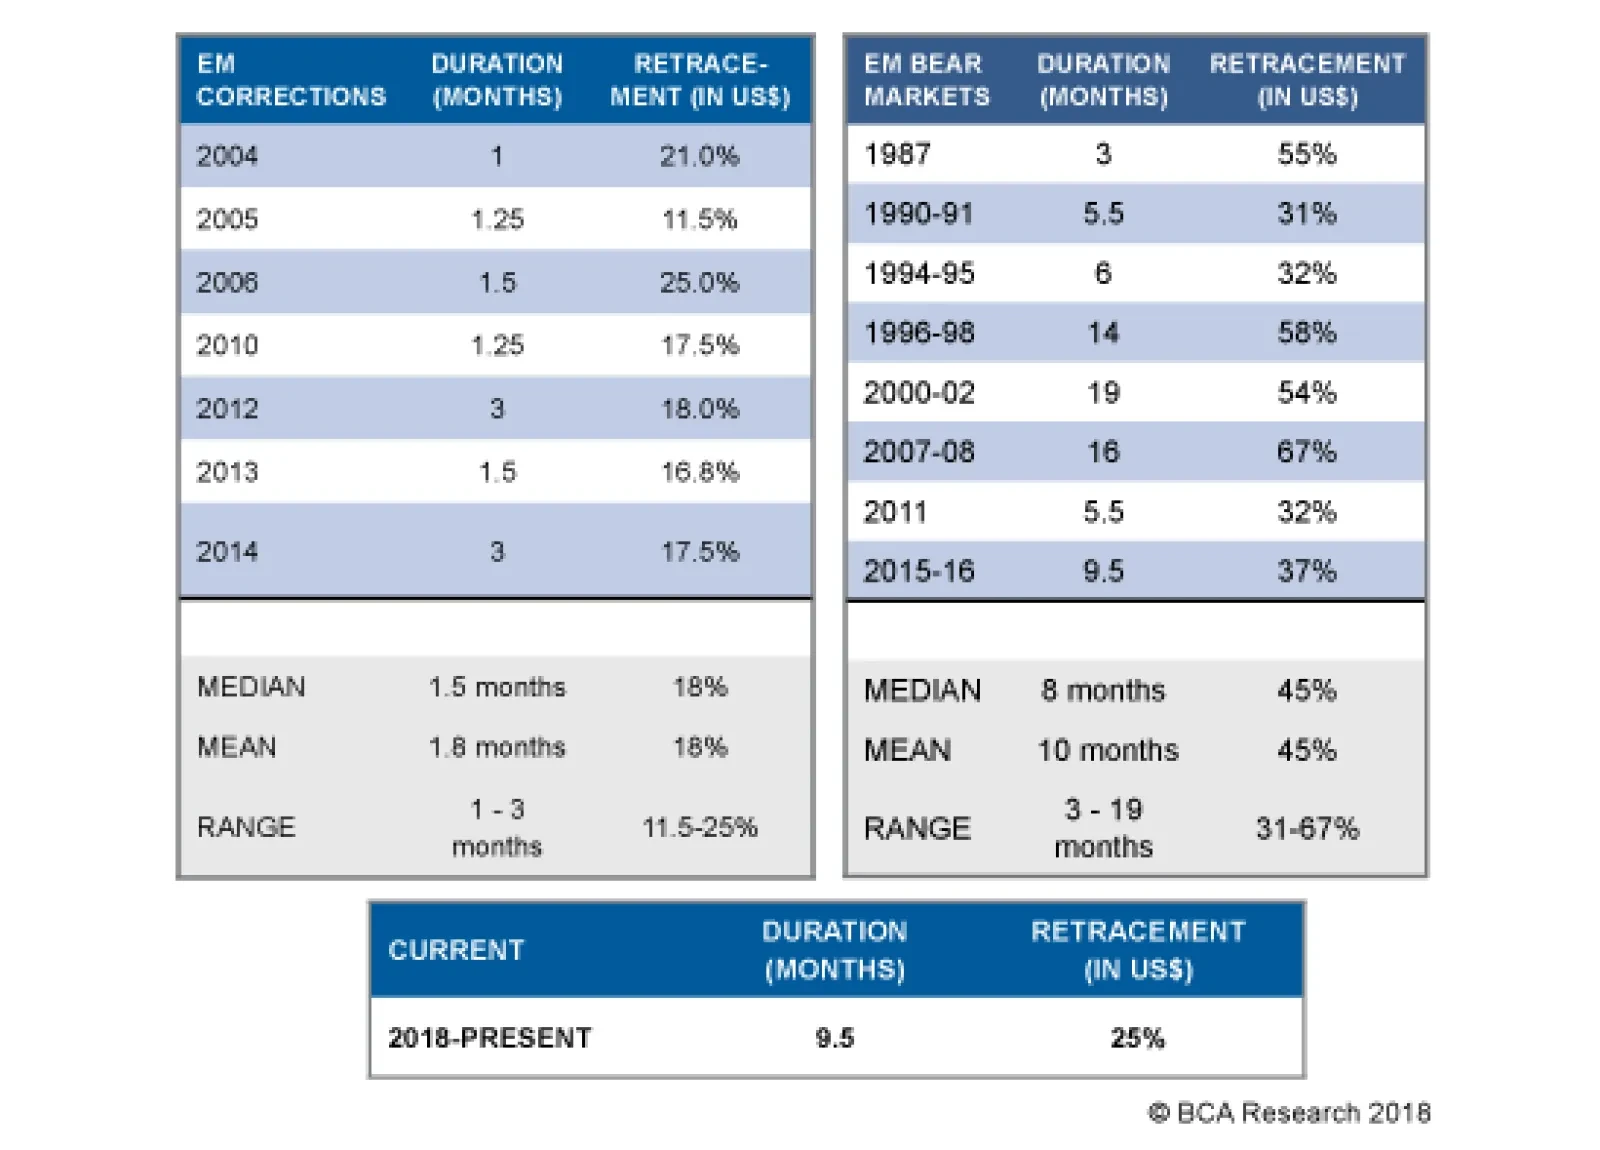
The following factors will keep downward pressure on EM risk assets over the cyclical investment horizon: weakening Chinese and EM demand; headwinds facing global trade growth; and the Fed’s hawkish reaction function. Perhaps the most relevant financial…
Dear Client, Barring any major market developments, we will not be sending you a report next week. Instead, I will be working with my colleagues on BCA's Annual Outlook, which will be published on Monday, November 26. The outlook will feature a wide-ranging discussion with Mr. X and his daughter Ms. X on the key themes that we see shaping global markets in 2019. Best regards, Peter Berezin, Chief Global Strategist Highlights The stock market correction has further to run. We would turn more bullish if global equities were to drop another 8% from current levels. A mundane economic identity - savings minus investment equals the current account balance - provides deep market insight into the workings of the global economy. The U.S. economy is suffering from a shortage of savings, which will push up interest rates and the value of the dollar. In contrast, China has a surfeit of savings. Rectifying this will require a weaker yuan. The political impasse between the EU and Italy over next year's budget will be resolved. However, the fact that Italy lacks a readily available outlet for its excess private-sector savings could spell doom for the euro area down the road. Feature The Correction Ain't Over Our MacroQuant model continues to signal downside risks for global equities over the coming weeks (Chart 1). The model is flagging a deterioration in a variety of leading economic indicators, both in the U.S. and abroad, which tends to be bearish for stocks (Chart 2). Global financial conditions have also tightened since the summer due to the rise in government bond yields, higher credit spreads, and a firmer dollar. Chart 1MacroQuant* Model Suggests Caution Is Still Warranted
S-I=CA In The U.S., China, And Italy
S-I=CA In The U.S., China, And Italy
Chart 2Global Growth Indicators Are Deteriorating
Global Growth Indicators Are Deteriorating
Global Growth Indicators Are Deteriorating
Sentiment remains reasonably upbeat, a bearish contrarian indicator. The November Bank of America Merrill Lynch Global Fund Manager Survey revealed that a net 31% of managers were still overweight global stocks. Past major bottoms in 2008, 2011, 2012, and 2016 all saw equity allocations fall into underweight territory. Strikingly, EM allocations rose in November, with a net 13% of fund managers overweight the asset class. This is in stark contrast to 2015 when a net 30% of fund managers were underweight EM stocks. We do not expect the correction which began in October to morph into a full-fledged bear market. Nevertheless, the near-term path of least resistance for stocks remains to the downside. We would only upgrade global equities to overweight if the MSCI All-Country World index were to fall another 8% from current levels, consistent with a price of $64 on the ACWI ETF. At that level, the forward P/E on the index would be back to 2013 levels (Chart 3). Chart 3A Valuation Reset
A Valuation Reset
A Valuation Reset
A Key Macro Identity One of the first identities undergraduate economics students learn is S-I=CA: The difference between what a country saves and invests is equal to its current account balance.1 While it is easy to dismiss this identity as yet another abstract concept that only egghead economists would find interesting, it has real-world implications for investors of all stripes. To see this, it is useful to expand the identity a bit. Total savings is just the sum of private-sector and public-sector savings. Thus, we can write: Private-sector savings = fixed asset investment + government budget deficit + current account balance In other words, the savings that the private sector generates must either be recycled into investment, soaked up by the government through a budget deficit, or exported abroad via a current account surplus. This relationship always holds ex post. But what happens if it does not hold ex ante? Then "something" must adjust to make the relationship hold. In a normal environment, this "something" is interest rates. If there is a shortfall of private-sector savings - that is, if the right-hand side of the equation above exceeds the left-hand side - an increase in rates can restore the identity by encouraging private savings, discouraging investment, and potentially making it more difficult for the government to pursue an expansionary fiscal policy. Higher rates will also produce a stronger currency, leading to a deterioration in the current account balance. The exact opposite will happen if there is an excess of private-sector savings. What happens if there is excessive savings but the central bank cannot lower interest rates either because it lacks monetary independence - i.e., when a country has a currency peg - or because monetary policy is constrained by the zero lower bound on nominal short-term rates? In that case, employment will decline. One cannot save if one does not have a job that generates income. In practice, this can lead to a vicious circle where falling employment causes households to try to save more for precautionary reasons, while discouraging companies from investing in new capacity. The resulting increase in desired savings is likely to lead to further declines in employment. Keynes referred to this outcome as the paradox of thrift: A situation where one person's desire to save more leads to a collective decline in savings because aggregate income shrinks. Let's turn to what all this means for investors today. The U.S.: Trump's Fiscal Policy Is Inconsistent With His Trade Goals The IMF estimates that the U.S. cyclically-adjusted budget deficit will reach 5.6% of GDP next year. The results of the midterm elections are unlikely to change this outcome. While the takeover of the House of Representatives by the Democrats will preclude Congress from passing another round of tax cuts, our geopolitical strategists believe that there is a better than 50% chance that a bipartisan deal will be reached to increase infrastructure spending.2 They point out that Nancy Pelosi mentioned infrastructure five times during her election night address, without mentioning impeachment once. Recent data on U.S. capital spending has been on the soft side (Chart 4). Core capital goods orders have decelerated and capex intention surveys have come off their highs. Residential investment has also been weak, as reflected in declining housing starts and building permits. Chart 4Both Residential And Nonresidential Investment Have Softened
Both Residential And Nonresidential Investment Have Softened
Both Residential And Nonresidential Investment Have Softened
We would tend to fade the weakness in capital spending (Chart 5). The ISM industrial capacity utilization rate is near cycle highs. Rising wages will incentivize firms to substitute labor with capital, leading to more investment spending. The downside risk to home building is also limited, given that residential investment stands at only 3.9% of GDP, well below the high of 6.7% reached in 2005. If anything, the U.S. is not churning out enough fixed capital, as evidenced by the fact that the average age of the capital stock has risen swiftly over the past decade. As my colleague Doug Peta likes to say, you don't get hurt falling out of a basement window. Chart 5Running Out Of Spare Capacity
Running Out Of Spare Capacity
Running Out Of Spare Capacity
Meanwhile, the personal savings rate stands at over 6%, significantly higher than what one would expect based on its typical relationship with household net worth (Chart 6). Chart 6U.S. Household Savings Rate Is High Relative To Wealth
S-I=CA In The U.S., China, And Italy
S-I=CA In The U.S., China, And Italy
The identity described at the outset of this report implies that the trade balance will necessarily deteriorate if the savings rate falls, investment rises, and the budget deficit remains elevated. If President Trump strikes a trade deal with China, he will have no one to blame for a larger U.S. trade deficit. Hence, he has little incentive to make a deal. Protectionism remains popular in the U.S. Midwest, the battleground on which the next presidential election will be fought. Democrat Sherrod Brown won the Ohio Senate race by 6.4% - a state that Trump carried by 8.1% - on a highly protectionist platform. Trump simply cannot afford to go soft on one of his signature issues. China: What To Do With Excess Savings? The slowdown in Chinese growth this year has been concentrated in domestic demand (Chart 7). Exports have held up well. In fact, Chinese exports to the U.S. are up 13% in dollar terms in the first ten months of the year compared with the same period last year. Chart 7China's Domestic Economy Is Weakening
China's Domestic Economy Is Weakening
China's Domestic Economy Is Weakening
Unfortunately, judging from the steep drop in the export component of the Chinese manufacturing PMI, exports are likely to come under increasing pressure over the coming months (Chart 8). This makes it all the more important for the Chinese authorities to prop up domestic growth. Chart 8China's Export Outlook Is Dire
China's Export Outlook Is Dire
China's Export Outlook Is Dire
China has historically stimulated its economy through debt-financed fixed-investment spending (Chart 9). This made eminent sense when China needed more factories, infrastructure, and modern housing. However, now that China has all this in spades, it is looking for different stimulus options. Chart 9China: Debt And Capital Accumulation Have Gone Hand In Hand
China: Debt And Capital Accumulation Have Gone Hand In Hand
China: Debt And Capital Accumulation Have Gone Hand In Hand
Our formula reveals what those other options must be. If China wants to reduce investment spending to a more sustainable level, it must either boost consumption, increase the fiscal deficit, or raise net exports. Given a hostile export backdrop, it is therefore no surprise that the Chinese government has been cutting taxes, increasing social transfer payments, and letting the currency slide. The problem is that none of these other forms of stimulus are beneficial to the rest of the world, and in some cases, they may be quite detrimental. The rest of the world relies on Chinese investment, not Chinese consumption. Raw materials and capital goods comprise 80% of Chinese imports. China represents close to half of the world's demand for aluminum, copper, zinc, nickel, and steel (Chart 10). Whether it be services or manufactured goods, what Chinese households consume is generally produced in China. Chart 10China Is The Predominant Source Of Global Demand For Metals
China Is The Predominant Source Of Global Demand For Metals
China Is The Predominant Source Of Global Demand For Metals
A weaker yuan will make the Chinese economy more competitive, but at the expense of other emerging markets. A weaker yuan will also raise the price of imported goods, leading to a lower volume of imports. The implication is that both the magnitude and composition of China's stimulus may disappoint. This week's much weaker-than-expected credit and money data - new CNY loans clocked in at RMB 697 billion in October, well below consensus expectations of RMB 905 billion - validates this view. Italy: Getting To "Yes" Is The Easy Part The showdown between Italy's populist leaders and the EU continues. The Lega-Five Star coalition government promised big tax cuts and generous increases in social spending. It is loath to backtrack on its campaign pledges so soon after the election. As long as there is no contagion from Italy to the rest of Europe, the EU has no incentive to back off. While it will never admit it, the EU establishment would love nothing more than to humiliate the Italians in order to dissuade voters across Europe from electing populist politicians. In the end, we expect the Italian government to give in to the EU's demands. Business confidence has plunged (Chart 11). The economy is again teetering on the brink of recession. Italy's banking system would be technically insolvent if the ten-year BTP yield were to rise above 4% based on a mark-to-market accounting of Italian bank holdings of government debt. Chart 11Italy: Is The Economy Heading For Another Dip?
Italy: Is The Economy Heading For Another Dip?
Italy: Is The Economy Heading For Another Dip?
A political resolution to the ongoing crisis would provide short-term relief. However, it may not solve Italy's problems - indeed, it could exacerbate them. Italy's working-age population is shrinking (Chart 12). This has made companies reluctant to expand capacity. Meanwhile, households are busily saving for retirement. Their motivation to save more would only be amplified by the cuts to pension benefits that the previous caretaker government promised and that the EU is insisting be implemented. The overall private-sector financial balance - the difference between what the private sector saves and invests - reached a surplus of 5.1% of GDP in 2017 (Chart 13). Chart 12The Italian Workforce Is Shrinking
S-I=CA In The U.S., China, And Italy
S-I=CA In The U.S., China, And Italy
Chart 13Italy: Private Sector Saves Too Much And Spends Too Little
Italy: Private Sector Saves Too Much And Spends Too Little
Italy: Private Sector Saves Too Much And Spends Too Little
Our formula shows that counterbalancing this private-sector surplus will require a persistent government fiscal deficit or current account surplus. Italy's primary budget balance - its overall budget balance excluding interest payments - hit 1.7% of GDP in 2017 (Chart 14). This primary surplus is necessary to cover the 3.6% of GDP in interest payments that the government has to make, a number that will only rise if the ECB raises rates (hence, our high-conviction view that the ECB will have to keep rates low for years to come). Chart 14Italy Needs A Primary Budget Surplus
Italy Needs A Primary Budget Surplus
Italy Needs A Primary Budget Surplus
Italy runs a modest current account surplus of 2% of GDP. However, its current account balance would be far smaller, and perhaps even negative, if the economy were operating at full employment since stronger domestic demand would suck in more imports. Italy would love to copy Germany, a country which habitually over-saves but exports its excess savings to the rest of the world through a gargantuan 8% of GDP current account surplus. Alas, achieving a larger current account surplus would require either a currency depreciation or productivity-enhancing structural reforms. The former is impossible as long as Italy is a member of the euro area, while the latter has proven to be wishful thinking for as long as people have talked about it. We do not expect Italy to default on its debt or jettison the euro in the near term. But when the next synchronized global downturn arrives - probably in about two years or so - all hell could break loose. Concluding Thoughts An economy facing a shortfall in savings is one where desired spending exceeds income. When the economy has spare capacity, such a savings shortfall is a good thing; it means more demand, more employment, and ultimately, more income. However, once spare capacity is soaked up, a shortage of savings will lead to higher inflation. The U.S. finds itself in the latter situation today. The output gap is fully closed, but growth remains above trend. As we have discussed in past reports, the Fed is likely to raise rates more than the market expects.3 This will lead to higher Treasury yields and a stronger dollar. With that in mind, we are raising our end-year target on our long DXY trade recommendation from 98 to 100, implying another 3% increase from current levels. In the absence of offsetting Chinese stimulus, a stronger dollar will put further pressure on emerging markets. EM equities will likely bottom in the first half of next year once the dollar peaks and global growth stabilizes. Until then, investors should overweight DM stocks relative to their EM peers. Peter Berezin, Chief Global Strategist Global Investment Strategy peterb@bcaresearch.com 1 National savings, S, is equal to Y-C-G, where Y is national income and C and G are household and government consumption, respectively. Substituting this identity into the standard Y=C+I+G+X-M equation yields S-I=X-M. National income includes net foreign earnings. In this case, the trade balance, X-M, is equal to the current account balance. 2 Please see Geopolitical Strategy Special Report, "The 2020 U.S. Election: A "Way Too Soon" Forecast," dated November 7, 2018. 3 Please see Global Investment Strategy Weekly Report, "Bond Bears Maul Goldilocks," dated October 12, 2018; and "The Next U.S. Recession: Waiting For Godot?" dated October 5, 2018. Strategy & Market Trends Tactical Trades Strategic Recommendations Closed Trades
Highlights Global growth has not yet bottomed, this will provide additional support for the dollar. EUR/USD will be a buy once it dips below 1.1, as slowing global growth means that European activity will continue to lag behind the U.S. The dollar is not as expensive as simple metrics suggest. Fade any Sino-U.S. détente in Buenos Aires. The best vehicle to play a dollar correction remains the NZD. GBP volatility is peaking. Feature We have been on the road for the past two weeks, in the U.S. and in the Middle East. Exchanges with clients can reveal what the key narratives driving the markets are and where the walls of worries may lie. This week, we opted to share what have been the major questions plaguing clients minds. Question 1: Has Global Growth Bottomed? The short answer is no. While there are issues affecting Europe, such as Italian budget battles and idiosyncrasies in the German auto sector, the key impetus pushing global growth downward is China. The Chinese economy is slowing as Chinese policymakers are working to force indebtedness lower, and have therefore constrained access to credit, especially in the shadow banking system (Chart I-1). This has not changed. Chart I-1Chinese Policy Tightening In Action China's Deleveraging Is Not Over Yet
Chinese Policy Tightening In Action China's Deleveraging Is Not Over Yet
Chinese Policy Tightening In Action China's Deleveraging Is Not Over Yet
It is also true that Chinese policy makers have been trying to limit the downside to growth. They have injected liquidity in the banking system, let the renminbi depreciate, and allegedly, supported a stock market spiraling downward under the pressure of margin calls. Moreover, fiscal policy is being eased, with income tax cuts pointing to a desire to support household consumption, especially spending on services. But none of these policy actions seems to matter for the world economy, at least for now. China impacts global growth through its imports, and non-food commodities, investment goods, machinery equipment and transportation goods constitute 85% of total Chinese imports. These goods are levered to industrial activity and the Chinese investment cycle. The latter in turn is levered to the Chinese credit cycle (Chart I-2). Hence, as long as China tries to reign in credit growth, Chinese imports will be under pressure. Chart I-2Slowing Chinese Credit Impulse Means Slower Chinese Imports
bca.fes_wr_2018_11_16_s1_c2
bca.fes_wr_2018_11_16_s1_c2
What about the recent rebound in Chinese imports? Our China Strategist posits that it has been linked to front running of orders before the Trump tariffs enter into effect. The trend in credit growth remain poor. The October's money and credit numbers show that the China's total social financing grew at its slowest pace in 12 years, and money growth as well as traditional loan growth has also relapsed (Chart I-3). Hence, China doesn't have an appetite for credit yet. Chart I-3Chinese Credit Is Not Responding To Chinese Stimulus
Chinese Credit Is Not Responding To Chinese Stimulus
Chinese Credit Is Not Responding To Chinese Stimulus
It is hard to fully know why the country's appetite for credit is slowing despite the expanding list of small measures implemented by authorities to support economic activity. On the one hand, it seems that lenders are reluctant to lend. On the other, the private sector does not seems hungry to spend either. As BCA's Emerging Market Strategy service highlighted, even the Chinese consumer is displaying a declining marginal propensity to consume, and retail sales as well as car sales are declining (Chart I-4).1 This suggests that China will continue to act as an anchor on global growth for the time being. Chart I-4Chinese Households Are Cautious
Chinese Households Are Cautious
Chinese Households Are Cautious
Stresses outside of China also remain problematic for global growth. Emerging market financial conditions have tightened significantly. This will continue to act as a drag on global industrial activity (Chart I-5). In fact, the recent poor GDP numbers out of Germany and Japan, two nations highly levered to the global industrial cycle, confirm that the pain originating in the EM space is spreading around the globe. Chart I-5EM Financial Conditions Suggest Continued Downward Pressure On Growth
EM Financial Conditions Suggest Continued Downward Pressure On Growth
EM Financial Conditions Suggest Continued Downward Pressure On Growth
Ultimately, since the U.S. economy is a low beta economy, even if U.S. growth downshifts in response to shocks to global growth, it is likely to slow less than the rest of the world. This explains why the dollar exhibits little constant correlation with U.S. growth, but a tight negative relationship with global growth (Chart I-6). Chart I-6The Countercyclical Dollar
The Countercyclical Dollar
The Countercyclical Dollar
Hence, since we see little hope for an imminent bottom in global growth, additional dollar upside remains. Thus, we re-iterate our target for DXY at 100. Nevertheless, make no mistake, the easy gains in the greenback are behind us. The remainder of the rally will likely prove volatile. Question 2: Is The Growth Divergence Between The U.S. And The Euro Area Peaking? Will This Reverse The Dollar Rally? Economic data in the U.S. has begun to weaken, especially on the durable good orders and the housing fronts. Moreover, the recent core CPI data, which came in at 2.1%, was a disappointment. The strong dollar, higher interest rates, tighter financial conditions, and the potential hit to profits from falling oil prices all suggest that U.S. capex could slow. However, as Chart I-7 illustrates, Europe is slowing more than the U.S. Despite the rollover in the U.S. Leading Economic Indicator, the gap between the U.S. and the euro area LEI is in fact growing in favor of the U.S. This is because the U.S. is a low beta economy and it outperforms Europe when global growth slows, especially when the negative impulse emanates out of China (Chart I-8). Chart I-7U.S. Growth May Be Slowing, But It Is Still Outperforming...
U.S. Growth May Be Slowing, But It Is Still Outperforming...
U.S. Growth May Be Slowing, But It Is Still Outperforming...
Chart I-8...Especially If China Does Not Pick Up
...Especially If China Does Not Pick Up
...Especially If China Does Not Pick Up
Nonetheless, the Fed has already increased rates eight times this cycle and the market anticipates a bit more than two interest rate hikes in the U.S. over the next 12 months, while in Europe, rate expectations are much more muted. Will this slowdown in U.S. growth cause U.S. rate and yield differentials versus the euro area - which stand near historical highs - to fall, providing a welcome fillip for EUR/USD in the process (Chart I-9)? Chart I-9U.S. Spreads Are Wide
U.S. Spreads Are Wide
U.S. Spreads Are Wide
We doubt it. First, three deep structural problems still hamper Europe: Italy still faces challenging debt arithmetic if interest rates rise quickly, which means that Italy continues to teeter close to the hedge of a Eurosceptic drama. European banks are still much weaker than U.S. ones and have a large amount of EM exposure, limiting their capacity to handle higher rates. Europe is far from a true fiscal union, which means that the job of supporting growth lies much more heavily on monetary authorities than in the U.S. This forces the European Central Bank to stay more dovish than the Fed. Second, once the cost of currency hedging is taken into account, the spread between U.S. and European bonds yields becomes negative (Chart I-10)! This suggests that unhedged U.S. yields can rise further versus European ones as U.S. hedged yields are not attractive. This means that yields and interest rates in the U.S. can remain high or even rise relative to Europe, making it attractive to buy the greenback for investors willing to take on currency risk. Chart I-10U.S. Hedged Yields Are Low
U.S. Hedged Yields Are Low
U.S. Hedged Yields Are Low
Hence, we do not expect that the slowdown in U.S. growth will constitutes a major problem for the dollar. Instead, we are looking for EUR/USD to fall below 1.10 before buying the common currency again. Question 3: Is The Dollar Expensive? The answer to this question seems obvious. When looking at a simple purchasing-power parity model, the dollar does look very expensive (Chart I-11). However, valuing currencies is a much more complex question than just looking at PPP metrics. Once other factors are taken into account, the dollar trades in line with its long-term drivers (Chart I-12). The dollar might not be as expensive as PPP metrics suggest because the U.S. productivity growth is higher than in most other G10 nations, because neutral interest rates in the U.S. are structurally higher than in Europe or Japan, and because the U.S. current account deficit is stable despite a strong dollar as the U.S. morphs from an energy importer to an energy exporter. Chart I-11U.S. Dollar And PPP Is The Greenback Really This Expensive?
U.S. Dollar And PPP Is The Greenback Really This Expensive?
U.S. Dollar And PPP Is The Greenback Really This Expensive?
Chart I-12Maybe Not
Maybe Not
Maybe Not
On a short-term basis, there is no evident misalignment in the USD either. The DXY dollar index trades in line with our short-term metrics, suggesting that until now, the bulk of the dollar rally this year was a correction of its previous undervaluation (Chart I-13). Furthermore, the dollar tends to peak at higher degree of overvaluations, and, if U.S. growth continues to outperform the rest of the world, the fair value of the DXY could rise further. Chart I-13No Short-Term Misalignment
No Short-Term Misalignment
No Short-Term Misalignment
Question 4: Will Sino-U.S. Relations Improve After The Buenos Aires G20 Meeting? We are skeptical that Sino-U.S. relations will improve after the Buenos Aires meeting at the end of the month. The White House could delay the imposition of a third round of tariffs as well as the increase in the current tariff rate from 10% to 25%. Such actions would likely result in a temporary bounce back in risk assets and EM related plays as well as correction in the USD. However, President Trump has no incentive to make a full-blown trade deal with China right now. The midterm elections confirmed that the U.S. electorate is not pro-free trade and that the political apparatus in the U.S. is unified in fighting China. At the end of the day, China is a great scapegoat for the income inequality problem plaguing the U.S. Question 5: Will The Dollar Correct After Its Furious 2018 Rally? Our inclination is to think that there are short-term risks building up in the dollar, a topic we discussed at length three weeks ago.2 Namely, traders are now very long the dollar, and risk-on currencies have been rallying against the dollar despite the strength in the DXY. This suggests that the corners of the FX market most levered to global growth might be sniffing out a stabilization in global conditions. Indeed, the Chinese economic surprise index has improved (Chart I-14). While Chinese data has not meaningfully picked up, expectations toward China are very depressed. As such, a slowdown in the pace of deterioration could be interpreted as good news for global growth. The countercyclical dollar may correct. Chart I-14Are Expectations Toward China Too Depressed?
Are Expectations Toward China Too Depressed?
Are Expectations Toward China Too Depressed?
We have not played the dollar correction risk through selling DXY or buying EUR/USD. Instead, we have bought the NZD against both the USD and the GBP. The beaten down kiwi would be the currency most likely to rebound if global growth conditions were to surprise to the upside, even if temporarily. This has proved to be the right call. We remain positive on the NZD for the coming two months. However, from a risk management perpectives we are closing our long NZD/USD trade at 4.8% profit. However, we doubt that any dollar correction is likely to morph into a genuine bear market. If global growth conditions were indeed to improve, this would give more ammo for the Fed to hike in line with its "dots". The market knows that and would revise upward the modest 60 basis point of hikes currently anticipated over the coming 12 months. As such, the resultant increase in real rates would likely hurt the still-fragile EM economies and cause a renewed tightening in EM financial conditions. This would in turn lead to additional slowdown in global growth and would support the dollar. Hence, our current positive predisposition toward the kiwi is temporary in nature. Question 6: Has The Pound Bottomed, Will GBP-Volatility Recede Anytime Soon? In September, we warned that the pound did not compensate investors adequately for the political uncertainty surrounding Brexit risks.3 Specifically, we were most worried about British domestic politics, not the EU side of the negotiations. However, because we believed that ultimately, either soft Brexit or Bremain would ultimately prevail, we refrained from selling the pound outright. Instead, we recommended investors buy the GBP's volatility. Today, Prime Minister Theresa May is in danger as two additional ministers resigned from her cabinet after she presented the Brexit deal that was hammered out with Brussels. The risk of a new election or a hard-liner Brexit Tory replacing her is growing by the minute. Markets are once again clobbering the pound, and GBP implied volatility is trading at level last seen directly after the June 2016 referendum (Chart I-15). Chart I-15Close Long GBP Vol Bets
Close Long GBP Vol Bets
Close Long GBP Vol Bets
At current levels, the pound is now an attractive play for long-term investors. Additionally, while a new election is likely to cause more tremors into the pound, we are inclined to recommend investors close long GBP volatility trades as the British public is growing more disillusioned with Brexit. Our conviction is only growing that only the softest form of Brexit will be implemented. As a result, the risk-reward ratio from selling the pound or buying its volatility has now significantly deteriorated. We are closing our short GBP/NZD trade at a 6% profit in four weeks. Mathieu Savary, Vice President Foreign Exchange Strategy mathieu@bcaresearch.com Footnotes 1 Please see Emerging Markets Strategy Weekly Report, titled "On Domino Effects And Portfolio Outflows", dated November 15, 2018, available at ems.bcaresearch.com 2 Please see Foreign Exchange Strategy Weekly Report, titled "Risk To The Dollar View", dated October 26, 2018, available at fes.bcaresearch.com 3 Please see Foreign Exchange Strategy Special Report, titled "Assessing the Geopolitical Risk Premium In the Pound", dated September 7, 2018, available at fes.bcaresearch.com Currencies U.S. Dollar Chart II-1USD Technicals 1
USD Technicals 1
USD Technicals 1
Chart II-2USD Technicals 2
USD Technicals 2
USD Technicals 2
Recent data in the U.S. has been mixed: Both core inflation and core PCE came in below expectations, coming in at 2.1% and 1.6% respectively. However, Q3 GDP growth surprised to the upside, coming in at 3.5%. Moreover, nonfarm payrolls also came in above expectations, coming in at 250 thousand. The DXY index has been able to appreciate over the past three weeks. We maintain our bullish bias towards the dollar, given that despite its rise, this currency remains fairly valued. Moreover, we expect global growth to continue deaccelerating, as Chinese authorities continue to tighten. That being said, potential upside might be limited from current levels, as speculators are very long the dollar. Report Links: Updating Our Intermediate Timing Models - November 2, 2018 In Fall, Leaves Turn Red, The Dollar Turns Green - October 12, 2018 Policy Divergences Are Still The Name Of The Game - August 14, 2018 The Euro Chart II-3EUR Technicals 1
EUR Technicals 1
EUR Technicals 1
Chart II-4EUR Technicals 2
EUR Technicals 2
EUR Technicals 2
Recent data in the Euro area has been mixed: Core inflation increased and outperformed expectations, coming in at 1.1%. Moreover, Markit Services PMI also surprised to the upside, coming in at 53.7. However, Markit Manufacturing PMI surprised negatively, coming in at 52. EUR/USD has depreciated over that past three weeks. We remain bearish on the euro, given that we expect global growth to keep slowing, hurting export-driven economies like the euro area. Furthermore, Italian debt dynamics will continue to plague the Eurozone. That being said, if the euro were to fall below 1.1, we would tamper our bearishness. Report Links: Evaluating The ECB's Options In December - November 6, 2018 Updating Our Intermediate Timing Models - November 2, 2018 Will Rising Wages Cause An Imminent Change In Policy Direction In Europe And Japan? - October 5, 2018 The Yen Chart II-5JPY Technicals 1
JPY Technicals 1
JPY Technicals 1
Chart II-6JPY Technicals 2
JPY Technicals 2
JPY Technicals 2
Recent data in Japan has been mixed: The unemployment rate surprised positively, coming in at 2.3%. This measure also decreased from last month. However, housing starts yearly growth underperformed expectations, coming in at -1.5%. Moreover, overall household spending yearly growth also surprised negatively, coming in at -1.6%. Q2 GDP contracted and also came in below expectations, driven by poor capex growth. USD/JPY has also appreciated over the past three weeks. We remain positive on the trade-weighted yen, given that the continued slowdown in global growth, fueled by the dual tightening of policy by Chinese authorities and the Fed, will help safe haven currencies like the yen. Moreover, the current selloff in U.S. markets could also provide a boon for this currency if it forces the Fed to tamper its hawkishness. Report Links: Updating Our Intermediate Timing Models - November 2, 2018 Will Rising Wages Cause An Imminent Change In Policy Direction In Europe And Japan? - October 5, 2018 Rhetoric Is Not Always Policy - July 27, 2018 British Pound Chart II-7GBP Technicals 1
GBP Technicals 1
GBP Technicals 1
Chart II-8GBP Technicals 2
GBP Technicals 2
GBP Technicals 2
Recent data in the U.K. has been mixed: Average hourly earnings excluding bonus yearly growth surprised to the upside, coming in at 3.2%. However, core inflation underperformed expectations, coming in at 1.9%. Moreover, retail sales yearly growth also surprised negatively, coming in at 2.2%. After rising for the last three weeks, GBP/USD fell by over 1.5% on Thursday, after two ministers quit Theresa's May cabinet. While the headline risk remains large, especially as the U.K. could soon go through an election, we do not want to be greedy and our closing our long GBP-vol bets. We are also closing our short GBP/NZD bet. At current levels, GBP is now an attractive long-term play. Report Links: Updating Our Intermediate Timing Models - November 2, 2018 Clashing Forces: The Fed And EM Financial Conditions - October 19, 2018 Updating Our Long-Term FX Fair Value Models - June 22, 2018 Australian Dollar Chart II-9AUD Technicals 1
AUD Technicals 1
AUD Technicals 1
Chart II-10AUD Technicals 2
AUD Technicals 2
AUD Technicals 2
Recent data in Australia has been positive: Employment growth outperformed expectation, coming in at 32.8 thousand. Moreover, the participation rate also surprised to the upside, coming in at 65.6%. Finally, the unemployment rate also surprised positively, coming in at 5%. AUD/USD has risen by 3.39% the past 3 weeks. We are inclined to fade this rally as the poor outlook for the Chinese economy could soon transform these strong Australian economic results into much more disappointing numbers. Report Links: Updating Our Intermediate Timing Models - November 2, 2018 Policy Divergences Are Still The Name Of The Game - August 14, 2018 What Is Good For China Doesn't Always Help The World - June 29, 2018 New Zealand Dollar Chart II-11NZD Technicals 1
NZD Technicals 1
NZD Technicals 1
Chart II-12NZD Technicals 2
NZD Technicals 2
NZD Technicals 2
Recent data in New Zealand has been positive: Employment growth outperformed expectations, coming in at 1.1%. Moreover, the participation rate also surprise to the upside, coming in at 71.1%. Finally, the unemployment rate also surprised positively, coming in at 3.9%. NZD/USD has risen by more than 5.5% the past 3 weeks. The NZD continues to be one of our favorite currencies in the G10, given that rate expectations continue to be very low, even though economic data has strengthened. Moreover, food prices, dairies in particular have limited downside from here, especially as they are not very exposed to China's policy tightening. Report Links: Updating Our Intermediate Timing Models - November 2, 2018 Clashing Forces: The Fed And EM Financial Conditions - October 19, 2018 In Fall, Leaves Turn Red, The Dollar Turns Green - October 12, 2018 Canadian Dollar Chart II-13CAD Technicals 1
CAD Technicals 1
CAD Technicals 1
Chart II-14CAD Technicals 2
CAD Technicals 2
CAD Technicals 2
Recent data in Canada has been positive: The net change in employment outperformed expectations, coming in at 11.2 thousand. Moreover, housing starts also surprised to the upside, coming in at 206 thousand. Finally, the unemployment rate also surprised positively, coming in at 5.8%. USD/CAD has risen by 1.2% these past 3 weeks. The weakness in oil prices have caused the Canadian dollar to be one of the worst performing currencies in the G10 in recent weeks. We are reticent to be too bullish on the CAD, given that markets are now pricing in a BoC that will be more hawkish than the Fed. Report Links: Updating Our Intermediate Timing Models - November 2, 2018 Clashing Forces: The Fed And EM Financial Conditions - October 19, 2018 Updating Our Long-Term FX Fair Value Models - June 22, 2018 Swiss Franc Chart II-15CHF Technicals 1
CHF Technicals 1
CHF Technicals 1
Chart II-16CHF Technicals 2
CHF Technicals 2
CHF Technicals 2
Recent data in Switzerland has been negative: Real retail sales yearly growth came in significantly below expectations, coming in at -2.7%. Moreover, the SVME Purchasing Manager's Index also surprised to the downside, coming in at 57.4. Finally, the KOF leading Indicator also surprised negatively, coming in at 100.1. EUR/CHF has been flat in recent weeks. We continue to be bearish on the franc on a cyclical basis, given that inflationary forces in Switzerland remain too tepid for the SNB to hike policy rates. Moreover, the SNB will also have to intervene in currency markets if the franc becomes more expensive in response to the current risk-off environment. Report Links: Updating Our Intermediate Timing Models - November 2, 2018 Updating Our Long-Term FX Fair Value Models - June 22, 2018 Updating Our Intermediate Timing Models - May 18, 2018 Norwegian Krone Chart II-17NOK Technicals 1
NOK Technicals 1
NOK Technicals 1
Chart II-18NOK Technicals 2
NOK Technicals 2
NOK Technicals 2
Recent data In Norway has been mixed: Both headline and core inflation underperformed expectations, coming in at 3.1% and 1.6% respectively. Moreover, manufacturing output also surprised to the downside, coming in at -0.3%. However, registered unemployment surprised positively, coming in at 79.7 thousand. USD/NOK has risen by 1.5%, as falling oil prices have weighed heavily on the krone. We are bullish on the krone relative to the Canadian dollar, given that rate expectations in Canada are much more fully priced in Canada than they are in Norway, even though the inflationary backdrop is similar. Report Links: Updating Our Intermediate Timing Models - November 2, 2018 Clashing Forces: The Fed And EM Financial Conditions - October 19, 2018 Updating Our Long-Term FX Fair Value Models - June 22, 2018 Swedish Krona Chart II-19SEK Technicals 1
SEK Technicals 1
SEK Technicals 1
Chart II-20SEK Technicals 2
SEK Technicals 2
SEK Technicals 2
Recent data in Sweden has been mixed: Retail sales yearly growth outperformed expectations, coming in at 2.1%. Manufacturing PMI also outperformed expectations, coming in at 55. However, headline inflation surprised to the downside, coming in at 2.3%. USD/SEK has depreciated by roughly 1% for the past 3 weeks. Overall, we are bullish on the krona on a long-term basis. After all, the Riksbank is on the verge of beginning a tightening cycle, as imbalances in the Swedish economy are only growing more dangerous. With that being said, the krona could suffer if global growth slows further, as Sweden is very exposed to the gyrations of the global economy. Report Links: Updating Our Intermediate Timing Models - November 2, 2018 Updating Our Long-Term FX Fair Value Models - June 22, 2018 Updating Our Intermediate Timing Models - May 18, 2018 Trades & Forecasts Forecast Summary Core Portfolio Tactical Trades Closed Trades
The Chinese economy is transitioning from investment- and export-led growth to consumer-led growth. Amid downward pressure on investment growth and escalating China-U.S. trade tensions, the strength and durability of household consumption in China has become…
Our Chief Geopolitical Strategist, Marko Papic, just wrote a fantastic piece on how the secular upswing in U.S.-China tensions could shape the future of critical industries (to impacting both investors and governments) and capital market behavior.1 The…
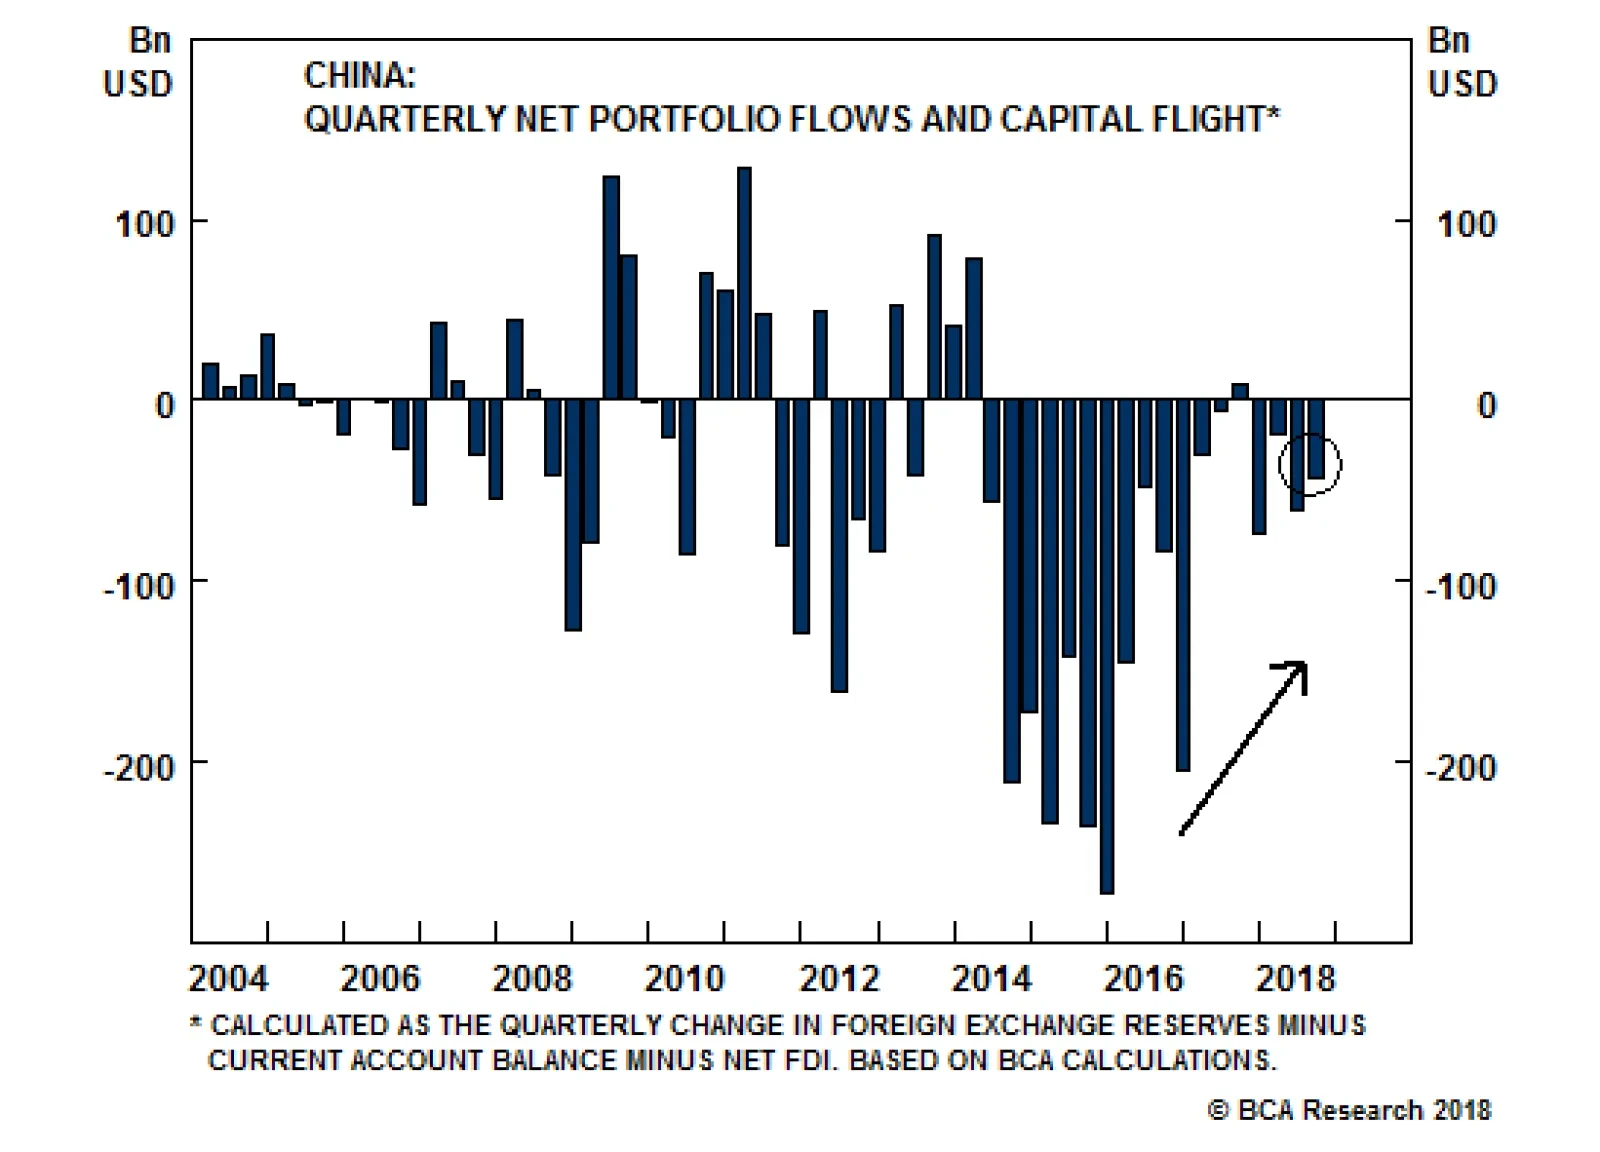
In 2015, a 4.7 percent depreciation precipitated a US$483 billion outflow of Chinese FX reserves. Conversely, the RMB has declined by about 10% in 2018 without any meaningful capital outflows or FX reserve deployment (see chart). To be fair, forex reserves…
Highlights The ongoing selloff in EM risk assets and commodities resembles a domino effect. Given that domino effects transpire in bear markets - not corrections - we believe that EM risk assets and commodities are indeed in a bear market. We continue to recommend short positions in EM risk assets and underweighting EM versus DM. Finally, we rank individual developing countries in terms of their vulnerability to foreign portfolio capital outflows based on their share of foreign equity and domestic bond holdings. Feature The fundamental case for our negative stance on EM risk assets continues to rest on the following: A deepening slowdown in global trade due to weakening demand in Chinese and EM economies alongside the Federal Reserve's determination to tighten policy are creating a toxic mix for EM risk assets, a stronger U.S. dollar and negative spillovers into DM markets. With the exception of China's latest trade data, which were inexplicably strong,1 recent trade data out of Asia indicate the region's exports are faltering, as evidenced by slumping outward shipments of Taiwan and Korea (Chart I-1). Chart I-1No Improvement In Asian Exports
No Improvement In Asian Exports
No Improvement In Asian Exports
Importantly, not only has capital spending decelerated in China but household spending growth has also slowed considerably. Chart I-2 illustrates that the marginal propensity to spend among mainland households has diminished, passenger car sales are contracting and the nominal growth rate of retail sales of consumer goods has plummeted from 10% last year to 4%. Chart I-2Chinese Consumer Is Decelerating
Chinese Consumer Is Decelerating
Chinese Consumer Is Decelerating
That said, observing past and current economic data alone does not offer enough information to gauge whether a selloff is a correction or a bear market. To assess the potential for further downside in risk assets, one needs to exercise judgement on the growth outlook. The latter is often contingent on the presence of imbalances and excesses as well as potential policy responses and their effectiveness. We have elaborated on these topics - in particular why lingering excesses and imbalances in China/EM could make the present global cyclical downturn extensive - at great length in past reports2 and we will not repeat our arguments today. Instead, this week we focus on the nature and character of the equity selloff to understand whether this is a correction or a bear market. In addition, we estimate the degree of foreign investors' positioning in individual EM equity and local bond markets, with the aim of gauging risks of potential portfolio outflows. Domino Effects Occur During Bear Markets Bear markets evolve in phases resembling domino effect-like patterns, where some markets lead while others lag. In contrast, corrections are abrupt and the majority of markets drop concurrently. For example, the EM crises in 1997-'98 did not occur simultaneously across all EM countries. It began in July 1997 with Thailand, then spread to Korea, Malaysia and Indonesia and finally to the rest of Asia. By August 1998, Russian financial markets had collapsed, triggering the Long-Term Capital Management (LTCM) debacle. The last leg of the crisis appeared in Brazil and culminated in the real's devaluation in January 1999. Similarly, the U.S. financial/credit crisis commenced with the selloff in sub-prime securities in March 2007. Corporate spreads began widening, and bank share prices rolled over in June 2007. Next, the S&P 500 and EM stocks peaked in October 2007 (Chart I-3). Despite these developments, commodities prices and EM currencies continued to rally until the summer of 2008, finally collapsing in the second half of that year (Chart I-3, bottom panel). Chart I-3Domino Effect In 2007-08
Domino Effect In 2007-08
Domino Effect In 2007-08
We discussed the nature of the current EM selloff in our June 14 report titled, "EM: Sustained Decoupling, Or Domino Effect?" In that report,3 we argued that the selloff in EM risk assets fits the pattern of a bear market - not a correction. We also noted that the odds of U.S. stocks and corporate bonds remaining resilient in the face of a deepening EM selloff were low. In the past month, U.S. equities and corporate bonds have sold off, validating our thesis. In terms of market dynamics, the following observations are noteworthy: The selloff in global risk assets that commenced early this year resembles that of a domino effect, and therefore fits the pattern of a bear market. Following the initial selloff in early February, U.S. stocks recovered and made new highs, but EM risk assets and DM ex-U.S. share prices continued to riot. Since early October, the selloff has snared U.S. stocks and more recently U.S. corporate bonds. Within the EM universe, it began with Turkey and Argentina, then spread to Indonesia, South Africa and Brazil. Chinese, Korean and Taiwanese equities held up until the middle of June. By the second half of June, the selloff spread to these markets as well, causing severe damage. A similar rotational selloff developed in the commodities space. Precious metals prices were the first to drop; followed by industrial metals. While oil made new highs in October, crude oil prices have lately recoupled to the downside. Interestingly, crude oil prices have rolled over at their very long-term moving averages - a phenomenon that often marks a major top and is followed by a large decline (Chart I-4). Chart I-4A Major Top In Oil
A Major Top In Oil
A Major Top In Oil
In terms of market indicators, some of our favorites are signaling more downside in share prices. First, China's narrow money (M1) growth has been a good marker for EM share prices; currently, it is extremely weak and has not yet turned up (Chart I-5). Chart I-5Chinese Money Supply & EM Stocks
Chinese Money Supply & EM Stocks
Chinese Money Supply & EM Stocks
Second, both U.S. and EM share prices always deflate in tandem with a rise in their corporate bond yields, as illustrated in Chart I-6. Chart I-6Corporate Bond Yields Point To Lower Share Prices
Corporate Bond Yields Point To Lower Share Prices
Corporate Bond Yields Point To Lower Share Prices
Importantly, yields on Chinese property companies' offshore bonds have surged and spreads have widened dramatically (Chart I-7). Such high cost of capital entails a dismal outlook for construction activity and industries that are exposed to it. These include global industrials and materials. Chart I-7A Stress In Chinese Real Estate Credit
A Stress In Chinese Real Estate Credit
A Stress In Chinese Real Estate Credit
Table I-1 segregates the EM equity selloffs of the past 35 years into corrections (Table I-1A) and bear markets (Table I-1B). The duration of the corrections range from one to three months, while for bear markets it is three to 19 months. The current EM equity selloff is already 9.5 months old and its drawdown is 25%. As such, it qualifies as a bear market, not a correction. Table I-1
On Domino Effects And Portfolio Outflows
On Domino Effects And Portfolio Outflows
Interestingly, this year the global equity index has exhibited a very similar profile to its 2000 top - Chart I-8 overlays the MSCI global stocks index in U.S. dollars with its profile in 1997-2002. Global share prices peaked in January 2000, attempted a failed breakout in March, and after several months of moving sideways, began plunging in September 2000. The behavior of the equity market this year is very similar to what happened in 2000. Chart I-82018 Top = 2000 Peak?
2018 = 2000?
2018 = 2000?
This does not mean the current global equity selloff will last as long as or will be as severe as it was in 2000-2002, but the similarities between these episodes are noteworthy. Some investors have hypothesized that a blow-off phase in global stocks will likely occur when the Fed halts its tightening. Although this is a plausible argument, it is important to note that the rally in global stocks from the early 2016 lows to the tops reached this year was of similar magnitude to the surge that occurred in global equities from their 1998 lows to their peak in 2000. Is a widely expected blow-off phase in global share prices behind us? Only time will tell. Finally, the U.S. equal-weighted stock index as well as share prices of Goldman Sachs and J.P. Morgan - the two financial behemoths leveraged to financial markets - have exhibited negative technical chart patterns (Chart I-9). These are also warnings signals for U.S. share prices and risk assets worldwide. Chart I-9Bearish Technicals In U.S. Stocks
Bearish Technicals In U.S. Stocks
Bearish Technicals In U.S. Stocks
How far will this selloff go? Table I-2 compares the current selloff with the one in 2015, when global manufacturing and trade growth flirted with contraction and global cyclical sectors plunged due to a slowdown in China and EM. Table I-2Drawdown In Various Equity Indexes In 2015 And 2018
On Domino Effects And Portfolio Outflows
On Domino Effects And Portfolio Outflows
The current selloff is likely to be at least as bad, if not worse. This is because EM risk assets have entered this selloff more overbought than they were in 2015. We discuss the topic in the following section. Bottom Line: The selloff in EM risk assets and currencies has further to run. Stay short / underweight. EM Portfolio Outflows: Vulnerability Ranking The U.S. dollar is attempting to break out to new cyclical highs, and the odds are in its favor. Both the Fed's tightening and the ongoing global trade slowdown will foster the U.S. dollar rally. As EM currencies depreciate further, there will be considerable pressure on foreign investors to sell their EM assets. To gauge how vulnerable various developing countries are to foreign capital outflows, we have determined how individual countries rank with respect to their share of foreign equity and domestic bond holdings. Table I-3 ranks individual bourses by the share of foreign equity ownership in their largest companies accounting for at least two-thirds of market cap.4 Table I-3What Is The Share Of Foreign Ownership In Local Bourses?
On Domino Effects And Portfolio Outflows
On Domino Effects And Portfolio Outflows
This ranking illustrates that South Africa, the Czech Republic, Taiwan, Russia and Hungary have the highest share of foreign holdings, while Colombia, Malaysia, Chile, Thailand and Indonesia have the lowest. China is not a part of this list because its investable stocks are traded in various jurisdictions, making it difficult to define foreign investor ownership. To put the current penetration of foreign ownership into historical perspective, Table I-4 juxtaposes the current share of foreign stock ownership for select bourses with the one from March 2015 - just before the freefall in EM share prices. The share of foreign ownership is larger now than back in March 2015 for Brazil, Turkey and India, while it is lower for Indonesia and unchanged for Russia. Table I-4Share Of Foreign Ownership In Stocks: March 2015 Vs. Today
On Domino Effects And Portfolio Outflows
On Domino Effects And Portfolio Outflows
Foreign purchases of local currency bonds have been a major source of capital flows for developing countries as well. Critically, exchange rates substantially influence foreign investors' returns in EM local bonds, as illustrated in Chart I-10. Therefore, EM currency depreciation will lead to further outflows from their local bonds. Chart I-10Return On EM Domestic Bonds: In USD & Local Currency
Return On EM Domestic Bonds: In USD & Local Currency
Return On EM Domestic Bonds: In USD & Local Currency
Table I-5 demonstrates that foreigners hold the largest share of domestic bonds in Peru, the Czech Republic, South Africa, Indonesia and Mexico. Meanwhile, India, Brazil, Korea, Thailand and Hungary have the lowest share of foreign investors in their local currency bonds. Table I-5Share Of Domestic Bonds Held By Foreigners
On Domino Effects And Portfolio Outflows
On Domino Effects And Portfolio Outflows
The scatter plot in Chart I-11 brings together the share of foreign ownership of equities on the X axis with the share of foreign ownership of local currency bonds on the Y axis. Chart I-11EM Portfolio Outflow Vulnerability Assessment
On Domino Effects And Portfolio Outflows
On Domino Effects And Portfolio Outflows
Based on this diagram, South Africa, the Czech Republic, Peru, Mexico and Russia seem to be the most at risk of foreign portfolio outflows, while Colombia, Malaysia, Thailand and India seem to be the least vulnerable. These rankings are only one of the indicators we look at when forming our asset allocation across EM countries. We are currently overweight equity markets in Korea, Thailand, Brazil, Mexico, Colombia, Chile, Russia and central Europe. Our equity underweights are Indonesia, India, the Philippines, Hong Kong, South Africa and Peru. In the local-currency bond space, we favor Korea, Thailand, Brazil, Mexico, Chile, Russia and central Europe. The markets to underweight or avoid are Indonesia, the Philippines, Malaysia, South Africa and India. A complete list of our overweights and underweights across EM equities, fixed-income, credit and currencies as well as specific trade recommendations can be found each week at the end of our reports (please see pages 11-12). Arthur Budaghyan, Senior Vice President Emerging Markets Strategy arthurb@bcaresearch.com Stephan Gabillard, Senior Analyst stephang@bcaresearch.com 1 Most likely they reflect the frontrunning of U.S. import tariffs. 2 Please see Emerging Markets Strategy Weekly Report "Is The EM Pendulum About To Swing Back?" dated November 8, 2018, the link is available on page 13. 3 Please see Emerging Markets Strategy Weekly Report "EM: Sustained Decoupling, Or Domino Effect?" dated June 14, 2018, available at ems.bcaresearch.com. 4 We weighted each company's share of foreign stock ownership by their respective market cap weight. The result is an equity market cap-weighted proxy for the share of foreign stock ownership by country. All of these data are from Bloomberg Finance L.P. and dates as of November 12, 2018. Equity Recommendations Fixed-Income, Credit And Currency Recommendations