Emerging Markets
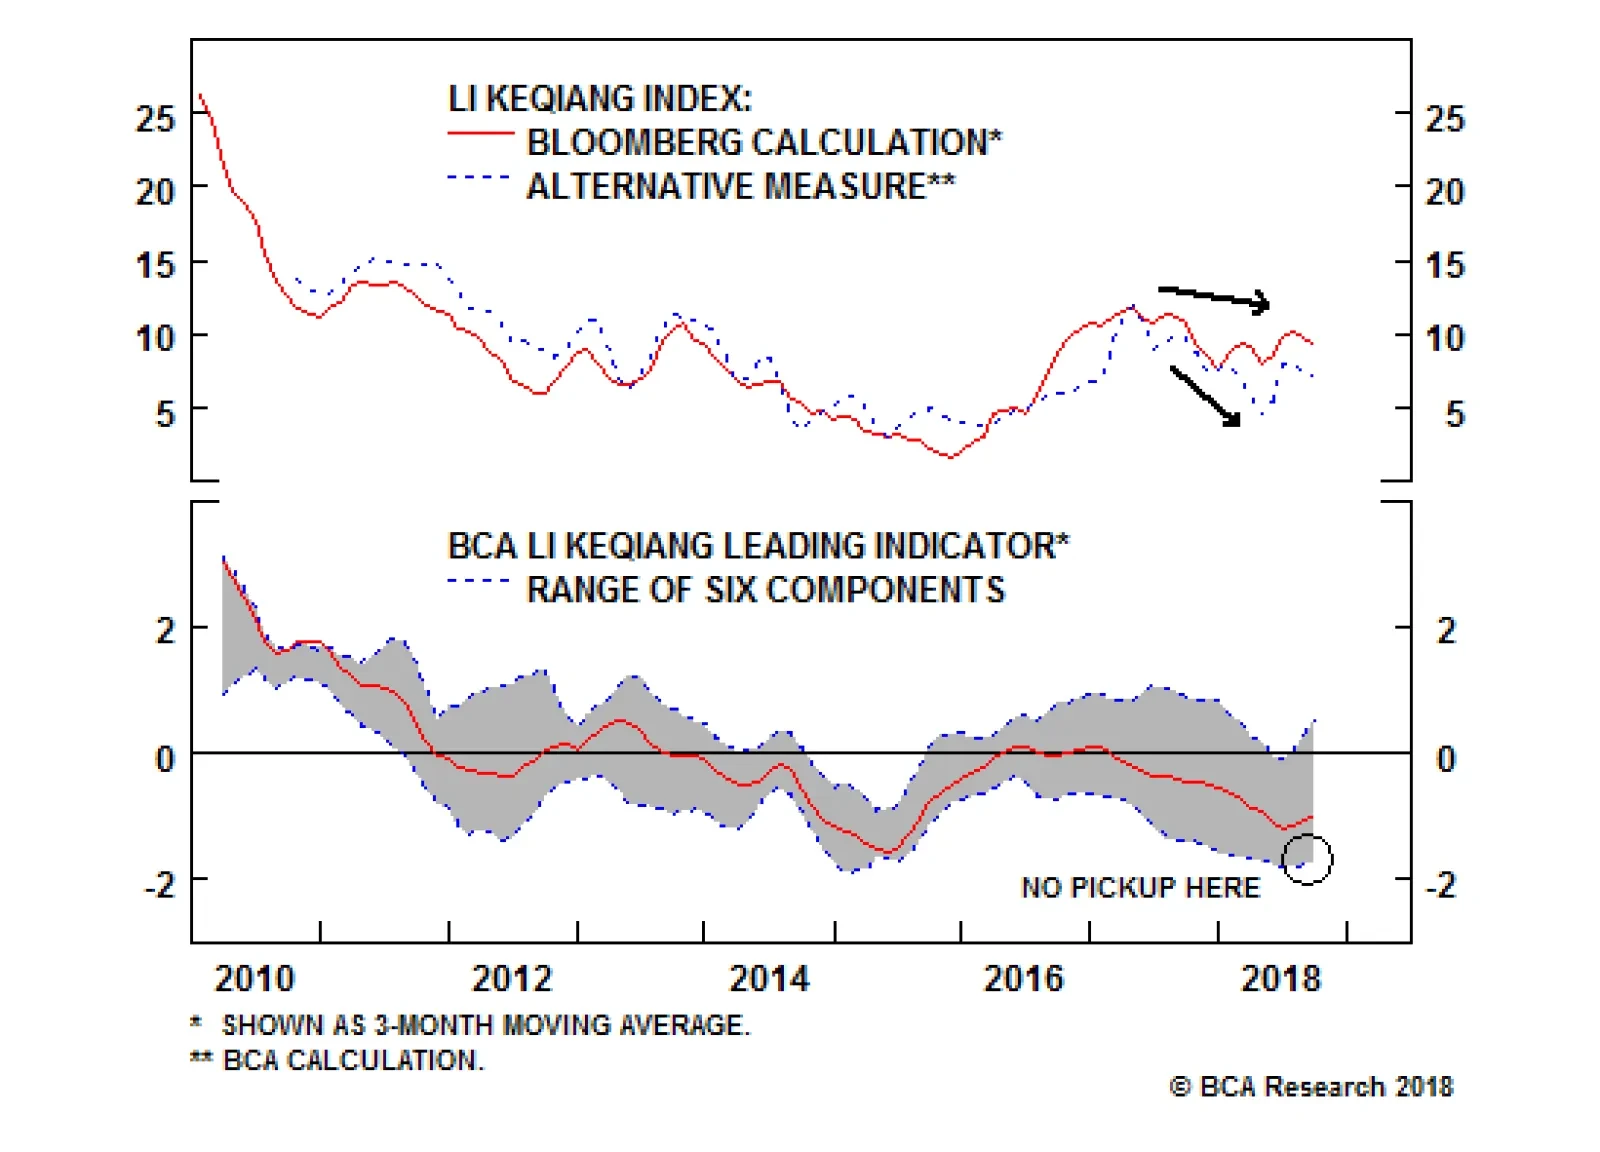
Bloomberg's measure of the Li Keqiang index (LKI) fell in September, confirming that activity in China's old economy is trending lower. A downtrend in industrial activity is even more apparent in our alternative LKI, which is constructed using total freight…

Highlights Gold's performance during the "Red October" equities sell-off, coupled with that of the most widely followed gold ratios (copper- and oil-to-gold), indicates investors and commodity traders are not pricing in a sharp contraction in global growth. These ratios are, however, picking up divergent trends in EM and DM growth (Chart of the Week). Chart of the WeekGold Ratios Lead Divergence Of Global Bond Yields
Gold Ratios Lead Divergence Of Global Bond Yields
Gold Ratios Lead Divergence Of Global Bond Yields
In the oil markets, the Trump Administration appears to have blinked on its Iran oil-export sanctions. On Monday, the U.S. granted waivers to eight "jurisdictions" - China, India, Japan, South Korea, Turkey, Italy, Greece and Taiwan - allowing them to continue to import Iranian oil for 180 days (Chart 2).1 The higher-than-expected number of waivers indicates the Trump Administration is aligned with our view that the global oil market is extremely tight, despite the recent production increases from OPEC 2.0 and the U.S.2 The U.S. State Department, in particular, apparently did not want to test the ability of OPEC spare capacity - mostly held by the Kingdom of Saudi Arabia (KSA) - to cover the combined losses of Iranian exports, Venezuela's collapse, and unplanned random production outages. No detail of volumes that will be allowed under these waivers was available as we went to press. Chart 2Waivers Will Restore Iranian Exports For 180 Days
Gold Ratios Wave Off "Red October" ... Iran Export Waivers Highlight Tight Market
Gold Ratios Wave Off "Red October" ... Iran Export Waivers Highlight Tight Market
Energy: Overweight. Iran's exports are reportedly down ~ 1mm b/d from April's pre-sanction levels of ~ 2.5mm b/d. We assume Iran's exports will fall 1.25mm b/d. Base Metals: Neutral. Close to 45k MT of copper was delivered to LME warehouses last week, according to Metal Bulletin's Fastmarkets. This was the largest delivery into LME-approved warehouses since April 7, 1989. Precious Metals: Neutral. Gold is trading close to fair value, while the most widely followed gold ratios - copper- and oil-to-gold - indicate global demand is holding up. Ags/Softs: Underweight. The USDA's crop report shows the corn harvest accelerated at the start of November, reaching 76% vs. 68% a year ago. Feature Gold Ratios Suggest Continued Growth Gold is trading mostly in line with our fair-value model, based on estimates using the broad trade-weighted USD and U.S. real rates (Chart 3).3 Safe-haven demand - e.g., buying prompted by the fear of a global slowdown or a deepening of the global equity rout dubbed "Red October" in the press - does not appear to be driving gold's price away from fair value. Neither is rising volatility in the equity markets. Chart 3Gold Trading Close To Fair Value
Gold Trading Close To Fair Value
Gold Trading Close To Fair Value
This assessment also is supported by the behavior of the widely followed gold ratios - copper-to-gold and oil-to-gold - which have become useful leading indicators of global bond yields and DM equity levels following the Global Financial Crisis (GFC). From 1995 up to the GFC, the gold ratios tracked changes in the nominal yields of 10-year U.S. Treasury bonds fairly closely. During this period, bond yields led the ratios as they expanded and contracted with global growth, as seen in Chart 4. Post-GFC, this relationship has reversed, and the gold ratios now lead global bond yields. Chart 4Gold Ratios Followed Global 10-Year Yields Pre-GFC
Gold Ratios Followed Global 10-Year Yields Pre-GFC
Gold Ratios Followed Global 10-Year Yields Pre-GFC
To understand this better, we construct two variables to isolate the common growth-related and idiosyncratic factors driving these ratios over the long term, particularly following the GFC.4 The common factor is labeled growth vs. safe-haven in the accompanying charts. It consistently tracks changes in global bond yields and DM equities, which also follow global GDP growth closely. If investors were fleeing economically sensitive assets and buying the safe haven of gold, the correlation between these variables would fall. As it happens, the strong correlation held up well following the "Red October" equities rout, indicating investors have not become overly risk-averse or fearful global growth is taking a downturn. When regressing our proxy for global 10-year yields and the U.S. 10-year yields on the growth vs. safe-haven factor, we found this factor explains a significantly larger part of the variation in global yields than U.S. bond yields alone (Chart 5).5 This common factor also is highly correlated with DM equity variability (Chart 6). Chart 5Gold Ratios' Common Factor Correlates With 10-Year Global Yields ...
Gold Ratios" Common Factor Correlates With 10-Year Global Yields...
Gold Ratios" Common Factor Correlates With 10-Year Global Yields...
Chart 6... And DM Equities
... And DM Equities
... And DM Equities
The second, or idiosyncratic, factor we constructed, captures the fundamental drivers that impact each of the gold ratios through supply-demand fundamentals in the copper and oil markets, and EM vs. DM economic performance. The latter is proxied using EM equity returns relative to DM returns.6 This analysis shows oil outperforms copper in periods of rising DM and slowing EM economic growth (Chart 7). Our analysis also indicates this idiosyncratic factor explains the divergence of the gold ratios seen in 2018: Copper demand is heavily influenced by EM demand, particularly China, which accounts for ~ 50% of global copper demand, but less than 15% of global oil demand. Oil demand - some 100mm b/d - is much more affected by the evolution of global GDP. Chart 7Relative DM Outperformance Drives Idiosyncratic Factors
Relative DM Outperformance Drives Idiosyncratic Factors
Relative DM Outperformance Drives Idiosyncratic Factors
At the moment, this idiosyncratic factor is driving both ratios apart because of: Relative economic underperformance of EM vs. DM, which favors oil over copper; and Persistent fears of escalating Sino-U.S. trade tensions, which are weighing on copper. Price-supportive supply-shocks in the oil market (sanctions on Iranian oil exports, falling Venezuelan production) and still-strong demand continue to drive oil prices. These dynamics likely will remain in place for the foreseeable future (1H19), which will favor oil over copper. Gold Ratios As Leading Indicators To round out our analysis, we looked at causal relationships between the performance of financial assets - EM and DM stocks and bonds - and the gold ratios.7 From 1995 to 2008, the causality ran from stocks and bond yields to our growth vs. safe-haven factor for the gold ratios. However, since 2009, causality has gone from the common factor to bond yields (Table 1). Table 1Granger-Causality Results
Gold Ratios Wave Off "Red October" ... Iran Export Waivers Highlight Tight Market
Gold Ratios Wave Off "Red October" ... Iran Export Waivers Highlight Tight Market
In our view, this suggests that the widely traded industrial commodities - copper and oil being the premier examples of such commodities - convey important economic information on the state of the global economy, as a result of their respective price-formation processes.8 It also suggests that in the post-GFC world, commodity markets assumed a larger role in discounting the impacts on the real economy of the numerous monetary experiments of central banks in the post-GFC era. Bottom Line: Our analysis of the factors driving the copper- and oil-to-gold ratios supports our view that demand for cyclical commodities - mainly oil and metals - is still strong. The behavior of our idiosyncratic factor leads us to favor oil over copper due to the rising EM vs. DM divergence, and the price-supportive supply dynamics in the oil market. Waivers On U.S. Sanctions Roil Oil Markets A week ago, we cautioned clients to "expect more volatility" on the back of news leaks the Trump administration was considering granting waivers to importers of Iranian crude oil, just before the sanctions kicked in this week. We certainly got it. Since hitting $86.1/bbl in early October, Brent crude oil prices have fallen $15.4/bbl (18%), as markets attempt to price in how much Iranian oil is covered by the sanctions and when importers can expect to see it arrive. On Monday, the U.S. granted waivers to eight "jurisdictions" - China, India, Japan, South Korea, Turkey, Italy, Greece and Taiwan - allowing them to continue to import Iranian oil for 180 days. This was a higher-than-expected number of waivers than we - and, given the volatility in prices - the market was expecting. This pushed down the elevated risk premium, which had been supporting prices over the past few months.9 The combined imports of these eight states is ~1.4mm b/d, according to Bloomberg estimates. The loss of these volumes in a market that was progressively tightening as OPEC 2.0 brought more of its spare capacity on line - while the USD continued to strengthen - likely would have driven the local-currency cost of fuel steadily higher (Chart 8). Because they are a de facto supply increase - albeit temporary, based on Trump Administration statements - they also will restrain price hikes in EM generally, barring an unplanned outage in 1H19 (Chart 9). Chart 8Waivers Will Contain Oil Price Rises In Local-Currency Terms
Waivers Will Contain Oil Price Rises In Local-Currency Terms
Waivers Will Contain Oil Price Rises In Local-Currency Terms
\ Chart 9Oil Prices Rises In EM Economies
Oil Prices Rises In EM Economies
Oil Prices Rises In EM Economies
No detail of volumes that will be allowed under these waivers was available as we went to press. Although it is obvious Iranian sales will recover some of the ~ 1mm b/d of exports lost in the run-up to the re-imposition of sanctions, it is not clear how much will be recovered. We believe the 180-day effective period for the waivers most likely was sought by KSA and Russia to give them time to bring on additional capacity to cover Iranian export losses. Markets will find out just how much spare capacity these states have in 1H19. By 2H19, additional production out of the U.S. from the Permian Basin will hit the market, as transportation bottlenecks are alleviated. This will allow U.S. exports to increase as well. However, it's not clear how much of this can get to export markets, given most of the dredging work needed to accommodate very large crude carriers (VLCCs) in the U.S. Gulf Coast has yet to be done. This could explain why the WTI - Cushing vs. WTI - Midland differentials are narrowing, while WTI spreads vs. Brent remain wide (Chart 10). Chart 10WTI Spreads Diverge
WTI Spreads Diverge
WTI Spreads Diverge
It is important to note the market still is exposed to greater-than-expected declines in Venezuela's production, and to any unplanned outage anywhere in the world. OPEC spare capacity is 1.3mm b/d, according to the EIA and IEA, and most of that is in KSA. Russia probably has another 200k b/d or so it can bring on line. These production increases both are undertaking are cutting deeply into spare capacity, as the Paris-based International Energy Agency noted in its October 2018 Oil Market Report: Looking ahead, more supply might be forthcoming. Saudi Arabia has stated it already raised output to 10.7 mb/d in October, although at the cost of reducing spare capacity to 1.3 mb/d. Russia has also signaled it could increase production further if the market needs more oil. Their anticipated response, along with continued growth from the US, might be enough to meet demand in the fourth quarter. However, spare capacity would fall to extremely low levels as a percentage of global demand, leaving the oil market vulnerable to major disruptions elsewhere (p. 17). Bottom Line: We expected continued crude-oil price volatility, as markets sort out the U.S. waivers on Iranian oil imports. The supply side of the market remains tight, and spare capacity is being eroded by production increases. We believe OPEC 2.0 will use the 180 days contained in the waivers to mobilize additional production. How much of this becomes available is yet to be determined. Hugo Bélanger, Senior Analyst Commodity & Energy Strategy HugoB@bcaresearch.com Robert P. Ryan, Senior Vice President Commodity & Energy Strategy rryan@bcaresearch.com 1 Please see "As U.S. starts oil sanctions against Iran, major buyers get waivers," published by reuters.com November 5, 2018. 2 OPEC 2.0 is a name we coined for the producer coalition led by KSA and Russia. Please see "Risk Premium In Oil Prices Rising; KSA Lifts West Coast Export Capacity" for our most recent supply-demand balances and price assessments, published October 25 by Commodity & Energy Strategy, and is available at ces.bcaresearch.com. 3 We use the USD broad trade-weighted index (TWIB) and U.S. inflation-adjusted real rates as explanatory variables in these models. As Chart 3 indicates, actual gold prices are in line with these variables. 4 The first factor accounts for ~ 80% of the variation in the gold ratios. The second idiosyncratic factor, which captures (1) supply-demand fundamentals in the oil and copper markets, and (2) divergences in global growth using EM vs. DM equities as proxies, accounts for the remaining ~ 20% of the variation. 5 Throughout this report, we proxy global yield by summing the yield on the 10-year German Bunds, Japanese Government Bonds and U.S. Treasurys. Please see BCA Research European Investment Strategy Weekly Report titled "The 'Rule Of 4' For Equities And Bonds," dated August 2, 2018. Available at eis.bcaresearch.com. The adjusted R2 in the global yield model is 0.94 compared to 0.88 for the U.S. Treasury model. 6 Using MSCI Emerging Market Index and MSCI Word Index price index. 7 To conduct this analysis, we use a statistical technique developed by the 2003 Nobel laureate, Clive Granger. The eponymous Granger-causality test is used to see whether one variable (i.e., time series) can be said to precede the other in terms of occurrence in time. This test measures information in the variables, particularly the effect of information from the preceding variable on the following variable. Please see Granger, C.W.J. (1980). "Testing for Causality, Personal Viewpoint,"Journal of Economic Dynamics and Control, 2 (pp. 329 - 352). 8 This assessment is consistent with the Efficient Market Hypothesis, the literature on which is countably infinite at this point. Sewell notes: "A market is said to be efficient with respect to an information set if the price 'fully reflects' that information set (Fama, 1970), i.e. if the price would be unaffected by revealing the information set to all market participants (Malkiel, 1992). The efficient market hypothesis (EMH) asserts that financial markets are efficient." The EMH has been debated and tested for decades. Please see Sewell, Martin (2011). "History of the Efficient Market Hypothesis," Research Note RN/11/04, published by University College London (UCL) Department of Computer Science. 9 Please see BCA Research Commodity & Energy Strategy Weekly Report "Risk Premium In Oil Prices Rising; KSA Lifts West Coast Export Capacity," published October 25, 2018. It is available at ces.bcaresearch.com. Investment Views and Themes Recommendations Strategic Recommendations Tactical Trades Commodity Prices and Plays Reference Table
Gold Ratios Wave Off "Red October" ... Iran Export Waivers Highlight Tight Market
Gold Ratios Wave Off "Red October" ... Iran Export Waivers Highlight Tight Market
Trades Closed in 2018 Summary of Trades Closed in 2017
Gold Ratios Wave Off "Red October" ... Iran Export Waivers Highlight Tight Market
Gold Ratios Wave Off "Red October" ... Iran Export Waivers Highlight Tight Market
Highlights China's old economy continues to slow in the leadup to the negative effect of U.S. import tariffs on Chinese export growth. Weaker trade data over the coming few months is likely to weigh further on investor sentiment. Our Li Keqiang leading indicator has risen off of its low, but not in a broad-based fashion. While the RMB depreciation has caused Chinese monetary conditions indexes to move sharply higher, money and credit growth remain weak. The recent breakdown in Chinese consumer staples stocks is an exception to the broad trend of low-beta sector outperformance. Fears have risen that the Chinese consumer is faltering, a concern that we will address in a Special Report next week. Feature Tables 1 and 2 highlight key developments in China's economy and its financial markets over the past month. On the growth front, the September update to Bloomberg's measure of the Li Keqiang index (LKI), and our newly created alternative LKI, makes it clear that China's economy continues to slow in the leadup to the negative shock from the external sector. The fact that both LKIs peaked early in 2017 highlights that the slowdown was precipitated by monetary tightening, which has only recently reversed. This easing in monetary conditions has likely improved the liquidity situation in China, but it remains to be seen whether it will prompt any meaningful acceleration in credit growth. Table 1The Trend In Domestic Demand, And The Outlook For Trade, Is Negative
Checking In On The Data
Checking In On The Data
Table 2Financial Market Performance Summary
Checking In On The Data
Checking In On The Data
From an investment strategy perspective, our recommendations remain unchanged. Despite deeply oversold conditions in China's stock markets, investors should avoid outright long positions for now due to the high odds of additional negative catalysts over the coming few months. We expect further weakness in the RMB, and expect USD-CNY to break through 7, suggesting that investors trading within the Chinese equity universe should only favor domestic stocks in currency-hedged terms for now. Finally, we continue to recommend an overweight stance towards low-beta sectors within the investable market, and believe that onshore corporate bonds are a buy despite pervasive default concerns. In reference to Tables 1 and 2, we provide several detailed observations concerning developments in China's macro and financial market data below: Bloomberg's measure of the Li Keqiang index (LKI) fell in September, confirming that activity in China's old economy is trending lower. A downtrend in industrial activity is even more apparent in our alternative LKI (Chart 1), which is constructed using total freight (instead of railway freight) and secondary industry electricity consumption (instead of overall electricity production). Chart 1China's Old Economy Is Slowing, Before The Trade Shock Hits
China's Old Economy Is Slowing, Before The Trade Shock Hits
China's Old Economy Is Slowing, Before The Trade Shock Hits
Our BCA Li Keqiang leading indicator has risen somewhat from its June low, driven by the two monetary conditions indexes (MCIs) included in the indicator. Both of these MCIs have, in turn, been driven by the substantial weakness in the RMB over the past four months. This sharp improvement has not been matched by the other components of the indicator: Chart 2 illustrates that the low end of the component range remains quite weak, in contrast to mid-2015 when both the high and low ends of the range were in a clear uptrend. Chart 2A Narrow Pickup In Our LKI Leading Indicator
A Narrow Pickup In Our LKI Leading Indicator
A Narrow Pickup In Our LKI Leading Indicator
Nearly all of the housing market indicators included in Table 1 are above their 12-month moving average, with the exception of pledged supplementary lending by the PBOC. Pledged supplementary lending itself sequentially increased quite meaningfully in October, underscoring that policymakers are keen to avoid the risk of overtightening the economy at a time when external demand is likely to weaken considerably. Still, smoothed residential sales volume growth has ticked down for two months in a row, suggesting that the extremely stretched pace of floor space started is likely to moderate over the coming months. Chinese export growth remains buoyant, despite several manufacturing and general business condition surveys showing a substantial deterioration over the past few months. As we go to press, China's October trade data has not yet been released, but we expect exports to weaken considerably in the coming few months. This could further weigh on investor sentiment if the slowdown exceeds the market's expectations. Within China's equity market universe, both domestic and investable stocks are deeply oversold in absolute terms, having declined 30% and 28% from their late-January peaks, respectively. Our technical indicators for both markets suggest that Chinese stocks have actually reached 1 standard deviation oversold, a level that has historically served as a platform for a rebound. Still, this speaks merely to the odds of a rebound, not when one will occur, and we can identify further negative catalysts for the equity over the coming 3 months. Avoid outright long positions for now. Despite having fallen significantly themselves, Taiwan and Hong Kong's equity markets have materially outperformed Chinese investable stocks since the beginning of the year (Chart 3). However, Taiwan's outperformance trend has recently moved in the opposite direction, as global investors begin to price in the fact that tensions between the U.S. and China are strategic and long-term in nature, not merely focused on trade.1 Taiwan is extremely exposed to this rivalry, warranting a higher equity risk premium. Chart 3Taiwan's Recent Outperformance Is Likely Reversing
Taiwan's Recent Outperformance Is Likely Reversing
Taiwan's Recent Outperformance Is Likely Reversing
Within Chinese investable stocks, low-beta equity sectors have in general continued to outperform over the past month. Our long MSC China low-beta sectors / short MSCI China trade is up 10% since initiation on June 27, and we expect further gains in the near-term. One exception to this trend is the relative performance of domestic and investable consumer staples stocks, which have recently underperformed their respective broad markets (Chart 4). The selloff has been sharp in the case of the domestic market, and has been in response to heightened fears that household consumption is weakening, a sector of the economy that heretofore had been reliably strong. In response to these developments, please note that BCA's China Investment Strategy service will be publishing a Special Report outlook detailing the outlook for the Chinese consumer next week. Chart 4Fears About Chinese Consumers Are Growing
Fears About Chinese Consumers Are Growing
Fears About Chinese Consumers Are Growing
The Chinese government bond yield curve has bull steepened considerably since the middle of the year, although it has oscillated without a trend over the past month. To the extent that traditional interpretations of the yield curve apply similarly to China, this suggests that domestic investors are pessimistic about the growth outlook, and expect monetary policy to remain easy. For now, this supports our recommendation to avoid outright long positions in Chinese stocks. Domestic Chinese and global investors remain deeply averse to Chinese corporate bonds, and we continue to disagree that aversion is warranted. Chart 5 highlights that the ChinaBond Corporate Bond total return index remains in a solid uptrend, even for bonds rated AA-. Incredibly, panel 2 of Chart 5 illustrates that global investors who have access to onshore corporate bonds have not lost money this year in unhedged terms, despite the material weakness in the RMB since the middle of the year. We continue to recommend onshore corporate bond positions over the coming 6-12 months.2 Chart 5Chinese Corporate Bonds: A Contrarian Long
Chinese Corporate Bonds: A Contrarian Long
Chinese Corporate Bonds: A Contrarian Long
CNY-USD rose materially last week, in response to speculation that the U.S. is readying a possible trade deal with China. Our geopolitical strategists recommend fading the odds of a near-term trade truce, implying that the odds of USD-CNY breeching 7 over the coming months are substantial. While economically meaningless in and of itself, the threshold is psychologically important and its failure to hold could spark meaningful renewed fears of uncontrolled capital outflow from China. Jonathan LaBerge, CFA, Vice President Special Reports jonathanl@bcaresearch.com 1 Please see Emerging Markets Strategy Weekly Report "EMs Are In A Bear Market," published October 18, 2018. Available at ems.bcaresearch.com. 2 Please see China Investment Strategy Weekly Report "Investing In The Middle Of A Trade War," published September 19, 2018. Available at cis.bcaresearch.com. Cyclical Investment Stance Equity Sector Recommendations
Highlights So What? Donald Trump's reelection depends on the timing of the next recession. Why? The midterm elections will not determine Trump's reelection chances. Rather, the timing of the next recession will. BCA's House View expects it by 2020. Otherwise, President Trump is favored to win. Trump may be downgrading "maximum pressure" on Iran, reducing the risk of a 2019 recession. Trade war with China, gridlock, and budget deficits are the most investment-relevant outcomes of U.S. politics in 2018-20. Feature The preliminary results of the U.S. midterm elections are in, with the Democrats gaining the House and failing to gain the Senate, as expected. Our view remains that the implications for investors are minimal. The policy status quo is now locked in - a gridlocked government is unlikely to produce a major change in economic policy over the next two years. While the election is to some extent a rebuke to Trump, this report argues that he remains the favored candidate for the 2020 presidential election - unless a recession occurs. A Preliminary Look At The Midterms First, the preliminary takeaways from the midterms, as the results come in: The Democrats took the House of Representatives, with a preliminary net gain of 27 seats, resulting in a 51%-plus majority, and this is projected to rise to 34 seats as we go to press Wednesday morning. This is above the average for midterm election gains by the opposition party, especially given that Republicans have held the advantage in electoral districting. Performance in the Midwest, other swing states, and suburban areas poses a threat to Trump and Republicans in 2020. Republicans held the Senate, with a net gain of at least two seats, for a 51%-plus majority. Democrats were defending 10 seats in states that Trump won in 2016. While Democrats did well in the Midwest, these candidates had the advantage of incumbency. On the state level, the Democrats gained a net seven governorships, two of them in key Midwestern states. The gubernatorial races were partly cyclical, as the Republicans had hit a historic high-water mark in governors' seats and were bound to fall back a bit. However, the Democratic victory in Michigan and Wisconsin, key Midwestern Trump states, is a very positive sign for the Democrats, since they were not incumbents in either state and had to unseat incumbent Governor Scott Walker in Wisconsin. (Their victory in Maine could also help them in the electoral college in 2020.) The governors' races also suggest that moderate Democrats are more appealing to voters than activist Democrats. Candidate Andrew Gillum's loss in Florida is a disappointment for the progressive wing of the Democratic Party.1 With the House alone, Democrats will not be able to push major legislation through. In the current partisan environment it will be nigh-impossible to reach the 60 votes needed to end debate in the Senate ("cloture"), and even then House Democrats will face a presidential veto. They will not be able to repeal Trump's tax cuts, re-regulate the economy, abandon the trade wars, resurrect Obamacare, or revive the 2015 Iranian nuclear deal. Like the Republicans after 2010, they will be trapped in the position of controlling only one half of one of the three constitutional branches. The most they can do is hold hearings and bring forth witnesses in an attempt to tarnish Trump's 2020 reelection chances. They may eventually bring impeachment articles against him, but without two-thirds of the Senate they cannot remove him from office (unless the GOP grassroots abandons him, giving senators permission to do so). U.S. equities generally move upward after midterm elections - including midterms that produce gridlock (Chart 1A & Chart 1B). However, the October selloff could drag into November. More worryingly, as Chart 1B shows, the post-election rally tends to peter out only six months after a gridlock midterm, unlike midterms that reinforce the ruling party. Chart 1AMidterm U.S. Elections Tend To Be Bullish...
Midterm U.S. Elections Tend To Be Bullish...
Midterm U.S. Elections Tend To Be Bullish...
Chart 1B... But Markets Lose Steam Six Months Post-Gridlock
... But Markets Lose Steam Six Months Post-Gridlock
... But Markets Lose Steam Six Months Post-Gridlock
However, the 2018 midterms could be mildly positive for the markets, as they do not portend any major new policies or uncertainty. Trump's proposed additional tax cuts would have threatened higher inflation and more Fed rate hikes, whereas House Democrats will not be able to raise taxes or cut spending alone. Bipartisan entitlement reform seems unlikely in 2018-20 given the acrimony of the two parties and structural factors such as inequality and populism. An outstanding question is health care, which Republicans left unresolved after failing to repeal Obamacare, and which exit polls show was a driving factor behind Democratic victories. Separately, as an additional marginal positive for risk assets, the Trump administration has reportedly granted eight waivers to countries that import Iranian oil. We have signaled that Trump's "maximum pressure" doctrine poses a key risk for markets due to the danger of an Iran-induced oil price shock. A shift toward more lax enforcement reduces the tail-risk of a recession in 2019 (Chart 2). Of course, the waivers will expire in 180 days and may be a mere ploy to ensure smooth markets ahead of the midterm election, so the jury is still out on this issue. Chart 2Rapid Increases In Oil Prices Tend To Precede Recessions
The 2020 U.S. Election: A "Way Too Soon" Forecast
The 2020 U.S. Election: A "Way Too Soon" Forecast
This brings us to the main focus of this report: what do the midterms suggest about the 2020 election? Bottom Line: The midterm elections have produced a gridlocked Congress. Trump can continue with his foreign policy, most of his trade policy, his deregulatory decrees, and his appointment of court judges with limited interference from House Democrats. The only thing the Democrats can prevent him from doing is cutting taxes further. He tends to agree with Democrats on the need for more spending! While the U.S. market could rally on the back of this result, we do not see U.S. politics being a critical catalyst for markets going forward. On balance, a gridlocked result brings less uncertainty than would otherwise be the case, which is positive for markets in the short term. The Midterms And The 2020 Election There is a weak relationship at best between an opposition party's gains in the midterms and its performance in the presidential election two years later. Given that the president's party almost always loses the midterms - and yet that incumbent presidents tend to be reelected - the midterm has little diagnostic value for the presidential vote, as can be seen in recent elections (Chart 3A & Chart 3B). Chart 3AMidterm Has Little Predictive Power For Presidential Popular Vote ...
The 2020 U.S. Election: A "Way Too Soon" Forecast
The 2020 U.S. Election: A "Way Too Soon" Forecast
Chart 3B... Nor For Presidential Electoral College Vote
The 2020 U.S. Election: A "Way Too Soon" Forecast
The 2020 U.S. Election: A "Way Too Soon" Forecast
Nevertheless, historian Allan Lichtman has shown that since 1860, a midterm loss is marginally negative for a president's reelection chances.2 And for Republicans in recent years, losses in midterm elections are very weakly correlated with Republican losses of seats in the electoral college two years later (Chart 4). Chart 4Republican Midterm Loss Could Foreshadow Electoral College Losses
The 2020 U.S. Election: A "Way Too Soon" Forecast
The 2020 U.S. Election: A "Way Too Soon" Forecast
Still, this midterm election does not give any reason to believe that Trump's reelection chances have been damaged any more than Ronald Reagan's were after 1982, or Bill Clinton's after 1994, or Barack Obama's after 2010. All three of these presidents went on to a second term. A midterm loss simply does not stack the odds against reelection. Why are midterm elections of limited consequence for the president? They are fundamentally different from presidential elections. For instance, "the buck stops here" applies to the president alone, whereas in the midterms voters often seek to keep the president in check by voting against his party in Congress.3 Despite the consensus media narrative, the president is not that unpopular. Trump's approval rating today is about the same as that of Clinton and Obama at this stage in their first term (Chart 5). This week's midterm was not a wave of "resistance" to Trump so much as a run-of-the-mill midterm in which the president's party lost seats. Its outcome should not be overstated. Bottom Line: There is not much correlation between midterms and presidential elections. The best historians view it as a marginal negative for the incumbent. This result is not a mortal wound for Trump. Chart 5President Trump Is Hardly Losing The Popularity Contest
The 2020 U.S. Election: A "Way Too Soon" Forecast
The 2020 U.S. Election: A "Way Too Soon" Forecast
2020: The Recession Call Is The Election Call The incumbent party has lost the White House every single time that a recession occurred during the campaign proper (Chart 6).4 The incumbent party has lost 50%-60% of the time if recession occurred in the calendar year before the election or in the first half of the election year. Chart 6A 2020 Recession Is Trump's Biggest Threat
A 2020 Recession Is Trump's Biggest Threat
A 2020 Recession Is Trump's Biggest Threat
This is a problem for President Trump because the current economic expansion is long in the tooth. In July 2019, it will become the longest running economic expansion in U.S. history, following the 1991-2001 expansion. The 2020 election will occur sixteen months after the record is broken, which means that averting a recession over this entire period will be remarkable. BCA's House View holds that 2020 is the most likely year for a recession to occur. The economy is at full employment, inflation is trending upwards, and the Fed's interest rate hikes will become restrictive sometime in 2019. The yield curve could invert in the second half of 2019 - and inversion tends to precede recession by anywhere from 5-to-16 months (Table 1). No wonder Trump has called the Fed his "biggest threat."5 Table 1Inverted Yield Curve Is An Ominous Sign
The 2020 U.S. Election: A "Way Too Soon" Forecast
The 2020 U.S. Election: A "Way Too Soon" Forecast
The risks to this 2020 recession call are probably skewed toward 2021 instead of 2019. The still-positive U.S. fiscal thrust in 2019 and possibly 2020 and the Trump administration's newly flexible approach to Iran sanctions, if maintained, reduce the tail-risk of a recession in 2019. If there is not a recession by 2020, Trump is the favored candidate to win. First, incumbents win 69% of all U.S. presidential elections. Second, incumbents win 80% of the time when the economy is not in recession, and 76% of the time when real annual per capita GDP growth over the course of the term exceeds the average of the previous two terms, which will likely be the case in 2020 unless there is a recession (Chart 7). Chart 7Relative Economic Performance Could Give Trump Firepower
Relative Economic Performance Could Give Trump Firepower
Relative Economic Performance Could Give Trump Firepower
The above probabilities are drawn from the aforementioned Professor Allan Lichtman, at American University in Washington D.C., who has accurately predicted the outcome of every presidential election since 1984 (except the disputed 2000 election). Lichtman views presidential elections as a referendum on the party that controls the White House. He presents "13 Keys to the Presidency," which are true or false statements based on historically derived indicators of presidential performance. If six or more of the 13 keys are false, the incumbent will lose. On our own reading of Lichtman's keys, Trump is currently lined up to lose a maximum of four keys - two shy of the six needed to unseat him (Table 2). This is a generous reading for the Democrats: Trump's party has lost seats in the midterm election relative to 2014; his term has seen sustained social unrest; he is tainted by major scandal; and he is lacking in charisma. Yet on a stricter reading Trump only has one key against him (the midterm). Table 2Lichtman's Thirteen Keys To The White House*
The 2020 U.S. Election: A "Way Too Soon" Forecast
The 2020 U.S. Election: A "Way Too Soon" Forecast
What would it take to push Trump over the edge? Aside from a recession (which would trigger one or both of the economic keys against him), he would need to see two-to-four of the following factors take shape: a serious foreign policy or military failure, a charismatic Democratic opponent in 2020, a significant challenge to his nomination within the Republican Party, or a robust third party candidacy emerge. In our view, none of these developments are on the horizon yet, though they are probable enough. For instance, it is easy to see Trump's audacious foreign policy on China, Iran, and North Korea leading to a failure that counts against him. Thus, as things currently stand, Trump is the candidate to beat as long as the economy holds up. What about impeachment and removal from office prior to 2020? As long as Trump remains popular among Republican voters he will prevent the Senate from turning against him (Chart 8). What could cause public opinion to change? Clear, irrefutable, accessible, "smoking gun" evidence of personal wrongdoing that affected Trump's campaigns or duties in office. Nixon was not brought down until the Watergate tapes became public - and that required a Supreme Court order. Only then did Republican opinion turn against him and expose him to impeachment and removal - prompting him to resign. Chart 8Trump Cannot Be Removed From Office
The 2020 U.S. Election: A "Way Too Soon" Forecast
The 2020 U.S. Election: A "Way Too Soon" Forecast
All that being said, Trump tends to trail his likeliest 2020 adversaries in one-on-one opinion polling. Given our recession call, we would not dispute online betting markets giving Trump a less-than-50% chance of reelection at present (Chart 9). The Democratic selection process has hardly begun: e.g. Joe Biden could have health problems, and Michelle Obama, Oprah Winfrey, or other surprise candidates could decide to run. The world will be a different place in 2020. Bottom Line: The recession call is the election call. If BCA is right about a recession by 2020, then Trump will lose. If we are wrong, then Trump is favored to win. Chart 9A Strong Opponent Has Yet To Emerge
The 2020 U.S. Election: A "Way Too Soon" Forecast
The 2020 U.S. Election: A "Way Too Soon" Forecast
Is It Even Possible For Trump To Win Again? Election Scenarios Is it demographically possible for Trump to win? Yes. In 2016 BCA dubbed Trump's electoral strategy "White Hype," based on his apparent attempt to increase the support and turnout of white voters, primarily in "Rust Belt" battleground states. While Republican policy wonks might have envisioned a "big tent" Republican Party for the future, demographic trends in 2016 suggested that this strategy was premature. Indeed, drawing from a major demographic study by the Center for American Progress and other Washington think tanks,6 we found that a big increase in white turnout and support was the only 2016 election scenario in which a victory in both the popular vote and electoral college vote was possible. In other words, while "Minority Outreach" have worked as a GOP strategy in the future, Donald Trump's team was mathematically correct in realizing that only White Hype would work in the actual election at hand. This strategy did not win Trump the popular vote, but it did secure him the requisite electoral college seats, notably from the formerly blue of Wisconsin, Michigan, and Pennsylvania. Comparing the 2016 results with our pre-election projections confirms this point: Trump won the very swing states where he increased white GOP support and lost the swing states where he did not. Pennsylvania is the notable exception, but he won there by increasing white turnout instead of white GOP support.7 Can Trump do this again? Yes, but not easily. Map 1 depicts the 2016 election results with red and blue states, plus the percentage swing in white party support that would have been necessary to turn the state to the opposite party (white support for the GOP is the independent variable). In Michigan, a 0.3% shift in the white vote away from Republicans would have deprived Trump of victory; in Wisconsin and Pennsylvania, a 0.8% shift would have done the same; in Florida, a 1.5% change would have done so. Map 1The 'White Hype' Strategy Narrowly Worked In 2016
The 2020 U.S. Election: A "Way Too Soon" Forecast
The 2020 U.S. Election: A "Way Too Soon" Forecast
Critically, the country's demographics have changed significantly since 2016 - to Trump's detriment. The white eligible voting population in swing states will have fallen sharply from 81% of the population to 76% of the population by 2020 (Chart 10). Chart 10Demographic Shift Does Not Favor Trump
The 2020 U.S. Election: A "Way Too Soon" Forecast
The 2020 U.S. Election: A "Way Too Soon" Forecast
Thus, to determine whether Trump still has a pathway to victory, we looked at eight scenarios, drawing on the updated Center for American Progress study. The assumptions behind the scenarios in Table 3 are as follows: Status Quo - This replicates the 2016 result and projects it forward with 2020 demographics. 2016 Sans Third Party - Replicates the 2016 result but normalizes the third party vote, which was elevated that year. Minority Revolt - In this scenario, Hispanics, Asians, and other minorities turn out in large numbers to support Democrats, even with white non-college educated voters supporting Republicans at a decent rate. The Kanye West Strategy - Trump performs a miracle and generates a swing of minority voters in favor of Republicans. Blue Collar Democrats - White non-college-educated support returns to 2012 norms, meaning back to Democrats. Romney's Ghost - White college-educated support returns to 2012 levels. White Hype - White non-college-educated support swings to Republicans. Obama versus Trump - White college-educated voters ally with minorities in opposition to a surge in white non-college-educated voters for Republicans. Table 3Assumptions For Key Electoral Scenarios In 2020
The 2020 U.S. Election: A "Way Too Soon" Forecast
The 2020 U.S. Election: A "Way Too Soon" Forecast
The results show that Trump's best chance at remaining in the White House is still White Hype, as it is still the only scenario in which Trump can statistically win a victory in the popular vote (Chart 11). Another pathway to victory is the "2016 Sans Third Party" scenario. But this scenario still calls for White Hype, since a third party challenger is out of his hands (Chart 12).8 Chart 11'White Hype' May Be Only Way To Secure Both Popular And Electoral College Vote...
The 2020 U.S. Election: A "Way Too Soon" Forecast
The 2020 U.S. Election: A "Way Too Soon" Forecast
Chart 12... Although Moving To The Center Could Still Yield Electoral College Vote
The 2020 U.S. Election: A "Way Too Soon" Forecast
The 2020 U.S. Election: A "Way Too Soon" Forecast
However, the data show that Trump cannot win merely by replicating his white turnout and support from 2016, due to demographic changes wiping away the thin margins in key swing states. He needs some additional increases in support. These increases will ultimately have to be culled from his record in office - which reinforces the all-important question of the timing of recession, but also raises the question of whether Trump will move to the center to woo the median voter. In the "Kanye West" and "Romney's Ghost" scenarios, Trump wins the electoral college by broadening his appeal to minorities and college-educated white voters. This may sound far-fetched, but President Clinton reinvented himself after the "Republican Revolution" of 1994 by compromising with Republicans in Congress. The slim margins in the Midwest suggest that the probability of Trump shifting to the middle is not as low as one might think. Especially if there is no recession. Independents remain the largest voting block - and they have not lost much steam, if any, since 2016. Moreover, the number of independents who lean Republican is in an uptrend (Chart 13). Without a recession, or a failure on Lichtman's keys, Trump will likely broaden his base. Chart 13Trump Shows Promise Among Independents
Trump Shows Promise Among Independents
Trump Shows Promise Among Independents
Bottom Line: Trump needs to increase white turnout and GOP support beyond 2016 levels in order to win 2020. Demographics will not allow a simple repeat of his 2016 performance. However, he may be able to generate the requisite turnout and support by moving to the center, courting college-educated whites and even minorities. His success will depend on his record in office. Investment Implications What are the implications of the above findings for 2018-20 and beyond? The Rust Belt states of Michigan, Pennsylvania, and Wisconsin will become pseudo-apocalyptic battlegrounds in 2020. The Democrats must aim to take back all three to win the White House, as they cannot win with just two alone.9 They are likely to focus on these states because they are erstwhile blue states and the vote margin is so slim that the slightest factors could shift the balance - meaning that Democrats could win here without a general pro-Democratic shift in opinion that hurts Trump in other key swing states such as Florida, North Carolina, or Arizona. The "Blue Collar Democrat" scenario, for instance, merely requires that white non-college-educated voters return to their 2012 level of support for Democrats. Joe Biden is the logical candidate, health permitting, as he is from Pennsylvania and was literally on the ballot in 2012! Moreover, these states are the easiest to flip to the Democratic side via the woman vote. In Michigan, a 0.5% swing of women to the Democrats would have turned the state blue again; in Pennsylvania that number is 1.6% and in Wisconsin it is 1.7% (Table 4). These are the lowest of any state. Women from the Midwest or with a base in the Midwest - such as Michelle Obama or Oprah Winfrey - would also be logical candidates. Table 4Women Voters May Hold The Balance
The 2020 U.S. Election: A "Way Too Soon" Forecast
The 2020 U.S. Election: A "Way Too Soon" Forecast
The Democrats could also pursue a separate or complementary strategy by courting African American turnout and support, especially in Florida, Georgia, and North Carolina. But it is more difficult to flip these states than the Midwestern ones. With the Rust Belt as the fulcrum of his electoral strategy and reelection, Trump has a major incentive to maintain economic nationalism over the coming two years. Trump may be more pragmatic in the use of tariffs, and will certainly engage in talks with China and others, but he ultimately must remain "tough" on trade. He has fewer constraints in pursuing trade war with China than with Europe. For the same Rust Belt reason, the Democrats, if they get into the Oval Office, will not be overly kind to the "butchers of Beijing," as President Clinton called the Chinese leadership in the 1992 presidential campaign (after the 1989 Tiananmen Square incident). Hence we are structurally bearish U.S.-China relations and related assets. Interestingly, if Trump moves to the middle, and tones down "white nationalism" in pursuit of college-educated whites and minorities, then he would have an incentive to dampen the flames of social division ahead of 2020. The key is that in an environment without recession, Trump has the option of courting voters on the basis of his economic and policy performance alone. Whereas if he is seen fanning social divisions, it could backfire, as Democrats could benefit from a sense of national crisis and instability in a presidential election. Either way, culture wars, controversial rhetoric, identity politics, unrest, and violence will continue in the United States as the fringes of the political spectrum use identity politics and wedge issues to rile up voters.The question is how the leading parties and their candidates handle it. What about after 2020? Are there any conclusions that can be drawn regardless of which party controls the White House? The two biggest policy certainties are that fiscal spending will go up and that generational conflict will rise. On fiscal spending, Trump was a game changer by removing fiscal hawkishness from the Republican agenda. Democrats are not proposing fiscal responsibility either. The most likely areas of bipartisan legislation in 2018-20 are health care and infrastructure - returning House Speaker Nancy Pelosi mentioned infrastructure several times in her election-night speech - which would add to the deficit. The deficit is already set to widen sharply, judging by the fact that it has been widening at a time when unemployment is falling. This aberration has only occurred during the economic boom of the 1950s and the inflation and subsequent stagflation beginning in the late 1960s (Chart 14). The current outlook implies a return of the stagflationary scenario. In the late 1960s, the World War I generation was retiring, lifting the dependent-to-worker ratio and increasing consumption relative to savings. Today, as Peter Berezin of BCA's Global Investment Strategy has shown, the Baby Boomers are retiring with a similar impact. Chart 14The Deficit Is Blowing Out Even Without A Recession
The Deficit Is Blowing Out Even Without A Recession
The Deficit Is Blowing Out Even Without A Recession
Trump made an appeal to elderly voters in the midterms by warning that unfettered immigration and Democratic entitlement expansions would take away from existing senior benefits. By contrast, Democrats will argue that Republicans want to cut benefits for all to pay for tax cuts for the rich, and will try to activate Millennial voters on a range of progressive issues that antagonize older voters. The result is that policy debates will focus more on generational differences. Mammoth budget deficits - not to mention trade war - will be good for inflation, good for gold, and a headwind for U.S. government bonds and the USD as long as the environment is not recessionary. The greatest policy uncertainties are health care and immigration. These are the two major outstanding policy issues that Republicans and Democrats will vie over in 2018 and beyond. While President Trump could achieve something with the Democrats on either of these issues with some painful compromises, it is too soon to have a high conviction on the outcome. But assuming that over the coming years some immigration restrictions come into play and that some kind of public health care option becomes more widely available, there are two more reasons to expect inflation to trend upward on a secular basis. Also on a secular basis, defense stocks stand to benefit from geopolitical multipolarity, especially U.S.-China antagonism. Tech stocks stand to suffer due to the trade war and an increasingly bipartisan consensus that this sector needs to be regulated. Matt Gertken, Vice President Geopolitical Strategy mattg@bcaresearch.com Marko Papic, Senior Vice President Chief Geopolitical Strategist marko@bcaresearch.com 1 Furthermore, victories on the state level, if built upon in the 2020 election, could give the Democrats an advantage in gerrymandering, i.e. electoral redistricting, which is an important political process in the United States. 2 Please see Allan J. Lichtman, Predicting The Next President: The Keys To The White House 2016 (New York: Rowman and Littlefield, 2016). 3 Please see Joseph Bafumi, Robert S. Erikson, and Christopher Wlezien, "Balancing, Generic Polls and Midterm Congressional Elections," The Journal of Politics 72:3 (2010), pp. 705-19. 4 Please see footnote 2 above. 5 Please see Sylvan Lane, “Trump says Fed is his ‘biggest threat,’ blasting own appointees,” The Hill, October 16, 2018, available at thehill.com. 6 Please see Rob Griffin, Ruy Teixeira, and William H. Frey, "America's Electoral Future: Demographic Shifts and the Future of the Trump Coalition," Center for American Progress, dated April 14, 2018, available at www.americanprogress.org. 7 In several cases, he did not have to lift white support by as much as we projected because minority support for the Democrats dropped off after Obama left the stage. 8 Interestingly, however, this scenario would result in an electoral college tie! Since the House would then vote on a state delegation basis, it would likely hand Trump the victory (and Pence would also win the Senate). 9 However, if they win Pennsylvania plus one electoral vote in Maine, they can win the electoral college with either Michigan or Wisconsin.
Highlights Investors are worrying too much about the things that caused the global financial crisis, and not enough about those that could cause the next downturn. Despite the recent patch of soft data, the U.S. housing market is in good shape. Go long homebuilders relative to the S&P 500. Imbalances in the corporate debt market have increased, but are not severe enough to generate systemic economic distress. U.S. rates will need to rise quite a bit more than the market anticipates before the economy slows by enough to force the Fed to back off. The combination of a stronger dollar and inadequate Chinese stimulus will continue to pressure emerging markets. Even Brazil's pro-capitalist new president may not be able to reverse the country's bleak fiscal dynamics. Our MacroQuant model, which predicted the correction, points to further near-term downside risk for global equities. The cyclical (12-to-18 month) outlook looks much better, however. Feature The Market's Maginot Line One of the most reliable ways to make money as an investor is to figure out the market's collective biases and trade against them. Behavioral economists have long noted that people tend to assign too much weight to recent experience in taking decisions. As a result, in finance, as in military strategy, there is a constant temptation to fight the last war. The last war policymakers waged was against the scourge of deflation that followed the housing bust and financial crisis. For much of the past decade, investors have held a magnifying glass over anything that could possibly resemble the conditions that led up to the Global Financial Crisis. While such behavior is understandable, it is misplaced. History suggests that both lenders and borrowers tend to act prudently for years, if not decades, following major financial crises. Mistakes are still made, but they are different mistakes. People overcompensate. They obsess about the past rather than focusing on the future. U.S. Housing Is Okay There is no denying that the U.S. housing market has softened this year (Chart 1). Housing starts, building permits, and home sales have all fallen. Residential investment has subtracted from GDP growth over three consecutive quarters. Chart 1Housing Has Been A Drag On The U.S. Economy This Year
Housing Has Been A Drag On The U.S. Economy This Year
Housing Has Been A Drag On The U.S. Economy This Year
There is little mystery as to why the housing market has been on the back foot. The Trump tax bill capped the deduction on state and local property taxes, while reducing the amount of mortgage debt on which homeowners can deduct interest payments from $1 million to $750,000. This had a negative effect on housing activity, especially in high-tax Democrat-leaning states with elevated real estate prices. More importantly, mortgage rates have risen by over 100 basis points since last August. Chart 2 shows that home sales and construction almost always decline after mortgage rates rise. In this respect, the weakness in housing activity is reminiscent of the period following the taper tantrum, when housing activity also slowed sharply. Chart 2No Mystery Why U.S. Housing Has Been Weak...
No Mystery Why U.S. Housing Has Been Weak...
No Mystery Why U.S. Housing Has Been Weak...
We do not expect mortgage rates to fall from current levels. But they are not going to rise at the same pace as they have over the past year. Thus, while the headwinds from higher financing costs will not disappear, they will abate to some extent. Fundamentally, the housing market is on solid ground (Chart 3). Mortgage rates are still well below their historic average. Home prices have risen considerably, but do not appear excessively stretched compared to rents or incomes. Unlike in 2006, the home vacancy rate is near its historic lows. Residential investment stands at only 3.9% of GDP, compared with a peak of 6.7% of GDP in the second half of 2005. The average age of the residential capital stock has risen by nearly five years since 2006, the largest increase since the Great Depression. With household formation rebounding briskly from its post-recession lows, homebuilders are still arguably not churning out enough new homes. Chart 3A...But Fundamentals Are Still In Good Shape (I)
...But Fundamentals Are Still In Good Shape (I)
...But Fundamentals Are Still In Good Shape (I)
Chart 3B...But Fundamentals Are Still In Good Shape (II)
...But Fundamentals Are Still In Good Shape (II)
...But Fundamentals Are Still In Good Shape (II)
Mortgage lenders have learned from past mistakes (Chart 4). While lending standards have eased modestly over the past 4 years, underwriting standards have remained high. The average FICO score for new borrowers is more than 40 points above pre-recession levels. The Urban Institute Housing Credit Availability index, which measures the percentage of home purchase loans that are likely to default over the next 90 days, is at reassuringly low levels. This is particularly the case for private-label mortgages, whose default risk has hovered at just over 2% during the past few years, down from a peak of 22% in 2006. Moreover, banks today hold much more high-quality capital than in the past, which gives them additional space to absorb losses (Chart 5). Chart 4Lending Standards Have Been Tight, But Are Starting To Loosen
Lending Standards Have Been Tight, But Are Starting To Loosen
Lending Standards Have Been Tight, But Are Starting To Loosen
Chart 5U.S. Banks Are Well Capitalized
U.S. Banks Are Well Capitalized
U.S. Banks Are Well Capitalized
With all this in mind, we are initiating a new strategic trade to go long U.S. homebuilders relative to the S&P 500.1 Corporate Debt: How Big Are The Risks? Unlike household debt, U.S. corporate debt has risen over the past decade and now stands at a record high level as a share of GDP. The quality of the lending has also been less than pristine, as evidenced by the proliferation of "covenant lite" loans. The interest coverage ratio for the economy as a whole - defined as the volume of profits corporations generate for every dollar of interest paid - is still above its historic average (Chart 6). However, this number is skewed by a few mega-cap tech companies that hold a lot of cash and have little debt. Chart 6Interest Coverage Looks Relatively High
Interest Coverage Looks Relatively High
Interest Coverage Looks Relatively High
My colleague Mark McClellan, who writes our monthly Bank Credit Analyst publication, has shown that the interest coverage ratio for companies comprising the Bloomberg Barclays index would drop close to the lows of the Great Recession if interest rates were to rise by a mere 100 basis points across the corporate curve. The damage would be far worse if profits also fell by 25% in this scenario.2 While the corporate debt market has become increasingly frothy, it does not pose an imminent danger to the economy. There are several reasons for this. First, while U.S. corporate debt is high in relation to the past, it is still quite low in comparison with many other economies (Chart 7). The ratio of corporate debt-to-GDP, for example, is 30 percentage points higher in the euro area. This suggests that U.S. businesses still have the "carrying capacity" to take on additional debt. Chart 7U.S. Corporate Debt Is Not That High By Global Standards
U.S. Corporate Debt Is Not That High By Global Standards
U.S. Corporate Debt Is Not That High By Global Standards
Second, the average maturity of U.S. corporate debt has risen over the past decade, with an increasing share of companies opting for fixed over floating-rate borrowings. This implies that it will take a while for the effect of higher rates to make their way through the system. Third, and perhaps most importantly, corporate bonds are generally held by non-leveraged investors such as pension funds, insurance companies, and ETFs. Bank loans account for only 18% of nonfinancial corporate-sector debt, down from 40% in 1980 (Chart 8). The share of leveraged loans held by banks has declined from about 25% a decade ago to less than 10% today. Chart 8Banks Have Reduced Their Exposure To The Corporate Sector
Banks Have Reduced Their Exposure To The Corporate Sector
Banks Have Reduced Their Exposure To The Corporate Sector
Tellingly, we already had a dress rehearsal for what a corporate debt scare might look like. Credit spreads spiked in 2015. Default rates rose, but the knock-on effects to the financial system were minimal (Chart 9). This suggests that corporate America could withstand quite a bit of monetary tightening without buckling under the pressure. Chart 9The 2015 Debt Scare Did Not Topple The Economy
The 2015 Debt Scare Did Not Topple The Economy
The 2015 Debt Scare Did Not Topple The Economy
Government Debt: No Worries... Yet If the risks posed by both the housing market and corporate debt market are contained, what about the risks posed by soaring government debt? The long-term fiscal outlook is certainly bleak, but the near-term risks are low.3 President Trump's tweets aside, the U.S. has an independent central bank which has been able to keep inflation expectations well anchored. The U.S. private sector is also running a financial surplus at the moment, meaning that it earns more than it spends (Chart 10). Not only does this make the economy more resilient, it also provides the government with additional savings with which to finance its fiscal deficit. Chart 10The U.S. Private Sector Is A Net Saver
The U.S. Private Sector Is A Net Saver
The U.S. Private Sector Is A Net Saver
The private sector's financial balance will deteriorate over the next two years as household savings decline and corporate investment rises. This will put upward pressure on Treasury yields. However, if rising yields are reflective of stronger aggregate demand, this is unlikely to derail the economy. When Things Break Recessions are usually caused when the Fed raises rates by enough to undermine spending on interest rate-sensitive purchases such as housing, or when higher rates prick an asset bubble just waiting to burst. Given the lack of clear imbalances either in the real economy or financial markets, the Fed may have to raise rates significantly more than the market is currently anticipating. In fact, far from having to press the pause button midway through next year, our baseline expectation is that the Fed will expedite the pace of rate hikes in late 2019 as inflation finally starts to accelerate. Aggressive Fed rate hikes combined with an incrementally less expansionary fiscal policy will sow the seeds of a recession in late 2020 or 2021. Before the next U.S. downturn arrives, the dollar will have strengthened further. A resurgent greenback will cast a long shadow over emerging markets and commodity producers. As we discussed last week, China is unlikely to save the day by launching a massive stimulus program of the sort that it orchestrated in both 2009 and 2015.4 True, not all emerging markets are equal. Emerging Asia is more resilient now than it was two decades ago. Thailand, for example, was patient zero for the Asian crisis in 1997. Today, it sports a current account surplus of over 10% of GDP and low levels of external debt. This resilience will not prevent Asian economies from experiencing slower growth on the back of weaker Chinese demand, but it will prevent a full-blown balance of payments crisis from spiraling out of control. In contrast to Emerging Asia, Latin America looks more vulnerable (Table 1). BCA's chief emerging market strategist, Arthur Budaghyan, wisely upgraded Brazilian assets on a tactical basis on October 9th ahead of the presidential elections. Nevertheless, Arthur still worries that Brazil's daunting fiscal challenges - the budget deficit currently stands at 7.8% of GDP and the IMF expects government debt to rise to nearly 100% of GDP over the next five years (Chart 11) - are so grave that even South America's answer to Donald Trump may not be able to save the Brazilian economy. Table 1Vulnerability Heat Map For Key EM Markets
Fighting The Last War
Fighting The Last War
Chart 11Brazil Is Fiscally Challenged
Brazil Is Fiscally Challenged
Brazil Is Fiscally Challenged
A Correction, Not A Bear Market The current market environment bears some similarities to the late 1990s. The Fed is tightening monetary policy in order to keep the domestic economy from overheating. The U.S. economy is responding to higher rates to some extent, but the main effects are being felt overseas. The Asian Crisis did not end the bull market in U.S. stocks, but it did generate a few nasty selloffs, the most notable being the 22% peak-to-trough decline in the S&P 500 between July 20 and October 8, 1998. We witnessed such a selloff this October. The bad news is that our MacroQuant model is pointing to additional equity weakness over the coming weeks (Chart 12). The model tends to downgrade stocks whenever growth is slipping, financial conditions are tightening, and sentiment is deteriorating from bullish levels. All three of these things are currently occurring. Chart 12MacroQuant* Model Suggests Caution Is Warranted
Fighting The Last War
Fighting The Last War
The good news is that none of our recession indicators are flashing red. Since recessions and bear markets typically overlap (Chart 13), the odds are high that the current stock market correction will be just that, a correction. Chart 13Recessions And Bear Markets Usually Overlap
Recessions And Bear Markets Usually Overlap
Recessions And Bear Markets Usually Overlap
Peter Berezin, Chief Global Strategist Global Investment Strategy peterb@bcaresearch.com 1 The corresponding ETFs are long ITB/short SPY. 2 Please see The Bank Credit Analyst Special Report, "The Long Shadow Of The Financial Crisis," dated October 25, 2018. 3 It is actually not even clear that a loss of confidence in America's fiscal management would cause a recession. The Fed largely determines borrowing costs at the short-to-medium end of the yield curve, which is where the government finances most of its debt. If people lose confidence in the dollar, they will either need to run down their cash balances by purchasing more goods and services or try to move their wealth abroad. The former will directly increase aggregate demand, while the latter will indirectly increase it through a weaker currency. To be clear, we are not suggesting that such an outcome would be beneficial to the economy; it would, among other things, greatly slow potential GDP growth by discouraging investment. But the near-term effect would likely be economic overheating and rising inflation rather than a recession. 4 Please see Global Investment Strategy Weekly Report, "Chinese Stimulus: Not So Stimulating," dated October 26, 2018. Strategy & Market Trends Tactical Trades Strategic Recommendations Closed Trades
The peso will plunge much further if the monetary authorities do not tighten aggressively. Alternatively, the central bank could defend the peso without hiking rates by selling foreign exchange reserves. Doing so, nevertheless, will still lead to higher…
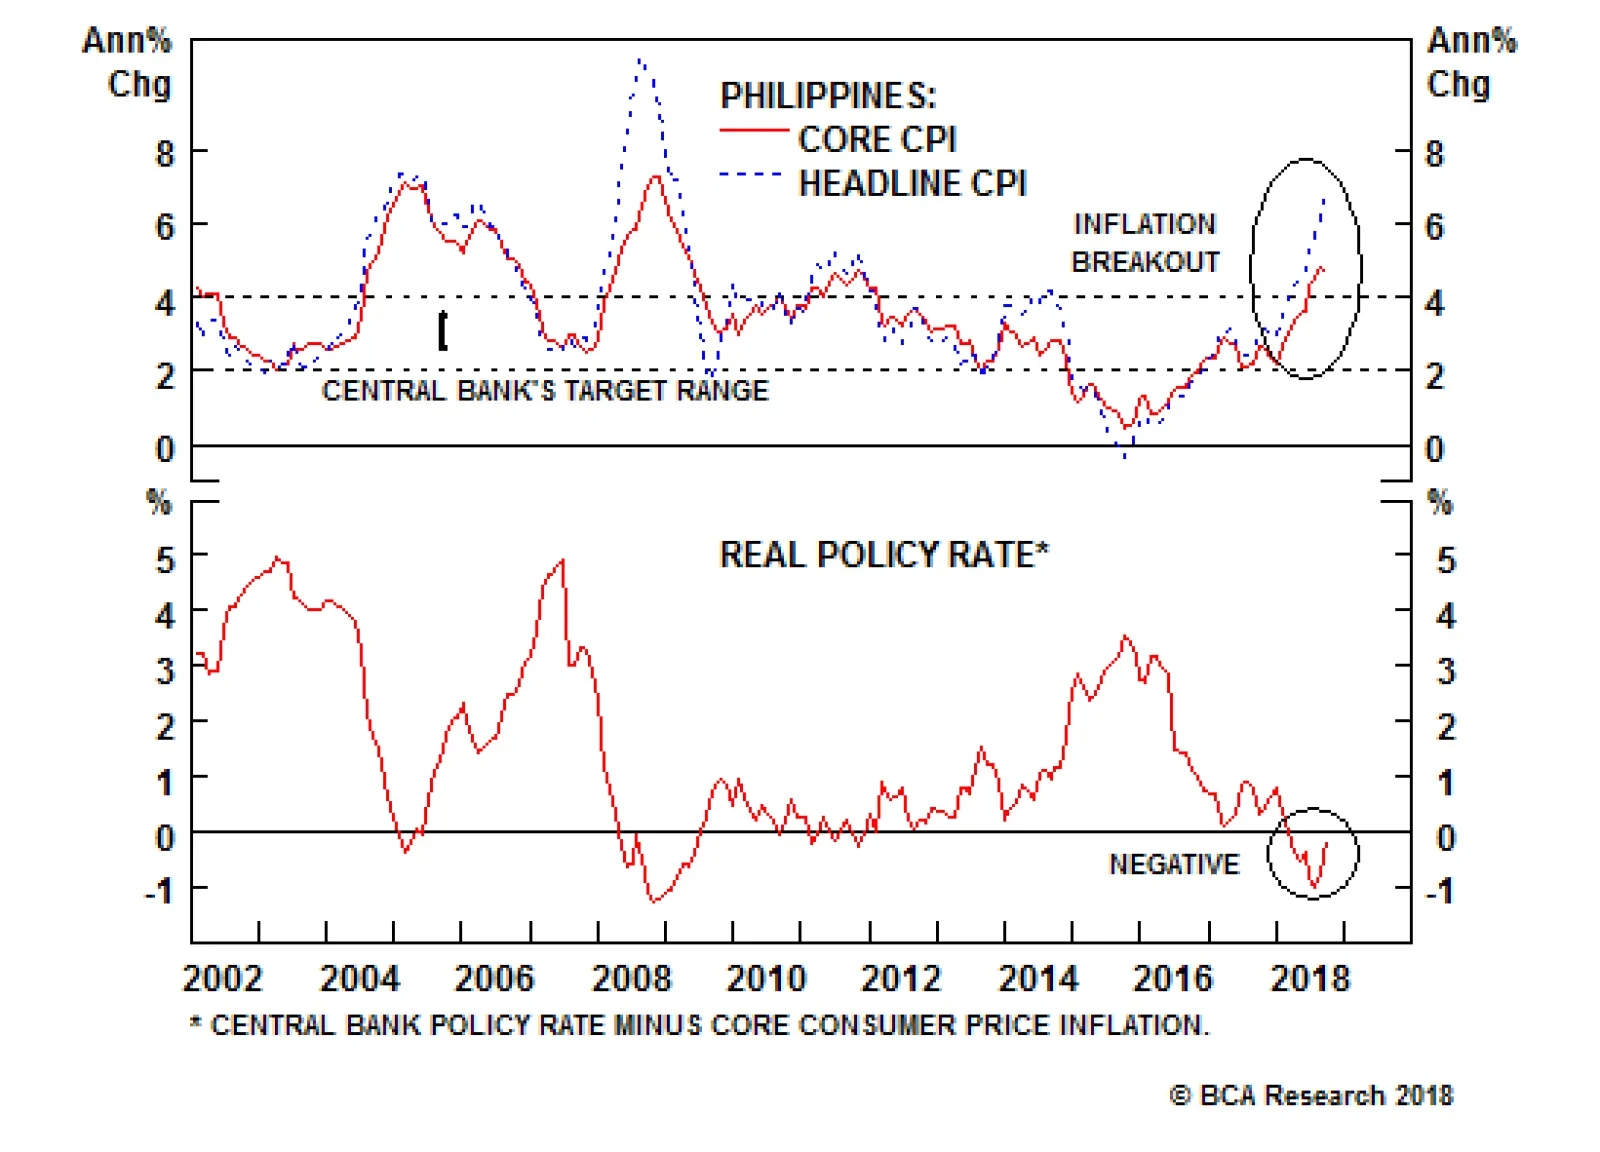
The Philippine economy continues to overheat. Both headline and core inflation measures are rising precipitously and have breached the central bank's upper target of 4% by a wide margin. Odds are that inflation will continue to climb. Overall domestic…
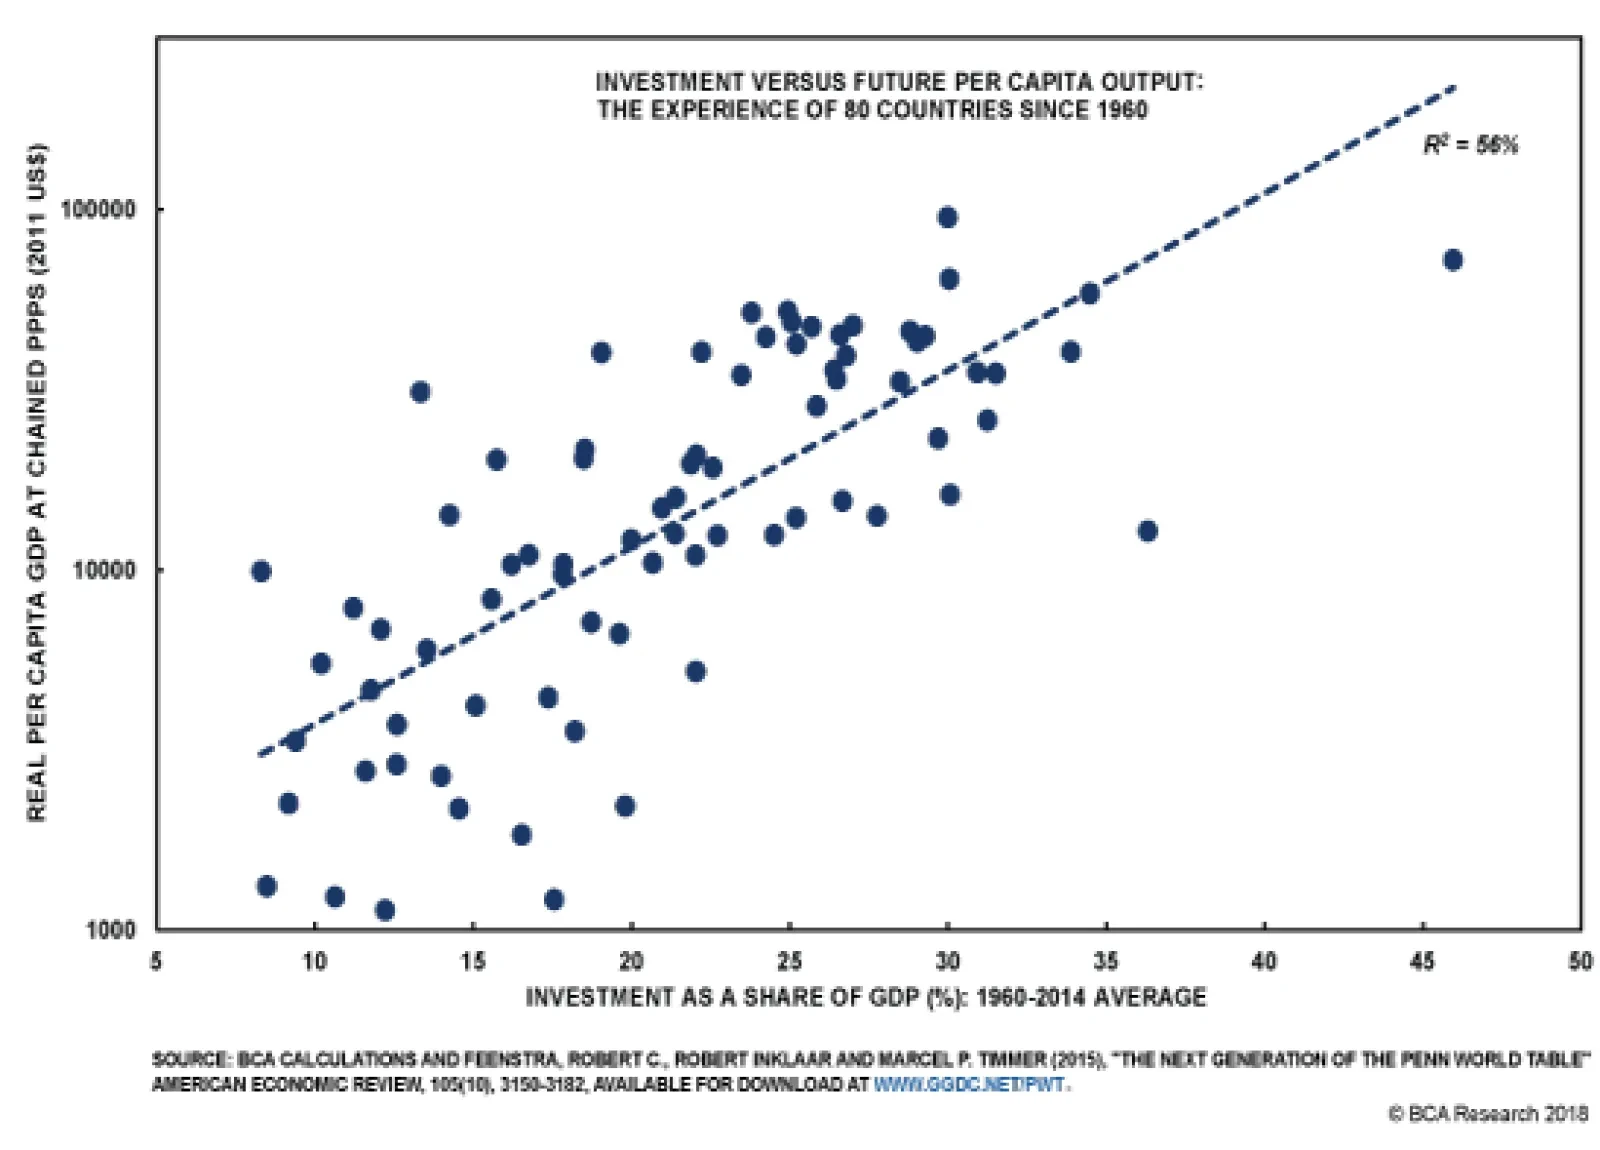
The above chart presents, in a nutshell, the theoretical support for the "keep investing" view. The chart depicts real per capita GDP for 80 countries in 2014 as a function of the average share of gross capital formation to GDP from 1960 to 2014. The chart…
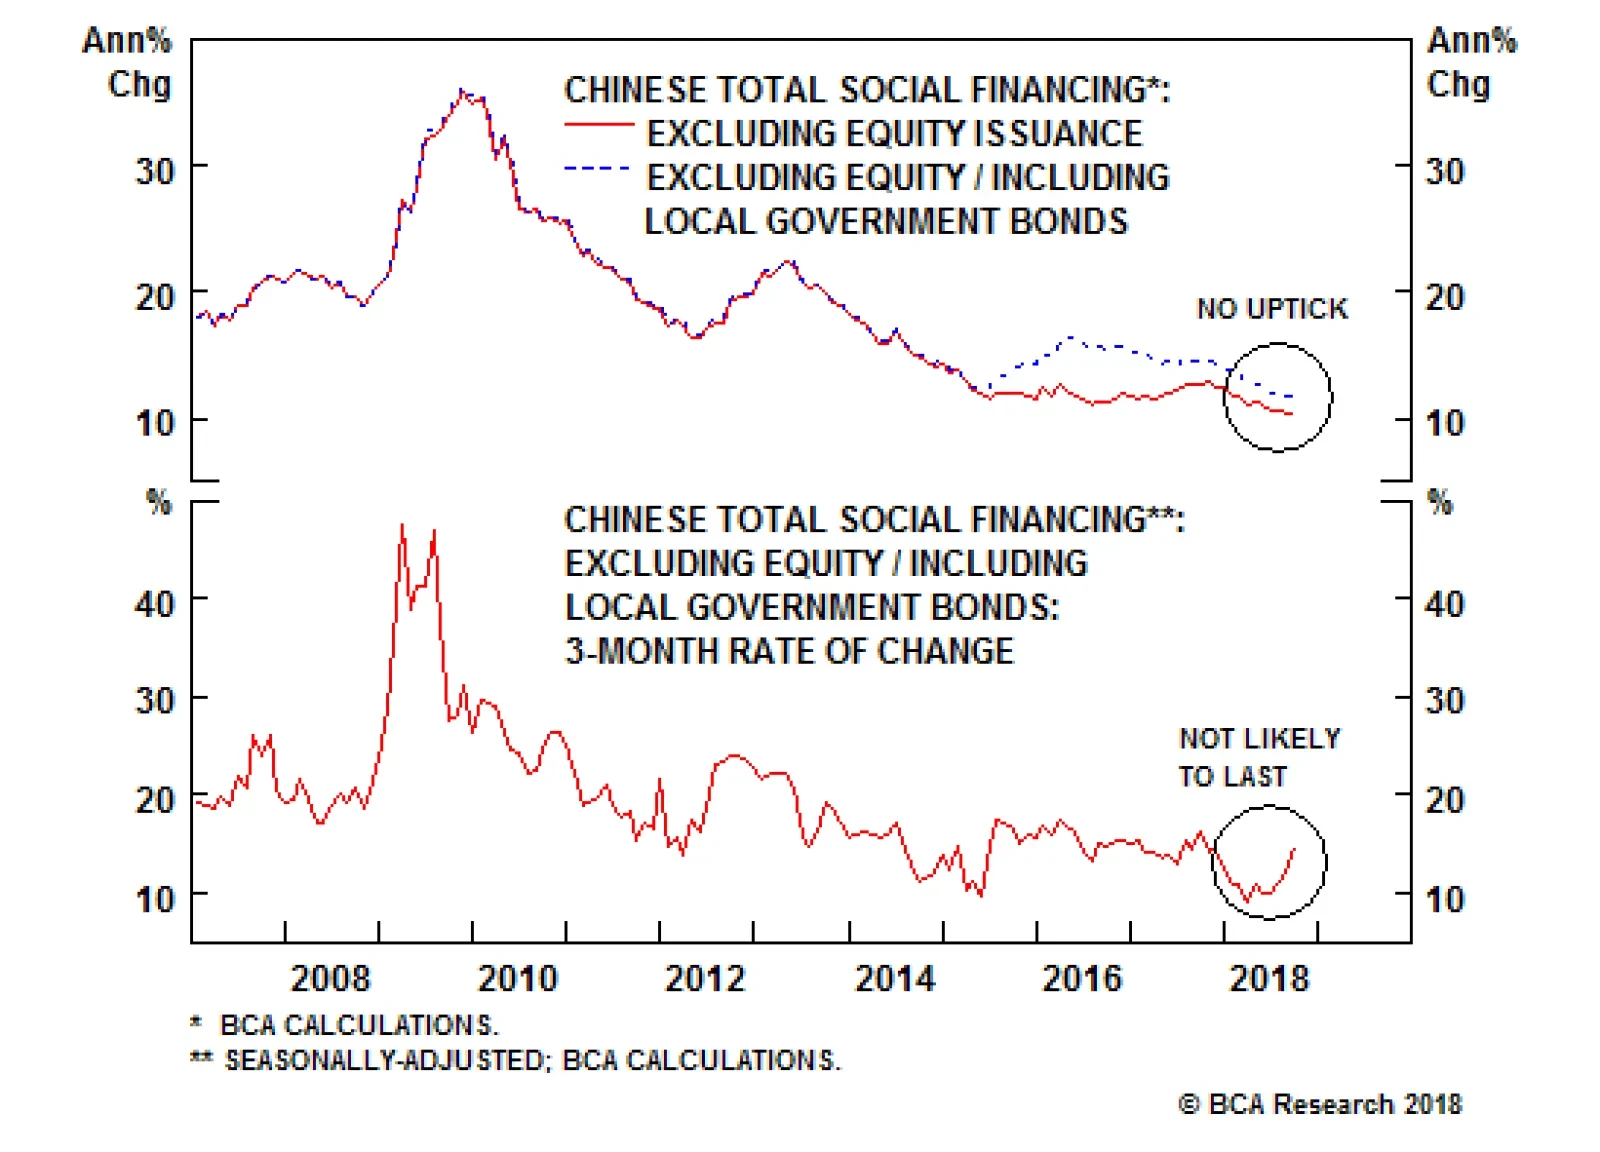
September's total social financing data, released earlier this month, provided important evidence supporting our view that Chinese policymakers are not aiming for a significant acceleration in private sector credit growth. The above chart highlights that the…
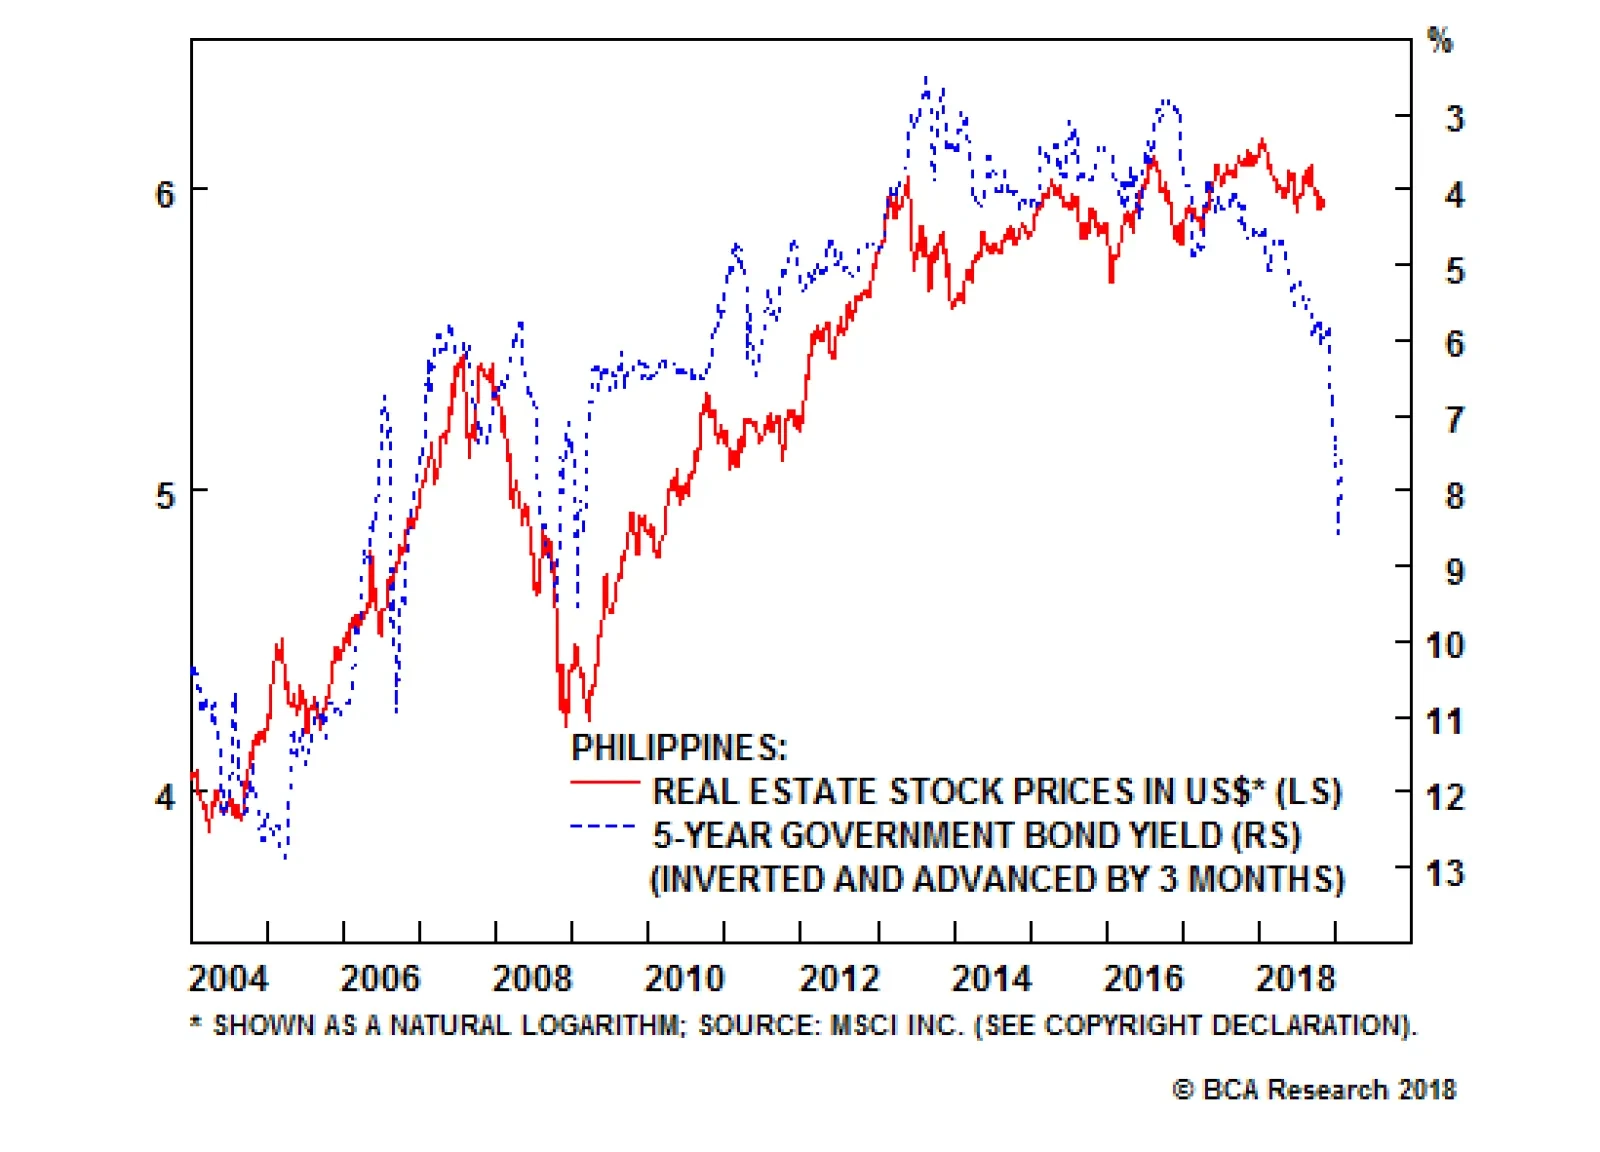
Highlights In the Philippines, inflation is breaking out while the central bank is well behind the curve. Financials markets remain at risk. As a play on surging interest rates: Go short Philippine property stocks. We appraise and modify our investment strategy across all central European markets in general and Hungary in particular - where a monetary policy shift is in the making. A new trade: We recommend paying 3-year swap rates in Hungary and receiving 3-year swap rates in the euro area. Feature The Philippines: Short Real Estate Stocks Philippine stocks are on the verge of a major breakdown (Chart I-1, top panel). Meanwhile, local currency bond yields are surging (Chart I-1, bottom panel). Chart I-1Philippine Stocks Are On The Edge Of A Breakdown
Philippine Stocks Are On The Edge Of A Breakdown
Philippine Stocks Are On The Edge Of A Breakdown
The Philippine economy continues to overheat, and the Bangko Sentral ng Pilipinas (BSP) has fallen well behind the curve. The top panel of Chart I-2 shows that both headline and core inflation measures are rising precipitously and have breached the central bank's upper target of 4% by a wide margin. Chart I-2The Central Bank Is Far Behind The Curve
The Central Bank Is Far Behind The Curve
The Central Bank Is Far Behind The Curve
Odds are that inflation will continue to climb higher. Overall domestic demand remains reasonably strong. Noticeably, both the current and fiscal accounts are in deficit and widening (Chart I-3). A current account deficit is a form of hidden inflation. The basis is that it gauges the degree of excess domestic demand relative to the productive capacity of the economy. Chart I-3The Philippines: A Large Twin Deficit
The Philippines: A Large Twin Deficit
The Philippines: A Large Twin Deficit
The roots of these macro problems stem from ultra-easy monetary and fiscal policies pursued by Filipino authorities. The BSP has kept borrowing costs low and for much longer than was warranted, and has been slow to hike rates. As a result, credit has been booming relentlessly (Chart I-4). Chart I-4Bank Loans Have Boomed...
Bank Loans Have Boomed...
Bank Loans Have Boomed...
The fiscal authorities, on the other hand, have vigorously pursued growth-at-all-costs programs. Government spending is now growing at an annual rate of 22% (Chart I-5). Chart I-5...So Have Government Expenditures
...So Have Government Expenditures
...So Have Government Expenditures
Consequently, these populist policies have created excessive domestic demand that has stoked an inflation breakout. Given Philippine President Rodrigo Duterte's reluctance to cut back on fiscal expenditures, it will be up to the monetary authorities to tighten sufficiently enough to curb inflation.1 The currency was depreciating against the U.S. dollar in 2017, even as its EM peers rallied. A falling currency amid strong economic growth is generally a symptom of an overheating economy; it signals that real interest rates are low and the central bank is behind the curve. Today, the monetary authorities need to hike borrowing rates aggressively, otherwise the currency will plunge much further. The country's financial markets are quickly approaching a riot point, and local currency bond yields are already selling off as creditors are rebelling (see bottom panel of Chart I-1 on page 1). Another option the BSP could take to defend the peso without hiking rates much is to sell foreign exchange reserves. Doing so, nevertheless, will still lead to higher domestic interest rates - especially at the short end of the curve. When a central bank sells its dollar reserves, it absorbs local currency liquidity - i.e. commercial banks' excess reserves at the central bank decline. Interbank rates then rise, which pushes up short-term rates and potentially long-term ones too. This is how financial markets naturally force macro adjustments on an overheating economy when policymakers are reluctant to act. As such, Filipino share prices are now facing a major risk. Higher domestic rates amid strong loan growth will cause the economy to decelerate significantly. Certain interest rate-sensitive sectors such as vehicle sales are already shrinking. The property sector - the segment of the economy that has benefited the most from the credit binge - will be the next shoe to drop: The supply of residential real estate buildings has been booming - floor space built has risen 2.4-fold since 2003. As interest rates continue to rise, real estate and construction loans - which are still growing at a 19% annual rate - will slump. Higher borrowing costs will hurt real estate prices. Meanwhile, rent growth will decline as the economy decelerates. The slowdown in the property sector will take a heavy toll on real estate development and management companies: First, these firms' revenues and income - property sales, rental and other types of income - will decelerate significantly (Chart I-6, top panel). Chart I-6Listed Real Estate Companies Will Face Major Headwinds
Listed Real Estate Companies Will Face Major Headwinds
Listed Real Estate Companies Will Face Major Headwinds
Second, higher interest rates will raise their interest expenses (Chart I-6, bottom panel). Remarkably, Philippine real estate stocks have remained quite resilient, despite the broad selloff in financial markets. While the former are down by 18% in dollar terms from their early 2018 peak, Chart I-7 suggests rising interest rates herald a much more pronounced drop in their prices. Chart I-7Filipino Property Stocks Are On A Cliff
Filipino Real Estate Stocks Have Been Quite Resilient
Filipino Real Estate Stocks Have Been Quite Resilient
Besides, these property companies are also still expensive. Their price-to-book value (PBV) currently stands at 2.9. Between the years 2000 and 2005, their PBV averaged 1.6. We are therefore initiating a new trade: Short Philippine real estate stocks in absolute U.S. dollar terms. Crucially, the real estate sector makes up 27% of the Philippines MSCI index, and will therefore have a significant impact on the Philippine stock market. As to bank stocks - the other large segment of the equity market - a couple of points are in order. Commercial banks in the Philippines are exposed to the real estate sector. Hence, a slowdown in the property sector will culminate in the form of higher NPLs and provisions for bad loans on banks' balance sheets. Real estate and construction loans account for 25% of total bank loans. Crucially, NPLs and provision levels - at 1.3% and 1.9%, respectively - are very low, and have so far not risen. This is unsustainable given the magnitude of the ongoing credit boom and rising interest rates. Higher provisions will cause banks' profits and share prices to suffer materially. This will come on top of plunging net interest margins (Chart I-8). Chart I-8Philippines Commercial Bank Profits Are Getting Squeezed
Philippines Commercial Bank Profits Are Getting Squeezed
Philippines Commercial Bank Profits Are Getting Squeezed
As to equity valuations, this bourse is not cheap, neither in absolute terms nor relative to the EM equity benchmark - both valuation measures are neutral (Chart I-9). Chart I-9Equity Valuations Are Not Attractive
Equity Valuations Are Not Attractive
Equity Valuations Are Not Attractive
Overall, the outlook for Philippine equities as a whole remains unattractive both in absolute terms, as well as relative to the EM benchmark. Bottom Line: EM equity portfolios should continue underweighting this bourse. We are also initiating a new trade: Going short Philippine real estate stocks in absolute U.S. dollar terms. Ayman Kawtharani, Associate Editor ayman@bcaresearch.com Strategy For Central European Markets Our presiding macroeconomic theme for central Europe - which we first elaborated on in a Special Report titled, Central Europe: Beware Of An Inflation Outbreak2 - has been as follows: An accommodative policy stance in the context of strong growth and tight labor markets warrants higher inflation. Our proxy for labor shortages - calculated as the number of job vacancies divided by the number of unemployed looking for a job - is continuing to surge across all central European countries as well as in Germany. This foreshadows higher wage growth ahead (Chart II-1). Chart II-1Tight Labor Markets Means Higher Wage Growth
Tight Labor Markets Means Higher Wage Growth
Tight Labor Markets Means Higher Wage Growth
Furthermore, monetary policy in central European countries remains accommodative - policy rates are negative in real (inflation-adjusted) terms. Consistently, private credit (bank loan) growth and domestic demand remain robust. Today, we appraise and modify our investment strategy across all central European markets in general and Hungary in particular, where a policy shift is in the making. Hungary: Moving Away From Ultra-Accommodative Monetary Policy? Last month, the NBH (National Bank of Hungary) modified its monetary policy statement to include a new paragraph explaining that the council is prepared for the gradual normalization of monetary policy, depending on the outlook for inflation.3 Given our view that inflation in Hungary will continue to rise, the NBH is likely to move away from ultra-accommodative monetary policy sooner rather than later. Besides mounting inflationary pressures, several factors lead us to believe that the NBH is more comfortable normalizing policy today than in the past: First, after seven years of deleveraging, private credit is finally on the rise, and money supply growth is booming (Chart II-2, top and middle panel). Chart II-2Hungary: Easy Monetary Conditions Will Lift Inflation
Hungary: Easy Monetary Conditions Will Lift Inflation
Hungary: Easy Monetary Conditions Will Lift Inflation
Second, capital expenditures are recovering and business confidence is making new highs (Chart II-3, top and middle panel). Furthermore, construction is firing on all cylinders (Chart II-3, bottom panel). Chart II-3Hungary: Capex Is Robust
Hungary: Capex Is Robust
Hungary: Capex Is Robust
Lastly, core consumer inflation is rising and the real deposit rates is at -2%, the lowest in 20 years (Chart II-2, bottom panel). Given the genuine need for rate normalization in Hungary and the central bank's readiness to do so, we are adjusting our strategy: We are taking profits of 72 basis points on our Hungarian yield curve steepening trade that we initiated on June 21, 2017. Hungary's yield curve is already the steepest yield curve in Europe. The slope of the 10/1-year yield curve is 320 basis points in Hungary, versus 200 in Poland, 100 in the Czech Republic and 105 in Germany. We are closing our long PLN / short HUF trade with a 7.7% gain since its initiation on September 28, 2016 (Chart II-4). The cross rate is close to an all-time high and will likely reverse. Chart II-4Book Profits On Long PLN / Short HUF
Book Profits On Long PLN / Short HUF
Book Profits On Long PLN / Short HUF
A new trade: We recommend paying 3-year swap rates in Hungary and receiving 3-year swap rates in the euro area (Chart II-5). Chart II-5A New Trade: Pay Hungarian / Receive Euro Area 3-year Swap Rates
A New Trade: Pay Hungarian / Receive Euro Area 3-year Swap Rates
A New Trade: Pay Hungarian / Receive Euro Area 3-year Swap Rates
First, not only is final domestic demand in Hungary much more robust than in the euro area, but Hungary's output gap is positive while the euro area's is still negative (Chart II-6,top and middle panel). This foreshadows a widening gap in inflation between Hungary and the euro area (Chart II-6, bottom panel). As this transpires, policy rate expectations will rise faster and by more in Hungary than in the euro area. Chart II-6Hungarian Economy Will Overheat Faster Than Euro Area's
Hungarian Economy Will Overheat Faster Than Euro Area's
Hungarian Economy Will Overheat Faster Than Euro Area's
Second, ultra-accommodative monetary policy in Hungary has served its purpose and has generated an overflow of liquidity. In effect, with broad money supply in Hungary now growing considerably faster than in the euro area, the NBH will likely tighten its policy at a faster pace and by more than the ECB (Chart II-7). This warrants a widening 3-year swap rate differential between Hungary and the euro area. Chart II-7Hungary Vs. Euro Area: Money Growth And Swap Rates
Hungary Vs. Euro Area: Money Growth And Swap Rates
Hungary Vs. Euro Area: Money Growth And Swap Rates
Third, as global trade continues to slump, affecting German manufacturing, the European Central Bank will be fast to reiterate its readiness to keep policy accommodative longer than expected. This could push back expectations of the first ECB rate hike. Finally, Italy remains a risk and European banks are exposed to weakening developing countries. With euro area bank share prices plunging close to their 2008 and 2012 lows, the ECB will be both slow and cautious in signaling rate normalization in the immediate future. While Hungary is a very open economy and will feel the pinch from a slowdown in European manufacturing, its currency may depreciate further against the euro as it typically does amid global risk-off periods. A cheap currency will reduce the NBH's worries about the pass-through of a global slowdown and disinflation into its domestic economy. In short, given that both economies have different inflationary backdrops, Hungarian interest rate expectations will increasingly diverge from those of the euro area. As such, fixed-income investors should bet on a rising 3-year swap rate differential between Hungary and the euro area. Our Other Positions In Central European Markets Within the fixed income and currency space: Stay overweight CE3 within EM dedicated fixed-income portfolios. Predicated on our view that the epicenter of the ongoing global growth slowdown is China, emerging Asian and commodity leveraged markets are at much bigger risk than their Central European counterparts. Consistent with this theme, stay short IDR versus PLN. Book profits of 109 basis points on the following trade initiated on July 26, 2017: Pay Czech / receive Polish 10-year swap rates (Chart II-8). In line with our expectations,4 the Czech National Bank has been responding to rising domestic inflationary pressures and has been tightening monetary policy faster than the National Bank of Poland. There now remains little upside in Czech rates relative to Polish ones, so we are booking profits. Chart II-8Book Profits On Pay Czech / Receive Polish 10-year Swap Rates
Book Profits On Pay Czech / Receive Polish 10-year Swap Rates
Book Profits On Pay Czech / Receive Polish 10-year Swap Rates
Stay long CZK against the EUR. Widening growth and inflation gaps between the Czech Republic and the euro area justify higher rates and a stronger currency in the former relative to the latter. Regarding the equity space: Stay long CE3 banks / short euro area banks. CE3 banks are less leveraged and have a higher return on assets than euro area banks. Continue overweighting CE3 within EM dedicated equity portfolios. CE3 stocks have staged a double bottom relative to their emerging market peers, both in common and local currency terms (Chart II-9). Given emerging markets are saddled with credit excesses, unresolved economic imbalances and looming currency weakness, central Europe is likely to continue outperforming. Chart II-9CE3 Equities Will Outperform EM
CE3 Equities Will Outperform EM
CE3 Equities Will Outperform EM
A summary of all our trades and asset allocations can be found on page 14 and 15. Stephan Gabillard, Senior Analyst stephang@bcaresearch.com 1 Please see Emerging Markets Strategy/Geopolitical Strategy Special Report, "The Philippines: Duterte's Money Illusion," dated April 25, 2018, available at ems.bcaresearch.com 2 Please see Emerging Markets Strategy Special Report "Central Europe: Beware Of An Inflation Outbreak," dated June 21, 2017, available at ems.bcaresearch.com. 3 http://www.mnb.hu/en/monetary-policy/the-monetary-council/press-releases/2018/press-release-on-the-monetary-council-meeting-of-18-september-2018 4 Please see Emerging Markets Strategy Weekly Report "Follow The Money, Not The Crowd," dated July 26, 2017, available at ems.bcaresearch.com Equity Recommendations Fixed-Income, Credit And Currency Recommendations