Emerging Markets

Highlights After tumbling more than 20% between June and August, copper prices have remained largely static. This reflects the tug-of-war between the near-term bullish physical market fundamentals, and the cloudier macro headwinds ahead, arising from a stronger U.S. dollar. Furthermore, Chinese policymakers are unlikely to abandon their reform agenda and stimulate massively, which will put downside pressure on copper prices further down the road. Despite our negative 12-month outlook, we do not rule out the potential for some upside going into year-end, on the back of falling inventories. Energy: Overweight. News leaked earlier this week indicates the Trump administration is divided over whether to grant waivers on Iranian crude oil imports to big importers like China, India and Turkey, following the re-imposition of sanctions on November 4.1 The U.S. State Department, in particular, appears worried the sanctions will produce a price spike that could derail growth in the U.S. and its allies. This suggests the Administration will be less determined to enforce its Iranian export sanctions, until it has been assured Saudi Arabia and Russia will be able to bring enough production on line in 1H19 to cover the lost Iranian exports, and possible deeper Venezuelan losses. Markets will remain focused on actual export losses from Iran - if they come in at the high end of expectations (i.e., greater than 1.5mm b/d), we expect higher prices; if it becomes apparent the U.S. will go soft on enforcing sanctions, prices would fall. Expect higher volatility. Base Metals: Neutral. Copper prices could rally over the short term, on the back of lower inventories. However, longer term, we see no catalysts to push prices toward recent highs of ~ $3.30/lb on the COMEX. Precious Metals: Neutral. Gold's break above $1,200/oz is holding, but it continues to grind in a $1,210 to $1,240/oz range. Ags/Softs: Underweight. The USDA will report on export sales of grains and oil seeds today. Soybean exports were down 21% y/y for the current crop year, based on the Department's October 18 report. Feature Tight Market Conditions Suggest A Brief Upswing ... After remaining in the $2.90-$3.30/lb trading range for the better part of 1H18, copper prices plunged ~20% since their June peak. The trigger? The escalation of the U.S.-China trade war. The increasingly acrimonious trade relationship acted as a reality check. Investors betting on strike-induced mine supply shortfalls earlier this year were forced to adjust expectations regarding the resilience of the global, and, more specifically, the Chinese business cycles.2 The negative impact of the trade war is clear: copper prices moved to the downside with each escalation in the dispute (Chart of the Week). While current market fundamentals do not necessarily warrant such drastic declines, we see these developments as a wake-up call to market participants. Copper sentiment - previously buoyed by expectations of mine strikes (which failed to materialize) - has come crashing down (Chart 2). Chart of the WeekCopper Down On Trade War
Copper Down On Trade War
Copper Down On Trade War
Chart 2Sentiment Has Come Crashing Down
Sentiment Has Come Crashing Down
Sentiment Has Come Crashing Down
However, the outlook in the very near term is not so bleak. The evidence below suggests tight physical conditions, indicating copper's next move could be to the upside: Chinese copper imports came in strong in September (Chart 3). While unwrought copper imports reached a 2.5-year high, ores and concentrates forged new record highs. Chart 3Chinese Imports Came In Strong
Chinese Imports Came In Strong
Chinese Imports Came In Strong
The resilience of Chinese purchases comes on the back of restrictions on scrap imports, which account for a significant share global copper supply (Chart 4). As we have been highlighting, Chinese restrictions on the purity of scrap imports require other forms of the metal to fill the supply gap.3 At the same time, the 25% tariff imposed on Chinese imports of U.S. scrap since August also manifests itself in greater demand for other forms of the metal. This is evident in weak scrap copper imports (Chart 5). Chart 4A Dependable Secondary Market Is Essential For Global Supply
Copper Could Rally In The Short Term; Long-Term Fundamentals Less Bullish
Copper Could Rally In The Short Term; Long-Term Fundamentals Less Bullish
Chart 5Scrap Import Restrictions Raise Need For Other Forms Of Copper
Scrap Import Restrictions Raise Need For Other Forms Of Copper
Scrap Import Restrictions Raise Need For Other Forms Of Copper
Copper inventories at the three major global exchange warehouses have been declining steadily and together now stand at half their late April peak (Chart 6). This is their lowest level since late 2016. Chart 6Exchange Inventories At Two Year Low
Exchange Inventories At Two Year Low
Exchange Inventories At Two Year Low
The above evidence of a tight market is in line with copper's futures curve, which is recently pricing a premium for physical delivery (Chart 7). Chart 7Markets Pricing A Premium For Physical Delivery
Markets Pricing A Premium For Physical Delivery
Markets Pricing A Premium For Physical Delivery
Going into the winter, smelter disruptions may lend further upside support amid these tight conditions: The Vedanta copper smelter in the Indian state of Tamil Nadu was forced to shut down in May due to violent protests. The smelter has an annual production of over 400k MT. In Chile, Codelco gave notice to the market that two of its four smelters will undergo weeks-long outages, in order to comply with tightening of emissions rules - requiring smelters to capture 95% of emissions - due to take effect in December. This will halt production from smelters at the Chuquicamata and Salvador mines for 75 days and 45 days, respectively. Furthermore, in mid-October BHP Billiton reduced its 2018 copper production forecast by 3% to between 1.62mm MT and 1.7mm MT, due to shutdowns at its Olympic Dam facility in Australia and Spence in Chile. Bottom Line: Dynamics at the scrap level in China and disruptions at major smelters in India, Chile and Australia justify tight copper market conditions. This offers potential for a minor rebound in copper prices in the very near term. ... Ahead Of Macro Headwinds In the medium term, macro headwinds will dominate the physical market, capping gains in copper prices. Most notably, fall-out from the U.S.-China trade war in absence of aggressive traditional forms of stimulus, will weigh on demand there. Furthermore, U.S. dollar strength on the back of economic and monetary policy divergences, will make the red metal more expensive for global consumers. Ex-U.S. Growth Unpromising Given the stimulative fiscal policies in the U.S., our House View still does not expect a recession before late-2020. However in the meantime, the global economy will be characterized by divergence in favor of the U.S. (Chart 8). Chart 8Global Economic Divergence Favors U.S.
Global Economic Divergence Favors U.S.
Global Economic Divergence Favors U.S.
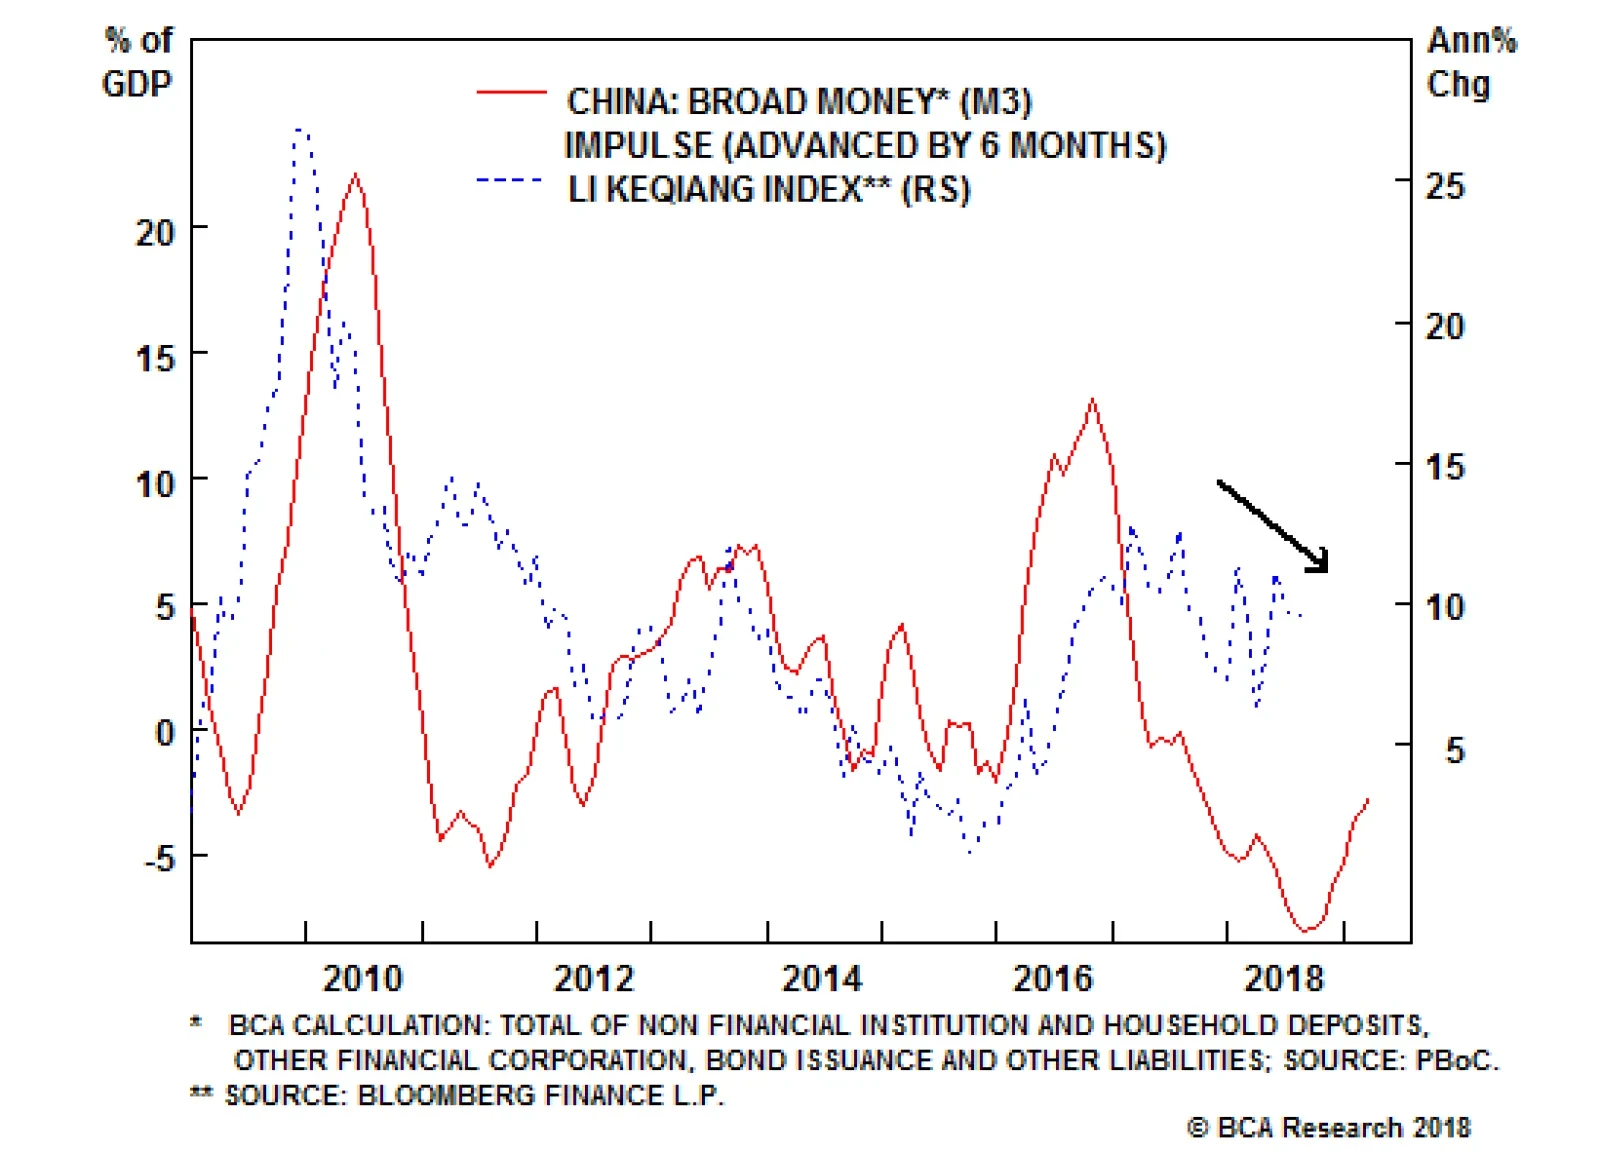
Of utmost importance is, of course, China - where roughly half of global refined copper is consumed. The trade dispute with the U.S. has raised concerns over the resilience of the Chinese economy. Recent data releases have done little to ease fears of a manufacturing slowdown. The Li Keqiang Index and our China construction proxy - both of which are strongly correlated with copper prices - are on a slight downtrend (Chart 9). Chart 9Ominous Signs From China
Ominous Signs From China
Ominous Signs From China
China's 3Q18 GDP data indicate the Chinese economy grew by the slowest pace in nearly a decade (Chart 10). At the same time, PMI's have fallen to or near the 50 level - the boom-bust line - reflecting pessimism in the manufacturing sector. The real estate market - where 45% of China's copper is consumed - also looks gloomy. Home sales rolled over, boding ill for future housing starts. Chart 10Weak Q3 GDP Mirrors Manufacturing And Property Sectors
Weak Q3 GDP Mirrors Manufacturing And Property Sectors
Weak Q3 GDP Mirrors Manufacturing And Property Sectors
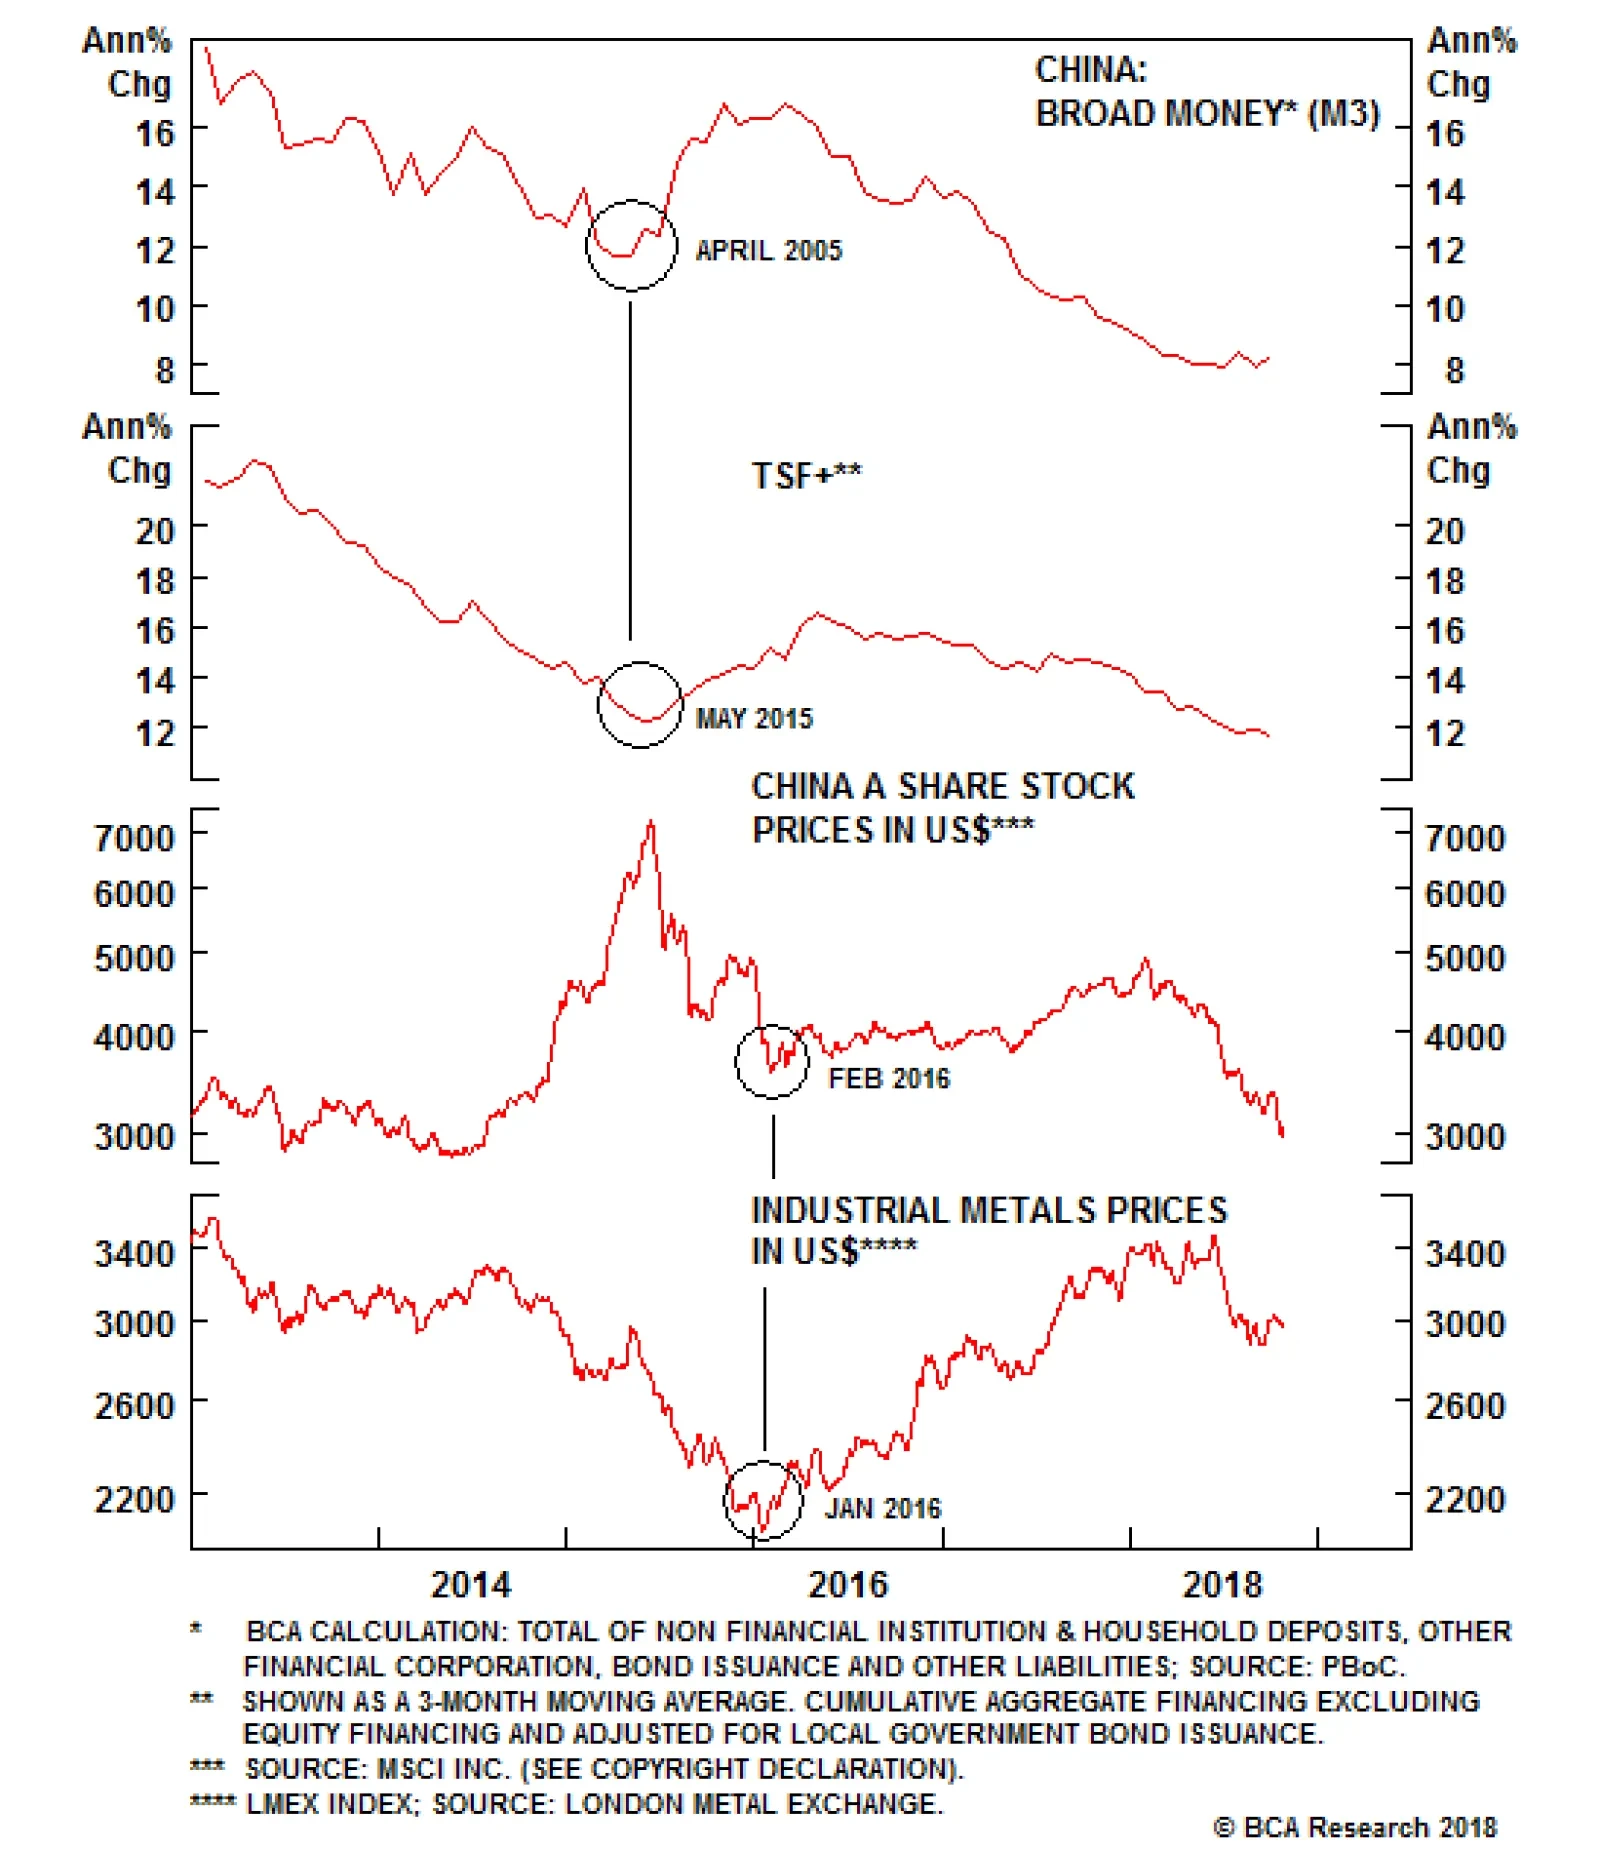
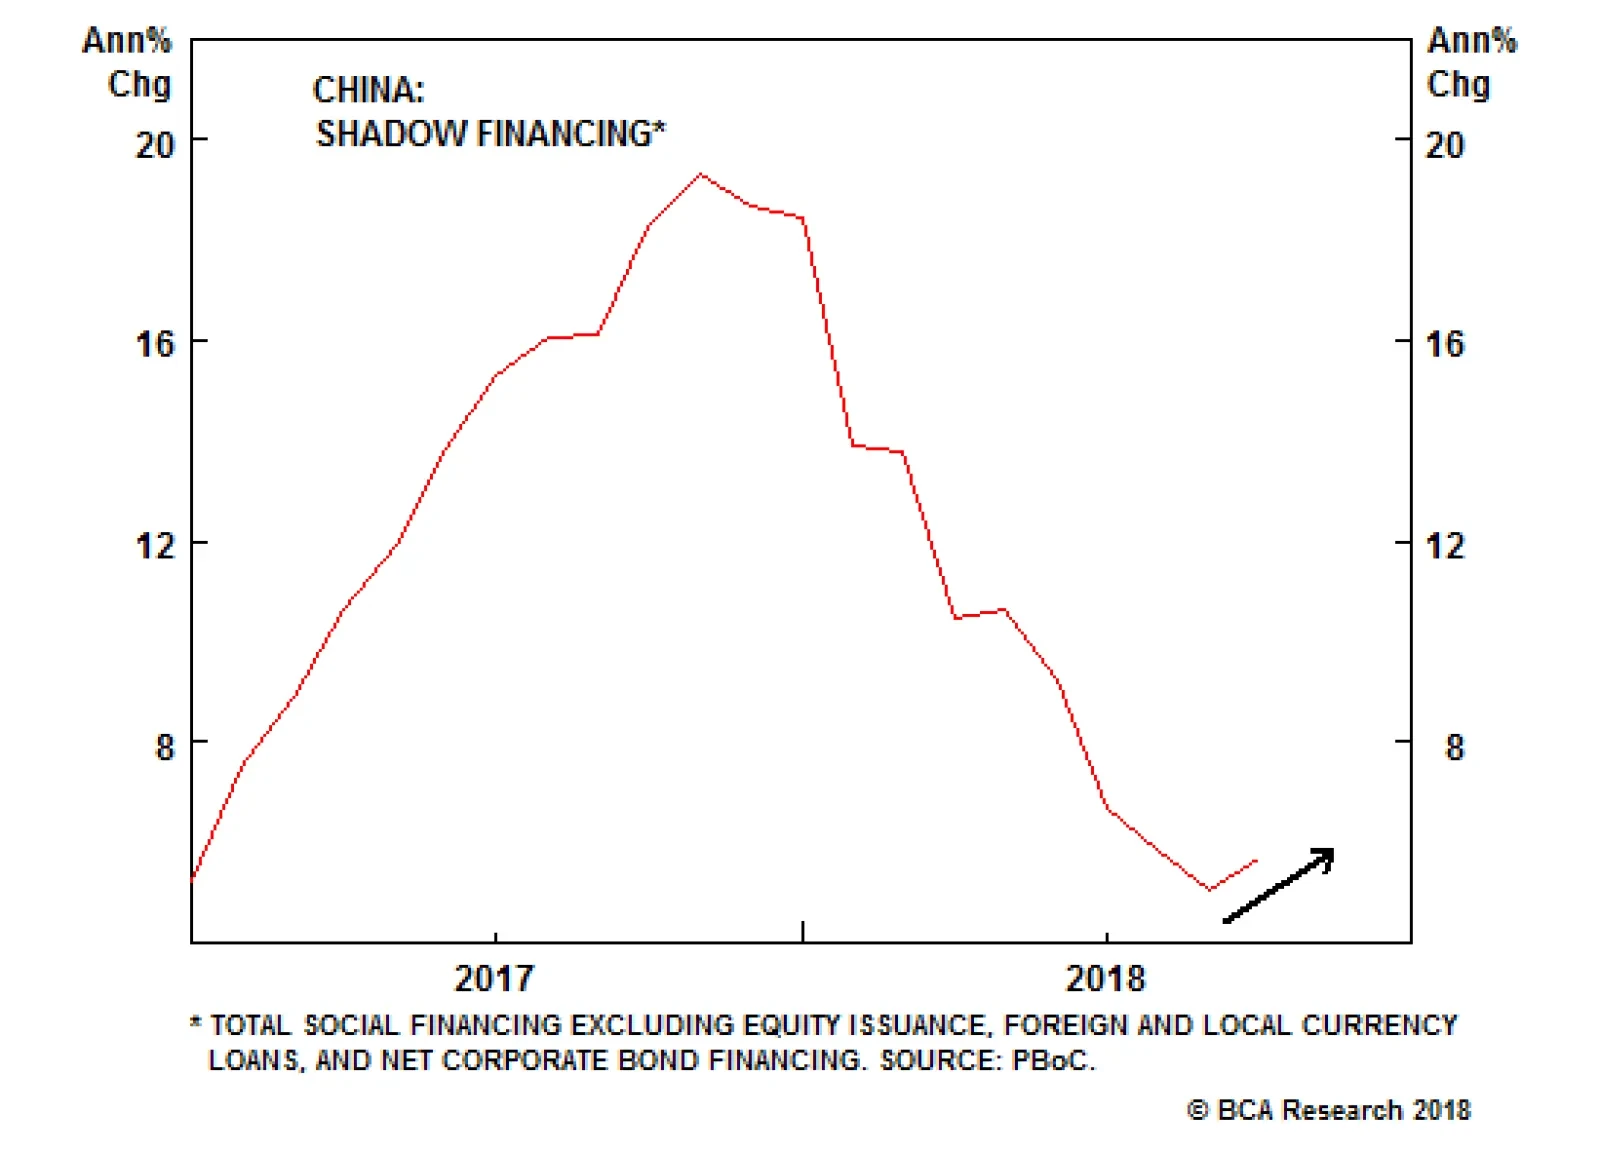
What's more, we are not betting on a flood of stimulus to rescue China's ailing economy. As our colleagues at BCA's Geopolitical Strategy service have been highlighting, the drive to combat vulnerabilities in financial markets raised the pain threshold of Chinese policymakers.4 As such, they are not likely to abandon their reform agenda at the first sign of weakness, as they traditionally have. Although some measures have already been implemented to ease policy, the current response is not yet as promising for commodity markets as has historically been the case. For one, credit growth is constrained by China's de-leveraging campaign. Although there is some evidence that the clampdown on shadow financing is easing, it is not yet at simulative levels (Chart 11). And while the money impulse is rebounding thanks to Reserve Requirement Ratio cuts, the credit impulse is still falling deeper into negative territory. Chart 11Shadow Banking Restrained By Reform Agenda
Shadow Banking Restrained By Reform Agenda
Shadow Banking Restrained By Reform Agenda
Additionally, as Peter Berezin who heads BCA's Global Investment Strategy highlights, China's more recent forms of (consumption-based) stimulus such as income tax reforms do not boost commodity demand. The same goes for the other way in which Chinese authorities are trying to stabilize their economy: by depreciating the RMB. This is in clear contrast to traditional measures such as fixed asset investment, which stimulate demand for raw materials and capital goods.5 Overall, the current level of stimulus is not sufficient to boost the Chinese economy. Nor, by extension, is it enough to lift EMs, and commodity prices in the process. In fact, copper markets have been oblivious to various announcements by Chinese authorities that they are easing policy (Chart 12). Chart 12Copper Markets Oblivious To Chinese Stimulus
Copper Markets Oblivious To Chinese Stimulus
Copper Markets Oblivious To Chinese Stimulus
Our Geopolitical Strategists warn that the U.S.-China trade war could get worse before it improves. Thus, while policymakers are not yet compelled to throw in the towel with their reform agenda, they are pragmatic and will likely intensify their response if conditions deteriorate further. If authorities were to deploy massively stimulative fiscal and monetary policy by propping up infrastructure and the real estate sector - as they traditionally have done - chances are that we would be able to escape further price weakness in copper markets. For now, the evidence points at a more modest policy approach. Green Dollar, Red Metal As a counter-cyclical currency, the U.S. dollar will shine in the current weaker ex-U.S. growth environment. What's more, limited spare capacity in the U.S. and a strong labor market foreshadow rising U.S. inflation readings. This will justify continued tightening by the Fed. Economic divergences favoring the U.S. economy will amplify the impact. Rising U.S. borrowing costs will be painful for debt-laden EM economies. Their Central Banks will struggle to keep the pace with the Fed. Similarly, the European Central Bank - conscious of turmoil in Italy - will be forced to maintain a more dovish stance. This will weigh down on the EUR/USD. A stronger dollar generally dents demand by making commodities - priced in U.S. dollars - more expensive for foreign consumers. While energy markets dominated by supply risks remain disconnected from their long-term negative correlation with the U.S. dollar, the relationship with metals has re-converged (Chart 13).6 This leaves copper more vulnerable to the downside amid dollar strengthening. The impact will be magnified for Chinese consumers as the RMB weakens further, forcing the top consumer to cut down on imports of the red metal. Chart 13USD-Copper Relationship Re-converged
USD-Copper Relationship Re-converged
USD-Copper Relationship Re-converged
Bottom Line: Headwinds from weakness in China and a stronger dollar will be a drag on demand next year. Unless Chinese policymakers temporarily abandon their reform agenda and stimulate massively, medium term copper prices will face pressures to the downside. Model Updates Given the macro headwinds outlined above, we revised our copper demand forecast. Our balances now point to a slight surplus in 2019 (Chart 14). In the context of 24mm MT of consumption p.a., a 100k MT surplus can be characterized as a balanced market. This makes prices vulnerable to upside or downside surprises, which can easily tip the scale. Chart 14Broadly Balanced Market
Copper Could Rally In The Short Term; Long-Term Fundamentals Less Bullish
Copper Could Rally In The Short Term; Long-Term Fundamentals Less Bullish
In line with our market assessment, we simulated forecasts for copper prices based on a 5% and 10% appreciation in the USD over the coming 12 months (Chart 15). Chart 15Macro Headwinds In 2019
Macro Headwinds In 2019
Macro Headwinds In 2019
Roukaya Ibrahim, Editor/Strategist Commodity & Energy Strategy RoukayaI@bcaresearch.com 1 Reuters published an interesting analysis containing the apparently leaked information re the internal disputes in the Trump administration entitled "Trump's sanctions on Iran tested by oil-thirsty China, India" on October 29, 2018. 2 In the Commodity & Energy Strategy Weekly Report published January 25, 2018, we highlighted the risk to mine supply in 2018 on the back of an unusually large number of labor contract renegotiations taking place this year - representing ~ 5 mm MT worth of mined copper. Most noteworthy was the risk of a strike at the Escondida copper mine in Chile. These have been largely resolved with minimal impact on supply. Please see "Stronger USD, Slower China Growth Threaten Copper," available at ces.bcaresearch.com. 3 Please see BCA Research Commodity & Energy Strategy Weekly Report titled "Copper: A Break Out, Or A Break Down?" dated May 17, 2018. Available at ces.bcaresearch.com. 4 Please see BCA Research Geopolitical Strategy Special Report titled "China Sticks To The Three Battles," dated October 24, 2018. Available at gps.bcaresearch.com. 5 Please see BCA Research Global Investment Strategy Weekly Report "Chinese Stimulus: Not So Stimulating" dated October 26, 2018, available at gis.bcaresearch.com. 6 Please see BCA Research Commodity & Energy Strategy Weekly Report titled "Correlations Vs. USD Weaken," dated June 14, 2018. Available at ces.bcaresearch.com. Investment Views and Themes Recommendations Strategic Recommendations Tactical Trades Commodity Prices and Plays Reference Table
Copper Could Rally In The Short Term; Long-Term Fundamentals Less Bullish
Copper Could Rally In The Short Term; Long-Term Fundamentals Less Bullish
Trades Closed in 2018 Summary of Trades Closed in 2017
Copper Could Rally In The Short Term; Long-Term Fundamentals Less Bullish
Copper Could Rally In The Short Term; Long-Term Fundamentals Less Bullish
Highlights Economic data and policy announcements over the past month reflect the view that policymakers are serious about restraining credit growth, and that they will attempt to combat any weakness in external demand by boosting domestic consumption. A review of historical episodes of "outsized" investment intensity shows that policymakers have good reason to try and shift the composition of China's economy towards consumption, as it suggests that China's current experience probably cannot be sustained. A shift even somewhat away from heavy investment-led growth means that the "strike price" of the China put option has fallen relative to past economic slowdowns, implying that it will take more pain before investors can cash in. It is too soon to move towards an outright long position favoring domestic stocks, even though considerable bad news has been priced in. CNY-USD likely has further downside, and investors allocating among Chinese stocks should only favor domestic over investable equities in currency-hedged terms. Feature September's total social financing data, released earlier this month, provided important evidence supporting our view that Chinese policymakers are not aiming for a significant acceleration in private sector credit growth. Chart 1 highlights that the year-over-year growth rate of adjusted total social financing (TSF) actually ticked modestly lower in September, in clear contrast to the bet of many investors that China is following its "old stimulus rulebook". Chart 1Chinese Policymakers Are Not Pumping The Credit Taps
Chinese Policymakers Are Not Pumping The Credit Taps
Chinese Policymakers Are Not Pumping The Credit Taps
Some market participants have pointed to the fact that adjusted TSF is rising sharply on a 3-month annualized basis after adjusting for seasonality (Chart 2), and have concluded from this fact that a sustained expansion in credit growth is forthcoming. However, Chart 3 illustrates that the pickup shown in Chart 2 is due to a surge in special local government bond issuance, which reflects front-loading of fiscal spending. Financial news outlets have reported that "provincial authorities had by the end of September already raised 92 percent of the 1.35 trillion yuan ($195 billion) worth of special infrastructure bonds that the central government has targeted for the entire year",1 implying that local government bond issuance in Q4 will drop off significantly relative to the past three months. Chart 2A Near-Term Pickup...
A Near-Term Pickup...
A Near-Term Pickup...
Chart 3...Caused By Front-Loaded Fiscal Spending
...Caused By Front-Loaded Fiscal Spending
...Caused By Front-Loaded Fiscal Spending
The September credit data aside, we acknowledge that there have been several small-scale stimulus announcements from the Chinese government over the past month. But the bottom line for now is that developments over this period reflect the view that policymakers are serious about restraining credit growth, and that they will attempt to combat any weakness in external demand by boosting domestic consumption.2 Restraining Credit Growth: Wisdom Or Folly? China's unwillingness to resort to a significant acceleration in credit growth to help stabilize its economy has surprised some investors, and raised criticism in some corners that the country is making a policy mistake. A recurring argument in this vein, particularly among perennial China bulls, is that policymakers should not be concerned about China's elevated levels of private sector debt because it is the natural and inevitable result of a high savings rate. According to this view, restraining credit growth and attempting to boost consumption merely dooms China's ability to escape the middle-income trap, because higher per capita income can only be achieved by further growth in the stock of capital. BCA's China Investment Strategy service does not dispute the notion that a high savings rate can lead to a high leverage ratio, particularly among small, fast-growing economies. But in the case of China, the sharp rise in private sector debt that has occurred since 2010 was not natural, and certainly was not inevitable. Instead, our view is that it was the result of an explicit "least-bad" choice made by policymakers to weather the reality of poor external demand following the global financial crisis. Chart 4 presents, in a nutshell, the theoretical support for the "keep investing" view. The chart depicts real per capita GDP for 80 countries in 2014 as a function of the average share of gross capital formation to GDP from 1960 to 2014. The chart clearly shows that richer countries today have tended to invest more on average in the past, which is entirely consistent with textbook economic theory. Chart 4Higher Investment Has Led To Higher Per Capita GDP Growth...
Is China Making A Policy Mistake?
Is China Making A Policy Mistake?
However, there are two reasons why the simple inference from Chart 4 that China should just "keep investing" is deeply flawed. First, while investment as a share of GDP in China has recently declined from its 2011-2014 peak, it remains close to 45%. This is a massive rate of investment, and a historical review points to the conclusion that it probably cannot be sustained: 45% is nearly off the x-axis scale shown in Chart 4, suggesting that China's current rate of investment is not achievable over extended periods of time. In fact, the chart suggests that 30% is the highest realistic rate of investment as a share of GDP that a country can maintain over an extended period. In 2014, based on the definition of the data from the Penn World Table (GDP share of gross capital formation at current purchasing power parity), China had maintained its investment share above 30% for 12 years. At first blush, there appears to be some precedent suggesting that China's outsized investment run can go on for longer: among the 80 countries included in Chart 4, 14 of them have experienced a longer continuous run of investment as a share of GDP. However, Chart 5 shows that most of these experiences occurred in the 1960s and 1970s, when global exports as a share of GDP were rising from a very low base. This implies that historical examples of outsized investment runs have largely reflected export-driven catch-up stories, which bodes poorly for China's ability to continue to invest at its recent massive scale given that global exports to GDP appear to have peaked. Chart 5...But Very High Rates Of Investment Have Driven By Exports
...But Very High Rates Of Investment Have Driven By Exports
...But Very High Rates Of Investment Have Driven By Exports
Second, the relationship shown in Chart 4 captures the potential gains of profitable and rational investment, or in other words the accumulation of a "useful" stock of capital. But an unfortunate reality facing savers is that while one can choose to save or invest, one cannot necessarily choose the accompanying rate of return. If China invests heavily at very low or negative rates of return, the idea that investment will lead China out of the middle-income trap is very likely wrong. As we have discussed in previous reports, there is good evidence to suggest that the marginal gains from investment in China have been falling. The private sector debt-to-GDP ratio features prominently in the case against profitable investment in China: despite a massive rise in investment and debt from 2002-2007, the private sector debt-to-GDP ratio barely rose, because this debt was used to accumulate capital that verifiably delivered nominal GDP growth. Yet following 2010 the ratio rose sharply, implying that the returns from the investment that has taken place over the past decade have been (at least so far) considerably lower than those of the prior decade. Also, we noted in our August 29 Special Report that state-owned enterprises (SOEs) have accounted for a sizeable portion of the private sector leveraging that occurred after 2010,3 and that the marginal operating gain from debt for SOEs has become negative (Chart 6). A gap between the cost/return on borrowed funds strongly implies that the investment channeled through SOEs over the past several years does not represent, on balance, the accumulation of useful capital. Chart 6Strong Evidence Against Productive SOE Investment
Strong Evidence Against Productive SOE Investment
Strong Evidence Against Productive SOE Investment
In our view, a cohesive story emerges from the above analysis, one that counters the view that China is making a policy mistake by trying to avoid another significant episode of private sector leveraging. China's enormous catchup in per capita GDP over the past 20 years was initially export-led, but was sustained after 2010 by quasi-fiscal spending in the form of a material leveraging of state-owned enterprises. This shadow government spending was aimed at preventing large-scale job losses, but proved to be considerably less productive than the private, export-driven investment-boom that preceded it. This suggests that China is simply investing too much for an economy that needs to accumulate capital for the purposes of domestic production, and that any further, aggressive leveraging of the private sector will simply raise the odds or the cost of the eventual bailout. While investors who are hoping to profit from China's credit excesses may wish for a different outcome, the bottom line is that Chinese policymakers will act in the best interests of their country, and they have good reason to try and shift China's economy away from extremely high rates of investment towards more consumption. Implications For Investment Strategy As would be the case in any other major country, we have no doubt that Chinese policymakers will eventually move to a maximum reflationary stance (which would imply a significant reacceleration in credit growth) if they feel that the existing slowdown will lead to deep, threatening economic instability. The key point for investors is that a desire of policymakers to shift even somewhat away from heavy investment-led growth means that the "strike price" of the China put option has fallen relative to past economic slowdowns, implying that it will take more pain before investors can cash in. Within the universe of Chinese financial assets, there are three pertinent investment strategy questions that arise from this reality: Even if there is more pain to come, Chinese domestic stocks have fallen 30% in local currency terms, and close to 40% in U.S. dollar terms (Chart 7). Is it time to go outright long? Should investors allocating among Chinese stocks favor domestic or investable equities? What is the outlook for CNY-USD? For now, our answers are as follows: 1) not yet, 2) domestic over investable in currency-hedged terms, and 3) weaker (possibly significantly so). Chart 7The Bear Market In A-Shares Is Advanced...
The Bear Market In A-Shares Is Advanced...
The Bear Market In A-Shares Is Advanced...
We agree that 30% is a reasonable estimate of the likely decline in domestic earnings over the coming year, which normally would suggest that A-shares have fully priced the bad news and that investors should consider buying. However, there are two key reasons why we think this conclusion is premature: We noted in our September 19 Weekly Report that the lesson of 2014/2015 was Chinese stocks needed both policy stimulus and earnings clarity before bottoming.4 For now, China's stimulative response has been measured, and we have yet to see any decline in domestic 12-month forward earnings (Chart 8). While it is not the only factor contributing to the decline, the escalation in the trade war with the U.S. acted as a clear negative catalyst for the Chinese stock market. We have argued that the evolution of the trade positions of both sides suggests that the imposition of a third and final round of import tariffs covering all Chinese exports to the U.S. is likely, which would further reduce Chinese earnings visibility for investors. News reports this week suggested that an announcement to this effect could occur in early-December, if a meeting between Presidents Trump and Xi is called off or fails (as we expect). Chart 8...But Forward EPS Have Yet To Start Falling
...But Forward EPS Have Yet To Start Falling
...But Forward EPS Have Yet To Start Falling
Chart 9 presents our framework for forecasting CNY-USD as a function of various U.S. import tariff scenarios, which we used to argue that a break above the psychologically-important level of 7 for USD-CNY appeared likely barring strong action from the PBOC4. The RMB has weakened in line with our view over the past month, and Chart 9 shows that it stands to weaken further, potentially significantly, if the U.S. does move ahead with a 25% import tariff on all imports from China. Chart 9Further Downside In CNY-USD Is Likely
Further Downside In CNY-USD Is Likely
Further Downside In CNY-USD Is Likely
Finally, our negative outlook for the currency informs our view that a relative position favoring domestic over investable stocks should be currency-hedged. Chart 10 shows that an uptrend in relative performance does appear to be forming in local currency terms, but not in U.S. dollar terms (due to the recent renewed weakness in CNY-USD). Chart 10Relative To Investable Stocks, Only Favor A-Shares In Hedged Terms
Relative To Investable Stocks, Only Favor A-Shares In Hedged Terms
Relative To Investable Stocks, Only Favor A-Shares In Hedged Terms
We opened a shadow trade in our July 5 Weekly Report of being long the MSCI China A Onshore index / short MSCI China index,5 which we said we would consider implementing in response to a 5% rally in relative performance. Our intention was to structure this trade in unhedged terms (consistent with most of the trades in our trade book), and our judgement is that it is simply too early to do so despite the fact that a 5% relative rise in U.S. dollar terms has indeed occurred. Signs of a durable bottom in CNY-USD, or an assessment of minimal further downside coupled with strong outperformance of domestic stocks in local currency terms, are likely catalysts for a green light. Jonathan LaBerge, CFA, Vice President Special Reports jonathanl@bcaresearch.com 1 "China Is Struggling To Find Projects To Spend Bond Splurge On", Bloomberg News, October 22, 2018. 2 Pease see China Investment Strategy Special Reports "China: How Stimulating Is The Stimulus?", dated August 8, 2018, and "China: How Stimulating Is The Stimulus? Part Two", dated August 15, 2018, available at cis.bcaresearch.com. 3 Pease see China Investment Strategy Special Report "Chinese Policymakers: Facing A Trade-Off Between Growth And Leveraging", dated August 29, 2018, available at cis.bcaresearch.com. 4 Pease see China Investment Strategy Weekly Report "Investing In The Middle Of A Trade War", dated September 19, 2018, available at cis.bcaresearch.com. 5 Pease see China Investment Strategy Weekly Report "Standing On One Leg", dated July 5, 2018, available at cis.bcaresearch.com. Cyclical Investment Stance Equity Sector Recommendations
If the Chinese government were to deliver a massive dose of traditional fiscal/credit easing, this would boost fixed-asset investment and thus commodity prices, helping emerging markets in the process. Such a dollop of stimulus would also lift global growth.…
Even if our strategists were to turn more positive on global equities after the recent selloff, we would maintain our preference for developed market stocks over emerging markets, despite the latter’s higher beta nature. The wave of liquidity created by…
Question: Why are financial markets rioting, even though China has announced stimulus? Answer: The market’s interpretation is that Chinese stimulus measures adopted thus far are insufficient to reverse China’s growth outlook in the near term. We agree with…
Highlights The correction in global equities is not yet over, but we would turn more constructive if stocks retreated about 6% from current levels. Among the many things bothering investors, the fate of the Chinese economy remains high on the list. Chinese growth continues to slow, with the impact of the trade war yet to be fully felt. Investors are likely to end up being disappointed by both the size and the composition of Chinese stimulus. High debt levels and excess capacity limit the prospective benefits of traditional fiscal/credit easing. Stimulus measures aimed at boosting consumption, which is what the authorities are increasingly focusing on, would help the Chinese economy. However, they would generate only small gains for the rest of the world. A weaker yuan would be outright negative for other economies. Cyclically and structurally, we expect the bond bear market to continue, but slower Chinese growth and a stronger dollar could temporarily cap Treasury yields over the coming months. Feature Correction Slightly More Than Halfway Through We argued in our October 5th report that "prudent investors should consider scaling back risk if they are currently overweight risk assets" because the market was at an elevated risk of a "phase transition" from unbridled optimism to a more sober appreciation of the risks presently facing the global economy.1 The good news is that the ongoing correction will be just that, a correction. Both monetary and fiscal policy in the U.S. remain highly accommodative. The next recession will not occur until late-2020 at the earliest. U.S. equities, which account for over half of global stock market capitalization, rarely enter sustained bear markets outside of recessions (Chart 1). Chart 1Recessions And Bear Markets Usually Overlap
Recessions And Bear Markets Usually Overlap
Recessions And Bear Markets Usually Overlap
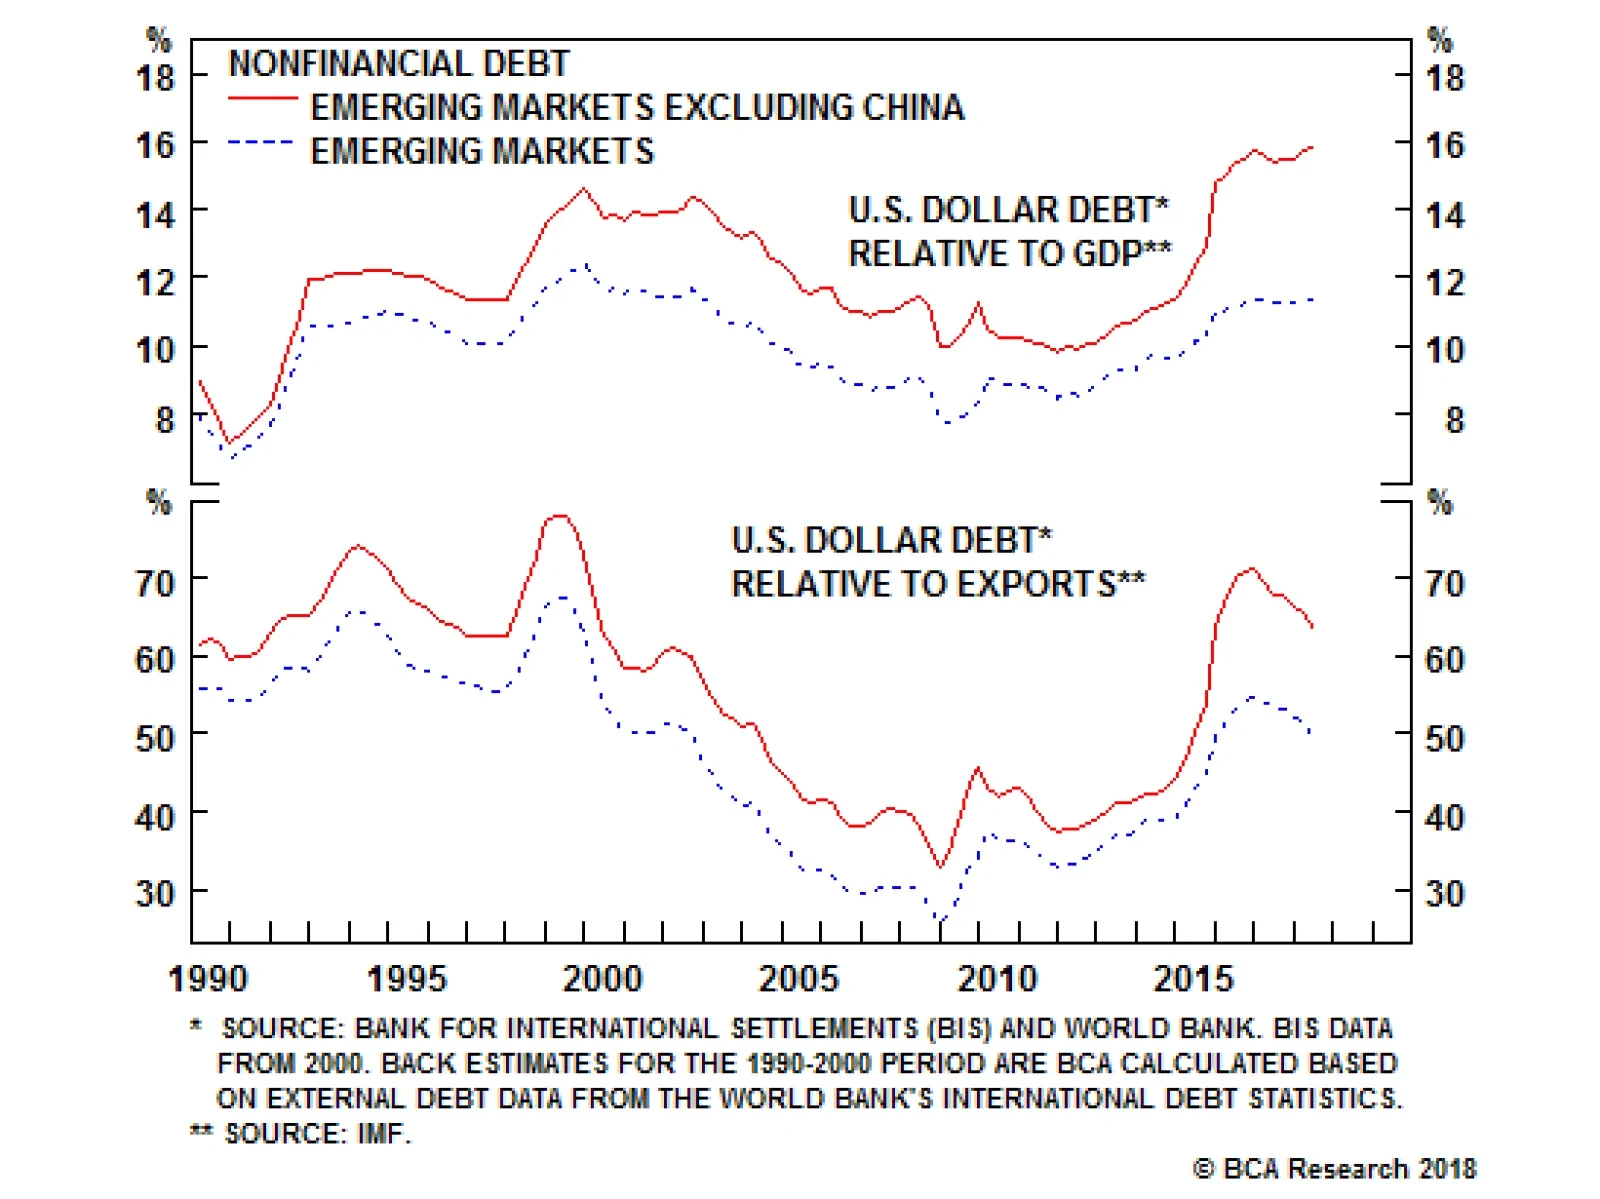
The bad news is that we have yet to reach a capitulation point. As we noted last week, corrections usually end when investors stop believing that they are witnessing a correction and start thinking that a bear market is afoot.2 Normally, stocks need to break through prior support levels several times before "buy the dip" investors throw in the towel. This week saw the S&P 500 fall below its October 11th lows. A few more iterations of this pattern may be necessary. To repeat what we wrote before, barring any major new developments, we would turn bullish on global equities again if the MSCI All-Country World Index were to fall by 12% 10% 8% 6% from current levels. With that in mind, we are putting in a limit order to buy the ACWI ETF at $64.3 Emerging Markets: Time To Pay The Piper Even if we were to turn more positive on global equities, we would maintain our preference for developed market stocks over emerging markets, despite the latter's higher beta nature. The wave of liquidity created by the Fed and other major central banks over the past decade ended up flowing into places where it was not needed. Emerging markets were a prime destination: Dollar-denominated debt in emerging markets now stands at levels reached just before the late-1990s Asian Crisis (Chart 2). Chart 2EM Dollar Debt At Late-1990s Levels
EM Dollar Debt At Late-1990s Levels
EM Dollar Debt At Late-1990s Levels
While EM valuations have cheapened considerably, they are not yet at washed out levels. The latest BofA Merrill Lynch Global Fund Manager Survey showed that managers were slightly net overweight emerging market equities in October. This is a far cry from 2015, when a net 30% of managers were underweight EM stocks. Chinese Stimulus To The Rescue? China figures heavily into the equation. If the Chinese government were to deliver a massive dose of traditional fiscal/credit easing, this would boost fixed-asset investment and thus commodity prices, helping emerging markets in the process. Such a dollop of stimulus would also lift global growth. As a countercyclical currency, the U.S. dollar tends to weaken when global growth accelerates (Chart 3). The reflationary impulse from higher commodity prices and a softer dollar would be manna from heaven for emerging markets. Chart 3Decelerating Global Growth Tends To Be Bullish For The Dollar
Decelerating Global Growth Tends To Be Bullish For The Dollar
Decelerating Global Growth Tends To Be Bullish For The Dollar
If we had strong confidence that such a burst of stimulus were forthcoming, we would be comfortable in calling the end of the global stock market correction now and going overweight EM assets. Unfortunately, the evidence so far suggests that while the Chinese authorities are stimulating the economy, they are not doing so by enough to reignite growth (Chart 4). Chart 4Chinese Growth Remains Soft
Chinese Growth Remains Soft
Chinese Growth Remains Soft
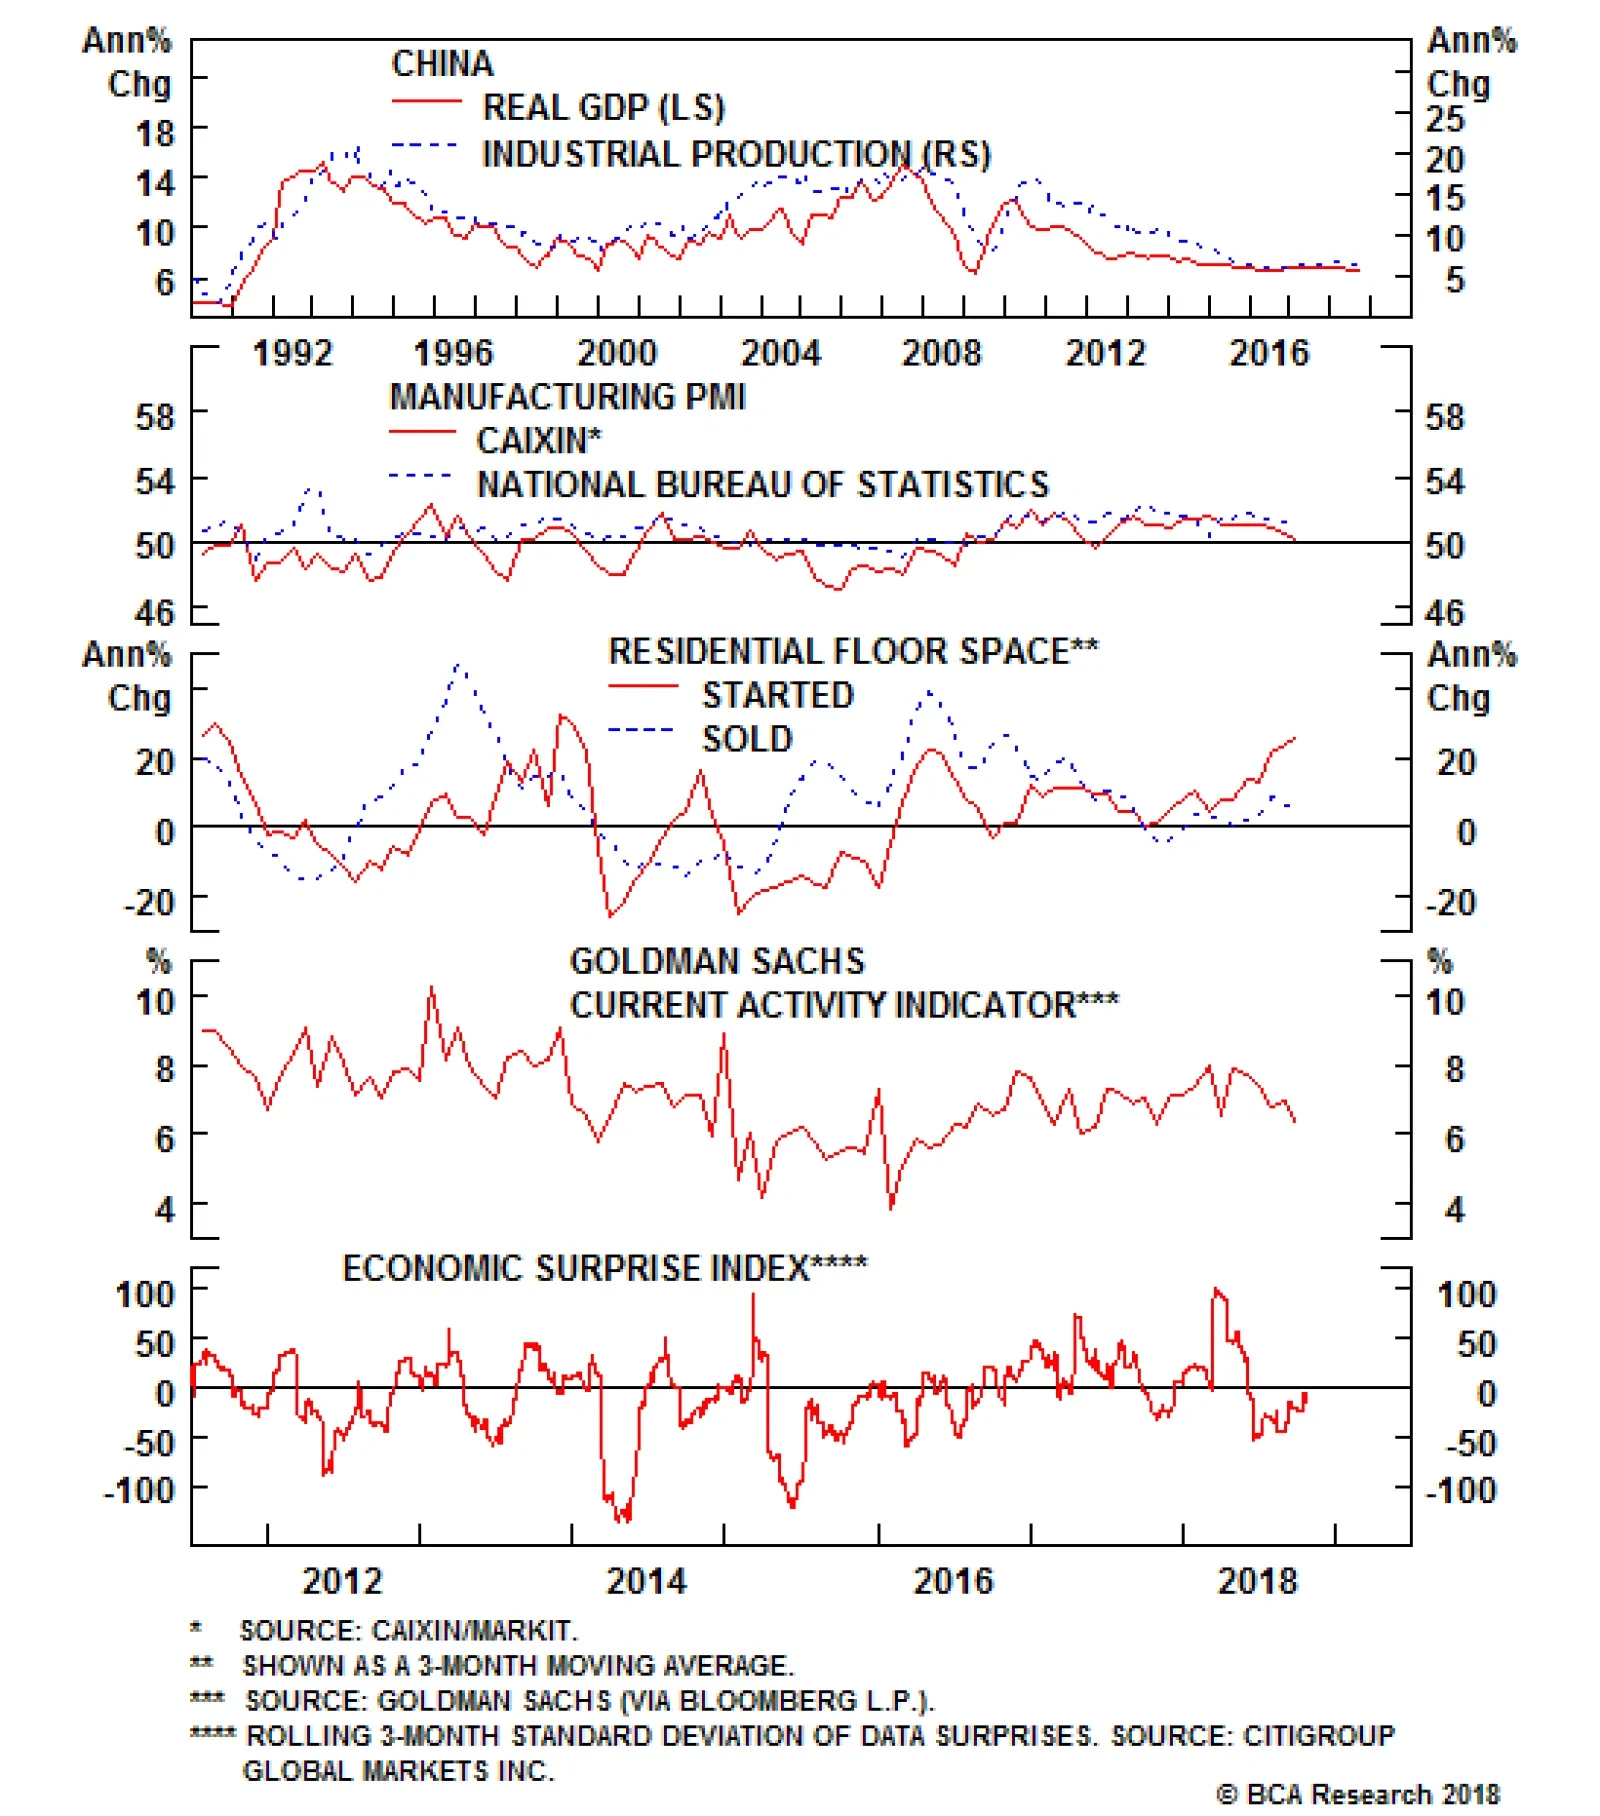
Real GDP increased at a weaker-than-expected pace in the third quarter. Industrial production surprised on the downside in September, echoing declines in the manufacturing PMI. Home sales are running well below housing starts, suggesting downside risk for the latter in the months ahead. Goldman's China Current Activity Indicator has continued to grind lower, while the economic surprise index remains mired in negative territory. Our conversations with clients suggest that most are expecting the recently announced stimulus measures to arrest and then reverse the downward trend in growth. We are not so sure. As our geopolitical team has stressed, the Chinese government has expended a lot of political capital on its reform agenda.4 Abandoning it now would not only cause the government to lose credibility, but it would undermine the very reasons it was implemented in the first place. Waves of stimulus have caused total debt to soar from 140% of GDP in 2008 to 260% of GDP at present (Chart 5). Since most of the new credit has been used to finance fixed-asset investment, China has ended up with a severe overcapacity problem. The rate of return on assets in the state-owned corporate sector has fallen below borrowing costs (Chart 6). Our China team estimates that 15%-to-20% of apartments are sitting vacant.5 Chart 5China: Debt And Capital Accumulation Went Hand In Hand
China: Debt And Capital Accumulation Went Hand In Hand
China: Debt And Capital Accumulation Went Hand In Hand
Chart 6Rate Of Return On Assets Below Borrowing Costs For Chinese SOEs
Rate Of Return On Assets Below Borrowing Costs For Chinese SOEs
Rate Of Return On Assets Below Borrowing Costs For Chinese SOEs
Today, Chinese banks are being told that they must lend more money to support the economy, while ensuring that their loans do not sour. This has become an impossible feat. As such, we are skeptical that the recent acceleration in credit growth will have long legs (Chart 7). Anecdotal evidence suggests that some companies which are receiving credit are simply holding on to the cash, rather than running the risk of being accused of investing in money-losing projects. Monetary policy in China is increasingly pushing on a string. Chart 7China: Only A Modest Acceleration In Credit Growth
China: Only A Modest Acceleration In Credit Growth
China: Only A Modest Acceleration In Credit Growth
Rebalancing: Be Careful What You Wish For This does not mean that China will not try to prop up its economy. It will. But the form of stimulus the government pursues may not be to foreign investors' liking. For example, consider the recently announced income tax reforms, which raise the threshold at which households need to start paying taxes while increasing deductions for education, health, housing, and eldercare. In and of themselves, these measures are admirable and long overdue. The Chinese income tax system is fairly regressive. Poor households face an effective income tax rate exceeding 40%. This is well above OECD norms (Chart 8).6 A more progressive tax system would boost consumption among poorer households. Chart 8High Tax Burden For Low-Income Households In China
Chinese Stimulus: Not So Stimulating
Chinese Stimulus: Not So Stimulating
The snag is that raw materials and capital goods comprise 85% of Chinese imports. As Arthur Budaghyan, BCA's Chief EM strategist, has long noted, policies that boost Chinese consumption are simply less beneficial to the rest of the world than policies that boost investment.7 Pundits who talk about the virtue of "rebalancing" the Chinese economy away from fixed-asset investment and towards consumer spending should be careful what they wish for! The Trade War Will Heat Up One of the more notable aspects of China's recent slowdown is that it has been concentrated in domestic demand rather than in net exports. Remarkably, Chinese exports to the U.S. actually increased by 12% in dollar terms in the first nine months of the year, compared to the same period in 2017. However, judging from the steep drop in the export component of both the official and private-sector Chinese manufacturing PMI, the export sector is likely to come under increasing pressure over the next few quarters as the headwinds from higher tariffs fully manifest themselves (Chart 9). Chart 9China: An Ominous Sign For Exports
China: An Ominous Sign For Exports
China: An Ominous Sign For Exports
Investors hoping that U.S. President Donald Trump and his Chinese counterpart Xi Jinping will reach a deal to end the trade war on the sidelines of the G20 leaders' summit in Buenos Aires on November 29 are likely to be disappointed. As we have stressed in the past, Trump's fiscal policy is completely inconsistent with his trade agenda. Fiscal stimulus in a full-employment economy will suck in imports. It will also force the Fed to raise rates more aggressively than it otherwise would, leading to a stronger dollar. The result will be a larger trade deficit. Trump will not be able to blame Canada or Mexico for a deteriorating trade position because he just signed a "big, beautiful" trade agreement with them (incidentally, the new USCAM USMCA agreement is remarkably similar to the "horrible" one that it replaced with the notable exception that it contains a clause barring Canada and Mexico from negotiating bilateral trade deals with China). This means Trump needs a patsy who will take the blame for America's burgeoning trade deficit. Reaching a deal with China would actually be a strategic mistake for Trump's political career. A Weaker RMB Ahead A weaker Chinese currency would blunt some of the pain inflicted on China's export sector from Trump's tariffs. There is obviously a limit to how far China can let its currency slide, but last week's decision by the U.S. Treasury to refrain from labeling China a currency manipulator will probably embolden the Chinese to allow the currency to depreciate some more from current levels.8 A weaker Chinese currency would be a cold shower for the rest of the world. Not only will it make other economies less competitive in global markets; it will also reduce Chinese imports. Concluding Thoughts Investors spend a lot of time debating the magnitude of China's stimulus plans and not enough time thinking about the composition of that stimulus. Credit/fiscal easing of the sort China has historically engaged in is good for other emerging markets because it sucks in raw materials and capital goods. In contrast, consumption-based stimulus is only modestly beneficial to the rest of the world, while a weaker Chinese currency is an outright negative for other economies. If China focuses more on the latter two types of stimulus and less on the former, global investors are likely to be disappointed. Emerging market assets have cheapened considerably over the past few months and will likely find a bottom in the first half of next year. For now, however, investors should overweight developed market stocks relative to their EM peers. Consistent with our July 5, 2016 call declaring "The End Of The 35-Year Bond Bull Market," both the cyclical and structural trend in bond yields is firmly to the upside. Tactically, however, bonds are deeply oversold (Chart 10). The combination of slower EM growth, disappointments over the magnitude and composition of Chinese stimulus, and a stronger dollar will put a lid on yields over the next few months. Chart 10Treasurys Are Oversold
Treasurys Are Oversold
Treasurys Are Oversold
Peter Berezin, Chief Global Strategist Global Investment Strategy peterb@bcaresearch.com 1 Please see Global Investment Strategy Weekly Report, "The Next U.S. Recession: Waiting For Godot?" dated October 5, 2018. 2 Please see Global Investment Strategy Weekly Report, "Phase Transitions In Financial Markets: Lessons For Today," dated October 19, 2018. 3 Valid during extended trading hours. 4 Please see Geopolitical Strategy and China Investment Strategy Special Report, "How Stimulating Is The Stimulus? Part Two," dated August 15, 2018. 5 Please see Emerging Market Strategy Special Report, "China Real Estate: A Never-Bursting Bubble?" dated April 6, 2018. 6 Please see Global Investment Strategy Special Report, "Is China Heading For A Minsky Moment?" dated April 13, 2018. 7 Please see Emerging Markets Strategy Weekly Report, "The Dollar Rally And China's Imports," dated May 24, 2018. 8 Ironically, while China may not be manipulating its currency based on the Treasury's legal definition, economic logic suggests it is. True, China is no longer buying dollars in a bid to weaken the yuan. In fact, its reserves have actually declined significantly since 2015. However, the value of the yuan is determined not just by current dollar purchases; it is also determined by those that have taken place in the past. If a central bank buys dollars, this bids up the value of those dollars relative to its own currency. If it then stops buying dollars, its currency does not instantly fall back to its original level. All things equal, it just stays where it is. The best parallel is with quantitative easing. Both theory and evidence suggest that it is the stock of bonds that a central bank owns, rather than the flow of bonds in and out of its balance sheet, that determines the level of yields. Strategy & Market Trends Tactical Trades Strategic Recommendations Closed Trades
Highlights Five risks to our bullish dollar stance need to be monitored: further weakness in the S&P 500; rebounding gold prices; stabilizing EM exchange rates and bond prices; Spanish bank stocks at multi-decade lows; and large, long-exposure by speculators to the greenback. However, China's lackluster response to stimulus and the U.S.'s domestic strength still favor the dollar. In fact, the key force likely to cause U.S. growth to converge toward weaker global growth will be a stronger U.S. dollar. Feature BCA has a positive bias toward the dollar for the coming six to nine months. Admittedly, the dollar is expensive, but cyclical determinants still favor a rally. The Federal Reserve is hiking rates as the U.S. economy is at full capacity and goosed up by fiscal injections. Yet global growth is very wobbly. This combination is a potent cocktail for USD strength. Despite these key sources of support, we cannot be dogmatic, especially as financial markets are anticipatory mechanisms, and therefore the dollar could have already priced in some of these developments. As such, this week we explore the key risks to our dollar view. While serious threats for the dollar exist over the upcoming two to three quarters, the key macro and financial drivers remain dollar bullish. The Threats 1) The S&P Sells Off Further The MSCI EAFE index, expressed in USD terms, is down nearly 20% since its January 2018 highs. Meanwhile, the S&P 500 has fallen 9% since its recent all-time high, or 7% vis-Ã -vis where it stood in late January. The risk is that as the global economic slowdown deepens, investors end up selling their good assets along with their bad ones. This means the S&P 500 could fall more. In fact, our colleague Peter Berezin writes in BCA's Global Investment Strategy that U.S. equities could fall an additional 6% from current levels before finding a durable support.1 The problem for the dollar is not whether stock prices fall. It is about what it means for the Fed. Until earlier this week, equity weakness had no impact at all on bonds. However, now, weak stock prices are dragging down U.S. bond yields. Moreover, while the U.S. yield curve slope steepened between August 24 and October 5, it is flattening anew (Chart I-1). All these market moves suggest investors are beginning to price out anticipated interest rate hikes. If U.S. stocks were to fall further, these dynamics would most likely deepen. However, since there is little monetary tightening to price out of the European or Japanese interest rate curves, such a move would likely lead to a dollar-bearish narrowing of interest rate differentials. Chart I-1It Took A Stock Market Rout For Investors To Reconsider The Fed's Path
It Took A Stock Market Rout For Investors To Reconsider The Fed's Path
It Took A Stock Market Rout For Investors To Reconsider The Fed's Path
2) Gold Is Rebounding Keynes might have called gold a barbarous relic of a bygone era, but as an extremely long-duration asset with no cash flow, the yellow metal remains an important gauge of global monetary and liquidity conditions. As the stock of dollar foreign-currency debt is large, a strong dollar is synonymous with tightening global liquidity conditions. Unsurprisingly, since 2017, gold and the dollar have been tightly negatively correlated (Chart I-2). However, since October, this correlation has been breaking down. Both the dollar and gold are moving up. This suggests that the recent increase in U.S. interest rates and in the dollar might not be as deleterious for the world as markets are currently anticipating. Chart I-2Is Gold Not Hating A Strong Dollar Anymore?
Is Gold Not Hating A Strong Dollar Anymore?
Is Gold Not Hating A Strong Dollar Anymore?
Moreover, gold prices often lead EM asset prices. Since gold prices are highly sensitive to global liquidity, this makes sense. When the yellow metal sniffs out whiffs of reflation, it is only a matter of time before EM assets do as well. Since a rally in EM assets would lead to an easing in EM financial conditions, this easing would improve the global growth outlook (Chart I-3). Hence, rising gold prices might be a sign that while investors are increasingly negative on global industrial activity, the light at the end of the tunnel could be around the corner. The dollar would suffer if the outlook for global growth were to improve. Chart I-3EM Financial Conditions Hold The Key To Global Growth
EM Financial Conditions Hold The Key To Global Growth
EM Financial Conditions Hold The Key To Global Growth
3) EM Currencies And EM High-Yield Bonds Stabilizing Something strange is happening. While EM equity prices are still falling, EM high-yield bonds and currencies are not. In fact, EM FX and EM debt prices bottomed at the beginning of September, despite rising U.S. interest rates. However, since then, EM stock prices denominated in USD terms have fallen nearly 10% (Chart I-4). EM exchange rates and yields are the most important determinants of EM financial conditions. This suggests that despite EM stock prices falling fast, EM financial conditions may not be deteriorating as quickly as assumed. Chart I-4Are EM Financial Conditions Easing?
Are EM Financial Conditions Easing?
Are EM Financial Conditions Easing?
This market action is in fact consistent with the development we highlighted in the gold market. We must therefore maintain a watchful eye on EM bonds and EM FX. Further meaningful improvement in these assets, while not BCA's base-case, would dangerously challenge our view that global industrial activity slows further, undermining our dollar-bullish view. 4) Spanish Banks Near Post-2008 Lows As we highlighted in August, Spanish banks are the most exposed major banks in the world to EM woes (Chart I-5).2 The exposure of the Spanish banking sector to the weakest EM economies represents 170% of capital and reserves, which is driving the entire euro area's exposure to these markets to 32% of Eurozone banks' capital and reserves. Chart I-5Who Has More Exposure To EM?
Risks To The Dollar View
Risks To The Dollar View
The weakening in EM expected growth and the fall in EM currencies is a risk for Spanish banks. However, Spanish banks also maintain a large chunk of their EM exposure in wholly or partly owned subsidiaries. This means that while an EM crisis will definitely have an important impact on Spanish bank earnings, the impact on the balance sheet of Spanish banks is likely to be more limited. However, Spanish banks now trade in line with the levels that prevailed in Q1 2009, Q3 2012 and Q1 2016 (Chart I-6). In other words, Spanish banks are already pricing in a crisis, especially after the Spanish Supreme Court ruled that banks - not customers - must pay mortgage duties. Chart I-6Spanish Banks Are Discounting Plenty Of Bad News
Spanish Banks Are Discounting Plenty Of Bad News
Spanish Banks Are Discounting Plenty Of Bad News
While markets may not be the most efficient mechanism when it comes to pricing future shocks, markets are very efficient at lateral pricing - i.e. the pricing of an event in one market, even if wrong, will be equally reflected in other markets. If the impact of an EM crisis is fully priced into Spanish banks, the impact of such a crisis is likely to also be reflected in the expectations of what the European Central Bank will do over the coming quarters, and thus it is also priced into the euro. The pessimism already present in Spanish banks and euro area financial equities may explain why the euro has not cracked below its August 17 lows, while global stock prices have. The bad news could simply already be baked into the cake! If Spanish bank stocks rebound, the dollar is likely to suffer; if they break down, the dollar will likely rally more. 5) Speculators Are Already Long The Dollar For the dollar to rise further, someone needs to buy it. The problem is that speculators have already been buying the greenback, and they are now aggressively long the dollar (Chart I-7). This means that it may become more difficult to find new buyers for U.S. dollars, especially as investors may be in the process of unloading their U.S. equities. To be fair, while it is true that the net speculative positions are elevated, they also can remain so for extended periods. Chart I-7Investors Are Long The Dollar
Investors Are Long The Dollar
Investors Are Long The Dollar
Bottom Line: There are important risks to our dollar-bullish view that we need to closely monitor. They are: the global stock selloff migrating to the U.S., which could prompt investors to price out Fed rate hikes; gold rebounding, which might indicate marginal improvement in global liquidity conditions; EM exchange rates and high-yield bonds not weakening anymore, which could result in an easing in financial conditions, ending the deterioration in global growth; Spanish banks potentially already pricing in a dire outcome in EM; and speculators being already long the dollar. Despite these Risks, Why Do We Still Like The Dollar? The first reason relates to global growth. Ultimately, the dollar is a counter-cyclical currency. When global growth weakens, the dollar strengthens. China continues to generate potent headwinds for the world economy. Beijing has been stimulating the Chinese economy, but this stimulus is having a muted impact. As Arthur Budaghyan writes in the week's Emerging Market Strategy report, China's monetary stimulus is falling flat.3 Not only are excess reserves in the banking sector rather meager, Chinese banks are not showing a deep propensity to lend. It is not just about the behavior of Chinese banks: Chinese firms are also not displaying a high propensity to spend and borrow, which is weighing on the velocity of money in China (Chart I-8). As a result, this means that liquidity injections are not generating much impact in terms of loan growth and economic activity. Chart I-8Chinese Stimulus Is Falling Flat Because Economic Agents Are Cautious
bca.fes_wr_2018_10_26_s1_c8
bca.fes_wr_2018_10_26_s1_c8
This is evident when looking at two variables. China's Li-Keqiang Index, our preferred measure of Chinese industrial activity, has stopped rebounding. In fact, it is currently weakening anew, which suggests that Chinese growth, despite all the supposed easing in monetary conditions, is not responding (Chart I-9, top panel). Moreover, Chinese infrastructure spending is also contracting at its fastest pace in 14 years (Chart I-9, bottom panel). Further, the slowing in Chinese real estate sales suggests that construction will not come to the rescue, especially as vacancy rates in Chinese major cities currently stand at elevated levels. Chart I-9Chinese Growth Outlook Is Deteriorating Anew
Chinese Growth Outlook Is Deteriorating Anew
Chinese Growth Outlook Is Deteriorating Anew
We continue to monitor our China Play index (Chart I-10) to see if China is showing any underlying improvement, but the rally evident from June to October is now dissipating. The impact of stimulus thus looks like it is leaving investors wanting for more. Yet, as Matt Gertken and Roukaya Ibrahim argue in this week's Geopolitical Strategy service, additional stimulus will be limited as Xi Jinping is not yet abandoning his three battles against indebtedness, pollution and poverty.4 Hence, we expect China to remain a significant drag on global growth over the coming two to three quarters. Chart I-10China-Related Plays Are Losing Momentum
China-Related Plays Are Losing Momentum
China-Related Plays Are Losing Momentum
The second issue that supports our bullish-dollar stance is the mechanism required for U.S. and global growth to converge. As Ryan Swift argues in BCA's U.S. Bond Strategy service, U.S. growth will not be able to avoid the gravitational pull of a weaker global economy.5 The type of divergence currently on display between the global and U.S. Leading Economic Indicators (LEIs) is generally followed by a deteriorating U.S. growth outlook (Chart I-11). Chart I-11U.S. Growth Ultimately Converges With The Rest Of The World
U.S. Growth Ultimately Converges With The Rest Of The World
U.S. Growth Ultimately Converges With The Rest Of The World
However, this weakening in U.S. growth won't happen out of nowhere. Either there will be domestic vulnerabilities that prompt the U.S. to become more sensitive to foreign shocks, or the dollar will force this adjustment. Today, unlike in 2015 and 2016, the sales-to-inventory ratio does not point to any imminent decline in U.S. industrial activity; to the contrary, it suggests further improvements in the coming months (Chart I-12). This leaves the dollar as the main culprit to put the brakes on U.S. growth. Chart I-12U.S. Domestic Fundamentals Are Fine
U.S. Domestic Fundamentals Are Fine
U.S. Domestic Fundamentals Are Fine
Since 2009, the greenback has been very responsive to the relative growth outlook between the U.S. and the rest of the world. The accumulated gap between the U.S. and global LEIs shows the total impact of growth divergences. This indicator has done a good job at foretelling how the dollar will trade (Chart I-13). The dollar tends to respond to U.S. growth outperformance. Only once the dollar has rallied enough to meaningfully tighten U.S. financial conditions does the U.S. growth outlook deteriorate vis-Ã -vis the rest of the world. Currently, this chart suggests we are nowhere near having reached a chokepoint for U.S. growth. Chart I-13A Higher Dollar Needed For U.S. Growth To Resist The Gravitational Pull From The Rest Of The World
A Higher Dollar Needed For U.S. Growth To Resist The Gravitational Pull From The Rest Of The World
A Higher Dollar Needed For U.S. Growth To Resist The Gravitational Pull From The Rest Of The World
Since the Fed remains quite unconcerned by the weakness in global growth and global stock prices, we expect that world financial markets will have to plunge deeper, the dollar to rally higher and U.S. financial conditions to tighten further before the FOMC shows enough concern to hurt the dollar. We are not there yet. Bottom Line: The absence of a meaningful response by the Chinese economy to stimulus suggests that China may have hit a debt wall. This implies that Chinese growth remains fragile and therefore a drag on global growth. Hence, international economic activity and trade will continue to provide an important tailwind for the U.S. dollar. Meanwhile, the U.S. economy is not displaying enough domestic vulnerabilities to be overly sensitive to the softness in global growth. Instead, more rounds of dollar strength will be required to force U.S. growth to converge lower toward global economic activity. As such, these two forces remain powerful enough to overweight currency exposure to the USD within global portfolios. That said, the five risks described in the previous section must be kept in mind. At the current juncture, they only warrant buying a few hedges, such as our long NZD/USD recommendation, but they do not warrant underweighting the greenback. Mathieu Savary, Vice President Foreign Exchange Strategy mathieu@bcaresearch.com 1 Please see Global Investment Strategy Special Report, "Chinese Stimulus: Not so Stimulating", dated October 26, 2018, available at gis.bcaresearch.com 2 Please see Foreign Exchange Strategy Special Report, "The Bear And The Two Travelers", dated August 17, 2018, available at fes.bcaresearch.com 3 Please see Emerging Markets Strategy Weekly Report, "China: Stimulus, Deleveraging And Growth", dated October 25, 2018, available at ems.bcaresearch.com 4 Please see Geopolitical Strategy Special Report, "China Sticks To The "Three Battles", dated October 24, 2018, available at gps.bcaresearch.com 5 Please see U.S. Bond Strategy Weekly Report, "Waiting For Peak Divergence", dated October 23, 2018, available at usbs.bcaresearch.com Currencies U.S. Dollar Chart II-1USD Technicals 1
USD Technicals 1
USD Technicals 1
Chart II-2USD Technicals 2
USD Technicals 2
USD Technicals 2
Recent data in the U.S. has been mixed: Markit Services PMI outperformed expectations, coming in at 54.7. This measure also increased from the previous month's reading of 53.5. However, durable good ex-defense month-on-month growth underperformed expectations, coming in at -0.6%. Finally, monthly new homes sales underperformed expectations, coming in at an annualized pace of 553 thousand. DXY has appreciated by 0.8% this week. We are bullish on the U.S. dollar on a cyclical basis. Furthermore, momentum, one of the strongest predictive factors for the dollar continues to be positive. Finally, global growth should continue to slowdown, as the monetary tightening by Chinese authorities starts to weigh on the global industrial cycle. Report Links: In Fall, Leaves Turn Red, The Dollar Turns Green - October 12, 2018 Policy Divergences Are Still The Name Of The Game - August 14, 2018 The Dollar And Risk Assets Are Beholden To China's Stimulus - August 3, 2018 The Euro Chart II-3EUR Technicals 1
EUR Technicals 1
EUR Technicals 1
Chart II-4EUR Technicals 2
EUR Technicals 2
EUR Technicals 2
Recent data in the euro area has been negative: Markit Manufacturing PMI surprised to the downside, coming in at 52.1. Moreover, Markit Services PMI also underperformed expectations, coming in at 53.3. Finally, private loan yearly growth surprised negatively, coming in at 3.1%. EUR/USD has fallen by 0.8% this week. We are bearish on the euro on a cyclical basis, as inflationary pressures continue to be too weak in the euro area for the ECB to start raising rates. Moreover, the fact that the euro area's economy is highly dependent on exports, makes it very sensitive to global growth and emerging markets. This means that the tightening by Chinese authorities should impact the euro area economy negatively, and consequently, put downward pressure on EUR/USD. Report Links: Will Rising Wages Cause An Imminent Change In Policy Direction In Europe And Japan? - October 5, 2018 Policy Divergences Are Still The Name Of The Game - August 14, 2018 Time To Pause And Breathe - July 6, 2018 The Yen Chart II-5JPY Technicals 1
JPY Technicals 1
JPY Technicals 1
Chart II-6JPY Technicals 2
JPY Technicals 2
JPY Technicals 2
Recent data in Japan has been mixed: The leading economic Index outperformed expectations, coming in at 104.5. However, the coincident index surprised to the downside, coming in at 116.7. USD/JPY has been flat this week. We are neutral on the yen on a tactical basis, given that the current risk-off environment should continue to help safe havens like the yen. However, we are bearish on the yen on a cyclical basis, as inflation expectations are not well anchored in Japan. This means that the BoJ will continue to conduct ultra-dovish monetary policy for the foreseeable future, putting a cap on how high the yen can rise. Report Links: Will Rising Wages Cause An Imminent Change In Policy Direction In Europe And Japan? - October 5, 2018 Rhetoric Is Not Always Policy - July 27, 2018 Updating Our Long-Term FX Fair Value Models - June 22, 2018 British Pound Chart II-7GBP Technicals 1
GBP Technicals 1
GBP Technicals 1
Chart II-8GBP Technicals 2
GBP Technicals 2
GBP Technicals 2
GBP/USD has decreased by 1.5% this week. Given the lack of a geopolitical risk premium embedded into the pound, we expect GBP volatility to remain elevated. This means that any hiccups in Brexit negotiations could bring about some downside for the pound. Furthermore, inflation should remain contained, even amid a tight labour market. This is mainly because inflation dynamics in the U.K. are much more driven by the external sector, as imports represent a very large portion of British final demand. Given that the pound has remained stable this year, inflation will remain subdued. We are currently short GBP/NZD in our portfolio, to take advantage of the dynamics mentioned above. Report Links: Clashing Forces: The Fed And EM Financial Conditions - October 19, 2018 Updating Our Long-Term FX Fair Value Models - June 22, 2018 Inflation Is In The Price - June 15, 2018 Australian Dollar Chart II-9AUD Technicals 1
AUD Technicals 1
AUD Technicals 1
Chart II-10AUD Technicals 2
AUD Technicals 2
AUD Technicals 2
AUD/USD has been flat this week. We are most bearish on this currency within the G10, given that the AUD is highly sensitive to the Chinese industrial cycle, which will continue to slow down, as Chinese authorities keep cleaning credit excesses in the economy. Moreover, policy tightening by the Fed will provide a further headwind to cyclical plays like the AUD. We are short AUD/CAD within our portfolio, as we believe that the oil currencies should fare better than other commodity currencies, given that OPEC supply cuts, as long as Iranian sanction in oil will keep upward pressure on oil prices. Report Links: Policy Divergences Are Still The Name Of The Game - August 14, 2018 What Is Good For China Doesn't Always Help The World - June 29, 2018 Updating Our Long-Term FX Fair Value Models - June 22, 2018 New Zealand Dollar Chart II-11NZD Technicals 1
NZD Technicals 1
NZD Technicals 1
Chart II-12NZD Technicals 2
NZD Technicals 2
NZD Technicals 2
NZD/USD has been flat this week. We are positive on the New Zealand dollar, particularly against the GBP, as there is very little room for kiwi rate expectations to fall. Moreover, this currency should also outperform the Australian dollar, given that New Zealand is less exposed to the Chinese industrial cycle than Australia. Nevertheless, we remain bearish on the NZD on a long-term basis, given that the new government proposals to reduce immigration and add an unemployment mandate to the RBNZ will lower the neutral rate in New Zealand, which will limit the central bank's ability to tighten monetary policy. Report Links: Clashing Forces: The Fed And EM Financial Conditions - October 19, 2018 In Fall, Leaves Turn Red, The Dollar Turns Green - October 12, 2018 Updating Our Long-Term FX Fair Value Models - June 22, 2018 Canadian Dollar Chart II-13CAD Technicals 1
CAD Technicals 1
CAD Technicals 1
Chart II-14CAD Technicals 2
CAD Technicals 2
CAD Technicals 2
Recent data in Canada has been negative: Core inflation underperformed expectations, coming in at 1.5%. This measure also decreased form 1.7% last month. Headline inflation also surprised to the downside, coming in at 2.2%. This measure decreased significantly, coming down from 2.8% the previous month. The Bank of Canada increased rates to tk% on Wednesday, and highlighted the potential for additional rate hikes over the coming 12 months. USD/CAD has been mostly flat this week. The upside in the CAD versus the USD is likely to be limited as the policy tightening by the BoC now seems well anticipated by market participants. To take advantage of this reality, we went short CAD/NOK in our portfolio. This cross also serves as a hedge to our long dollar view, given its positive correlation to the DXY. Despite some headwinds, the CAD should outperform the AUD, as we expect that oil will do better than base metals within the commodity complex. Report Links: Clashing Forces: The Fed And EM Financial Conditions - October 19, 2018 Updating Our Long-Term FX Fair Value Models - June 22, 2018 Inflation Is In The Price - June 15, 2018 Swiss Franc Chart II-15CHF Technicals 1
CHF Technicals 1
CHF Technicals 1
Chart II-16CHF Technicals 2
CHF Technicals 2
CHF Technicals 2
EUR/CHF has fallen by 0.5% this week, as investors have grown worried with the recent sell off in equities. We are bearish on the franc on a cyclical basis, given that inflation in Switzerland is still too weak for the SNB to move away from their ultra-dovish monetary policy. Moreover, Helvetic real estate prices should continue to fall, as the restrictions on immigration put forth by the Swiss government since 2014 should continue to weigh on housing demand. This will further hamper the ability of the SNB to tighten its extraodinarly accommodative monetary policy. That being said, EUR/CHF could continue to fall in the near term, as money flows into safe heaven assets amid the current sell off in equities. Report Links: Updating Our Long-Term FX Fair Value Models - June 22, 2018 Updating Our Intermediate Timing Models - May 18, 2018 Value Strategies In FX Markets: Putting PPP To The Test - May 11, 2018 Norwegian Krone Chart II-17NOK Technicals 1
NOK Technicals 1
NOK Technicals 1
Chart II-18NOK Technicals 2
NOK Technicals 2
NOK Technicals 2
USD/NOK has risen by 0.9% this week. As expected, yesterday the Norges Bank left rates unchanged at 0.75%. In its report, the Norwegian central bank highlighted that although economic growth has been a little lower than anticipated, inflation has been somewhat higher than expectations. We are bullish on the krona against the Canadian dollar, given that rate hike expectation in Canada are much more fully priced in than in Norway even though the inflationary backdrop is very similar. Moreover, we are positive on the krone relatively to other commodity currencies like the AUD or the NZD, as we expect oil to outperform other commodities thanks to supply cuts by OPEC and sanctions against Iran. Report Links: Clashing Forces: The Fed And EM Financial Conditions - October 19, 2018 Updating Our Long-Term FX Fair Value Models - June 22, 2018 Updating Our Intermediate Timing Models - May 18, 2018 Swedish Krona Chart II-19SEK Technicals 1
SEK Technicals 1
SEK Technicals 1
Chart II-20SEK Technicals 2
SEK Technicals 2
SEK Technicals 2
USD/SEK has rallied by 1% this week. We are positive on USD/SEK on a short-term basis, given that the SEK is the currency which is most negatively affected by the strength of the U.S. dollar. Furthermore, tightening by Chinese authorities should also weigh on the krona, given that the Swedish economy is very levered to the global industrial cycle, as many of its exports are intermediate goods that are then re-exported to emerging markets. That being said, we are bullish on the krona on a longer-term basis, as the Riksbank is on the verge of beginning a tightening cycle as imbalances in the Swedish economy are only growing more dangerous. Report Links: Updating Our Long-Term FX Fair Value Models - June 22, 2018 Updating Our Intermediate Timing Models - May 18, 2018 Value Strategies In FX Markets: Putting PPP To The Test - May 11, 2018 Trades & Forecasts Forecast Summary Core Portfolio Tactical Trades Closed Trades
We have now had two months of full data – August and September – since China’s top leaders announced in late July that they would ease economic policy. The data show that there has not been a major acceleration in total private credit growth. This is based on…
Getting the Chinese economy forecast right requires getting the Chinese credit forecast right, as the latter has been a consistent driver of the former since 2010 (see chart). And getting the Chinese credit forecast right requires getting the Chinese policy…
Mounting supply-side uncertainty will keep the risk premium in oil prices - and volatility - elevated after U.S. export sanctions against Iran kick in November 4 (Chart of the Week). Chart of the WeekOil-Price Risk Premium Will Continue To Increase
Risk Premium In Oil Prices Rising; KSA Lifts West Coast Export Capacity
Risk Premium In Oil Prices Rising; KSA Lifts West Coast Export Capacity
These sanctions likely will remove 1.0 - 1.5mm b/d of Iranian exports, and absorb the combined spare capacity of the Kingdom of Saudi Arabia (KSA) and Russia (Chart 2) in the process. Export capacity expansions on KSA's West coast - intended to keep oil flowing if the Strait of Hormuz is closed - put the supply-side risks sharply in focus. Chart 2Lost Iranian Exports Could Exceed KSA's and Russia's Spare Capacity
Risk Premium In Oil Prices Rising; KSA Lifts West Coast Export Capacity
Risk Premium In Oil Prices Rising; KSA Lifts West Coast Export Capacity
OPEC 2.0's production increases last month calmed markets.1 All the same, it is worth noting they occurred just before a widely expected U.S. Strategic Petroleum Reserve (SPR) release coinciding with refinery turnarounds, and one-off Asian demand shocks. On the back of these supply boosts, and an upward revision to U.S. shale output (see below), and a slight decrease in our expected demand growth next year, we lowered our 2019 Brent forecast to $92/bbl from $95/bbl. We now expect Brent prices to peak in April 2019. WTI will trade $6/bbl lower (Chart 3). Our forecasts are conditioned on Iranian export losses of 1.25mm b/d, and Venezuelan losses of just over 450k b/d. A loss of 1.7mm+ b/d of Iran exports, as Platts Analytics expects, or a Venezuela collapse, means an unplanned outage anywhere will take prices above $100/bbl. Chart 3OPEC 2.0 Production Hike Pushes Price Spike To 2Q19
OPEC 2.0 Production Hike Pushes Price Spike To 2Q19
OPEC 2.0 Production Hike Pushes Price Spike To 2Q19
Highlights Energy: Overweight. The IMF downgraded global GDP growth expectations from 3.9% to 3.7% p.a. this year and next. This reduced our base case demand growth for 2019 slightly, to 1.5mm b/d from 1.6mm b/d previously. Base Metals: Neutral. Global copper stocks stand at half their late April peak - the lowest level since late 2016, on the back of restrictions on Chinese scrap imports. Precious Metals: Neutral. Palladium traded to record levels above $1,140/oz this week, as persistent physical deficits into 2020 are priced into the market. Ags/Softs: Underweight. The USDA's Crop Progress Report showed soybean harvests accelerating: 53% of the crop was harvested as of last week, below the 2013 - 17 average of 69%, but well above the previous week's 38% level. Feature U.S. Treasury Secretary Steve Mnuchin is convinced global oil markets have fully priced in the loss of Iranian crude oil exports arising from the re-imposition of export sanctions by the U.S. November 4. Speaking with Reuters over the weekend, he said, "Oil prices have already gone up, so my expectation is that the oil market has anticipated what's going on in the reductions. I believe the information is already reflected in the price of oil."2 We are not so sure. The price-decomposition model shown in the Chart of the Week is a bottom-up fundamental model that assesses how changes in OPEC and non-OPEC supplies, global demand and inventories contribute to overall price changes, as new information becomes available regarding these variables. These variables are shown in Chart 4 and Table 1.3 Chart 4BCA Global Oil Supply-Demand Balances
BCA Global Oil Supply-Demand Balances
BCA Global Oil Supply-Demand Balances
The "residual" term in the model covers everything not explained by these fundamental variables.4 We believe the unexplained effect on prices in the residuals reflects market participants' perception of riskiness - either to supply or demand - given the big fundamental drivers of price are accounted for in the other variables. Table 1BCA Global Oil Supply - Demand Balances (MMb/d)
Risk Premium In Oil Prices Rising; KSA Lifts West Coast Export Capacity
Risk Premium In Oil Prices Rising; KSA Lifts West Coast Export Capacity
Close inspection reveals the residual term has been increasing as we approach the deadline for the re-imposition of U.S. sanctions on Iran. And the fact is, estimates of the loss in Iranian exports are widely dispersed - from less than 1mm b/d to 1.7mm b/d by tanker trackers like Platts Analytics. As Chart 2 shows, export losses at the high end of this range would absorb almost all of the world's spare capacity - the 1.3mm b/d the U.S. EIA estimates for OPEC (most of it held by KSA, plus whatever other Gulf Arab producers can muster). Russia, which is producing at a record of ~ 11.4mm b/d, likely has ~ 250k b/d of spare capacity at its disposal. With the increase in global demand largely being covered by U.S. shales, which are constrained to ~ 1.3mm b/d of growth p.a. until 2H19, when we expect production to increase at a 1.44mm b/d annual rate, this leaves the global market perilously exposed to any and all unplanned production outages. Any deterioration in Venezuela's production, which we expect to fall to 865k b/d on average in 2019 (versus 1.3mm b/d on average this year), or an unplanned loss in exports from historically unstable states like Nigeria and Libya - where we raised our production estimates to 1.75mm b/d and 1.05mm b/d in line with OPEC survey data - almost surely will spike prices above $100/bbl.5 OPEC 2.0 Got Lucky OPEC 2.0 - the producer coalition led by KSA and Russia - picked a fortuitous moment to increase production this past month. OPEC, led by KSA, lifted crude and liquids production 140k b/d in September, while Russia's production rose 150k b/d. It is worth noting these output increases occurred just before a widely expected U.S. SPR release in October - November, which overlapped with refinery maintenance (turnaround) season in the U.S. Midwest refiners were expected to take 300k to 460k b/d of capacity offline in September and October, a relatively high level of maintenance, while Gulf Coast refiners were expected to take 430k to 535k b/d down.6 Both events raise the supply of crude relative to demand, and reduce inventory drawdowns. In addition, one-off Asian demand shocks - an earthquake and typhoon in Japan - dented demand. KSA lifted its production to 10.5mm b/d in September, bringing average 3Q18 production to 10.4mm b/d versus a bit more than 10mm b/d in 1H18. Russia's crude and liquids output rose to 11.45mm b/d in 3Q18 versus 11.2mm b/d in 1H18. The higher production calmed markets somewhat. OPEC 2.0 effectively got a two-month assist from the U.S. refinery turnarounds and a U.S. SPR release, just as markets were fretting prices would breach $90/bbl earlier this month.7 These production boosts will allow OECD inventories to rebuild somewhat going in to the Northern Hemisphere's winter (Chart 5). Nonetheless, OPEC 2.0 has begun tearing into spare capacity with these output increases. Chart 5OPEC 2.0 Production Boost Allows OECD Stocks To Rebuild
OPEC 2.0 Production Boost Allows OECD Stocks To Rebuild
OPEC 2.0 Production Boost Allows OECD Stocks To Rebuild
KSA Talks Markets Lower... While the U.S. SPR release and inventory builds associated with U.S. turnarounds progressed, KSA's Energy Minister Khalid al-Falih was reassuring markets the Kingdom can ramp production to 11mm b/d, and even 12mm b/d if needs be. KSA has been increasing rig counts in 2H18 as Brent prices rise, but we remain highly dubious KSA can ramp production to 11mm b/d - let alone 12mm b/d - and sustain it for any meaningful length of time (Chart 6). Chart 6KSA Increasing Rig Counts, After Price-Induced Slowdown
KSA Increasing Rig Counts, After Price-Induced Slowdown
KSA Increasing Rig Counts, After Price-Induced Slowdown
The likelihood KSA can significantly boost production before the end of 1H19 became even more doubtful, following reports the Kingdom and Kuwait were having difficulty agreeing on restarting Neutral Zone production. We've downgraded our assessment that 350k b/d of Neutral Zone production will be returned to the market beginning in 2Q19 to a 50% likelihood, following reports KSA and Kuwaiti officials are diverging on operational control of the production. Apparently, the two states also differ on geopolitical issues in the Gulf, as well - e.g., the Qatar blockade lead by KSA, and Iran policy.8 While core Gulf Arab producers are raising output, we expect the non-Gulf members of the Cartel continue to see output decline (Chart 7). Indeed, with the exception of the core OPEC Gulf Arab producers, U.S. shale operators and Russia, the rest of the world is barely keeping its output level (Chart 8). Chart 7Non-Gulf OPEC Output Continues to Decline
Non-Gulf OPEC Output Continues to Decline
Non-Gulf OPEC Output Continues to Decline
Chart 8Global Production Growth Stalls Outside U.S. Onshore, GCC And Russia
Global Production Growth Stalls Outside U.S. Onshore, GCC And Russia
Global Production Growth Stalls Outside U.S. Onshore, GCC And Russia
...And Shores Up Export Capacity Export capacity expansions on KSA's West coast - intended to keep oil flowing if the Strait of Hormuz is closed - put global supply-side risks sharply in focus. KSA has added 3 mm b/d of oil export capacity to the Red Sea coast of the Kingdom, with an upgrade to its Yanbu crude oil terminal. Prior to the expansion, Yanbu terminal's export capacity was 1.3mm b/d; it was used mainly for refined products and petrochemicals shipments, due to its relative proximity to refineries in Yanbu, Rabigh, Yasref, Jeddah and Jazan. Shipping via the Red Sea port allows KSA to move crude to Asia through the Bab el-Mandeb Strait to the south, which at times is threatened by Yemen's Houthi militia, and the north to Western markets through the Suez Canal. In addition, KSA's national oil company, Aramco, says it intends to restore operations at al-Muajjiz crude oil terminal, which has been out of operation since Iraq's invasion of Kuwait in 1990. Aramco intends to integrate the Muajjiz terminal into the Yanbu facilities to expand Red Sea export capacity from ~ 8 mm b/d to some 11.5 mm b/d. KSA's total export capacity is scheduled to reach 15mm b/d by year-end. These expansions give KSA the option to reroute all of its ~ 7mm b/d exports through the Red Sea, in the event the Strait of Hormuz is closed by Iran. However, this option could be limited by pipeline infrastructure. The current capacity of the East - West crude pipeline is 5mm b/d, although Aramco signalled its intention to boost capacity to 7mm b/d by end-2018. No announcements indicating this was on schedule or completed could be found. Global Demand Holds Up The IMF downgraded its global GDP growth expectation from 3.9% p.a. to 3.7% this year and next. This reduced our base case demand growth for 2019 to 1.5mm b/d from 1.6mm b/d. Even so, we note that oil prices for EM consumers in local-currency terms are at or close to post-GFC highs (Charts 9A and9B). A number of EM governments relaxed or removed subsidies on fuel prices following the oil-price collapse of 2014 - 16, which means consumers in these states are feeling most or all of the effect of higher prices directly for the first time in the modern era (beginning in the 1960s, when OPEC became the dominant producer cartel in the market).9 Chart 9ALocal-Currency Cost Of Oil In Select EM Economies
Local-Currency Cost Of Oil In Select EM Economies
Local-Currency Cost Of Oil In Select EM Economies
Chart 9BLocal-Currency Cost Of Oil In Select EM Economies
Local-Currency Cost Of Oil In Select EM Economies
Local-Currency Cost Of Oil In Select EM Economies
As we've noted previously, high fuel costs (in local-currency terms) coupled with high absolute prices deliver a double-whammy to EM consumers, which are the driving force in global oil-demand growth. In fact, 1.1mm b/d of the 1.5mm b/d of demand growth we expect next year in our base case is accounted for by EM growth. In our scenarios analysis, we assume every $10/bbl jump in prices above $90/bbl destroys 100k b/d of EM demand. This lowers the unconstrained oil-price trajectory, and reduces our base case growth estimate of 1.5mm b/d next year to 1.3mm b/d (Chart 10). Chart 10An Oil-Supply Shock Would Lower Demand
An Oil-Supply Shock Would Lower Demand
An Oil-Supply Shock Would Lower Demand
An oil-supply shock that seriously erodes EM demand would - in the course of months, we believe - translate into a disinflationary impulse into DM markets. This could force the Fed to change course and dial its rates-normalization policy back, as we recently noted.10 Bottom Line: Volatility will remain elevated following the re-imposition of sanctions against Iran's oil exports next month. OPEC 2.0's fortuitously timed production increases - coincident with a scheduled U.S. SPR release and refinery turnarounds - will be absorbed by markets once turnaround season ends in the U.S. Global spare capacity is insufficient to cover Iranian export losses at the high end of market expectations, if Venezuelan production falls more than expected or that state collapses. Any unplanned outage anywhere will quickly push prices through $100/bbl, necessitating further U.S. SPR releases. Robert P. Ryan, Senior Vice President Commodity & Energy Strategy rryan@bcaresearch.com Hugo Bélanger, Senior Analyst Commodity & Energy Strategy HugoB@bcaresearch.com 1 OPEC 2.0 is the name we coined for the OPEC/non-OPEC coalition led by KSA and Russia. This coalition likely will be formalized at the December 7 OPEC meeting in Vienna via treaty. This has been alluded to over the past year, most recently in an interview given to Tass, the Russian state-owned news agency. Please see "Saudi energy minister Al-Falih speaks to TASS on OPEC+, oil prices and Khashoggi," published by TASS, October 22, 2018. 2 Please see "Mnuchin says it will be harder for Iran oil importers to get waivers," published by uk.reuters.com October 21, 2018. 3 The Federal Reserve Bank of New York publishes a similar price-decomposition model weekly in its "Oil Price Dynamics Report," which is available online. 4 We can assume USD effects will be reflected in demand and supply at the margin - i.e., a stronger USD reduces demand by raising the local-currency costs of oil, and increases supply by lowering the local-currency costs of production, and vice versa. Uncertainty as to the USD's trajectory adds to overall uncertainty in the model. 5 This likely would trigger withdrawals from the U.S. SPR, or the EU's strategic petroleum reserves, but that will take time to implement. Both Libya and Nigeria likely will hold elections next year: Nigeria in February, Libya possibly on December 10, but more likely next year following passage of a UN resolution to extend the mandate of its political mission there to September 15, 2019. Civil unrest in Libya has been increasing, as ISIS fighters increase the tempo of operations on the ground. 6 Please see "Falling into refiner Turnaround Season & Maintenance outlook," published by Genscape August 23, 2018. 7 This occurs at a fortuitous time in the U.S. election cycle, as mid-terms will be held November 6, two days after Iran sanctions kick in. We expected an SPR draw ahead of midterms; please see "Trade, Dollars, Oil & Metals ... Assessing Downside Risk," published by BCA Research's Commodity & Energy Strategy August 23, 2018. It is available at: ces.bcaresearch.com. 8 Please see "Oil output from Saudi, Kuwait shared zone on hold as relations sour," published by uk.reuters.com October 18, 2018. 9 The U.S. Federal Reserve is in the process of a rates-normalization cycle, which likely will keep the USD appreciating against EM currencies into next year. Our House view calls for five additional hikes between December and the end of 2019. Please see "Trade, Dollars, Oil & Metals ... Assessing Downside Risk," published by BCA Research's Commodity & Energy Strategy August 23, 2018, for further discussion. ces.bcaresearch.com. 10 We discuss this at length in a Special Report published last week with BCA Research's entitled "Man Bites Dog: Could Sharply Rising Oil Prices Lead To Lower Global Bond Yields in 2019?" It is available at ces.bcaresearch.com. Investment Views and Themes Recommendations Strategic Recommendations Tactical Trades Commodity Prices and Plays Reference Table Trade Recommendation Performance In 3Q18
Risk Premium In Oil Prices Rising; KSA Lifts West Coast Export Capacity
Risk Premium In Oil Prices Rising; KSA Lifts West Coast Export Capacity
Trades Closed in 2018 Summary of Trades Closed in 2017 Summary Of Trades Closed In 2017
Risk Premium In Oil Prices Rising; KSA Lifts West Coast Export Capacity
Risk Premium In Oil Prices Rising; KSA Lifts West Coast Export Capacity