Emerging Markets
Our Geopolitical Strategy service thinks China could respond to the U.S. “show of force” in two ways: directly or through proxies. The direct response would involve confronting the U.S. military openly and forcefully. Our geopolitical strategists believe…
The U.S. holds shows of force fairly frequently. Over recent decades it has been the third most common type of operation for the U.S. military. However, for most of the past several decades, the U.S. conducted very few operations in the Asia Pacific that did…

Highlights This Special Report was written with our colleagues in BCA Research's Geopolitical Strategy, led by Marko Papic. In it, we explore the evolution of Russia's role in European natural gas markets vis-a-vis the fast-growing U.S. natural gas production and Liquefied Natural Gas (LNG) export capabilities. So what? Rise of U.S. LNG exports to Europe will benefit gas producers and LNG merchants with access to U.S. supplies. Russia will grow ever-more dependent on China, while retaining a market share in Europe. Why? Exports of U.S. LNG to Europe are set to surge over the next decade. Russia will not be completely displaced, as American LNG fills the gap in European natural gas production. But U.S. LNG will lead to the end of oil-indexing of long-term natural gas contracts, hurting Russian state coffers on the margin... ... And forcing Russia further into the arms of China. Also... A tighter Trans-Atlantic partnership - soon to involve a deep energy relationship - and a budding Sino-Russian alliance will further divide the world into two camps, producing a Bifurcated Capitalism that may define this century. Feature Russia's obituaries have been written and re-written many times since the end of the Cold War. And yet, Moscow continues to play an outsized role in global affairs that is belied by quantitative measures of its power (Chart 1). Chart 1From Bipolarity To Multipolarity
From Bipolarity To Multipolarity
From Bipolarity To Multipolarity
How so? The fall of the Soviet Union was precipitated by the country's sclerotic managed economy, its failure to escape the middle income trap, and its disastrous military campaign in Afghanistan. But before it died, the Soviet Union sowed the seeds for its resurrection. The $100-130 billion (in 2018 USD) spent on building a natural gas pipeline infrastructure into Western Europe was the elixir that revived Russian power. Just as Russia emerged from its lost decade in the 1990s, it caught a break. Western Europe's natural gas demand rose. At the same time, China's epic industrialization created a once-in-a-century commodity bull market (Chart 2). With demand for its resources buoyed on both sides of the Eurasian landmass, Russia once again saw revenue fill its coffers (Chart 3). With material wealth came the ability to rebuild its hard power and put up a fight against an expansionary Western alliance encroaching on its sphere of influence. Chart 2Chinese Industrialization...
Chinese Industrialization...
Chinese Industrialization...
Chart 3...Filled Russian Coffers
...Filled Russian Coffers
...Filled Russian Coffers
Is there an existential risk to Russia's business model looming in the form of surging U.S. liquefied natural gas (LNG) export capability (Chart 4)? Not yet. Thanks to a massive drop in European domestic production, U.S. LNG exports will fill a growing supply gap, but will not replace Russia's natural gas exports in the medium term. All the same, the once-lucrative European market no longer holds as much promise as it once did with the arrival of the U.S. LNG supplies. Chart 4U.S. LNG Exports Will Surge
American Pipes, Russian Gripes?
American Pipes, Russian Gripes?
In order for Russian natural gas exports to Europe to be permanently displaced, Europe would have to build out new LNG capacity beyond 2020, restart domestic production by incentivizing shale development, or turn to alternative energy sources with large base-load potential, such as nuclear power. None of these are on the horizon. With ~15% of its government revenue sourced from natural gas sales, Russia is as much of a one-trick pony as there is in macroeconomics. While we do not foresee that pony heading off to the glue factory, Russia will face some considerable risks in the future, starting with the shift away from the rigid oil-indexed contracts it favors (which lock the price of natural gas to that of oil). As such, the risk to Russia is not that it loses market share in Europe's energy market, but that this market share yields much smaller income in the future, as gas-on-gas pricing competition increases. The U.S. Shale Revolution Goes Global Our commodity team has presented a compelling case for why investors should expect an increase in U.S. LNG exports beyond the current EIA forecast.1 Increasing volumes of associated natural gas production in the Permian Basin in west Texas, which will have to be transported from the basin so as not to curtail oil production, will drive a large part of the expected growth in LNG exports. Our commodity team expects that a major LNG export center will be developed in south Texas, in Corpus Christi, over the next five years, just as the U.S. surpasses 10 Bcf/d of exports in the middle of the next decade.2 At the same time, global LNG demand is expected to rise at an impressive 1.7% annual rate to 2040 (Chart 5). A few key markets will lead this trend (Chart 6). Based on BCA Commodity & Energy Strategy calculations, world LNG export capacity is expected to go from 48 Bcf/d in 2017 to 61 Bcf/d by 2022 (Chart 7). The majority of the new capacity (53%) will come from the U.S., while 18% will come from Australia and 15% from Russia. Chart 5Global LNG Demand Growth Likely Outpaces Current Expectations
American Pipes, Russian Gripes?
American Pipes, Russian Gripes?
Chart 6Supply - Demand Imbalances Will Fuel LNG Demand Globally
American Pipes, Russian Gripes?
American Pipes, Russian Gripes?
Chart 7LNG Export Capacity Growth
American Pipes, Russian Gripes?
American Pipes, Russian Gripes?
The pickup in Australian export capacity is already impressive. While being a relatively small natural gas producer - the eighth largest, accounting for 3% of world output - it has already become the second largest LNG exporting country in the world with over 7.5 Bcf/d of exports. The bulk of new liquefaction facilities will be operational in 2019. Most of Australia's LNG trade lies with Asia, given its geography. The U.S., whose LNG export terminals will be located in the Gulf of Mexico, only has 3 Bcf/d of liquefaction capacity today. Most of its LNG exports also go to Asia (Table 1), but that may change as the current capacity expansion will see exports rise to just over 9 Bcf/d in 2020.3 Furthermore, American gas will compete with surging Australian LNG exports and a build-up of Russian pipeline export capacity to China, which is set to start delivering gas to the country in 2019. Table 1U.S. LNG Exports By Country
American Pipes, Russian Gripes?
American Pipes, Russian Gripes?
Europe, on the other hand, has massive regasification capacity slack and thus requires only minimal capex to begin importing large volumes of U.S. LNG. Europe has 23 Bcf/d regasification capacity, with a very low utilization rate of just 27%. This means that it has ~ 16 Bcf/d capacity available, more than enough to absorb all of expectant U.S. ~ 6-7 Bcf/d exports in the next couple of years.4 Bottom Line: The U.S. shale revolution is going global, with U.S. LNG exports set to surge over the next 5-10 years. While some of that capacity will find its way to Asia, those markets will also be flooded with Australian LNG and Russian piped natural gas. Europe, on the other hand, is filing just a quarter of its LNG import capacity, making a Trans-Atlantic gas alliance a match made in heaven. From Cold War To Gas War? If half of the currently proposed, pre-FID, LNG export projects were built in the U.S., American capacity would grow to potentially ~26 Bcf/d by 2030. Europe would need only one or two extra LNG import terminals to build over the next two decades to absorb this volume, as its current capacity is able to import nearly every molecule coming out of North America (Chart 8). Chart 8Europe Has Plenty Of Regasification Capacity
American Pipes, Russian Gripes?
American Pipes, Russian Gripes?
Will this new U.S. LNG displace Europe's imports of Russian natural gas? The short answer is no. By 2030, Europe's supply-gap (i.e. domestic supply minus domestic consumption) is estimated to reach 36 Bcf/d. The U.S. could cover a large part of this gap if only half of the proposed pre-FID projects are constructed. However, if Europe's demand remains stable over this period, Europe will still import roughly 20 Bcf/d of Russian natural gas, which in 2017 amounted to 35% of Europe's natural gas consumption. If the U.S. fills 100% of the increase in Europe's supply-gap, it means new Russian natural gas production (the IEA and BP expect Russian production to keep increasing until 2030) will not be sent to Europe. Hence, even if it does not displace old Russian exports, it will limit Russia's ability to export its new natural gas. Europe's demand for natural gas is not likely to be stable. Despite sclerotic growth and generally weak population growth, European governments have tried to incentivize natural gas consumption due to its low emission of CO2 (Table 2). As such, investors should expect further displacement of coal and nuclear power generation in favor of natural gas. Table 2Natgas Emits Less CO2
American Pipes, Russian Gripes?
American Pipes, Russian Gripes?
Thus, U.S. exports will simply replace Europe's domestic production, which is facing considerable declines. The U.K. North Sea production will decrease 5% annually due to the lack of capex and the large number of fields reaching a mature state. Meanwhile, the Netherlands is phasing-out its Groningen field by 2030. Finally, Norwegian gas production is likely to stagnate after reaching record levels in 2017. The second reason that Europe will not be able to sever its relationship with Russia is that its LNG import terminals are largely located in countries that are not massively dependent on Russian imports (Map 1). The two major LNG terminals serving Central and Eastern Europe are the Swinoujscie terminal in Poland - finished in 2015 - and the Adria project in Croatia, to be completed in 2020. Map 1European Natural Gas Geography
American Pipes, Russian Gripes?
American Pipes, Russian Gripes?
The Polish LNG terminal will do little to alleviate the dependency of countries further East - Belarus, Ukraine, Bulgaria, Hungary, and Slovakia - from Russia as it currently satisfies only one third of Poland's natural gas needs, and is projected to reach 50% by 2022 once the expansion is completed. This could significantly cut Russian exports to Poland, but not completely end them.5 The Croatian LNG terminal will likely make a very small dent in the overall reliance of the Balkans on Russian natural gas, as once it satisfied Croatian demand, little will be left over for the rest of the region. Beyond these two terminals, Europe will have to invest in pipeline infrastructure in order to reverse the flow of pipelines currently taking gas from the East to the West. At some point in the distant future, we could see a scenario where American natural gas flows even through Cold War era, Soviet-built pipelines deep into Central and Eastern Europe. But given the steep declines in West European natural gas production, this day will come after 2030. Bottom Line: Dreams of displacing Russian natural gas in Europe with American are overstated. European imports of U.S. LNG are likely to skyrocket, but that will merely replace the massive decline in West European and North Sea production. What does that mean for geopolitics? It means that Russia will continue to have a role to play in Europe, but its share of European imports will decline. As such, Europe will have options. If it builds more LNG import terminals, it could expand those options beyond American LNG imports. However, Russian geopolitical influence will not be displaced completely. Russian Coffers Will Take A Hit Although Russian natural gas will continue to course through Europe's veins, its state coffers are nonetheless going to take a hit. European governments are actively diversifying away from Russia via U.S. LNG imports, and buyers generally are shortening the tenor of contracts as they seek more flexible pricing.6 The growth in the global LNG market, fueled by surging U.S. production, will ultimately allow Asian and European markets to diversify away from oil-indexed pricing - which tends to be priced higher than gas-on-gas pricing - and expand access to U.S. supplies.7 The EU has co-financed or committed to co-finance LNG infrastructure projects valued at ~ 640mm euros to secure U.S. LNG. Ultimately, as more and more U.S. LNG moves toward Europe, markets will move toward short- and long-term contracts priced in USD/MMBtu (indexed to Henry Hub, LA, prices), much like Brent crude oil priced in USD/bbl. European markets have already seen this shift, as illustrated in Chart 9. Chart 9European Gas-On-Gas Pricing Is Rising
American Pipes, Russian Gripes?
American Pipes, Russian Gripes?
The totality of U.S. export prices is determined by gas-on-gas pricing - i.e., gas priced in USD/MMBtu as a function of gas supply-demand fundamentals. These contracts are without the restrictions found in many oil-indexed contracts. In the U.S., the presence of a deep futures market delivering natural gas to Henry Hub, LA, allows flexible long-term financing and short- and long-term contracting that can be hedged by buyers and sellers. According to Royal Dutch Shell, the spot LNG market doubled from 2010 to 2017, accounting for ~ 25% of all transactions, most of it due to the prodigious increase in U.S. LNG supply. While in Europe the share of LNG spot and short-term deals is small relative to the overall market, it is growing (Chart 10). With U.S. LNG volumes becoming increasingly available in Europe, market participants will be inclined to turn to the LNG spot market to buy or sell outside contracted volumes. This will deepen the development of European natgas markets: in any fully developed market, spot trading is followed by forward contracting, then futures trading using contracts settling against a spot price.8 Chart 10Expect More LNG Spot Trading
American Pipes, Russian Gripes?
American Pipes, Russian Gripes?
Russia is a low-cost gas producer in Europe and will be committed to maintaining its market in Europe. However, with U.S. LNG export capacity potentially reaching ~14 Bcf/d by 2025, from ~3 Bcf/d today, it is entirely likely that Russia will find itself in a price war defending existing market share in Europe at lower prices. Its preferred way of doing business, via oil price indexed contracts, will be challenged overnight by a surge in U.S. LNG imports. Bottom line: The EU and its member states are actively diversifying gas supply sources away from Russia via U.S. LNG purchases. This will lower the marginal price of all gas bought and sold in Europe, all else equal, resulting in lower margins for all sellers of gas and better prices for consumers. Ultimately, the European natural gas market will resemble every other fully developed commodity market, operating on razor-thin margins. This means whatever rents were available in this market will be dissipated as competition increases. Investment And Geopolitical Implications The immediate investment implication of these developments is that gas producers and LNG merchants with access to U.S. shale-gas supplies, processing trading, and risk-management capabilities should be favored in this evolving market. Beyond the short term, however, we expect several ongoing geopolitical developments to be ossified by the flood of American LNG steaming towards European shores: Sino-Russian alliance deepens: As Russian natural gas exports to Europe stagnate, its pipeline infrastructure build-out will increase its exports to China to 3.8 Bcf/d by 2019. China will become the growth market for Russian energy producers, deepening the move between the two former Cold War foes to stabilize their relationship. Although it may seem obvious that Russia would retain leverage in such a relationship - given that it can "turn off the lights" to Beijing at whim - we actually think that Beijing will hold all the cards.9 Europe will have an incentive to keep diversifying its natural gas supplies. Meanwhile, Chinese demand is likely to keep growing. As such, China will become Russia's main option for revenue growth. And as the old adage goes, the customer is always right. Trans-Atlantic alliance deepens: Despite the fears that the "Trump Doctrine" would lead to American isolationism - fears that we shared in 2017 - the growing U.S.-European LNG connection will ensure that the Trans-Atlantic alliance - forged 70 years ago in blood - will be saved via brisk energy trade.10 A growing European energy deficit with the U.S. will also resolve - or at least alleviate - the main source of marital problems in the relationship: Europe's trade surplus. Bifurcation of capitalism: A key theme of BCA's Geopolitical Strategy is that the age of globalization will yield to the world's segmentation into spheres of influence.11 A deepening Trans-Atlantic alliance, when combined with a budding Sino-Russian relationship, will lead to a Bifurcated Capitalism system where the Trans-Atlantic West faces off against the Eurasian East. What would such a Bifurcated Capitalism mean for investors? Time will tell. But it may mean that thirty years of global capitalism (1985 to roughly today) may give way to something more common in human history: a world dissected into spheres of influence where flows of capital, goods, and people within spheres are relatively smooth and unencumbered, yet flows between the spheres are heavily impeded. Marko Papic, Senior Vice President Chief Geopolitical Strategist marko@bcaresearch.com Hugo Bélanger, Senior Analyst Commodity & Energy Strategy HugoB@bcaresearch.com Robert P. Ryan, Senior Vice President Commodity & Energy Strategy rryan@bcaresearch.com Pavel Bilyk, Research Associate Commodity & Energy Strategy pavelb@bcaresearch.com 1 Please see "U.S. Set To Disrupt Global LNG Market," published by BCA Research's Commodity & Energy Strategy October 4, 2018. It is available at ces.bcaresearch.com. 2 Please see "The Price of Permian Gas Pipeline Limits," by Stephen Rassenfoss, in the Journal of Petroleum Technology, published July 19, 2018. 3 Following a two-year pause in project Final Investment Decisions (FIDs) from 2016 to 2017, potential FIDs in 2018 and 2019 could increase the U.S. capacity to ~ 14 Bcf/d by 2025. This will make the U.S. the second-largest exporter of LNG in the world, surpassing Australia. This new wave of investment is yet to be finalized. Therefore, final decisions in 2H18 and 2019 will be crucial to determine the medium-term potential of U.S. LNG. 4 Cheniere Energy, the largest U.S. LNG exporter, expects ~ 50% of its exports to go to Europe, according to S&P Global Platts. Please see "US LNG vs Pipeline Gas: European Market Share War?" published April 2017 by Platts. 5 Additionally, if the Baltic Pipe Project, moving gas from Norway to Poland, reaches FID in 2019, this would help Poland diversify its energy supply from Russia, as the country would cover close to all its domestic demand via its production + LNG and new pipeline imports. 6 Please see "US and Russia step up fight to supply Europe's gas," published by the Financial Times August 3, 2017. See also "Russia's gas still a potent weapon," also published by the FT, re the so-called collateral damage suffered by Europe when Russia cut off gas supplies to Ukraine in January 2009. 7 For the EU, supply diversification is a particularly important goal. On July 25, 2018, the European Commission and the U.S. issued a joint statement, in which the EU agreed to import more LNG from the U.S. "to diversify and render its energy supply more secure. The EU and the U.S. will therefore work to facilitate trade in liquefied natural gas," according to a press release issued August 9, 2018, by the Commission. Re Japan's diversification strategy, please see "Feature: US LNG sources fit with Japan's desire for route diversity: minister," published by S&P Global Platts September 27, 2018. 8 Please see Darrell Duffie, Futures Markets (1988), Prentice-Hall; and Jeffrey C. Williams, The Economic Function of Futures Markets (1986), Cambridge University Press. Longer-term deals already are being signed under flexible Henry Hub futures-based indexing terms in the U.S. This is occurring because the U.S. LNG market is able to tap into futures liquidity that supports hedging by natgas producers and consumers. Please see "Vitol-Cheniere Pact Shows Long-Term LNG Deals Aren't Dead," published by bloomberg.com September 17, 2018. 9 Please see BCA Geopolitical Strategy Special Report, "The Embrace Of The Dragon And The Bear," dated April 11, 2014, available at gps.bcaresearch.com. 10 Please see BCA Geopolitical Strategy Weekly Report, "The Trump Doctrine," dated February 1, 2017, available at gps.bcaresearch.com. 11 Please see BCA Geopolitical Strategy Monthly Report, "Multipolarity And Investing," dated April 9, 2014, and Special Report, "The Apex Of Globalization - All Downhill From Here," dated November 12, 2014, available at gps.bcaresearch.com.
Highlights So What? More downside to CNY/USD ahead. Why? The trade war is spilling into political and military arenas, making it harder to de-escalate and negotiate a trade deal. Official U.S. and Chinese rhetoric is increasingly antagonistic, reflecting once-in-a-generation policy shifts toward a new Cold War. Tensions will not subside after the U.S. midterm election - neither the U.S.-Mexico-Canada agreement nor any quick deals with Japan and the EU will speed up U.S.-China negotiations. Feature Clients know that BCA's Geopolitical Strategy has been alarmist on U.S.-China relations since we started as a service in 2012.1 This structural view is based on the long-term decline of U.S. power relative to China and the emergence of global multipolarity.2 However, the rise of General Secretary Xi Jinping in 2012 and President Donald Trump in 2016 have reinforced our view that "Sino-American conflict is more likely than you think."3 This includes military as well as economic conflict. Setting aside the risk of war, a geopolitical "incident" of some kind is becoming increasingly likely. As the two sides engage in brinkmanship, the probability of a miscalculation or provocation rises, and the probability of a grand new compromise falls. For investors, the takeaway is supportive of Geopolitical Strategy's current stance: long U.S. dollar, long U.S. stocks relative to DM, and long DM stocks relative to EM. We expect CNY/USD to fall further as markets question the ability to discount trade uncertainties via tariff rates alone (Chart 1). We continue to recommend a "safe haven" hedge of Swiss bonds and gold. Chart 1CNY/USD Has More Downside
CNY/USD Has More Downside
CNY/USD Has More Downside
The risk is that China could respond to U.S. pressure by stimulating its economy aggressively. So far, the "China Play Index," devised by our Foreign Exchange Strategy, does not signal reflation. Nor do Chinese domestic infrastructure stocks relative to global, which our China Investment Strategy watches closely (Chart 2). Chart 2Small Stimulus Thus Far
Small Stimulus Thus Far
Small Stimulus Thus Far
Trade Tensions Are Spilling Over A corollary of our view that U.S.-China tensions are secular and strategic in nature - i.e., not limited to the U.S. trade deficit - is the view that trade tensions will spill over into strategic areas, exacerbating those tensions and generating negative outcomes for investors exposed to the U.S.-China economic partnership.4 This strategic spillover is now taking shape. Since President Trump went forward with the second round of tariffs - 10% on $200 billion worth of imports, to ratchet up to 25% on January 1, 2019 - a series of negative events have taken place in U.S.-China relations (Table 1), culminating in the USS Decatur incident on September 30. Table 1Trade War Spills Into Strategic Areas
A Global Show Of Force?
A Global Show Of Force?
The Decatur, an Arleigh Burke-class guided-missile destroyer, was conducting operations in the Spratly Islands in the South China Sea when it sailed within 12 nautical miles of Gaven and Johnson Reefs, which China claims as sovereign islands. At around 8:30am that Sunday morning, a Luyang-class destroyer from China's People's Liberation Army Navy "approached within 45 yards of Decatur's bow, after which Decatur maneuvered to prevent a collision," according to the U.S. Pacific Fleet spokesman. This was not an unprecedented incident in itself, but it came very close to a collision that could easily have resulted in a shipwreck, a full-blown U.S.-China crisis, and a global risk-off event in financial markets. The Decatur sailed close to the Chinese-claimed reefs because it was conducting a "Freedom of Navigation Operation" (FONOP) to assert the international right of free passage. A major point of contention between China and the U.S. (and between China and most of its neighbors and the western world) is that China claims outright sovereignty over about 80% of the South China Sea, including the Spratly Islands. In July 2016, the International Court of Arbitration ruled that none of the contested rocks and reefs in the sea qualify as islands and hence that they are not entitled to 12 nautical miles of "territorial" sea. China rejects this ruling and asserts sovereignty over the maritime features and much of the sea itself.5 In Diagram 1 we illustrate how a FONOP works based on a similar operation last year. The U.S. has conducted these operations for decades, but in late 2015 it began a series of FONOPs focusing on countering China's excessive claims in the South China Sea.6 This was also a way of opposing China's construction, reclamation, and "militarization" of the reefs under its possession. Diagram 1What Is A 'Freedom Of Navigation Operation'?
A Global Show Of Force?
A Global Show Of Force?
It is not remotely a surprise that this year's trade tensions came close to exploding in the South China Sea. It is the premier geographic location of U.S.-China strategic friction: a hub for international trade; a vital supply route for all major Asian economies; and the primary focus of China's attempt to rewrite global rules (Diagram 2).7 The Appendix updates our list of clashes in this area. Diagram 2South China Sea As Traffic Roundabout
A Global Show Of Force?
A Global Show Of Force?
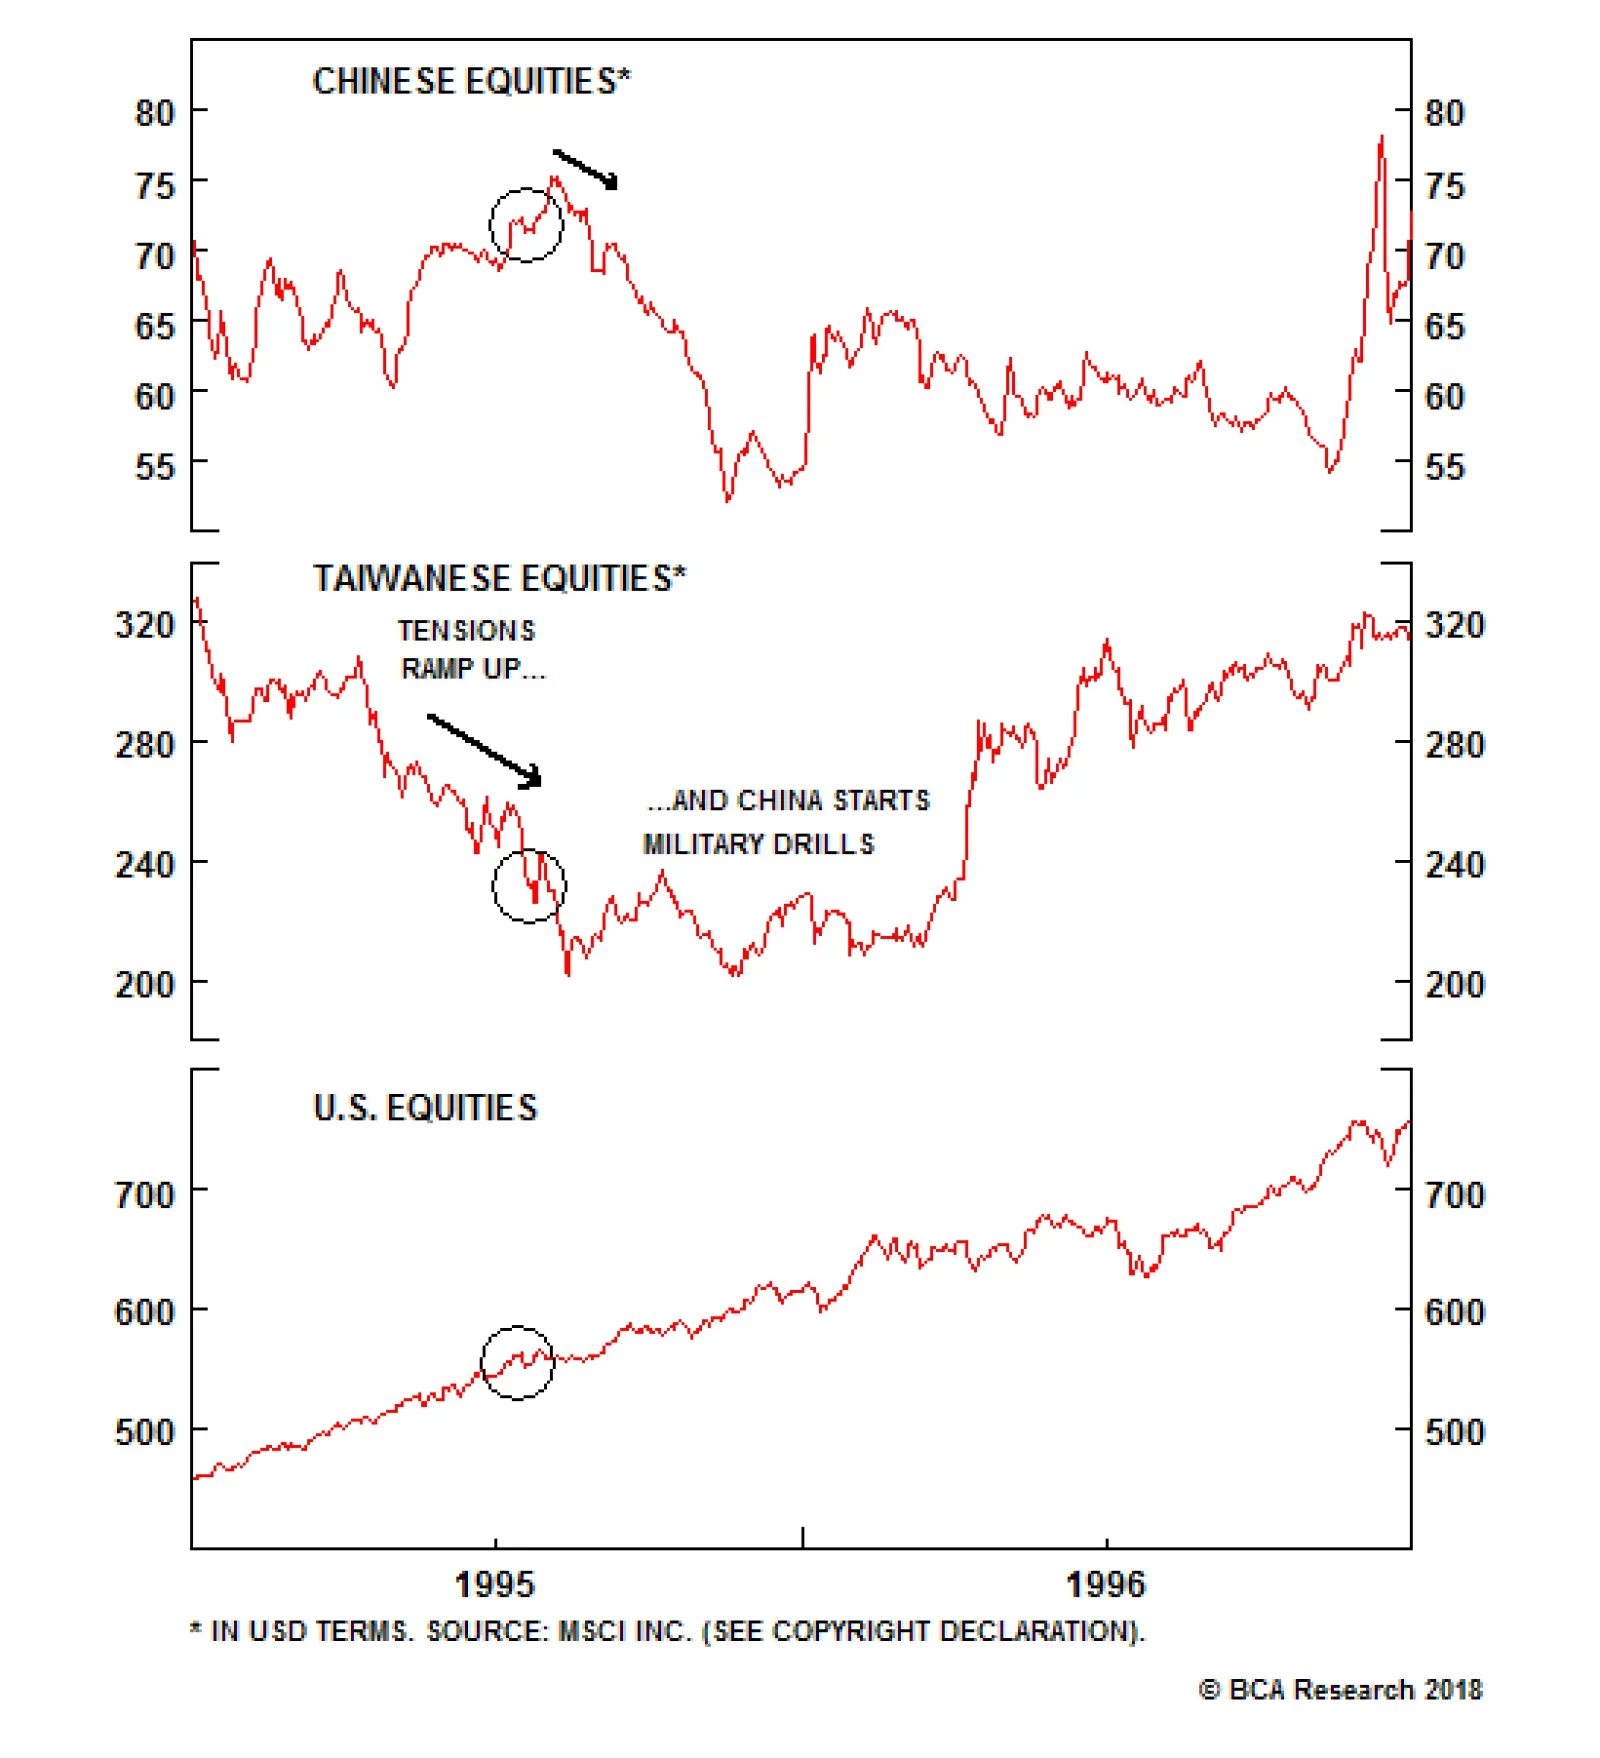
The takeaway is that, far from capitulating to the Trump administration's trade demands, China is taking a more aggressive stance - and it is doing so outside the trade context. The U.S., for its part, has not diminished the significance of this incident, as it has often done on similar occasions.8 Instead, Vice President Mike Pence gave a remarkable speech at the Hudson Institute on October 4 in which he highlighted the Decatur, among a range of other "predatory" Chinese state-backed actions, to make a comprehensive case that China is a geopolitical rival seeking to undermine the United States and specifically the Trump administration.9 Pence's comments reflect a decision to "go public" with a shift in national strategy that has been developing in recent years, beginning - albeit tepidly - even in the Obama administration. A similar shift is underway in China - and has accelerated with the U.S.'s implementation of tariffs. Official Communist Party rhetoric increasingly characterizes the U.S. as an enemy whose real intention is to "contain" China's rise and has recently called for Chinese "self-reliance" in the face of U.S. sanctions.10 The two sides are bracing for conflict and are now seeking to mold public opinion more actively. Bottom Line: Investors should take note: markets were 45 yards away from a significant correction! The U.S.-China trade tensions are spilling outside of economic relations into political and military domains, as we expected. The South China Sea remains a hot zone that could be the setting of a geopolitical incident as tensions mount. What Is A Show Of Force? Notably, the U.S. military is said to be considering a "global show of force" during an unspecified week in November in order to deter China from its current policy trajectory. If this occurs, it will be market-relevant as it will be seen as a provocation by China and other U.S. rivals. A "show of force" is a formal military operation conducted by a nation with the purpose of demonstrating that it has both the will and the ability to use force in defense of its interests. It is fundamentally a political action, even though it utilizes military resources. The declared intention is to demonstrate resolve and prevent or deter an undesirable course of action by a rival state.11 Nevertheless, it is the equivalent of a dog baring its teeth and should not be taken lightly, especially when conducted by one major power against another. The U.S. holds shows of force fairly frequently. Over recent decades it has been the third most common type of operation for U.S. forces.12 However, for most of the past several decades, the U.S. conducted very few operations in the Asia Pacific not pertaining to the Vietnam War, and these were usually of limited length and intensity. They were often shows of force to deter North Korea from various acts of terrorism and sabotage. China was rarely involved - there was, for example, no U.S. deployment during the Tiananmen crisis. Nevertheless there are a few highly relevant precedents: By far the most important exception is the Third Taiwan Strait Crisis in 1996. This was a major show of force - and one whose shadow still hangs over the Taiwan Strait. In July 1995, Beijing launched a series of missile tests and military exercises, hoping to discourage pro-independence sentiment and dissuade the Taiwanese people from voting for President Lee Teng-hui - who was rightly suspected of favoring independence - ahead of the 1996 elections. The United States responded on March 1, 1996 by deploying two aircraft carriers, USS Nimitz and USS Independence, and various warships to the area. The Nimitz even sailed through the strait. Tensions peaked ahead of the Taiwanese election on March 23, 1996 - in which voters went against China's wishes - and the show of force concluded after 48 days on April 17. Of course, tensions simmered for years afterwards. The Taiwan incident was the only operation involving China in the 1990s, and the first to do so since a minor contingency operation upon the Chinese invasion of Vietnam in 1979. It is generally deemed successful in demonstrating U.S. commitment to Taiwan's security - but it also spurred a revolution in Chinese military affairs, such that China is today in a far better position to attack Taiwan than ever before.13 The market effects were pronounced: Chinese and Taiwanese equities sold off. American stocks were unaffected (Chart 3). Chart 3Naval Shows Of Force Can Rattle Markets
Naval Shows Of Force Can Rattle Markets
Naval Shows Of Force Can Rattle Markets
The second major exception was the Hainan Island Incident, or EP-3 Incident. On April 1, 2001 a Chinese jet struck a U.S. EP-3 ARIES II signals reconnaissance plane in the skies over the South China Sea. The U.S. plane landed on China's island province of Hainan, where its crew was detained and interrogated for 10 days while their aircraft was meticulously disassembled. Ultimately the U.S. issued a half-hearted apology and the crew was released. This was a much smaller show of force than the third Taiwan crisis. The U.S. Navy positioned three destroyers in the area for two days. Chart 4A South China Sea Incident Helped Kill The Bull Market
A South China Sea Incident Helped Kill The Bull Market
A South China Sea Incident Helped Kill The Bull Market
This incident marked the peak of the cycle in U.S. equities ex-tech (Chart 4). In China, both A-shares and H-shares experienced volatility before selling off in subsequent months (Chart 5, top panel). Chart 5Volatility And Selloffs Amid Asian Shows Of Force
Volatility And Selloffs Amid Asian Shows Of Force
Volatility And Selloffs Amid Asian Shows Of Force
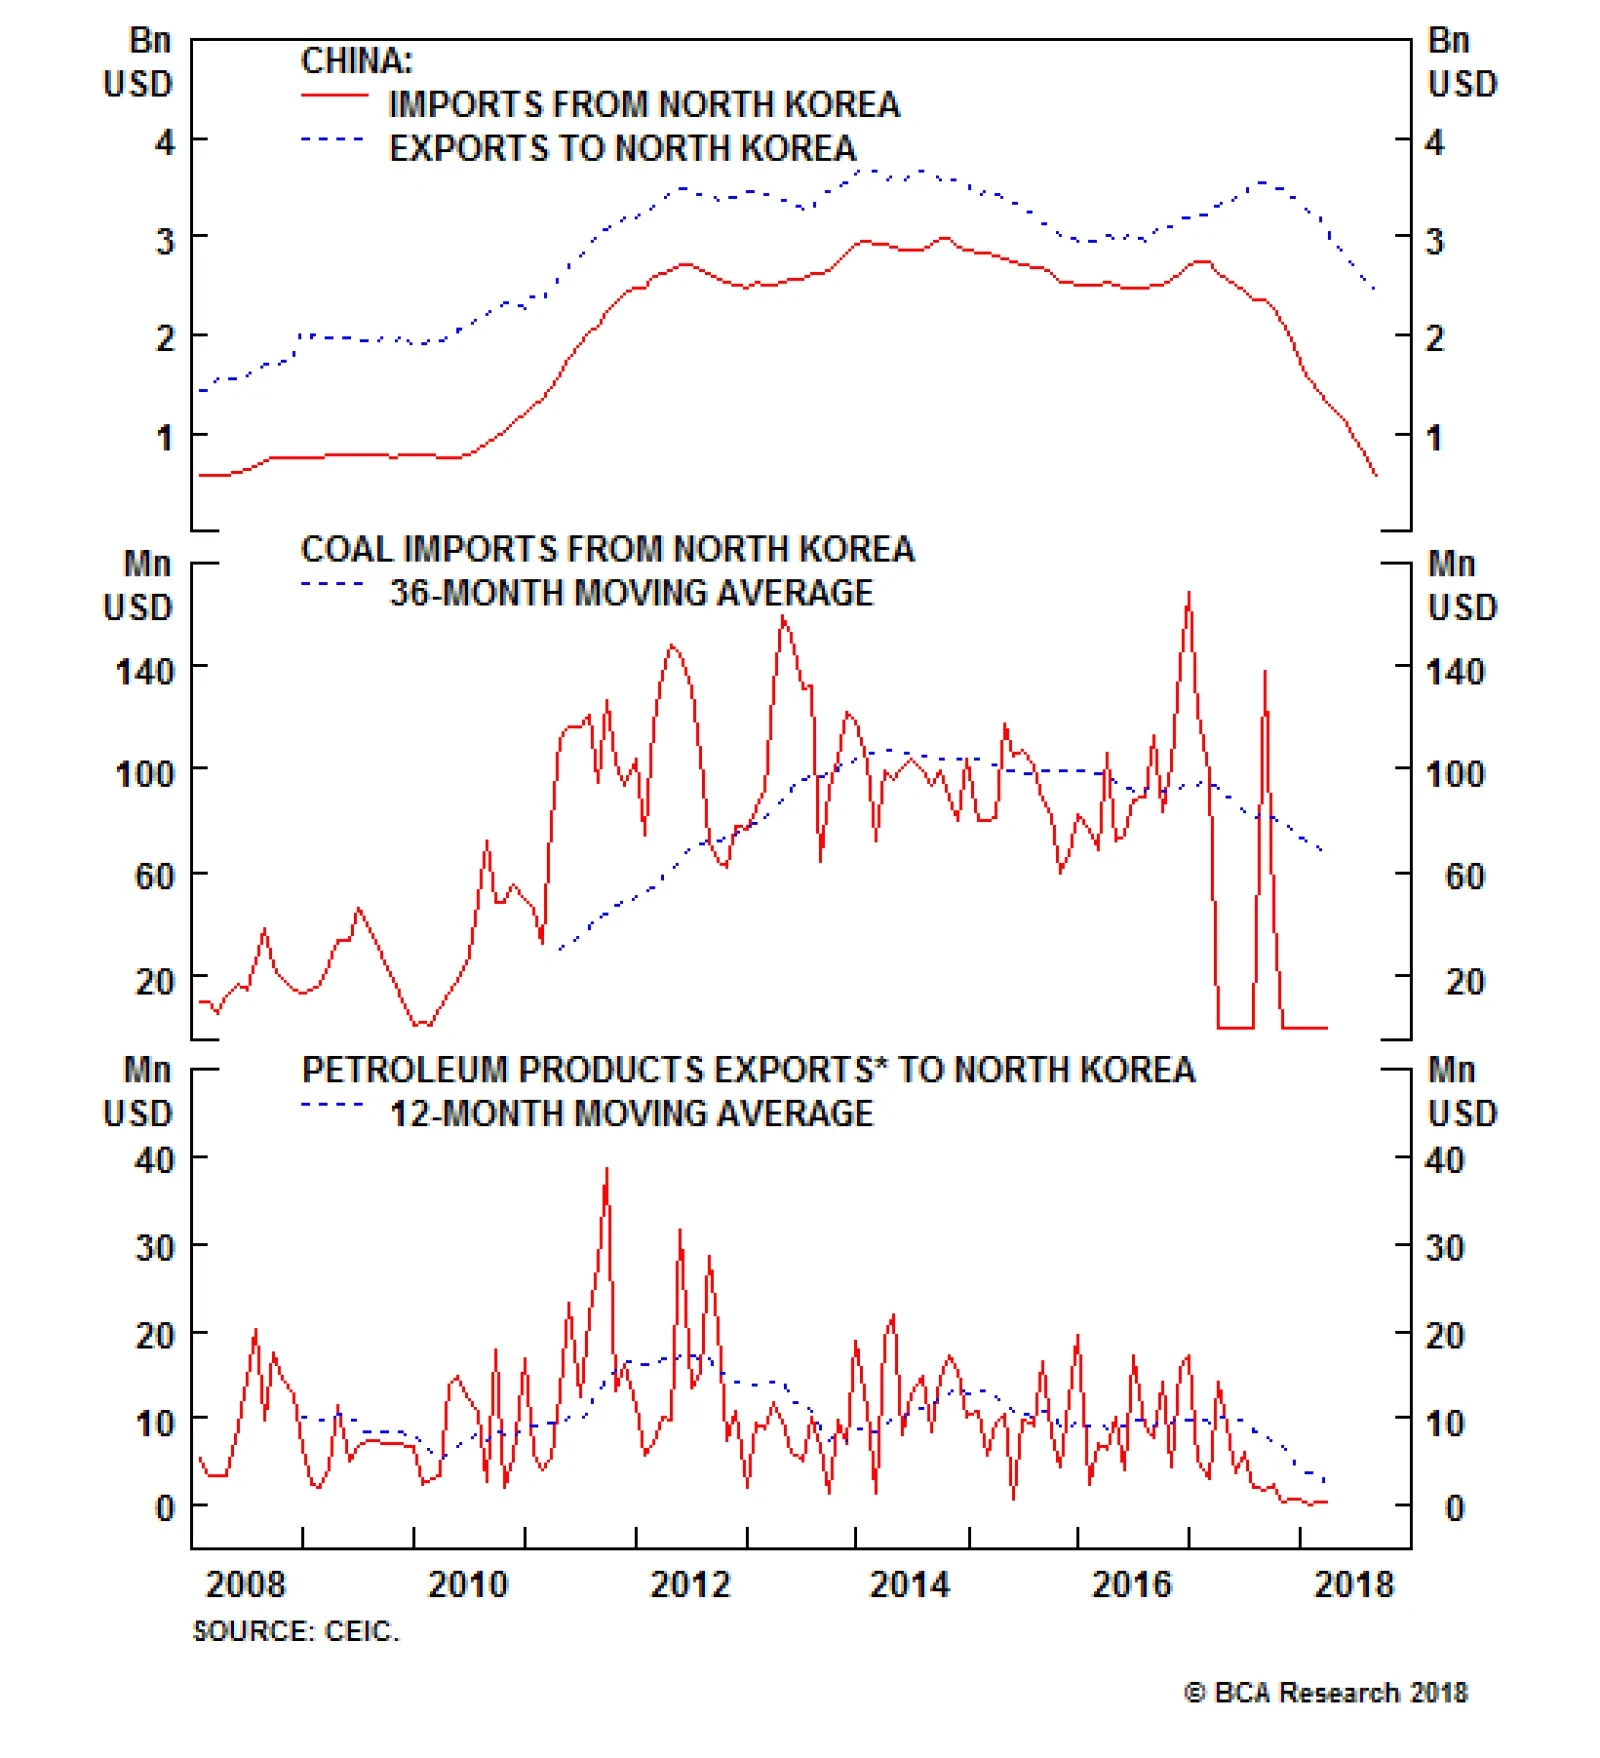
The Cheonan and Yeonpyeong Island incidents occasioned a show of force. On March 26, 2010 a North Korean miniature submarine conducted a surprise torpedo attack against the Cheonan, a South Korean Corvette, sinking it and killing 46 sailors. The U.S. intended to respond by positioning the USS George Washington in the Yellow Sea, but was intimidated from doing so by China's fiercely negative diplomatic reaction. Instead it deployed the carrier to the Sea of Japan. Later that year, however, after North Korea shelled Yeonpyeong Island and killed four South Koreans, the U.S. responded with a beefed up version of regular military drills, including the George Washington, for four days in the Yellow Sea. This incident is significant in showing how aggressively China will oppose demonstrations of American naval power in its near abroad. Unlike in 1996, China is today much better positioned to react to U.S. naval action in its neighborhood. If Beijing was so resistant to a U.S. show of force against North Korea in the wake of a North Korean attack, it will be even more resistant to a U.S. display of might in China's nearby waters aimed at China in response to what China views as a defense of maritime-territorial sovereignty. Chinese A-shares sold off, while H-shares were somewhat more resilient, during this episode (Chart 5, second panel). Fire and Fury: The United States' latest significant show of force occurred in 2017 when the navy positioned three aircraft carrier strike groups in the region to deter North Korean nuclear and missile tests and belligerent rhetoric against the United States. This action ultimately led to Chinese enforcement of sanctions and North Korean capitulation to U.S. demands. Chinese stocks only briefly sold off during this episode (Chart 5, third panel). However, the U.S. 10-year Treasury yield fell during the peak of tensions in the summer. So what about the global show of force that the U.S. is considering in November? Details on the specific operation under consideration are scant because they fall under a "classified proposal," written by members of the U.S. Navy's Pacific Command and only partially leaked to the press (apparently to coincide with Vice President Pence's speech).14 The proposal is still being discussed by the Joint Chiefs of Staff and the Intelligence Community, so nothing is final. From the information that is publicly available, it is highly significant that the proposed show of force is supposed to be "global" in range. It would reportedly involve a "series" of military missions on "several fronts," including the South China Sea, the Taiwan Strait, an unspecified area near Russia, and the west coast of South America. It would also involve multiple military services - the navy, the air force, the marines, and potentially cyber and space capabilities. While the various missions would reportedly be "concentrated" and "focused," implying that the U.S. wants to manage the escalation of tensions carefully, the locations that have been named are extremely sensitive. A show of force in the Taiwan Strait and South China Sea would be provocative enough. A simultaneous show of force against both China and Russia in today's context would be truly extraordinary.15 In short, if the report is accurate, the U.S. is contemplating a rare and provocative display of its global power projection capabilities. Why would the U.S. stage such a grand demonstration merely because of a taunt by a Chinese ship? The Decatur incident is only the proximate cause. Washington is in the midst of attempting a very dangerous "two-front war" against China and Iran, the latter of whom faces oil sanctions from November 4.16 Moreover, this is a "three-front war" if today's historically bad relations with Russia are taken into account. Indeed, the U.S. may well be responding to the joint show of force by Russian President Vladimir Putin and Chinese President Xi in their own large-scale military exercises in September, in which Chinese soldiers participated in a Russian drill outside the auspices of the Shanghai Cooperation Organization for the first time.17 As such, we would not put any stock in the idea that a sudden drop-off in geopolitical tensions, with China or anyone else, will occur after the U.S. midterm election on November 6. Rather, investors should expect an increase in geopolitical risk. There is no combination of midterm election results in which Trump will be forced to pull back on his "Maximum Pressure" doctrine. The proposal is not final, and the idea alone is a low-level threat that could be used in negotiations. But under the circumstances, we think it more likely than not that the U.S. will go forward with it. Ultimately, the U.S. proposal epitomizes our mega-theme of multipolarity. The U.S. is in relative decline and is reasserting itself with a muscular national security policy, particularly against China and Iran but also against Russia. However, its actions are highly unlikely to cause a change in China's behavior now that Beijing has determined that the U.S. is seeking Cold War-style strategic containment. Instead, China will hasten its efforts to become self-reliant and to deter U.S. aggression in its near abroad. Global economic policy uncertainty, and trade policy uncertainty, are likely to increase, not decrease, in such an environment. Saber-rattling and supply-chain risk will weigh on EM Asia in particular. Bottom Line: The U.S. government is contemplating an extraordinary "global show of force" that could involve a series of joint military operations across the globe. The chief focus is China, but the unknown array of operations could also target Russia or Iran. We think such operations are plausible and will increase global economic uncertainty. We would expect them to create volatility in global markets, adding to jitters over China tariffs (supply-chain risks) and Iranian sanctions (oil prices). How Will China Retaliate? China does not have the ability to respond proportionately to the U.S. - it cannot hold a global show of force of its own. Because its own shows of force will appear diminutive next to American fireworks, it may not react immediately. Beijing is more likely to respond by changing its policies to address the underlying increase in antagonism with the United States and improve its national security. We would classify its potential responses into two main groups: the low road and the high road. The low road consists of policies meant to confront the U.S. directly and forcefully. In our view, these policies bring significant costs that will make China reluctant to embrace them fully: Raise the stakes in the South China Sea: China could go for broke and deploy the full range of military assets in the islands that it has repurposed. This would provoke an even larger international naval response from the U.S. and its allies.18 Remove sanctions on North Korea: China could reverse sanctions enforcement on North Korea (Chart 6) and undermine President Trump's signature foreign policy overture. The problem is that China would then provide the U.S. with a pretext for an even greater military presence in Northeast Asia. Chart 6China Could Reverse Sanctions Enforcement
China Could Reverse Sanctions Enforcement
China Could Reverse Sanctions Enforcement
Flout sanctions on Iran: China could subsidize Iran (Chart 7) in the hopes of helping to create a huge American distraction comparable to the second Iraq war. But this confrontation would threaten China with an oil shock and economic dislocation, an even greater conflict with the U.S., and the risk of regime change in Iran.19 Chart 7China Could Flout Iran Sanctions
China Could Flout Iran Sanctions
China Could Flout Iran Sanctions
Punish U.S. companies: China could raise the pressure on U.S. companies doing business on its territory. The problem is that the U.S. has already demonstrated, through the ZTE affair this year, that it can inflict devastating reprisals against the tech champions on whom China's economic future depends (Chart 8). Chart 8U.S. Could Punish Chinese Tech Firms
U.S. Could Punish Chinese Tech Firms
U.S. Could Punish Chinese Tech Firms
Thus China is most likely to take the "high road," i.e. seeking alternatives to the United States throughout the rest of the world: Chart 9China's Market Is Its Biggest Advantage
China's Market Is Its Biggest Advantage
China's Market Is Its Biggest Advantage
Import more goods: China's greatest strength in winning friends is that its domestic demand remains relatively robust (Chart 9). China can substitute away from the U.S. by shifting to other developed markets. Emerging markets are becoming more connected with China and less so with the U.S. (Chart 10). Chart 10China's Trade Ties Grow, Ex-U.S.
China's Trade Ties Grow, Ex-U.S.
China's Trade Ties Grow, Ex-U.S.
Maintain outward investment: China's outward investment profile is expanding rapidly (Chart 11), but there is potential for a negative political backlash - as has occurred in Malaysia.20 China will need to focus on improving relations with those countries where it expands investment, including in the Belt and Road Initiative (BRI).21 Chart 11China's Outward Investment Strategy: Priorities Over The Past Decade
A Global Show Of Force?
A Global Show Of Force?
Court U.S. regional allies: Relations with South Korea have already improved; Shinzo Abe of Japan is soon to make a rare state visit to China; and trilateral trade talks between these three have revived for the first time since 2015 (Chart 12). Both the Philippines and Thailand currently have governments that are friendly to China. Beijing will need to ensure that its growing trade surpluses do not get out of whack. Chart 12Can China Court U.S. Allies?
Can China Court U.S. Allies?
Can China Court U.S. Allies?
Sign multilateral trade pacts: China is trying to position itself as a leader of free trade. This is a tough sell, but a successful completion of negotiations on the Regional Comprehensive Economic Partnership (RCEP) will generate some momentum. This Asia Pacific trade grouping is far larger in terms of total imports than its more sophisticated rival, the Comprehensive and Progressive Trans-Pacific Partnership (CPTPP), the latter being shorn of U.S. participation (Chart 13). Chart 13RCEP Is Bigger Than CPTPP
RCEP Is Bigger Than CPTPP
RCEP Is Bigger Than CPTPP
Play nice in the South China Sea: Now that the U.S. is proposing to push back against Chinese militarization of the islands, it makes sense for China to take a conciliatory approach. It is proposing joint energy exploration with the Philippines and others at least as long as offshore activity is depressed (Chart 14). China might also try to settle a diplomatic "Code of Conduct" for the sea with its neighbors. Chart 14A Reason For China To Play Nice
A Reason For China To Play Nice
A Reason For China To Play Nice
The most important consequence is an alliance with Russia, whether formal or not. The security agenda of these two powers is increasingly aligned with their robust economic partnership (Chart 15).22 The differences and distrust between them cannot override their need to guard themselves against a more assertive United States. Chart 15Embrace Of Dragon And Bear
Embrace Of Dragon And Bear
Embrace Of Dragon And Bear
Bottom Line: China's "high road" strategies are its best options when more aggressive options have higher risks of undermining China's own long-term interests. But an alliance with Russia is quickly becoming inevitable. Investment Implications A global show of force targeting China's "core interests" in Taiwan and the South China Sea will make trade negotiations even more difficult. China is not going to offer concessions when facing U.S. military intimidation in addition to tariffs.23 Investors should watch closely for any signs that nationalist protests and boycotts of U.S. goods are developing in China. Such a movement would not be allowed to continue for long without the Communist Party condoning it. A boycott would mark a form of retaliation that is much more impactful than tariffs. A deterioration in cultural ties is also in the cards. The United States is reported to be considering restrictions on Chinese student visas after intelligence assessments of non-traditional technological and intellectual property theft via graduate students in advanced programs such as artificial intelligence and quantum computing.24 U.S. markets remain insulated today, as in the last big rupture in U.S.-China relations in 1989, so we continue to expect U.S. equities to outperform Chinese (and global) stocks amid trade tensions and saber-rattling. Chart 16Last U.S.-China Crisis Prompted Stimulus...
Last U.S.-China Crisis Prompted Stimulus...
Last U.S.-China Crisis Prompted Stimulus...
However, an important takeaway from the 1989 episode is that China stimulated the economy (Chart 16). This time we think stimulus will remain lackluster, reflecting Xi's need to keep overall leverage contained (Chart 17). But conflict escalation with the U.S. is clearly the biggest risk to this view. Chart 17...But Stimulus Muted Thus Far
...But Stimulus Muted Thus Far
...But Stimulus Muted Thus Far
One oft-discussed retaliatory option is that China could sell off its vast $1.17 trillion holdings of U.S. treasuries. Rapidly dumping them is not effective, but slowly tapering is precisely what China has been doing since 2011 (Chart 18). This will accelerate its need to invest in real assets abroad and to purchase alternative reserve currencies, such as the euro, pound, and yen. Chart 18China Weans Itself Off Treasuries
China Weans Itself Off Treasuries
China Weans Itself Off Treasuries
Ultimately, the significance of Vice President Pence's speech is that the U.S. now views China as both a great power and a threat to U.S. supremacy. This raises the potential for a large share of the $33 billion in cumulative U.S. direct investment in China since 2006 to become, effectively, stranded capital (Chart 19). If that is indeed the case, it would mean that investors in S&P 500 China-exposed companies would have to take note and re-rate their investments. Companies with significant investment in China may have to make capital investments in alternative supply-chain options, leading to a significant hit to their profit margin. Chart 19Stranded Capital In China?
A Global Show Of Force?
A Global Show Of Force?
Other countries in Europe and the rest of Asia stand to benefit from the U.S. getting squeezed out of China's market, unless and until the new Cold War forces them to choose sides. Their choice is by no means a foregone conclusion, underscoring that China's policy response will be to seek better bonds with its neighbors and non-U.S. partners. Over the longer term, we think that our mega-theme of multipolarity will produce the bifurcation of capitalism. Within each sphere of influence globalization will continue to operate, but between spheres, or in the border areas, it will become a much less tidy affair. In addition to our recommendations above on page 2, we are reinitiating our short U.S. S&P 500 China-exposed stocks relative to the broad market. These companies have sold off heavily in recent months but the negative backdrop suggests that there is farther to go. Housekeeping On a separate note, BCA's Geopolitical Strategy is closing our long U.S. high-tax rate basket relative to S&P 500 trade for a gain of 8.26%. This was a play on the Trump tax cuts that we initiated in April 2017. Matt Gertken, Vice President Geopolitical Strategy mattg@bcaresearch.com Marko Papic, Senior Vice President Chief Geopolitical Strategist marko@bcaresearch.com 1 Please see BCA Geopolitical Strategy Special Report, "Power And Politics In East Asia: Cold War 2.0?" dated September 25, 2012, available at gps.bcaresearch.com. 2 Please see BCA Geopolitical Strategy Monthly Report, "Multipolarity And Investing," dated April 9, 2014, available at gps.bcaresearch.com. 3 Please see BCA Geopolitical Strategy Special Report, "Sino-American Conflict: More Likely Than You Think," dated October 4, 2013, available at gps.bcaresearch.com. 4 Please see BCA Geopolitical Strategy Weekly Report, "Trump, Day One: Let The Trade War Begin," dated January 18, 2017, available at gps.bcaresearch.com. 5 Please see BCA Geopolitical Strategy Monthly Report, "Throwing The Baby (Globalization) Out With The Bath Water (Deflation)," dated July 13, 2016, available at gps.bcaresearch.com. 6 Please see BCA Geopolitical Strategy and Global Investment Strategy Special Report, "Underestimating Sino-American Tensions," dated November 6, 2015, available at gis.bcaresearch.com. 7 Please see BCA Geopolitical Strategy Special Report, "The South China Sea: Smooth Sailing?" dated March 28, 2017, and "The Looming Conflict In The South China Sea," May 29, 2012, available at gps.bcaresearch.com. 8 Comparable incidents in December 2013, August 2014, May 2016, December 2016, August 2017, and March 2018 did not receive such a high-level response from U.S. leaders, reflecting both the seriousness of the Decatur incident and the administration's sense of political expediency amidst the trade conflict and midterm election cycle. 9 Pence criticized Chinese President Xi by name for allegedly breaking his word on the militarization of the Spratly Islands. He suggested that China's outward investment should be understood in strategic rather than economic terms, implying that the Belt and Road Initiative is a Soviet-style plan to organize a "bloc" of nations under Chinese hegemony. And he hinted at a new defense of the Monroe Doctrine in his criticism of China's recent assistance to the collapsing socialist regime in Venezuela. Please see the White House, "Remarks by Vice President Pence on the Administration's Policy Toward China," dated October 4, 2018, available at www.whitehouse.gov. 10 The Trump administration's key document is Secretary of Defense James Mattis, "Summary of the 2018 National Defense Strategy of the United States of America," Department of Defense, 2018, available at dod.defense.gov. For the Xi administration, see Orange Wang and Zhou Xin, "Xi Jinping says trade war pushes China to rely on itself and 'that's not a bad thing,'" South China Morning Post, dated September 26, 2018, available at www.scmp.com; and the Information Office of the State Council, "The Facts and China's Position on China-US Trade Friction," September 2018, available at www.chinadaily.com. 11 For this discussion of shows of force please see W. Eugene Cobble, H. H. Gaffney, and Dmitry Gorenburg, "For the Record: All U.S. Forces' Responses to Situations, 1970-2000 (with additions covering 2000-2003)," Center for Strategic Studies, May 2005, available at www.dtic.mil. 12 See footnote 11 above. 13 Please see William S. Murray, "Asymmetric Options for Taiwan's Defense," Testimony before the U.S.-China Economic and Security Review Commission, June 5, 2014, available at www.uscc.gov. 14 Please see Barbara Starr, "US Navy proposing major show of force to warn China," dated October 4, 2018, available at www.cnn.com. 15 Even the South American location implies that Chinese, Russian, and Iranian influence on that continent is now deemed meaningful enough to require a reassertion of the Monroe Doctrine. Over the past decade, the U.S. has tended to regard these activities as limited, but now that may be changing. 16 Please see BCA Geopolitical Strategy Special Report, "2019: The Geopolitical Recession?" dated October 3, 2018, available at gps.bcaresearch.com. 17 Please see "Russia Holds Massive War Games, As Putin And Xi Tout Ties," Radio Free Europe, Radio Liberty, September 11, 2018, available at www.rferl.org. 18 Australia, Japan, and the U.K. have already begun enforcing freedom of navigation alongside the U.S. 19 The U.S. could also impose secondary sanctions on China for non-compliance. State-owned energy firm Sinopec, for instance, was said to be reducing imports of crude from Iran by half in the month of September. Our Commodity & Energy Strategy notes that Chinese refiners, like other Asian refiners, are preparing to run more light-sweet crude from the U.S. in the future, which gives a good yield in high-value-added products like gasoline. So far China has not imposed retaliatory tariffs on these imports from the U.S. Please see Chen Aizhu and Florence Tan, "China's Sinopec halves Iran oil loadings under U.S. pressure: sources," Reuters, dated September 28, 2018, available at uk.reuters.com. 20 Please see BCA Geopolitical Strategy Weekly Report, "Are You Ready For 'Maximum Pressure?'," dated May 16, 2018, available at gps.bcaresearch.com. 21 Please see BCA Emerging Markets Strategy Special Report, "China's Belt And Road Initiative: Can It Offset A Mainland Slowdown?" dated September 13, 2017, available at ems.bcaresearch.com. 22 Please see BCA Geopolitical Strategy Special Report, "Can Russia Import Productivity From China?" dated June 29, 2016, and "The Embrace Of The Dragon And The Bear," dated April 11, 2014, available at gps.bcaresearch.com. 23 Xi Jinping's refusal to meet with Secretary of State Mike Pompeo over the past weekend, and decision to visit North Korea for the first time in his term, underscores this point. 24 Please see Demetri Sevastopulo and Tom Mitchell, "US considered ban on student visas for Chinese nationals," Financial Times, dated October 2, 2018, available at www.ft.com. Appendix Notable Clashes In The South China Sea (2010-18)
A Global Show Of Force?
A Global Show Of Force?
Notable Clashes In The South China Sea (2010-18) (Continued)
A Global Show Of Force?
A Global Show Of Force?
Notable Clashes In The South China Sea (2010-18) (Continued)
A Global Show Of Force?
A Global Show Of Force?
Highlights Duration: Last week's bond market rout was driven by strong U.S. data. Global growth (ex. U.S.) continues to weaken. Weak foreign growth that migrates stateside via a stronger dollar remains the biggest risk to our below-benchmark duration stance. For now, we prefer to hedge that risk by owning curve steepeners and maintaining only a neutral allocation to spread product. High-Yield: A supply shock in the oil market would most likely lead to steep backwardation in the oil futures curve and an increase in implied oil volatility. An increase in implied oil volatility will translate into a higher risk premium embedded in junk spreads. Emerging Market Sovereigns: All of the recent widening in USD-denominated EM sovereign spreads has been concentrated in Turkey and Argentina, two nations that remain highly exposed to global growth divergences and a stronger U.S. dollar. Most other EM countries offer less attractive spreads than comparable U.S. corporate debt. Remain underweight USD-denominated EM sovereign bonds. Feature Bond Breakout Chart 1The Long End Breaks Out
The Long End Breaks Out
The Long End Breaks Out
Bond markets sold off sharply last week and long-dated Treasury yields took out some noteworthy technical levels in the process. The 10-year Treasury yield broke above its May 2018 peak of 3.11% and settled at 3.23% as of last Friday. The next big test for the 10-year's cyclical uptrend is the 2011 peak of 3.75% (Chart 1). The 30-year yield similarly broke above its May 2018 peak of 3.25%, settling at 3.39% as of last Friday. The next resistance for the 30-year occurs at the early-2014 peak of 3.96%. Removing our, admittedly uncomfortable, technical analysis hat, it is instructive to note which macro factors were responsible for last week's large bear-steepening of the Treasury curve and which weren't. Strong U.S. economic data - the non-manufacturing ISM survey hit its highest level since 1997 (Chart 2) - and Fed Chairman Powell commenting that the fed funds rate is "a long way from neutral at this point, probably" were the key drivers of the move.1 Taken together, these two developments suggest that the Fed is further behind the curve than was previously thought. This is consistent with an upward revision to the market's assessment of the neutral fed funds rate, which explains why the yield curve steepened and the price of gold edged higher.2 But it's equally important to note the factors that didn't drive the increase in yields. In this case, yields weren't driven by a rebound in growth outside of the U.S., which continues to flag (Chart 2, panel 2). The Global Manufacturing PMI fell for the fifth consecutive month in September. While our diffusion index based on the number of countries with PMIs above versus below the 50 boom/bust line ticked higher (Chart 2, panel 3), our diffusion index based on the number of countries with rising versus falling PMIs remained deeply negative (Chart 2, bottom panel). Chart 2Growth Divergences Deepen
Growth Divergences Deepen
Growth Divergences Deepen
Chart 3Global PMIs
Global PMIs
Global PMIs
Taken together, our diffusion indexes are consistent with an environment where most countries are experiencing decelerating growth from high levels. This message is confirmed by looking at the PMIs from the five largest economic blocs (Chart 3). The Eurozone PMI continues to fall rapidly, though it remains well above 50. The Emerging Markets (ex. China) PMI is also trending lower from a relatively high level, while the Chinese PMI is threatening to break below 50. Only the U.S. and Japan have healthy looking PMIs. The precariousness of non-U.S. growth leads us to reiterate the biggest risk to our below-benchmark duration view. The risk is that weak foreign growth eventually migrates to the U.S. via a stronger dollar and forces the Fed to pause its +25 bps per quarter rate hike cycle. If current trends continue, it is highly likely that U.S. growth will slow in the first half of next year, though it is unclear whether such a slowdown would be severe enough for the Fed to pause rate hikes.3 In any event, the bond market is only priced for the Fed to maintain its quarterly rate hike pace until June of next year (3 more hikes) before going on hold (Chart 4). Essentially, the market already discounts a rate hike pause, even after last week's large increase in yields. Chart 4Market's Rate Expectations Still Too Low
Market's Rate Expectations Still Too Low
Market's Rate Expectations Still Too Low
For this reason, we prefer to maintain our below-benchmark portfolio duration stance, and to hedge the risk of weakening foreign growth by owning curve steepeners,4 and maintaining only a neutral allocation to spread product. Bottom Line: Last week's bond market rout was driven by strong U.S. data. Global growth (ex. U.S.) continues to weaken. Weak foreign growth that migrates stateside via a stronger dollar remains the biggest risk to our below-benchmark duration stance. For now, we prefer to hedge that risk by owning curve steepeners and maintaining only a neutral allocation to spread product. In Case You Needed Another Reason To Be Nervous About Junk As Treasury yields broke higher last week, the average high-yield index option-adjusted spread tightened to a fresh cyclical low of 303 bps. It has since rebounded to 316 bps (Chart 5). Our measure of the excess spread available in the high-yield index after adjusting for expected default losses is now at 196 bps, well below its historical average of 247 bps (Chart 5, panel 2). We have previously pointed out that even this below-average excess spread embeds a very low 12-month default loss expectation of 1.07%.5 Rarely have default losses been below that level. With job cut announcements forming a tentative bottom (Chart 5, bottom panel), we see high odds that default losses surprise to the upside during the next 12 months. In the absence of further spread tightening, that would translate to 12-month excess junk returns of 196 bps or less. But this week we want to highlight an additional risk to junk spreads. That risk being our Commodity & Energy Strategy service's view that crude oil prices could experience a positive supply shock in the first quarter of next year. At present, our strategists see high odds of $100 per barrel Brent crude oil in the first quarter of next year, and are forecasting an average price of $95 per barrel for 2019. At publication time, the Brent crude oil price was $85.6 At first blush it isn't obvious why high oil prices would pose a risk to junk spreads, and in fact there is no consistent correlation between the level of oil prices and junk spreads. However, there is a correlation between implied volatility in the crude oil market and junk spreads, with higher implied vol coinciding with wider spreads and vice-versa (Chart 6). Chart 5Default Loss Expectations Too Low
Default Loss Expectations Too Low
Default Loss Expectations Too Low
Chart 6Higher Oil Vol = Wider Junk Spreads
Higher Oil Vol = Wider Junk Spreads
Higher Oil Vol = Wider Junk Spreads
Would higher oil prices necessarily induce a spike in implied volatility? Not necessarily. It turns out that what matters for implied oil volatility is the slope of the futures curve.7 A contangoed futures curve where long-dated futures trade at a higher price than short-dated futures tends to be associated with high implied volatility. A steeply backwardated futures curve where long-dated futures trade well below short-dated futures is equally associated with elevated implied vol (Chart 7). Implied volatility tends to be lowest when the futures curve is in mild backwardation. A mild backwardation is typical when crude prices are in a gradual uptrend, as is the case at present. All in all, the following features provide a reasonable description of the current environment: Gradual uptrend in crude oil price Mild oil futures curve backwardation Low implied crude volatility Tight junk spreads However, as we head into next year, our commodity strategists anticipate that supply constraints will bite in the oil market. The U.S. is poised to implement an oil embargo against Iran in November, and Venezuela - another important oil exporter - remains on the brink of collapse. With global oil inventories already tight, and the loss of further production from Venezuela and Iran looming, our strategists anticipate that the number of days of demand covered by crude oil inventories will decline sharply. This decline will lead to a steep backwardation of the futures curve (Chart 8). Chart 7Brent Crude Oil Volatility Vs. Forward Slope
Oil Supply Shock Is A Risk For Junk
Oil Supply Shock Is A Risk For Junk
Chart 8Supply Shock Will Lead To Steep Backwardation
Supply Shock Will Lead To Steep Backwardation
Supply Shock Will Lead To Steep Backwardation
The bottom line for junk investors is that a supply shock in the oil market would most likely lead to a steep backwardation in the futures curve and an increase in implied oil volatility. An increase in implied oil volatility will translate into a higher risk premium embedded in junk spreads. We continue to recommend only a neutral allocation to high-yield in U.S. bond portfolios. We will await a signal that profit growth is set to deteriorate before advocating for a further reduction in exposure. Still No Buying Opportunity In EM Sovereigns Chart 9EM Index Spread Looks Cheap
EM Index Spread Looks Cheap
EM Index Spread Looks Cheap
As growth divergences between the U.S. and the rest of the world increase, we are on high alert for an opportunity to shift some allocation out of U.S. corporate credit and into USD-denominated emerging market (EM) sovereign debt. However, so far EM spreads are simply not wide enough to merit attention from U.S. bond investors. This is not apparent from the average index spreads. In fact, a quick glance at the indexes shows that EM sovereign spreads have widened a lot relative to duration- and quality-matched U.S. corporates, and actually offer a healthy spread pick-up (Chart 9). However, a more detailed look at the spreads from individual countries shows that the spread advantage in EM is only available in a select few markets (Charts 10A & 10B). At the lower-end of the credit spectrum: Turkey, Argentina, Ukraine and Lebanon all offer higher breakeven spreads than comparable U.S. corporates. In the upper credit tiers: Saudi Arabia, Qatar and United Arab Emirates (UAE) look attractive. All other EM countries off lower breakeven spreads than comparable U.S. corporates. Chart 10ABreakeven Spreads: USD EM Sovereigns Vs. U.S. Corporates
Oil Supply Shock Is A Risk For Junk
Oil Supply Shock Is A Risk For Junk
Chart 10BBreakeven Spreads: USD EM Sovereigns Vs. U.S. Corporates
Oil Supply Shock Is A Risk For Junk
Oil Supply Shock Is A Risk For Junk
We would be very reluctant to shift any allocation out of U.S. corporates and into either Turkey or Argentina. Both of those countries are highly exposed to the tightening in global liquidity conditions that occurs alongside a strengthening U.S. dollar. Our Foreign Exchange and Global Investment Strategy teams created a Vulnerability Heat Map to identify which EM countries are likely to struggle as the U.S. dollar appreciates (Chart 11).8 These tend to be countries with large current account deficits and high external debt balances, though several other factors are also considered. The results show that Argentina and Turkey are the two most exposed nations. Chart 11Vulnerability Heat Map For Key EM Markets
Oil Supply Shock Is A Risk For Junk
Oil Supply Shock Is A Risk For Junk
At the upper-end of the credit spectrum, the USD bonds from Saudi Arabia, Qatar and UAE are more interesting. Our geopolitical strategists anticipate an escalation of tensions between the U.S. and Iran following the U.S. midterm elections, and such tensions could increase the political risk premium embedded in all Middle Eastern debt. But for longer-term U.S. fixed income investors, it is worth noting that extra spread is available in the hard currency sovereign debt of Saudi Arabia, Qatar and UAE compared to A-rated U.S. corporates. Bottom Line: All of the recent widening in USD-denominated EM sovereign spreads has been concentrated in Turkey and Argentina, two nations that remain highly exposed to global growth divergences and a stronger U.S. dollar. Most other EM countries offer less attractive spreads than comparable U.S. corporate debt. Remain underweight USD-denominated EM sovereign bonds. Ryan Swift, Vice President U.S. Bond Strategy rswift@bcaresearch.com 1 Powell's full interview can be viewed here: https://www.youtube.com/watch?v=-CqaBSSl6ok 2 Please see U.S. Bond Strategy Weekly Report, "A Signal From Gold?", dated May 1, 2018, available at usbs.bcaresearch.com 3 Please see U.S. Bond Strategy Weekly Report, "An Oasis Of Prosperity?", dated August 21, 2018, available at usbs.bcaresearch.com, where we note that every time the Global (ex. US) LEI has dipped below zero since 1993, the U.S. LEI has eventually followed. 4 Please see U.S. Bond Strategy Weekly Report, "More Than One Reason To Own Steepeners", dated September 25, 2018, available at usbs.bcaresearch.com 5 Please see U.S. Bond Strategy Weekly Report, "Out Of Sync", dated July 3, 2018, available at usbs.bcaresearch.com 6 Please see Commodity & Energy Strategy Weekly Report, "Odds Of Oil-Price Spike In 1H19 Rise; 2019 Brent Forecast Lifted $15 To $95/bbl", dated September 20, 2018, available at usbs.bcaresearch.com 7 Please see Commodity & Energy Strategy Weekly Report, "Calm Before The Storm In Oil Markets", dated August 2, 2018, available at ces.bcaresearch.com 8 Please see Foreign Exchange Strategy/Geopolitical Strategy Special Report, "The Bear And The Two Travelers", dated August 17, 2018, available at fes.bcaresearch.com Fixed Income Sector Performance Recommended Portfolio Specification
China is becoming more assertive and increasingly hostile toward the U.S., this will likely mark a paradigm shift in the macro landscape and hence, could become a grey swan event for emerging markets (EM) and asset valuations. The decision by the Trump…
Highlights Heightening geopolitical tensions between the U.S. and China, higher U.S. bond yields, tightening U.S. dollar liquidity and weakening EM/China growth - all combined - constitute a bitter cocktail for EM. Barring a meaningful improvement in Chinese growth, higher U.S. bond yields will be overwhelming for EM financial markets. U.S. banks are not creating new dollars sufficiently. In addition, they are shrinking their claims on EM. The U.S. dollar is primed for another upleg. Downgrade Indian stocks from overweight to underweight within a dedicated EM equity portfolio. Feature As China becomes more assertive and slightly hostile toward the U.S., this will likely mark a paradigm shift in the macro landscape and asset valuations and, hence, could become a grey swan1 event for emerging markets (EM). Investors remain complacent about the ongoing geopolitical confrontation between these two economic giants as well as other headwinds that China and EM are facing. The decision by the Trump administration to raise import tariffs to 25% on $200 billion of China's exports to the U.S. as of January 1, 2019 is an unambiguous signal that U.S. trade confrontation with China is not a pre-mid-term election political plot. Instead, it is the beginning of a long-term geopolitical battle between an existing and rising superpower. Remarkably, the just-concluded trade deal between the U.S., Mexico and Canada (USMCA) includes language that requires signatories to give notice if they plan to negotiate a free trade deal with a "non-market" economy.2 Provided "non-market" country is for now implied to be China, this corroborates that confrontation with the latter is a new long-term strategy for the U.S. In addition, investors should not expect China to be constantly on the defensive. Both the political leadership and people in China have realized that trade is not the only aspect where the U.S. is likely to challenge the Middle Kingdom, and they recognize it will be a long-term battle. Therefore, the communist party and President Xi will counter the U.S. with reasonably tough actions. Quite simply, failure to do so will place the political leadership's credibility in question. President Xi understands this well, and will not allow it to happen. It is hard to forecast the avenues and approaches that Chinese leadership will explore to confront the U.S. Yet the recent navy incident in the South China Sea exemplifies that China will not be silent in this row.3 More generally, EM financial markets are not ready for such negative surprises. For example, there has been little capitulation on the part of asset managers with respect to EM equities. In fact, they have lately been buying EM ETF futures (Chart I-1). Global financial market volatility calculated as an equally weighted average of volatility in U.S. and EM equities, U.S. bonds, various currencies, oil and gold are near its historic lows (Chart I-2). Chart I-1Asset Managers Have Been Buying EM Equity Futures
Asset Managers Have Been Buying EM Equity Futures
Asset Managers Have Been Buying EM Equity Futures
Chart I-2Financial Markets Volatility Is Very Low
Financial Markets Volatility Is Very Low
Financial Markets Volatility Is Very Low
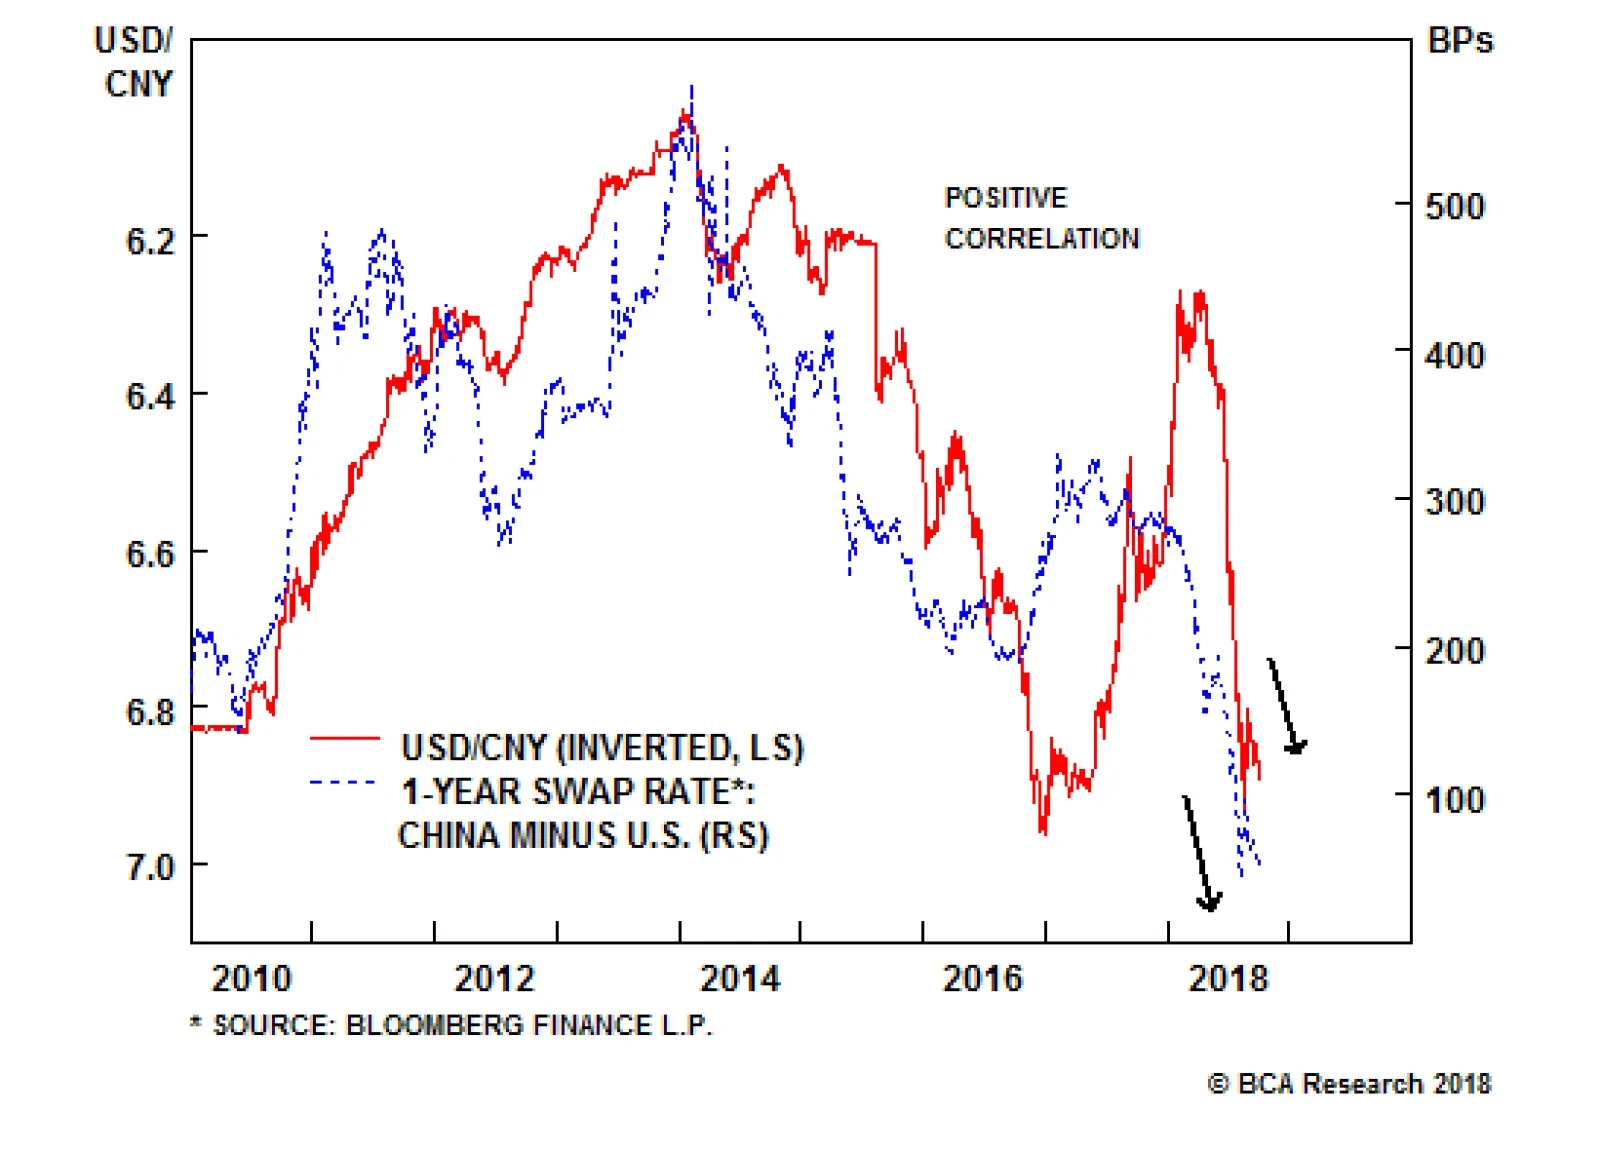
Remarkably, the U.S. bond market volatility is at an all-time low while bond yields are breaking out (Chart I-3). Odds are the U.S. yields will move up considerably. The basis is that strong growth and rising inflation in the U.S. warrant considerably higher bond yields and more Fed rate hikes than are currently priced in. Barring a meaningful improvement in Chinese growth and global trade, higher U.S. bond yields will be overwhelming for EM financial markets. In particular, higher U.S interest rates could trigger another downleg in the value of Chinese yuan. Chart I-4 illustrates that the China-U.S. interest rate differential has been instrumental to moves in the RMB/USD exchange rate. Chart I-3A Breakout In U.S. Bond Yields
A Breakout In U.S. Bond Yields
A Breakout In U.S. Bond Yields
Chart I-4China Vs. U.S.: Does Interest Rate ##br##Differential Explain Exchange Rate?
China Vs. U.S.: Does Interest Rate Differential Explain Exchange Rate?
China Vs. U.S.: Does Interest Rate Differential Explain Exchange Rate?
Apart from the heightening geopolitical tensions between the U.S. and China and higher U.S. bond yields, weakening EM/China growth, tightening global U.S. dollar liquidity and a strong U.S. dollar all combined will constitute a bitter cocktail for EM. We discuss some of these negatives below. All in all, financial markets could be on the cusp of a volatility outbreak, and EM will still be at the epicenter of the storm. BCA's Emerging Markets Strategy service continues to recommend short positions in EM risk assets and an underweight allocation versus DM. A Dead Cat Bounce... Emerging markets share prices have attempted to stage a rebound lately, but so far it appears to be nothing more than a dead cat bounce. Even thought the aggregate EM equity index managed a 5% bounce in recent weeks, both the EM equally weighted equity and small-cap indexes have failed to rebound at all (Chart I-5, top and middle panels). Similarly, EM bank stocks - which make up 17% of the MSCI market cap and are the key to the benchmark's performance - have not rallied (Chart I-5, bottom panel). This is occurring at a time when the S&P 500 is at all-time highs. These are very unhealthy signs for EM risk assets. ...As China/EM Growth Continues To Downshift The premise behind the lack of meaningful rebound in EM equities in our view is that both global manufacturing and world trade growth continue to downshift (Chart I-6, top panel). The epicenters of the slowdown are China and other emerging economies (Chart I-6, middle and bottom panels). Chart I-5No Confirmation Of EM Rebound
No Confirmation Of EM Rebound
No Confirmation Of EM Rebound
Chart I-6EM/China Growth Is Decelerating
EM/China Growth Is Decelerating
EM/China Growth Is Decelerating
Importantly, the Markit PMI manufacturing surveys suggest export orders contracted in September in the world's important manufacturing hubs, including China, Japan, Taiwan and Germany. The last time such poor export performance was registered was more than two years ago. The slump in the aggregate EM manufacturing PMI explains not only the EM equity selloff but also EM credit spreads widening and EM currency depreciation since the beginning of this year (Chart I-7). So long as the weakening trend in EM/China and global trade growth persist, EM risk assets and currencies will continue to sell off. Regarding China, growth deceleration was already occurring before the initial import tariffs took hold. Specifically, not only are overseas orders weak, but also domestic orders have rolled over decisively, as indicated by the People's Bank of China's (PBoC) 5000 industrial enterprise survey (Chart I-8). Chart I-7Weakening Growth Explains Selloff In ##br##EM Credit And Currencies
Weakening Growth Explains Selloff In EM Credit And Currencies
Weakening Growth Explains Selloff In EM Credit And Currencies
Chart I-8China: Domestic And Overseas Orders
China: Domestic And Overseas Orders
China: Domestic And Overseas Orders
In the mainland, the boost to infrastructure spending in the coming months will likely be offset by a slump in property construction and other segments of the economy. We discussed this angle in our recent report,4 but in recent days there has been more real estate market tightening. Specifically, the authorities are considering the cancellation of the housing pre-sale system in Guangdong province - a policy that could be applied to other geographies. The motive of this tightening is to curb both the land-buying frenzy and Ponzi financing schemes that many developers are involved in. This fits the policy script of dealing with and purging speculation and excesses early to prevent a bust later. These policy measures will cut off property developers from their primary source of funding - presales - and force them to reduce their construction volumes. As an unintended consequence of this announcement, some developers have already begun cutting house prices to accelerate pre-sales and raise funds. Given already bubbly property valuations and the existence of substantial speculative buying, house price deflation could set off a domino chain effect of lower prices, reduced speculative investment purchases and financial strains on developers, leading them in turn to offer even larger price discounts to generate funds faster, and so on. Forecasting the exact trajectory of a downturn and the speed of its adjustment is impossible. This is why we focus on the presence of major imbalances/excesses and policy tightening that could cause disentangling of these excesses. Given the still-considerable property market excesses5 prevalent in China and the money/credit tightening that has already occurred in the past two years, we reckon the odds of a material property market downtrend are substantial. On the whole, our main theme for China and EM remains that mainland construction activity will continue to downshift, with negative implications for countries that supply construction goods, materials and equipment. U.S. Dollars Shortages? The U.S. economy is firing on all cylinders and inflationary pressures continue to rise. Barring a deflationary shock from China/EM, the Federal Reserve has little reason to halt its rate hikes or abandon its policy of shrinking its balance sheet. Not only are U.S. interest rates rising, but there are also budding U.S. dollar shortages that will get worse: The U.S. banking system's excess reserves at the Fed are dwindling, as the latter continues to shrink its balance sheet (Chart I-9). U.S. banks' dollar-denominated claims on foreign entities in general and emerging markets in particular are shrinking (Chart I-10). Thus, EM debtors in particular have found themselves short of dollars. Chart I-9The U.S. Dollar Is Primed For Another Upleg
The U.S. Dollar Is Primed For Another Upleg
The U.S. Dollar Is Primed For Another Upleg
Chart I-10U.S. Dollar Shortages In Rest Of World
U.S. Dollar Shortages In Rest of World
U.S. Dollar Shortages In Rest of World
Finally, U.S. banks are not creating enough dollars - their total assets are growing at a paltry rate of 1%, and U.S. broad money (M2) growth is expanding at 4% annually - the slowest pace in the past 14 years excluding the aftermath of the 2008 credit crisis (Chart I-11). Bottom Line: The Fed is shrinking its balance sheet, and high-powered money/liquidity in the banking system is falling. This and other factors are discouraging U.S. banks from creating new U.S. dollars. Along with rising U.S. interest rates, this will propel the greenback higher, which will be detrimental for EM risk assets. Equity Portfolio Rotation Amid High Oil Prices Given the recent breakout in oil prices, we make the following changes to our country equity allocation: Upgrade Russia from neutral to overweight.4 October 2018 Orthodox macro policy and high oil prices will help this bourse to outperform the EM benchmark (Chart I-12, top panel). We have already been overweight Russia within EM local bonds, currency and credit portfolios.6 Chart I-11U.S. Banks Are Not Creating Sufficient Amount Of Dollars
U.S. Banks Are Not Creating Sufficient Amount Of Dollars
U.S. Banks Are Not Creating Sufficient Amount Of Dollars
Chart I-12Upgrade Russian And Colombian Equities ##br##From Neutral To Overweight
Upgrade Russian And Colombian Equities From Neutral To Overweight
Upgrade Russian And Colombian Equities From Neutral To Overweight
Upgrade Colombian equities from neutral to overweight. Like Russia, high oil prices and orthodox macro policies justify an upgrade (Chart I-12, bottom panel). Upgrade Malaysia from underweight to neutral.4 October 2018 High energy prices, hope for structural changes and low inflation do not justify an underweight stance. Still, Malaysia is vulnerable to slowdown in global trade and credit excesses of the past years that have not yet been worked out. This prevents us from upgrading this bourse to overweight. Downgrade Philippines equities from neutral to underweight.4 October 2018 Inflation is breaking out and the central bank is behind the curve.7 Downgrade India from overweight to underweight. More detailed analysis on India starts on the following page. Our equity overweights are Taiwan, Korea, Thailand, Chile, Mexico, Colombia, Russia and central Europe. Our underweights are Brazil, South Africa, India, the Philippines, Indonesia and Peru. The complete list of our equity, fixed-income, credit and currency allocations are always presented at the end of our Weekly Reports, please refer to page 16. Arthur Budaghyan, Senior Vice President Emerging Markets Strategy arthurb@bcaresearch.com Downgrade Indian Equities 4 October 2018 We are downgrading our allocation to Indian stocks from overweight to underweight within an EM-dedicated equity portfolio (Chart II-1). Rising stress in the country's non-bank finance companies - the recent default of finance company Infrastructure Leasing & Financial Services Limited and the fire-sale of Dewan Housing Finance bonds by a mutual fund - has been responsible for escalating financial risks, and will have ramifications for overall macro stability and growth. Stress Among Finance Companies: Liquidity Or Solvency? Finance companies account for about 12% of the MSCI India Stock Index. Further, there are deep interlinkages between them and mutual funds. Chart II-2 shows that mutual funds have exponentially increased their claims on non-bank finance companies by purchasing commercial paper (short-term debt obligations) issued by the latter. Chart II-1Failure To Break Out Is A Bad Omen
Failure To Break Out Is A Bad Omen
Failure To Break Out Is A Bad Omen
Chart II-2Mutual Funds' Exposure To Finance Companies
Mutual Funds' Exposure To Finance Companies
Mutual Funds' Exposure To Finance Companies
Further signs that the non-bank finance sector is having difficulties rolling over or repaying their debt obligations will hurt mutual funds. This might trigger redemptions from the latter by their own investors. Importantly, mutual funds' net purchases of equities as well as bonds has been very strong in recent years, often outpacing that of foreigners (Chart II-3). Given the former's large holdings of various securities, forced selling by mutual funds can often create an air pocket for Indian financial markets: local investors will be selling at a time when foreign investors are not yet ready to buy. Odds are considerable that stress will continue to escalate in the non-bank financial sector. Short-term interest rates and corporate bond yields are rising (Chart II-4). This is occurring at a time when non-bank finance companies are very vulnerable because of their liquidity mismanagement. Chart II-3Indian Mutual Funds Are Large Investors In Stocks And Bonds
Indian Mutual Funds Are Large Investors In Stocks And Bonds
Indian Mutual Funds Are Large Investors In Stocks And Bonds
Chart II-4Rising Borrowing Costs
Rising Borrowing Costs
Rising Borrowing Costs
Financial data from six non-bank finance companies included in the MSCI India Equity Index reveals that short-term debt levels for these companies are extremely elevated (Chart II-5, top panel) and their liquidity situation is grim. A measure of liquidity risk, calculated as short-term investments (including cash) minus short-term borrowing, has plummeted and is in deep negative territory (Chart II-5, bottom panel). In short, these finance companies have been borrowing short term and lending long term. Additionally, these entities will soon have to deal with surging non-performing assets (NPAs). Total assets for large finance companies - including the six companies included in the MSCI Equity Index - have grown at an annual average of around 20% since 2010. It is difficult to lend or invest at such a rapid pace while avoiding capital misallocation and the accumulation of bad assets. Crucially, the current level for NPAs for these six finance companies is 2.3% of risk-weighted assets, but could rise much further. Their provisions stand 2.1%, which barely covers existing NPAs. Hence, provisions have to rise multi-fold. For example, if NPAs rise to 12%, that would wipe out 32% of these companies' equity. We assume a recovery ratio of 30% on these bad assets. For comparison, the NPA ratio for overall the banking system has already surged to about 12%. Finally, commercial banks' lending to finance companies has been excessive in recent years (Chart II-6). Commercial banks are already swamped with rising non-performing loans, and any additional stress among finance companies will damage investor sentiment and negatively impact banks' share prices. Chart II-5Finance Companies: Liquidity Strains Are ##br##Rooted In Maturity Mismatches
Finance Companies: Liquidity Strains Are Rooted In Maturity Mismatches
Finance Companies: Liquidity Strains Are Rooted In Maturity Mismatches
Chart II-6Banks' Exposure To Finance Companies
Banks' Exposure To Finance Companies
Banks' Exposure To Finance Companies
Bottom Line: Odds are that the liquidity stress among finance companies will escalate and turn into a solvency problem. This will harm mutual funds in particular and cause them to liquidate their equity and bond holdings. Indian financial markets will selloff further. Limited Maneuvering Room For Central Bank High crude prices, rising inflation and mounting financial stress are placing the Reserve Bank of India (RBI) in an extremely precarious position: If the central bank provides sufficient liquidity or reduces interest rates to deal with budding stress in the financial system, the currency will plunge further; If the RBI does not provide sufficient liquidity or hikes rates to put a floor under the rupee, the stress in the financial system will worsen. It seems the central bank is currently biased to providing liquidity to contain financial system stress. In fact, the central bank has already injected bank reserves through the liquidity adjustment facility. In addition, it announced upcoming purchases of government securities in October in the order of Rs. 360 billion and has stressed its willingness to provide more injections if the need arises. This is negative for the currency which will continue to tumble, especially at a time when the U.S. dollar is well-bid worldwide. In turn, continued currency depreciation will make foreign investors net sellers of stocks and bonds. Bottom Line: We recommend investors downgrade India from overweight to underweight. We are also closing our long Indian banks / short Chinese banks at a 2% loss. Concerning equity sectors, we are reiterating our long Indian software companies' stocks / short EM overall equity benchmark. This trade is up 22%, and a cheaper rupee and strong DM growth herald further gains. Ayman Kawtharani, Associate Editor ayman@bcaresearch.com 1 A grey swan is an event that can be anticipated to a certain degree but is considered unlikely to occur and would have a sizable impact on financial markets if it were to occur. 2https://ustr.gov/trade-agreements/free-trade-agreements/united-states-mexico-canada-agreement/united-states-mexico# 3https://www-m.cnn.com/2018/10/01/politics/china-us-warship-unsafe-encounter/index.html?r=https%3A%2F%2Fwww.cnn.com%2F 4 Please see Emerging Markets Strategy Weekly Report "Desynchronization Compels Currency Adjustments," dated September 20, 2018, a link available on page 16. 5 Please see Emerging Markets Strategy Special Report "China Real Estate: A Never-Bursting Bubble?," dated April 6, 2018, available on ems.bcaresearch.com. 6 Please see Emerging Markets Strategy Special Report "Vladimir Putin, Act IV," dated March 7, 2018, link available on ems.bcaresearch.com. 7 Please see Emerging Markets Strategy Special Report "The Philippines: Duterte's Money Illusion," dated April 25, 2018, link available on ems.bcaresearch.com. Equity Recommendations Fixed-Income, Credit And Currency Recommendations
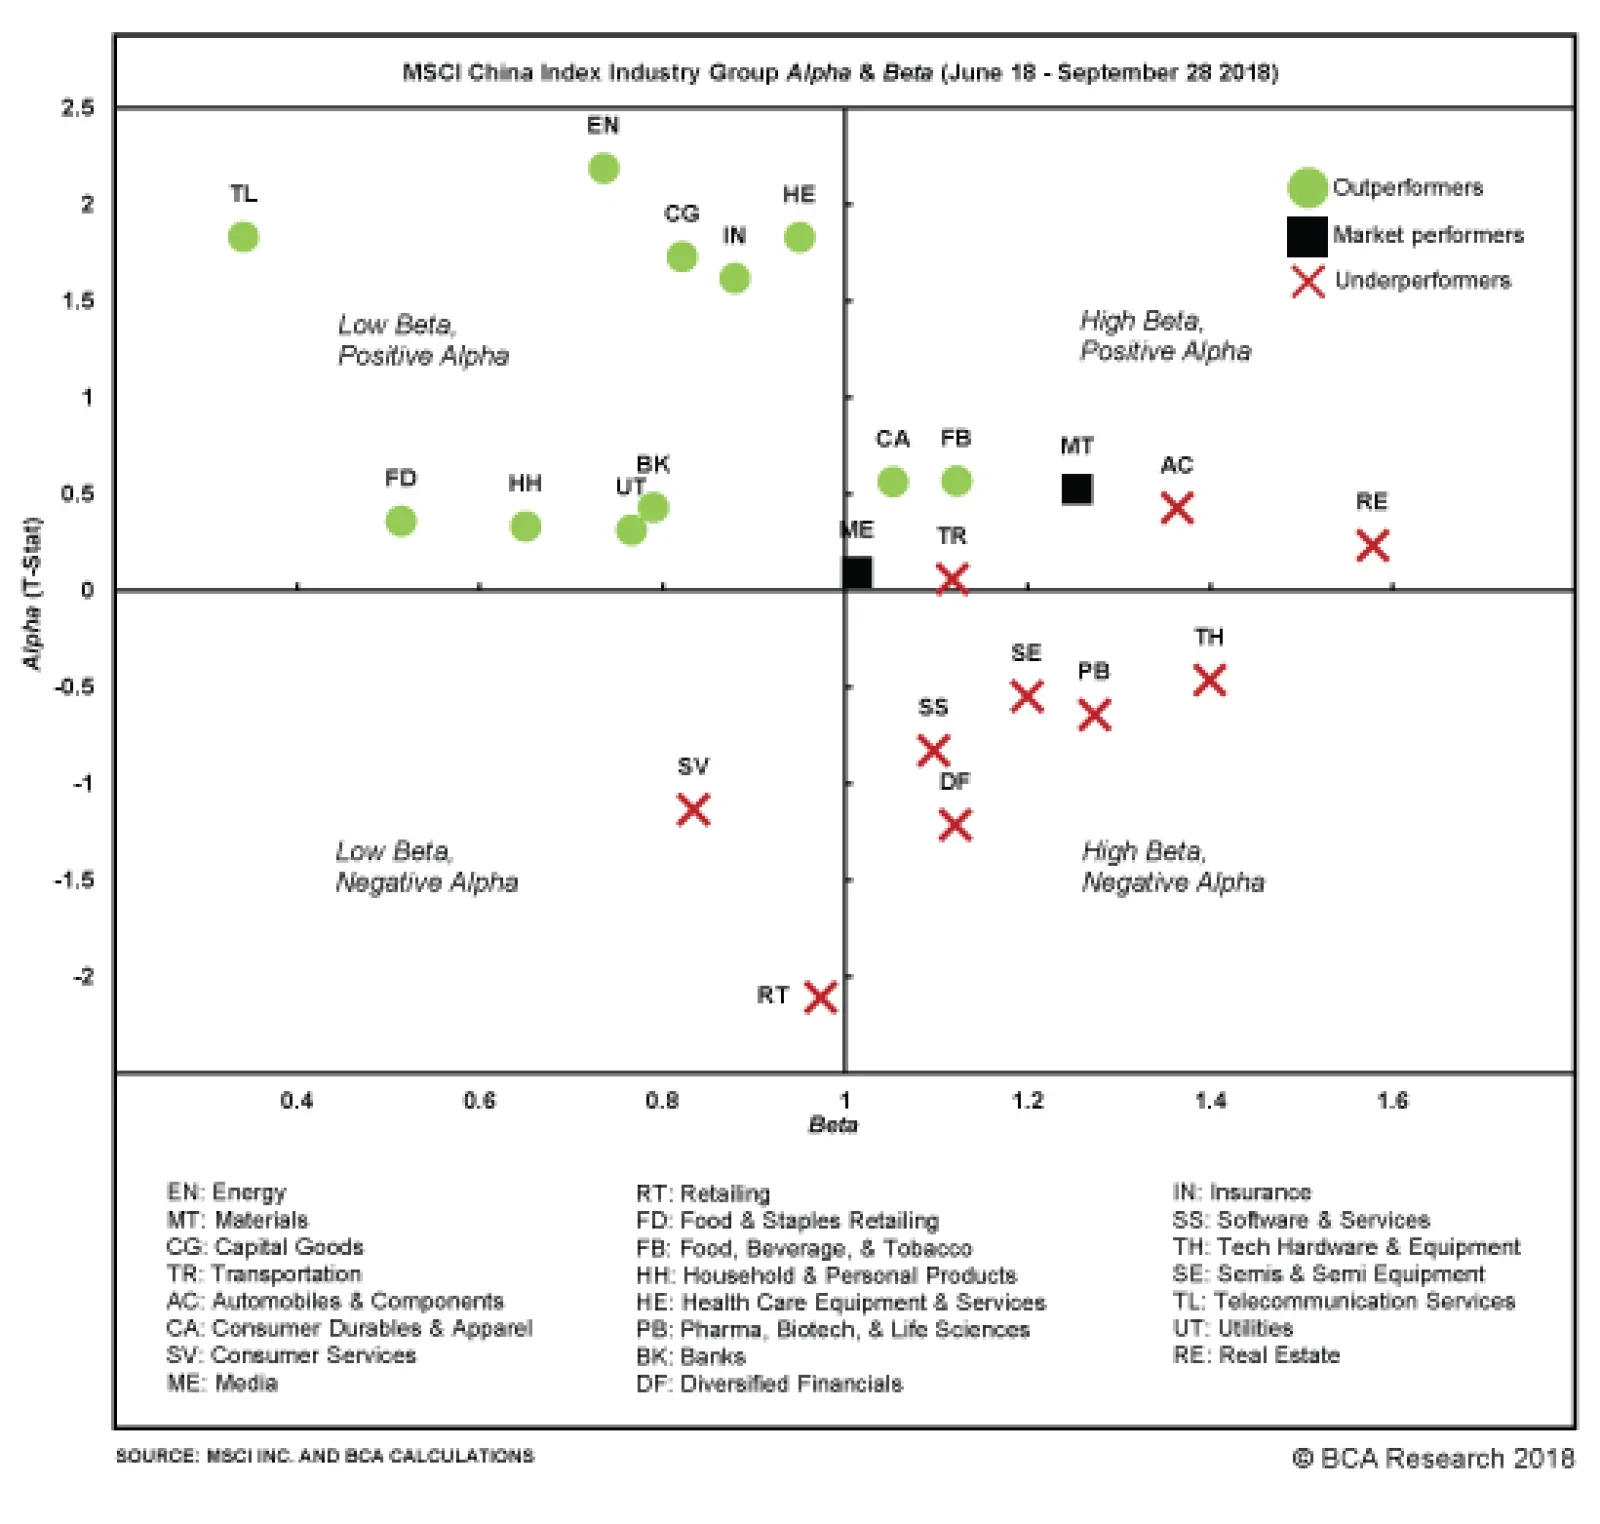
The above chart presents the alphas and betas of 23 industry groups within the MSCI China index from mid-June to the end of September. Several points are worth mentioning: The relative performance of Chinese industry groups since mid-June has been…
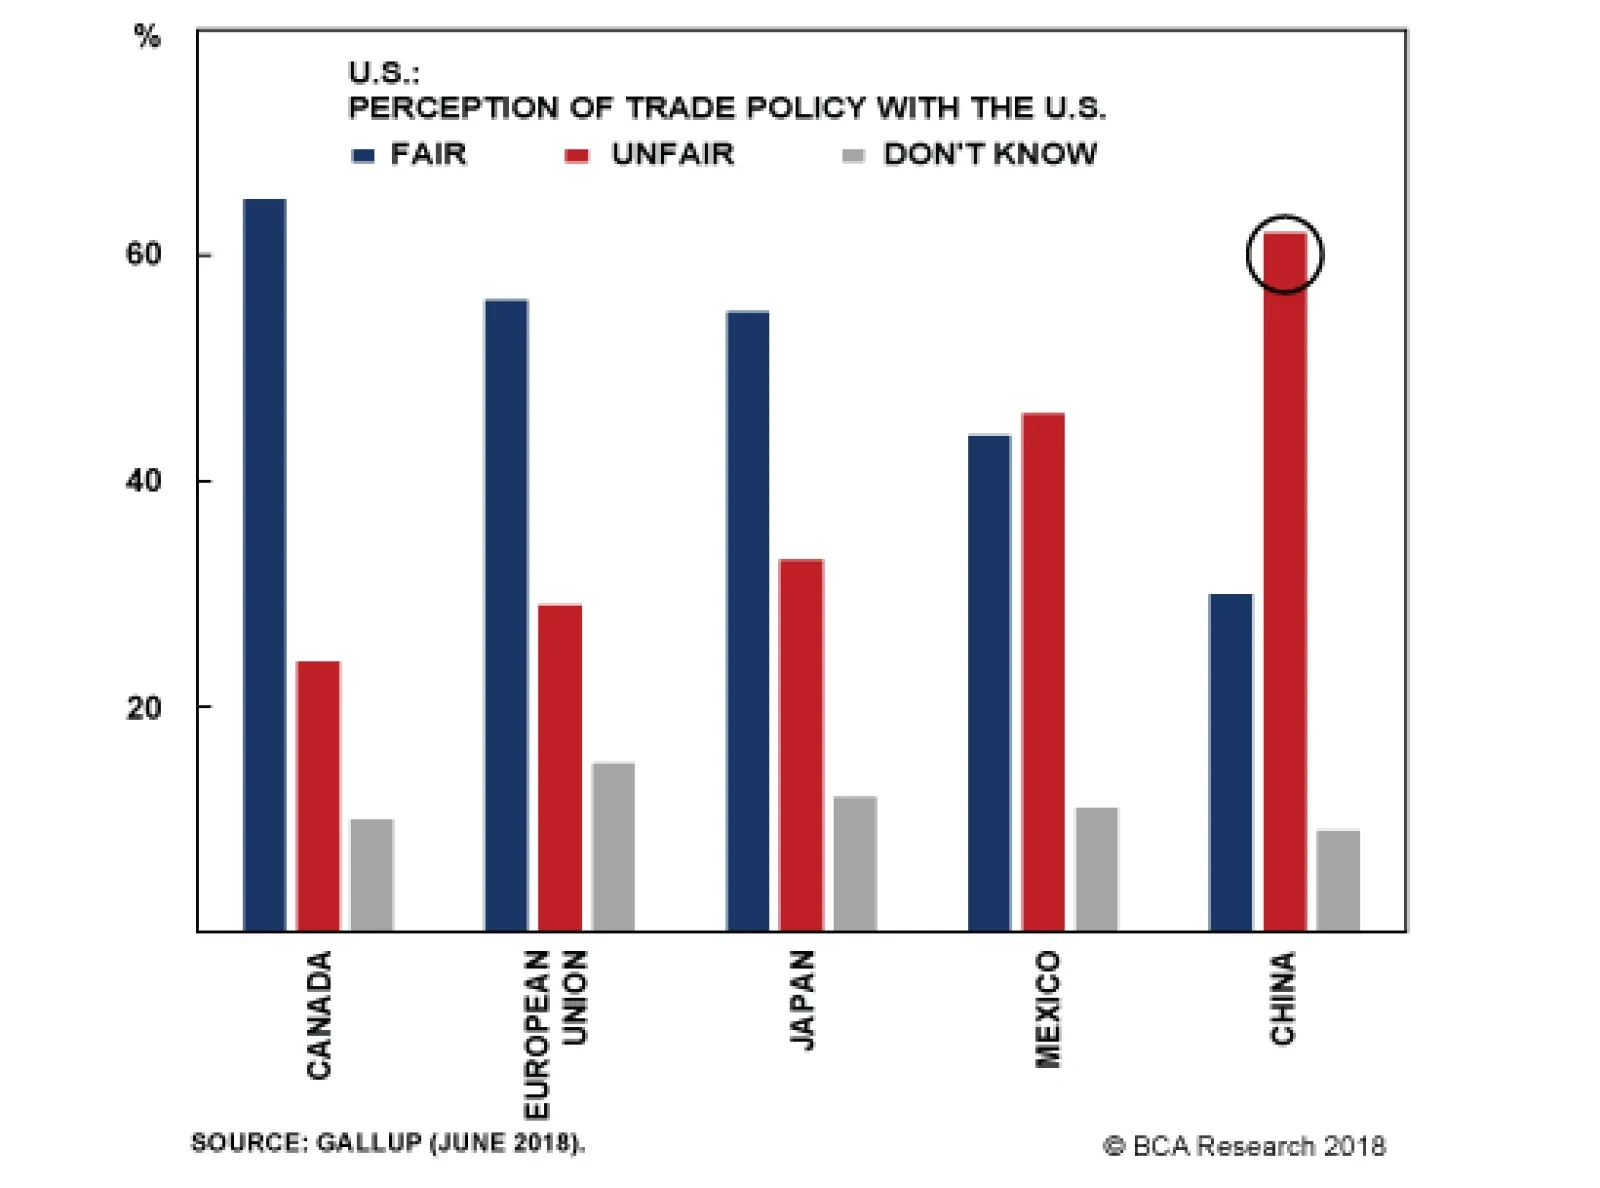
There are three reasons why investors holding this view are likely mistaken. First, in the U.S., the actual implementation of tariffs lies within the control of the White House. Congress has already delegated substantial authority on trade negotiation to…
Highlights Chart of the WeekIncreasing Gas-On-Gas Pricing Will Disrupt Global LNG Markets
U.S. Set To Disrupt Global LNG Market
U.S. Set To Disrupt Global LNG Market
Growth in the global Liquefied Natural Gas (LNG) market will be fuelled by surging U.S. natural gas production, which will allow consumers in Asian and European markets to diversify away from oil-indexed pricing - with its attendant geopolitical risks - and falling European gas production. As a result, markets will move toward short- and long-term contracts priced in USD/MMBtu (Chart of the Week). This will favor gas producers and LNG merchants with access to U.S. shale-gas supplies, where production is growing at double-digit p.a. rates (Chart 2). Well-developed trading and risk-management markets in the U.S. - centered on Henry Hub, LA - will incentivize consumers to shorten the tenor of oil-indexed contracts, replacing them with hedgeable futures-based contracts. These markets allow producers and merchants to offer short- and long-term contracts that meet consumer preferences. As the global LNG market grows, shipping companies, along with producers and merchants with worldwide trading and transport capabilities - or access to such capabilities - will grow market share at the expense of exporters tied to the more rigid oil-indexing regime (Chart 3). Energy: Overweight. We remain long call spreads along the Brent forward curve over February - August; these positions are up an average 88.4% since inception, basis Tuesday's close. The long S&P GSCI position we recommended in December is up 21.8%, on the back of higher oil prices and backwardated crude-oil forward curves. Base Metals: Neutral. Copper is holding on to recent gains - up ~ 11% from its mid-August trough, following oil higher. Precious Metals: Neutral. Gold hovers around $1,200/oz, following the Fed's meeting last week, which resulted in a 25bp increase in fed funds to 2.25%. Ags/Softs: Underweight. The trade agreement to be signed by U.S. officials at the end of November with their counterparts in Mexico and Canada removes some of the uncertainty weighing on ag markets. Upward revisions to 2017 carry-out estimates by the USDA continue to pressure corn and beans. Chart 2Surging Production, Market Depth Favor U.S. Gas Producers And Merchants
U.S. Set To Disrupt Global LNG Market
U.S. Set To Disrupt Global LNG Market
Chart 3Growing LNG Imports Will Favor Shippers, Producers And Merchants
U.S. Set To Disrupt Global LNG Market
U.S. Set To Disrupt Global LNG Market
Feature Surging U.S. natural gas production will continue to find its way to global LNG markets over the next decade. The persistence of oil-indexing in Asian LNG contracts will fuel the growth of U.S. exports, given the arbitrage between cheaper natural gas - priced basis supply-demand fundamentals for gas - and more expensive oil-indexed contracts.1 Added to this cost advantage, U.S. exports can be linked to hedgeable futures prices, using NYMEX Henry Hub, LA, contracts. These stability-of-supply and pricing advantages also allow LNG buyers in Asia and Europe to diversify away from oil-production disruption risks, which can send prices sharply higher, and being overly reliant on Russian imports. Chart 4U.S. LNG Exports Will Surge
U.S. Set To Disrupt Global LNG Market
U.S. Set To Disrupt Global LNG Market
This will give global consumers an incentive to continue shortening the tenor of more rigid oil-indexed LNG contracts, and to replace them with hedgeable contracts referencing Henry Hub, LA, futures contracts priced in USD/MMBtu. While a fairly stout increase of U.S. LNG exports already is expected by the EIA and IEA, we believe this dynamic likely results in export volumes that are higher than the ~ 10 Bcf/d expected by 2023, and close to 15 Bcf/d toward the end of the 2020s (Chart 4).2 Increasing volumes of associated natural gas production in the Permian Basin in west Texas, which will have to be transported from the basin so that it does not curtail oil production, will drive a large part of this growth. We expect a significant LNG export center to be developed in South Texas in Corpus Christi over the next five years or so, just as the U.S. surpasses 10 Bcf/d of exports in the middle of the next decade.3 Flexible pricing of LNG contracts basis Henry Hub already is supporting the buildout of Gulf Coast exports via take-or-cancel contracts. These contracts are replacing the more restrictive take-or-pay contracts still used in Asia.4 This will continue to evolve, allowing supply development to be hedged via Henry Hub natgas futures. Consumers ultimately benefit from cheaper supplies and hedgeable risks. This is not to say other benchmarks will fall away. There is always room for regional benchmarks - even oil-based benchmarks such as the Japan Crude Cocktail (JCC), or the spot- and swaps-market reference Japan/Korea Marker (JKM).5 The global crude oil market accommodates such regional benchmarks: WTI crude oil futures are the benchmark for oil markets in the Americas, while Brent crude oil futures serve as the benchmark for global markets. Crude oils with different chemical properties can be priced relative to these benchmarks for delivery anywhere in the world. The global LNG market could retain an Asian benchmark, but a lot of work needs to be done in terms of building the supporting infrastructure - pipelines, regasification facilities, deep futures markets, etc. - to make that happen.6 We are inclined to believe the build-out of U.S. LNG export capacity will occur before these pieces fall into place: Scale has never been an issue in the U.S. oil and gas patch. Global Supply - Demand Overview Chart 5Global LNG Demand Growth Likely Outpaces Current Expectations
U.S. Set To Disrupt Global LNG Market
U.S. Set To Disrupt Global LNG Market
Global LNG demand is expected to rise at an impressive 1.7% p.a. out to 2040 (Chart 5). However, local supply and demand levels are increasingly unbalanced, implying that cross-border pipeline and LNG imports will need to increase as gas demand rises.7 A few key markets lead this trend, as seen in Chart 6, which illustrates the supply-gap in major consuming countries. Supply gaps are poised to grow in Emerging Asia and Europe, due to elevated demand growth in the former and lack of supply growth in the latter. World LNG demand grew by 10% last year, with Europe and Emerging Asia accounting for more than 95% of this increase. However, last year's stellar growth numbers should not be considered as the baseline growth forecast.8 The latest projections show demand increasing by 21 Bcf/d by 2025 - taking LNG imports from 38 Bcf/d at present to 58 Bcf/d by then. This implies a lower annualized growth rate of 5.5%. Chart 6Supply - Demand Imbalances Will Fuel LNG Demand Globally
U.S. Set To Disrupt Global LNG Market
U.S. Set To Disrupt Global LNG Market
LNG Supply On Growth Trajectory World LNG export capacity is expected to go from 48 Bcf/d in 2017 to 61 Bcf/d by 2022 (Chart 7), with 53% of the additional capacity coming from the U.S., 18% from Australia, and 15% from Russia.9 Chart 7LNG Export Capacity Growth
U.S. Set To Disrupt Global LNG Market
U.S. Set To Disrupt Global LNG Market
Our baseline forecast for the LNG market foresees a short-term supply surplus in 2020 (Chart 8), followed by a catch-up in demand and new waves of projects between 2024 and 2030. Among the supply-side developments we are following: Chart 8New LNG Projects In The Pipeline
U.S. Set To Disrupt Global LNG Market
U.S. Set To Disrupt Global LNG Market
The Australian LNG market has undergone massive change in the last five years. While being a relatively small natural gas producer (8th largest producer, accounting for ~ 3% of world output), in 2015, the country became the second largest LNG exporting country in the world with now over 7.5 Bcf/d of exports. The bulk of new liquefaction facilities will be operational in 2019 with the completion of new trains at the Wheatstone, Prelude Floating and Ichthys LNG facilities.10 This will bring Australian total LNG export capacity to over 10 Bcf/d. Importantly, most of Australia's LNG trade is with Emerging Asian countries. This region still relies mostly on oil-linked, long-term, and fixed-destination contracts. Absent the OPEC market-share war of 2014 - 2016, when oil prices collapsed, Australia's LNG prices are subject to oil price risks and volatility (Chart 9). Chart 9Asian Oil-Indexed Contracts Trade Above Spot LNG
U.S. Set To Disrupt Global LNG Market
U.S. Set To Disrupt Global LNG Market
The U.S. currently has ~ 3 Bcf/d liquefaction capacity and is increasingly exporting to Asian countries (Table 1). The present wave of projects under-construction will push capacity to ~ 9 Bcf/d in 2020. Following a two year pause in project Final Investment Decisions (FIDs) from 2016 to 2017, potential FIDs in 2018 and 2019 could increase the U.S. capacity to ~ 14 Bcf/d by 2025. This will make the U.S. the second-largest exporter of LNG in the world, surpassing Australia. This new wave of investment is yet to be finalized; therefore, final investment decisions in 2H18 and 2019 will be crucial to determine the medium-term potential of U.S. LNG. If a majority of these projects goes through, U.S. capacity risks being overbuilt for the next decade (Chart 10). Table 1U.S. LNG Exports By Country
U.S. Set To Disrupt Global LNG Market
U.S. Set To Disrupt Global LNG Market
Chart 10U.S. LNG Capacity Risks Becoming Overbuilt
U.S. Set To Disrupt Global LNG Market
U.S. Set To Disrupt Global LNG Market
Importantly, U.S. LNG exports already have had a massive impact on the global LNG market. The totality of U.S. export prices are determined by gas-on-gas pricing - i.e., gas priced in USD/MMBtu as a function of gas supply-demand fundamentals. Just as importantly, these contracts are without destination restrictions found in many oil-indexed contacts. In the U.S., the presence of a deep futures market allows flexible long-term contracting.11 According to Royal Dutch Shell, the spot LNG market doubled from 2010 to 2017, accounting for ~ 25% of all transactions, most of it due to the prodigious increase in U.S. LNG supply.12 An overbuilt U.S. market would increase spot LNG trading. Our own calculations based on EIA data indicate the U.S. could have too much capacity relative to demand in 2018 - 19, but goes into balance in 2020 - 2022.13 Russia's natural gas production is projected to increase from 66.7 Bcf/d in 2017 to 70.1 Bcf/d in 2023. However, the bulk of this increase will cover new pipeline exports. The country's LNG capacity is expected to grow by ~ 2.5 Bcf/d with the completion of trains at the Yamal, Vysotsk and Portovaya export facilities. Despite its low LNG capacity, Russia remains a key player in the LNG market. Its rising pipeline capacity connected to China - the fastest growing market in the world - competes directly with global LNG supplies. For Russia, the rise of natural gas availability on a global basis - in the form of LNG - shakes its foreign relationships and policies to the core. In loosening the once-tight relationship between buyers and sellers, the rise of spot LNG supplies will favor consumers and energy security, and foster the development of longer-term contracting.14 Global LNG Demand Could Outpace Supply By our reckoning, some 62% of additional global gas demand of 160 Bcf/d will be covered by rising domestic production, 12% by rising trans-national pipeline capacity, and the remaining 26% by LNG imports.15 Longer-term, we expect LNG and natural gas demand to keep rising as industry demand expands and major coal consumers build up their natural gas and renewables usage. As a result, LNG consumption will increase at a rate of ~ 3% p.a. until 2040, as overall gas demand grows ~ 1.7%.16 Key demand-side developments: Table 2Natgas Emits Less CO2
U.S. Set To Disrupt Global LNG Market
U.S. Set To Disrupt Global LNG Market
China's environmental reforms, supply-side industrial policies and continued economic growth will be the engine of global natural gas and LNG growth in the next decade. The Middle Kingdom's natural gas demand grew 15% to 23 Bcf/d in 2017, of which 54% came from additional LNG. This short-term growth surge required spot and short-term LNG imports, which pushed up North Asian LNG spot prices. Despite our expectation that China will continue leading global LNG growth, we believe 2017 to be an outlier. Two factors contributed to the rise in spot prices: To tackle its massive pollution without significantly altering economic development and growth, China's environmental policies favor natural gas as a bridge to a low-carbon economy, since natgas contains half the carbon content of coal (Table 2). China's supply-side reforms and winter capacity cut led to a spike in spot LNG demand, which had to be covered in global LNG markets. China has an extremely low level of storage to deal with seasonal natgas consumption fluctuations; this forces the country to rely on spot LNG to meet short-term peaks in gas demand (Chart 11). Chart 11China's Minimal Natgas Storage Forces It To Rely On Spot Markets
U.S. Set To Disrupt Global LNG Market
U.S. Set To Disrupt Global LNG Market
While these factors still dominate Chinese markets, new Russian pipeline capacity is expected to start delivering gas in 2019, the ~ 247 bcf of additional domestic storage capacity and the rise in spot LNG supply will mitigate the effect. In addition, China is limited in its regasification capacity. Data re projects under construction and demand forecasts indicate the average utilization would rise to ~ 90% in 2020. Winter usage would push this to ~ 100% rapidly, constraining its ability to meet winter demand with spot LNG. As a result, we expect Asian spot LNG prices to rise above contracted oil-indexed prices next winter, but less so in 2020 and 2021. Longer term, China's gas consumption is expected to grow 4.6% p.a., outpacing the 4.0% p.a. domestic production growth. Some 23% of the gap will come from Russian and Turkmenistan pipeline imports. Europe's supply-gap rose in the past 3 years, and is expected to continue to widen. Unlike the rest of the world, this gap is growing because of supply depletion instead of strong demand growth. In fact, demand is expected to remain flat, based on the IEA's forecast of Europe's long-term growth. On the other hand, total European gas supply has decreased by 16% since 2010, and is expected to continue decreasing at a similar pace, reaching 21 Bcf/d in 2023 from 25 Bcf/d in 2017. These declines in European natgas supply are due to: The phase-out by 2030 of Netherlands' Groningen field. Continued concerns about the impact of natural gas production on earthquakes in nearby communities pushed the Dutch government to adopt, in March 2018, a plan to gradually stop gas extraction at the Groningen field. Production has been decreasing since 2013 and is expected to decrease by around three quarters between now and end-2023. U.K. natural gas production will decrease by 5% p.a. due to the lack of capex and the large number of fields reaching a mature state. Stagnation in Norway's gas production following its record production level in 2017. Europe's regasification capacity has considerable slack, which will allow it to expand its import volumes. Europe currently has 23 Bcf/d regas capacity, with a very low 27% utilization in 2017. This means it has ~16 Bcf/d capacity available. With the U.S. is expected to raise its exports by ~ 6 - 7 Bcf/d in the next couple of years, Europe could potentially absorb the entire U.S. LNG exports if it desires to diversify its source of energy supply. Pressure Builds For Competitive LNG Markets Chart 12Expect More LNG Spot Trading
U.S. Set To Disrupt Global LNG Market
U.S. Set To Disrupt Global LNG Market
The movement toward an integrated global market - similar in structure to current oil markets - will be driven by sharply increased U.S. LNG exports, and more competitive pricing of LNG as a function of gas supply-demand fundamentals. This latter effort likely will find support from Japanese and EU regulators. In addition, U.S. exporters already are using futures-based pricing - using Henry Hub contracts - which provide greater flexibility for producers, consumers and merchants to hedge their risk. Either Asian markets will develop viable regional benchmarks, or the global market will increasingly adopt Henry Hub indexing. Again, this is a typical commodity-market evolution: wheat can be priced for delivery anywhere on the planet using Chicago Board of Trade indexing. Asia lacks an integrated pipeline network. Market-based pricing of gas as gas - i.e., based on regional supply-demand gas fundamentals - also has not fully developed. LNG-on-LNG competition is considered a way to promote market-based pricing. Thus, the rise in spot and short-term contracts priced on the basis of natural gas fundamentals in the region already visible in the data likely will continue (Chart 12). In addition, if we see the oil price spike we expect in 1Q19 - driven by the loss of Iranian exports due to U.S. sanctions, continuing losses in Venezuelan exports due to economic collapse, and still-strong global oil demand - LNG priced on gas fundamentals will become even more attractive.17 LNG consumers' exposure to oil prices - via oil-indexed supply contracts - is a disadvantage to consumers with super-abundant natural gas supplies (Chart 13).18 That said, the U.S. export capacity remains limited, thus it cannot completely substitute for the global trade being done basis oil-indexed LNG contracts. Still, higher oil prices will incentivize a shift to contracts with prices determined by natgas fundamentals, which favors continued growth in U.S. exports. If anything, it will push for a faster-than-expected expansion of U.S. LNG export capacity. Chart 13LNG Buyers Will Resist Oil-Indexed Exposure
BCA Ensemble Forecast Lifts Brent To $95/bbl, As Market Tightens
BCA Ensemble Forecast Lifts Brent To $95/bbl, As Market Tightens
Bottom Line: Growth in global LNG markets likely will be faster than expected, as the U.S. develops its export capacity and continues to offer futures-based pricing. This will further reduce the attractiveness of rigid oil-indexed contracts. Gas producers and LNG merchants with access to U.S. shale-gas supplies, possessing trading and risk-management capabilities that allow them to offer flexible contracts globally, are favored in this quickly evolving market. Hugo Bélanger, Senior Analyst HugoB@bcaresearch.com Pavel Bilyk, Research Associate pavelb@bcaresearch.com Robert P. Ryan, Senior Vice President Commodity & Energy Strategy rryan@bcaresearch.com 1 The LNG cost structure is complex. A recent paper from the Oxford Institute For Energy Studies estimates U.S. breakeven costs for new LNG projects are roughly $7/MMBtu delivered, or ~ $4/MMBtu over current Henry Hub, LA, spot prices. This includes liquefaction costs, and transportation costs from the U.S. Gulf to Asia of ~ $1.50/MMBtu, and ~ $0.70/MMBtu from the U.S. Gulf to northwest Europe. Regasification charges and entry fees likely add ~ $0.70 to $1/MMBtu. Please see "The LNG Shipping Forecast: costs rebounding, outlook uncertain," published by the Oxford Institute For Energy Studies, March 2018. Transport costs are variable, and are only one part of the LNG pricing equation. The benefits of diversifying supplies cannot be overlooked, nor can the benefit of gas-on-gas pricing in a high-priced crude oil market. See also see "US powerhouse in the making," published June 14, 2018, by petroleum-economist.com. 2 Please see the International Energy Agency's Gas 2018 report published in March, particularly the discussion of supply beginning on p. 67. 3 Please see "The Price of Permian gas Pipeline Limits," by Stephen Rassenfoss, in the Journal of Petroleum Technology, published July 19, 2018. 4 Take-or-cancel contracts employ option-like features - e.g., cancelation payments that function as an option premium - that give buyer and seller flexibility in cancelling a contract or delivery in a manner that allows the seller to cover fixed costs, not unlike a tolling contact. This is possible because of the hedging latitude provided by the NYMEX natural gas futures market, which has Henry Hub, LA, as its delivery point. Please see "The Shift Away from Take-or-Pay Contracts in LNG," published by the Atlanta-based law firm King & Spalding on its Energy Law Exchange blog September 13, 2017. 5 Platts' JKM spot assessment for November was $11.35/MMBtu, which was down 6% from October assessments. Please see "Platts JKM: Asia November LNG spot prices fall on thin demand," published by S&P Global Platts September 21, 2018. The NYMEX JKM forward curve peaks at $13.50/MMBtu for January 2019 deliveries, and backwardates thereafter. 6 Big LNG consumers' antitrust regulators are increasing pressure on overly restrictive contracts, which could open these markets to further competition over the next three years. Japan's Fair Trade Commission (JFTC) in 2017 concluded a review of term LNG contracts, which raised the possibility heretofore standard term contract features - e.g., limits on destinations and diversions, and take-or-pay provisions - could run counter to its antimonopoly laws. Japan is the largest importer of LNG in the world, taking ~ 11 Bcf/d. Meanwhile, in June of this year, the European Commission opened an investigation into long-term LNG contracts between its member states and Qatar Petroleum. Akin Gump Strauss Hauer & Feld, the Washington, D.C., law firm, expects a ruling on destination and profit-sharing clauses that severely limit re-trading of LNG by purchasers. Akin Gump expects a ruling in the course of the next 3 years. While Japan's FTC did not specify remedies, it is possible buyers gain rights to re-sell and re-direct cargoes, following these reviews. This would make markets more competitive, although indexing the price of LNG to oil-based formulas likely will hinder this process. Please see "Revisiting LNG Resale Restrictions - Implications of Recent EU Decisions," published on the firm's website August 2, 2018. 7 Natural gas demand grew by 16% since 2010, according to the BP 2018 Statistical Review of World Energy, and is expected to grow by a cumulative 47% (1.6% p.a.) by 2040. 8 Many idiosyncratic factors helped Chinese LNG imports reach such an exceptional growth rate, mostly weather-related: China's environmental policy is resulting in widespread substitution of coal for natural gas for space-heating purposes, which, in colder-than-expected winters, results in surging demand. We do not believe this will be a long-term seasonal influence: Physical facilities are being built out to accommodate higher supply and demand. 9 World liquefaction capacity will rise to ~ 61 Bcf/d in 2022, based on our calculations of projects under construction. The bulk of additional capacity will come from the U.S., Australia and Russia. 10 Capacity of 0.6, 0.5 and 1.2 Bcf/d, respectively. 11 Please see U.S. Department of Energy, office of Oil & Natural Gas, LNG Monthly. 12 Like most globally traded commodities, LNG can be traded in USD/MMBtu. The global financial and clearing system already is set up to accommodate commodity transactions denominated in USD, therefore we do not see any impediments to extending it further into the LNG market. 13 Please see Chart 10 footnote for details. 14 We will be exploring the geopolitical dimension of LNG next week in a Special Report written with our colleagues in BCA Research's Geopolitical Strategy. Please see Meghan L. O'Sullivan, Windfall: How the new energy abundance upends global politics and Strengthens America's Power (New York: Simon & Schuster, 2012). 15 From 2017 to 2040, based on BP projections. The bulk of additional pipeline capacity will come from Russia with 12 Bcf/d destined to China and Europe expected to come on line in 2019. 16 Please see the International Energy Agency's GAS 2018 report published in March, BP's BP Statistical Review Of World Energy 2018 report published in June, Shell's Shell LNG Outlook 2018 report published in February, and U.S. the Energy Information Administration's International Energy Outlook 2017 report published in September. 17 Please see our most recent assessment of global oil fundamentals, published September 27, 2018, entitled "Risks From Unplanned Oil-Outage Rising; OPEC 2.0's Spare Capacity Is Suspect," and our updated forecast, "Odds Of Oil-Price Spike In 1h19 rise; 2019 Brent Forecast Lifted $15 To $95/bbl," published September 20, 2018. 18 Asia LNG prices are usually linked to the JCC according to predetermined formulae. However, the exact formula remains opaque and varies with each contract. Based on our calculations, we concluded that since 2010, the average formula uses a slope of ~14% on JCC prices lagged 4 months, with very low s-curve components and a constant. Investment Views and Themes Recommendations Strategic Recommendations Tactical Trades Commodity Prices and Plays Reference Table
U.S. Set To Disrupt Global LNG Market
U.S. Set To Disrupt Global LNG Market
Trades Closed in 2018 Summary of Trades Closed in 2017
U.S. Set To Disrupt Global LNG Market
U.S. Set To Disrupt Global LNG Market