Emerging Markets
Recent changes to the GICS structure will largely impact three sectors in the MSCI China Index, which is the main investable equity benchmark for China: information technology, consumer discretionary, and telecommunication services: The telecommunication…

Highlights We have deciphered global trade linkages to determine which countries are most at risk from a slowdown in EM/China imports. Our analysis takes into account not only the destinations of shipments but also the types of goods. Peru, Chile, Korea, Malaysia and Thailand are the most vulnerable to a slowdown in industrial sectors in EM and China. The least vulnerable emerging economies to this theme are Mexico, Turkey, Colombia, India and Russia. Feature The growth desynchronization1 currently taking place between developing and advanced economies warrants a detailed analysis of trade flows by countries as well as types of goods to assess the vulnerability of various economies to the global trade slowdown. This report's objective is to reveal which countries are most vulnerable to a slowdown in domestic demand in emerging markets, including China. Our main macro theme remains a considerable slowdown in EM/China capital spending, and a moderate slowdown in their consumer spending. We used these macro assumptions to produce a vulnerability ranking for both developing and developed countries. Why Do China And EM Matter? Annual imports by emerging markets including China stand at a combined $7 trillion. This overshadows both U.S. and EU imports, which collectively stand at $4.6 trillion, and underscores the importance of EM and China in global trade (Chart I-1). Chinese imports excluding processing trade - inputs that are imported, then processed and re-exported - make up $1.6 trillion, i.e., constituting 23% of the $7 trillion total of EM plus China imports. Furthermore, the most vulnerable part of the EM/Chinese economies are capital expenditures. The latter represent a significant portion of the global economy (Chart I-2). Aggregate investment expenditures in developing countries including China are as large as those of the U.S. and EU together. China itself accounts for half of EM investment expenditures. Moreover, capital spending is the largest component of the Chinese economy, constituting 42% of GDP. By comparison, Chinese exports to the U.S. and EU together account for only 7% of GDP. Chinese shipments to the U.S. constitute a mere 3.6% of mainland GDP (Chart I-3). Chart I-1EM/China Imports Are Much Larger ##br##Than U.S.'s And EU's Combined
EM/China Imports Are Much Larger Than U.S.'s And EU's Combined
EM/China Imports Are Much Larger Than U.S.'s And EU's Combined
Chart I-2EM/China Capex Is As Large ##br##As U.S.'s And EU's Combined
EM/China Capex Is As Large As U.S.'s And EU's Combined
EM/China Capex Is As Large As U.S.'s And EU's Combined
Chart I-3Structure Of Chinese##br## Economy
Structure Of Chinese Economy
Structure Of Chinese Economy
In turn, Chinese imports are much more leveraged to the country's capital spending than to household expenditures. Table I-1 shows that imports of consumer goods excluding autos account for a mere 15% of total Chinese foreign goods intake. Table I-1Import Composition Of Chinese Imports
Deciphering Global Trade Linkages
Deciphering Global Trade Linkages
With construction and infrastructure spending being a substantial part of mainland capital expenditures, China's investment cycle is very sensitive to the money/credit cycle. This is because no construction or infrastructure investment can be undertaken without credit (loans, bonds and other types of financing). Therefore, China's credit cycle - which drives its domestic capex cycle - is a key predictor of Chinese imports and many commodity prices (Chart I-4). Despite the latest liquidity easing in China, the cumulative effect of previous liquidity tightening as well as the ongoing regulatory clampdown on the financial system are still working their way through the banking and shadow banking systems. Our assessment is that it will take some time before the cumulative effect from the recent liquidity easing takes hold and helps growth recover. China accounts for a significant portion of total EM exports (Chart I-5). Shipments to China constitute 18% of emerging Asia's and 22% of South America's total exports. As the mainland's capex cycle and imports continue to decelerate, EM ex-China exports will slump. This will not only generate a negative income shock in EM economies but will also result in currency depreciation, which will push up local interest rates and tighten banking system liquidity (Chart I-6). Overall, a major downturn in the EM ex-China capex cycle and a moderate slowdown in household consumption will ensue. Chart I-4Chinese Imports ##br##To Decelerate
Chinese Imports To Decelerate
Chinese Imports To Decelerate
Chart I-5Importance China For Emerging Asia ##br##And South America
Importance Of China For Emerging Asia And South America
Importance Of China For Emerging Asia And South America
Chart I-6EM Ex-China: Currency Depreciation##br## = Higher Local Rates
EM Ex-China: Currency Depreciation = Higher Local Rates
EM Ex-China: Currency Depreciation = Higher Local Rates
How are different countries exposed to these forces? Methodology The global marketplace for goods is a complex system. Modern trade is dominated by the exchange of intermediate goods within different supply chains.2 Furthermore, trade flows between countries are dependent on the types of goods that are traded (industrial versus consumption goods, for instance). Our objective is to compute each country's exposure to China and the rest of the EM industrial sectors that are at the epicenter of a slowdown, as we elaborated above. We have developed the following methodology, summing up the following three parameters3 for each major economy in the world: 1) Exports to China that are used for industrial purposes (Table I-2). Table I-2Vulnerability Ranking Of Exports To China
Deciphering Global Trade Linkages
Deciphering Global Trade Linkages
In order to adjust for the sensitivity a certain export has to China's industrial sector, we assigned three coefficients to them: 0, 0.5 and 1. Agricultural commodities and non-durable consumer goods are assigned a coefficient of 0, and are therefore omitted from this aggregation. The basis for this is that agricultural goods are not sensitive to the industrial sector, and we do not expect a slump in China's consumption of non-durable goods. A coefficient of 0.5 is assigned to industrial fuels and semi-durable goods. This entails a moderate slowdown in these imports by China. Our rationale is that demand for industrial fuels is somewhat sensitive to the industrial sector, but not significantly as they are also consumed by the consumer sector. Industrial metals, capital goods and durable consumer goods are assigned a coefficient of 1, meaning maximum vulnerability. The former two are directly tied to the industrial sector, (construction and infrastructure, in particular) while the latter one will suffer as discretionary big-ticket item spending will weaken in the wake of a potential decline in financial assets and real estate values. We also have made an adjustment to account for goods that are exported to China and then re-exported to developed markets for final consumption. We assume these goods are not vulnerable, as we are not negative on U.S. and EU final domestic demand. Based on our estimates, around 30% of intermediate manufacturing goods shipments to China from Japan, Korea, Malaysia, the Philippines and Thailand are actually re-exported from China to developed markets for final consumption. We therefore removed this amount from the aggregation to properly reflect the vulnerable portion of their exports. 2) Exports to EM ex-China that are used for industrial purposes (Table I-3). Table I-3Vulnerability Ranking Of Exports To EM Ex-China
Deciphering Global Trade Linkages
Deciphering Global Trade Linkages
In order to adjust for the sensitivity of certain exports to the EM ex-China industrial sector, we assigned the same coefficients as above. The reason is that agricultural goods and non-durable consumer goods (a coefficient of zero) will not be sensitive to a slowdown in EM ex-China industrial sectors. Industrial metals, capital goods and durable goods, on the other hand, will be very vulnerable (a coefficient of one). Industrial fuels and semi-durable goods will be modestly affected (a coefficient of 0.5). 3) Exports to complex economies4 (i.e. Germany, Japan, Korea, Sweden and Switzerland) that are susceptible of being re-exported to emerging markets. We estimate that 30% of intermediate exports that are shipped to these very advanced economies end up being re-exported to EM and China. So, 30% of any country's intermediate goods exports to the complex economies is considered vulnerable. Vulnerability Ranking Chart I-7 sums up the three variables introduced above - total amount of vulnerable exports - and ranks countries based on their exports that are susceptible to an EM/China industrial slowdown as a share of total imports. Chart I-7Vulnerable Exports To China And EM As A Share Of Total Exports
Deciphering Global Trade Linkages
Deciphering Global Trade Linkages
Chart I-8 lists countries based on the size of their vulnerable exports as a share of their GDP from highest to lowest. Chart I-8Vulnerable Exports To China And EM As A Share Of GDP
Deciphering Global Trade Linkages
Deciphering Global Trade Linkages
Chart I-9 presents our ultimate trade vulnerability ranking which combines both parameters - vulnerable exports as a share of total exports and GDP. Peru, Chile, Korea, Malaysia and Thailand are the most vulnerable to a slowdown in industrial sectors in EM and China. The least vulnerable emerging economies are Mexico, Turkey, Colombia, India and Russia. Chart I-9Overall Vulnerability Assessment
Deciphering Global Trade Linkages
Deciphering Global Trade Linkages
These macro themes and rankings constitute an important but not sole part of our country view formation. There are many other factors - both global and domestic - that enter the formulation of our country views. That is why this ranking is not entirely consistent with our country recommendations. The lists of our overweights and underweights across EM equities, fixed-income, credit and currencies as well as specific trades that we recommend can be found on pages 9-10. Stephan Gabillard, Senior Analyst stephang@bcaresearch.com 1 Pease see Emerging Markets Strategy Weekly Report "Desynchronization Compels Currency Adjustments", dated September 20, 2018, available at ems.bcaresearch.com 2https://unctad.org/en/pages/PublicationWebflyer.aspx?publicationid=2109 3 All values are measured in US$ and are measured as % of total exports. The data is from the United Nations and dated as of December 31, 2017. 4https://www.media.mit.edu/projects/oec-new/overview/ Equity Recommendations Fixed-Income, Credit And Currency Recommendations
Highlights The presidential race between Haddad and Bolsorano will be very tight. At present, we put slightly higher odds on Haddad winning by a small margin in the second round. A Haddad victory would lead to a continuation of stress in financial markets. The prospects of Lula's release and populist policies will lead to further downside in Brazilian assets Bolsorano's victory in the second round will likely lead to a tradeable rally in Brazil's financial markets. For now continue underweighting Brazilian equities and credit and continue shorting the BRL. We will consider whether to upgrade Brazil after the outcome of the elections becomes clearer. Feature Chart 1Potential Roadmaps For Equities Relative Performance
Brazil: Can The Election Change Anything?
Brazil: Can The Election Change Anything?
Brazil's upcoming general elections will be among the closest in recent history. Current polls show a tight race between right-wing candidate Jair Bolsonaro and left-wing candidate Fernando Haddad. A victory by Bolsonaro may spark a short-term rally in Brazilian assets on the expectation of structural reforms. On the other hand, a Haddad victory and return of the Worker's Party to power would be quite negative for financial markets. The upside of this election, regardless of outcome, is that a new government with a new mandate will be formed, restoring a semblance of legitimacy for the first time since the impeachment of President Dilma Rousseff in 2016. The downside is that this mandate will be weak, the odds of a "pro-market" government are uncertain, and Congress will be fragmented. Much-needed yet painful social security reforms will face an uphill battle, with potentially another market riot needed to motivate policymakers and legislators to enact social security reforms. On the macroeconomic front, Brazil does not have a lot of room and time for maneuver. Without drastic measures to cut the budget deficit or boost nominal GDP, public debt will most likely spiral out of control. Due to the current state of polarization, we cannot have a high conviction view on the election outcome until after the congressional elections on October 7. That said, the macro forces remain negative for EM overall and Brazil in particular. Barring Bolsorano's victory in the second round, there is little reason for Brazilian risk assets to rally (Chart 1). An Anti-Establishment Victory? Media attention has centered on Bolsonaro of the Social Liberal Party. He is the frontrunner in the first round of the race, despite his controversial rhetoric and overt sympathies with Brazil's military dictatorship of the past. In polling for the second round, his considerable lead has shrunk, as he is now neck and neck with the other contenders (Chart 2). Bolsonaro is a serious candidate not because of any overarching, international "Trumpian" narrative, but because Brazil itself is ripe for an anti-establishment electoral outcome: With Lula out of the race, the combined "right-wing" and "left-wing" vote is close in the first round (Chart 3). Chart 2Second-Round Polls Very Tight
Brazil: Can The Election Change Anything?
Brazil: Can The Election Change Anything?
Chart 3A Tight Race
Brazil: Can The Election Change Anything?
Brazil: Can The Election Change Anything?
The country is still in the throes of a political crisis and a historic recession (Chart 4). The major political parties have been discredited. Years of slow economic growth have resulted in extremely low levels of public trust in government (Chart 5). Chart 4Brazil In The Wake Of A Historic Recession
Brazil: Can The Election Change Anything?
Brazil: Can The Election Change Anything?
Chart 5Low Growth Countries Suffer From Lack Of Trust In Their Government
Brazil: Can The Election Change Anything?
Brazil: Can The Election Change Anything?
This is prompting voters to seek a "change in direction" and/or a "protest vote," from which Bolsonaro is apparently benefiting. There is even a sizable audience for Bolsonaro's authoritarianism and nostalgia for military rule. Brazilians are disillusioned with democracy - with 67% of respondents in a Pew Research poll saying they are "not satisfied" with democracy, compared to a global median of 52%.1 Almost a third of educated Brazilians favor military rule, and that number is as high as 45% among the uneducated (Chart 6).2 Bolsonaro's net approval is less negative than other candidates. In fact, only former Presidents Lula and Rousseff have higher net approval (Chart 7). This is a serious risk to Bolsonaro's likeliest rivals, Fernando Haddad of the Worker's Party and Ciro Gomes of the Democratic Labor Party. Bolsonaro's stabbing at a rally on September 6 has not taken him out of the race. His social media support has become an important tool to reach out to his fan base. Chart 6Brazilian Voters Harbor Some Authoritarian Tendencies
Brazil: Can The Election Change Anything?
Brazil: Can The Election Change Anything?
Chart 7Net Approvals Advantage Bolsonaro
Brazil: Can The Election Change Anything?
Brazil: Can The Election Change Anything?
However, there are two key reasons why Bolsonaro is not the favorite to win the election: First, Brazil's two-round electoral system works against Bolsonaro because it enables left-leaning voters to vote strategically in favor of the "least bad option," i.e. the available left-of-center candidate, in the second round. Thus while polling shows Bolsonaro very close to each of his potential opponents in the second round, his final opponent will receive a boost that will not be fully accounted for until after the first round eliminates other left-wing contenders. Recent polls suggest that Haddad stands to benefit much more than Bolsonaro from the "migration" of votes after the first round, as left-wing supporters team up against Bolsonaro in the second round (Table 1). Second, with Lula disqualified from the race, Lula supporters are now in the process of switching to support Haddad. Lula has carried a high approval rating of around 35%-40% for over a year, well above all other candidates. In our "poll of polls" (average of various polls) Haddad has risen rapidly in the one month since Lula's disqualification became clear, so that he is now at equal odds with Bolsonaro (see Chart 2 above). A few polls even suggest Haddad is ahead of Bolsonaro in the second round (Chart 8).3 Table 1Second Round Migration##br## Polls Advantage Haddad
Brazil: Can The Election Change Anything?
Brazil: Can The Election Change Anything?
Chart 8Haddad Is Ahead##br## In These Polls
Brazil: Can The Election Change Anything?
Brazil: Can The Election Change Anything?
To elaborate on this last point: First, about 59% of Lula's supporters say they will shift to Haddad (Chart 9), which should be enough to position him as one of the top two contenders in the first round of voting. Only 4% of Lula supporters will shift to right-of-center candidate Alckmin- a share that is overpowered by the 71% of the Lula vote that will go to left-leaning candidates. Second, the number of undecided and "blank" Lula voters is high at 18%. These voters - if they vote - will mostly go to Haddad, and then Gomes. From the above we can conclude that Haddad will face Bolsonaro in the second round runoff. Because of strategic voting, Haddad will be favored to win the Presidency. A major risk to the left-wing candidate in the second round is that as many as 18% of Lula voters may stay home and not vote. This would mean that Haddad could lose the final vote due to low turnout.4 Overall voter turnout has been falling slightly since 2006 (from 83.3% to 80.7% in 2014) and the disillusionment of voters could result in still lower turnout in 2018. This would favor Bolsonaro, whose supporters are the most likely to vote, whereas Haddad's are the least likely, according to surveys. The profile of the most likely voters favors Bolsonaro (Table 2).5 Chart 9Lula's Migration Vote
Brazil: Can The Election Change Anything?
Brazil: Can The Election Change Anything?
Table 2Voter Profile Of Each Candidate
Brazil: Can The Election Change Anything?
Brazil: Can The Election Change Anything?
As a consequence, we give Bolsonaro 40%-50% odds of winning the presidency, with the possibility of downgrading his probability to a flat 40% if the rise in Haddad's polling continues at the current pace. Strategic voting imposes a handicap on Bolsonaro, making it hard for him to increase his odds above 50%. The lower net approval for Haddad and Gomes, and the risk that Lula voters will fail to transfer in full force to Haddad, suggests that Bolsonaro has a fair chance of winning the second round. Elections are a Bayesian process and we will update our probabilities as more information comes in. In particular, it is important to see if Haddad exceeds expectations in the October 7 first round. Bottom Line: Given strategic voting in the second round and the momentum behind Haddad, the odds of a left-wing victory in the Brazilian election are 50%-60%. However, this is a low-conviction view. Bolsonaro's odds of winning are closer to 40%-50%, particularly if Lula voters stay home. The New Government's Mandate Will Be Weak No matter who wins, there will be at least one positive takeaway for Brazilian risk assets: a new government will be elected with a fresh mandate to lead the country. The Brazilian state has suffered from a crisis of legitimacy over the past few years. A countrywide anti-corruption campaign and economic depression has led to a general loss of confidence. The latter was further exacerbated by the impeachment of President Rousseff and paralysis of the interim government of Michel Temer. Hence this election will clear the air and give a new government the chance to tackle the country's economic and political problems. However, this clearly positive factor will be overwhelmed by negative factors as the election unfolds and in the aftermath: No first round winner: As outlined above, none of the candidates are likely to win a simple majority of the vote in the first round on October 7. This has been the norm in recent elections, but it precludes the possibility that the current crisis will be matched by a leader with a strong personal mandate, like Cardoso in the 1990s. A close election may lead to contested results: The current second-round polling suggests the outcome will be close. The losing side may challenge the results, a controversy that could cause significant political uncertainty for weeks or months. Bolsonaro has already suggested that he can only lose if the Worker's Party rigs the election. Congress will be fractured: Brazil's Congress is always fractious; with numerous parties and coalitions cobbled together by presidents whose own party has a relatively small share of seats (Chart 10). The upcoming president may even have a weaker congressional base than usual. The erstwhile dominant parties, the PDMB and the PSDB, are less popular than they once were and have put forward lackluster presidential candidates, suggesting they will not win large numbers of seats. The Worker's Party, with a large support base in recent decades, was at the epicenter of the impeachment crisis and suffered huge losses in the municipal elections of 2016, also suggesting it will not win as many seats.6 Meanwhile Bolsonaro's Social Liberal Party is starting from a low base (it currently has only eight out of 513 seats in the lower house and none in the senate). Hence, no party is in a position to sweep Congress, or even come close to a majority, ensuring high diffusion of power, horse-trading, and unstable, ad hoc coalitions. Such coalitions have been a hallmark of Brazilian politics and may even be more unstable this time around. Chart 10ABrazil's Parliament Is Fractious
Brazil: Can The Election Change Anything?
Brazil: Can The Election Change Anything?
Chart 10BBrazil's Parliament Is Fractious
Brazil: Can The Election Change Anything?
Brazil: Can The Election Change Anything?
No more pork: Given the focus on fiscal austerity and corruption, the next president of Brazil will struggle to command as much "pork-barrel spending" - politically-motivated fiscal handouts to individual congress members - to grease the wheels of politics. President Lula and President Cardoso both relied on pork to ensure passage of key legislation in the 1990s and early 2000s. Polarization: Polarization will remain high as a result of the economic crisis. If Haddad wins, we expect that he will pardon President Lula, despite his assertions to the contrary, and create ill-will among the roughly 52% of the population that views Lula as corrupt. If Bolsonaro manages a victory, he will face intense opposition and resistance from civil society and possibly a left-of-center Congress. Historically, a governing coalition with a majority of seats eventually emerges from Brazil's fragmented Congress. However, periods of political crisis - and transitions from one leading party to the next - often require more time to form such coalitions. It took Lula two years, from 2002-04, to form a majority coalition during his first term in office, according to research by Taeko Hiroi of the University of Texas at El Paso (Chart 11). Chart 11Historical Profile Of Governing Coalitions
Brazil: Can The Election Change Anything?
Brazil: Can The Election Change Anything?
Bottom Line: The formation of a new government with a new mandate is positive but it will not bestow as much political capital as the market expects: in all likelihood the new president's mandate will be weak and Congress will, at least initially, be divided. Will Reforms Be Reactive Or Proactive? What are the likely market reactions from the different election scenarios? And will policymakers be proactive or reactive in their pursuit of any structural reforms? While we cannot rule out a knee-jerk rally if Bolsonaro wins, the length and breadth of the market reaction will depend on the government's political capital (e.g. popular margin of victory and strength in Congress) and willingness to be proactive about structural reforms. On the left, both Haddad and Gomes are "populist," left-leaning, candidates whose victory would exacerbate the selloff. Haddad's vice-presidential candidate and coalition partner is Manuela D'Avila, from the Brazilian Communist Party (PCdoB). Their platform states that the solution to low economic growth is expansionary fiscal and monetary policies, such as a removal of the cap on government spending and a reduction in interest rates. Meanwhile the Gomes campaign has denied that Brazil has a pension deficit.7 Neither Haddad nor Gomes faces the IMF-imposed constraints that Lula faced when he took power in 2002. The market pressure surrounding his election in 2002 and the IMF proposals at that time essentially forced Lula to continue his predecessor Cardoso's reforms. Compared to 2002-03, today's profile of Brazilian share prices suggests that more downside is warranted (see Chart 1, page 1). Hence, we believe more market turmoil would be necessary to force Haddad or Gomes to adopt any difficult and unpopular fiscal reforms. We believe that both could be capable of executing reforms if pressed by the market, but a market riot is needed first. On the other hand, a Bolsonaro victory would likely trigger a meaningful rally on the expectation of pro-market reforms. Bolsonaro's economic advisor Paulo Guedes, a University of Chicago economics PhD holder, is a supply-side reformer who has proposed to privatize state-owned assets, enact tax and pension reforms, and scale back the bureaucracy. Crucially, Bolsonaro's camp wants to use the proceeds from privatization to repurchase public debt and buy time before reforming the pension system. Hence, in the eyes of many investors, Bolsonaro represents a market-friendly candidate despite his tough talk and anti-establishment tendencies. The problem is that Guedes has spent far more time giving interviews to the financial press than campaigning on draconian structural reforms. As such, it is not clear that Bolsonaro's economic team's promises jive with the desires of the median voter in the country. Bolsonaro, meanwhile, will likely be limited in forming a coalition in the Chamber of Deputies.8 The ability to form and maintain alliances in the Chamber of Deputies is a key constraint for any Brazilian president, especially from a smaller party. Obstructionism is common.9 Even large parties with strong alliances have fallen into gridlock, most obviously in attempting structural reforms. In late 1998, for instance, President Cardoso's own PSDB party deprived him of the votes needed to seal a painstakingly negotiated deal with the IMF, which led to a loss of confidence among creditors and a sharp devaluation of the real in January 1999. In short, it will be difficult for the new president to implement reforms at the beginning of his term even though, as noted above, Brazilian presidents tend to cobble together a coalition over time. It should be noted that Bolsonaro's authoritarian tendencies and desire to rewrite the 1988 constitution - a partisan Pandora's Box - could result in a further deterioration of Brazilian governance (Chart 12). This would push up the risk premium on assets over the long run, though in the short run Bolsonaro may be positively received by financial markets. Bottom Line: Bolsonaro would likely want to be a proactive structural reformer, but he would also be constrained at first due to his small party base in Congress and need to form a coalition. In addition, the days of liberally soothing partisan battles with pork-barrel spending are over. Brazil is both fiscally constrained and increasingly sensitive to corruption. Moreover, fiscal austerity would come with a negative hit to growth in the short term. It is not clear whether Bolsonaro will be able to form a Congressional coalition that can push through the painful part of the "J-Curve" of structural reform (Diagram 1). Chart 12Brazilian Governance Set To Fall Further
Brazil: Can The Election Change Anything?
Brazil: Can The Election Change Anything?
Diagram 1The J-Curve Of Structural Reform
Brazil: Can The Election Change Anything?
Brazil: Can The Election Change Anything?
On the other hand, neither Haddad's nor Gomes's platforms are market-friendly. Neither is likely to attempt structural reforms proactively. The market would have to sell off further, as in 2002, to pressure them into such policies. At that point, however, they might ultimately have a better ability to push legislation through Congress than Bolsonaro due to their ability to form larger coalitions amongst leftist parties. Either way Brazilian risk assets have further downside from where they stand today. A market riot is likely necessary to galvanize the population's support for painful structural reforms. That support currently does not exist. What Is At Stake? Chart 13The Achilles Heel Of The Brazilian Economy
Brazil: Can The Election Change Anything?
Brazil: Can The Election Change Anything?
Brazil's public debt is out of control. Weak nominal GDP growth and high borrowing costs are increasing the public debt burden. This debt stems in large part from a sizable social security deficit that will continue expanding without the above-mentioned reforms (Chart 13). Thus, the next president will face a dilemma: implement austerity to satisfy creditors or increase spending to satisfy voters. A close look at voter preferences suggests that top priorities are improving health services and raising the minimum wage, while pension reform is at the bottom of the list (Chart 14). This reinforces our view that the left-of-center candidates are likely to be the closest to the median voter, and that fiscal austerity is not forthcoming. However, voters are also demanding that inflation be controlled, taxes be cut, and jobs be created - all of which could result in support for right-of-center candidates. Two possibilities to stabilize or reduce the debt load are: (1) restoring a primary budget surplus by enacting social security cuts and/or (2) privatizing state assets to raise fiscal revenues. In Europe throughout the early 2000s, peripheral countries with large public debt imbalances ran large primary budget deficits, just as Brazil has been running (Chart 15, top panel). Portugal, Ireland, Italy, Greece, and Spain stabilized their debt-to-GDP ratios by cutting social spending and capping fiscal expenditures (Chart 15, bottom panel). This will prove challenging as Brazil's pension system is one of the most generous in the world, with retirement ages of 54 and 52 for men and women, respectively, and a much lower contribution period relative to other countries. Furthermore, replacement rates for both men and women are 61%, or 10 percentage points above the OECD average and over 15 percentage points above other countries' reformed pension systems.10 Finally, the dependency ratio will continue to increase, as rising life expectancy and a declining working-age population remain structural headwinds for years to come.11 In our conversations with clients, the reality of Brazil's aging demographics usually comes as a complete surprise. Chart 14Brazil's Population Is ##br##Not Open To Fiscal Austerity
Brazil: Can The Election Change Anything?
Brazil: Can The Election Change Anything?
Chart 15Eurozone Debt Crisis Resulted ##br##In Lower Spending And Stable Debt
Brazil: Can The Election Change Anything?
Brazil: Can The Election Change Anything?
Therefore, social security reforms require outright cuts in spending, rather than soft caps on the budget balance. The present soft cap on government expenditures is not adequate to stabilize or reduce government debt levels. Could privatization help stabilize public debt dynamics? The privatization program during the 1990s under the Collor, Franco, and Cardoso governments led to the sale of $91 billion (around R$ 100 billion or 9% of GDP) worth of assets from 107 state-owned enterprises over the course of a decade. Presently, in order to re-balance the primary deficits of R$93 and R$79 billion for 2018 and 2019 respectively, the government would be required to frontload the sale of large state-owned entities, such as Petrobras or Banco do Brasil. This will prove challenging, since the sale of state-owned enterprises requires legislative approval. In fact, over the past two years, under interim President Temer, the government has struggled to sell its assets such as Electrobras. Even assuming that a Brazilian government under Bolsonaro conducts large-scale asset sales, previous privatization programs have failed to yield targeted sums and have required a longer time to implement than originally expected. Overall, privatization is not a feasible option to reduce high debt levels in Brazil in the short run. Bottom Line: Stabilizing or reducing the public debt as a share of GDP will be challenging under the current set of preferences set by voters. Moreover, demographic headwinds and structural constraints embodied in Brazil's two-tier legislative system will slow down the process of privatization and pension reform. The market is forward-looking and will cheer attempts to enact supply-side reforms in the short run, should they emerge, despite long-term uncertainties. The key questions are (1) whether the election produces a proactive Bolsonaro regime or a reactive left-wing regime (2) whether coalition formation - in Bolsonaro's case - or exogenous market pressure - in Haddad's case - are sufficient to initiate reforms in a timely manner in 2019. Amidst a broad EM selloff driven by external factors as well as Brazil's and other EM's internal fundamentals, we expect the markets to be largely disappointed in 2019. The evolution of the political context throughout the year will then determine when and if a buying opportunity emerges. Investment Implications In the late 1990s, faced with high foreign debt levels, a large current account deficit, and weak nominal growth, the Brazilian central bank devalued the real by 66% in January 1999 (Chart 16). This led to a rebound in nominal growth which helped the country relieve itself from built up excesses. In today's context, a weaker currency and lower interest rates are required to boost nominal GDP and contain Brazil's public debt as a share of GDP. There are already signs that the central bank is easing liquidity amid currency depreciation - which stands in contrast of the recent past (Chart 17). More liquidity provisioning by the central bank will cause the real to depreciate further. In light of this, we recommend that investors continue shorting the currency versus the U.S. dollar. Furthermore, due to our expectation of further deceleration in global growth stemming from China and a strong dollar, investors should expect more downside in broader EM and Brazilian share prices in U.S. dollar terms. With respect to the outcome of the elections, investors should continue underweighting Brazilian equities and credit in their respective portfolios for now (Chart 18). Chart 16Brazil Needs A Weaker Currency To##br## Boost Nominal Growth
Brazil: Can The Election Change Anything?
Brazil: Can The Election Change Anything?
Chart 17A New##br## Paradigm Shift?
Brazil: Can The Election Change Anything?
Brazil: Can The Election Change Anything?
Chart 18Sovereign Credit Spreads Will##br## Continue Widening
Brazil: Can The Election Change Anything?
Brazil: Can The Election Change Anything?
We will consider whether an upgrade of Brazil is warranted after electoral outcomes become known. Particularly, the balance of the parties in Congress and the new president's coalition formation options will dictate the relative performance of Brazilian equities and credit over the next 6-12 months. Andrija Vesic, Research Analyst andrijav@bcaresearch.com Matt Gertken, Vice President Geopolitical Strategy mattg@bcaresearch.com 1 Please see, Wike, R. et al., "Globally, Broad Support for Representative and Direct Democracy", October 16th, 2017, available at http://www.pewglobal.org/2017/10/16/many-unhappy-with-current-political-system/ 2 In addition to the Pew Research data cited in Chart 5, please see Dora Saclarides, "Do Brazilians Believe In Democracy?" InoVozes, The Wilson Center, November 21, 2017, available at www.wilsoncenter.org. 3 Please see "Brazil: Vox Populi Poll Gives Haddad Lead In Presidential Race," Telesur, September 13, 2018, available at www.telesurtv.net, & Data Poder 360 poll from September 21st, available at: https://www.poder360.com.br/datapoder360/datapoder360-bolsonaro-tem-26-e-haddad-22-os-2-empatam-no-2o-turno/ 4 Please see, BTG Pactual September 15-16 poll, page 18. The Polls states that 57% of Lula voters would "not vote at all" while 41% would vote for Haddad. While turnout will improve for the second round, this is a risk to Haddad. 5 A poll by Empiricus Research and Parana Pesquisas p56 shows that 89.5% intend to vote (which is unrealistic), and that 95.7% of Bolsonaro voters intend to vote while 91.6% of Haddad voters intend to vote. 6 "The PT lost four of the five state capitals it had run, including Sao Paulo, the country's economic powerhouse where the leftist party was born. The PT lost two-thirds of the municipalities it won in 2012, dropping to 10th place from third in the number of mayors controlled by each party." Please see Anthony Broadle, "Brazil parties linked to corruption punished in local elections," Reuters, October 2, 2016, available at www.reuters.com. 7 Gomes has, however, admitted the need for some adjustments to the retirement age and public sector worker privileges, which suggests that he could be brought to pursue structural reforms under the right circumstances. https://todoscomciro.com/en_us/pnd/ciro-gomes-previdencia-social/ 8 Bolsonaro's legislative experience is also surprisingly thin. As a congressional representative for 27 years, he has only passed two laws, after presenting a total of 171 bills and one amendment to the constitution. Only three of these bills presented were of economic nature. It is unclear whether he has what it takes to galvanize the legislature in pursuit of tricky reforms. 9 Please see BCA Geopolitical Strategy Special Report, "Separating The Signal From The Noise," dated September 10, 2014, available at gps.bcaresearch.com. 10 A replacement rate is the percentage of a worker's pre-retirement income that is paid out by a pension program upon retirement. 11 Ratio measuring number of dependent zero to 14 and over the age of 65 to total working age population
Highlights The risk of unplanned oil-production outages is rising. One or more such events will severely test OPEC 2.0's spare capacity in a supply-constrained market (Chart of the Week).1 As things now stand, OPEC 2.0 spare capacity - if it is available - and a likely U.S. SPR release of 500k b/d in 1Q19 will not cover expected production losses, if markets are hit with another unplanned outage from Libya or Iraq.2 Demand destruction via higher prices will have to balance markets. Oil markets are tightening (Chart 2). Falling supply and stable demand will produce a 1mm b/d physical deficit into 1H19, forcing continued OECD inventory draws (Chart 3). The dominant scenario in our forecast includes a supply shock arising from lost Iranian and Venezuelan exports, which triggers price-induced demand destruction. We raised the odds of Brent prices hitting $100/bbl by 1Q19, and our 2019 forecast to $95/bbl on the back of these factors. Unplanned outages would lift prices higher. Energy: Overweight. The long April, May and June 2019 Brent calls struck at $85/bbl vs short $90/bbl calls we recommended last week are up an average 33.8%, as of Tuesday's close. Base Metals: Neutral. Our foreign-exchange strategists expect the USD to correct further. This will be bullish for copper, which is up ~ 10% since Sept. 11. Precious Metals: Neutral. The USD correction will support gold in the short term. Technically, gold appears to be forming a pennant, which could be short-term bullish. Ags/Softs: Underweight. Corn prices are benefiting from strong exports, according to USDA data. Accumulated exports for the current crop year are up 27% vs last year in the week ending Sept. 13. Chart of the WeekUnplanned Oil-Production Outage Risks Up, OPEC 2.0's Spare Capacity Down
Risks From Unplanned Oil-Outage Rising; OPEC 2.0's Spare Capacity Is Suspect
Risks From Unplanned Oil-Outage Rising; OPEC 2.0's Spare Capacity Is Suspect
Chart 2Physical Oil Deficit Returns##BR##To Oil Market Next Year
Physical Oil Deficit Returns To Oil Market Next Year
Physical Oil Deficit Returns To Oil Market Next Year
Chart 3Fundamentals Support##BR##Strong Prices
Risks From Unplanned Oil-Outage Rising; OPEC 2.0's Spare Capacity Is Suspect
Risks From Unplanned Oil-Outage Rising; OPEC 2.0's Spare Capacity Is Suspect
Feature Oil markets are approaching a moment of truth. OPEC 2.0's spare capacity likely will be put to the test in 1Q19, as Iranian export volumes continue to fall, and other threats to production - Venezuelan losses, and increasing sectarian tension in Iraq and Libya - come to the fore. As the Chart of the Week demonstrates, spare capacity in the traditional OPEC states is low and falling: The U.S. EIA's most recent estimate of OPEC spare capacity is 1.7mm b/d this year and 1.3mm next year, well below the 2.3mm b/d average of 2008 - 2017. For its part, Russia - the other putative leader of OPEC 2.0 - likely only has ~ 200k b/d of spare capacity to ramp. On a relative basis, OPEC spare capacity is even more stretched: This year, the EIA expects it to average 1.7% of global demand. By next year, it is expected to fall to 1.3%, or ~ 1.3mm b/d. This will be lower than the spare capacity reported for 2008 (1.6%), when OPEC (mostly KSA) found itself struggling to meet surging EM demand, and well below the 2.6% average for 2008 - 2017. Spare capacity is very close to levels last seen in 2016, when low prices resulted in supply destruction. In the wake of the oil-price rout of 2014 - 16, capex collapsed as did maintenance spending needed to keep production steady y/y. This can be seen in the relentless decline in OPEC production ex GCC and the stagnation in other states unable to grow output (Chart 4 and Chart 5). Indeed, as prices hit their nadir in 1Q16, sovereign wealth funds (SWFs) in OPEC and non-OPEC states were being liquidated to cover gaping holes in producers' fiscal accounts. This partly explains the growing incidence of unplanned outages, and our contention OPEC spare-capacity claims are highly suspect (Chart of the Week). Chart 4OPEC 2.0's Core Producers Would Be Taxed to Replace Lost Exports
OPEC 2.0's Core Producers Would Be Taxed to Replace Lost Exports
OPEC 2.0's Core Producers Would Be Taxed to Replace Lost Exports
Chart 5Outside Of A Very Few Regions, Oil Production Has Struggled
Outside Of A Very Few Regions, Oil Production Has Struggled
Outside Of A Very Few Regions, Oil Production Has Struggled
U.S. Remains Adamant On Shutting Down Iran's Exports The Trump administration's goal is to reduce Iranian oil exports to zero via the sanctions it will impose beginning November 4 from ~ 2.5mm b/d back in April, when the U.S. sanctions were announced. However, as the EIA data indicates, achieving this goal would leave markets seriously short oil. Indeed, the Washington-based Center for International Strategic Studies (CSIS) noted in late August, "realistically, there is simply not enough readily available spare oil production capacity in the world to replace the loss of all Iranian barrels (some 2.4 mm b/d), coupled with the potential for further reductions in Venezuela, Libya, Nigeria, and elsewhere."3 Our modeling includes 1.25mm b/d of lost Iranian and Venezuelan exports, continued y/y losses in non-core OPEC (Chart 4), constrained U.S. production growth, and stagnate supply growth outside a handful of states able to lift their output (Chart 5). We do not believe OPEC 2.0 spare capacity is sufficient to cover these losses and one or two additional unplanned outages in Iraq or Libya, or anywhere for that matter. In addition, a 500k b/d release of U.S. SPR after the price goes above $90/bbl in 1Q19 will contain the supply shock we expect slightly, but will not completely reverse it. We have long believed KSA's ability to maintain production above 10.5mm b/d for an extended period is suspect, despite its claims it can ramp to its capacity of 12mm b/d.4 We are carrying KSA's current production at 10.4mm b/d in our balances estimates, roughly the level it self-reported to OPEC last month. To be clear, we are not saying KSA's production cannot be increased - perhaps to 10.7mm b/d - but we are dubious it can get to its claimed 12mm b/d capacity, or that it can sustain 10.7mm b/d indefinitely. It is important to note any short-term increase in OPEC 2.0's production will come out of spare capacity available to meet unplanned outages, or deeper-than-expected Venezuelan losses next year. Lastly, unplanned outages in a market already stretched by tighter supply will accelerate the rate of demand destruction via higher prices. This also would accelerate the arrival of a U.S. recession brought about by an oil-price shock, all else equal.5 Iran's Hand Is Strengthening You'd never know it from the declarations of President Trump and U.S. Treasury Secretary Steve Mnuchin - both of whom are adamant in their professed desire to see Iranian oil exports fall to zero - but the U.S. has been attempting to engage Iran in treaty discussions to limit the country's ballistic-missile capabilities and nuclear-development program.6 Not surprisingly, Iranian officials have shown no interest in such discussions. This is a remarkable turn of events, but not unexpected. At some point, it likely became apparent to the Trump administration the global oil markets are on a trajectory for significantly higher prices, as our analysis and forecasts indicate. It also likely is apparent to administration officials that oil prices - and gasoline prices, in particular, which matter most to U.S. voters - will be surging just as the 2020 presidential campaign gets underway next summer. Along with our colleague Marko Papic, who runs BCA's Geopolitical Strategy, we believe that, from a game-theoretic perspective, the approach from the U.S. actually strengthens Iran's hand. Given its history with the previous round of sanctions, and the economic hardships they imposed, the government in Iran likely believes it can ride out 12 to 18 months of renewed sanctions. It is not unrealistic to entertain the possibility Iranian politicians take the bet that sharply higher gasoline prices in the U.S. by 2H19 will give Democrats in U.S. presidential and congressional races - which kick off next summer - a powerful issue with which to campaign against President Trump and the GOP. Bottom Line: There is a non-trivial chance that OPEC 2.0 spare capacity will prove insufficient to cover the losses in Iranian and Venezuelan exports we foresee in the very near term. Should this prove to be the case, the odds that Brent crude oil prices exceed our $95/bbl forecast for next year are high. We believe Iran's political hand could be strengthened, if it rebuffs overtures by the Trump administration to negotiate a treaty to replace the executive agreement with former U.S. president Obama that limited its nuclear program. We recommended getting long Brent call spreads last week to position for the higher prices we are forecasting for next year. Specifically, we recommended getting long April, May and June 2019 Brent calls struck at $85/bbl vs short $90/bbl calls. As of Tuesday's close, these positions were up 33.8% on average vs their opening levels last Thursday. Robert P. Ryan, Senior Vice President Commodity & Energy Strategy rryan@bcaresearch.com Hugo Bélanger, Senior Analyst Commodity & Energy Strategy HugoB@bcaresearch.com 1 Please see "Upside Risks Dominate BCA's Oil Price Forecast," published by BCA Research's Commodity & Energy Strategy October 26, 2017, and "OPEC 2.0 Scrambles To Reassure Markets," published June 28, 2018. Both are available at ces.bcaresearch.com. 2 OPEC 2.0 is the name we coined for the oil-producer coalition led by the Kingdom of Saudi Arabia (KSA) and Russia, which was formed in November 2016, following the price collapse brought on by OPEC's market-share war launched in November 2014. Please see last week's Commodity & Energy Strategy lead article, "Odds Of Oil-Price Spike In 1H19 Rise; 2019 Brent Forecast Lifted $15 To $95/bbl." It is available at ces.bcaresearch.com. In that article we note that, in addition to the highly visible export losses in Iran due to U.S. sanctions and continued deterioration in Venezuelan production, the EIA reduced its estimate of U.S. production growth by 201k b/d in 2019, and the IEA reduced its estimate of Brazilian output this year by 260k b/d. 3 Please see "Whither the Oil Market? Headlines and Tariffs and Bears, Oh My..." published by csis.org August 29, 2018. We are closely following a just-proposed workaround to U.S. sanctions on Iranian oil exports made by the High Representative of the EU, Federica Mogherini, at the UN General Assembly meeting in New York on Tuesday. Ms. Mogherini proposed setting up a special-purpose vehicle that would allow importers in the EU, China and Russia to continue purchasing Iranian oil crude. The SPV would transact in euros, yuan, and roubles, so as to avoid processing transactions through the Society for Worldwide Interbank Financial Telecommunication SWIFT system in Brussels. The SWIFT system is dominated by USD transactions, and the U.S. Treasury has high visibility into transactions made using the system, given USD-denominated transaction like oil purchases and sales must ultimately be cleared through a U.S. bank or intermediary. Iran already takes yuan for its oil, and this mechanism would allow it to purchase goods and services denominated in these currencies. If technical details of the proposed system can be worked out, the SPV could facilitate increased Iranian exports under the U.S. sanctions regime. This would cause us to lower our estimate of lost exports from that country from our baseline assumption of 1.25mm b/d. Please see "Why India Will Struggle to Join Iran's Sanctions Busters," published by bloomberg.com on September 26, 2018. 4 We are not the only ones dubious of KSA's ability to ramp production. Please see "Can Saudi Arabia pump much more oil," published by reuters.com July 1, 2018. 5 In our House view, a recession in the U.S. does not arrive until 2H20. We have argued an oil-supply shock, particularly during a Fed tightening cycle, typically presages a recession in the 6 - 18 months following the shock. Please see Commodity & Energy Strategy lead article, "Odds of Oil-Price Spike In 1H19 Rise; 2019 Brent Forecast Lifted $15 To $95/bbl." It is available at ces.bcaresearch.com. 6 Please see "U.S. seeking to negotiate a treaty with Iran," published September 19, 2018, by reuters.com. Investment Views and Themes Recommendations Strategic Recommendations Tactical Trades Commodity Prices and Plays Reference Table
Risks From Unplanned Oil-Outage Rising; OPEC 2.0's Spare Capacity Is Suspect
Risks From Unplanned Oil-Outage Rising; OPEC 2.0's Spare Capacity Is Suspect
Trades Closed in 2018 Summary of Trades Closed in 2017
Risks From Unplanned Oil-Outage Rising; OPEC 2.0's Spare Capacity Is Suspect
Risks From Unplanned Oil-Outage Rising; OPEC 2.0's Spare Capacity Is Suspect
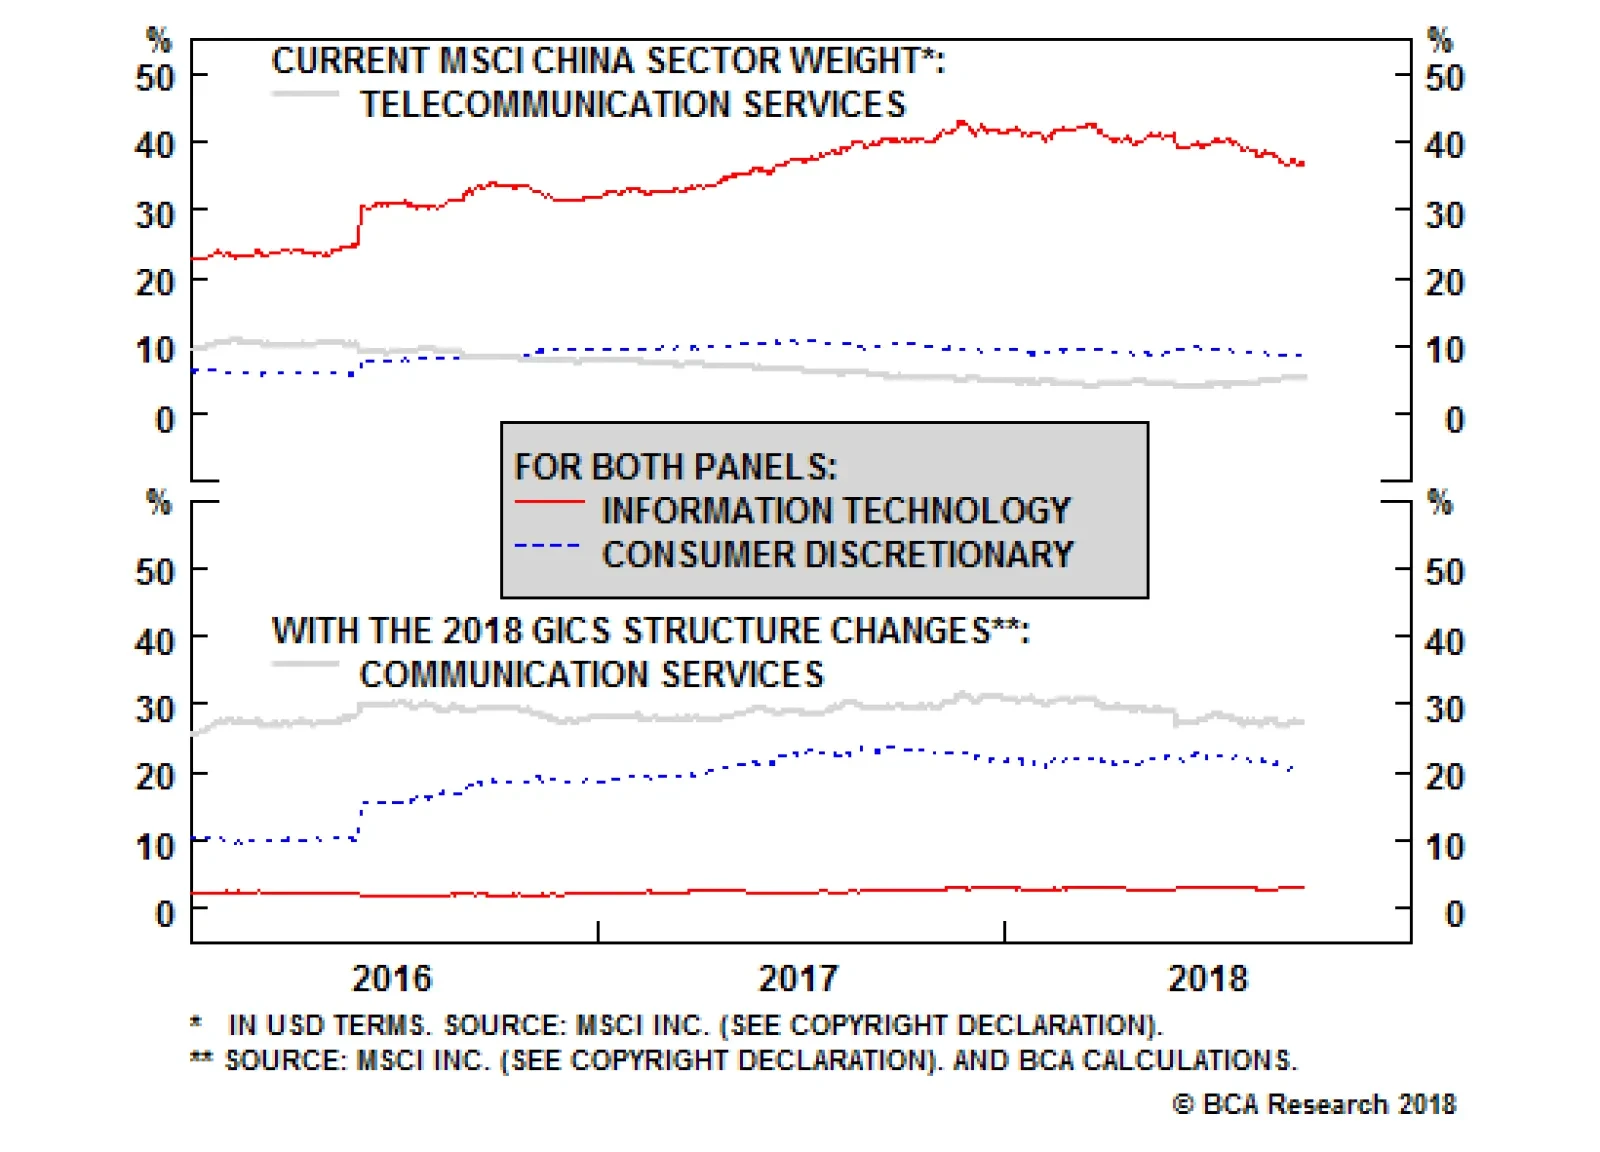
Highlights The upcoming changes to the Global Industry Classification Standard will substantially alter the sector composition of the MSCI China Investable index, by hollowing out the information technology sector (to the benefit of consumer discretionary and the new communication services sector). The new communication services sector will become a market-neutral (but barbelled) sector from the perspective of cyclicality, with high- and low-beta components. The inclusion of Alibaba in the consumer discretionary sector warrants the closure of our most successful trade over the past year: long consumer staples / short discretionary. Feature S&P Dow Jones and MSCI Inc. will be implementing major structural changes to the Global Industry Classification Standard (GICS), effective after the market close on September 28, 2018. The changes are among the most significant since the GICS was launched in 1999, and there are meaningful implications for investors. In this brief special report, we summarize the key changes as they pertain to the Chinese investable equity benchmark, and provide a counterfactual simulation of historical performance had the upcoming changes been in effect over the past three years.1 For the MSCI China index, the main investable equity benchmark, the changes to the GICS structure will largely impact three sectors: information technology, consumer discretionary, and telecommunication services: The telecommunication services sector will be renamed to "communication services", and this new level 1 sector will be much broader in scope. Communication services will include companies that facilitate transformation in the way of communication, entertainment, and information seeking. In addition to the companies currently classified within telecommunication services, communication services will include media stocks formerly in the consumer discretionary sector, including advertising, broadcasting, cable & satellite, publishing, movies & entertainment sub-sectors. In addition, home entertainment software and some internet software & services companies, currently classified under the information technology sector, will also move to communication services. These include prominent stocks like Baidu, Tencent, Sina, and Sohu. The consumer discretionary sector will include online retailers, such as Alibaba, from information technology sector under its internet & direct marketing retail sub-sector. Chart 1 shows that these changes will have a very substantial impact on the sector composition of the MSCI China index. The weight of the information technology sector will drop dramatically from 37% to 3% after the GICS changes occur, because all three of the BAT stocks (Baidu, Alibaba, and Tencent) will move to other sectors. The weight of consumer discretionary is set to rise from 8% to 20%, as the inclusion of Alibaba offsets the removal of media (Alibaba alone will account for 60% of the consumer discretionary sector after the GICS changes). Relative to the current weight of telecommunication services, the new communication services sector weight will be substantially higher, at 27% (versus its 5% current weight). Chart 2 provides both factual and counterfactual perspectives on what relative performance for these three sectors would have looked like since 2016, had the upcoming changes been in effect. The chart shows that the relative performance of consumer discretionary and communication services sector would have been considerably stronger, while the tech sector would have underperformed (in sharp contrast to what has actually occurred). Chart 3 provides some perspective on the cyclicality of China's new communication services sector. The telecommunication services sector is clearly a defensive sector, and has exhibited a beta less than 0.5 over the past year. However, the chart shows that communication services (had it existed), would have basically been a market-neutral sector in terms of market beta because of the offsetting impact of both including high-beta internet software & services companies and low-beta telecommunication services. In effect, the new communication services will become a barbelled sector from the perspective of cyclicality, with high- and low-beta components. Chart 1A Hollowing Out Of The Information Technology Sector
A Hollowing Out Of The Information Technology Sector
A Hollowing Out Of The Information Technology Sector
Chart 2CD And Comm Services Would Have Outperformed Over The Past Three Years
CD And Comm Services Would Have Outperformed Over The Past Three Years
CD And Comm Services Would Have Outperformed Over The Past Three Years
Chart 3Comm Services: A Market-Neutral, Barbelled Sector
Comm Services: A Market-Neutral, Barbelled Sector
Comm Services: A Market-Neutral, Barbelled Sector
Finally, the beta of consumer discretionary sector would have been higher over the past two years in our counterfactual scenario, thanks to the inclusion of Alibaba. Consumer discretionary stocks have fared poorly in response to a trade war with the U.S., but the imminent inclusion of Alibaba in the discretionary sector will substantially alter the character of its future performance. As such, we have decided to close our long MSCI China Consumer Staples / short MSCI China Consumer Discretionary trade at a fantastic return of 47.6%. Qingyun Xu, Senior Analyst qingyunx@bcaresearch.com 1 For China, we proxy the upcoming changes to the GICS structure using a simple set of rules that aims to capture an overwhelming majority (but not all) of the upcoming changes. As such, investors should view our methodology as an approximation, rather than an exact application of the firm-by-firm changes that MSCI will make. Clients who are interested in a similar exercise for the global IMI benchmark should refer to Neeraj Dabake, Craig Feldman. (September, 2018) The New GICS Communication Services Sector. MSCI Research Paper, Retrieved from https://www.msci.com/www/research-paper/the-new-gics-communication/01107886967. Cyclical Investment Stance Equity Sector Recommendations
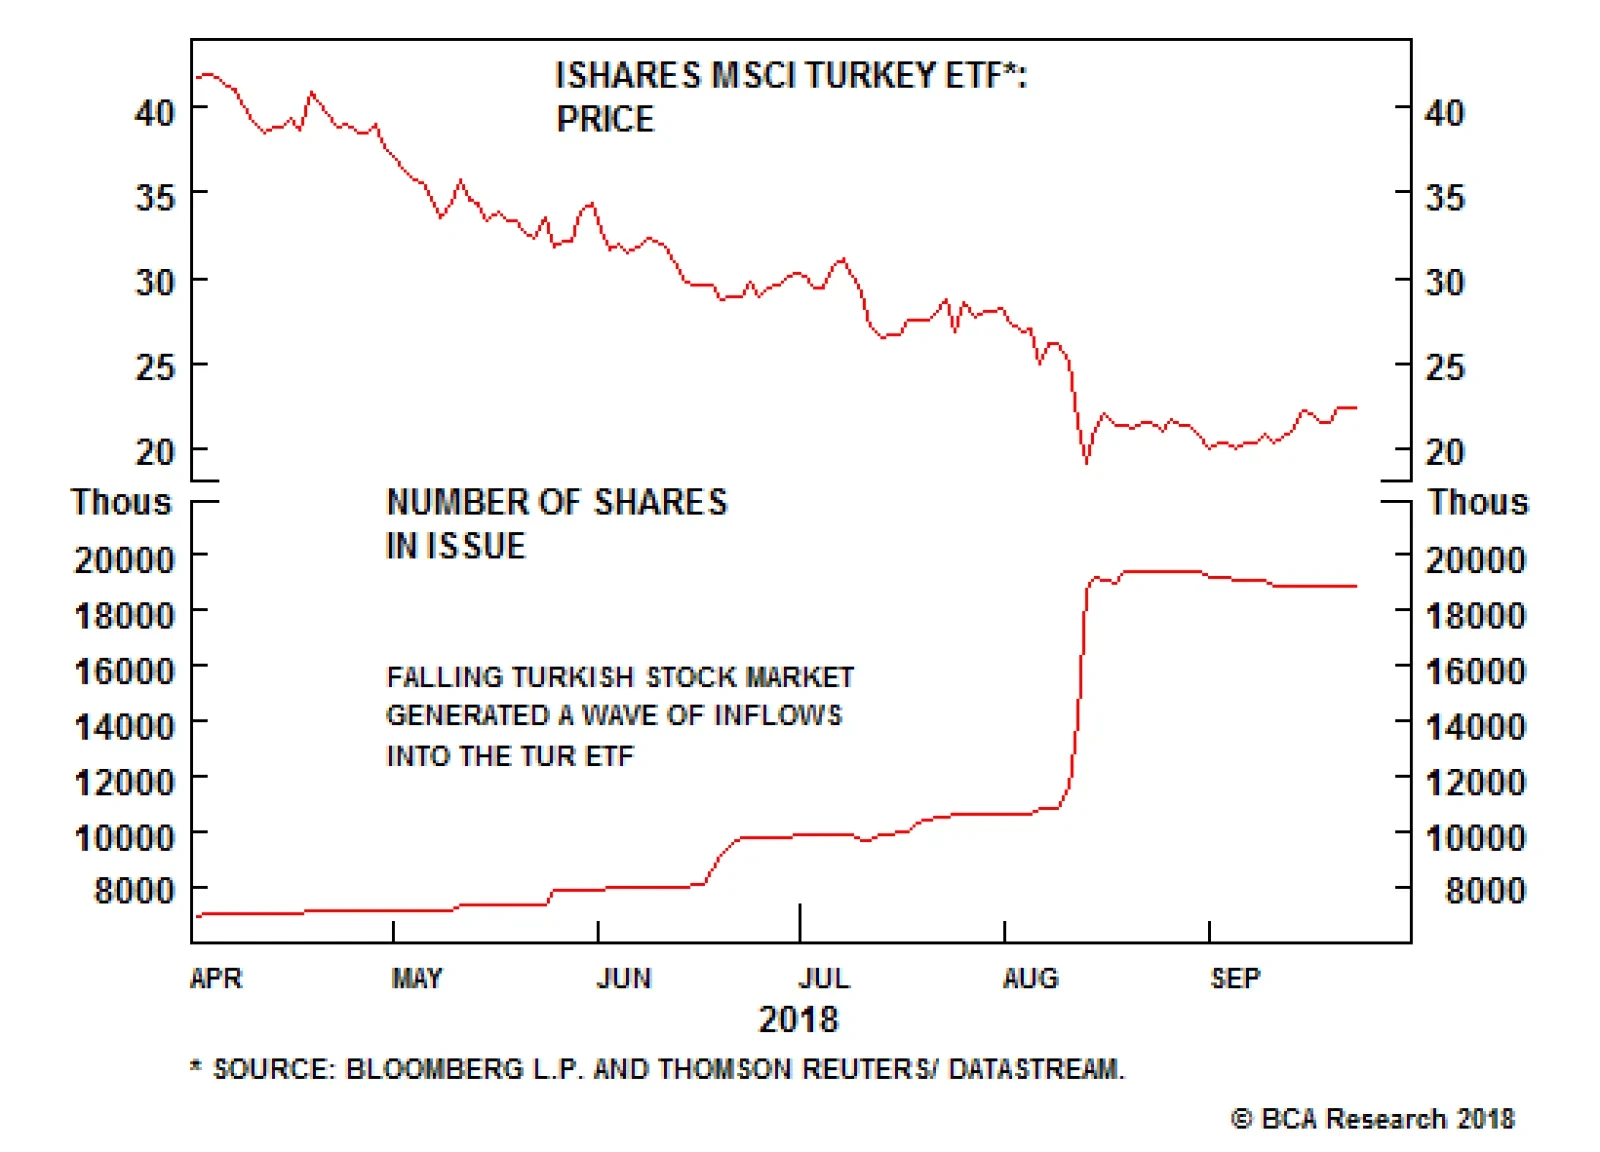
Our Global Investment Strategy team thinks it is too early to call a bottom in EM assets. Valuations have not yet reached washed-out levels. Bottom fishers still abound, as evidenced by the fact that the number of shares outstanding in the MSCI iShares…
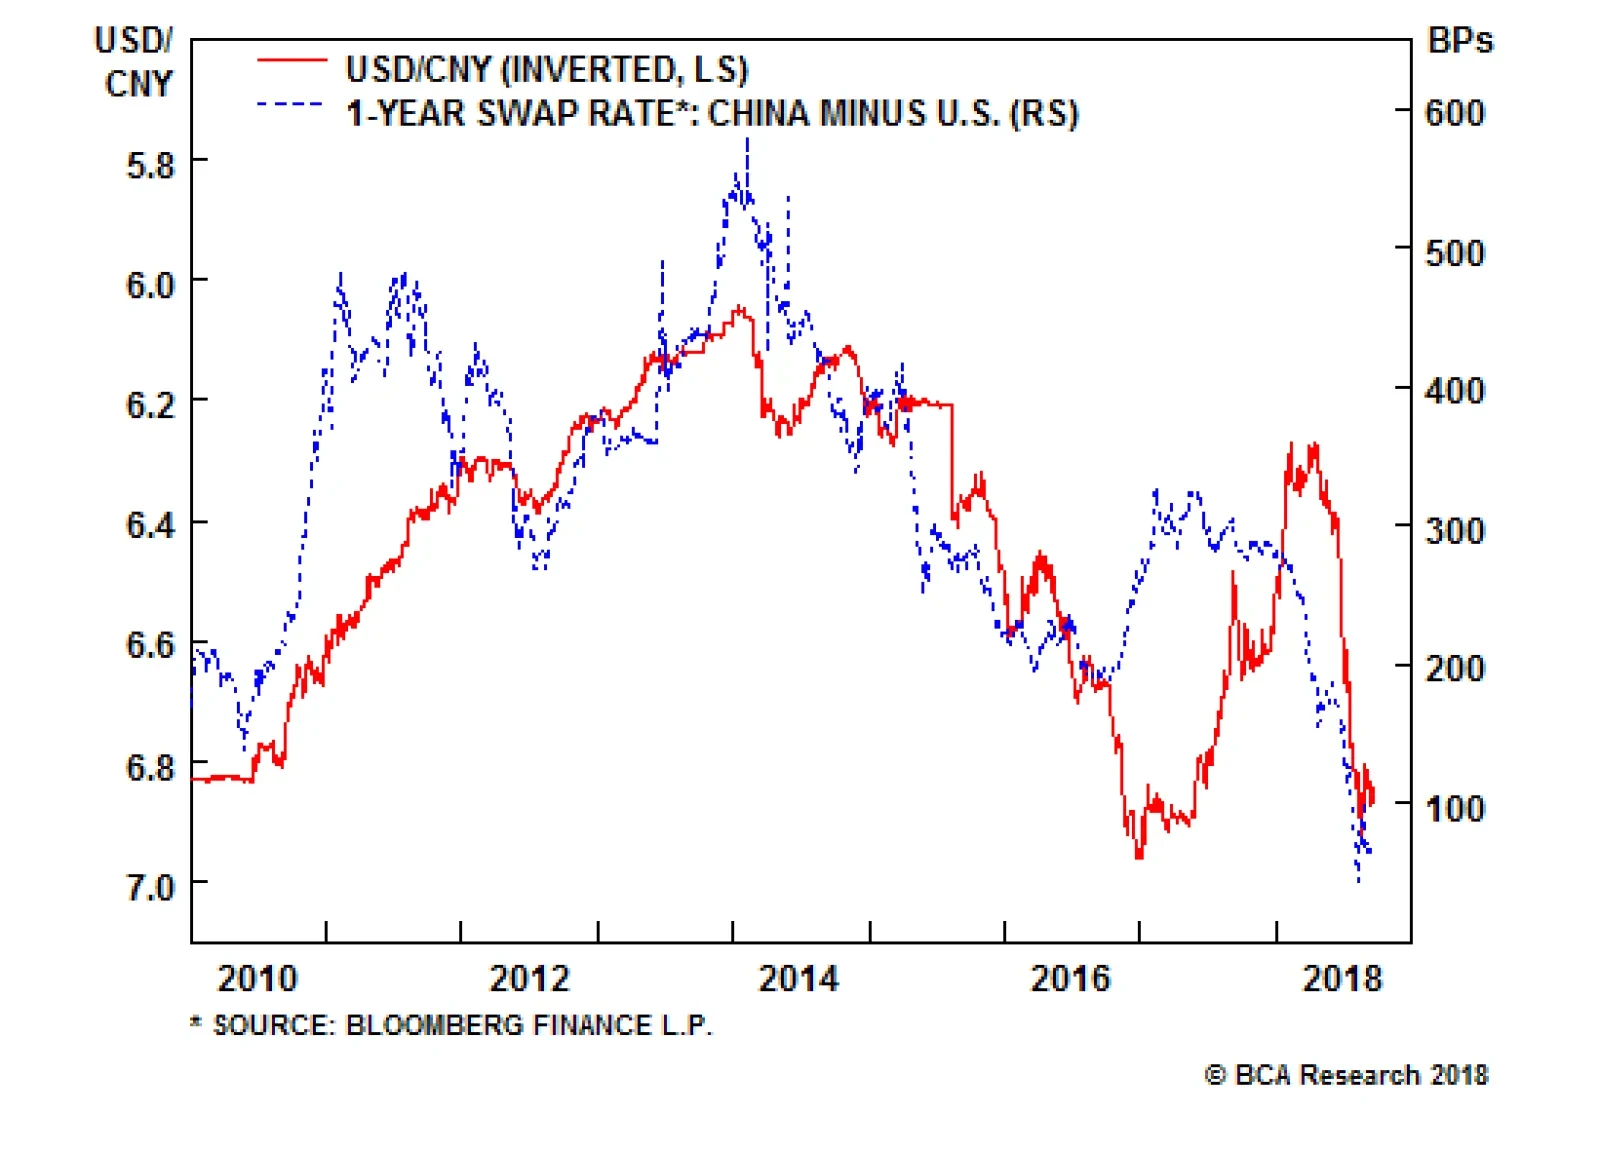
China’s economy is slowing, which has prompted the government to inject liquidity into the financial system. The spread in one-year swap rates between the U.S. and China has fallen from about 3% earlier this year to 0.6% at present, taking the yuan down with…
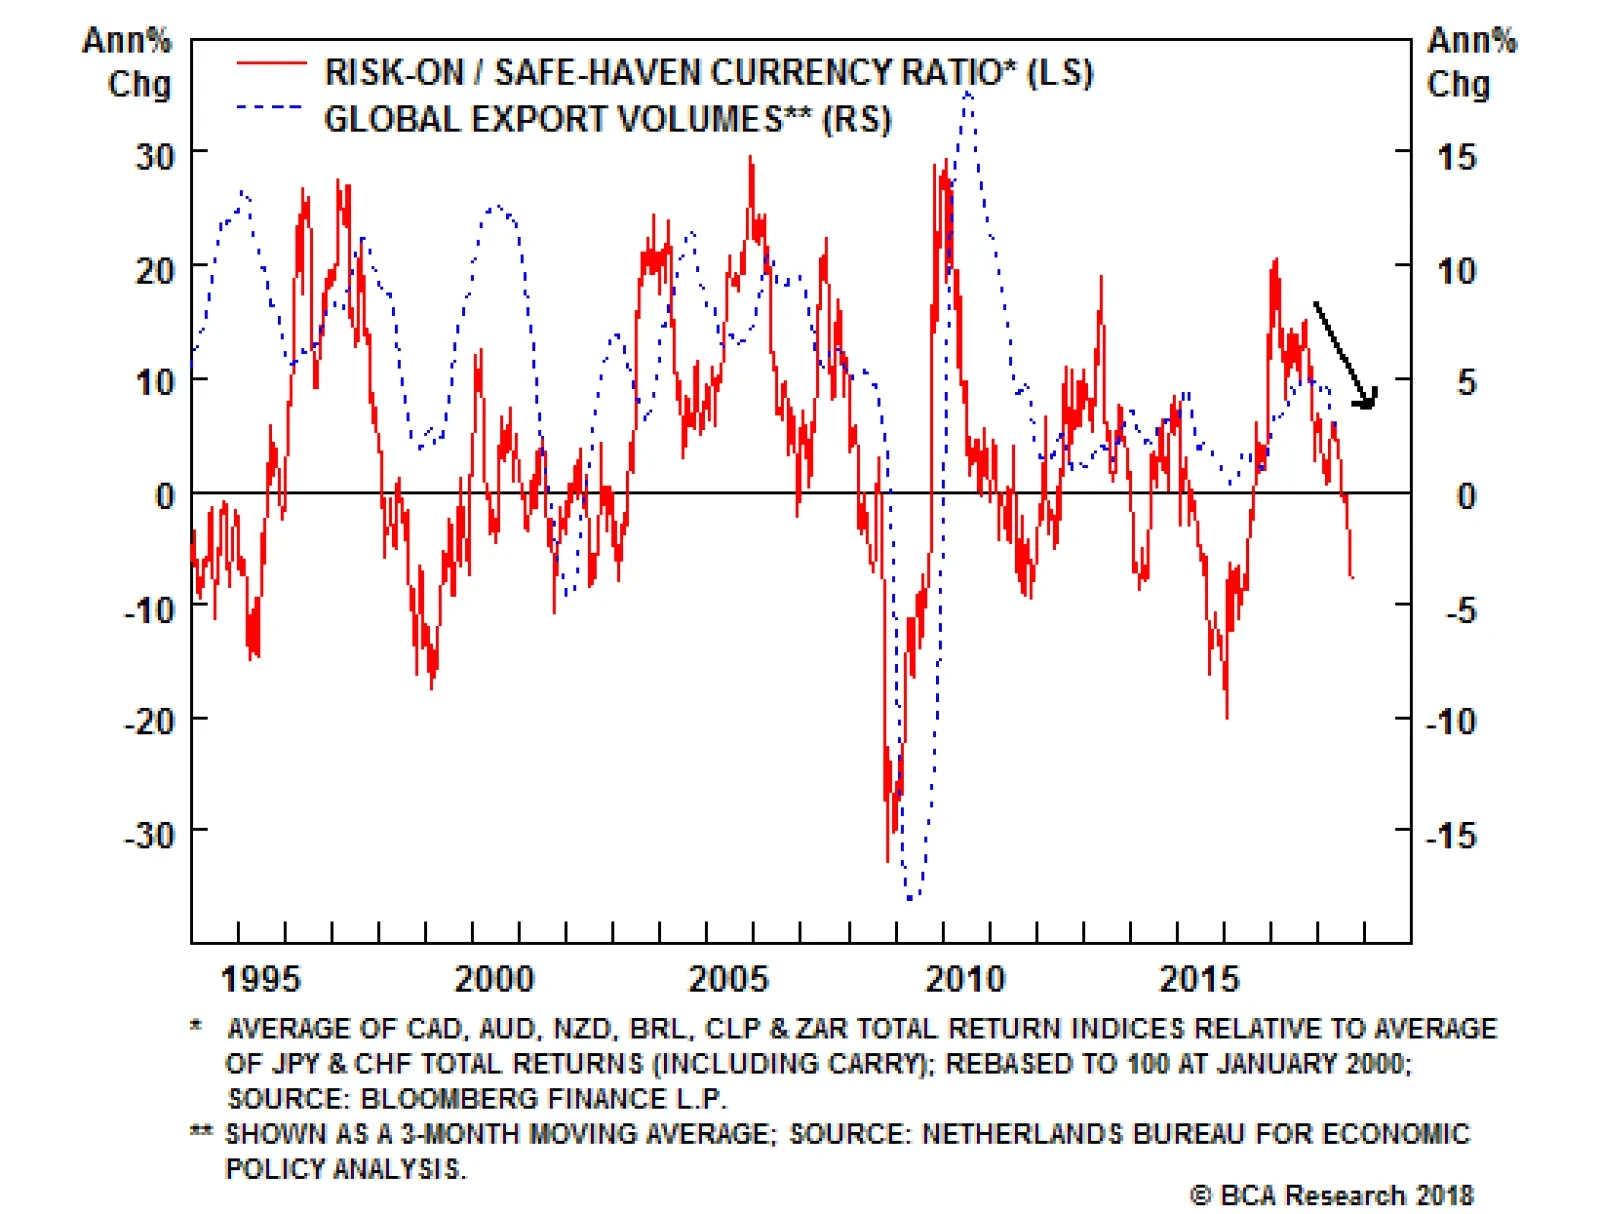
Currency markets can be used as signals for future growth expectations. The above chart shows that the relative performance of risk-on and risk-off currencies foreshadow further downside for global trade. More importantly, currency markets play an…
Highlights We review last year's "Three Tantalizing Trades" and offer four additional ones: Trade #1: Long June 2019 Fed funds futures contract/short Dec 2020 Fed funds futures contract Trade #2: Long USD/CNY Trade #3: Short AUD/CAD Trade #4: Long EM stocks with near-term downside put protection Feature A Review Of Last Year's "Three Tantalizing Trades" I had the pleasure of speaking at BCA's last Annual Investment Conference on September 25th, 2017, where I presented the following three trade ideas (Chart 1): 1. Short December 2018 Fed funds futures We closed this trade for a profit of 70 basis points. Had we held on, it would be up 92 basis points as of the time of this writing. 2. Long global industrial equities/short utilities We closed this trade on February 1st for a gain of 12%, as downside risks to global growth began to mount. This proved to be a timely decision, as the trade would be up only 6.1% had we kept it on. We would not re-enter this trade at present. 3. Short 20-year JGBs/long 5-year JGBs This trade struggled for much of 2018 but sprung back to life in August. It is up 0.6% since we initiated it. We still like the trade over the long haul. Investors are grossly underestimating the risk that Japanese inflation will move materially higher as an aging population creates a shortage of workers and a concomitant decline in the national savings rate. We also think the government will try to egg on any acceleration in consumer prices in order to inflate away its debt burden. In the near term, however, the trade could struggle if a combination of weaker EM growth and an increase in the value of the trade-weighted yen cause inflation expectations to decline. Four Additional Trades Trade #1: Long June 2019 Fed funds futures contract/short December 2020 Fed funds futures contract Investors expect U.S. short-term rates to rise to 2.38% by the end of 2018 and 2.85% by the end of 2019. The 47 basis points in tightening priced in for next year is less than the 75 basis points in hikes implied by the Fed dots. Investors appear to have bought into Larry Summers' secular stagnation thesis. They are convinced that short rates will not be able to rise above 3% without triggering a recession (Chart 2). Chart 1Revisiting Last Year's Three Tantalizing Trades
Revisiting Last Year's Three Tantalizing Trades
Revisiting Last Year's Three Tantalizing Trades
Chart 2Markets Expect No Fed Hikes Beyond Next Year
Four Tantalizing Trades
Four Tantalizing Trades
Regardless of what one thinks of Summers' thesis, it must be acknowledged that it is a theory about the long-term drivers of the neutral rate of interest. Over a shorter-term cyclical horizon, many factors can influence the neutral rate. Critically, most of these factors are pushing it higher: Fiscal policy is extremely stimulative. The IMF estimates that the U.S. cyclically-adjusted budget deficit will reach 6.8% of GDP in 2019 compared to 3.6% of GDP in 2015. In contrast, the euro area is projected to run a deficit of only 0.8% of GDP next year, little changed from a deficit of 0.9% it ran in 2015 (Chart 3). The relatively more expansionary nature of U.S. fiscal policy is one key reason why the Fed can raise rates while the ECB cannot. Credit growth has picked up. After a prolonged deleveraging cycle, private-sector nonfinancial debt is rising faster than GDP (Chart 4). The recent easing in The Conference Board's Leading Credit Index suggests that this trend will continue (Chart 5). Wage growth is accelerating. Average hourly earnings surprised on the upside in August, with the year-over-year change rising to a cycle high of 2.9%. This followed a stronger reading in the Employment Cost Index in the second quarter. A simple correlation with the quits rate suggests that there is plenty of upside for wage growth (Chart 6). Faster wage growth will put more money into workers pockets who will then spend it. The savings rate has scope to fall. The personal savings rate currently stands at 6.7%, more than two percentage points higher than what one would expect based on the current ratio of household net worth-to-disposable income (Chart 7). If the savings rate were to fall by two points over the next two years, it would add 1.5% of GDP to aggregate demand. Chart 3U.S. Fiscal Policy Is More Expansionary Than The Euro Area
U.S. Fiscal Policy Is More Expansionary Than The Euro Area
U.S. Fiscal Policy Is More Expansionary Than The Euro Area
Chart 4U.S. Private-Sector Nonfinancial Debt Is Rising At Close To Its Historic Trend
U.S. Private-Sector Nonfinancial Debt Is Rising At Close To Its Historic Trend
U.S. Private-Sector Nonfinancial Debt Is Rising At Close To Its Historic Trend
Chart 5U.S. Credit Growth Will Remain Strong
U.S. Credit Growth Will Remain Strong
U.S. Credit Growth Will Remain Strong
Chart 6Quits Rate Is Signaling That There Is Upside For Wage Growth
Quits Rate Is Signaling That There Is Upside For Wage Growth
Quits Rate Is Signaling That There Is Upside For Wage Growth
Chart 7The Personal Savings Rate Has Room To Fall
Four Tantalizing Trades
Four Tantalizing Trades
A back-of-the-envelope calculation suggests that these cyclical factors will permit the Fed to raise rates to 5% by 2020, almost double what the market is discounting.1 A more hawkish-than-expected Fed will bid up the value of the greenback. A stronger dollar, in turn, will undermine emerging markets, which have seen foreign-currency debts balloon over the past six years (Chart 8). The deflationary effects of a stronger dollar and falling commodity prices could temporarily cause investors to price out some hikes over the next few quarters. With that in mind, we recommend shorting the December 2020 Fed funds futures contract, while going long the June 2019 contract. The first leg of the trade captures our expectation that the market will revise up its estimate the terminal rate, while the second leg captures near-term risks to global growth. The gap between the two contracts has widened over the past few days as we have prepared this report, but at 21 basis points, it has plenty of room to increase further (Chart 9). Chart 8EM Dollar Debt Is High
EM Dollar Debt Is High
EM Dollar Debt Is High
Chart 9U.S. Rate Expectations Are Too Low Beyond Mid-2019
U.S. Rate Expectations Are Too Low Beyond Mid-2019
U.S. Rate Expectations Are Too Low Beyond Mid-2019
Trade #2: Long USD/CNY China's economy is slowing, which has prompted the government to inject liquidity into the financial system. The spread in 1-year swap rates between the U.S. and China has fallen from about 3% earlier this year to 0.6% at present, taking the yuan down with it (Chart 10). It is doubtful that China will be willing to match - let alone exceed - U.S. rate hikes. This suggests that USD/CNY will appreciate. China's real trade-weighted exchange rate has weakened during the past four months, but is up 25% over the past decade (Chart 11). U.S. tariffs on $250 billion (and counting) of Chinese imports threaten to erode export competitiveness, making a further devaluation necessary. Chart 10USD/CNY Has Tracked China-U.S. Interest Rate Differentials
USD/CNY Has Tracked China-U.S. Interest Rate Differentials
USD/CNY Has Tracked China-U.S. Interest Rate Differentials
Chart 11The RMB Is Still Quite Strong
The RMB Is Still Quite Strong
The RMB Is Still Quite Strong
President Trump will oppose a weaker yuan. However, just as China's actions earlier this year to strengthen its currency did not prevent the U.S. from imposing tariffs, it is doubtful that efforts by the Chinese authorities to talk up the yuan would appease Trump. Besides, China needs a weaker currency. The Chinese economy produces too much and spends too little. The result is excess savings, epitomized most clearly in a national savings rate of 46%. As a matter of arithmetic, national savings need to be transformed either into domestic investment or exported abroad via a current account surplus. China has concentrated on the former strategy over the past decade. The problem is that this approach has run into diminishing returns. Chart 12 shows that the capital stock has risen dramatically as a share of GDP. As my colleague Jonathan LaBerge has documented, the rate of return on assets among Chinese state-owned companies, which have been the main driver of rising corporate leverage, has fallen below their borrowing costs (Chart 13).2 Chart 12China's Capital Stock Has Grown Alongside Rising Debt Levels
China's Capital Stock Has Grown Alongside Rising Debt Levels
China's Capital Stock Has Grown Alongside Rising Debt Levels
Chart 13China: Rate Of Return On Assets Below Borrowing Costs For State-Owned Companies
China: Rate Of Return On Assets Below Borrowing Costs For State-Owned Companies
China: Rate Of Return On Assets Below Borrowing Costs For State-Owned Companies
Now that the economy is awash in excess capacity, the authorities will need to steer more excess production abroad. This will require a larger current account surplus which, in turn, will necessitate a relatively cheap currency. The dollar is currently working off overbought technical conditions, a risk we flagged in our August 31st report.3 That process should be complete over the next few weeks. Meanwhile, hopes of a massive Chinese stimulus focused on fiscal/credit easing will fade. The combination of these two forces will push up USD/CNY above the psychologically-critical 7 handle by the end of the year. Trade #3: Short AUD/CAD A weaker yuan will raise raw material costs to Chinese firms. This will hurt commodity prices. Industrial metals are much more vulnerable to slower Chinese growth than oil. Chart 14 shows that China consumes close to half of all the copper, nickel, aluminum, zinc, and iron ore produced in the world, compared to only 15% of oil output. Our expectation that developed economy growth will hold up better than EM growth over the next few quarters implies that oil will outperform industrial metals. Oil is also supported by a tighter supply backdrop, particularly given the downside risks to Iranian and Venezuelan crude exports. A bet on oil over metals is a bet on DM over EM growth in general, and the Canadian dollar over the Australian dollar specifically (Chart 15). Canada exports more oil than metals, while Australian exports are dominated by ores and metals. In terms of valuations, the Canadian dollar is still somewhat cheap relative to the Aussie dollar based on our FX team's long-term valuation model (Chart 16). Chart 14China Is A More Dominant Consumer Of Metals Than Oil
China Is A More Dominant Consumer Of Metals Than Oil
China Is A More Dominant Consumer Of Metals Than Oil
Chart 15Oil Over Metals = CAD Over AUD
Oil Over Metals = CAD Over AUD
Oil Over Metals = CAD Over AUD
Chart 16Canadian Dollar Still Somewhat Cheap Versus The Aussie Dollar
Canadian Dollar Still Somewhat Cheap Versus The Aussie Dollar
Canadian Dollar Still Somewhat Cheap Versus The Aussie Dollar
The loonie has been weighed down by ongoing fears that Canada will be left out of a renegotiated NAFTA. However, our geopolitical strategists believe that the Trump administration is trying to focus more on China, against whom the case for unfair trade practices is far easier to make. The U.S. has already negotiated a trade deal with Mexico and an agreement with Canada is more likely than not. If a new deal is struck, the Canadian dollar will rally. We recommended going short AUD/CAD on June 28. The trade is up 3.4%, carry-adjusted, since then. Stick with it. Trade #4: Long EM stocks with near-term downside put protection It is too early to call a bottom in EM assets. Valuations have not yet reached washed-out levels (Chart 17). Bottom fishers still abound, as evidenced by the fact that the number of shares outstanding in the MSCI iShares Turkish ETF has almost tripled since early April (Chart 18). However, at some point - probably in the first half of next year - investors will liquidate their remaining bullish EM bets. During the 1990s, this capitulation point occurred shortly after the collapse of Long-Term Capital Management in September 1998. EM equities fell by 26% between April 21, 1998 and June 15, 1998. After a half-hearted attempt at a rally, EM stocks tumbled again in July, falling by 35% between July 17 and September 10. The second leg of the EM selloff brought down the S&P 500 by 22%. Thanks to a series of well-telegraphed Fed rate cuts, global markets stabilized on October 8th (Chart 19). The S&P 500 surged by 68% over the next 18 months. The MSCI EM index more than doubled in dollar terms over this period. EM stocks outperformed U.S. equities by a whopping 71% between February 1999 and February 2000. Europe also outperformed the U.S. starting in mid-1999. Value stocks, which had lagged growth stocks over the prior six years, also finally gained the upper hand. Chart 17EM Assets: Valuations Not Yet At Washed Out Levels
EM Assets: Valuations Not Yet At Washed Out Levels
EM Assets: Valuations Not Yet At Washed Out Levels
Chart 18EM Bottom Fishers Still Abound
EM Bottom Fishers Still Abound
EM Bottom Fishers Still Abound
Chart 19The ''Great Equity Rotation'' Is Coming: A Roadmap From The 1990s
The ''Great Equity Rotation'' Is Coming: A Roadmap From The 1990s
The ''Great Equity Rotation'' Is Coming: A Roadmap From The 1990s
The "Great Equity Rotation" is coming. All the trades that have suffered lately - overweight EM, long Europe/short U.S., long cyclicals/short defensives, long value/short growth - will get their day in the sun. Investors can prepare for this inflection point by scaling into EM equities today, but guarding against near-term downside risk by buying puts. With that in mind, we are going long the iShares MSCI Emerging Market ETF (EEM), while purchasing March 15, 2019 out-of-the-money puts with a strike price of $41. Peter Berezin, Chief Global Strategist Global Investment Strategy peterb@bcaresearch.com 1 Depending on which specification of the Taylor rule one uses, a one percent of GDP increase in aggregate demand will increase the neutral rate of interest by half a point (John Taylor's original specification) or by a full point (Janet Yellen's preferred specification). Fiscal policy is currently about 3% of GDP too simulative compared to a baseline where government debt-to-GDP is stable over time. Assuming a fiscal multiplier of 0.5, fiscal policy is thus boosting aggregate demand by 1.5% of GDP. Nonfinancial private credit has increased by an average of 1.5 percentage points of GDP per year since 2016. Assuming that every additional one dollar of credit increases aggregate demand by 50 cents, the revival in credit growth is raising aggregate demand by 0.75% of GDP, compared to a baseline where credit-to-GDP is flat. The labor share of income has increased by 1.25% of GDP from its lows in 2015. Assuming that every one dollar shift in income from capital to labor boosts overall spending on net by 20 cents, this would have raised aggregate demand by 0.25% of GDP. Lastly, if the savings rate falls by two points over the next two years, this would raise aggregate demand by 1.5% of GDP. Taken together, these factors are boosting the neutral rate by anywhere from 2% (Taylor's specification) to 4% (Yellen's specification). This is obviously a lot, and easily overwhelms other factors such as a stronger dollar that may be weighing on the neutral rate. 2 Please see China Investment Strategy Special Report, "Chinese Policymakers: Facing A Trade-Off Between Growth And Leveraging," dated August 29, 2018. 3 Please see Global Investment Strategy Weekly Report, "The Dollar And Global Growth: Are The Tables About To Turn?" dated August 31, 2018. Strategy & Market Trends Tactical Trades Strategic Recommendations Closed Trades
Chinese stocks have caught a bid in recent days, up for three sessions and higher by more than 3%. Signs that policymakers in Beijing are expanding their stimulus to support the economy could certainly push this beaten-down asset higher. We are tracking the…