Emerging Markets
Investor expectations for Chinese stimulus to reverse the selloff on China-related assets might be premature. As our China strategists have noted, China’s industrial sector was weak before the U.S.-China trade war became a conspicuous problem. Furthermore,…
As we noted in today’s previous Insights, trade tensions with the U.S. are unlikely to ease very much in the coming months. Since our bias is tilted toward expecting more conflict on trade between the U.S. and China over the next year, our bias is also titled…
At a World Economic Forum event held yesterday, Premier Li Keqiang (the second most powerful Chinese official after President Xi) argued that China would not manipulate its currency, and highlighted that China would stick to “market-oriented foreign exchange…
Earlier this week, the Trump administration announced its decision on the second round of tariffs on $200 billion of Chinese imports; it decided that the tariff rate on the imports will initially start at 10%, but would rise to 25% by the end of the year. The…

Highlights The latest round of tariffs on U.S. imports from China confirms that the Trump administration's confrontation with China goes beyond the mid-term elections. Desynchronization between the U.S. and China/EM growth foreshadows dollar appreciation. The latter is the right medicine for the global economy for now. A stronger dollar is required to redistribute growth and inflation away from the U.S. and towards the rest of the world. China needs a weaker currency to offset deflationary pressures stemming from domestic deleveraging and trade tariffs. For EM ex-China, the dollar rally is painful, but it is the right medicine in the long run. It will bring about the unraveling of excesses within their economies. Feature The global economy presently finds itself between two strong and opposing crosscurrents: robust growth and mounting inflationary pressures in the U.S. on the one hand, and weakening Chinese growth on the other. Desynchronization between China/EM and the U.S. has been our theme since April 2017.1 Although this theme has become evident and to a certain degree priced into the markets, we believe it is not yet time to abandon it. Before exploring this analysis in greater depth, we will address the issue of whether strong U.S. demand will reverse the slowdown in the global trade cycle, and update our thoughts on the trade wars. Global Trade And Trade Wars Our leading indicators for global trade do not herald a reversal in the global exports slowdown. Chart I-1 demonstrates that the ratio of risk-on versus safe-haven currencies2 leads global export volumes by several months, and it does not yet flag any improvement. Chart I-1Risk-On / Safe-Haven Currency Ratio As An Indicator Of Global Trade
Risk-On / Safe-Haven Currency Ratio As An Indicator Of Global Trade
Risk-On / Safe-Haven Currency Ratio As An Indicator Of Global Trade
In addition, Taiwanese exports of electronic products lead the global trade cycles by a couple of months, and they are currently pointing to further deceleration in world exports (Chart I-2). It seems extremely robust U.S. domestic demand growth has not prevented a slowdown in global trade in general and EM exports in particular. The reason for this is that many developing countries' shipments to China are larger than their exports to the U.S., as illustrated in Table I-1. Chart I-2Taiwanese Electronics Exports##br## Slightly Lead Global Exports
Taiwanese Electronics Exports Slightly Lead Global Exports
Taiwanese Electronics Exports Slightly Lead Global Exports
Table I-1Many Emerging Economies##br## Sell More To China Than To The U.S.
Desynchronization Compels Currency Adjustments
Desynchronization Compels Currency Adjustments
The latest decision by the U.S. administration to impose a 10% tariff on $200 billion of imports from China and increase this rate to 25% starting January 1, 2019 confirms that the Trump administration's confrontation with China goes beyond the mid-term elections. The true intention of the U.S. is to contain China's geopolitical rise to preserve its global hegemony. These episodes of import tariffs will likely mark the beginning of a much longer and drawn-out geopolitical confrontation. Our colleagues at BCA's Geopolitical Strategy service have been noting for several years that a U.S.-China confrontation is unavoidable.3 In this vein, it is not clear to us why global growth-sensitive and China-leveraged plays in financial markets have rallied in recent days on the new tariff announcement. We can think of two reasons: (1) markets expect China to stimulate domestic demand aggressively to counter tariffs; and (2) gradually rising U.S. import tariffs will boost global trade in the near term, as companies front load their production and shipments before the 25% tariff rate takes hold. On the first point, there has so far been no major new fiscal stimulus announced in China. We detailed fiscal numbers in our August 23 report,4 and there have been no changes since. As to liquidity easing - which has been material - our assessment is that it is likely to be overwhelmed by ongoing regulatory tightening on banks and shadow banking. In short, lingering credit excesses and regulatory tightening will hamper the monetary transmission mechanism from lower interest rates to faster credit growth. So far, money growth in China remains very weak (Chart I-3). Chart I-3China's Narrow Money And EM Stocks
China's Narrow Money And EM Stocks
China's Narrow Money And EM Stocks
On the second point, we cannot rule out a moderate and temporary improvement in global trade due to various technical factors. Yet, any rally rooted in this will prove to be short-lived and fleeting. Bottom Line: Escalating tariffs on U.S. imports from China will reinforce the tectonic macro shifts that have been in place since early this year: it will lift U.S. inflation slightly and weigh on Chinese growth. Rising U.S. Inflation U.S. core inflation is accelerating and moving above the Federal Reserve's soft target of 2%. This will substantially narrow the Fed's maneuvering room to respond to the turmoil in EM and weakening growth outside the U.S. Chart I-4 demonstrates that an equally weighted average of various core consumer inflation measures for the U.S. has been markedly accelerating. The components of this core inflation aggregate are presented in Chart I-5 and include: trimmed mean CPI, trimmed mean PCE, market-based core PCE and median CPI. Besides, the U.S. labor market is super tight, and employee compensation growth will continue to rise. This will put downward pressure on corporate profit margins and will push businesses to consider passing on their rising costs to consumers. Provided wage growth will continue accelerating and the job market and confidence both remain strong, odds are that companies will be able to raise their selling prices. Chart I-4U.S. Inflation Is Rising...
U.S. Inflation Is Rising...
U.S. Inflation Is Rising...
Chart I-5...Based On Various Core Measures
...Based On Various Core Measures
...Based On Various Core Measures
Weakening Chinese Growth Growth continues to weaken in China. In particular: The aggregate freight index (transport by railway, highway, waterway, and aviation) is sluggish and the measure of Air China's freight continues to downshift (Chart I-6). The strength in China's residential property market since 2015 has partially been due to the central bank providing very cheap financing directly to housing via its Pledged Supplementary Lending (PSL) scheme. We have argued in the past that this represents nothing less than monetization of excess housing inventories directly by the People's Bank of China.5 This has boosted property prices and sales, supporting the economy over the past two years. Having met the objective of reducing housing inventories, the PBoC has lately reduced the amount of PSL. Provided changes in PSL flows have led both housing prices and sales volumes, it is reasonable to expect a relapse in new sales in the next six months or so (Chart I-7). Chart I-6China: A Slowdown In Freight Indicators
China: A Slowdown In Freight Indicators
China: A Slowdown In Freight Indicators
Chart I-7China: Housing Sales To Roll Over Soon
China: Housing Sales To Roll Over Soon
China: Housing Sales To Roll Over Soon
Our main theme in China has been and remains shrinking construction activity - both infrastructure and property building. This is the primary rationale for our negative view on commodities prices as well as weakness in mainland aggregate imports. Chart I-8 illustrates property construction activity is already contracting. Headline fixed asset investment in real estate has been held up by booming land purchases, yet equipment purchases as well as construction and installation have been shrinking (Chart I-8). Capital expenditures for all industries, including construction and installation, purchase of equipment and instruments - but excluding land values - are also very weak (Chart I-9). Chart I-8China: Property Investment##br## Excluding Land Is Contracting
China: Property Investment Excluding Land Is Contracting
China: Property Investment Excluding Land Is Contracting
Chart I-9China: Overall Capex##br## Is Very Weak
China: Overall Capex Is Very Weak
China: Overall Capex Is Very Weak
Interestingly, our proxy for marginal propensity to spend6 by Chinese companies leads global industrial metals prices, and continues pointing to more downside (Chart I-10). With respect to oil, Chinese oil import growth has downshifted considerably (Chart I-11) implying that global oil prices have been mostly propped up by supply concerns. Chart I-10Chinese Companies' Propensity##br## To Spend And Metal Prices
Chinese Companies' Propensity To Spend And Metal Prices
Chinese Companies' Propensity To Spend And Metal Prices
Chart I-11China: A Slowdown##br## In Oil Imports
China: A Slowdown In Oil Imports
China: A Slowdown In Oil Imports
Currency Markets As A Rebalancing Mechanism Pressures from growth desynchronization between the U.S. and China and trade wars continue to build. Left unchecked, these imbalances will enlarge and culminate into a bust. A release valve is needed to diffuse these accumulating pressures. Currency and bond markets often act as such - they move to rebalance the global economy and amend economic excesses. Odds are that exchange rates will continue to act as a rebalancing conduit. A stronger dollar is the right medicine for the global economy at the moment. A stronger dollar is required to redistribute growth away from the U.S. and towards the rest of the world. In particular, dollar appreciation is needed to cap budding U.S. inflationary pressures. China needs a weaker currency to offset deflationary pressures stemming from domestic deleveraging and trade tariffs. In turn, a stronger greenback will cause capital outflows from EM and compel the unraveling of excesses within the developing economies. While the result will be painful growth retrenchment for EM in the medium term, cheapened currencies and deleveraging (an unwinding of credit excesses) will ultimately create a foundation for stronger and healthier growth in the years ahead. As to the question of why the dollar would rally in the face of widening twin deficits, we have the following remarks. In a world where growth and inflation are scarce (i.e., in a deflationary milieu), a wider current account deficit and higher inflation - signs of robust domestic demand - will attract capital, ultimately lifting a country's currency. By contrast, in a world of strong growth and intensifying inflationary pressures, twin deficits and higher inflation will cause a country's currency to depreciate. Our assessment is that the global economic backdrop is still more deflationary than inflationary, despite intensifying inflationary pressures in the U.S. Therefore, twin deficits and inflation in the U.S. will be at a premium. That and the fact that the Federal Reserve is willing to continue tightening are conducive for dollar appreciation. As we have argued in previous reports, the U.S. dollar is not cheap,7 but it is not particularly expensive either. In fact, odds are it will get much more expensive before topping out. Bottom Line: Beyond any possible short-term countertrend moves, the path of least resistance for the U.S. dollar is up, and for the RMB and EM currencies, down. As these adjustments within the currency markets endure, EM risk assets will stay under selling pressure and underperform their developed market counterparts. Indonesia: At The Whims Of Foreign Portfolio Flows 20 September 2018 The Indonesian currency has reached a two- decade low, and equities and bonds have sold off considerably. Is it time to turn positive on the nation's financial markets? Our bias remains that this selloff is not over and stocks, bonds as well as the currency have more downside. The basis is that Indonesia's balance of payments (BoP) will continue to deteriorate. Indonesia has been very reliant on volatile foreign portfolio flows to fund its current account deficit (Chart II-1). Not surprisingly, a reversal in foreign portfolio inflows to emerging markets (EM) has hurt this country's financial markets. We expect international capital flows to EM to be lackluster, which will continue to weigh on Indonesia's capital account. In the meantime, Indonesia's current account deficit is likely to widen in the months ahead. First, export revenues will begin rolling over on the back of lower copper and palm oil prices. Together, these commodities account for 13% of Indonesian exports. Second, the ongoing slowdown in China may eventually weigh on thermal coal prices. This commodity makes up another 12% of exports. Third, Indonesian imports remain very robust. Overall, a widening current account/trade deficit is typically negative for both share prices and the rupiah (Chart II-2). Chart II-1Indonesia: Foreign ##br##Portfolio Flows Are Key
Indonesia: Foreign Portfolio Flows Are Key
Indonesia: Foreign Portfolio Flows Are Key
Chart II-2Deteriorating Trade Balance ##br##Is Bearish For Equities
Deteriorating Trade Balance Is Bearish For Equities
Deteriorating Trade Balance Is Bearish For Equities
To prevent further currency depreciation, the government announced it will curb certain imports by raising tariffs.While this policy may succeed in limiting imports, it will also raise inflation by pushing prices of imported goods higher. This will allow inefficient domestic producers to stay in business. Higher inflation is fundamentally negative for the currency and local bonds. The above dynamics are making Indonesia's macro outlook increasingly toxic because Bank Indonesia (BI) will probably need to tighten monetary policy further in order to stabilize the rupiah and restrain inflation. Crucially, the BI's objective is to maintain rupiah stability in order to keep inflation tame. Further, Perry Warjiyo, the current governor of BI, has highlighted his preference for setting decisive and preemptive policies. Indonesia's central bank has already raised interest rates, and more hikes are likely if the currency continues depreciating - as we expect. On top of rate hikes, the BI will continue to deplete its foreign exchange reserves to defend the rupiah. Chart II-3 shows that foreign exchange reserve selling by the BI is shrinking local banking system liquidity (commercial bank reserves at the central bank) and lifting domestic interbank rates. In turn, higher local rates will cause bank loan growth to slow, hurting domestic demand. The latter will be very negative for profit growth and share prices because the Indonesian stock market is heavily dominated by banks and other domestic plays. The outlook for Indonesian banks is crucial for the performance of the Indonesian bourse, given they account for 42% of total MSCI market cap. Unfortunately, banks still rest on shaky foundations: Chart II-3Selling FX Reserves = Higher Interbank Rates
Selling FX Reserves = Higher Interbank Rates
Selling FX Reserves = Higher Interbank Rates
Chart II-4Net Interest Margins Will Keep Compressing
Net Interest Margins Will Keep Compressing
Net Interest Margins Will Keep Compressing
Not only will demand for loans slump as borrowing costs rise, but banks' net interest margins will also continue to compress (Chart II-4). Weaker growth and higher interest rates will also lead to a considerable rise in non-performing loans (NPLs), and cause banks' provisioning levels to spike. Higher provisions will hurt their earnings (Chart II-5). Notably, banks have boosted their profits substantially in the past two years by reducing their provisions. This process is set to reverse very soon. Finally, a word on overall equity valuations is warranted. Despite the correction that has taken place, this bourse is not yet trading at compelling valuation levels neither in absolute nor in relative terms (Chart II-6). Chart II-5Downside Ahead For Banks' Shares
Downside Ahead For Banks' Shares
Downside Ahead For Banks' Shares
Chart II-6Indonesian Bourse Isn't Cheap
Indonesian Bourse Isn't Cheap
Indonesian Bourse Isn't Cheap
Bottom Line: The rupiah will remain under selling pressure. This in turn will create a toxic macro mix of higher inflation, rising borrowing costs and weaker domestic demand. We recommend investors keep an underweight position in Indonesian stocks as well as local and sovereign bonds within their respective EM dedicated portfolios. We are also maintaining our short positions in the rupiah versus the U.S. dollar and on 5-year local currency bonds. Arthur Budaghyan, Senior Vice President Emerging Markets Strategy arthurb@bcaresearch.com Ayman Kawtharani, Associate Editor ayman@bcaresearch.com Footnotes 1 Please see Emerging Markets Strategy Weekly Report, "Toward A Desynchonized World?" dated April 26, 2017, the link is available at ems.bcaresearch.com. 2 Relative total return (carry included) of four equally weighted EM (ZAR, RUB, BRL and CLP) and three DM (AUD, NZD and CAD) commodities currencies versus an equally weighted average of two safe-haven currencies - the Japanese yen and Swiss franc. 3 Please see Geopolitical Strategy Weekly Report, "We Are All Geopolitical Strategists Now," dated March 28, 2018, the link is available at gps.bcaresearch.com. 4 Please see Emerging Markets Strategy Weekly Report, "EM: Do Not Catch A Falling Knife," dated August 23, 2018, the link is available at ems.bcaresearch.com. 5 Please see Emerging Markets Strategy Special Report, "China Real Estate: A Never-Bursting Bubble?" dated April 6, 2018, the link is available at ems.bcaresearch.com. 6 Calculated as a ratio of corporate demand deposits to time deposits. Rising demand deposits relative to time (savings) deposits entail that companies are gearing up to spend /invest money and vice versa. 7 Please see Emerging Markets Strategy Special Report, "The Dollar: Will The U.S. Invoke A "Nuclear" Option?" dated August 30, 2018, the link is available at ems.bcaresearch.com. Equity Recommendations Fixed-Income, Credit And Currency Recommendations
Highlights Recent estimates by ship trackers put the loss of Iranian exports at close to 1mm b/d as of mid-September vs April levels. This loss is higher (and sooner) than our previous baseline expectation, and prompts us to raise our estimate of lost Iranian oil exports to 1.25mm b/d by November, when U.S. sanctions kick in. Venezuela still is close to collapse, but may avoid a complete meltdown with Chinese companies stepping in to safeguard the $50 billion loaned to the country's oil industry.1 We expect production to fall below 1mm b/d next year - to less than half its end-2016 level. With Fed policy likely to continue tightening into 2019 as oil prices surge, the odds of an equity bear market and recession arriving in 2H19 - vs our 2H20 House view - also increase. Our dominant scenario now includes a supply shock and higher prices in 1Q19, which is followed by a U.S. SPR release and price-induced demand destruction (Chart of the Week). As a result, we are raising the odds of Brent prices reaching or exceeding $100/bbl by as early as 1Q19, and lifting our 2019 forecast to $95/bbl. Energy: Overweight. U.S. refining capacity utilization remains close to 19-year highs. At 97.1% of operable capacity, it is within a whisker of the four-week-moving-average highs of 97.3% recorded in August, driven by strong product demand ex U.S. Base Metals: Neutral. The U.S. Treasury granted permission to Rusal's existing customers to continue signing new contracts with the aluminum producer. The announcement stopped short of a full removal of sanctions, which are set to come into effect on October 23. Precious Metals: Neutral. The strong trade-weighted USD continues to hold gold prices on either side of $1,200/oz. We remain long as a portfolio hedge. Ags/Softs: Underweight. The USDA's Crop Production report forecasts record yields for corn and soybeans - 181.3 and 52.8 bushels/acre, respectively - which continues to weigh on prices. The bean harvest is expected to be a record. Feature Chart of the WeekBCA Ensemble Forecast Lifts Brent To $95/bbl, As Market Tightens
BCA Ensemble Forecast Lifts Brent To $95/bbl, As Market Tightens
BCA Ensemble Forecast Lifts Brent To $95/bbl, As Market Tightens
With the loss of Iranian exports occurring faster and sooner than expected, and Venezuela remaining on the brink of collapse, senior energy officials from the U.S., Russia and the Kingdom of Saudi Arabia (KSA) are going to great lengths to reassure their domestic consumers everything - particularly on the supply side - is under control. We are inclined to believe their comfort level re global oil supply is inversely proportional to the amount of reassurance they provide their domestic audiences. The more they meet and talk - particularly to the media - the more concerned they are. And right now, they're pretty concerned. Rick Perry, the U.S. Energy Secretary, held a presser in Moscow following his meeting with Alexander Novak, Russia's Energy Minister, saying the U.S., KSA and Russia can lift output over the next 18 months to compensate for the loss of exports from Iran, Venezuela, and other unplanned outages.2 That might be true, but the market's already tightening far faster and far sooner than many analysts expected. Covering a supply shortfall in 18 months does nothing for the market over the next few months, particularly with demand remaining robust (Chart 2) and OECD inventories falling (Chart 3). Since 2017, our factor model shows Brent prices have been supported by two factors acting simultaneously together: Chart 2Fundamentals Support Strong Prices
Odds Of Oil-Price Spike In 1H19 Rise; 2019 Brent Forecast Lifted $15 To $95/bbl
Odds Of Oil-Price Spike In 1H19 Rise; 2019 Brent Forecast Lifted $15 To $95/bbl
Chart 3Inventory Draws Will Accelerate
Inventory Draws Will Accelerate
Inventory Draws Will Accelerate
Strong compliance of OPEC 2.0 members to the coalition's production-cutting agreement, which reduced the OPEC Supply-and-Inventory factor's role, and The pickup in global oil demand, particularly in EM economies, which pushed our Global Demand factor up. These effects were partly counterbalanced by the rise in our non-OPEC Supply factor - driven by strong growth in U.S. shale-oil output - which became the largest negative contributor to price movements. Global demand's been strengthening since the end of 1H17 on the back of stellar EM income growth. This remains the fundamental backdrop to global oil for now. While our base case remains relatively supportive for oil prices, we are raising the odds of a price spike resulting from a supply shock as early as 1Q19 on the back of larger- and faster-than-expected Iranian export losses, and continued declines in Venezuelan production. Should this occur, we believe it would trigger a U.S. SPR release, and produce demand destruction at a rate that could be faster than historical experience would suggest (Table 1). This further tightens balances, and leads us to raise our 2019 forecast for Brent crude oil to $95/bbl on average, up from $80/bbl last month, with WTI trading $6/bbl below that (Chart 4). This forecast is highly conditional, given our assumptions re supply-side variables, a U.S. SPR release, and demand destruction estimates. Table 1BCA Global Oil Supply - Demand Balances (MMb/d) (Base Case Balances)
Odds Of Oil-Price Spike In 1H19 Rise; 2019 Brent Forecast Lifted $15 To $95/bbl
Odds Of Oil-Price Spike In 1H19 Rise; 2019 Brent Forecast Lifted $15 To $95/bbl
Chart 4BCA's Oil Balances Tighter
BCA's Oil Balances Tighter
BCA's Oil Balances Tighter
Oil Balances Tighten As Supply Contracts In our monthly balances update, we are incorporating a sharply accelerated loss of Iranian export barrels to the market, which already is evident. Bloomberg this week reported its tanker-tracking service registered a decline in Iranian exports of close to 1mm b/d between April, when sanctions were announced, and mid-September.3 At this rate, the assessment by Platts Analytics last week that as much as 1.4mm b/d of Iranian exports could be lost by the time U.S. sanctions kick in November 4 appears more likely.4 However, to be conservative, we are building in a loss of 1.25mm b/d in our balances, and have it developing over the July - November period in increments of 250k b/d, instead of the November - February interval we assumed in last month's balances. We will monitor this situation and revise our estimates as new information arrives. Also on the supply side, we are assuming the U.S. SPR releases 500k b/d starting a month after Brent prices go over $90/bbl in March 2019. This is in line with the SPR's enabling legislation, which limits drawdowns to 30mm b/d over a 60-day period, after the President authorizes such action to meet a severe energy supply interruption. Lastly, we continue to carry supply constraints arising from the lack of sufficient take-away capacity to get all of the crude produced in the Permian Basin to refining markets in our models. To wit: We continue to expect 1.2mm b/d of supply growth from the U.S. shales, driven largely by Permian production, vs an earlier expectation of 1.4mm b/d of growth. We expect the Permian to be de-bottlenecked by 4Q19. We expect the Big 3 producers Secretary Perry expects to fill supply gaps in 18 months - the U.S., Russia, and KSA - to produce 10.83mm, 11.4mm and 10.4mm b/d in 2H18, and 11.79mm, 11.43mm and 10.4mm b/d next year, respectively. They will get some help from OPEC's Gulf Arab producers - i.e., the core OPEC producers (Chart 5) - but, supply will continue to fall/stagnate in most of the rest of the world, particularly in offshore producers (Chart 6). Chart 5While Core OPEC Can Increase Supply...
While Core OPEC Can Increase Supply...
While Core OPEC Can Increase Supply...
Chart 6... 'The Other Guys' Output Stagnates
Odds Of Oil-Price Spike In 1H19 Rise; 2019 Brent Forecast Lifted $15 To $95/bbl
Odds Of Oil-Price Spike In 1H19 Rise; 2019 Brent Forecast Lifted $15 To $95/bbl
We also note the EIA and IEA have lowered their supply-growth estimates this month. The EIA this month reduced expected U.S. crude production growth by 210k b/d in 2019, and the IEA lowered its estimate of offshore production growth in Brazil from 260k b/d to just 30k b/d this year. These are non-trivial adjustments in a market that was tight prior to the downgrade in supply growth. Still, there are significant marginal disagreements on the supply side among the major data supporters (the EIA, IEA and OPEC), which can be seen in Table 2. Table 2Comparison Of Major Balances Estimates
Odds Of Oil-Price Spike In 1H19 Rise; 2019 Brent Forecast Lifted $15 To $95/bbl
Odds Of Oil-Price Spike In 1H19 Rise; 2019 Brent Forecast Lifted $15 To $95/bbl
Demand Destruction Likely As Prices Spike In 1Q19 We expect the rate of growth in EM incomes and trade - a proxy for income - to slow slightly this year vs 2017, on the back of a strengthening USD. This will reduce the rate of growth in EM imports and the rate of growth in EM commodity demand, at the margin. However, y/y growth in EM incomes is expected to remain positive over the next 12 months in our baseline scenario, which will keep the level of commodity demand - particularly for oil and industrial metals - robust. This will drive global demand growth of ~ 1.6mm b/d this year, roughly unchanged from last month. Higher prices risk slowing next year's growth. This is where it gets tricky. An oil-supply shock occurring when global demand is strong most likely will produce a price spike, as we've been arguing for the past several weeks.5 This price spike, coupled with continued monetary-policy tightening by the Fed, raises the likelihood of demand destruction globally. Higher oil prices and a stronger USD act as a double-whammy on EM oil demand. The problem we have now is gauging the elasticity of oil demand, particularly in EM. Oil markets are fundamentally different now than at any point in the modern era - roughly beginning in the early 1960s with the ascendance of OPEC - because many big oil-importing EM economies removed or relaxed subsidies following the prices collapse of 2014 - 2016. Prominent among these states are China and India. OPEC states also took advantage of the price collapse to relax or remove subsidies, e.g., KSA.6 The price shock we anticipate, therefore, will be the first in the modern era in which EM consumers - the principal driver of oil demand in the world, accounting for roughly 70% of the demand growth we expect - are exposed directly to higher prices. How quickly they will respond to higher prices is unknown. For this reason, we're introducing what we consider a reasonable first approximation of how EM demand might respond to higher prices and a stronger USD into the scenarios we include in our ensemble forecast (Chart 7). As a first approximation - subject to at least monthly adjustment, as more data become available - we are modeling a 100k b/d loss of demand for every $10/bbl increase in crude oil prices.7 We will continue to iterate on this as new information becomes available. Chart 7Ensemble Scenarios Reflect New Risks
Ensemble Scenarios Reflect New Risks
Ensemble Scenarios Reflect New Risks
Bottom Line: We've raised the odds of a supply shock in the oil markets that takes Brent prices to or through $100/bbl by 1Q19. Should this occur, we expect it will be met by a U.S. SPR release of 500k b/d a month after prices breach $90/bbl. This price spike will set off a round of demand destruction, which we expect will be quicker than history would suggest, given many large EM oil-consuming states have relaxed or eliminated fuel subsidies, leaving their consumers exposed to the price shock. This will be exacerbated by a stronger USD going forward, as the Fed likely looks through the price spike and continues with its policy-rate normalization. In this scenario, a U.S. recession could arrive in 2H19 vs our House view of 2H20 or later. In addition, we would expect an equity bear market to ensue sooner than presently anticipated. We recommend using Brent call spreads to express the view consistent with our research. At tonight's close, we will go long April, May and June 2019 calls struck at $85/bbl and short $90/bbl calls. Robert P. Ryan, Senior Vice President Commodity & Energy Strategy rryan@bcaresearch.com Hugo Bélanger, Senior Analyst Commodity & Energy Strategy HugoB@bcaresearch.com 1 Please see "Venezuela hands China more oil presence, but no mention of new funds," published by reuters.com September 14, 2018. 2 U.S. Energy Secretary Rick Perry made this claim at a press conference after meeting with Russian Energy Minister Alexander Novak last Friday. Please see "Big Three oil states can offset fall in Iran supplies: Perry," published by reuters.com September 14, 2018. 3 Please see "Saudi Arabia Is Comfortable With Brent Oil Above $80," published by bloomberg.com September 18, 2018. 4 Please see "OPEC crude oil production rises to 32.89 mil b/d in Aug as cuts unwind: Platts survey" published by SP Platts Global September 6, 2018. 5 Please see "Oil-Supply Shock, Rising U.S. Rates Favor Gold As A Portfolio Hedge," published by BCA Research's Commodity & Energy Strategy Weekly Report on September 13, 2018. It is available at ces.bcaresearch.com. For a discussion of the effect of a stronger USD on global oil demand, please see "Trade, Dollars, Oil & Metals ... Assessing Downside Risk," published by the Commodity & Energy Strategy August 23, 2018. 6 Please see the Special Focus in the World Bank's January 2018 Global Economic Prospects entitled "With The Benefit of Hindsight: The Impact of the 2014 - 16 Oil Price Collapse," beginning on p. 49. 7 In this simulation, we employ an iterative one-step-ahead forecasting methodology that reduces demand by 100k b/d for every $10/bbl increase in prices. Investment Views and Themes Recommendations Strategic Recommendations Tactical Trades Commodity Prices and Plays Reference Table
Odds Of Oil-Price Spike In 1H19 Rise; 2019 Brent Forecast Lifted $15 To $95/bbl
Odds Of Oil-Price Spike In 1H19 Rise; 2019 Brent Forecast Lifted $15 To $95/bbl
Trades Closed in 2017 Summary of Trades Closed in 2018
Odds Of Oil-Price Spike In 1H19 Rise; 2019 Brent Forecast Lifted $15 To $95/bbl
Odds Of Oil-Price Spike In 1H19 Rise; 2019 Brent Forecast Lifted $15 To $95/bbl
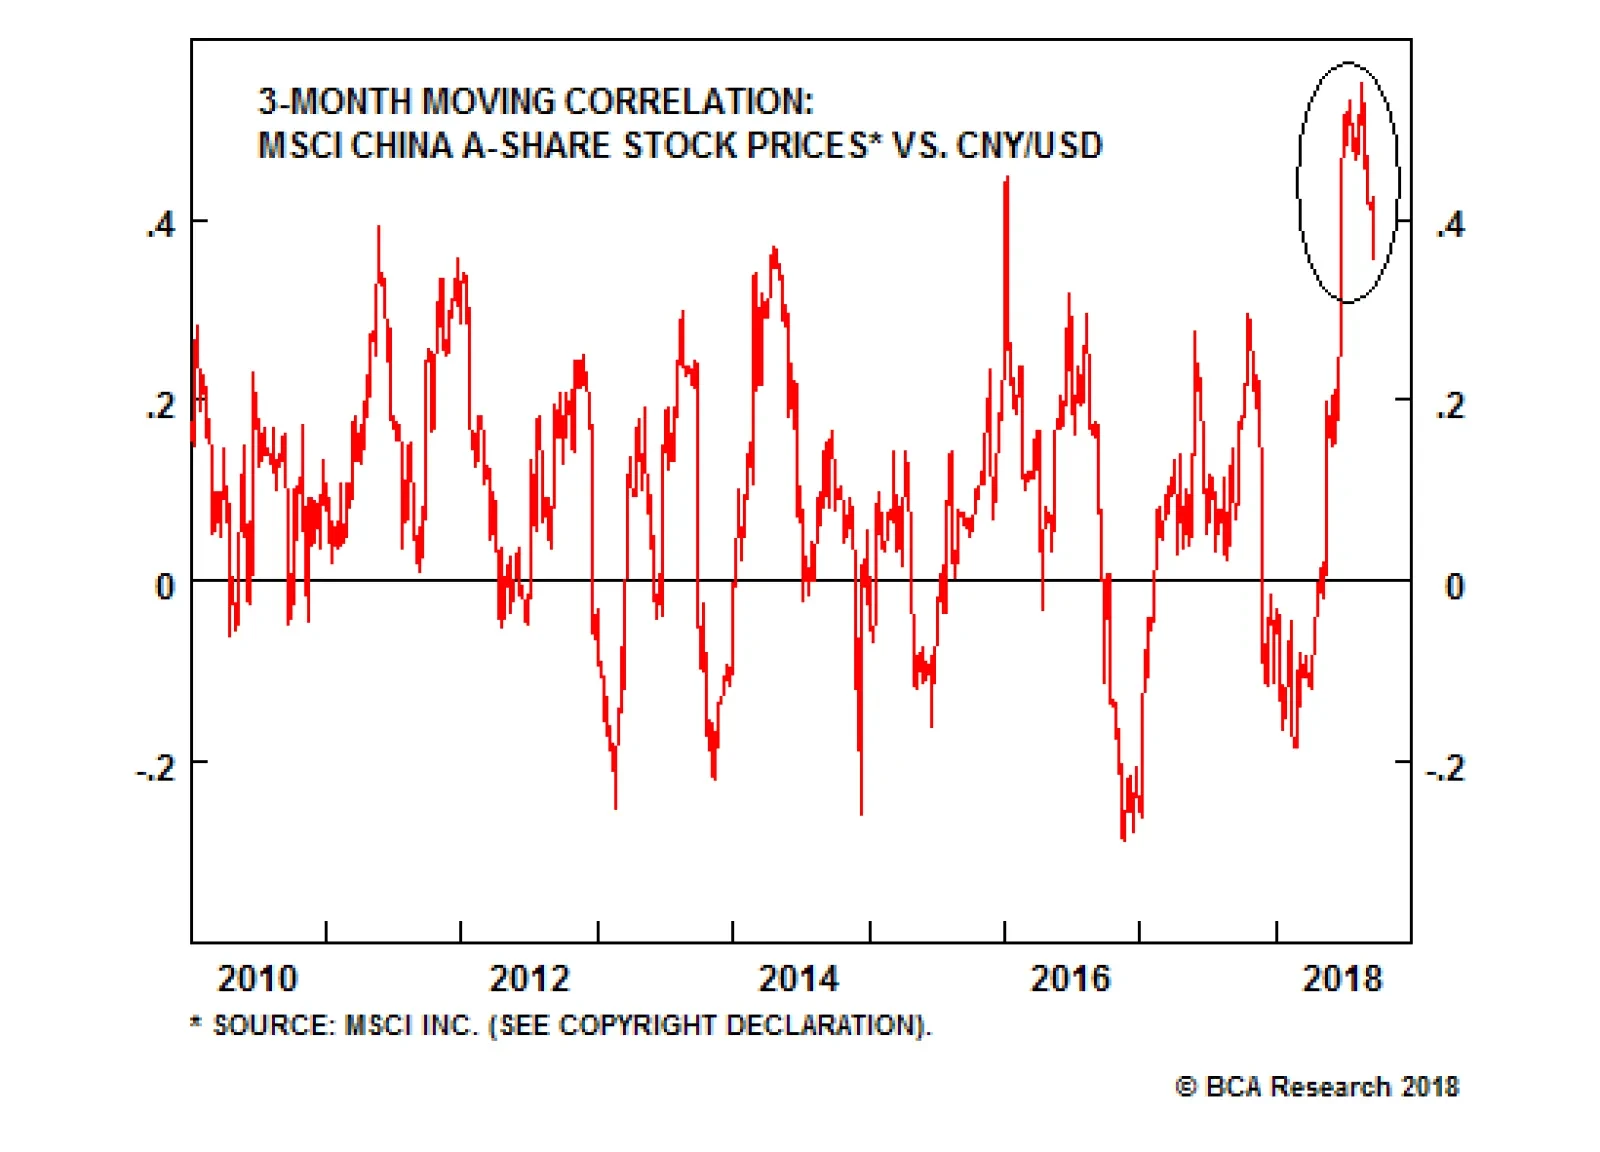
Highlights The Trump administration's decision to effectively tariff the second round of imports at 25% materially raises the odds of another significant uptick in Chinese financial market volatility. Even if China ramps up its stimulus efforts in response, the lesson of the 2014-2016 episode is that investors are likely to wait for earnings clarity before buying stocks aggressively. Stay neutral China, at best, relative to global stocks, and overweight low-beta sectors within the investable equity universe. We have a contrarian view about Chinese corporate bonds, and recommend holding a long but diversified position over the coming 6-12 months. Feature Chart 1The RMB Is Acting As A "Panic Barometer" ##br##For Domestic Stocks
The RMB Is Acting As A "Panic Barometer" For Domestic Stocks
The RMB Is Acting As A "Panic Barometer" For Domestic Stocks
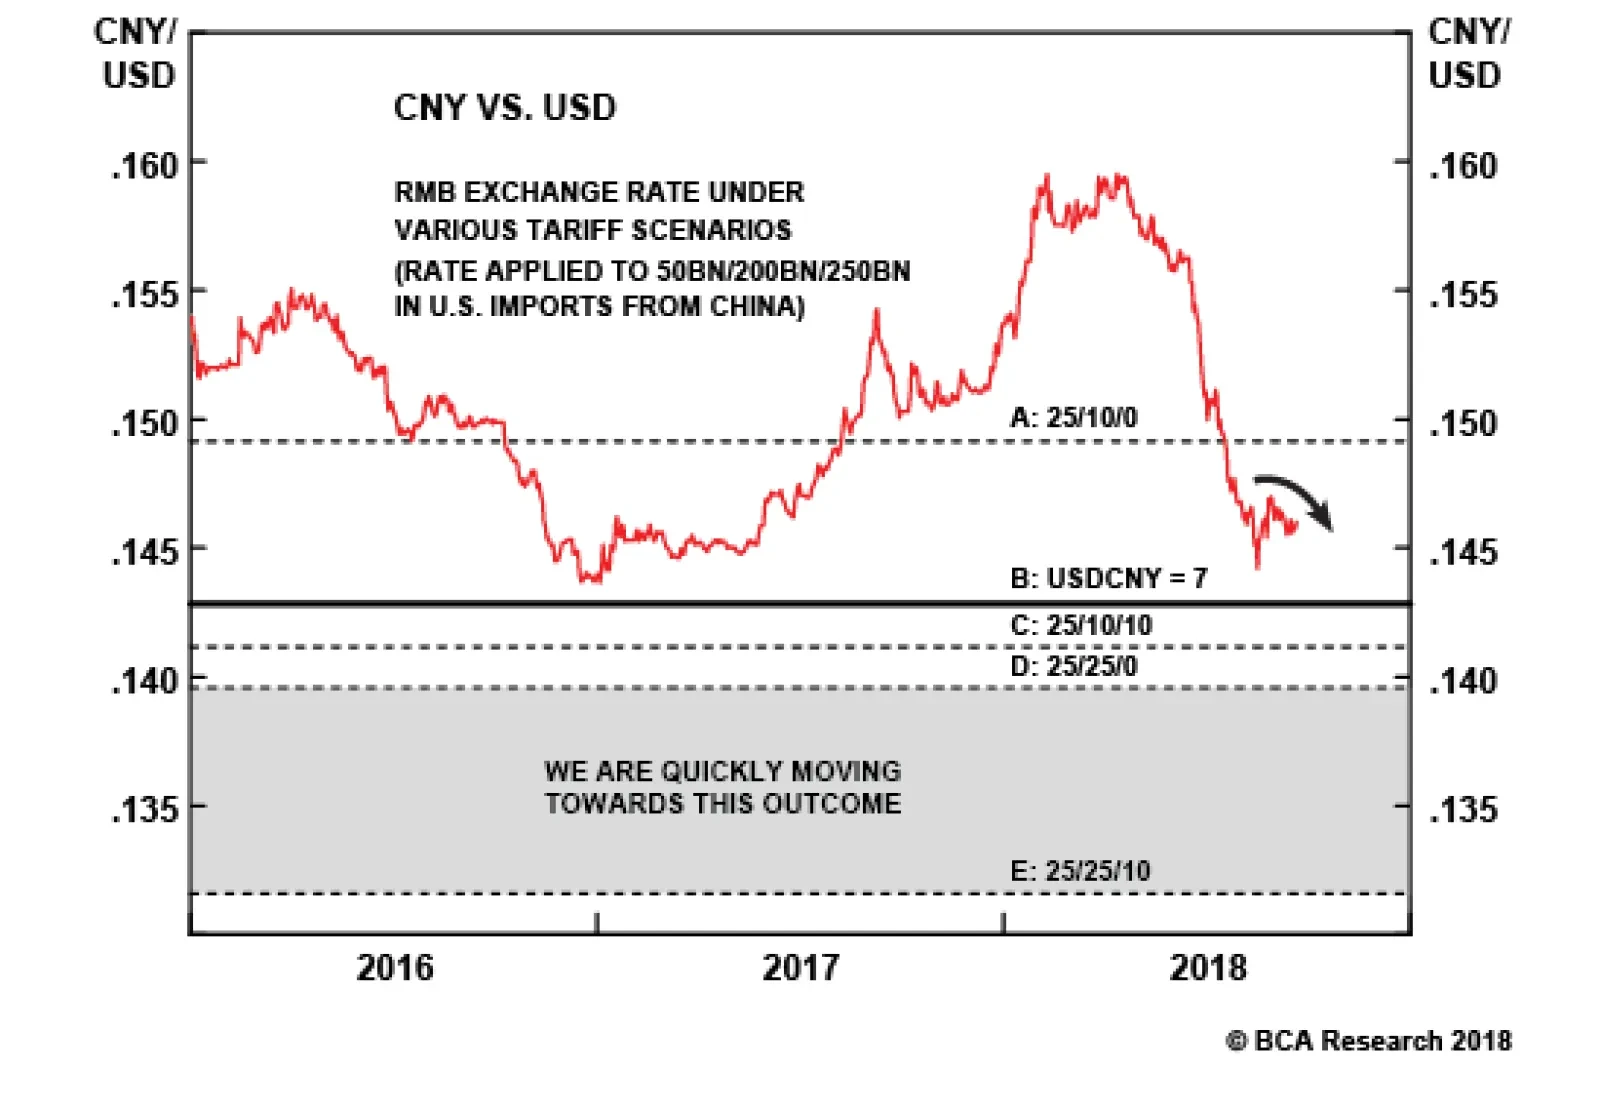
The Trump administration finally announced its decision this week on the second round of tariffs on Chinese imports, essentially applying a 25% rate. While the rate will initially start at 10%, it will rise to 25% by the end of the year, and the administration has threatened to immediately seek public consultation on tariffs on all remaining imports from China if the country retaliates against the second round (which was announced yesterday). With news reports having suggested that China would reject new trade talks merely if the second round moves forward, the prospect of a breakthrough in negotiations seems dim, at best. We have highlighted in past reports that the RMB has acted as a panic barometer for domestic equities (Chart 1), as evidenced by the recent spike in the correlation between the two. During this period, the percent decline in CNY-USD seems to have closely followed the magnitude of proposed tariffs as a percent of Chinese exports to the U.S., as would be implied in a simple open economy model with flexible exchange rates. Based on this framework, Chart 2 suggests that the RMB may come under considerable further market pressure, even if investors only assume a 10% rate on the third round of tariffs. A break above the psychologically-important level of 7 for USD-CNY appears likely barring a major intervention from the PBOC, suggesting that a meaningful uptick in Chinese financial market volatility is forthcoming. Chart 2USDCNY = 7 Is Likely To Be Breached Barring Strong Action From The PBOC
USDCNY = 7 Is Likely To Be Breached Barring Strong Action From The PBOC
USDCNY = 7 Is Likely To Be Breached Barring Strong Action From The PBOC
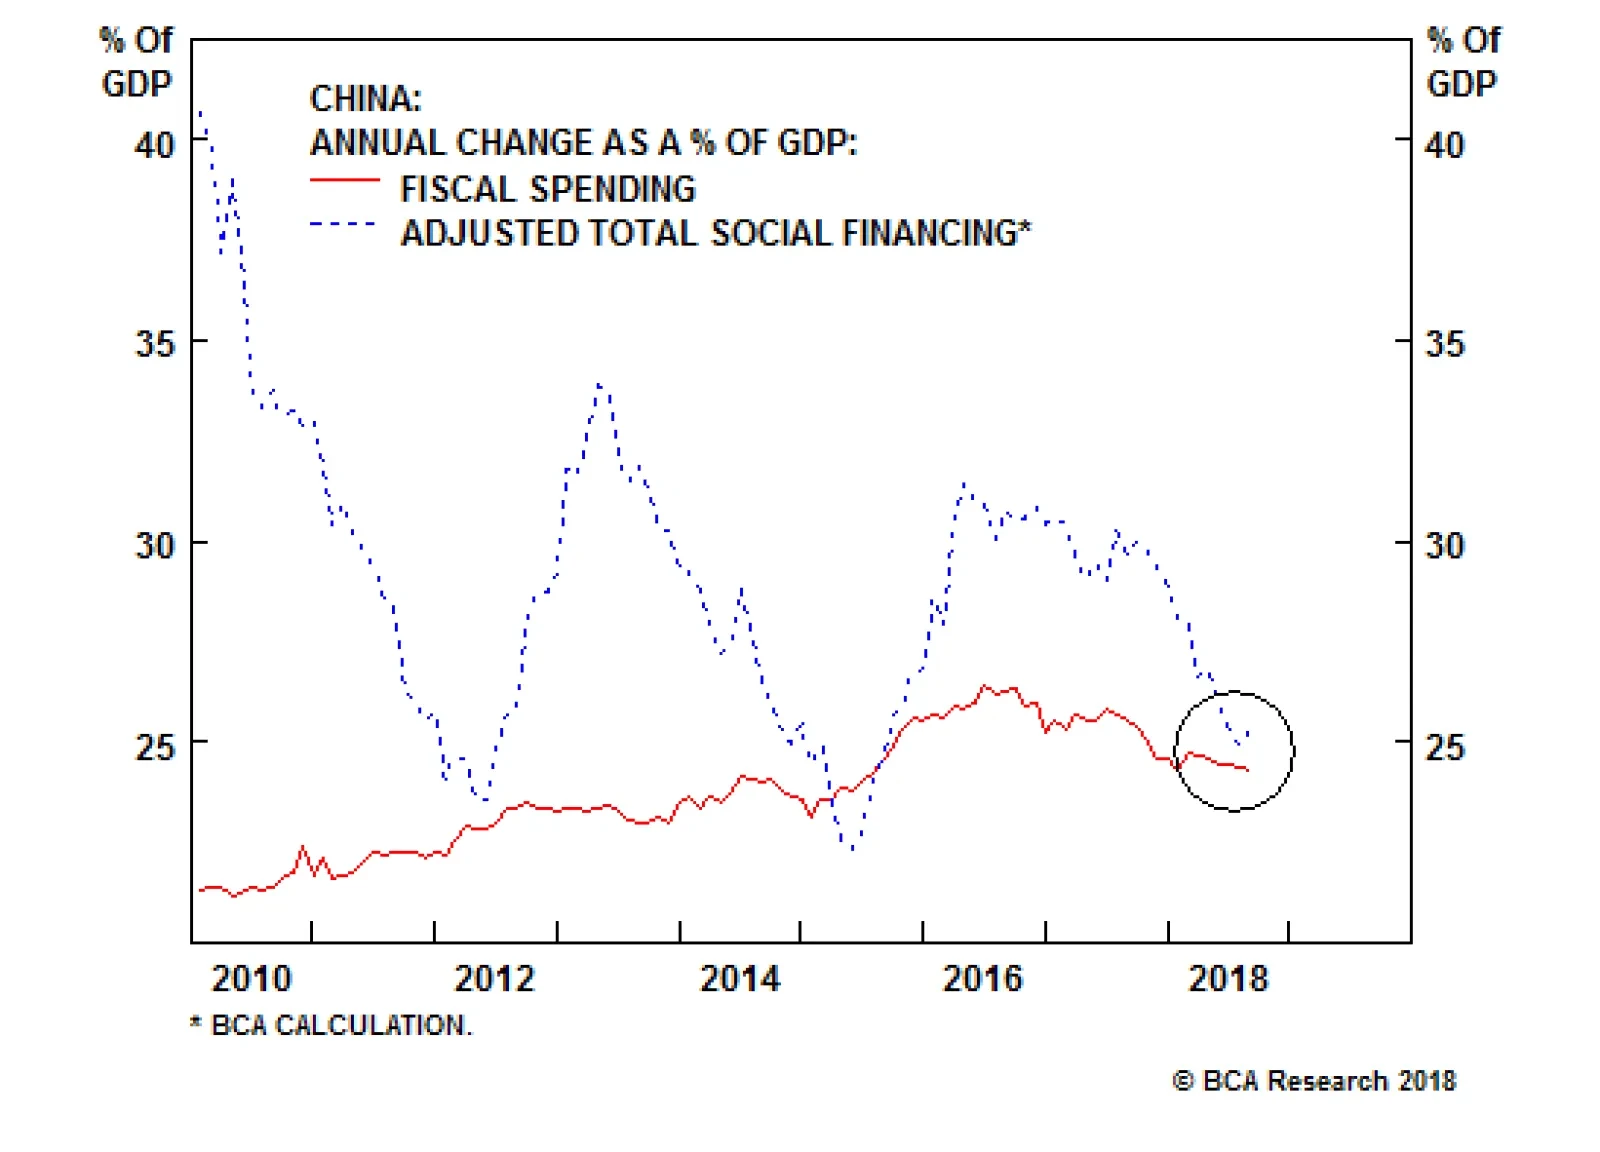
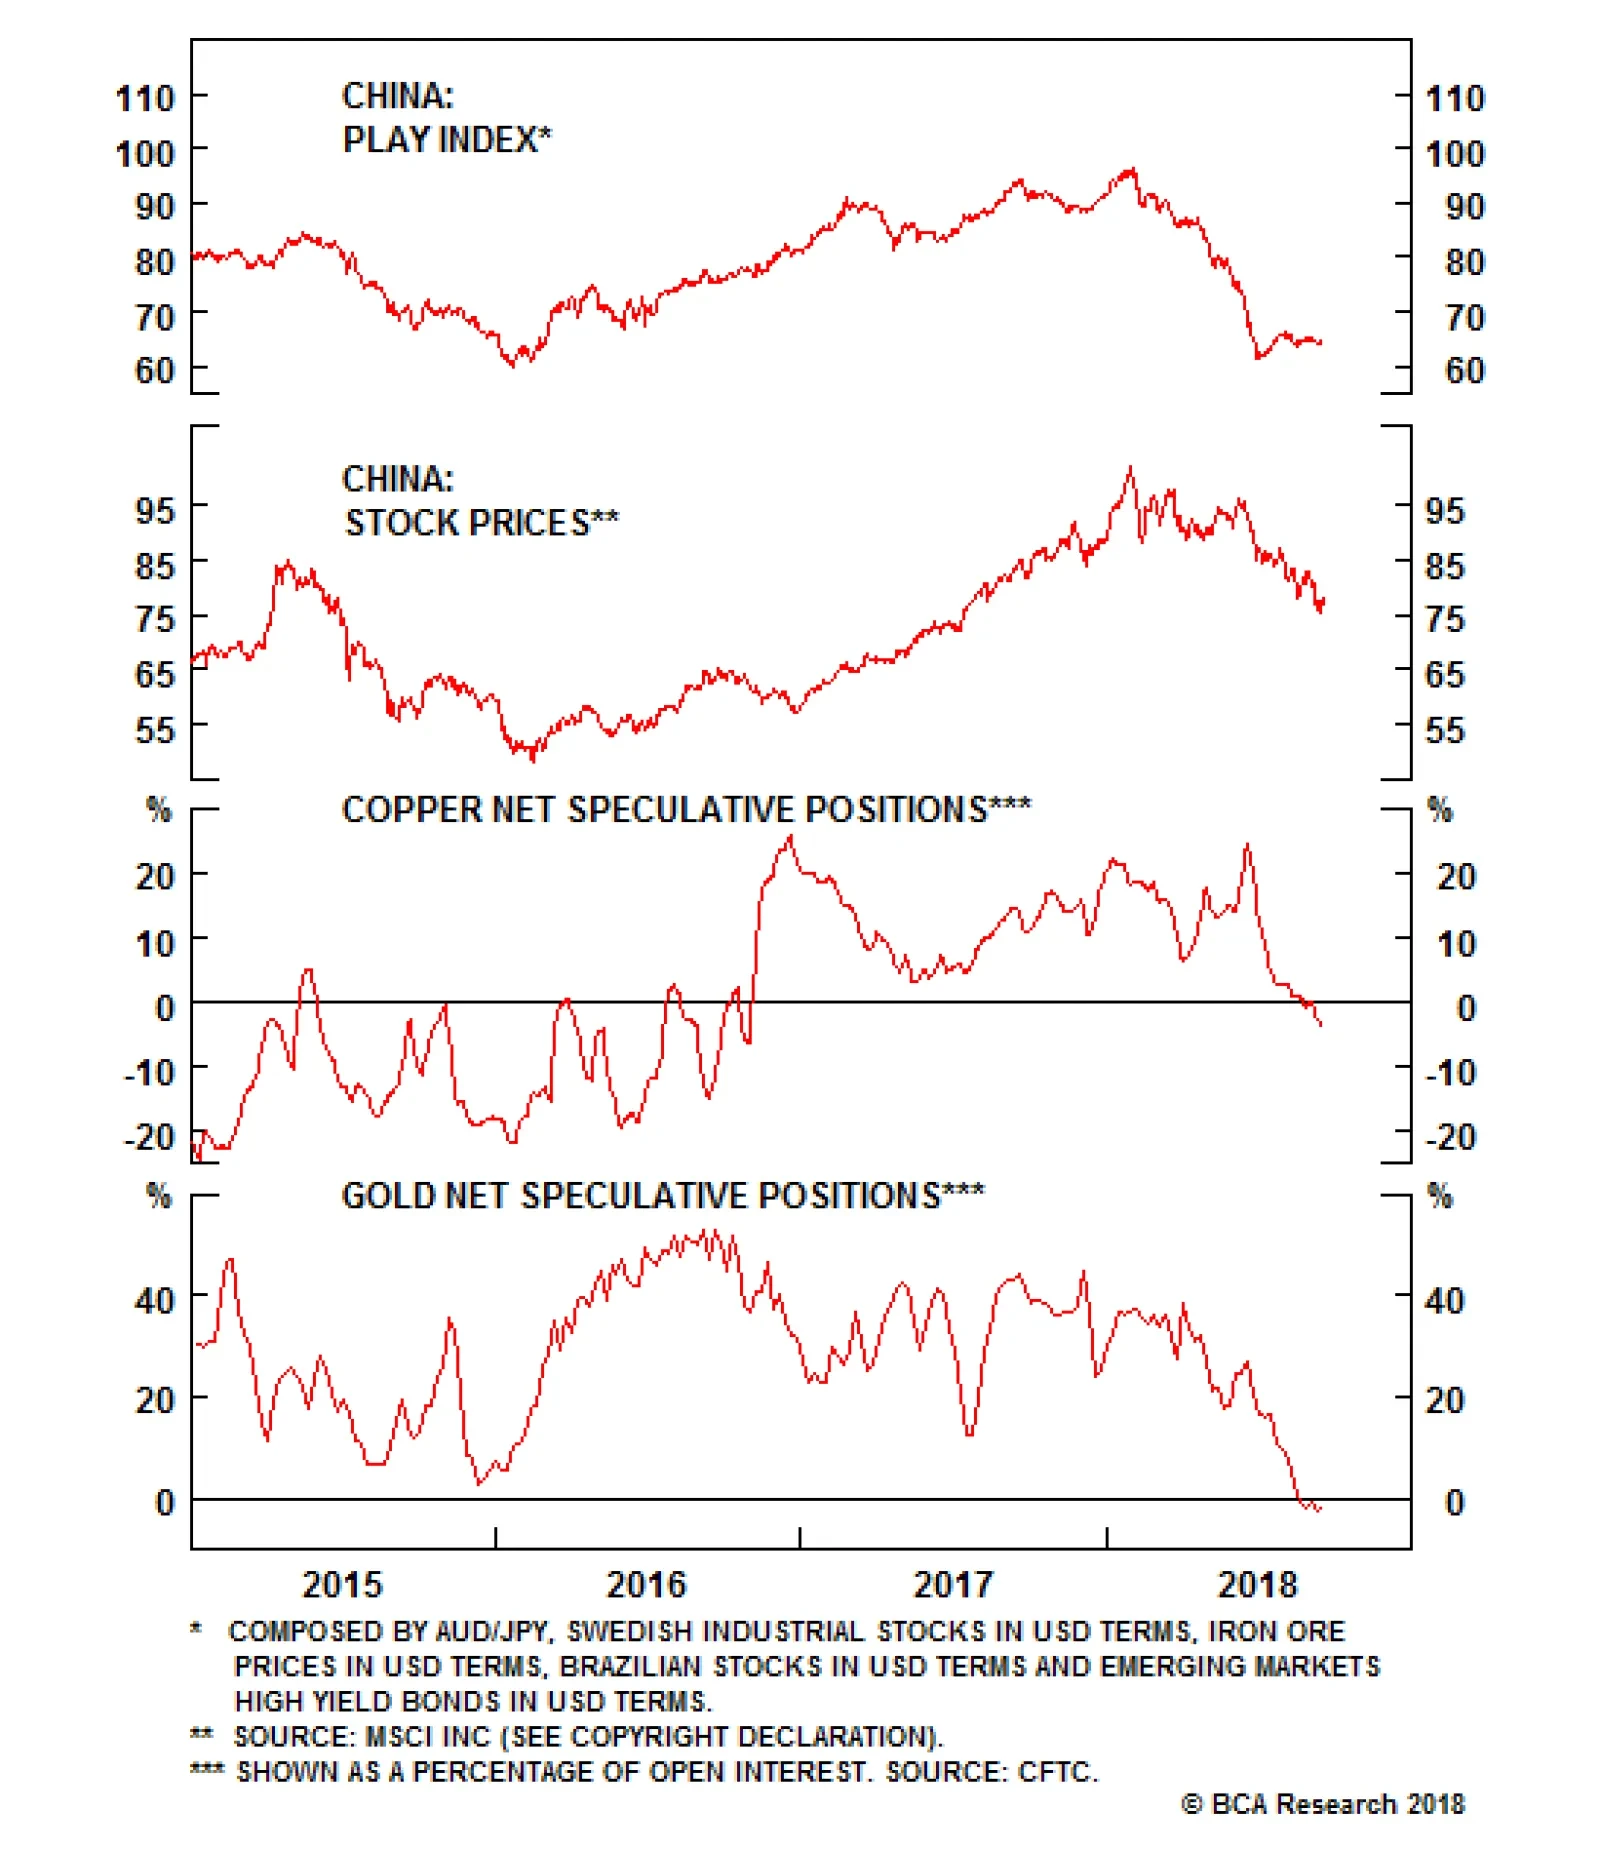
Stimulus To The Rescue? Given that Chinese policymakers have signaled their willingness to stimulate in response to a negative external environment, some investors have argued that China is actually about to enter a mini-cycle upswing. For now, two points suggest that this conclusion is premature: A 10% tariff rate on all remaining imports from China would imply close to $90 billion in tariffs collected, once the second round rate rises to 25%. As noted above, a simple equilibrium exchange rate framework would imply material further weakness in the RMB to counter protectionism of this magnitude. Besides heralding a further selloff in Chinese stocks, this could lead to competitive currency devaluation amongst China's largest trading partners, a "beggar-thy-neighbor" policy that tends to exacerbate rather than alleviate shocks to aggregate demand. As we have noted numerous times over the past year, China's old economy was slowing in the lead up to the U.S./China trade war, and it is not yet clear whether the announced stimulus will generate enough "lift" to convince investors that the low in economic activity is behind them. Chart 3 shows that the August rise in adjusted total social financing as a share of GDP was extremely muted, and that there is no sign yet of a pickup in government spending. Even if China ramps up its stimulus efforts in response to this week's decision from the Trump administration, Chart 4 highlights an important point for investors: there was a considerable lag between a policy response and the low in stock prices during the 2014-2016 episode (a lag that may re-occur today). The chart shows that despite an ongoing depreciation in the RMB and a rebound in our BCA leading indicator for the Li Keqiang index, Chinese stock prices continued to decline for several months. This gap was caused by a lagged decline in earnings, and underscores that investors may ignore the current efforts by policymakers to stabilize the economy until clarity on the stability of earnings presents itself. Chart 3No Sign Yet Of##br## Major Stimulus
No Sign Yet Of Major Stimulus
No Sign Yet Of Major Stimulus
Chart 4History Suggests Investors Need Both ##br##Stimulus And Earnings Clarity
History Suggests Investors Need Both Stimulus And Earnings Clarity
History Suggests Investors Need Both Stimulus And Earnings Clarity
And for now, several signs point to potentially material downside risk for earnings: While the now considerably larger shock from U.S. tariffs has yet to impact the Chinese economy, trailing earnings growth has already peaked and has recently fallen below its trend (Chart 5, panel 1). Despite the recent deceleration in trailing earnings growth and the sharp decline in stock prices, analysts' 12-month forward growth estimates remain quite elevated (Chart 5, panel 2). This suggests that forward earnings could be vulnerable to a decline above and beyond what occurs to trailing earnings, as a full 1/3rd of the increase in the former since late-2015 has been due to very significant shift in growth expectations. The rise in trailing earnings over the past few years appears to be stretched, based the trend in profit margins (Chart 6). The chart highlights that 12-month trailing earnings have well surpassed sales since late-2016, causing margins to rise to their highest level on record and raising the risk of a significant mean-reversion in response to a meaningful economic shock. Net earnings revisions have done a good job at predicting inflection points in forward earnings growth over the past decade, and have recently fallen into negative territory (Chart 7). Chart 5Lofty Earnings Growth Expectations ##br##Are A Risk To Stocks
Lofty Earnings Growth Expectations Are A Risk To Stocks
Lofty Earnings Growth Expectations Are A Risk To Stocks
Chart 6The Earnings Recovery Has Been Partly ##br##Reliant On A Margin Expansion
The Earnings Recovery Has Been Partly Reliant On A Margin Expansion
The Earnings Recovery Has Been Partly Reliant On A Margin Expansion
Chart 7Earnings Revisions Herald ##br##Slowing Earnings Momentum
Earnings Revisions Herald Slowing Earnings Momentum
Earnings Revisions Herald Slowing Earnings Momentum
It is true that some of the above-average levels for profit margins and 12-month forward growth expectations can be explained by the substantial rise in the share of the tech sector in the MSCI China index, whose constituents are significantly more profitable than ex-tech stocks, may have better longer-term growth prospects, and may be more immunized from the trade war with the U.S. Still, Chart 8 illustrates the high earnings hurdle rate for tech stocks over the coming year. Bottom-up analysts continue to expect tech stocks to grow their earnings more than 20% over the next 12 months, despite: Chart 8Are Chinese Tech Stocks Going To Be##br## Able To Grow Earnings 20+%?
Are Chinese Tech Stocks Going To Be Able To Grow Earnings 20+%?
Are Chinese Tech Stocks Going To Be Able To Grow Earnings 20+%?
A poor economic outlook that is likely to impact consumer spending (even if households "outperform" the business sector), and The fact that tech sector net earnings revisions have fallen deeply into negative territory (panel 2). How should investors allocate capital within China in the middle of a trade war with the U.S? First, despite the fact that Chinese stocks have already fallen significantly from their early-January high, it is clearly too early to bottom fish either domestic or investable stocks. Stay neutral China, at best, relative to global stocks. Second, investors should certainly favor low-beta sectors within the Chinese equity universe. Currently, our low-beta equity portfolio includes industrials, telecom services health care, utilities, and consumer staples, but we update the portfolio weights at the end of every month. Third, as discussed below, investors should ignore the very bearish narrative towards Chinese corporate bonds, and hold a long but diversified position over the coming 6-12 months. Bottom Line: The Trump administration's decision to effectively tariff the second round of imports at 25% materially raises the odds of another significant uptick in Chinese financial market volatility. Even if China ramps up its stimulus efforts in response, the lesson of the 2014-2016 episode is that investors are likely to wait for earnings clarity before buying stocks aggressively. Stay neutral China, at best, relative to global stocks, and overweight low-beta sectors within the investable equity universe. Chinese Corporate Bonds: A Contrarian Long Our analysis of the earnings risk facing equities suggests that it is probably still too early to buy Chinese stocks, but in our (contrarian) view there is still one pro-cyclical asset that investors should favor: Chinese corporate bonds. Headlines about defaults in China's corporate bond market continue to appear in the financial press, with concerns most recently focused on low recovery rates of defaulted issues.1 We last wrote about Chinese corporate bonds in June,2 and took a contrarian (i.e. optimistic) stance towards the market. In the meantime, our long China onshore corporate bond trade has continued to gain ground, and an analysis of the inferred credit rating of the market actually strengthens our conviction to stay long. One key element of the bearish narrative towards Chinese corporate bonds is the fact that investment-grade issues in the market are trading like junk. Table 1 highlights that this is largely true: the table presents the spread-inferred credit rating of the four major rating categories of the ChinaBond Corporate Bond Index, and shows that AAA bonds are trading on the border of equivalent maturity investment- and speculative-grade bonds in the U.S. Bonds rates AA+/AA/AA- in China are trading between lower-B and high-CAA, which is firmly in speculative-grade territory. However, in our view market participants are making a mistake when they assume that de-facto junk ratings on Chinese corporate bonds will translate into U.S. junk-style default rates on bonds over the coming 6-12 months (or, frankly, beyond). Chart 9 presents an estimate of the market-implied default rate for the four rating categories shown in Table 1, and suggests that investors are pricing in roughly a 1% default rate for AAA-rated corporate bonds and a 4-5% default rate for AA+/AA/AA-. Table 1Chinese Corporate Bonds Are Trading##br## Like Speculative-Grade Issues
Investing In The Middle Of A Trade War
Investing In The Middle Of A Trade War
Chart 9Allowing Market-Implied Default Rates##br## To Occur Would Be A Huge Policy Error
Allowing Market-Implied Default Rates To Occur Would Be A Huge Policy Error
Allowing Market-Implied Default Rates To Occur Would Be A Huge Policy Error
There are two important factors to consider when gauging the validity of these expectations: Based on Moody's most recent Annual Default Study, the market's current expectations for Chinese corporate bond defaults are actually above the average historical one-year default rates for their inferred credit ratings. Average default rates almost never actually occur over a given 12-month period. Chart 10 highlights that default rates in the U.S. have a binary distribution that is almost entirely determined by whether the economy is in recession (not just slowing down). The late-1980s and the post-2015 environment have been exceptions to this rule, which in large part can be explained by industry-specific events (namely, a surge of energy-sector defaults due to a collapse in the price of oil). But the key point is that investors are likely to overestimate the actual default rate over a given 12 month period when assuming an average historical rate, unless the economy shifts from an expansion to an outright recession over the period. From our perspective, the combination of the market's default expectations and the fact that China is easing suggests an outright long position in Chinese corporate bonds is warranted over the coming year. In our judgement, there is simply no way that policymakers can allow default rates on the order of what is being priced in to occur, as it would constitute an enormous policy mistake that would risk destabilizing the financial system at a time when officials are attempting to counter the looming shock to the export sector. In fact, we doubt that China's typical policy of gradualism when liberalizing its economy and financial markets would allow default rates to rise from 0% to 5% over a year in any economic environment, particularly the current one. As a final point, Chart 11 highlights why a significant rise in the default rate is required in order for investors to lose money on Chinese corporate bonds. The chart shows the 12-month breakeven spread for the ChinaBond AA- Corporate Bond index, unadjusted for default. The breakeven spread represents the rise in yields that would be required for investors to lose money over a 12-month horizon (i.e. the yield change that exactly erases the income return from the position), assuming no defaults. Chart 10"Average" Default Rates ##br##Do Not Really Occur
"Average" Default Rates Do Not Really Occur
"Average" Default Rates Do Not Really Occur
Chart 11A 2% Rise In Yields From Tighter Policy Is Not##br## Going To Occur Over The Coming Year
A 2% Rise In Yields From Tighter Policy Is Not Going To Occur Over The Coming Year
A 2% Rise In Yields From Tighter Policy Is Not Going To Occur Over The Coming Year
The chart shows that AA- bond yields would have to rise approximately 215 bps over the coming year before investors suffer a negative total return, which would be an enormous rise that has a near-zero probability of occurring due of tighter monetary policy. As such, defaults (or the pricing of default risk) remains the only real credible source of potential capital loss from these bonds over the coming year. Our bet, with high conviction, is that holders of Chinese corporate bonds hold a put option that will prevent this from occurring. Bottom Line: Fade investor concerns about rising defaults, and stay long Chinese corporate bonds over the coming 6-12 months. We acknowledge that idiosyncratic risk is likely to be elevated for this asset class, and we recommend that investors take a diversified, portfolio approach when investing in China's corporate bond market. Jonathan LaBerge, CFA, Vice President Special Reports jonathanl@bcaresearch.com 1 For example, please see "In China, Less Than 20% Defaulted Bonds Have Been Paid Back" by Bloomberg News, August 27, 2018 2 Pease see China Investment Strategy Weekly Report "A Shaky Ladder", dated June 13, 2018, available at cis.bcaresearch.com. Cyclical Investment Stance Equity Sector Recommendations
Our Daily Meeting provides an amazing forum for intellectual exchanges and deep discussions on the macro outlook, how markets are behaving, and where we could be wrong as strategists. A frequent topic of discussion over the past month has been the potential…
Our Emerging Market Strategy team has the following observations. The peso is about 40% below its real effective exchange rate fair value based on consumer and producer prices. Based on past devaluation episodes, there could be another 15% downside for the…

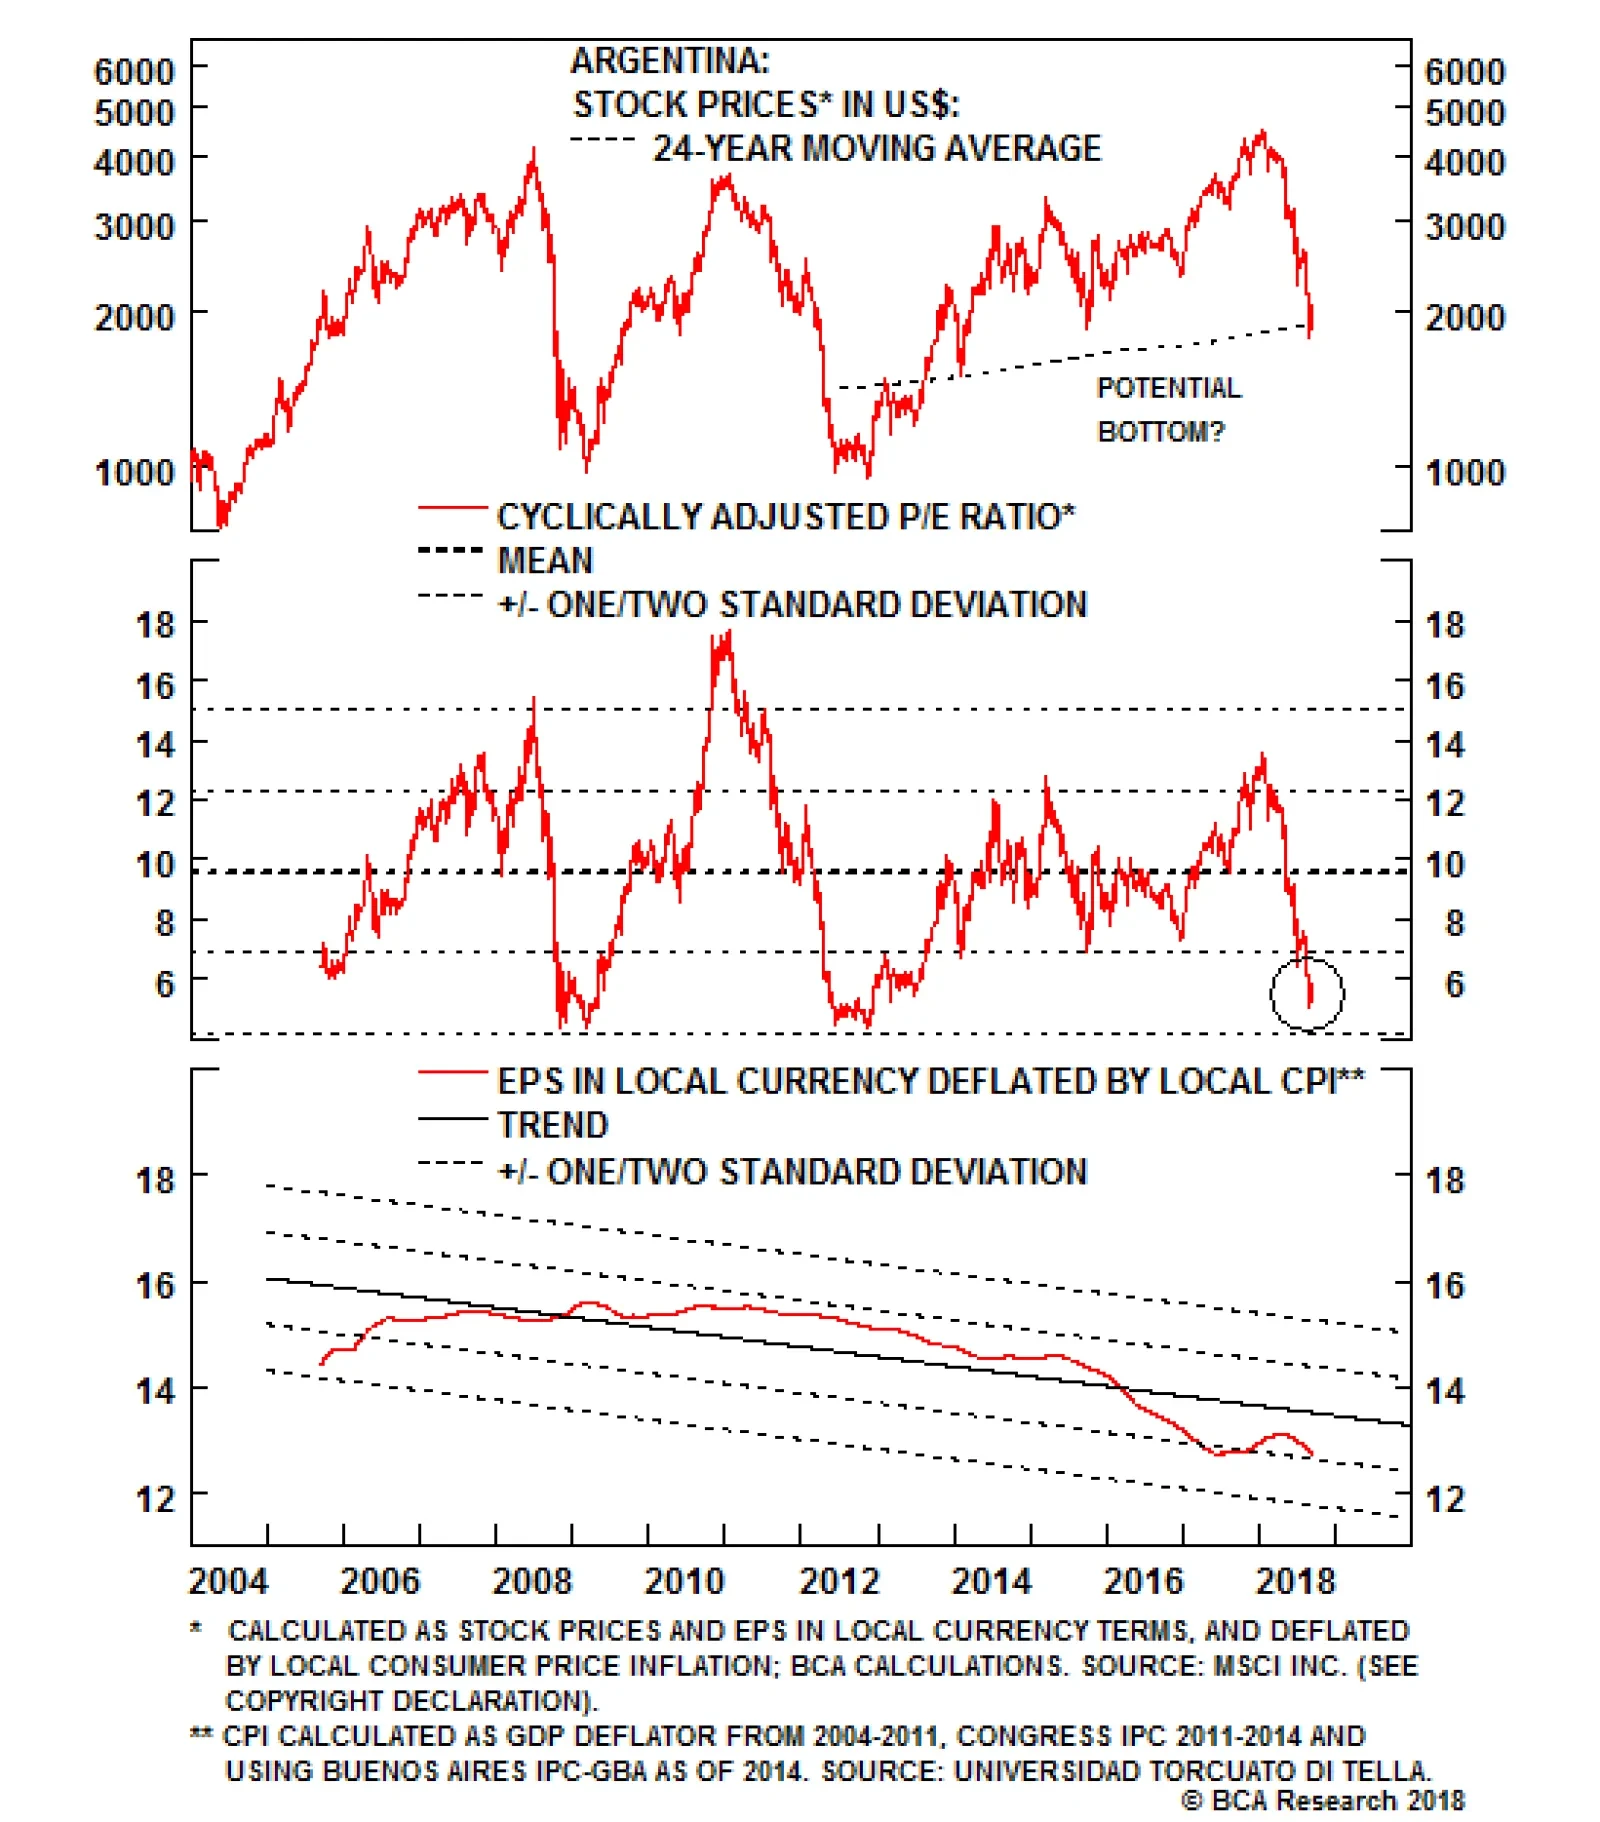
The massive underperformance of Argentine assets in 2018 shows that investors are intensely asking if the country is heading toward another sovereign default. This is a valid question, given that Argentina's foreign currency public debt stands at $220…