Equipment & Services
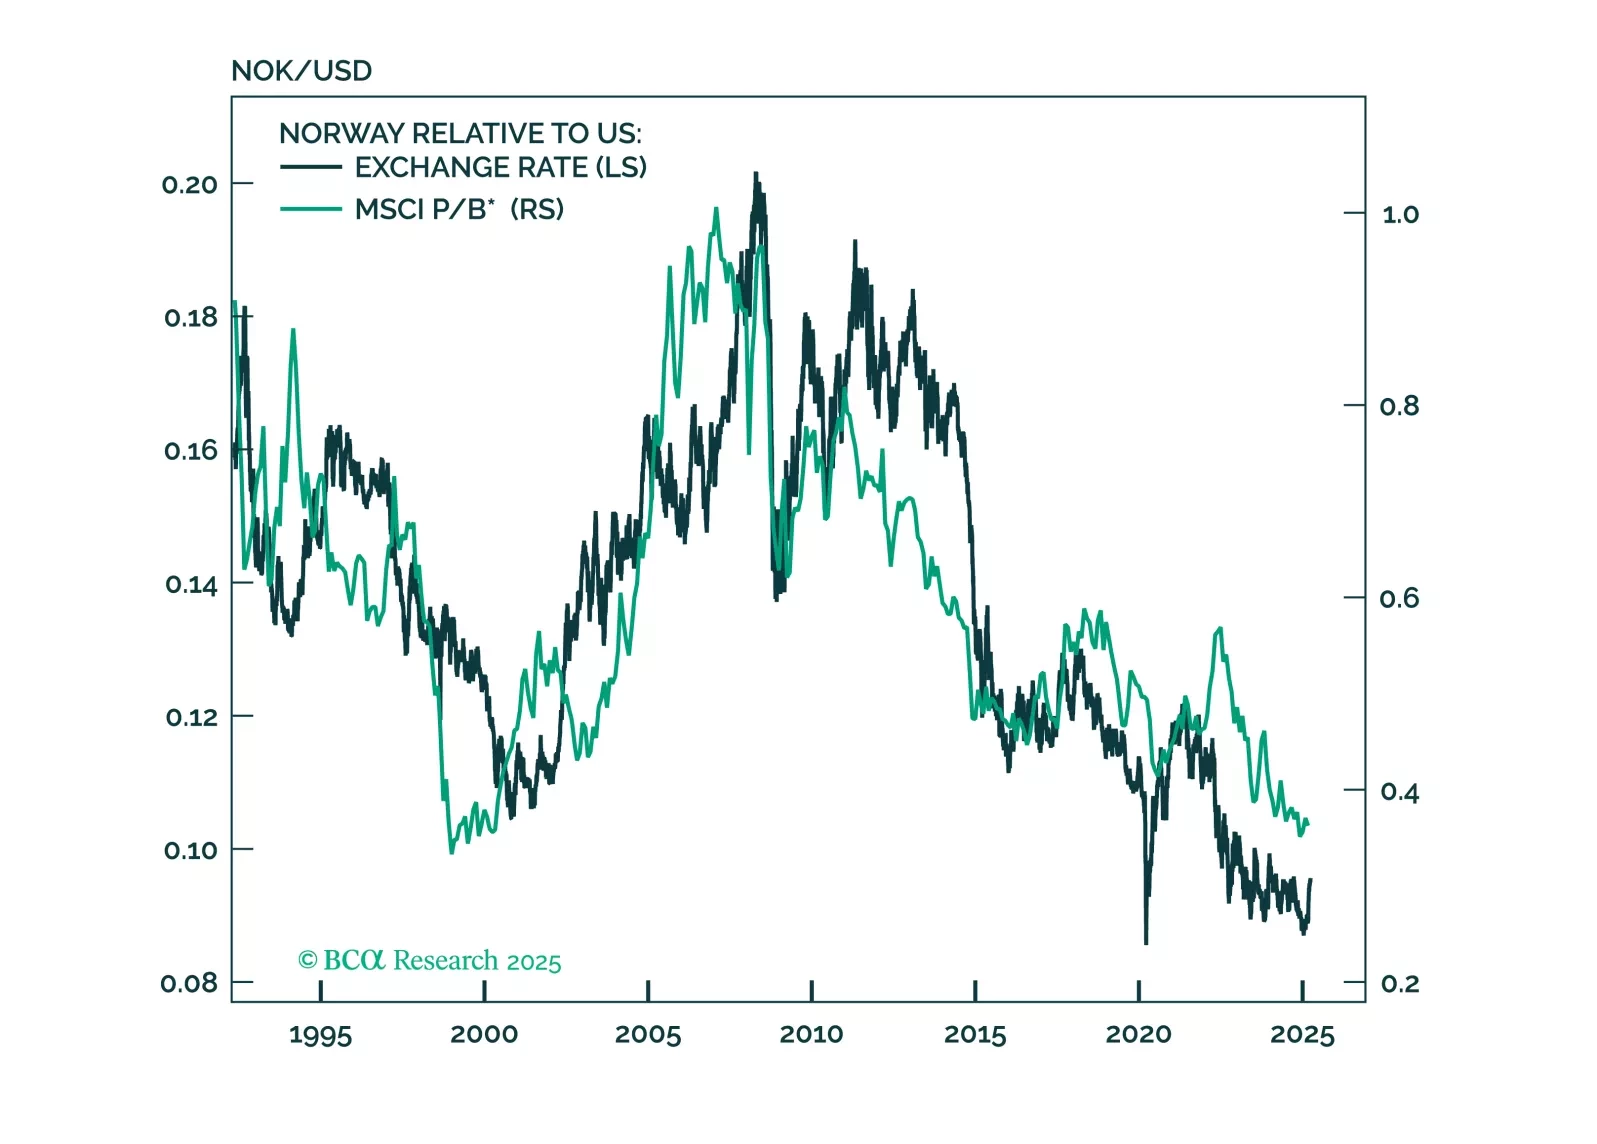
This report looks at investment implications, for Norwegian assets, given the recent meeting, from the Norges Bank.

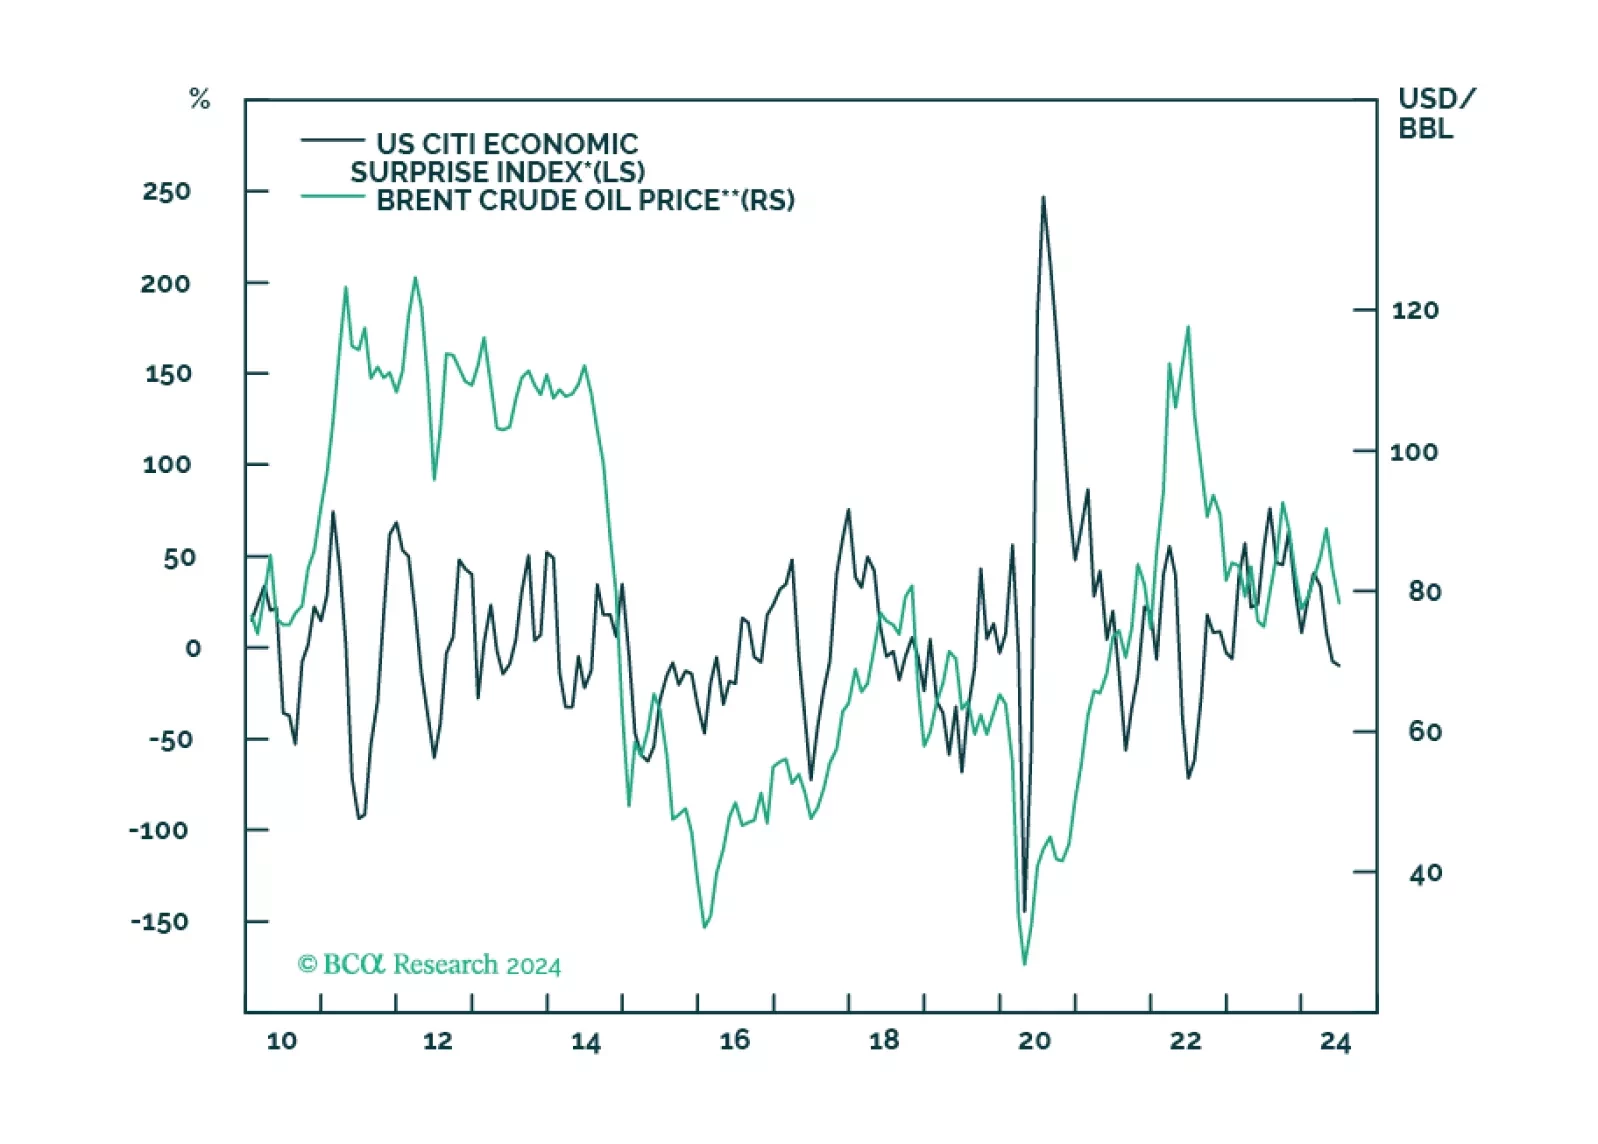
The decline in oil prices accelerated this month. Although Wednesday’s moves reversed Tuesday’s sharp daily declines, Brent and WTI have fallen 11% and 10% so far in September, and 30% and 33% from their April peaks. Deteriorating demand likely drove these…
According to BCA Research’s Commodity & Energy Strategy service, oil markets are caught in a tug-of-war that has kept oil prices in a trading range since H2 2023. Bearish demand concerns are enforcing an upper limit on the price of crude while bullish…
European regulatory carbon credits (EUAs) are becoming increasingly investable as an asset class. In a Special Report published last September, our Global Investment strategists agreed to the strategic bull case for EUAs, but highlighted a bearish view on…
We close our overweights to Energy and Aerospace & Defense. The macroeconomic backdrop is deteriorating for Energy. As for A&D, the good news is already priced in.

China’s oil demand growth will moderate to a still robust 4%-6% in the next six-to-nine months. We recommend that investors in China’s onshore and offshore stock indexes overweight energy producers.
Highlights Alternative energy is priced to deliver spectacular long-term earnings growth, but this will be a very tough ask. While alternative energy will take a greater share of the energy pie, the pie itself is shrinking, as is its price. At its current valuation, alternative energy does not meet the conditions to be in a long-term investment portfolio. As the Ethereum network becomes the ‘go to’ place to implement and execute smart contracts or decentralised finance, such services will have to be paid in ETH giving the token an economic value. ETH should certainly form a small part of a long-term investment portfolio. A near-term combination of valuation and technical constraints means that stocks will struggle to outperform ultra-long bonds. Fractal analysis: India versus China. Feature Chart of the WeekThe World Is Using Much Less Energy Per Unit Of Economic Output Alternative Energy Blues Alternative energy is the meme theme of the moment. Hardly a day passes without some exhortation to save the planet, by substituting fossil fuels with cleaner forms of energy. Yet this year, alternative energy stocks have performed dismally. Since January, the sector is down 30 percent in absolute terms, and almost 40 percent versus the broad market. Begging the question, how can one of the biggest themes of the moment be one of the worst investment performers? Last year, the forward earnings of the alternative energy sector rose by 35 percent, helped by post-pandemic stimulus measures that targeted the clean energy industry. But as investors fell in love with this meme theme, the bigger story was that the valuation paid for the sector skyrocketed from 13 times forward earnings to a nosebleed 42 times, an increase of 220 percent (Chart I-2 and Chart I-3). Chart I-2Alternative Energy Earnings Rose... Chart I-3...But The Valuation Skyrocketed To put the 42 into context, the peak multiple of the tech sector has reached ‘only’ 29 this cycle, meaning that alternative energy was trading at a near 50 percent premium even to the daddy of growth sectors! This year, as investors have pared back the nosebleed valuation, the alternative energy sector has underperformed. Nevertheless, it is still trading at a 25 percent premium to tech, meaning that its profits will have to deliver spectacular long-term growth to justify the sky-high valuation. Is this likely? We are not convinced. The world is using less energy per unit of economic output. A fundamental rule of long-term investment is that you shouldn’t own any sector whose sales are shrinking as a share of the economy. The problem for alternative energy is that it is, ultimately, energy (Chart I-4). And the world is using less energy per unit of economic output. Chart I-4Alternative Energy And Traditional Energy Show Similar Earnings Profiles In 1995, every $1000 of real GDP used 157 kilograms of oil equivalent energy. Today, that has plunged to 109 kilograms. Meaning that over the past 25 years, the world economy has reduced its energy intensity by 30 percent.1 And the downtrend persists (Chart I-1). Granted, over the past 25 years, the share of the energy pie taken by non-fossil fuels has increased from 13.4 to 16.9 percent, of which renewables have increased from 0.6 to 5.7 percent. But the marginal prices of wind, solar, and geothermal power generation are collapsing. As a recent report from the International Renewable Energy Agency (IRENA) points out: Generation costs for onshore wind and solar photovoltaics (PV) have fallen between 3 percent and 16 percent yearly since 2010 – far faster than anything in our shopping baskets or household budgets… (and) auction results show these favourable cost trends continuing through the 2020s.2 Given that the alternative energy market is competitive rather than monopolistic or oligopolistic, a large part of these massive cost savings will be passed on to end-users. Constituting a long-term boon to consumers rather than to alternative energy profits. To repeat, with the alternative energy sector still trading at a 25 percent premium to tech, it must deliver spectacular long-term earnings growth. But this will be a very tough ask. Energy sector profits tightly track the value of energy produced, meaning volume times price (Chart I-5). The risk is that while alternative energy will take a greater share of the energy pie, the pie itself is shrinking, as is its price. Chart I-5Energy Sector Profits Tightly Track The Value Of Energy Produced (Volume Times Price) We conclude that with an ambiguous outlook for long-term earnings growth, alternative energy does not meet the conditions to be in a long-term investment portfolio at its still nosebleed valuation multiple of 32 times forward earnings. Now let’s turn to an investment that you should have in a long-term investment portfolio. The London Hard Fork Is A Boon For The Ethereum Network The Ethereum network’s London hard fork – an event that passed under most radar screens – marks the shape of things to come for the blockchain and the cryptocurrency space. Crucially, it signals an ongoing sea-change that favours the Ethereum network’s users at the expense of its cryptocurrency miners. For those interested in the nerdy details, we direct you to Ethereum Improvement Protocol (EIP) 1559. But to cut to the chase, the fork has drastically reduced the profitability of Ethereum mining while “ensuring that only ETH can ever be used to pay for transactions on Ethereum, cementing the economic value of ETH within the Ethereum platform.” Only ETH can ever be used to pay for transactions on Ethereum, cementing the economic value of ETH within the Ethereum platform. The statements of intent address, and will ultimately alleviate, two of the biggest investment concerns about cryptocurrencies – first, that cryptocurrency mining is a prodigious user of energy, particularly dirty energy; and second, that as cryptocurrencies cannot be readily exchanged for goods and services, they have no value other than that from other investors believing they have value. Addressing the first concern, mining becomes irrelevant if the blockchain users employ the skin in the game ‘proof-of-stake’ protocol to validate transactions rather than the energy-intensive ‘proof-of-work’ protocol that relies on external miners. Which is where Ethereum is headed with the fully proof-of-stake Ethereum 2.0. Addressing the second concern, if the Ethereum network becomes the ‘go to’ place to implement and execute smart contracts or decentralised finance, then such services will have to be paid in ETH, giving the tokens an economic value. Hence, the key structural question is, which blockchain networks will become the go to places for decentralised intermediation? Ethereum is an excellent candidate. Note that the lending arm of the EU, the European Investment Bank, has effectively endorsed the Ethereum network by issuing a €100 million digital bond on it. And although the principal “is expected to be repaid in euros”, the intermediators get paid in ETH. Crucially, the token of a successful blockchain network will become the de-facto currency of the network, exchangeable for intermediation services on that network. With a value independent of speculative investments, investors can also justifiably own these tokens as a ‘digital gold.’ Clearly, cryptocurrencies experience a higher volatility than gold, but this can be adjusted through position sizing. To equalise drawdowns in digital gold versus gold, investors should own $1 of cryptocurrency for every $3 of gold (Chart I-6). On this relative risk basis, cryptocurrencies should constitute at least one quarter ($3.8 trillion) of the $15 trillion ‘anti-fiat’ market that gold currently dominates. Chart I-6Cryptocurrency Drawdowns Are Becoming Less Severe Therefore, if Ethereum became the dominant cryptocurrency based on its network size, it would command a market capitalisation of at least $1.9 trillion, a more than five-fold increase from today. ETH should certainly form a small part of a long-term investment portfolio. Stocks Versus Bonds Face A Double Constraint Since mid-March the world stock market (MSCI All Country World Index) has rallied by 10 percent, but the ultra-long bond (30-year T-bond) has done even better, rallying by 14 percent. Hence stocks to bonds have drifted gently lower, for which there are two reasons. First, the valuation of the most highly-rated parts of the stock market have reached the limit that has held in the post-GFC era. Specifically, tech’s earnings yield premium versus the 10-year T-bond has reached its 2.5 percent lower bound (Chart I-7). Chart I-7Tech Reached Its Post-GFC Valuation Limit Versus Bond Yields Second, the groupthink in overweighting stocks versus bonds reached an extreme. All investors up to 260-day investment horizons are already in the trade, and this level of extreme groupthink correctly signalled stocks versus bonds major-tops in 2010 and 2013 (as well as major-bottoms in 2008 and 2020) (Chart I-8). Chart I-8The Groupthink In Overweighting Stocks Versus Bonds Reached An Extreme This near-term combination of valuation and technical constraints means that stocks will struggle to outperform ultra-long bonds. In the near term, stocks will struggle to outperform ultra-long bonds. Nevertheless, if bonds rally, it will support stocks. But if bonds sell off, it will undermine stocks. The implication of the above is that a bond sell-off – should it even occur – will be self-limiting. As we explained last week in Stocks, Not The Economy, Will Set The Upper Limit To Bond Yields, the upper limit to the 10-year T-bond yield is 1.8 percent. India Trading At A Precarious Premium This week’s fractal analysis highlights that the spectacular outperformance of India versus China has reached the limit of fragility on its 260-day fractal structure that marked previous major-tops in 2014, 2016, and 2019 (as well as major bottoms in 2015, 2018, and 2020) (Chart I-9). Chart I-9The Outperformance Of India Versus China Is Fragile In effect, as China’s tech sector has recently corrected, tech stocks in India are now trading at a precarious 60 percent premium to those in China (Chart I-10). Chart I-10India Is Trading At A Precarious Premium To China The recommended trade is to short India versus China (MSCI indexes), setting the profit target and symmetrical stop-loss at 19 percent. Dhaval Joshi Chief Strategist dhaval@bcaresearch.com Footnotes 1 Source: World Bank, and BP Statistical Review of World Energy 2021 2 Source: Renewable Power Generation Costs In 2019, International Renewable Energy Agency Fractal Trading System Fractal Trades 6-Month Recommendations Structural Recommendations Closed Fractal Trades Closed Trades Asset Performance Equity Market Performance Indicators To Watch - Bond Yields Chart II-1Indicators To Watch - Bond Yields ##br##- Euro Area Chart II-2Indicators To Watch - Bond Yields ##br##- Europe Ex Euro Area Chart II-3Indicators To Watch - Bond Yields ##br##- Asia Chart II-4Indicators To Watch - Bond Yields ##br##- Other Developed Indicators To Watch - Interest Rate Expectations Chart II-5Indicators To Watch - Interest Rate Expectations Chart II-6Indicators To Watch - Interest Rate Expectations Chart II-7Indicators To Watch - Interest Rate Expectations Chart II-8Indicators To Watch - Interest Rate Expectations
Highlights Higher copper prices will follow in the wake of China's surge in steel demand, which lifted Shanghai steel futures to an all-time high just under 5,200 RMB/MT earlier this month, as building and infrastructure projects are completed this year (Chart of the Week). Copper will register physical deficits this year and next, which will pull inventories even lower and will push demand for copper scrap up in China and globally. High and rising copper prices could prompt government officials to release some of China's massive state holdings of copper – believed to total some 2mm MT – if the current round of market jawboning fails to restrain demand and price increases. Strong steel margins and another round of environmental restraints on mills are boosting demand for high-grade iron ore (65% Fe), which hit a record high of just under $223/MT earlier this week. Benchmark iron ore prices (62% Fe) traded at 10-year highs this week, just a touch below $190/MT. We are lifting our copper price forecast for December 2021 to $5.00/lb from $4.50/lb. In addition, we are getting long 2022 CME/COMEX copper vs short 2023 CME/COMEX copper at tonight's close, expecting steeper backwardation. Feature Government-mandated reductions of up to 30% in steel mill operations for the rest of the year in China's Tangshan steel hub to reduce pollution will tighten an already-tight market responding to a construction and infrastructure boom (Chart 2). This boom triggered a surge in steel prices, and, perforce, in iron ore prices (Chart 3). As it has in the past, this sets the stage for the next leg of copper's bull run. Chart of the WeekSurging Steel Presages Stronger Copper Prices In our modeling, we have found a strong relationship between steel prices, particularly for reinforcing bar (rebar), and copper prices, as can be seen in the Chart of the Week. Steel goes into building and infrastructure projects at the front end (in the concrete that is reinforced by steel and in rolled coil products), and then copper goes into the completed project (in the form of wires or pipes). Chart 2Copper Bull Market Will Continue In addition to the building and construction boom, continued gains in manufacturing will provide a tailwind for copper prices, which will be augmented by the global recovery in activity 2H21. Chart 4 shows the relationship between nominal GDP levels and copper prices. What's important here is economic growth in Asia (including China) and ex-Asia is, unsurprisingly, cointegrated with copper prices – i.e., economic growth and industrial commodities share a long-term equilibrium, which explains their co-movement. Chart 3Steel Boom Lifts Iron Ore Prices Media reports tend to focus on the effects of Chinese government spending as a share of GDP – e.g., total social financing relative to GDP – to the exclusion of the economic, particularly when trying to explain commodity price movements. To the extent the Chinese government is successful in further expanding the private sector – on the goods and services sides – organic economic growth will become even more important in explaining Chinese commodity demand. Chart 4Global Economic Grwoth Will Boost Copper Prices In our copper modeling, we find copper prices to be cointegrated with nominal Chinese GDP, EM Asian GDP and EM ex-Asian GDP, along with steel and iron ore prices, which, from a pure economics point of view, is what would be expected. On the other hand, there is no cointegration – i.e., no economic co-movement or a shared trend – between these industrial commodity prices and total social financing as a percent of nominal China GDP. These models allow us to avoid spurious relationships, which offer no help in explaining or forecasting these copper prices. Chart 5Iron Ore, Copper Demand Will Lift With The "Green Energy" Buildout Chart 6Renewables Dominate Incremental New Generation Longer term, as we have written in past research reports, the transition to a low-carbon energy mix favoring distributed renewable electricity generation, more resilient grids and electric vehicles (EVs) will be a major source of demand growth for bulks like iron ore and steel, and base metals, particularly copper (Chart 5).1 Already, renewable generation represents the highest-growth segment of incremental power generation being added to the global grid (Chart 6). Copper Supply Growth Requires Higher Prices Copper supply will have a difficult time accommodating demand in the short term (to end-2022) when, for the most part, the buildout in renewables and EVs will only be getting started. This means that over the medium (to end-2025) and the long terms (2050) significant new supply will have to be developed to meet demand. In the short term, the supply side of refined copper – particularly the semi-refined form of the metal smelters purify into a useable input for manufactured products (condensates) – is running extremely low, as can be seen in the longer-term collapse of Treatment Charges and Refining Charges (TC/RC) at Chinese smelters (Chart 7). At ~ $22/MT last week, these charges were the lowest since the benchmark TC/RC index tracking these charges in China was launched in 2013, according to reuters.com.2 Chart 7Copper TCRCs Fall As Supplies Fall, Pushing Prices Higher The copper supply story also can be seen in Chart 8, which converts annual supply and demand into balances, which will be mediated by the storage market. The International Copper Study Group (ICSG) estimates mine output again registered flat year-on-year growth last year, while refined copper supplies were up a scant 1.5% y/y. Chart 8Physical Deficits Will Draw Copper Stocks... Consumption was up 2.2%, according to the ICSG's estimates, which expects a physical deficit this year of 456k MT, after adjusting for Chinese bonded warehouse stocks. This will mark the fourth year in a row the copper market has been in a physical deficit, which, since 2017, has averaged 414k MT. The net result of this means inventories will once again be relied on to fill in supply gaps, and global stockpiles, which are down ~25% y/y, and will continue to fall (Chart 9). With mining capex weak and copper ore quality falling, higher prices will be required to incentivize significant new investment in production (Chart 10). However, the lead time on these projects is five years in the best of circumstances, which means miners have to get projects sanctioned with final investment decisions made in the near future (Chart 11). Chart 9...Which After Four Years Of Physical Deficits Are Low Chart 10Higher Copper Prices Required To Reverse Weak Capex, Falling Ore Quality Chart 11Falling Lead Times To Bring New Mines Online, But Time Is Short Investment Implications Our focus on copper is driven by the simple fact that it spans all renewable technologies and will be critical for EVs as well, particularly if there is widespread adoption of this technology (Chart 12). We continue to expect copper supply challenges across the short-, medium- and long-term investment horizons. To cover the short term, we recommended going long December 2021 copper on 10 September 2020, and this position is up 39.2%. To cover the longer term, we are long the S&P Global GSCI commodity index and the iShares GSCI Commodity Dynamic Roll Strategy ETF (COMT), recommended 7 December 2017 and 12 March 2021 , respectively, which are down 2.3% and 0.8%. Chart 12Widespread EV Uptake Will Create All New Copper Demand At tonight's close, we will cover the medium-term opportunity of the copper supply-demand story developed above by getting long the 2022 CME/COMEX copper futures strip and short 2023 CME/COMEX copper futures strip, given our expectation the continued tightening of the market will force inventories to draw, leading to a steeper backwardation in the copper forward curve. The principal risks to our short-, medium- and long-term positions above are a global failure to contain the COVID-19 pandemic, which, we believe is a short-term risk. Second among the risks to these positions is a large release of strategic copper concentrate reserves held by China's State Reserve Bureau (aka, the State Bureau of Minerial Reserves). In the case of the latter risk, the actual holdings of the Bureau are unknown, but are believed to be in the neighborhood of 2mm MT.3 Bottom Line: We remain bullish industrial commodities, particularly copper. Robert P. Ryan Chief Commodity & Energy Strategist rryan@bcaresearch.com Commodities Round-Up Energy: Bullish Texas is expected to add 10 GW of utility-scale solar power by the end of 2022, according to the US EIA. Texas entered the solar market in a big way in 2020, installing 2.5 GW of capacity. The EIA expects The Great State to add ~ 5GW per year in the next two years, which would take total solar capacity to just under 15 GW. Roughly 30% of this new capacity is expected to be built in the Permian Basin, home to the most prolific oil field in the US. By comparison, the leading producer of solar power in the US, California, will add 3.2 GW of new solar capacity, according to the EIA (Chart 13). To end-2022, roughly one-third of total new solar generation in the will be added in Texas, which already is the leading wind-powered generator in the country. Wind availability is highest during the nighttime hours, while solar is most abundant during the mid-day period. Precious Metals: Bullish Palladium prices, trading ~ $2,876/oz on Wednesday, surpassed their previous record of $2,875.50/oz set in February 2020 and are closing in on $3,000/oz, as supply expectations continue to be lowered by Russian metals producer Nornickel, the largest palladium producer in the world (Chart 14). Earlier this week, the company updated earlier guidance and now expects mine output to be down as much as 20% this year in its copper, nickel and palladium operations, due to flooding in its mines. Palladium is used as a catalyst in gasoline-powered automobiles, sales of which are expected to rebound as the world emerges from COVID-19-induced demand destruction and a computer-chip shortage that has limited new automobile supply. In addition, production of platinum-group metals (PGMs) is being hampered by unreliable power supply in South Africa, which has forced the national utility suppling most of the state's power (> 90%) to revert to load-shedding schemes to conserve power. We remain long palladium, after recommending a long position in the metal 23 April 2020; the position is up 35.6%. Chart 13 Chart 14 Footnotes 1 Please see, e.g., Renewables, China's FYP Underpin Metals Demand, which we published 26 November 2020. It is available at ces.bcaresearch.com. 2 Please see RPT-COLUMN-Copper smelter terms at rock bottom as mine squeeze hits: Andy Home published by reuters.com 14 April 2021. The report notes direct transactions between miners and smelters were reported as low as $10/MT, in a sign of just how tight the physical supply side of the copper market is at present. 3 Please see Column: Supercycle or China cycle? Funds wait for Dr Copper's call, published by reuters.com 20 April 2021. Investment Views and Themes Recommendations Strategic Recommendations Tactical Trades Commodity Prices and Plays Reference Table Trades Closed in 2021 Summary of Closed Trades
Overweight Quarter-to-date the S&P energy services index is up 12% compared with the 2% rise in the broad market. While the steep rebound in oil prices primarily lies behind such stellar outperformance (top panel), our capex upcycle theme for 2018 should support this nascent recovery. Energy related capital spending budgets are not only rising in the U.S. (primarily in shale oil), but also globally. The global rig count is breaking out, and declining OECD oil stocks suggest that drilling activity will remain robust (second and third panels). Relative share price momentum does not yet fully reflect the rebound in industry investment (using national accounts) that remains in a V-shaped recovery since the Q1/2016 oil market trough (bottom panel). In sum, there are more gains in store for the S&P energy services index. Firming industry demand at a time when global energy capital spending budgets are renormalizing, along with rising crude oil prices, signal that high-beta energy services equities have more running room. Bottom Line: Stay overweight the S&P energy service index and see our Weekly Report for more details. The ticker symbols for the stocks in this index are: BLBG: S5ENRE: NOV, SLB, FTI, BHGE, HAL, HP.