Equities

Executive Summary We hold to our view that households are in better shape than widely perceived, nourished by a robust labor market and a formidable supply of pandemic savings. We do not believe that the equity bear market will derail our base-case scenario that consumption will keep the economy afloat over the next several quarters. Empirically, changes in equity wealth have exerted little to no impact on consumption. Housing does have a discernible wealth effect, and consumption may be more sensitive to falling home prices than rising ones. The sharp decline in home prices feared by many investors could prompt homeowners to retrench, realizing the number-one risk to our constructive view. Although home price appreciation is in the process of decelerating, housing remains undersupplied and home prices will not fall precipitously. Housing bubble chatter is unfounded. Consumption Declines Are Few And Far Between
Consumption Declines Are Few And Far Between
Consumption Declines Are Few And Far Between
Bottom Line: Neither the equity bear market nor a softening housing market will stifle consumption. The Fed’s anti-inflation campaign will eventually induce a recession, but wealth effect concerns are overblown. Feature Flush consumers drawing down the mountain of excess savings they accumulated across 2020 and 2021 provide the foundation for our constructive near-term view on risk assets and the economy. Consumer retrenchment is one of the two principal risks to our stance1 and we would abandon it if a meaningful share of households began to cut back. We do not know that households will dip into their savings to keep consuming at something close to their trend pace – the scale of the fiscal transfers that fattened their bank accounts was unprecedented – but we view the low and declining savings rate as providing ongoing validation for our thesis. Households can sustainably dis-save relative to their post-crisis trend (Chart 1), as a 5% savings rate whittles down their remaining $2.1 trillion stash by just $150 billion per quarter. Chart 1An Extended Period Of Dis-saving Is Sustainable
An Extended Period Of Dis-saving Is Sustainable
An Extended Period Of Dis-saving Is Sustainable
The wealth effect is real – household spending fluctuates with wealth – and one may question whether consumers will continue to spend amidst an equity bear market while the 3-percentage-point surge in mortgage rates pressures home values. As counterintuitive as it may seem, however, changes in equity wealth have had a modest and inconsistent effect on consumption. Changes in housing wealth have exerted greater influence, and one study by prominent researchers suggests that the effect is stronger when home prices decline. We consider the empirical evidence regarding equity and housing wealth effects, along with the prospects for a sharp decline in home prices, in this report. What Drives Spending? For all the talk of the wealth effect, consumer spending is predominantly a function of income. Every multi-factor regression we performed (Box 1) indicated that changes in nominal income account for the lion’s share of changes in nominal consumption, with estimates ranging up to 75%. When we regressed real consumption with real income and real measures of equity and housing wealth, the estimates of income’s effect were sharply lower – typically between 10 and 25% – but the modeled results were dramatically less robust. We accordingly focus on the nominal relationships in the rest of this report, though we note that the real regressions reinforced the nominal regressions’ pointed implication that changes in equity wealth are largely irrelevant for explaining changes in consumption. Box 1: A Regression Refresher Multi-factor linear regression is a statistical method for determining which independent variables influence the movements of a dependent variable. Regression analysis reveals the statistical significance of independent variables based on their empirical relationship with the dependent variable. If the relationship is robust enough that it is unlikely to have occurred randomly, the independent variable is deemed to be significant. The regression equation describes a best-fit line that minimizes the individual observations’ aggregate deviation from the line. It includes a constant term, b, marking the point where the best-fit line intersects the y-axis, and an x term that denotes each of the independent variables, paired with a coefficient, a. Each coefficient describes the sensitivity of the dependent variable to changes in the value of each independent variable. For dependent variable y, and independent variables x1, x2, …, xn, the equation is written as: y = a1x1 + a2x2 + … + anxn + b. The robustness of the regression is indicated by its r-squared value, ranging from 0 to 1, which quantifies the share of the dependent variable's movement that is explained by movement in the independent variables. In our research, we used Personal Consumption Expenditures and Personal Income from the National Income Accounts as our measures of consumption and income, respectively. We used the measure of corporate equities held by households and nonprofit organizations from the Fed’s quarterly Financial Accounts of the United States (report Z.1) to measure equity wealth and followed the methodology of Case, Quigley and Shiller (2005 and 2013)2 to calculate housing wealth.3 We also followed Case, Quigley and Shiller’s methodology in regressing the year-over-year percentage change in the natural log of the variables’ values. Homes Trump Stocks Simple regressions, measuring the empirical impact of a single independent variable upon a dependent variable, indicate that changes in equity wealth exert considerably less influence over changes in consumption than changes in housing wealth. With a two-quarter lag, year-over-year consumption has changed by nearly three cents for every dollar move in equity wealth (Chart 2). Three cents are in line with rule-of-thumb estimates, but we note that the regression’s r-squared is less than 3%. An unlagged year-over-year regression posits a 0.6-cent consumption change for every dollar move in equity wealth with a microscopic r-squared of 0.1%. Chart 2Equities' Relationship With Consumption Is Weak And Unreliable, ...
The Wealth Of Households
The Wealth Of Households
The housing wealth regression indicates that every dollar of changes in housing wealth leads to a 38-cent change in consumption. With a 38% r-squared, the housing wealth regression generates a visibly tighter fit (Chart 3), inspiring more confidence in the posited relationship, though it is incomplete without considering any other variables’ role in influencing consumption. The housing wealth relationship is also considerably stronger on an unlagged basis (Table 1). Chart 3... Contrasting With Housing's Stronger, More Consistent Pull
The Wealth Of Households
The Wealth Of Households
Table 1Simple Regression Output
The Wealth Of Households
The Wealth Of Households
Chart 4Equities Are Owned By Low MPC Households
The Wealth Of Households
The Wealth Of Households
It may seem surprising that relatively opaque changes in housing wealth exert a much stronger influence over consumption than immediately observable changes in equity wealth. We think the result is a function of the greater breadth of home ownership; nearly two-thirds of households own their home, and it is far and away the largest asset for all but the wealthiest of families. Stock ownership, on the other hand, is highly concentrated, with the top 1% of households by wealth owning over 50% of equities, and the top 10% owning nearly 90% of them (Chart 4). Fluctuations in the stock market mostly impact households with a low marginal propensity to consume but changes in home prices effect a much fuller sweep of Americans. The simple regressions set the stage for what we discovered when we performed multi-factor regressions, confirming previous researchers’ findings. Income is the primary driver of consumption, with a one-dollar change in nominal income provoking a 65-to-72-cent change in nominal spending, and its statistical significance in the models is beyond question (Table 2). Table 2Multiple Regression Output
The Wealth Of Households
The Wealth Of Households
Equities’ wealth effect is not statistically significant in the unlagged model at a 5% significance level (it’s not even statistically significant at the more forgiving 10% significance level) and it is modest (about 1.5 cents on the dollar) in any event. The model would be better off without including equity wealth as an independent variable. In the model lagging consumption by two quarters, which produces a slightly better fit and accords more easily with our own intuition that wealth effects are not felt instantaneously, consumption moves inversely with equity wealth, falling 3 cents for every one-dollar increase in equity wealth and rising 3 cents for every one-dollar decrease. That result is statistically significant, albeit hard to wrap one’s head around. The housing wealth variable is comfortably significant even at a 1% significance level and its impact is quite large in both the unlagged (14.5 cents on the dollar) and the two-quarter-lagged (11.75 cents on the dollar) specifications. Both model specifications generate high r-squareds, explaining 58% and 60% of the variability in consumption, respectively, and the modeled values fit the actual values extremely well before the pandemic scrambled the relationship between consumption and its drivers (Chart 5). Chart 5A Tight Fit Before The Pandemic
A Tight Fit Before The Pandemic
A Tight Fit Before The Pandemic
We also ran a version of the model that substituted Disposable Income for Personal Income, but it slightly weakened its explanatory power and we judge that the broader Personal Income series is a better input. We also ran a version of the model that used household real estate holdings and mortgage balances from the Fed’s quarterly Z.1 report to calculate a factor that translates gross housing wealth to net housing wealth to reflect that all households do not own their homes free and clear.4 Substituting net housing wealth reduced the model’s explanatory power by about two percentage points but left the individual variables’ significance largely intact while cutting housing’s unlagged and two-quarter lagged wealth effect to 7 and 5 cents, respectively (Table 3). Net housing wealth is more intellectually satisfying than gross housing wealth and the smaller wealth effect estimates are more in line with the peer-reviewed literature. Table 3Multiple Regression Output With Net Housing Wealth
The Wealth Of Households
The Wealth Of Households
Whither Home Prices? Investors appear to be braced for a sizable decline in home prices even though nominal price declines are unusual in the five-decade history of the leading repeat sales price indexes. The Case-Shiller National Index has declined just 19% of the time on a sequential basis and 14% of the time on a year-over-year basis (Chart 6). Excepting the 21 consecutive quarters of year-over-year declines from 1Q07 through 1Q12, the Case-Shiller National Index has declined in just five quarters over 41 years, all during the 1990-91 recession that featured tax law changes sharply curtailing individuals’ ability to benefit from losses on real estate investments. The FHFA (née OFHEO) House Price Index has declined on a year-over-year basis just 11% of the time, with only one decline occurring outside of 2007 to 2012 (Chart 7). Chart 6Ex-The Crisis, Declines Are Rare, ...
Ex-The Crisis, Declines Are Rare, ...
Ex-The Crisis, Declines Are Rare, ...
Chart 7... In Both Major Series
... In Both Major Series
... In Both Major Series
Investors expecting a decline therefore appear to be anchoring to an extreme outlier. We cringe whenever we hear the term “housing bubble” used to liken today’s backdrop to the one that preceded the financial crisis. Make no mistake: it is not 2007 in the housing finance market in any way, shape or form. Residential mortgage originations have been made to vastly better borrowers than they were in the run-up to the crisis (Chart 8) and they’ve been made on far more solid terms, as the loan-to-value ratio for residential mortgages has shrunk by 25 percentage points in the immediate aftermath of the bust to its easily sustainable levels of the early ‘80s (Chart 9). Chart 8Mortgages Have Been Extended To Better Borrowers ...
The Wealth Of Households
The Wealth Of Households
Chart 9... On Better Terms Than Before The Crisis
... On Better Terms Than Before The Crisis
... On Better Terms Than Before The Crisis
Chart 10Housing Supply Is Tight
Housing Supply Is Tight
Housing Supply Is Tight
Housing is broadly undersupplied, as evidenced by the record-low home vacancy rate (Chart 10). Higher mortgage rates have surely put monthly payments out of the reach of some aspiring buyers, sending them to the sidelines, but supply remains constrained and home prices fall slowly. Kahneman and Tversky demonstrated that people are quick to take gains by selling appreciated assets but slow to part with assets that are under water. Even if we are underestimating the eventual magnitude of a decline in home prices, we are confident that the decline will not be sudden. Homeowners with discretion over when they sell will wait to exercise it; turnover will slow as pricing softens and the reduced supply will help to mitigate the declines. Investment Implications We were inspired to explore the housing wealth effect by a striking assertion featured in a leading market periodical two weeks ago. An independent strategist stated that the wealth effect from a one dollar decline in home prices was a whopping 40 cents, while the effect of a like decline in equity prices was 10 cents. The assertion was passed on without comment or criticism by the publication, which has long touted its skepticism and unwillingness to accept bullish statements at face value. Alas for its readers, the standard apparently does not apply to bearish claims, no matter how far off the beam they may be. (Based on our results, we suspect these wealth effect estimates are based on simple regressions.) Divergent views are what make a market, but nothing in the body of peer-reviewed research supports the idea that the $6.5 trillion decline in directly owned equities and a hypothetical 10% decline in home equity from its nearly $30 trillion June 30th level will extinguish $650 billion and $1.2 trillion of consumption, respectively. That nearly $2 trillion hit would be punishing, given consumption's current $17 trillion annualized pace. It would also be unprecedented: since the Personal Consumption Expenditures series began in 1950, nominal consumption has only ever declined by a margin that can be seen by the naked eye during the Great Recession and the COVID pandemic (Chart 11). Those historic declines amounted to 3.5% from the 3Q08 peak to the 2Q09 trough and 11.4% from the 4Q20 peak to the lockdown 2Q21 trough. Chart 11Visible Declines In Nominal Spending Are Rare
Visible Declines In Nominal Spending Are Rare
Visible Declines In Nominal Spending Are Rare
We are only too happy to take the other side of the view that another 11% decline could be in store, assuming the absence of nuclear war or another pandemic. We think the 3.5% Great Recession decline will likely remain out of reach, as well, given that the financial crisis emerged from a concatenation of events that cannot repeat now that regulators have so thoroughly clipped the banking system’s wings. Not every investor subscribes to Chicken Little warnings about the housing market, but the promiscuity with which the term bubble is thrown around strongly suggests to us that the consensus view overestimates the probability of a dire economic outcome. When subsequent events reveal that the shock probability has been overstated, the consensus economic and S&P 500 earnings views will have to be revised upward and we believe the eventual revisions will provide risk assets with a path to recover some of the ground they’ve lost this year. We continue to believe that it would be premature to implement full-on defensive asset allocation measures before they do. Doug Peta, CFA Chief US Investment Strategist dougp@bcaresearch.com Footnotes 1 A breakout in long-run inflation expectations is the other. 2 Case, Karl E., John M. Quigley, and Robert J. Shiller, “Comparing Wealth Effects: the Stock Market versus the Housing Market,” Advances in Microeconomics, 5(1),2005: 1-32. Case, Karl E., John M. Quigley, and Robert J. Shiller, “Wealth Effects Revisited: 1975-2012,” NBER Working Paper 18667, January 2013. 3 Case, Quigley and Shiller calculate housing wealth in time t, HWt, as the product of the number of US households, Nt, the homeownership rate, ORt, the average price of a single-family home in the base period (1Q75 in our study), AVGBASE, and a weighted repeat sales price index relative to its base period value, (PIt/PIBASE). We used the National Association of Realtors’ average existing home price series and the Case-Shiller National Index for variables AVG and PI, respectively, as per the following equation: HWt = Nt × ORt × AVG1Q75 × (PIt/PI1Q75) 4 HWt, described in the second footnote, is a gross measure of housing wealth. We divided outstanding mortgage debt by the value of households’ real estate holdings to calculate the aggregate residential mortgage loan-to-value ratio, LTV. We subtracted LTV from 1 to calculate the share of housing value that represented households’ aggregate home equity and multiplied it by HWt to produce an estimate of net housing wealth, NHW: NHWt = HWt × (1 – LTVt)
Executive Summary The USD has appreciated by over 25% since the beginning of 2021. This is a negative for US corporate sales and profits and is a drag on US equity performance. According to BCA FX strategists, the USD is likely to roll over as it appears overbought and overvalued. However, even if the USD has peaked, the effects of its appreciation will be imprinted in the earnings of US corporates for months. Our earnings model signals an earnings recession, with earnings expected to contract to the tune of 20% into the year-end. Technology and Materials are most exposed to the dollar, while Utilities, Financials, and Real Estate are the most domestic sectors. Growth is a more international style than Value, while midcaps offer the best protection from a stronger greenback. USES Model Breakdown
Should US Equity Investors Worry About The Dollar?
Should US Equity Investors Worry About The Dollar?
Bottom Line: While a strong dollar is certainly a headwind for US earnings growth and for the performance of US equities, its adverse effects are minor compared to the effects of tighter monetary policy, slowing growth at home and abroad, rising costs, falling productivity, and fading pricing power. An earnings recession is inevitable. Dollar depreciation will be a welcome development, yet the dollar should be the least of investors’ worries. Feature The USD has appreciated by over 25% since the beginning of 2021 (Chart 1), a concerning development for US equity investors. The S&P 500 companies derive roughly 40% of sales from abroad and the strong dollar is a headwind: Not only does an appreciating domestic currency diminish foreign earnings through a currency translation effect, but it also makes US goods and services more expensive and less competitive in a global marketplace. Related Report US Equity StrategyUS Dollar Bear Market: What To Buy & What To Sell Over the past few months, a number of US multinationals have complained about the adverse effect of the strong greenback on their sales and earnings. The list is both long and diverse and includes technology giants like Microsoft, Dell, and Netflix as well as the likes of Philip Morris, Johnson and Johnson, TJX, and Costco. Investors paid attention: Since the beginning of 2021, US companies with a high share of international sales underperformed their more domestically oriented counterparts by about 20% (Chart 2). However, partially this divergence in performance may be explained by the international index heavily overrepresenting Tech, which has headwinds of its own. Chart 1The USD Has Appreciated By Over 25%
The USD Has Appreciated By Over 25%
The USD Has Appreciated By Over 25%
Chart 2US Multinationals Have Underperformed
US Multinationals Have Underperformed
US Multinationals Have Underperformed
In this week’s report, we will analyze the effects of the stronger dollar on US corporate earnings, zooming in on its implications for the S&P 500 sectors and styles. Sneak Preview: A strong dollar is a definite negative for US corporate sales and profits and is a drag on US equity performance. However, when compared in magnitude to the effects of tighter monetary policy, slowing growth, and rising costs – the dollar should take a backseat to the other investor worries. USD: The Best House On The Worst Street The reasons for the rapid rise of the USD are manifold. The following are just a few: The Dollar smile: The USD outperforms when global growth is strong and investors are optimistic, as well as when growth slows and investors are fearful, benefiting from its status as a reserve currency. Over the past two years, both scenarios have played out. In 2021, investor flows pushed the dollar higher as the US was ahead of the rest of the world in terms of post-pandemic recovery. This year, the USD became a safe haven for jittery investors and became one of the rare assets delivering positive returns in the “sea of misery.” Chart 3Rate Differentials Favored The US
Rate Differentials Favored The US
Rate Differentials Favored The US
The US looks good compared to other regions: Despite its own economic maladies, such as high inflation and slowing growth, the US has been in an advantageous position compared to the rest of the world. The US appears well insulated from global shudders compared to Europe, which is in the midst of a recession and an energy crisis, China roiling from the zero-COVID policy and property market fallout, and EM countries on the verge of food and energy shortages. Interest rate differentials: The Fed is being viewed as the most credible central bank to curb inflation. As a result, US rates have risen more than in other markets (Chart 3). The USD has been strengthening as the US has been enjoying relative stability and better growth compared to the other regions. The Fed is also ahead of the curve. Will The USD Appreciation Continue? BCA FX Strategist Chester Ntonifor does not expect the dollar to continue to appreciate for the following reasons: While the Fed is ahead of the curve, other central banks are also becoming more hawkish. As such, interest rate differentials will not materially move further in favor of the dollar. Inflation is a global problem as opposed to US-centric. Thanks to the Fed’s aggressive policy stance compared to the other central banks, the inflation impulse is slowing in the US, relative to a basket of G10 countries (Chart 4). In addition, the dollar is expensive, overbought, and is a crowded consensus trade (Chart 5). Chart 4The US Inflation Impulse Has Turned
The US Inflation Impulse Has Turned
The US Inflation Impulse Has Turned
Chart 5The Dollar Is Overvalued On A PPP Basis
The Dollar Is Overvalued On A PPP Basis
The Dollar Is Overvalued On A PPP Basis
We concur. While we will not outright bet against the dollar, to our mind, risks are skewed to the downside. The dollar must be close to its peak, and we are neutral on a tactical basis. Effects Of USD Moves On S&P 500 Sales And Earnings Growth It Takes Time While US dollar appreciation may have come to an end, its toll will be imprinted on US earnings growth for a while. There is a lag between currency appreciation and its effects on company sales and earnings: It takes companies three to six months to change contracts, adjust prices and record revenue (Table 1). Stronger Dollar: Lower Sales And Lower Costs It is foreign sales that are most affected by the variation in the purchasing power of foreign currencies relative to the dollar (Chart 6). And while US multinationals hate the strengthening dollar, they also get a hand from it on the cost side of the equation, especially if they outsource a sizeable part of production abroad. Thus, the net effect on profits depends on the cost structure and the type of business. That explains why changes in the dollar are never one-to-one to changes in earnings growth. Table 1Sensitivity Of EPS YoY% To USD YoY% Over Time
Should US Equity Investors Worry About The Dollar?
Should US Equity Investors Worry About The Dollar?
Modeling Effects Of A Stronger Dollar In the “Is An Earnings Recession In The Cards?” report published this past June, we introduced our EPS Growth Forecast Model (Table 2). The model has five intuitive factors: Chart 6The USD Primarily Affects Sales
The USD Primarily Affects Sales
The USD Primarily Affects Sales
Table 2EPS Growth Forecast Model
Should US Equity Investors Worry About The Dollar?
Should US Equity Investors Worry About The Dollar?
ISM PMI is a gauge of US economic growth and a proxy for top-line growth. PPI stands for the change in costs. Pricing Power is a BCA proprietary indicator and captures companies’ ability to pass costs onto their customers. HY Spreads indicate costs of borrowing and also the state of the economy (spreads tend to shoot up in a slowing economy). USD represents the ability of US multinationals to sell goods abroad. These five factors explain 65% of the variation in earnings growth,1 and all factors are statistically significant. Earnings Recession Is Still In The Cards Back in June, we predicted an earnings recession later this year. After all, economic growth is slowing at home and abroad, and demand is rolling over while costs are rising, especially wages. Making things worse, productivity is falling, and Unit Labor Costs (ULC) hit nearly 10% in August. At the same time, consumers are reeling from rising prices, while companies are coming to realize that their ability to pass on costs to customers is pushing the limit. We have updated the model with three more months of data and expect earnings to start contracting in the third quarter, falling as much as 20% in the fourth quarter (Chart 7). None of this is surprising. S&P 500 margins have fallen by 2% in the second quarter, and earnings growth ex Energy came in at -2% on a nominal basis. Analysts expect six out of 11 S&P 500 sectors to deliver negative EPS Growth in Q3-2022. And while a 20% earnings drawdown sounds terrible, it is fairly mild compared to recent recessions – at the worst point in 2008, nominal earnings went to 0, printing a -100% contraction (Table 3). Chart 7The BCA Earnings Model Predicts A Earnings Recession Later This Year
The BCA Earnings Model Predicts A Earnings Recession Later This Year
The BCA Earnings Model Predicts A Earnings Recession Later This Year
Table 3The S&P 500 Earnings Drawdowns
Should US Equity Investors Worry About The Dollar?
Should US Equity Investors Worry About The Dollar?
Here, we would like to emphasize that financial econometrics is not an exact science, and earnings growth point estimates are rarely precise. However, it is abundantly clear that earnings growth will trend well past the zero mark. Costs And Pricing Power Are Key Drivers Of S&P 500 Earnings In 2022 Breaking down the negative earnings growth forecast into contributions from different factors (Chart 8), we observe that the outcome is mostly driven by the interplay between PPI and Pricing Power – costs are rising and companies’ ability to pass them on further defines their profitability. And while commodity prices have fallen, these changes will take a while to flow into earnings. In addition, tighter monetary policy and slowing growth are the new speed bumps (HY Spreads and ISM PMI). Chart 8Interplay Of PPI And Pricing Power Drives The Direction Of Earnings
Should US Equity Investors Worry About The Dollar?
Should US Equity Investors Worry About The Dollar?
Chart 9The USD Contribution Is Negative…
The USD Contribution Is Negative…
The USD Contribution Is Negative…
USD Is Less Important So what about the dollar? According to our model, 1% of dollar appreciation is shaving off roughly 50bps from earnings growth. However, we need to keep this number in context. While the dollar has appreciated more than 25% since the beginning of 2021, only the last three to six months matter on a rolling basis. And over the past three months, USD has appreciated by about 8%, which will detract 4% from earnings in Q4-2022 (Chart 9). The importance of the USD for earnings growth is fairly minor compared to the other factors, such as pricing power, PPI, HY spreads, and ISM PMI (Chart 10). Chart 10... But Is Minor Compared To The Other Factors
Should US Equity Investors Worry About The Dollar?
Should US Equity Investors Worry About The Dollar?
Bottom Line: A strong dollar is a headwind for earnings growth. However, its effects are dwarfed by other factors. Sectors Most Affected By The Strong Currency And Weakening Global Growth Table 4The S&P 500: % Of Foreign Sales By Sector
Should US Equity Investors Worry About The Dollar?
Should US Equity Investors Worry About The Dollar?
While the overall negative effect of a strong dollar on the S&P 500 earnings is relatively minor, some sectors in the index are more exposed than others (Table 4). While the S&P 500 derives about 40% of sales from abroad, the Technology and Materials sectors have about 60% of foreign sales, and for the companies in these sectors, a strong currency is a serious concern. Utilities, Financials, and Real Estate are the most domestic in the index. It is important to note, that, at present, US multinationals are dealing not only with the effects of a stronger currency but also with global growth slowdown. Effects Of Strong Dollar On US Equity Performance While over the long term, a link between earnings growth and equities performance is irrefutable, in the short run, there may be significant variations. In this section, we will look at the relationship between equity returns and the USD. We will also isolate sectors and styles that are best positioned to withstand the current environment. And when the dollar swoons, we will also know which parts of the equity market are most likely to bounce back. USD Dollar Regimes To better understand the relationship between equity returns and the USD, we demarcate two distinct USD regimes, defined rather simplistically as “USD Rising” and “USD Falling” (Chart 11). Then we compile median monthly returns in each regime and keep track of how many months the S&P 500 was positive in each. Chart 11The USD Regimes
Should US Equity Investors Worry About The Dollar?
Should US Equity Investors Worry About The Dollar?
Chart 12The USD Is A Headwind For The Performance Of Equities
Should US Equity Investors Worry About The Dollar?
Should US Equity Investors Worry About The Dollar?
We found that when the USD is appreciating, median monthly returns are only 0.5% and are positive only 37% of the time. However, when the dollar is depreciating, median monthly returns are 1.4% and are positive 63% of the time (Chart 12). This relationship is significant at a 10% confidence level. Sector Performance Under Different USD Regimes When the USD rises, more defensive sectors, such as Utilities, Healthcare, and Consumer Staples tend to outperform. Energy has made the list thanks to the recent rally – normally Energy does not benefit from dollar strength (Chart 13). Chart 13Materials And Comm Services Will Outperform If The USD Turns
Should US Equity Investors Worry About The Dollar?
Should US Equity Investors Worry About The Dollar?
The weakening dollar supports Materials as it stimulates demand, as well as the Communications sector, as it is home to multinational media and entertainment companies like Netflix, Facebook, and Google. Style Performance Under Different USD Regimes Growth Vs Value: Growth is more exposed to the USD than Value thanks to the index composition (Chart 14). Growth is home to Tech as well as Media & Entertainment, and “growthy” Consumer Discretionary, all of which have a higher share of earnings from abroad than the index. Value is dominated by Financials, Industrials, and Utilities, which are fairly domestic. Thus, while over time, exposure to the dollar fluctuates, over the long term, Growth is clearly more sensitive than Value (Chart 15). Chart 14Growth Is Dominated By Multinationals
Should US Equity Investors Worry About The Dollar?
Should US Equity Investors Worry About The Dollar?
Chart 15Growth Is More Exposed To The USD Than Value
Growth Is More Exposed To The USD Than Value
Growth Is More Exposed To The USD Than Value
Chart 16Mid Is A More Domestic Asset Class Than Small
Mid Is A More Domestic Asset Class Than Small
Mid Is A More Domestic Asset Class Than Small
Small Vs Mid: According to a popular belief, small caps are insulated from currency moves as they don’t have reach and scale and earn very little outside of the US. However, small caps are often part of the ecosystem and supply chain of multinationals, and when the profitability of those is under pressure, they also start to feel the heat. Small caps have little leverage with their large clients and their profitability changes with the ebbs and flows of their larger brethren. Hence, they are quite sensitive to currency moves. Arguably, it is midcaps that are the most domestic asset class, as their exposure to the USD is less and more stable compared to the S&P 500 and small caps (Chart 16). Midcaps are usually not big enough to have much international reach but are big enough to have bargaining power with their multinational customers to guard their profitability. Investment Implications The S&P 500 derives roughly 40% of sales from abroad, which makes its earnings quite sensitive to dollar moves and global growth. The recent dollar bull market and slowing growth abroad have challenged US corporates and have detracted from their profit growth. However, slower growth, rising costs, and diminished pricing power by far dwarf the effects of the dollar. Overall, challenges at home and abroad are likely to trigger an earnings recession, which in all likelihood, has already started this summer, and is about to get worse. The dollar may be close to its peak, and our colleagues from the FX team expect dollar devaluation over the long term. A turn in the dollar will offer some respite for the performance of US equities despite the domestic backdrop of slowing growth and rising rates. It will also trigger a change in leadership, with sectors such as Materials and Communications rebounding from their lows. In terms of styles, a strong dollar lends support to Value, thanks to its sector composition. Once the dollar starts to depreciate, Growth will get another tailwind towards recovery. And lastly, midcap is one area in the US equity market somewhat more insulated from currency moves. Bottom Line While a strong dollar is certainly a headwind for US earnings growth and for the performance of US equities, its adverse effects are minor compared to the effects of tighter monetary policy, slowing growth at home and abroad, rising costs, falling productivity, and companies, diminished ability to pass on costs to customers—who are already strapped by rising prices. In short, dollar depreciation will be a welcome development, yet the dollar is the least of investors’ worries. Irene Tunkel Chief Strategist, US Equity Strategy irene.tunkel@bcaresearch.com Footnotes 1 The model’s adjusted R-squared is 0.65. Recommended Allocation
Executive Summary What To Do With The Euro?
What To Do With The Euro?
What To Do With The Euro?
The outlook for European assets is uniquely muddled. European energy prices will remain elevated, but the worst of the adjustment is already behind us. The global economy is teetering on the edge of a recession and weak global growth is historically very negative for European assets. However, European valuations and earnings forecasts already discount an extremely severe outcome for global growth. A hawkish Fed should support the dollar, but investors increasingly realize foreign central banks are fighting inflation equally aggressively. The dollar already anticipates a global recession. Meantime, European credit offers a large spread pickup over sovereigns and even appears as a decent alternative to equities. Within a credit portfolio, we adopt a more cautious approach towards European investment grade bonds (IG) relative to their US counterpart. Instead, we recommend favoring UK IG over Euro Area IG as well as Swedish IG relative to US IG. Recommendations INCEPTION DATE RETURN SINCE INCEPTION (%) COMMENT Set a stop buy at EUR/USD 0.9650 with a stop-loss at 0.9400 9/26/2022 Bottom Line: Investors should maintain a modest long position in equities in European portfolios, with a preference for defensive stocks over cyclicals. The conditions are falling in place to buy the euro tentatively. Following the hawkishness that transpired from the Fed press conference and revised forecasts last week, EUR/USD plunged below 0.99 and hit a 20-year low. Moreover, President Vladimir Putin’s announcement of a broader mobilization of the Russian army is stoking fears that the Ukrainian conflict will only be prolonged. The prospects of a lengthier war and greater energy market shock are raising further worries for Europe’s growth outlook, which weighs on European asset prices, notably the euro and the pound. The odds of a global financial accident are on the rise. Global central banks have joined the Fed and are relentlessly tightening global monetary and financial conditions. Moreover, the surging dollar is adding to global risks by raising the cost of capital around the world. This is a very fragile situation and the odds of a global recession have jumped significantly. Against this backdrop, investors should continue to overweight defensive equities at the expense of cyclical stocks. The euro also has more downside, but we are issuing a tentative stop-buy at EUR/USD 0.9650 with a stop at 0.9400. Credit remains a safer alternative to European stocks. The Evolving European Energy Backdrop Chart 1All About The Gas
All About The Gas
All About The Gas
The surge of natural gas and electricity prices since the fall of 2021 has been one of the main drivers of the underperformance of European assets and the fall in the euro (Chart 1). While the medium-term outlook for European energy prices remains fraught with risk, the near-term prospects have improved. Following a surge from €77.4/MWh in June to €340/MWh on August 26, one-month forward natural gas prices at the Dutch Title Transfer Facility (TTF) have declined 45% to €187/MWh. These wild gyrations reflect the evolution of both the natural gas flows from Russia, which have fallen from 3,060Mcm to 599 Mcm today, and the rapid buildup of natural gas inventories across the European Union. The good news is that the costly efforts to rebuild European gas inventories have been successful. EU-wide inventories are at 85.6% capacity, achieving its 80% storage objective well before November. Germany has gone even further, with storage use now standing at 90% of capacity. This large stockpile, along with the re-opening of coal power plants and consumption curtailment efforts, should allow Europe to survive the winter without Russian energy imports, as long as the temperatures are not abnormally cold. The absence of a summer dip in Norwegian gas exports and the surge in LNG flows to Europe have partially replaced the missing Russian inflows, thus helping Europe rapidly rebuild its natural gas inventories (Chart 2). This success was a consequence of elevated European natural gas prices, which have allowed Europe to absorb LNG flows from the rest of the world (Chart 3). Chart 2No Restocking Without LNG
No Restocking Without LNG
No Restocking Without LNG
Chart 3LNG Flowed Toward High Prices
LNG Flowed Toward High Prices
LNG Flowed Toward High Prices
So far, the European industrial sector has managed to adjust better than expected to the jump in the price of natural gas, a crucial energy input. Take Germany as an example. For the month of August, Germany’s consumption of natural gas by the industrial sector fell 22% below the 2018-2021 average (Chart 4, top panel), while PPI moved up vertically. Yet, industrial output is only down 5% year-on-year and industrial capacity utilization stands at 85%, which is still a level that beats two thirds of the readings recorded between 1990 and this the most recent quarter (Chart 4, bottom panel). The adjustment will be uneven across various industries, with those most voracious of natural gas likely to experience a declining share of Europe’s gross value added. Using the German example once again, we can see that the chemicals, basic metal manufacturing, and paper products sectors are the most at risk from higher natural gas prices and most likely therefore to suffer the most from gas rationing this winter (Chart 5). Chart 4A Surprisingly Successful Transition
A Surprisingly Successful Transition
A Surprisingly Successful Transition
Chart 5The Three Sectors Most At Risk
Is Europe About To Be Crushed?
Is Europe About To Be Crushed?
Going forward, important changes are likely to take place that will allow the European economy to continue to survive on diminished Russian gas flows: European natural gas prices will remain elevated compared to the rest of the world to attract LNG flows to the region. Importantly, Europe’s capacity to absorb these flows keeps increasing, as more re-gasification ships are docked around the continent. Moreover, North America is building more facilities to export LNG to Europe. Chart 6Nuclear Energy's Contribution Will Rebound
Nuclear Energy's Contribution Will Rebound
Nuclear Energy's Contribution Will Rebound
Nuclear electricity production will rebound. Currently, the EU’s nuclear production is around 43.2TWh, well below the normal 60TWh to 70TWh winter levels, driven mostly by the collapse in French production from 35TWh to 18TWh (Chart 6). This decline in nuclear electricity generation has accentuated the upward pressure on European natural gas and electricity prices. One of the key objectives of the nationalization of EDF by the French government is to accelerate the maintenance of France’s ageing nuclear power plants and allow a return to more normal production levels by the winter. The role of natural gas in European household’s energy mix will decline. Currently, EU households are the largest natural gas consumers and account for 41% of the bloc’s gas consumption (Chart 7). It will be easier to replace their natural gas consumption over time with other sources of energy than it will be to cut the industrial sector’s consumption extensively. As a result, even if European natural gas imports are permanently below 2021 levels, the industrial sector will not bear the brunt of the adjustment. Chart 7Households To Be Displaced
Is Europe About To Be Crushed?
Is Europe About To Be Crushed?
These developments imply that natural gas prices have limited downside. However, we believe that the worst of the spike in prices is behind us, at least over the near term. The reason is that the inelastic buying created by the inventory re-stocking exercise since May 2022 is ending. In fact, the German Federal Minister for Economic Affairs and Climate Action, Robert Habeck, declared last week that his country would no longer purchase gas at any price. Chart 8The Most Painful Part Of The Adjustment Is Over
The Most Painful Part Of The Adjustment Is Over
The Most Painful Part Of The Adjustment Is Over
If prices stabilize around €200/MWh, European industrial activity will continue to face a headwind, but the worst of the adjustment process will be in the rearview mirror as natural gas inflation recedes (Chart 8). Ultimately, capitalist systems are dynamic, and it is this rapid change in price that causes the most pain. In other words, the impoverishment of the European private sector has already happened. Steady states are easier to manage. Moreover, if natural gas prices eventually follow the future’s curve (this is a big “if”), the picture for Europe will improve considerably. One additional mitigating factor should ease the pain being experienced by the European private sector. Fiscal policy is responding very aggressively to the current energy crisis. So far, EU countries and the UK have allocated more than €500 billion to protect their private sectors against higher energy costs (Chart 9) and the UK just announced tax cuts of £45 billion. This is in addition to the disbursement of €150 billion from the NGEU funds in 2023. Moreover, the European commission is planning to modify the EU fiscal rules to abandon annual structural deficit targets and for debt sustainability to be evaluated over a ten-year period. Chart 9Massive Fiscal Support
Is Europe About To Be Crushed?
Is Europe About To Be Crushed?
Bottom Line: The worst of Europe’s adjustment to higher energy prices is now behind us. However, European energy prices will remain elevated, which will continue to put Europe at a handicap compared to the rest of the world. Bad News From The Rest Of The World The worst of Europe’s energy crisis is behind us, but the world is teetering toward a recession, which will hurt the trade- and manufacturing-sensitive European economy. Chart 10A Global Recession This Way Comes
A Global Recession This Way Comes
A Global Recession This Way Comes
The tightening in global financial conditions created by the surge in the dollar and by the jump in global yields is pushing the US Manufacturing ISM and the Euro Area PMIs toward the low-40s, which is consistent with a recession (Chart 10). The problem does not stop there. Global central banks have become solely focused on fighting inflation. For 2023, the FOMC’s dot plot forecasts both an interest rate rise to 4.6% and a 0.7% increase in the unemployment rate. This is tantamount to the Fed telling the market that it will increase interest rates as a recession emerges to repress inflation. Not to be undone, European central banks are also rapidly increasing their policy rates, even as they also forecast an imminent deterioration in domestic growth conditions. Quickly tightening policy in a slowing growth environment, especially as the dollar hits a 20-year high, is a recipe for a financial accident and a global recession. Chart 11No Help From China
No Help From China
No Help From China
Moreover, China’s economy is still unable to create a positive offset to the deterioration in global monetary and financial conditions. The marginal propensity of China’s private sector to consume remains in a downtrend, hampered by the country’s zero-COVID policy and the continuing meltdown in real estate activity (Chart 11). Furthermore, the most rapid decline in the yuan exchange rate in 5 years is imparting an additional downside risk to the global economy. European stocks are uniquely exposed to these threats. Europe overweights deep cyclicals, which are currently squeezed by the deteriorating global growth outlook. The message from the collapse in FedEx’s stocks on very poor guidance is particularly ominous: this company has a much closer correlation with the Dow Jones Euro STOXX 50 than with the S&P 500 (Chart 12). European share prices are already factoring in much of the bad news. Valuations are significantly less expensive than they once were. The Shiller P/E ratio of European equities and their equity risk premium stand at the same levels as those in the 1980s. This is in sharp contrast to the US (Chart 13). Chart 12FedEx's Gloomy Delivery
FedEx's Gloomy Delivery
FedEx's Gloomy Delivery
Chart 13Low CAPE In Europe
Low CAPE In Europe
Low CAPE In Europe
Table 1A Deep Downgrade To European Earnings
Is Europe About To Be Crushed?
Is Europe About To Be Crushed?
European forward earnings have also already done considerable work adjusting downward. Excluding energy, 2022 and 2023 forward EPS are down 10.3% and 11.9% since their peak, respectively (Table 1). But inflation flatters earnings growth and European large-cap indices are dominated by multinational firms, which implies that looking at earnings in USD terms makes more sense. In both real and USD terms, 2022 and 2023 forward EPS, excluding energy, are already down 25% and 26.4%, respectively. These adjustments are in line with previous recessions. The counterargument is that analysts still expect positive earnings growth in 2023 relative to 2022. However, at 4%, this increase in expected earnings is still well below inflation and 6% below the average expected growth in forward earnings recorded over the past 35 years (Chart 14). Additionally, a global recession could put further downward pressure on energy prices in Europe, which would create an additional cushion under European earnings in 2023 The implication here is that it still makes sense to be modestly long European equities in absolute terms, especially for investors with an investment horizon of twelve months or more. However, we cannot be complacent, as the risk of an additional selloff is still too large for comfort. As a result, for now investors should only garner a small exposure to European equities and do so while favoring defensive names over cyclical ones (Chart 15). Chart 14Weak Forward Earnings Growth
Weak Forward Earnings Growth
Weak Forward Earnings Growth
Chart 15Continue To Favor Defensive Names
Continue To Favor Defensive Names
Continue To Favor Defensive Names
Bottom Line: European stocks must still contend with the growing threat of a global recession catalyzed by tighter financial conditions and aggressive global central banks. The good news is that they already discount considerable pessimism, as illustrated by their low valuations and downgraded forward earnings. Consequently, investors can continue to nibble at European equities, but do so to a limited degree and by favoring defensive stocks over cyclical ones, at least for now. The Euro Dilemma On the back of the very hawkish Fed meeting and the announcement of Russia’s broadened military mobilization, the EUR/USD broke below the 0.99 support level and fell under 0.98, a level we judged in the past as very attractive on a six-to-nine months basis. Obviously, Fed Chair Jerome Powell’s reaffirmation of the FOMC’s war on inflation is a major boost to the dollar. The momentum property of the greenback implies that it has room to rally further in the near term. This narrative, however, overlooks the fact that the Fed is not the only central bank intent on fighting inflation, no matter the cost. The Norges Bank, the Riksbank, the ECB, and even the SNB have all showed their willingness to move aggressively against inflation. While the BoE only increased rates by 50bps last week, its communication suggested that an at least 75bps increase would be due at the November meeting, when the MPC publishes its Monetary Policy report that will incorporate the impact of the budget measures announced by new British Prime Minister, Liz Truss. Chart 16The Rest Of The World Is Catching Up To The Fed
The Rest Of The World Is Catching Up To The Fed
The Rest Of The World Is Catching Up To The Fed
As a result, market interest rate expectations are climbing in the US, but they are rising even faster in Europe, albeit from a lower base. However, the decline in the expected rate of interest in the US relative to Europe and in the number of expected hikes in the US relative to Europe are consistent with a sharp decline in the DXY in the coming months (Chart 16). Due to its 80% weight in European currencies, a weaker DXY implies a rebound in the EUR, GBP, CHF, NOK, and SEK against the USD. Chart 17Surprising European Resilience
Surprising European Resilience
Surprising European Resilience
Moreover, there could be room for expected interest rate differentials to narrow further against the dollar. The analysis we published two weeks ago shows that, even when the different nonfinancial private debt loads are accounted for, the gap in the US and Eurozone r-star stands at 1%. However, the spread between the Fed funds rate’s upper bound and the ECB Deposit Rate is 2%. The gap between the July 2023 US and Eurozone OIS is 1.7%. Since European inflation may prove more stubborn than that of the US in the near term, there is scope for the expected interest rate gap to narrow further, especially as the Euro Area final domestic demand is surprisingly more robust than that of the US (Chart 17). What about global growth? The view that the global economy is about to experience a recession is consistent with a stronger dollar, since the greenback is an extremely countercyclical currency. However, the DXY’s 25% rally since January 2021 already prices in such an outcome (Chart 18). Similarly, the euro is trading again at 2002 levels, which is also in line with a global recession with deep negative repercussions for the Eurozone. Additionally, the Euro has fallen 21% since May 2021, which compares to the 21.4% fall in 2008, the 20% decline in 2010, the 18% plunge in 2011/12 and the 24% collapse in 2014/15; yet EUR/USD is much cheaper now than in any of those instances. Moreover, the wide difference between the competitiveness of Germany and that of the rest of the Euro Area has now faded, which means that a major handicap against the euro has disappeared (Chart 19). Chart 18The Dollar Already Foresees A Recession
The Dollar Already Foresees A Recession
The Dollar Already Foresees A Recession
Chart 19Normalizing Eurozone Internal Competitiveness
Normalizing Eurozone Internal Competitiveness
Normalizing Eurozone Internal Competitiveness
This does not mean that the euro is not without risk. First, since the major euro collapse began in June 2021, EUR/USD breakdowns have been followed by average declines of 3.6%, ranging from 2.7% to 4.2%. Since the dollar is a momentum currency, it is unlikely that this time will be different. Second, if the tightening in global policy does cause a financial accident, the dollar will catch one last major bid that could push EUR/USD toward 0.9. As a result, to mitigate the danger, we recommend setting a stop-buy in the euro at EUR/USD 0.965 or 2.6% below the breakdown level of 0.9904. This position comes with a stop-loss at 0.94. For now, we would view this bet as a tactical position if it were triggered. Bottom Line: While a hawkish FOMC is very positive for the dollar, markets now expect foreign central banks to catch up to some extent with the Fed. This process is dollar bearish. Additionally, while a global recession would be supportive of the greenback, the USD already discounts this scenario. Instead, Europe is proving surprisingly resilient, which could soon create a tailwind for EUR/USD. Set a stop-buy at EUR/USD 0.965, with a stop-loss at 0.94. Market Update: European Credit After Central Bank Week For investors concerned with the left-tail risk in European equities, European credit offers a credible alternative in the near term. This asset class is also attractive relative to European government bonds. Taken together, the Fed, the ECB, the BoE, the Riksbank, the Norges Bank, the SNB, and the BoC have tightened policy by 475bps over the past month (Chart 20). Moreover, the SNB’s hike closed the chapter of negative rates in Europe. But make no mistake – there will be a second chapter. Until then, European corporate bond yields have risen enough to offer attractive spreads over duration-matched government bonds and to challenge the earnings yield provided by equities (Chart 21). Besides, the volatility observed in equity markets over the past few months makes the European corporate bond more appealing. Chart 20Central Bank Week
Is Europe About To Be Crushed?
Is Europe About To Be Crushed?
Chart 21Push Back Against TINA Argument
Push Back Against TINA Argument
Push Back Against TINA Argument
In the Euro Area, BB-rated bonds, which are the highest credit quality and largest tranche within the high-yield space, are particularly attractive. They sport a 6.6% YTM, at a spread of 480bps over 3-year German government bond yields. This compares to an equity earnings yield of 7.4% (Chart 21, top panel). In other European corporate bond markets, there is no need to go down in credit quality. Yields-to-maturity for investment grade corporate bonds in the UK, Sweden, and Switzerland provide appealing alternatives to equities, with shorter duration still. This is especially true in Sweden, where the equity earnings yield has collapsed and is now only 60bps above Swedish IG yield, with substantially greater risk. Meanwhile, the spread pickup offered by Swiss IG over Swiss government bonds of similar duration is at its widest in more than ten years (Chart 21, bottom panel). Chart 22Heed The Message From OIS Curve Differentials
Heed The Message From OIS Curve Differentials
Heed The Message From OIS Curve Differentials
This week, we turn neutral on European credit versus US credit. Back in March, we made the case that European credit would outperform its US counterpart in response to a more hawkish Fed than the ECB. Since then, European IG outperformed US IG by 1% on a total return basis. However, with the Fed funds rate at 3.25%, traders now expect more monetary policy tightening from the ECB, which often corresponds to an underperformance of Euro Area credit relative to that of the US (Chart 22, top panel). On the other hand, Swedish IG is expected to outperform US IG over the next six months (Chart 22, bottom panel). Mathieu Savary, Chief European Strategist Mathieu@bcaresearch.com Jeremie Peloso, Editor/Strategist JeremieP@bcaresearch.com Tactical Recommendations Cyclical Recommendations Structural Recommendations
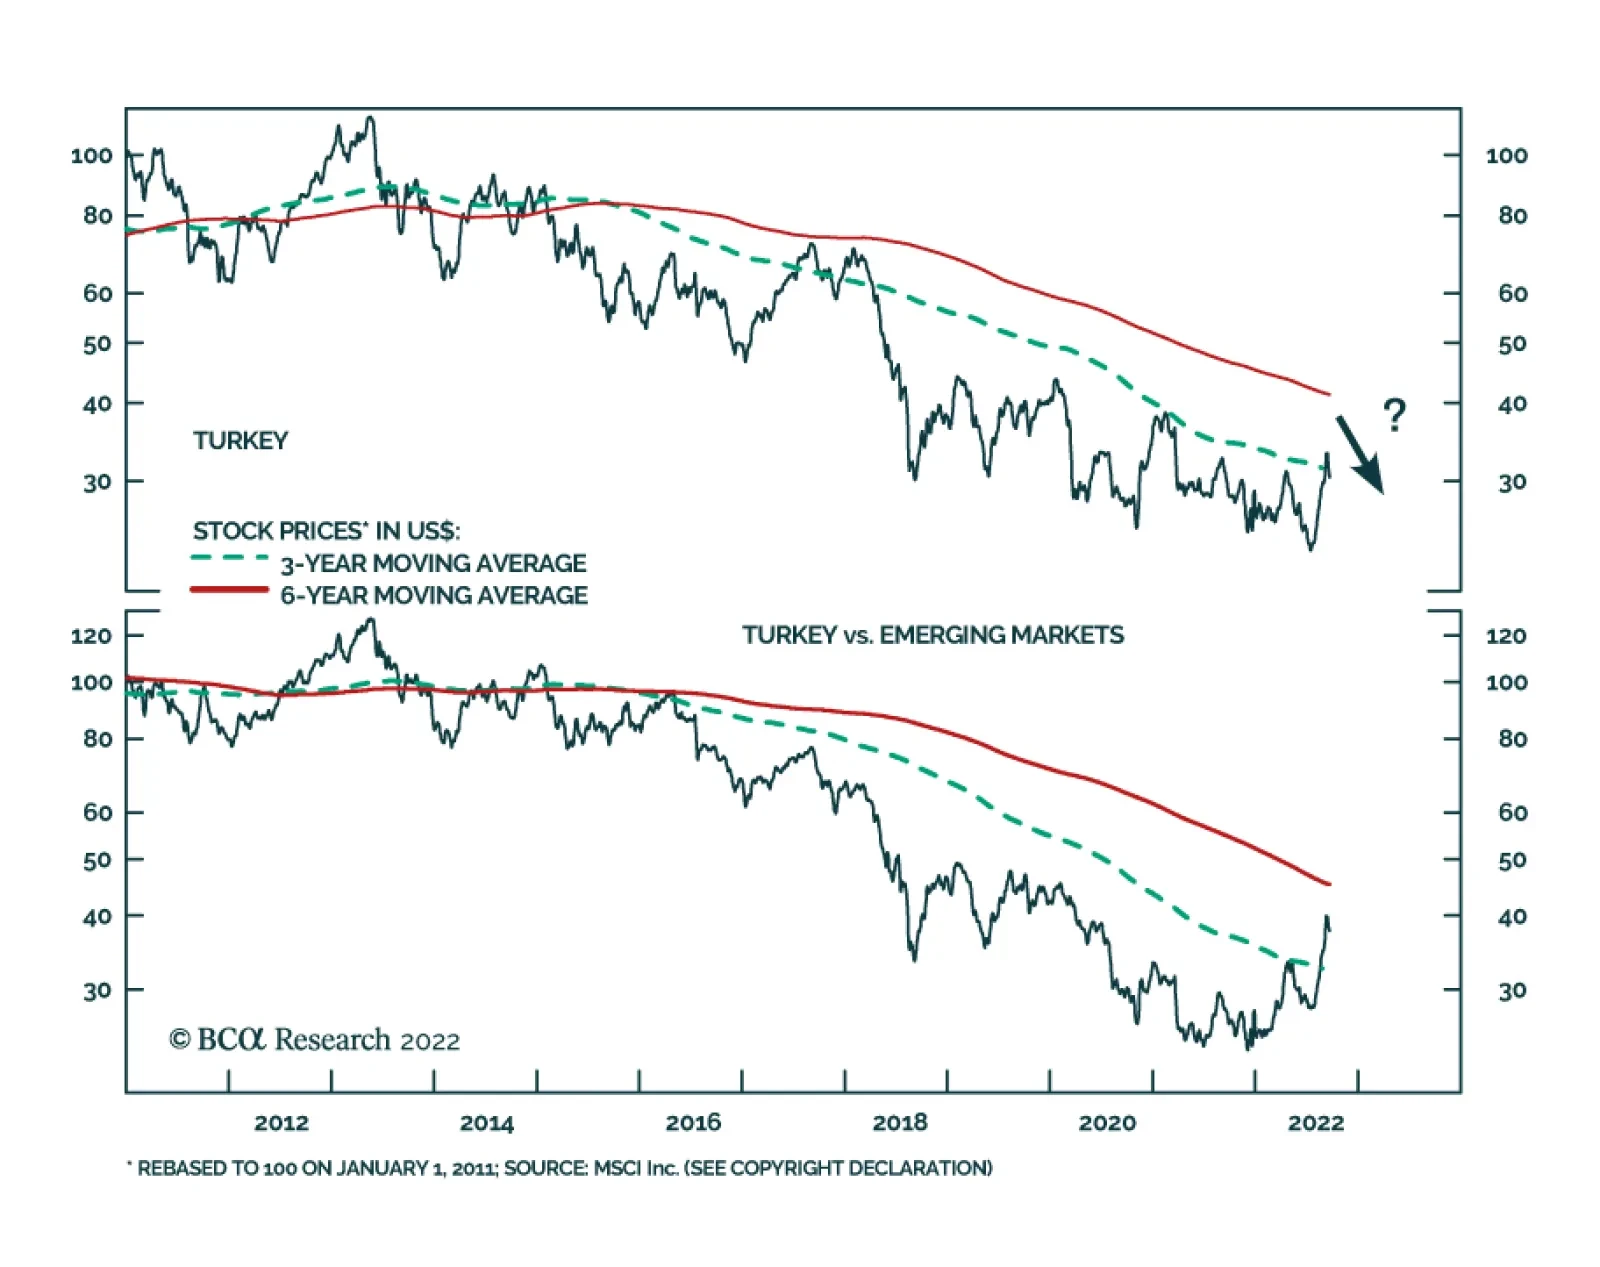
BCA Research’s Emerging Markets Strategy & Geopolitical Strategy services conclude that the Turkish equity rally will soon fade. Turkish stocks have outperformed their Emerging Markets counterparts this year in common currency terms even though the…
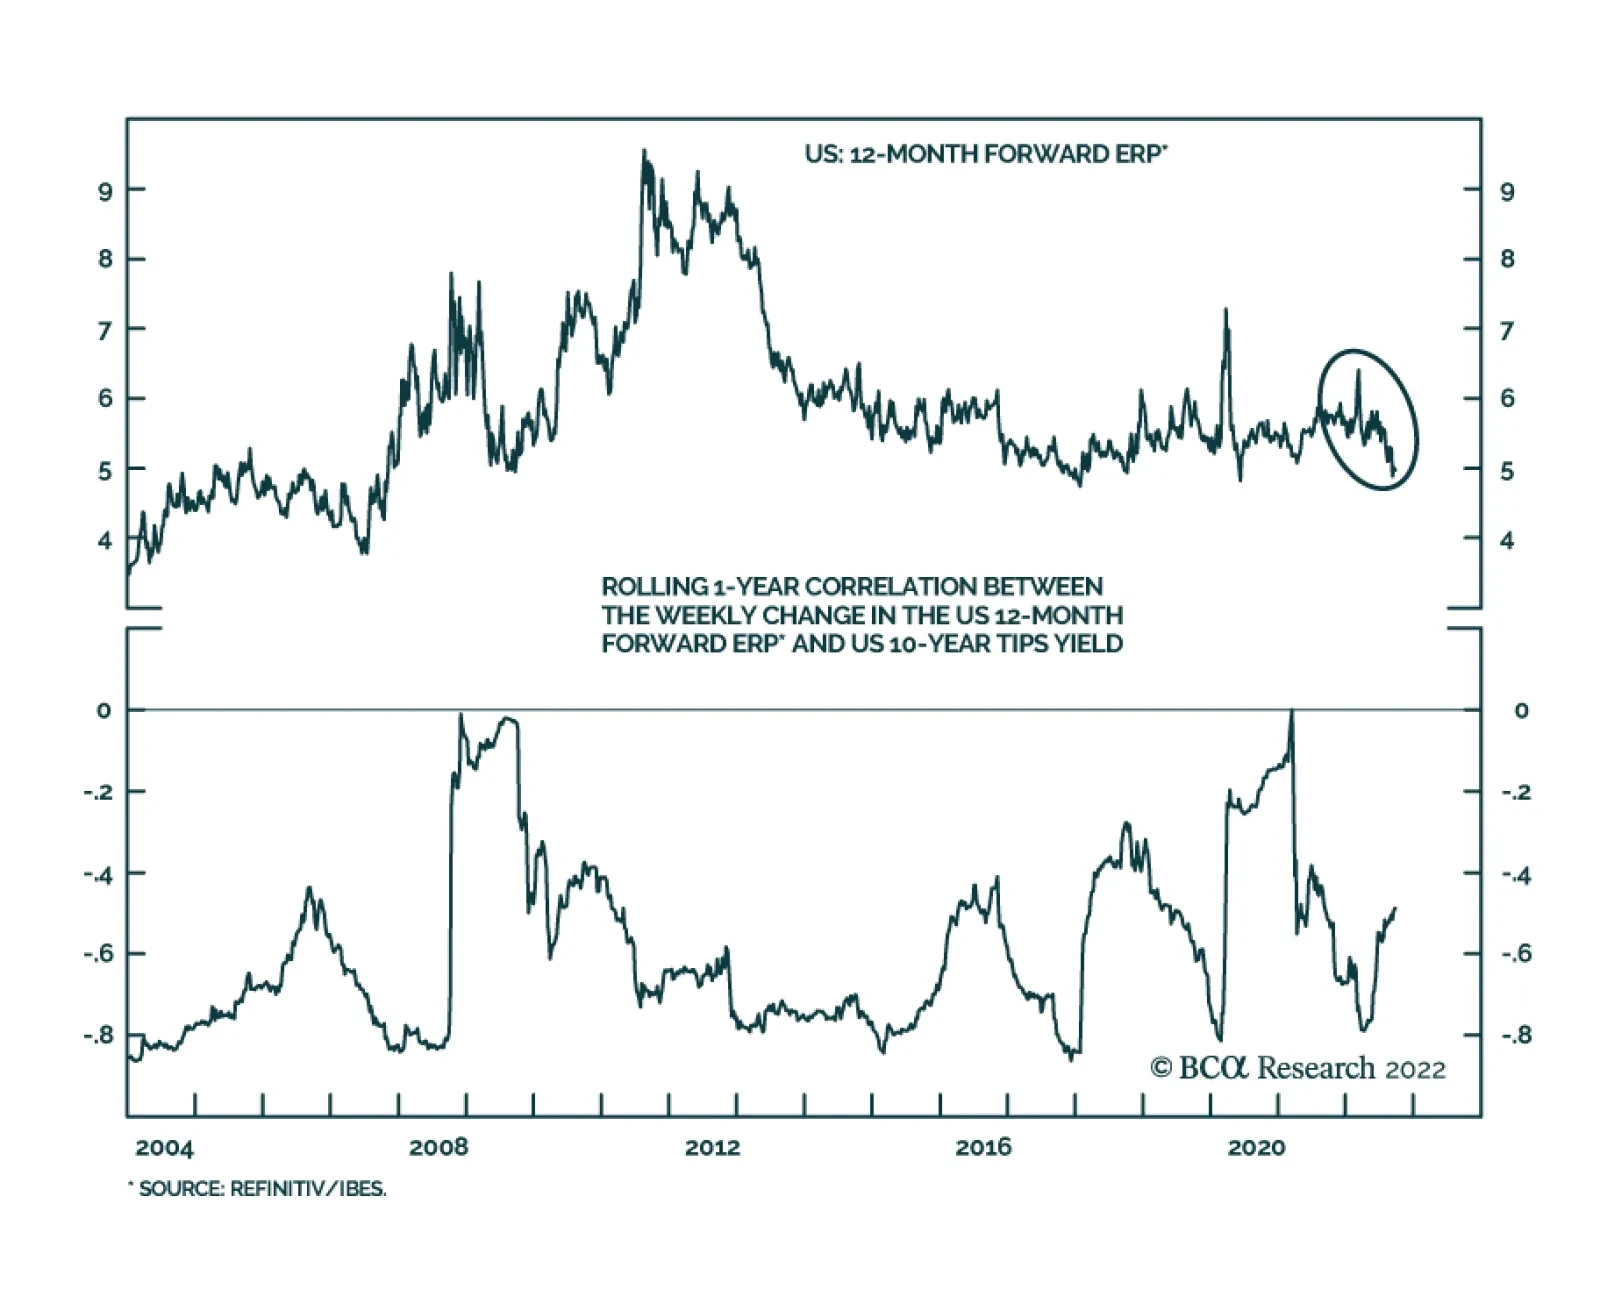
The S&P 500 forward equity risk premium – measured as the difference between the S&P 500 12-month forward earnings yield (the inverse of the forward multiple) and the 10-year TIPS yield – reached its peak in March and has since rolled over. …
Executive Summary Turkey is staring into an abyss: economic crisis that will morph into political crisis in the June 2023 election cycle. President Erdoğan will pursue populist economic policies and foreign policy adventurism to try to stay in power, leading to negative surprises and “black swan” risks over the coming 9-12 months. While Erdoğan and the ruling party are likely to be defeated in elections, which is good news, investors should not try to front-run the election given high uncertainty. Neither Turkey’s economy and domestic politics nor the global economy and geopolitics warrant a bullish view on Turkish assets. GEOPOLITICAL STRATEGY Recommendation (TACTICAL) Initiation Date Return LONG JPY/TRY 2022-09-23 Erdoğan’s Net Negative Job Approval
Turkey: Before And After Erdoğan
Turkey: Before And After Erdoğan
Bottom Line: The Lira will depreciate further versus the dollar. Both Turkish stocks and local currency bonds merit an underweight stance in an EM basket. EM sovereign credit investors, however, should be neutral on Turkish sovereign credit relative to the EM sovereign credit benchmark. Feature Turkey – now technically Türkiye – is teetering on the verge of a national meltdown. The inflation rate is the fastest in G20 countries, both because of a domestic wage-price spiral and soaring global food and fuel prices. President Recep Tayyip Erdoğan and his Justice and Development Party (AKP) have been in power since 2002, making them highly vulnerable to demands for change in the general election slated for June 18, 2023. Yet Erdoğan is a strongman who won a popular vote to revise the constitution in 2017 and increase his personal power over institutions. His populist Islamist movement is starkly at odds with the country’s traditional elite, including the secular military establishment. Given the poor state of the economy, Erdoğan will likely lose the 2023 election but he could refuse to leave office … or he could win the election and be ousted in a coup d'état, as happened in Turkey in 1960, 1971, and 1980.1 Meanwhile Turkey is beset by foreign dangers – including war in Ukraine and instability in the Middle East. Erdoğan will try to use foreign policy to bolster his popular standing. Turkey has inserted itself in various regional conflicts and could instigate conflicts of its own. While global investors are eager to buy steeply discounted Turkish financial assets ahead of what could be a monumental change in national policy in 2023, the country is extremely unstable. It is a source of “black swan” risks. The best bet is to remain underweight Turkish assets unless and until a pro-market election outcome shakes off the two-decade trend toward economic ruin. Turkish Grand Strategy Turkey is permanently at a crossroads. The land-bridge between Europe and Asia, it is secular and cosmopolitan but also Islamist and traditional. Its past consists of the greatness of empires – Byzantine, Ottoman – while its present consists of a frustrating search for new opportunities in a chaotic regional context. The core of the country consists of the disjointed coastal plains around the Bosporus and Dardanelles straits and the Sea of Marmara, where Istanbul is located. The Byzantine and Ottoman empires were seated on this strategic location at the juncture of the world’s east-west trade. To secure this area, the Turks needed to control the larger Anatolian peninsula – Asia Minor – to prevent roving Eurasian powers from invading, just as they themselves had originally invaded from Central Asia. During times of greatness the Turks could also expand their empire to control the Balkan peninsula and Danube river valley up to Vienna, Crimea and the Black Sea coasts, and the eastern Mediterranean island approaches. During the Ottoman empire’s golden days Turkish power extended all the way into North Africa, Mesopotamia, the Nile river valley, and Mecca and Medina. The empire – and the Islamic Ottoman Caliphate – collapsed in 1924 after centuries of erosion and the catastrophes of World War I. Subsequently Turkey emerged as a secular republic. It adapted to the post-WWII world order by allying with the United States and NATO, in conflict with the Soviet Union which encircled the Turks on all sides. The Russians are longstanding rivals of Turkey, notably in the Black Sea and Crimea, and Stalin wanted to get his hands on the Dardanelles and Bosporus straits. Hence alliance with the US and NATO fulfilled one of the primary demands of Turkish grand strategy: a navy that could defend the straits and Turkish interests in the Black Sea and eastern Mediterranean. The collapse of the Soviet Union seemed to usher in an era of opportunity for Turkey. Turkey benefited from democratization, globalization, and foreign capital inflows. But then America’s wars and crises, Russia’s resurgence, and Middle Eastern instability created a shatter-belt surrounding Turkey, impinging on its national security. In this context of limited foreign policy options, Turkey’s domestic politics coalesced around Erdoğan, the AKP, political Islam, and investment-driven economic growth. Erdoğan and the AKP represent the Anatolian, religious, and Middle Eastern interests in Turkey, as opposed to the maritime, secular, and Euro-centric interests rooted in Istanbul. This point can be illustrated by observing that the poorer interior regions have grown faster than the national average over the period of AKP rule, whereas the more developed coastal regions have tended to lag (Map 1). Voting patterns from the 2018 general election overlap with these economic outcomes. The AKP has steered investment capital into the interior to fund infrastructure and property construction while currency depreciation, rather than productivity enhancement, has merely maintained the status quo with the manufacturing export sector in the coastal regions (Chart 1). Map 1Turkey’s Anatolian Model And The Struggle With The Coasts
Turkey: Before And After Erdoğan
Turkey: Before And After Erdoğan
Chart 1Turkey's Export Competitiveness
Turkey's Export Competitiveness
Turkey's Export Competitiveness
Today Turkey faces three distinct obstacles to its geopolitical expansion: Russian aggression: Russia’s resurgence, especially with the seizure of Crimea in 2014 and broader invasion of Ukraine in 2022, threatens Turkey’s interests in the Black Sea and eastern Mediterranean. Turkey must always deal with Russia carefully but over the past 14 years Russia has become belligerent, forcing Turkey to come to terms with Putin while maintaining the NATO alliance. Today Erdoğan tries to mediate the conflict as it does not want to encourage Russian aggression but also does not want NATO to provoke Russia. For instance, Turkey is willing to condone Finland and Sweden joining NATO but only if the West grants substantial benefits to Turkey itself. Ultimately Turkish ties with Russia are overrated. For both economic reasons and grand strategic reasons outlined above, Turkey will cleave to the West (Chart 2). Chart 2Turkey Still Linked To The West
Turkey: Before And After Erdoğan
Turkey: Before And After Erdoğan
Chart 3Turkish Energy Ties With Russia
Turkey: Before And After Erdoğan
Turkey: Before And After Erdoğan
Western liberal hegemony: The EU and NATO foreclosed any Turkish ambitions in Europe. The EU has consolidated with each new crisis while rejecting Turkish membership. This puts limits on Turkish access to European markets and influence in the Balkans. Turkey has guarded its independence jealously against the West. After the Cold War the US expected Turkey to serve American interests in the Middle East and Eurasia. The EU expected it to serve European interests as an energy transit state and a blockade against Middle Eastern refugees. But Turkish interests were often sidelined while its domestic politics did not allow blind loyalty to the West. This led Turkey to push back against the West and cultivate other options, such as deeper economic ties with Russia and China. Turkish dependency on Russian energy is substantial and Turkey has tried to play a mediating role in Russia’s conflict with NATO (Chart 3). Recently Turkey offered to join the Shanghai Cooperation Organization (SCO), a military alliance of Asian powers. However, as with trade, Turkish defense and security ties with the Russo-Chinese bloc are ultimately overrated (Chart 4). There is room for some cooperation but Turkey is not eager to abandon American military backing in a period in which Russia is threatening to control the Black Sea rim, cut off grain exports arbitrarily, and use tactical nuclear weapons. Chart 4Turkey’s Defense Alliance With The West
Turkey: Before And After Erdoğan
Turkey: Before And After Erdoğan
Middle Eastern instability: The Middle East is a potential area for Turkey to increase influence, especially given the AKP’s embrace of political Islam. Turkey benefits from regional economic development and maintains relations with all players. But the region’s development is halting and Turkey is blocked by competitors. The US toppled Iraq in 2003, which strengthened Iran’s regional clout over the subsequent decades. But Iran is not stable and the US has not prevented Iran from achieving nuclear breakout capacity. Turkey cannot abide a nuclear-armed Iran. At the same time, the US continues to support Israel and the Gulf Arab monarchies, which oppose Turkey’s combination of Islam and democratic populism. Russia propped up Syria’s regime in league with Iran, which threatens Turkey’s border integrity. Developments in Syria, Iraq, and Iran have all complicated Turkey’s management of Kurdish militancy and separatism. Kurds make up nearly 20% of Turkey’s population and play a central role in the country’s political divisions. Erdoğan’s Anatolian power base is antagonistic toward the Kurds and regional Kurdish aspirations. China’s strategic rise brings both risks and rewards for Turkey but China is too distant to become the focus of Turkish strategy: China’s dream of reviving the Silk Road across Eurasia harkens back to the glory days of Ottoman power. The Belt and Road Initiative and other investments help to develop Central Asia and the Middle East, enabling Turkey to benefit once again as the middleman in east-west trade (Chart 5). Chart 5Turkey Benefits From East-West Trade
Turkey Benefits From East-West Trade
Turkey Benefits From East-West Trade
But insofar as China’s Eurasian strategy is successful, it could someday impinge on Turkish ambitions, particularly by buttressing Russian and Iranian power. In recent years Erdoğan has experimented with projecting Turkish power in the Middle East (Syria), North Africa (Libya), the Caucasus (Armenia), and the eastern Mediterranean (Cyprus). He cannot project power effectively because of the obstacles outlined above. But he can manipulate domestic and foreign security issues to try to prolong his hold on power. Bottom Line: Boxed in by Russian aggression, western liberal hegemony, and Middle Eastern instability, Turkey cannot achieve its geopolitical ambitions and has concentrated on internal development over the past two decades. However, the country retains some imperial ambitions and these periodically flare up in unpredictable ways as the modern Turkish state attempts to fend off the chaotic forces that loom in the Black Sea, Middle East, North Africa, and Caucasus. The Erdoğan regime is focused on consolidating Anatolian control of Turkey and projecting military power abroad so that the military does not become a political problem for his faction at home. Erdoğan’s Domestic Predicament President Erdoğan has stayed in power for 20 years under the conditions outlined above but he faces a critical election by June 18, 2023 that could see him thrown from power. The result will be extreme political turbulence over the coming nine months until the leadership of the country is settled by hook or by crook. Erdoğan has pursued a strongman or authoritarian leadership style, especially since domestic opposition emerged in the wake of the Great Recession. By firing three central bankers, he has pressured the central bank into running an ultra-dovish monetary policy, producing a 12% inflation rate prior to the Covid-19 pandemic and an 80% inflation rate today. He has also embraced populist fiscal handouts and foreign policy adventurism. Taken together his policies have eroded the country’s political as well as economic stability. From the last general election in 2018 to the latest data in 2022: Real household disposable income growth has fallen from -7.4% to -18.7% (Chart 6). Chart 6Real Incomes Falling
Real Incomes Falling
Real Incomes Falling
Chart 7Turkish Activity Slows Ahead Of Election
Turkish Activity Slows Ahead Of Election
Turkish Activity Slows Ahead Of Election
The manufacturing PMI has fallen from 49.0 to 47.4 (Chart 7). Consumer confidence has fallen from 92.1 to 72.2 (Chart 8). Chart 8Consumer Confidence: Not Better Off Than At Last Election
Consumer Confidence: Not Better Off Than At Last Election
Consumer Confidence: Not Better Off Than At Last Election
Chart 9Erdoğan’s Net Negative Job Approval
Turkey: Before And After Erdoğan
Turkey: Before And After Erdoğan
Bad economic news is finally altering public opinion, with polls now shifting against the president and incumbent party: Since the pandemic erupted, Erdoğan’s approval rating has fallen from a peak of 57% to 40% today. Disapproval has Erdoğan’s risen to 54%, leaving him a net negative job approval (Chart 9). Bear in mind that Erdoğan won the election with 52.6% of the vote in 2018, only slightly better than the 51.8% he received in 2014 and well below the 80% that his AKP predecessor received in 2007. Meanwhile the AKP, which never performs as well as Erdoğan himself, has fallen from a 45% support rate to 30% today in parliamentary polls, dead even with the main opposition Republican People’s Party (Chart 10). The AKP won 42.6% of the vote in 2018, down from 49.5% in the second election of 2015, 49.8% in 2011, and 46.6% in 2007. Chart 10Justice And Development Party Neck And Neck With Republican Opposition
Turkey: Before And After Erdoğan
Turkey: Before And After Erdoğan
The gap between Erdoğan and his Republican rivals has narrowed sharply since the global food and fuel price spike began to bite in late 2021 (Chart 11). Chart 11Erdoğan Faces Tough Re-Election Race
Turkey: Before And After Erdoğan
Turkey: Before And After Erdoğan
However, the 2023 election is not straightforward. There are several caveats to the clear anti-incumbent tendency of economic and political data: Soft Economic Landing? The election takes place in nine months, enough time for surprises to salvage Erdoğan’s presidential campaign, given his and his party’s heavily entrenched rule. For example, it is possible – not probable – that Russia will resume energy exports, enabling Europe to recover, and that central banks will achieve a “soft landing” for the global economy. Turkey’s economy would bounce just in time to help the incumbent party. This is not what we expect (see below) but it could happen. Foreign Policy Victories? Erdoğan could achieve some foreign policy victories. He has negotiated a tenuous deal with Russia and Ukraine, along with the UN, to enable grain exports out of Odessa. He could build on this process to negotiate a broader ceasefire in Ukraine. He could also win major concessions from the US and NATO to secure Finnish and Swedish membership in that bloc. If he did he would come off looking like a grand statesman and might just buy another term in office. Unfortunately what is more likely is that Erdoğan will pursue an aggressive foreign policy in an attempt to distract voters from their bread-and-butter woes, only to destabilize Turkey and the region further. Stolen Election? Erdoğan revised the constitution in 2017 – winning 51.4% of the votes in a popular referendum – to give the presidency substantial new powers across the political system. Using these powers he could manipulate the election to produce a favorable outcome or even cling to power despite unfavorable election results. He does not face nearly as powerful and motivated of a liberal establishment as President Trump faced in 2020 or as Brazilian President Jair Bolsonaro faces in 2022. As noted Erdoğan has a contentious relationship with the Turkish military, so while investors cannot rule out a stolen election, they also cannot rule out a military coup in reaction to an attempted stolen election. Thus the election could produce roughly four outcomes, which we rank below from best to worst in terms of their favorability for global investors: 1. Best Case: Decisive Opposition Victory – 25% Odds – A resounding electoral defeat for the AKP would reverse its unorthodox economic policies in the short term and serve as a lasting warning to future politicians that populism and economic mismanagement lead to political ruin. This outcome would also provide the political capital and parliamentary strength necessary to impose tough reforms and restore a semblance of macroeconomic stability. 2. Good Case: Narrow AKP Defeat – 50% Odds – A narrow or contested election would produce a weak new government that would at least put a stop to the most inflationary AKP policies. It would improve global investor sentiment around Turkey’s eventual ability to stabilize its economy. The new government would lack the ability to push through structural reforms but it could at least straighten out the affairs of the central bank so as to ensure a cycle of monetary policy tightening, which would stabilize the currency. 3. Bad Case: Narrow AKP Victory – 15% Odds – A narrow victory would force the AKP to compromise with opposition parties in parliament and pacify social unrest. Foreign adventurism would continue but harmful domestic policies would face obstructionism. 4. Worst Case: Decisive AKP Victory – 10% Odds – A resounding victory for the ruling party would vindicate Erdoğan and his policies despite their negative economic results, driving Turkey further down the path of authoritarianism, populism, money printing, currency depreciation, and hyper-inflation. He could also be emboldened in his foreign adventurism. Bottom Line: We expect Erdoğan and the AKP to be defeated and replaced. However, Turkey is in the midst of an economic and political crisis and the next 12 months will bring extreme uncertainty. The election could be indecisive, contested, stolen, or overthrown. The aftermath could be chaotic as well as the lead-up. If the AKP stays in power then investors will abandon Turkey and its economy will suffer a historic shock. Therefore investors should underweight Turkey – at least until the next phase in the economic downturn confirms our forecast that the AKP will fall from power. Macro Outlook: Fade The Equity Rally Chart 12Turkish Stock Rally Will Fade Soon; Stay Underweight This Market Versus EM
Turkish Stock Rally Will Fade Soon; Stay Underweight This Market Versus EM
Turkish Stock Rally Will Fade Soon; Stay Underweight This Market Versus EM
The Turkish economy is beset by hyper-inflation. Headline consumer prices are rising at upwards of 80% and core inflation is 65%. Yet Turkish government 10-year bond yields are low and falling: they are down to 11% currently, from a high of 24% at the beginning of the year. Turkish stocks have also outperformed their Emerging Markets counterparts this year in common currency terms even though the lira has been the worst performing EM currency (Chart 12). So, what’s going on in this market? The answer is hidden in the slew of unorthodox policies adopted by the authorities. These measures caused massive distortions in both the economy and the markets. Specifically, late last year, despite very high inflation, the central bank began to cut policy rates encouraging massive loan expansion. As a result, both local currency loans and money supply surged. Which, in turn, completely unhinged inflation (Chart 13). As inflation rose, so did government bond yields. In a bid to keep government borrowing costs low, policymakers changed several bank regulations to force commercial banks to buy government bonds.2 The upshot was that the bond yields stopped tracking inflation and instead began to fall even as inflation skyrocketed. The rampant inflation meant Turkish non-financial firms’ nominal sales skyrocketed. Indeed, sales of all MSCI Turkey non-financials companies have risen by 40% in US dollar terms and 200% in local currency (Chart 14). Chart 13Massive Bank Credit And Money Growth Completely Unhinged The Inflation
Massive Bank Credit And Money Growth Completely Unhinged The Inflation
Massive Bank Credit And Money Growth Completely Unhinged The Inflation
This was at a time when policy rates were being cut. The policy rate has fallen to 12% today from 19% a year earlier. Firms’ local currency real borrowing costs have fallen deeply into negative territory (Chart 15). It helped reduce firms’ costs significantly. Chart 14Surging Sales Amid Deeply Negative Real Borrowing Costs Boosted Firms' Profits
Surging Sales Amid Deeply Negative Real Borrowing Costs Boosted Firms' Profits
Surging Sales Amid Deeply Negative Real Borrowing Costs Boosted Firms' Profits
Chart 15Policy Rates Are Being Cut Even As The Inflation Reigns Havoc
Policy Rates Are Being Cut Even As The Inflation Reigns Havoc
Policy Rates Are Being Cut Even As The Inflation Reigns Havoc
Chart 16Wage Costs Have Risen Too, But Not As Much As Inflation
Wage Costs Have Risen Too, But Not As Much As Inflation
Wage Costs Have Risen Too, But Not As Much As Inflation
Meanwhile, even though wage growth accelerated, it still fell short of inflation, and therefore of nominal sales of the firms (Chart 16). Firms’ wage costs did not rise as much as their prices. All this boosted non-financial firms’ margins. Total profits have risen by 35% in US dollar terms from a year earlier (200% in lira terms). Chart 17The Deluge Of Money Has Led All Kinds Of Asset Prices To Skyrocket
The Deluge Of Money Has Led All Kinds Of Asset Prices To Skyrocket
The Deluge Of Money Has Led All Kinds Of Asset Prices To Skyrocket
On their part, listed financials’ profits have surged by 50% in USD terms and 220% in local currency terms. They benefited both from surging interest income due to rapid loan growth and from massive capital gains on their holding of government securities (see Chart 14 above). All this is reflected in Turkish companies’ earnings per share as well. The spike in EPS has propped up Turkish stocks for past few months. Over the past year, not only have corporate profits and share prices surged, but also house prices have skyrocketed by 170% in local currency terms and 30% in USD terms (Chart 17). In sum, the abnormally low nominal and deeply negative real borrowing costs have produced a money/credit deluge, which has generated a massive inflationary outbreak and has inflated revenues/profits as well as various asset prices. The Lira To Depreciate Further This macro setting is a recipe for a major currency sell-off. First, Europe – the destination of 90% of Turkish exports – will likely slide into recession over the coming year (Chart 18). Chart 18A Slowing Europe Will Materially Dent Turkish Growth Too
A Slowing Europe Will Materially Dent Turkish Growth Too
A Slowing Europe Will Materially Dent Turkish Growth Too
A fall in exports will widen Turkey’s current account deficit. Notably, imports will not fall much since the authorities are pursuing easy money policy. Second, the lack of credible macro policies as well as political crisis will assure that foreign capital escapes Turkey. Turkey will find the current account deficit nearly impossible to finance. Third, the country’s net foreign reserves, after adjusting for the central bank’s foreign currency borrowings and commercial banks’ deposits with the central bank, stand at minus 30 billion dollars. In other words, the central bank now has large net US dollar liabilities. As such, it has little wherewithal to defend the currency. There are very high odds that the lira depreciation will accelerate in the months ahead. Fourth, the slew of unorthodox measures taken by the Turkish authorities will encourage banks to buy more government local currency bonds to suppress the government’s borrowing costs. When commercial banks buy government securities from non-banks, they create money “out of thin air.” Hence, the ongoing money supply deluge will continue. This is bearish for the currency. Notably, the economy will likely enter into recession next year – and yet core inflation will stay very high (30% and above). Recent unorthodox bank regulations are meant to encourage a certain kind of lending – loans to farmers, exporters, and small and medium-sized businesses – while discouraging other kinds. Consequently, the overall loan growth will likely slow in nominal terms. There are already signs that credit is decelerating on the margin (Chart 19). Given the very high inflation, slower credit growth will likely lead to a liquidity crunch for many businesses – forcing them to curtail their activity. Chart 19Bank Credit Will Decelerate Due To Many Unorthodox Bank Regulations
Bank Credit Will Decelerate Due To Many Unorthodox Bank Regulations
Bank Credit Will Decelerate Due To Many Unorthodox Bank Regulations
Chart 20Bank Loans Are Already Contracting in Real Terms: Not a Good Omen For Real GDP
Bank Loans Are Already Contracting in Real Terms: Not a Good Omen For Real GDP
Bank Loans Are Already Contracting in Real Terms: Not a Good Omen For Real GDP
Indeed, in real terms (deflated by core CPI), local currency loan growth has already slipped into negative territory. This is a bad omen for the overall economy: contracting real loan growth is a harbinger of recession (Chart 20). In short, Turkey is looking into an abyss: a recession amid high inflation (i.e., stagflation) as well as a brewing political crisis (with Erdoğan likely doubling down on unorthodox and populist policies). All this point to another period of a large currency depreciation. While the country will likely change direction to avoid the abyss, investors should wait to allocate capital until after the change in direction is confirmed. Investment Takeaways The Turkish lira will fall much more vis-à-vis the US dollar in the year ahead. Both Turkish stocks and local currency bonds merit an underweight stance in an EM basket. EM sovereign credit investors, however, should be neutral on Turkish sovereign credit relative to the EM sovereign credit benchmark. Turkey is involved in an economic crisis that will devolve into a political crisis over the election cycle. While Erdoğan and the AKP are likely to fall from power as things stand today, they are heavily entrenched and will be difficult to remove, creating large risks of an indecisive or contested election in 2023 that will increase rather than decrease policy uncertainty and the political risk premium in Turkish assets. As a strongman leader Erdoğan has consolidated political power in his own hands, so there is no one to take the blame for the country’s economic mismanagement – other than foreigners. Hence there is a distinct risk that his foreign policy adventurism will escalate between now and next year, resulting in significant military conflicts or saber-rattling. These will shake out western investors who try to speculate on the likelihood that the election or the military will oust Erdoğan and produce sounder national and economic policies. That outcome is indeed likely but Erdoğan is not going without a fight. Our Geopolitical Strategy also recommends tactically shorting the lira versus the Japanese yen in light of global slowdown, extreme geopolitical risk, and the Bank of Japan’s desire to prevent the yen from falling too far. Matt Gertken Chief Geopolitical Strategist mattg@bcaresearch.com Rajeeb Pramanik Senior EM Strategist rajeeb.pramanik@bcaresearch.com Andrija Vesic Consulting Editor Footnotes 1 Sinan Ekim and Kemal Kirişci, “The Turkish constitutional referendum, explained,” Brookings Institution, April 13, 2017, brookings.edu. 2 The central bank replaced an existing 20% reserve requirement ratios for credits with a higher 30% treasury bond collateral requirement. Lenders will have to cut interest rates on commercial loans (except for loans to farmers, exporters, and SMEs). Otherwise, banks will have to maintain additional securities. Strategic Themes Open Tactical Positions (0-6 Months) Open Cyclical Recommendations (6-18 Months) Regional Geopolitical Risk Matrix
Listen to a short summary of this report Executive Summary Sales & Profit Margins: The Two Propellers That Powered The Post-GFC US Rally
What Has Driven US Outperformance Post-GFC And Can This Persist?
What Has Driven US Outperformance Post-GFC And Can This Persist?
US equity markets underperformed the global benchmark by 10% over 2000-08. Since then, the US has outperformed the global benchmark by about 170%. So, what has driven the US’ chartbusting performance in the post-GFC period? If we break down the US’ price performance into three parts – namely price-to-earnings ratio, net profit margins, and sales – then it becomes clear that growth in the latter two elements played a key role in driving US outperformance in the post-GFC era. Can the US’ outperformance relative to global markets persist going forward? It appears unlikely that the US’ high profit margins can sustain these levels of growth going forward. Distinct from the mean reversion argument, the US’ high profit margins are unusually concentrated amongst a fistful of firms. US firms may also find it challenging to maintain high sales growth as US GDP growth slows and given that America’s antitrust philosophy may soon undergo a once-in-a-generation change. Finally, it is worth noting that ‘sector composition’ effects played a significant role in driving US outperformance over 2008-22. Given that we expect outperforming sectors like Tech to become underperformers, this effect could become weaker going forward, thereby subverting another source of the US’ outperformance. Bottom Line: Forecasting is a tenuous science but given that the two prime propellers of the US’ performance engine are likely to confront headwinds going forward, investors should consider reducing allocations to US equities over a longer term, strategic horizon. Dear Client, I am meeting clients in Asia this week while also working on our Fourth Quarter Strategy Outlook, which will be published next week, followed by my webcast the week after. In lieu of our regular report this week, you are receiving a Special Report from my colleague, Ritika Mankar, discussing the sources of US equity outperformance over the past 14 years and the likely path ahead. Best Regards, Peter Berezin, Chief Global Strategist US Stock Market Dominance – It Wasn’t Always This Way Let us assume that you could travel back in time, and today was December 31, 2008. On this day you know that US and Japanese equity markets have underperformed the global benchmark (Chart 1). You also know that Europe (i.e., EU-27) has done marginally better than the US, while Emerging Markets (EM) have been the star outperformer. Let us further assume that by close of play today you have to deploy US$10bn across these four equity markets (across the US, Europe, Japan, and EM). As if the task of taking this decision on the last day of this historic year was not enough, let us assume that the funds you invest must be locked in until the fall of 2022. Finally, let us add one more condition to this task – let us suppose that you have no idea how markets would perform over the 2008-22 period, but you have perfect foresight about how the nominal GDP of these four regions would look like in 2022. Specifically, you know that EM GDP will have a terrific run between 2008 to 2022, US GDP will increase but by a far less impressive degree, European GDP will grow only slightly, and Japan’s GDP would be lesser in 2022 than it was in 2008 (Chart 2). Chart 1US Equities Underperformed The Global Benchmark By 10% Over 2000-08
US Equities Underperformed The Global Benchmark By 10% Over 2000-08
US Equities Underperformed The Global Benchmark By 10% Over 2000-08
Chart 2EM GDP Has More Than Doubled Since The GFC
What Has Driven US Outperformance Post-GFC And Can This Persist?
What Has Driven US Outperformance Post-GFC And Can This Persist?
Chart 3US Equities Outperformed The Global Benchmark By About 170% Over 2008-22YTD
US Equities Outperformed The Global Benchmark By About 170% Over 2008-22YTD
US Equities Outperformed The Global Benchmark By About 170% Over 2008-22YTD
If you were to take an investment decision based only this information, what is certain is that the fund you manage would underperform by a painful degree. This is because we now know that even though US markets had poor momentum in 2008, and the US’ GDP expansion paled relative to EM, US equity markets outperformed global markets by a wide margin since 2008 (Chart 3). On the other hand, despite positive momentum and high GDP growth, EM emerged as a distant second-best performer. Japan miraculously made it to third place despite a contraction in nominal GDP, and finally Europe ended up being the worst performer. If market momentum and GDP growth cannot explain these market movements, then what drove the US' outstanding performance in the post-GFC period? In this Special Report, we delve into answering this question in detail. The purpose of peeling the onion of the US' performance is simple – we hope to extract the insights that investors need to construct alpha-generating portfolios, in a world where forward time travel is not a possibility (yet). The US’ Performance Has Been Powered More By Earnings, Less By Valuations The two basic building blocks of any equity index are its earnings and its price-to-earnings ratio. The former captures the fundamentals backing an index, while the latter quantifies the valuation element. Breaking down the US’ performance into these two parts shows that earnings have been the prime factor that have propelled the rise of US equity markets in the post-GFC era (Chart 4). That earnings have been an important driver of the US’ outperformance becomes even more apparent when US earnings are compared to that of other major markets. For instance, the steep expansion in US earnings contrasts with the situation across the Atlantic. In Europe, earnings have trended lower relative to the global benchmark since 2008 and an increase in relative valuations has helped lend a floor to the index (Chart 5). The earnings report card for Japan and EM, on the other hand, have been surprisingly similar as earnings failed to rise meaningfully in both these geographies in the post-GFC period (Chart 6 and 7). Chart 4Earnings Have Played A Key Role In Propelling The Post-GFC US Rally
What Has Driven US Outperformance Post-GFC And Can This Persist?
What Has Driven US Outperformance Post-GFC And Can This Persist?
Chart 5European Equities Supported More By Valuation Multiples
What Has Driven US Outperformance Post-GFC And Can This Persist?
What Has Driven US Outperformance Post-GFC And Can This Persist?
Chart 6Earnings Growth Has Been Unimpressive In Japan Too
What Has Driven US Outperformance Post-GFC And Can This Persist?
What Has Driven US Outperformance Post-GFC And Can This Persist?
Chart 7Earnings Have Trended Lower In EM Since 2008
What Has Driven US Outperformance Post-GFC And Can This Persist?
What Has Driven US Outperformance Post-GFC And Can This Persist?
In summary, the US' price-to-earnings ratio has had a meaningful role in driving US outperformance in the post-GFC period (Chart 8), but earnings expansion has played an outsized role (Chart 9). Chart 8Relative Valuation Multiples Have Played A Key Role In Supporting European Markets
What Has Driven US Outperformance Post-GFC And Can This Persist?
What Has Driven US Outperformance Post-GFC And Can This Persist?
Chart 9Earnings Expansion In The US Has Been Phenomenal
What Has Driven US Outperformance Post-GFC And Can This Persist?
What Has Driven US Outperformance Post-GFC And Can This Persist?
In fact, the growth in earnings in the US in the post-GFC era has been so noteworthy that if US equity market prices were to be broken down into its two building blocks i.e., earnings and price-to-earnings ratio, then the lion’s share of US equity market prices today would be attributed to its earnings (Chart 10). Expectedly, this contrasts with the situation in Europe where equity market prices have managed to stay afloat owing to a re-rating in its price-to-earnings ratio (Chart 11). These attribution analysis numbers are not meant to be taken literally, but rather, reflect the relative role played by earnings and price-to-earnings ratios in supporting the prices of regional indices. Chart 10US Equities: Supported More By Earnings
What Has Driven US Outperformance Post-GFC And Can This Persist?
What Has Driven US Outperformance Post-GFC And Can This Persist?
Chart 11EU Equities: More Reliant On Multiples
What Has Driven US Outperformance Post-GFC And Can This Persist?
What Has Driven US Outperformance Post-GFC And Can This Persist?
The Unsung Hero Behind The US’ Outperformance - Record Sales Expansion The index of a region can also be envisaged as the product of three elements, namely: (1) its price-to-earnings ratio; (2) its net profit margins; and (3) its sales. In other words: Price = (Price / Earnings) x (Earnings / Sales) x (Sales) While the US' healthy earnings tend to attract disproportionate investor attention, this formulation shows how a surge in US sales was the bigger driver of US outperformance (Chart 12). US profit margins experienced a sharp surge relative to global profit margins over the 2008-12 period, but then this parameter flatlined. US sales, on the other hand, have managed to register a steady march upwards over the entirety of the post-GFC period. The growth in sales of listed American corporations has in fact been so remarkable that a grand total of ten American firms now have annual sales of over $200 billion – which marks an all-time high for the US (Chart 13). Chart 12Post-GFC US Rally Powered By Record Sales Expansion
What Has Driven US Outperformance Post-GFC And Can This Persist?
What Has Driven US Outperformance Post-GFC And Can This Persist?
Chart 13The US Is Home To Ten Firms With Revenues Of +$200bn
What Has Driven US Outperformance Post-GFC And Can This Persist?
What Has Driven US Outperformance Post-GFC And Can This Persist?
Furthermore, the US’ lead on sales today is meaningful not only by its own historical standards, but by cross-country standards too. The rise in US sales has meant that the US is now home to half of the twenty largest listed corporations globally (Table 1). Conversely, Europe and Japan, despite being the third and fourth largest economies of the world, respectively, together account for only three names on this list. Notably however, Emerging Markets have managed to punch above their weight and are home to six of the top twenty firms by sales globally. Table 1The US Today Dominates The Global List Of Top 20 Firms By Revenue
What Has Driven US Outperformance Post-GFC And Can This Persist?
What Has Driven US Outperformance Post-GFC And Can This Persist?
The steep rise in America’s sales in the post-GFC world is also unique because no other major market has experienced such a clear upward move in sales as the US has. Europe and Japan in fact saw their sales-per-share trend downwards in the post-GFC period (Chart 14 and Chart 15). Emerging markets were the only other major global market where sales-per-share managed to stay steady relative to the global benchmark (Chart 16). Chart 14Europe’s Sales Have Trended Lower Post-GFC
What Has Driven US Outperformance Post-GFC And Can This Persist?
What Has Driven US Outperformance Post-GFC And Can This Persist?
Chart 15Japan’s Sales Also Trended Lower Post-GFC
What Has Driven US Outperformance Post-GFC And Can This Persist?
What Has Driven US Outperformance Post-GFC And Can This Persist?
Finally, thanks to the high growth in US sales, the contribution of sales to US equity prices is far higher than the contribution of its net profit margins or its price-to-earnings ratio (Chart 17). This once again is in sharp contrast to a market like Europe, where only a smidgeon of the European equity prices pie can be attributed to its sales. Chart 16EM Sales Have Expanded Marginally Post-2008
What Has Driven US Outperformance Post-GFC And Can This Persist?
What Has Driven US Outperformance Post-GFC And Can This Persist?
Chart 17The Main Engine That Powers US Markets Is ‘Sales’
What Has Driven US Outperformance Post-GFC And Can This Persist?
What Has Driven US Outperformance Post-GFC And Can This Persist?
Chart 18US Profit Margins Have Also Been Expanding Steadily Post-GFC
What Has Driven US Outperformance Post-GFC And Can This Persist?
What Has Driven US Outperformance Post-GFC And Can This Persist?
Distinct from the role played by growing sales, the US’ stellar post-GFC performance has also been powered by growing profit margins. It is notable that the US has experienced an unusually strong upward movement in its profit margins in the post-GFC period (Chart 18). Japan is the only other region which has seen its profit margins expand post-GFC, with both Europe and EM having experienced a fall in profit margins from the levels seen in 2008. A Quick Note On Dividends: The US Lags On Dividend Yields But Leads On Buybacks Thus far we have focused on the returns generated by the US market relative to the world and the factors that drove US outperformance since the GFC. If one were to focus on the dividend yield component, then it is notable that the US lags its peers on this front. Post-GFC, the first major cresting of dividend yields globally took place in 2009-10. Then the next major move down in yields took place in 2020 (Chart 19). While globally, yields have now recovered from this last dip, the US finds itself lagging on this metric which matters for pension funds that rely on annuities (Chart 20). Not only have dividend yields in the US almost halved since the GFC, but the gap between dividend yields offered by the US and other markets has widened over the last few years. Europe however has managed to stay the undisputed leader when it comes to dividend yields through most of the 21st century. Chart 19Global Dividend Yields Have Recovered From The Post-2020 Fall
What Has Driven US Outperformance Post-GFC And Can This Persist?
What Has Driven US Outperformance Post-GFC And Can This Persist?
Chart 20US Lags Global Markets On Dividend Yields
What Has Driven US Outperformance Post-GFC And Can This Persist?
What Has Driven US Outperformance Post-GFC And Can This Persist?
Chart 21Pace Of Buybacks In The US Has Been Meaningful
Pace Of Buybacks In The US Has Been Meaningful
Pace Of Buybacks In The US Has Been Meaningful
Notably, however, while the US lags its peers on dividend yields, it leads when it comes to buybacks. The latter is evident from the fact that proxy measures of shares outstanding have trended lower in the US in the post-GFC period, as compared to the rest of the world (Chart 21). Finally, it is important to note that both the growth in dividends-per-share as well as the absolute level of dividends in the US has been high. This parameter has increased by 2.4 times since 2008 and US dividends in absolute terms are nearly 5 times that of Europe’s dividends today. The only reason why dividend yields have stayed low despite this is because US equity prices have had a stellar run in the post-GFC period. Can This Extent Of US Outperformance Persist? Having delved into the drivers of the US’ performance, we now know that a record expansion in sales and net profit margins have driven its outstanding performance in the post-GFC era. This in turn means that the probability of the US continuing to outperform over the next few years will be closely linked to its ability to maintain a lead on these two parameters. So how is the US positioned with respect to both these factors? The US’ High Profit Margins Appear Unsustainable, For A Wide Range Of Reasons We have established the fact that expanding profit margins have been a supporting driver of the US’ outperformance in the post-GFC period. Now, the consensus view is that US profit margins are extraordinarily high and that they will eventually come down to earth. The logic for this argument is often grounded in mean reversion. We have also previously highlighted that most of the increase in US profit margins has occurred due to rising margins within the tech sector and the accompanying increase in the market cap weight of tech within benchmark indices. Chart 22US High Profit Margins Are Concentrated Amongst Top Firms
What Has Driven US Outperformance Post-GFC And Can This Persist?
What Has Driven US Outperformance Post-GFC And Can This Persist?
Aside from these reasons, two more factors could lead to the compression of US profit margins over the next few years. Firstly, it is worth noting that the US' high profit margins are unusually concentrated amongst a handful of firms. While the US as a market is characterized by high margins at the headline level, profit margins of companies below the top tier are notably lower than that of the top tier (Chart 22). If profit margins were uniformly high across the US listed space and the divergence was low, then the probability of sustaining elevated margins would have been higher. But given that the US uniquely suffers from a high profit margin concentration problem, the probability of the sustainability of US high profit margins appears lower. Secondly, history suggests that in the globalized world that we live in, any region’s profit margins fail to persist above the global average beyond a maximum of 15 years (Table 2). This makes sense and is in line with economic theory which suggests that when profitability in a particular market is excessive, then new firms will enter this space, increase competition, and thereby exert downward pressure on the incumbents’ profit margins. Table 2Regional Profit Margins Seldom Persist Above The Global Average Beyond 15 Years
What Has Driven US Outperformance Post-GFC And Can This Persist?
What Has Driven US Outperformance Post-GFC And Can This Persist?
Given that US profit margins have now persisted above global levels for almost 13 years, if history were to repeat itself, then it appears highly likely that US profit margins would trend towards the global average over the next 2 years. US Sales Growth: A Peak Appears Nigh We now know that the rapid sales expansion experienced by US firms has been the prime driver of the US stock market outperformance since the GFC. However, the prognosis for this variable also appears shaky for the US. Chart 23US GDP And Sales Tend To Move In Lockstep
What Has Driven US Outperformance Post-GFC And Can This Persist?
What Has Driven US Outperformance Post-GFC And Can This Persist?
The key macro variable which has the tightest theoretical link to the sales generated by the companies in a country is the country’s nominal GDP. Even as companies headquartered in the US end up selling to the global economy, history suggests that the link between the US’ nominal GDP and the sales generated by listed American firms are closely linked (Chart 23). Given that the pace of US nominal GDP growth is set to slow over the next few years (relative to both its past and relative to other major economies), US companies’ sales growth could end up slowing too (Chart 24). Also, given that the US revenue-to-nominal GDP ratio is already elevated, it is likely that even as the US’ nominal GDP keeps growing, the pace of conversion of this GDP into revenues will stay the same or may even diminish over the coming decade. Chart 24US GDP Growth Is Set To Slow
What Has Driven US Outperformance Post-GFC And Can This Persist?
What Has Driven US Outperformance Post-GFC And Can This Persist?
Then from a bottom-up perspective, we are also of the view that the US economy’s ability to spawn mega-sized companies (by sales) may become increasingly compromised over the next decade. This is because a peculiar stagnation is in the works in the middle tier of American firms, which tend to become the mega-sized corporations of tomorrow. Finally, the US' antitrust philosophy is likely to undergo a once-in-a-generation change under the Biden administration. This could mean that America’s mega-scaled firms (which have had a free run up until now) could end-up baiting regulatory attention, restricting their ability to grow sales. US Price Performance: Strong Sector Effects Are Unlikely To Persist Chart 25Sector Composition Effect: Strongest For The US
What Has Driven US Outperformance Post-GFC And Can This Persist?
What Has Driven US Outperformance Post-GFC And Can This Persist?
Lastly, it is worth noting that the price performance of the broad US equity index subverts the role played by “sector composition” in driving the US' outperformance. The fact that returns generated by the US benchmark are higher than the returns generated by a hypothetical US index which weights all sectors equally suggests that “sector composition” effects had a meaningful role in driving US outperformance. In fact, as compared to other major markets, the sector composition effect is the most prominent for the US (Chart 25). Another way of quantifying the role of sector effects is to compare the US’ market cap expansion relative to a global benchmark after removing the market cap of top-performing sectors. Expectedly, US outperformance relative to the global benchmark over the post-GFC period gets substantially reduced if the market cap of the three top-performing sectors (namely Information Technology, Consumer Discretionary, and Health Care) is adjusted for (Chart 26). To complicate matters, the sector composition effect in the US has been unwinding but remains high (Chart 27). Given that we expect outperforming sectors like Tech to turn into underperformers, the sector constitution effect in the US could weaken going forward, thereby subverting another source of US outperformance. Chart 26Extent Of US Outperformance Weakens Sans Tech, Consumer Discretionary, And Health Care
What Has Driven US Outperformance Post-GFC And Can This Persist?
What Has Driven US Outperformance Post-GFC And Can This Persist?
Chart 27Sector Composition Effect In The US Remains High
What Has Driven US Outperformance Post-GFC And Can This Persist?
What Has Driven US Outperformance Post-GFC And Can This Persist?
Investment Conclusions The prime drivers of US outperformance relative to the global benchmark in the post-GFC period have been ascendant sales and rising net profit margins. Forecasting is a tenuous science but given that both these propellers of the US equity market engine are set to face headwinds, investors should consider reducing allocations to US equities over a longer term, strategic horizon. Ritika Mankar, CFA Editor/Strategist Ritika.Mankar@bcaresearch.com
Executive Summary The Chinese Economy Is Facing Deflationary Pressures
The Chinese Economy Is Facing A Risk of Deflation
The Chinese Economy Is Facing A Risk of Deflation
China’s economy is facing a deflationary threat. Core consumer price inflation is below 1%, and producer (ex-factory) price inflation has decelerated rapidly and will soon deflate. Bank loan growth remains subdued due to the deepening property market slump and lackluster credit demand in the private sector. In view of the reluctance of households and enterprises to spend, invest and hire, the multiplier of stimulus in this cycle will be lower than in previous ones. China’s property market woes continued in August and a turnaround is not likely in the near term. China’s overseas shipments are set to contract in the months ahead. China needs to reduce interest rates and weaken its exchange rate to battle deflationary pressures and reflate the system. Thus, Chinese authorities will not prevent a further depreciation in the yuan versus the US dollar - as long as the decline is orderly and gradual. Bottom Line: The risk-reward profile remains unattractive for Chinese stocks in absolute terms. For global equity portfolios, we recommend a neutral allocation to Chinese onshore stocks and an underweight stance in investable stocks. Escalating deflationary pressures mean that onshore asset allocators should continue to favor government bonds over stocks. Recovery prospects for China’s economy remain dim. Despite August’s better-than-expected growth in industrial output and retail sales, economic activity in the months ahead will be weighed down by a lingering real estate slump, recurring disruptions linked to Covid and a budding contraction in exports. Related Report China Investment StrategyThe Party Congress And Beyond As discussed in our previous report, China’s transition from zero Covid tolerance to a managed approach to living with the virus will be a measured but protracted process. The conditions are not yet in place for a pivotal change in the country’s dynamic zero-Covid strategy. Thus, the risk of outbreaks and ensuing lockdowns still constitute a major hurdle for private domestic demand in the near term. China’s exports are set to shrink in the coming months due to a relapse in global demand for consumer goods (ex-autos). Domestic and external headwinds confronted by China underscore that the primary economic risk is deflation. Chinese policymakers need to lower interest rates and allow the currency to depreciate to battle deflationary pressures. Odds are high that the PBoC will cut rates further. However, the efficacy of reflationary efforts is doubtful due to three factors: uncertainty over the dynamic zero-Covid policy and the outlook for Omicron; persistent real estate woes; and the downbeat sentiment among corporates and households. Chart 1Upsides In Chinese Equity Prices Are Capped Without Aggressive Stimulus
Upsides In Chinese Equity Prices Are Capped Without Aggressive Stimulus
Upsides In Chinese Equity Prices Are Capped Without Aggressive Stimulus
Therefore, our outlook for China’s business cycle remains a U-shaped recovery with risks skewed to the downside in the next few months. Consistently, the risk-reward of Chinese stocks remains poor. Their absolute performance is also at risk from a further selloff in US/global equities as discussed in the latest Emerging Markets Strategy report. We continue to recommend a neutral stance on Chinese onshore stocks and underweight allocation for Chinese offshore stocks within a global equity portfolio (Chart 1). Depressed Credit Demand And Low Stimulus Multiplier Demand for credit from China’s private sector remains depressed, reflected by a very muted credit impulse when local government bond issuance is excluded (Chart 2). Critically, banks have been unable to accelerate the pace of lending even after the PBoC cut rates and urged them to boost lending (Chart 3). Chart 2The Credit Impulse Remains Muted
The Credit Impulse Remains Muted
The Credit Impulse Remains Muted
Chart 3Subdued Loan Growth Despite Lower Interest Rates
Subdued Loan Growth Despite Lower Interest Rates
Subdued Loan Growth Despite Lower Interest Rates
The growth rate of medium-to-long-term consumer loans, which are primarily composed of residential mortgages, continues to plunge (Chart 4, top panel). New household loan origination is contracting (Chart 4, bottom panel). Our proprietary measure of marginal propensity to spend for households dropped to an all-time low, mirroring consumers’ downbeat sentiment (Chart 5). Chart 4Household Loan Demand Is Depressed...
Household Loan Demand Is Depressed...
Household Loan Demand Is Depressed...
Chart 5...And Sentiment Remains in The Doldrums
...And Sentiment Remains in The Doldrums
...And Sentiment Remains in The Doldrums
Corporate credit flow improved slightly with medium-to-long-term corporate loan growth ticked up in August (Chart 6). While it is difficult to quantify, it is likely that the recent modest improvement in corporate loan growth was mainly due to state-owned banks’ lending to local government financing vehicles (LGFV) to purchase land. The latter is de-facto bailing out local governments that heavily depend on land sales. Land transfer revenues made up 23% of local government aggregate expenditure in the past 12 months (Chart 7). Chart 6Corporate Loan Growth Slightly Improved In August
Corporate Loan Growth Slightly Improved In August
Corporate Loan Growth Slightly Improved In August
Chart 7Land Sales Are Critical For Local Government Financing
Land Sales Are Critical For Local Government Financing
Land Sales Are Critical For Local Government Financing
Chart 8Corporates' Investment Sentiment Is Worsening
Corporates' Investment Sentiment Is Worsening
Corporates' Investment Sentiment Is Worsening
Consistent with poor business sentiment, enterprises’ investment expectation deteriorated in August (Chart 8). Given private-sector’s reluctance to borrow, the multiplier of stimulus will be lower than that in previous cycles. Consequently, China’s policymakers have no choice but to bump up fiscal stimulus and cut interest rates even more. Property Market: No Turnaround In Sight Yet China’s property market woes continued in August with a further weakening in housing market indicators (Chart 9). Home sales tumbled by 25% in August from a year ago. Real estate investment shrinkage deepened and home price deflation accelerated. Property market indicators probably will begin to show a rate-of-change improvement in the coming months due to a more favorable base effect. However, their annual growth rates will remain deeply negative, probably posting a double-digit retrenchment from a year ago. In brief, the level of housing sales will continue withering (Chart 10, top panel). Chart 9Housing Market Activity And Prices
Housing Market Activity And Prices
Housing Market Activity And Prices
Chart 10Shrinking Sales = Less Funding
Shrinking Sales = Less Funding
Shrinking Sales = Less Funding
Shrinking home sales mean a scarcity of funding for real estate developers who heavily rely on advance payments from homebuyers to finance their projects (Chart 10, middle and bottom panels). Hence, a contraction in property investment will remain intact for the next three to six months and housing construction activities will stay depressed (Chart 11). Chart 11Less Funding = Reduced Completions And Investments
Less Funding = Reduced Completions And Investments
Less Funding = Reduced Completions And Investments
Chart 12Households Are Reluctant To Buy When House Prices Are Falling
Households Are Reluctant To Buy When House Prices Are Falling
Households Are Reluctant To Buy When House Prices Are Falling
Interestingly, to revive housing sales, Guangzhou (a southern Chinese metropolis) plans to loosen price controls to allow new house prices to drop up to 20%. Other provinces might follow suit. This would eventually make housing more affordable, but homebuyers might be reluctant to buy until house prices bottom (Chart 12). Therefore, an imminent rebound in home sales is unlikely. Overseas Shipments Are Set To Shrink China’s export growth, in both value and volume terms, slowed noticeably in August. The global demand for goods continues to dwindle, which does not bode well for Chinese overseas shipments. Imports for processing trade,1 which historically led China’s exports growth by three months, sank in August (Chart 13). In addition, Shanghai’s export container freight index has plummeted sharply (Chart 14). Both signal an impending shrinkage in the country’s exports volume. Chart 13Plummeted Processing Imports Herald A Downtrend In Exports
Plummeted Processing Imports Herald A Downtrend In Exports
Plummeted Processing Imports Herald A Downtrend In Exports
Chart 14A Sign Of Exports Relapse
A Sign Of Exports Relapse
A Sign Of Exports Relapse
Notably, the country’s exports to the US began to wither in August and this trend will only accelerate in the months ahead. We elaborated on the reasons for the global trade contraction in a previous report. Consistently, the continued underperformance of global cyclical stocks versus defensives, which historically has been a good leading indicator of global manufacturing cycles, points to a worldwide manufacturing downturn (Chart 15). This will be bad news for China, which is the largest manufacturing hub in the world. Deflationary Pressures Will Intensify The Chinese economy is facing a deflationary threat with core consumer inflation below 1% and producer (ex-factory) price inflation falling sharply (Chart 16). Chart 15Global Manufacturing Is Heading Into A Contraction
Global Manufacturing Is Heading Into A Contraction
Global Manufacturing Is Heading Into A Contraction
Chart 16The Chinese Economy Is Facing A Risk of Deflation
The Chinese Economy Is Facing A Risk of Deflation
The Chinese Economy Is Facing A Risk of Deflation
As weaknesses in domestic demand, real estate price and exports deepen, deflationary pressures in the mainland economy will likely intensify. Producer prices will begin deflating in the coming months. Manufactured goods prices have already deflated modestly, which will dampen investment in the industrial sector (Chart 17). Deflationary pressures are set to proliferate given that manufacturing output accounts for one-third of China’s GDP and manufacturing investment accounts for 32% of the nation’s overall fixed-asset investment. Investment in the real estate sector deteriorated severely in August. The downtrend in manufacturing and property investments will cap China’s overall capital spending growth through the end of this year, despite the ongoing rebound in infrastructure investment (Chart 18). Chart 17Manufacturing Prices Are Deflating
Manufacturing Prices Are Deflating
Manufacturing Prices Are Deflating
Chart 18Weakness In Property And Manufacturing Investments Will Cap Overall Capital Spending
Weakness In Property And Manufacturing Investments Will Cap Overall Capital Spending
Weakness In Property And Manufacturing Investments Will Cap Overall Capital Spending
Chart 19Sluggish Household Consumption
Sluggish Household Consumption
Sluggish Household Consumption
Weak income growth and an unwillingness by consumers to spend have taken a heavy toll on retail sales and the service sector since early this year. The growth in goods sales volume edged up in August but remains lackluster and well below pre-pandemic levels (Chart 19). In addition, online retail sales of services continued to shrink (Chart 19, bottom panel). More Downside In The RMB China needs to reduce its interest rates and weaken its exchange rate to battle deflationary pressures. Therefore, Chinese authorities will not mind more deterioration in the yuan versus the US dollar as long as it is gradual. The PBoC lowered the banks’ foreign exchange (FX) deposit reserve requirement ratio (RRR) from 8% to 6%, effective September 15. However, this will have little impact on altering the current weakening trend of the RMB. The balance of FX deposits at commercial banks was US$910 billion at the end of August. A 2% decrease in the FX deposit reserve ratio will only free about US$18 billion in FX liquidity, which is not large compared with US$80 billion in China’s net portfolio outflows through bond and stock connects so far this year. Capital outflows from China will likely persist for the next few months due to the disappointing economic recovery and widening interest rate differential relative to the US (Chart 20). Moreover, slumping exports will heighten selling pressures on the yuan and increase the government’s tolerance for a weaker currency. The FX settlement rate by banks on behalf of clients has continued to drop, which reflects the reluctance of exporters to sell their foreign currency receipts to banks on the expectation that the RMB will weaken even more (Chart 21). Chart 20China-US Rate Differentials Indicate RMB Depreciation
China-US Rate Differentials Indicate RMB Depreciation
China-US Rate Differentials Indicate RMB Depreciation
Chart 21Contracting Exports Will Weigh On The RMB
Contracting Exports Will Weigh On The RMB
Contracting Exports Will Weigh On The RMB
Furthermore, despite a 12% depreciation against the US dollar since this March, the RMB remains strong in trade-weighted terms (Chart 22). Finally, the RMB is modestly cheap, which does not constitute sufficient conditions for the exchange rate reversal, especially when macro fundamentals warrant a weaker currency (Chart 23). In short, we expect that the RMB has another 5% to fall versus the US dollar. Chart 22RMB Is Strong In Trade-Weighted Terms
RMB Is Strong In Trade-Weighted Terms
RMB Is Strong In Trade-Weighted Terms
Chart 23The RMB Is Modestly Cheap But Might Undershoot
The RMB Is Modestly Cheap But Might Undershoot
The RMB Is Modestly Cheap But Might Undershoot
Stay Cautious On Chinese Equities Deflationary pressures confronted by the Chinese economy suggest that onshore asset allocators should continue to favor government bonds over stocks (Chart 24). Chart 24China's Onshore Stock-To-Bond Ratio Will Continue Relapsing
China's Onshore Stock-To-Bond Ratio Will Continue Relapsing
China's Onshore Stock-To-Bond Ratio Will Continue Relapsing
Chart 25A-Shares Have Broken Below Their 6-Year Moving Average
A-Shares Have Broken Below Their 6-Year Moving Average
A-Shares Have Broken Below Their 6-Year Moving Average
The onshore CSI 300 stock index had broken through its 6-year moving average technical support, which will become new resistance for the index (Chart 25). The Hang Seng Tech index, which tracks Chinese offshore tech stocks/platform companies, has failed to break above its 200-day moving average (Chart 26). The above tell-tale signs raise the odds of cyclical new lows in these indexes. Within Chinese equities, we continue to recommend overweighting interest rate sensitive sectors, such as consumer staples, utilities and autos (Chart 27). Chart 26Chinese Tech Stocks Still Appear Brittle
Chinese Tech Stocks Still Appear Brittle
Chinese Tech Stocks Still Appear Brittle
Chart 27Interest Rate Sensitive Sectors Benefit From Loosening Monetary Conditions
Interest Rate Sensitive Sectors Benefit From Loosening Monetary Conditions
Interest Rate Sensitive Sectors Benefit From Loosening Monetary Conditions
Finally, we reiterate our long A-share index / short MSCI Investable stock index recommendation, a position we initiated in March 2021. Qingyun Xu, CFA Associate Editor qingyunx@bcaresearch.com Table 1China Macro Data Summary
China: Battling Deflationary Pressures
China: Battling Deflationary Pressures
Table 2China Financial Market Performance Summary
China: Battling Deflationary Pressures
China: Battling Deflationary Pressures
Footnotes 1 Processing trade refers to the business activities of importing raw materials, components and accessories, and then re exporting the finished products after processing or assembly. Strategic Themes Cyclical Recommendations
Since the S&P 500 peaked on August 16, information technology and real estate have been among the three worst performing US equity sectors. This marks a major reversal from their performance during the mid-June to mid-August rally. During that period, IT…
The MSCI All Country World index lost 4% last week, bringing it down to its lowest level since mid-July. The weakness was broad-based with both the MSCI World Value and Growth indices at 2-month lows. However, the growth index’s 5.0% decline last week and…