Equities
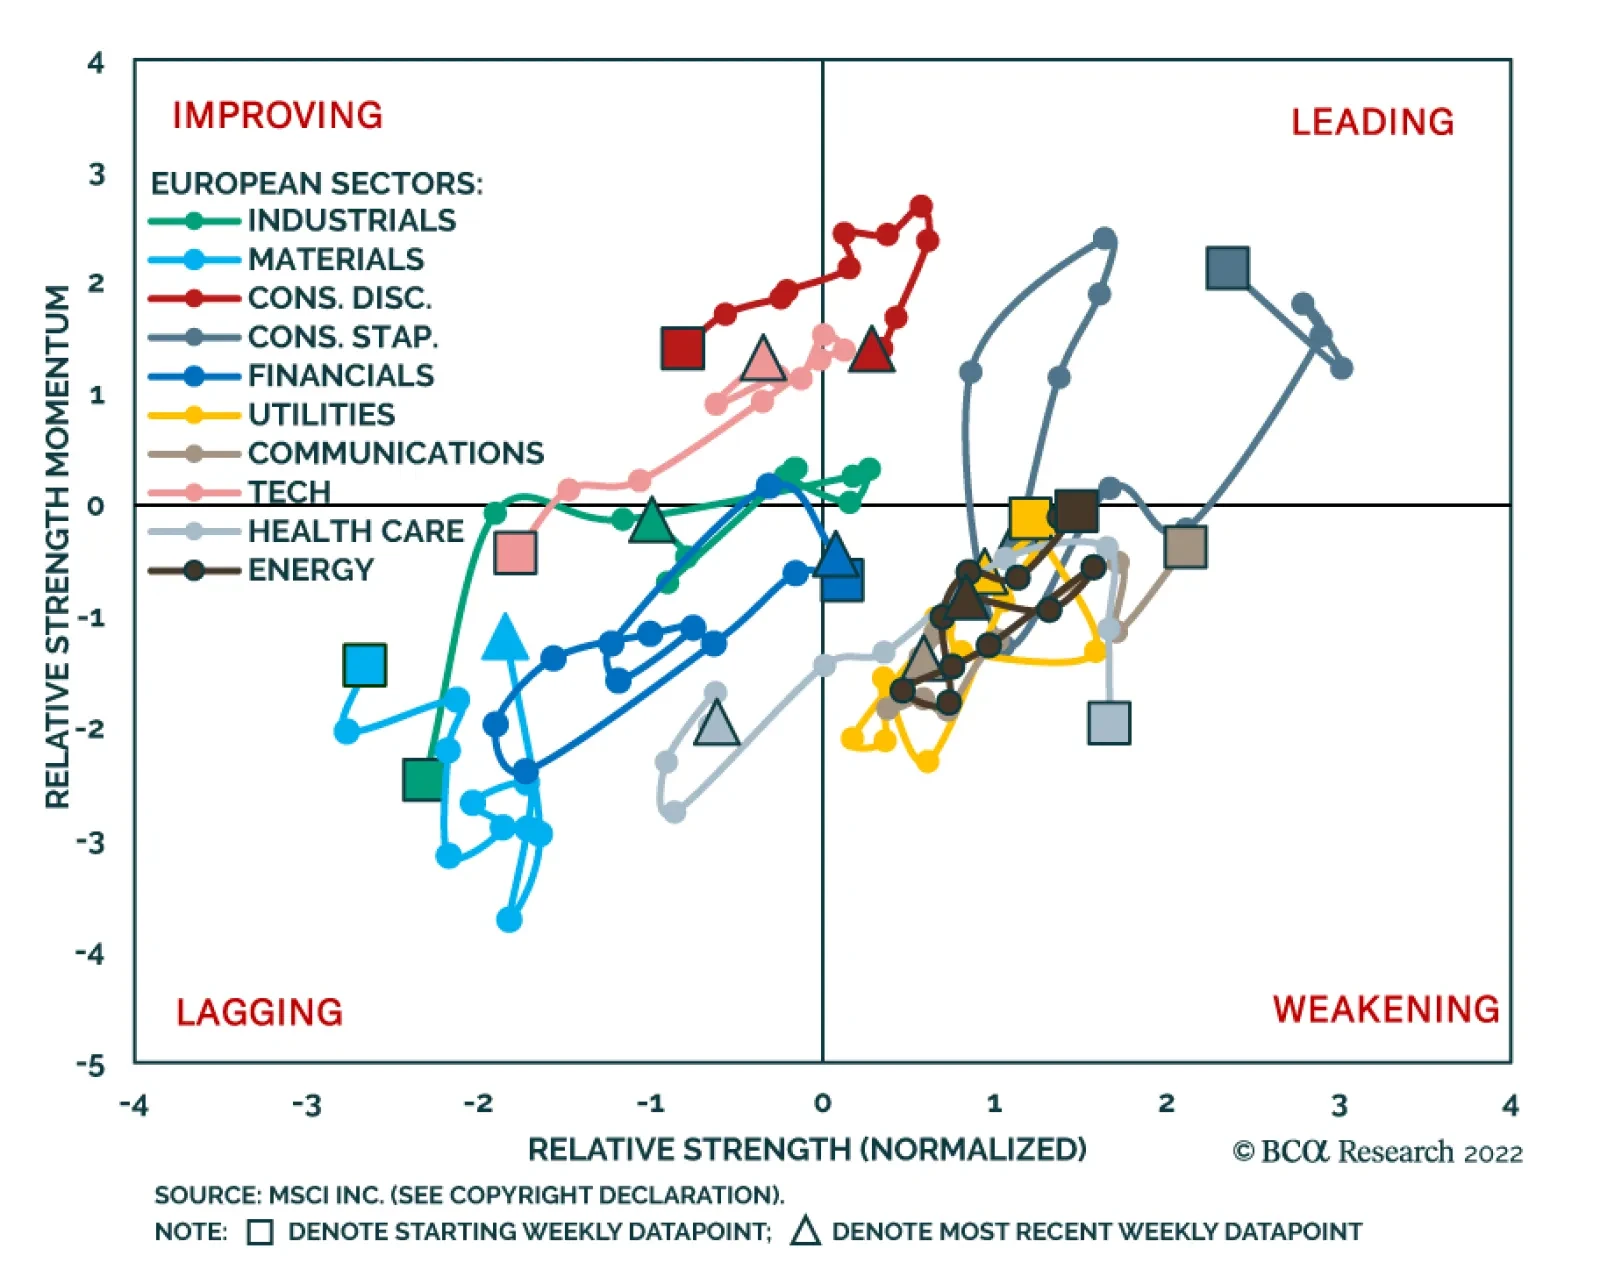
BCA Research’s European Investment Strategy service’s Rotation Maps framework suggests that the Euro Area energy sector stands out as a good underweight candidate in equity portfolios over the next twelve months, especially relative to industrials. The…

Executive Summary Robotization Is Gaining Pace
The Robot Revolution
The Robot Revolution
In today’s publication, we will zero in on one of the most exciting areas of technological innovation that also presents substantial long-term investment potential – robotics. The robotics industry is expected to grow steadily both in the US and abroad thanks to a confluence of favorable long-term trends such as deteriorating global demographics, and a shift of manufacturing toward onshoring and customization. Thanks to technological breakthroughs in the areas of AI, machine learning, lidars, and machine vision, robots are becoming more intelligent and dexterous, thus suitable for an increasing list of tasks and applications. Robots are also becoming more affordable, which is a catalyst for ubiquitous adoption. Increased connectivity and broad-based automation and robotization, are ushering in Industrial Revolution 4.0, improving productivity manyfold. Over time, robotics will change our world beyond recognition, improving not only manufacturing and service industries but also our daily lives. Bottom Line: Robotics is an exciting story of technological innovation, which also presents substantial long-term investment potential. And while the US equity market is likely to remain volatile for months to come, the recent correction in robotics stocks presents an attractive entry point for patient investors with longer investment horizons. Chart 1US Manufacturers Cannot Fill In Vacant Positions, Wages Are Surging
US Manufacturers Cannot Fill In Vacant Positions, Wages Are Surging
US Manufacturers Cannot Fill In Vacant Positions, Wages Are Surging
Last month we published a report: “Industrials: A Trifecta Of Positives” in which we noted that the US is entering a period of industrial boom prompted by favorable government policy and generous spending, and strong new trends in onshoring and automation (Chart 1). This trifecta of positives helps the sector defy the gravity of the slowing economy. In this week’s publication, we will zero in on automation and robotization. This is one of the most exciting areas of technological innovation, which presents substantial long-term investment potential. And while the US equity market is likely to remain volatile for months to come, robotics ETFs such as BOTZ, ROBO, IRBO, and ROBT are off some 40%-50% from their recent post-pandemic peaks (Table 1) and present an attractive entry point for patient investors with longer investment horizons. Table 1An Attractive Entry Point for Long-term Investors
The Robot Revolution
The Robot Revolution
What Is A Robot? Recent breakthroughs in AI and robotics technology are awe-inspiring and unsettling. The "robot revolution" could be as transformative as previous General Purpose Technologies (GPT), including the steam engine, electricity, and the microchip. GPTs are technologies that radically alter the economy's production process and make a major contribution to living standards over time The most basic definition is "a device that automatically performs complicated and often repetitive tasks". Interestingly, according to the definition of the International Standards Organization (ISO), software (bots, AI, process automation), remotely controlled drones, voice assistants, autonomous cars, ATMs, smart washing machines, etc. are not robots. Broadly speaking, there are three types of robots: Industrial, service, and collaborative (cobots). Industrial robots work on assembly lines in manufacturing, service robots perform necessary as well as potentially harmful tasks for humans, while collaborative robots (or “cobots”) work next to human workers. We will discuss different types of robots in more depth in later sections. Robotics Industry Is Growing Steadily Global Adoption Chart 2Robotization Is Gaining Pace
The Robot Revolution
The Robot Revolution
According to the International Federation of Robotics, as of 2020, industrial robot stock has constituted 3 million units and between 2015 and 2020 has been growing at 13% per year. A total of 383,000 units of industrial robots were installed in 2020. Industrial robots reported record preliminary sales in 2021, with 486,800 units shipped globally, a 27% increase from 2020. The pace of installations is forecasted to stay robust well into 2024 (Chart 2). Service robot adoption has also clearly been crossing the chasm: In 2020, nearly 132,000 service robots were installed, a 41% increase over 2019, and 19 million consumer service robots were installed, a 6% increase over 2019. Together, the service robot turnover was approximately $12 billion in 2020. The US Is Lagging But The Pace Is Accelerating Chart 3Industrial Robots Across The Globe
The Robot Revolution
The Robot Revolution
The US has been lagging other developed countries in terms of automation and robotization (Chart 3). However, labor shortages brought about by the pandemic appear to have “moved the needle.” According to the Association for Advancing Automation (A3), the number of robots sold in the US in 2021 rose by 27% over 2020 with 49,900 units installed. 2022 is on pace to exceed previous records, with North American companies ordering a record 11,595 robots in Q1, a 28% increase over Q1-2021. Multiple Tailwinds Promote Ubiquitous Robotization The robotics industry is expected to grow steadily both in the US and abroad thanks to a confluence of forces, such as deteriorating global demographics, manufacturing shifts toward onshoring and customization, and technological breakthroughs that make robots more capable and affordable. Aging Population Leads To Labor Shortages Populations in both developed and emerging markets is aging: More people both in high and upper-middle-income countries will retire in the next decade than will enter the workforce, making labor shortages inevitable. In the US, the problem is particularly acute. Since 2020, labor force participation has declined from 63.4% to 62.4%, most likely due to early retirements, while the unemployment rate stands at a historically low 3.7%. There are two job openings per job seeker, and many businesses report difficulty finding qualified staff. As companies are struggling to fill existing openings, they are increasingly turning towards robots: Replacing labor with automation/robots allows them to produce more and avoid a profit margin squeeze. IFR reports that an increasing number of small- and medium-sized businesses are deploying robots. Related Report US Equity StrategyIndustrials: A Trifecta Of Positives Onshoring And Reshoring As we pointed out in the recent report on Industrials, the onset of the pandemic and geopolitical tensions have accelerated the pace of reshoring. Supply chain disruptions have highlighted corporate vulnerabilities and made companies realize that “just-in-case” trumps “just-in-time.” However, companies that bring their businesses back home do realize that finding workers is a challenge, while labor costs are many times higher. Hence, one of the solutions they pursue is automation and robotization. Mass Customization The “new normal” in many industries is mass customization, i.e., variations for a growing number of products, dubbed a “batch of one.” The shift towards high mix, low volume production raises the importance of manufacturing flexibility and agility – and that is when the industrial robot, capable of working in high to low-volume productions on simple to complex processes, comes to the rescue. The Lower Total Cost Of Ownership Technological advances have made robots both more sophisticated and more affordable. In addition, to a growing supply of low-cost robots, there are also novel pricing models, such as “Robots-as-a-Service” and pay-as-you-use, which support the ubiquitous adoption of robots even by smaller enterprises. Technological Breakthroughs Recent advances in artificial intelligence (AI), computer vision, radars, and networks have expanded the range of tasks that robots can do. Effectively, new technology gives the robot the ability to see, hear, and pick up objects, acting differently according to the data the robot receives, offering it a certain level of autonomous decision-making. Now that robots can “see” and “hear,”, they are being taught how to “feel,” and some of the recent technological advances are truly mind-boggling. Glasgow University researchers have developed ultra-sensitive electronic skin that learns from sensations it experiences. A robotic hand covered with the new e-skin recoiled from what it recognized as “painful” stimuli. This new technology will allow robots to interact with the world in a whole new way, an invention that can be leveraged in a wide range of applications, from prosthetic limbs to the “internet-of-things”.1 And this is just one of many recent inventions. Virtuous Cycle Of Innovation The Robotics industry is going through a perpetual and ever-accelerating cycle of innovation (Chart 4). Improvements to one domain of robotic applications can be transferred to others, benefitting from “adjacent” technologies. In other words, innovations in vacuum cleaners or transport trucks can be easily applied to other areas of robotics, as despite differences in prices and value-add, all the robotic applications are trying to solve the same problems. Advances in different fields in robotics create opportunities for ever more applications, creating a virtuous cycle. Chart 4Robotics Will Enter Into A Virtuous Cycle
The Robot Revolution
The Robot Revolution
Furthermore, robotics is a poster child for Moore’s Law, which refers to the phenomenon whereby transistors on a microchip double every two years, eventually leading to exponential improvements in computing power. Automation and robotics take advantage of these improvements as they are challenged with more complex tasks. We predict the virtuous cycle for robots will span several decades. As the cost of automation drops, better solutions will be developed, resulting in the ‘early retirement’ of dated but otherwise fully functional robotic systems. The following is a brief synopsis of advances in technology and their applications to robotics. Technologies That Help Robots Act Like Humans AI And Machine Learning (ML) AI and ML not only teach robots to perform certain tasks but also makes machines more intelligent by training them to act in different scenarios. To do this, vast amounts of data are consumed. For example, to “teach” a robot to recognize an object and act accordingly, a massive number of images are used to train the computer vision model. Dexterity And Deep Imitation Learning One of the major challenges of roboticists is improving the dexterity of robots and empowering them to manipulate objects gripped by the hand, akin to humans. Some researchers are using machine learning to empower robots to independently identify and work out how to grab objects. Deep Imitation Learning, neural-network-based algorithms, allow the robot to “learn” from humans. For example, in a robotics study led by researchers from the University of Tokyo, the machine learning embedded in the robot practiced a method observed by a human demonstrator. After watching one of the researchers peel a banana periodically for thirteen hours, a robot successfully learned how to peel a banana without crushing the fruit.2 There are also major improvements in hardware, with grippers ranging from pincer-like appendages to human-like hands. Lidar Lidar (Light Detection and Ranging) technology uses sophisticated laser radars that allow robots to navigate their surroundings through object perception, identification, and collision avoidance. Lidar sensors provide information in real-time about the robot’s surroundings such as walls, doors, people, and various objects. While originally expensive, Lidar costs are starting to fall thanks to a more effective chip design and more economical mechanical implementation. Lidars are crucial for advances in industrial automation and warehouse robots. Machine Vision Deep Learning has brought about a groundbreaking advancement in machine vision. One of the early hurdles in machine vision may be described with a simple question: “Am I looking at a large object that’s far away or a tiny object that’s up close?” The modern approach to answering this question is to use both 3-D cameras and the context. 3-D is simulated by using two or more overlapping cameras, correlating the information on camera movements with changing images from the cameras. Deep Learning algorithms help formulate the context of these changing images.3 Machine vision provides higher quality mapping at a more affordable cost than Lidar, especially when it comes to indoor robotics and automation. Industrial Internet Of Things In Robotics The implementation of the “Industrial Internet of Things” (IIoT) is vital for manufacturing automation and robotics. Its main goal is to create a constant tracking of inputs and outputs, enabling communication along the entire supply chain, passing data between enterprise level and plant floor systems, and improving productivity through the use of big data. Robots working at different stages of the manufacturing process are interconnected, ensuring flawless production. IIoT technology aims to improve productivity by reducing human-to-human and human-to-computer interactions, reducing costs, and minimizing the probability of mistakes. Similar to smart homes, IIoT factories are smart factories.4 Industrial Revolution 4.0 Early industrial robots performed very specific operations under carefully controlled conditions – an assembly robot that encountered a misaligned component would simply install it that way, resulting in a defective product. However, thanks to improvements in vision systems, computing, AI, and mechanics, the ability of robots to perform increasingly complex tasks that involve some limited decision-making has improved. Increased connectivity, brought about by IIoT, and ubiquitous automation and robotization, are ushering in a new Industrial Revolution, dubbed 4.0. As in previous industrial revolutions, innovation improves productivity manifold. Chart 5Robots Are Proficient In Many Tasks
The Robot Revolution
The Robot Revolution
Industrial robots are deployed to carry out a wide variety of tasks (Chart 5). Arc welding, spot welding, assembly, palletizing, material removal, inspection, material handling, and packaging are some of the most popular applications for robots, but the list does not stop with just those. Industrial robots limit the need for human interaction while being able to complete tasks accurately with a high level of repeatability. Proficiency with these many tasks allows robots to add value to a multitude of industries, such as automotive, electronics, aerospace, food, and medical. While in the past the automotive sector was the key end-demand market for global robotics sales, non-automotive sales now represent 58% of the total, demonstrating a broadening reach of automation. Metals, Auto, and Food and Consumer Goods have the highest growth in terms of the purchase of robots (Charts 6 & 7). Chart 6Robots Are Gaining Traction In Multiple Industries
The Robot Revolution
The Robot Revolution
Chart 7In The US, Robotization Is Broad-Based
The Robot Revolution
The Robot Revolution
We expect the rising digitalization of the manufacturing sector to lead to a new wave of automation investment in developed countries. Key Players In Industrial Robots Space The global industrial robotics market is largely dominated by established Japanese and European companies: ABB, Yaskawa, KUKA, and Fanuc. However, the sizzling demand for robots demonstrates that technological breakthroughs are no longer just about the established players, as many industrial companies, such as Rockwell Automation, Eaton, and Caterpillar, are becoming leaders in this new space. These companies also reach across the aisle to software companies to leverage their expertise in data storage, computing, and artificial intelligence. Rockwell has recently partnered with Microsoft, while others are acquiring software companies. Deere has acquired GUSS Automation, a pioneer in semi-autonomous spring for high-value crops. These companies will benefit from strong demand for their products and should exhibit strong sales and profit growth. Service Robots Are Here To Help Service robots can significantly benefit humans in a variety of fields, including healthcare, automation, construction, household, and entertainment. These robots are managed by internal control systems, with the option of modifying the operation manually. These service robots remove the possibility of human error, manage time, and increase production by lowering the workload of staff and labor. Chart 8Service Robots Across Industries
The Robot Revolution
The Robot Revolution
Service robots are quickly becoming an essential part of business for service-focused companies in healthcare, logistics, and retail (Chart 8). Developments in edge artificial intelligence processors and the arrival of 5G telecom services are likely to propel the market for service robots to new heights. The usage of service robots is extremely broad and range from cleaning to preparing meals to delivering goods. The following are some of the key areas that benefit from service robots. Healthcare Common duties assigned to service robots include setting up patient rooms, tracking inventory and placing orders, and transporting supplies, medication, and linens. Cleaning and disinfection robots can also help create a safe and sanitized facility for everyone. Further, robots assist in performing difficult surgeries and medical procedures. Robots also help the elderly and disabled. For example, ReWalk has developed a wearable robotic exoskeleton that provides powered hip and knee motion to enable individuals with spinal cord injury (SCI) to stand upright, walk, turn, and climb and descend stairs. The system allows independent, controlled walking while mimicking the natural gait pattern of the legs. Military Defense Autonomous Mobile Robots (AMR) are helpful for combating fires, disarming bombs, and traversing through dangerous areas. Fully automated drone robots are indispensable for military intelligence and combat operations. Logistics As e-commerce sales continue to surge, logistics businesses are using service robots to help overcome current labor shortages, assist current workers to avoid workforce burnout, and enable warehouse automation. Robotic arms are often assigned tasks like picking, placing, and sorting objects, and because these cobots can navigate warehouses independently, they are used to deliver materials to human workers for accurate and efficient order fulfillment. Some logistics companies, such as FedEx, are experimenting with using AMR for last-mile delivery of goods, which is often the most expensive and least productive part of the entire delivery chain. AMR can navigate sidewalks, unpaved surfaces, and steps while carrying cargo. Key Players In Service Robots Space Many US companies are active in this space. Amazon (AMZN) developed robots to support its fulfillment center operation: Robots help automate storage and retrieval mechanisms throughout vast warehouses. IRobot (IRBT) has developed a series of AI-enabled robot vacuums, mops, and pool cleaners – friendly pet-like bots you may see in many American homes. There are also highly sophisticated surgical robots, developed by Stryker (SYK) and Intelligent Surgical (ISRG). Collaboration Between Humans And Robots Collaboration between humans and robots is still in its infancy but it is one of the fastest-growing fields within robotics. Cobots work alongside humans, allowing humans to be more productive and avoid tedious or strenuous tasks. Cobots can be installed directly in the current production system, with less space than conventional robots. Equipped with intelligent features such as vision and force sensors, the flexibility of cobots means they can perform tasks like parts handling, assembly, and bin picking. Manufacturers adopting cobots, particularly those featuring vision and inspection systems, are seeing an increase in quality and efficiency. Investment Characteristics I hope we have convinced our readers that Robotics is a promising long-term investment theme. We also noted that the robotics ETFs are currently down substantially from their peaks. However, this report would not have been complete without a closer look at the investment characteristics of the robotics ETFs. A few salient points: Table 2Price Sensitivity
The Robot Revolution
The Robot Revolution
Robotics ETFs have betas to the S&P 500 ranging from 1.2 to 1.4 (Table 2), which signals that the robotics sector is a high octane play on the US equity market. The recent pullback in the S&P 500 was particularly punishing for the stocks exposed to robotics. In terms of market capitalization, companies in this space tend to be smaller than the median company in the S&P 500, as they constitute the robotics ecosystem and supply chain (AI, Lidar), and tend to be younger and smaller. Robotics ETFs have always traded at a premium to the market given their superb growth potential. However, currently, ROBO ETF, which is a proxy for the rest of the cohort on a relative basis, is trading just under a half standard deviation above the historical mean (Chart 9). In terms of macroeconomic exposure, all of the robotics ETFs have a pronounced negative exposure to the US dollar – after all, robotics and automation are a global phenomenon. A stronger dollar makes American multinational sales from abroad lower both because of the translation effect and higher prices. The robotics theme doesn’t have much exposure to interest rates, inflation, or commodities, but is somewhat positively exposed to bitcoin (Table 3). Chart 9Valuations And Technicals Are Attractive
Valuations And Technicals Are Attractive
Valuations And Technicals Are Attractive
Table 3Robotics Is A High Octane Equities Theme With A Significant Sensitivity To USD
The Robot Revolution
The Robot Revolution
Investment Implications Robotics is a compelling long-term investment theme as Industrial Revolution 4.0 is taking place in front of our eyes. And while over the short term, monetary tightening and slowing economic growth, both at home and abroad, will be a headwind; over time a new Google or Facebook may emerge in this space. We have already watched the success of Nvidia, a supplier of sophisticated chips for the industry. Table 4Comparing ETFs
The Robot Revolution
The Robot Revolution
There are four ETFs that focus on Robotics and Automation (Table 4). BOTZ Is the largest ETF with $2.1 billion AUM, followed by ROBO at $1.7 billion, which is also the most expensive (Table A1 in the Appendix) Which one is the best? To answer this question, we have turned to the quant wizards at the BCA Equity Analyzer team. To compare the ETFs, they have assigned a BCA stock selection and Owl Analytics ESG scores to stocks in each of the robotics ETFs, to calculate composites. We note the BCA composite score is low across the board, as robotics as a nascent investment theme scores low on valuations. We note that while ESG scores are comparable across the portfolios, there is some variation in BCA scores. Overall, ROBO is marginally better than the other options: It has the highest BCA score and is the most liquid. It also has a lower beta to the S&P 500 than BOTZ and IRBO, making it slightly less risky. Unfortunately, it is also the most expensive. Bottom Line Robotics is an exciting long-term theme that benefits from multiple tailwinds, such as demographic trends, continuous technological innovation, reshoring, and customization. Robots are also becoming more intelligent and dexterous, and have better “senses,” making them suitable for an increasing list of tasks and applications. Robots are also becoming more affordable, which is a catalyst for ubiquitous adoption. Over time, robotics will change our world beyond recognition, improving not only manufacturing and service industries but also our daily lives. And that is a future from which investors should certainly profit. Irene Tunkel Chief Strategist, US Equity Strategy irene.tunkel@bcaresearch.com Appendix Table A1ETF Universe
The Robot Revolution
The Robot Revolution
Footnotes 1 Clive Cookson in London, "Ouch! Robotic hand with smart skin recoils when jabbed in the palm,” Financial Times, June 1, 2022, ft.com 2 Ron Jefferson, "Deep Learning Robot with Fine Motor Skills Peel Bananas Without Crushing the Fruit,” Science Times, March 29, 2022, sciencetimes.com 3 "Is Lidar Going to be Replaced by Machine Vision?” LiDAR News, January 12, 2022, blog.lidarnews.com 4 Jennifer Stowe, "Automation and IoT: Transforming How Industries Function,” IoT For All, October 12, 2020, iotforall.com Recommended Allocation Recommended Allocation: Addendum
The Robot Revolution
The Robot Revolution
Executive Summary The US inflation surprise increases the odds of both congressional gridlock and recession, which increases uncertainty over US leadership past 2024 and reduces the US’s ability to lower tensions with China and Iran. Despite the mainstream media narrative, the Xi-Putin summit reinforces our view that China cannot reject Russia’s strategic partnership. The potential for conflict in Taiwan forces China to accept Russia’s overture. For the same reason the US and China cannot re-engage their economies sustainably, even if Biden and Xi somehow manage to reduce tensions after the midterm elections and twentieth national party congress. Russia could reduce oil exports as well as natural gas, intensifying the global energy shock. Ukraine’s counter-offensive and Europe’s energy diversification increase the risk of Russian military and economic failure. The Middle East will destabilize anew and create a new source of global energy supply disruptions. US-Iran talks are faltering as expected. Russian Oil Embargo Could Deliver Global Shock
Xi-Putin Summit, Ukraine Offensive, Iran Tensions
Xi-Putin Summit, Ukraine Offensive, Iran Tensions
Asset Initiation Date Return LONG GLOBAL DEFENSIVES / CYCLICALS EQUITIES 2022-01-20 19.1% Bottom Line: Stay long US stocks, defensive sectors, and large caps. Avoid China, Taiwan, eastern Europe, and the Middle East. Feature Several notable geopolitical developments occurred over the past week while we met with clients at the annual BCA Research Investment Conference in New York. In this report we analyze these developments using our geopolitical method, which emphasizes constraints over preferences, capabilities over intentions, reality over narrative. We also draw freely from the many valuable insights gleaned from our guest speakers at the conference. China Cannot Reject Russia: The Xi-Putin Summit In Uzbekistan Presidents Xi Jinping and Vladimir Putin are meeting in Uzbekistan as we go to press and Putin has acknowledged China’s “questions and concern” about the war in Ukraine.1 They last met on February 4 when Xi gave Putin his blessing for the Ukraine invasion, promising to buy more Russian natural gas and to pursue a “no limits” strategic partnership (meaning one that includes extensive military cooperation). The meeting’s importance is clear from both leaders’ efforts to make it happen. Putin is leaving Russia despite rising domestic criticism over his handling of the Ukraine war and European energy war. Ukraine is making surprising gains in the battlefield, particularly around Kharkiv, threatening Russia’s ability to complete the conquest of Donetsk and the Donbas region. Meanwhile Xi is leaving China for the first time since the Covid-19 outbreak, despite the fact that he is only one month away from the most important political event of his life: the October 16 twentieth national party congress, where he hopes to clinch another five, ten, or fifteen years in power, expand his faction’s grip over the political system, and take over Mao Zedong’s unique title as chairman of the Communist Party. We do not yet know the full outcome of the Uzbek summit but we do not see it as a turning point in which China turns on Russia. Instead the summit reinforces our key point to investors all year: China cannot reject Russia. Russia broke energy ties with Europe and is fighting a proxy war with NATO. The Putin regime has lashed Russia to China’s side for the foreseeable future. China may not have wanted to move so quickly toward an exclusive relationship but it is not in a position to reject Russia’s diplomatic overture and leave Putin out to dry. The reason is that China is constrained by the US-led world order and like Russia is attempting to change that order and carve a sphere of influence to improve its national security. Beijing’s immediate goal is to consolidate power across the critical buffer territories susceptible to foreign interests. It has already consolidated Tibet, Xinjiang, Hong Kong, and to some extent the South China Sea, the critical approach to Taiwan. Taiwan is the outstanding buffer space that needs to be subjugated. Xi Jinping has taken it upon himself to unify China and Taiwan within his extended rule. But Taiwanese public opinion has decisively shifted in favor of either an indefinite status quo or independence. Hence China and Taiwan are on a collision course. Regardless of one’s view on the likelihood of war, it is a high enough chance that China, Taiwan, the US, and others will be preparing for it in the coming years. Chart 1US Arms Sales To Taiwan
Xi-Putin Summit, Ukraine Offensive, Iran Tensions
Xi-Putin Summit, Ukraine Offensive, Iran Tensions
The US is attempting to increase its ability to deter China from attacking Taiwan. It believes it failed to deter Russia from invading Ukraine – and Taiwan is far more important to US economy and security than Ukraine. The US is already entering discussions with Taiwan and other allies about a package of severe economic sanctions in the event that China attacks – sanctions comparable to those imposed on Russia. The US Congress is also moving forward with the Taiwan Policy Act of 2022, which will solidify US support for the island as well as increase arms sales (Chart 1).2 Aside from China's military preparation – which needs to be carefully reviewed in light of Russia’s troubles in Ukraine and the much greater difficulty of invading Taiwan – China must prepare to deal with the following three factors in the event of war: 1. Energy: China is overly exposed to sea lines of communication that can be disrupted by the United States Navy. Beijing will have to partner with Russia to import Russian and Central Asian resources and attempt to forge an overland path to the Middle East (Chart 2). Unlike Russia, China cannot supply its own energy during a war and its warfighting capacity will suffer if shortages occur or prices spike. 2. Computer Chips: China has committed at least $200 billion on a crash course to build its own semiconductors since 2013 due to the need to modernize its military and economy and compete with the US on the global stage. But China is still dependent on imports, especially for the most advanced chips, and its dependency is rising not falling despite domestic investments (Chart 3). The US is imposing export controls on advanced microchips and starting to enforce these controls on third parties. The US and its allies have cut off Russia’s access to computer chips, leading to Russian shortages that are impeding their war effort. Chart 2China’s Commodity Import Vulnerability
Xi-Putin Summit, Ukraine Offensive, Iran Tensions
Xi-Putin Summit, Ukraine Offensive, Iran Tensions
Chart 3China's Imports Of Semiconductors
China's Imports Of Semiconductors
China's Imports Of Semiconductors
3. US Dollar Reserves: China is still heavily exposed to US dollar assets but its access will be cut off in the event of war, just as the US has frozen Russian, Iranian, Venezuelan, and Cuban assets over the years. China is already diversifying away from the dollar but will have to move more quickly given that Russia had dramatically reduced its exposure and still suffered severely when its access to dollar reserves was frozen this year (Chart 4). Where will China reallocate its reserves? To developing and importing natural resources from Russia, Central Asia, and other overland routes. Chart 4China's US Dollar Exposure
China's US Dollar Exposure
China's US Dollar Exposure
Russia may be the junior partner in a new Russo-Chinese alliance but it will not be a vassal. Russia has resources, military power, and regional control in Central Asia that China needs. Of course, China will maintain a certain diplomatic distance from Russia because it needs to maintain economic relations with Europe and other democracies as it breaks up with the United States. Europe is far more important to Chinese exports than Russia. China will play both sides and its companies will develop parallel supply chains. China will also make gestures to countries that feel threatened by Russia, including the Central Asian members of the Shanghai Cooperation Organization (SCO). But the crucial point is that China cannot reject Russia. If the Putin regime fails, China will be diplomatically isolated, it will lose an ally in any Taiwan war, and the US will have a much greater advantage in attempting to contain China in the coming years and decades. Russo-Chinese Alliance And The US Dollar Many investors speculate that China’s diversification away from the US dollar will mark a severe downturn for the currency. This is of course possible, given that Russia and China will form a substantial anti-dollar bloc. Certainly there can be a cyclical downturn in the greenback, especially after the looming recession troughs. But it is harder to see a structural collapse of the dollar as the leading global reserve currency. The past 14 years have shown how global investors react to US dysfunction, Russian aggression, and Chinese slowdown: they buy the dollar! The implication is that a US wage-price spiral, a Russian détente with Europe, and a Chinese economic recovery would be negative for the dollar – but those stars have not yet aligned. Related Report Geopolitical StrategyThe Geopolitical Consequences Of The Ukraine War The reason China needs to diversify is because it fears US sanctions when it invades Taiwan. Hence reducing its holdings of US treasuries and the dollar signals that it expects war in future. But will other countries rush into the yuan and yuan-denominated bonds if Xi is following in Putin’s footsteps and launching a war of choice, with damaging consequences for the economy? A war over Taiwan would be a global catastrophe and would send other countries plunging into the safe-haven assets, including US assets. Nevertheless China will diversify and other countries will probably increase their yuan trade over time, just as Russia has done. This will be a cyclical headwind for the dollar at some point. But it will not knock the US off the premier position. That would require a historic downgrade in the US’s economic and strategic capability, as was the case with the United Kingdom after the world wars. China will continue to stimulate the economy after the party congress. A successful Chinese and global economic rebound next year – and a decision to pursue “jaw jaw” with the US and Taiwan rather than “war war” – would be negative for the dollar. Hence we may downgrade our bullish dollar view to neutral on a cyclical basis before long … but not yet and not on a structural basis. Bottom Line: Favor the US dollar and the euro over the Chinese renminbi and Taiwanese dollar. Underweight Chinese and Taiwanese assets on a structural basis. Ukraine’s Counter-Offensive And A Russian Oil Embargo Ukraine launched a counter-offensive against Russia in September and achieved significant early victories. Russians fell back away from Kharkiv, putting Izyum in Ukrainian hands and jeopardizing Russia’s ability to achieve its war aim of conquering the remaining half of Donetsk province and thus controlling the Donbas region of eastern Ukraine. Russian positions also crumbled west of the Dnieper river, which was always an important limit on Russian capabilities (Map 1). Map 1Status Of Russia-Ukraine War: The Ukrainian Counter-Offensive (September 15, 2022)
Xi-Putin Summit, Ukraine Offensive, Iran Tensions
Xi-Putin Summit, Ukraine Offensive, Iran Tensions
Some commentators, such as Francis Fukuyama in the Washington Post, have taken the Ukrainian counter-offensive as a sign that the Ukrainians will reconquer lost territory and Russia will suffer an outright defeat in this war.3 If Russia cannot conquer the Donbas, its control of the “land bridge” to Crimea will be unsustainable, and it may have to admit defeat. But we are very skeptical. It will be extremely difficult for Ukrainians to drive the Russians out of all of their entrenched positions. US military officials applauded Ukraine’s counter-offensive but sounded a cautious note. The chief problem is that neither President Putin nor the Russian military can afford such a defeat. They will have to double down on the Donbas and land bridge. The war will be prolonged. Ultimately we expect stalemate, which will be a prelude to ceasefire negotiations. But first the fighting will intensify and the repercussions for global economy and markets will get worse. Russia’s war effort is also flagging because Europe is making headway in finding alternatives for Russian natural gas. Russia has cut off flows through the Nord Stream pipeline to Germany, the Yamal pipeline to Poland, and partially to the Ukraine pipeline system, leaving only Turkstream operating normally. Yet EU gas storage is in the middle of its normal range and trending higher (Chart 5). Chart 5Europe Handling Natural Gas Crisis Well … So Far
Xi-Putin Summit, Ukraine Offensive, Iran Tensions
Xi-Putin Summit, Ukraine Offensive, Iran Tensions
Of course, Europe’s energy supply is still not secure. Cold weather could require more heating than expected. Russia has an incentive to tighten the gas flow further. Flows from Algeria or Azerbaijan could be sabotaged or disrupted (Chart 6). Chart 6Europe’s NatGas Supply Still Not Secure
Xi-Putin Summit, Ukraine Offensive, Iran Tensions
Xi-Putin Summit, Ukraine Offensive, Iran Tensions
Chart 7Europe Tipping Into Recession Anyway
Europe Tipping Into Recession Anyway
Europe Tipping Into Recession Anyway
Russia’s intention is to inflict a recession on Europe so that it begins to rethink its willingness to maintain a long-term proxy war. Recession will force European households to pay the full cost of the energy breakup with Russia all at once. Popular support for war will moderate and politicians will adopt more pragmatic diplomacy. After all they do not have an interest in prolonging the war to the point that it spirals out of control. Clearly the economic pain is being felt, as manufacturing expectations and consumer confidence weaken (Chart 7). Europe’s resolve will not collapse overnight. But the energy crisis can get worse from here. The deeper the recession, the more likely European capitals will try to convince Ukraine to negotiate a ceasefire. However, given Ukraine’s successes in the field and Europe’s successes in diversification, it is entirely possible that Russia faces further humiliating setbacks. While this outcome may be good for liberal democracies, it is not good for global financial markets, at least not in the short run. If Russia is backed into a corner on both the military and economic fronts, then Putin’s personal security and regime security will be threatened. Russia could attempt to turn the tables or lash out even more aggressively. Already Moscow has declared a new “red line” if the US provides longer-range missiles to Ukraine. A US-Russia showdown, complete with nuclear threats, is not out of the realm of possibility. Russia could also start halting oil exports, as it has threatened to do, to inflict a major oil shock on the European economy. Investors will need to be prepared for that outcome. Bottom Line: Petro-states have geopolitical leverage as long as global commodity supplies remain tight. Investors should be prepared for the European embargo of Russian oil to provoke a Russian reaction. A larger than expected oil shock is possible given the risk of defeat that Russia faces (Chart 8). Chart 8Russian Oil Embargo Could Deliver Global Shock
Xi-Putin Summit, Ukraine Offensive, Iran Tensions
Xi-Putin Summit, Ukraine Offensive, Iran Tensions
US-Iran Talks Falter Again This trend of petro-state geopolitical leverage was one of our three key views for 2022 and it also extends to the US-Iran nuclear negotiations, which are faltering as expected. Tit-for-tat military action between Iran and its enemies in the Persian Gulf will pick up immediately – i.e. a new source of oil disruption will emerge. If global demand is collapsing then this trend may only create additional volatility for oil markets at first, but it further constrains the supply side for the foreseeable future. It is not yet certain that the talks are dead but a deal before the US midterm looks unlikely. Biden could continue working on a deal in 2023-24. The Democratic Party is likely to lose at least the House of Representatives, leaving him unable to pass legislation and more likely to pursue foreign policy objectives. The Biden administration wants the Iran deal to tamp down inflation and avoid a third foreign policy crisis at a time when it is already juggling Russia and China. The overriding constraints in this situation are that Iran needs a nuclear weapon for regime survival, while Israel will attack Iran as a last resort before it obtains a nuclear weapon. Yes, the US is reluctant to initiate another war in the Middle East. But public war-weariness is probably overrated today (unlike in 2008 or even 2016) and the US has drawn a hard red line against nuclear weaponization. Iran will retaliate to any US-Israeli aggression ferociously. But conflict and oil disruptions will emerge even before the US or Israel decide to launch air strikes, as Iran will face sabotage and cyber-attacks and will need to deter the US and Israel by signaling that it can trigger a region-wide war. Chart 9If US-Iran Talks Fail, Iraq Will Destabilize Further
If US-Iran Talks Fail, Iraq Will Destabilize Further
If US-Iran Talks Fail, Iraq Will Destabilize Further
Recent social unrest in Iraq, where the nationalist coalition of Muqtada al-Sadr is pushing back against Iranian influence, is only an inkling of what can occur if the US-Iran talks are truly dead, Iran pushes forward with its nuclear program, and Israel and the US begin openly entertaining military options. The potential oil disruption from Iraq presents a much larger supply constraint than the failure to remove sanctions on Iran (Chart 9). A new wave of Middle Eastern instability would push up oil prices and strengthen Russia’s hand, distracting the US and imposing further pain on Europe. It would not strengthen China’s hand, but the risk itself would reinforce China’s Eurasian strategy, as Beijing would need to prepare for oil cutoffs in the Persian Gulf. Iran’s attempts to join the Shanghai Cooperation Organization should be seen in this context. Ultimately the only factor that could still possibly convince Iran not to make a dash for the bomb – the military might of the US and its allies – is the same factor that forces China and Russia to strengthen their strategic bond. The emerging Russo-Chinese behemoth, in turn, acts as a hard constraint on any substantial reengagement of the US and Chinese economies. The US cannot afford to feed another decade of Chinese economic growth and modernization if China is allied with Russia and Central Asia. Of course, we cannot rule out the possibility that the Xi and Biden administrations will try to prevent a total collapse of US-China relations in 2023. If China is not yet ready to invade Taiwan then there is a brief space for diplomacy to try to work. But there is no room for long-lasting reengagement – because the US cannot simply cede Taiwan to China, and hence China cannot reject Russia, and Russia no longer has any options. Bottom Line: Expect further oil volatility and price shocks. Sell Middle Eastern equities. Favor North American, Latin American, and Australian energy producers. Investment Takeaways Recession Risks Rising: The inflation surprise in the US in August necessitates more aggressive Fed rate hikes in the near term, which increases the odds of rising unemployment and recession. US Policy Uncertainty Rising: A recession will greatly increase the odds of US political instability over the 2022-24 cycle and reduce the incentive for foreign powers like Iran or China to make concessions or agreements with the US. European Policy Uncertainty Rising: We already expected a European recession. Russia’s setbacks make it more likely that it will adopt more aggressive military tactics and economic warfare. Chinese Policy Uncertainty Rising: China will continue stimulating next year but its economy will suffer from energy shocks and its stimulus is less effective than in the past. It will likely increase economic and military pressure on Taiwan, while the US will increase punitive measures against China. It is not clear that it will launch a full scale invasion of Taiwan – that is not our base case – but it is possible so investors need to be prepared. Long US and Defensives: Stay long US stocks over global stocks, defensive sectors over cyclicals, and large caps over small caps. Buy safe-havens like the oversold Japanese yen. Long Arms Manufacturers: Buy defense stocks and cyber-security firms. Short China and Taiwan: Favor the USD and EUR over the CNY. Favor US semiconductor stocks over Taiwanese equities. Favor Korean over Taiwanese equities. Favor Indian tech over Chinese tech. Favor Singaporean over Hong Kong stocks. Matt Gertken Chief Geopolitical Strategist mattg@bcaresearch.com Footnotes 1 Tessa Wong and Simon Fraser, “Putin-Xi talks: Russian leader reveals China's 'concern' over Ukraine,” BBC, September 15, 2022, bbc.com. 2 US Senate Foreign Relations Committee, “The Taiwan Policy Act of 2022,” foreign.senate.gov. 3 Greg Sargent, “Is Putin facing defeat? The ‘End of History’ author remains confident,” Washington Post, September 12, 2022, washingtonpost.com. Strategic Themes Open Tactical Positions (0-6 Months) Open Cyclical Recommendations (6-18 Months) Regional Geopolitical Risk Matrix
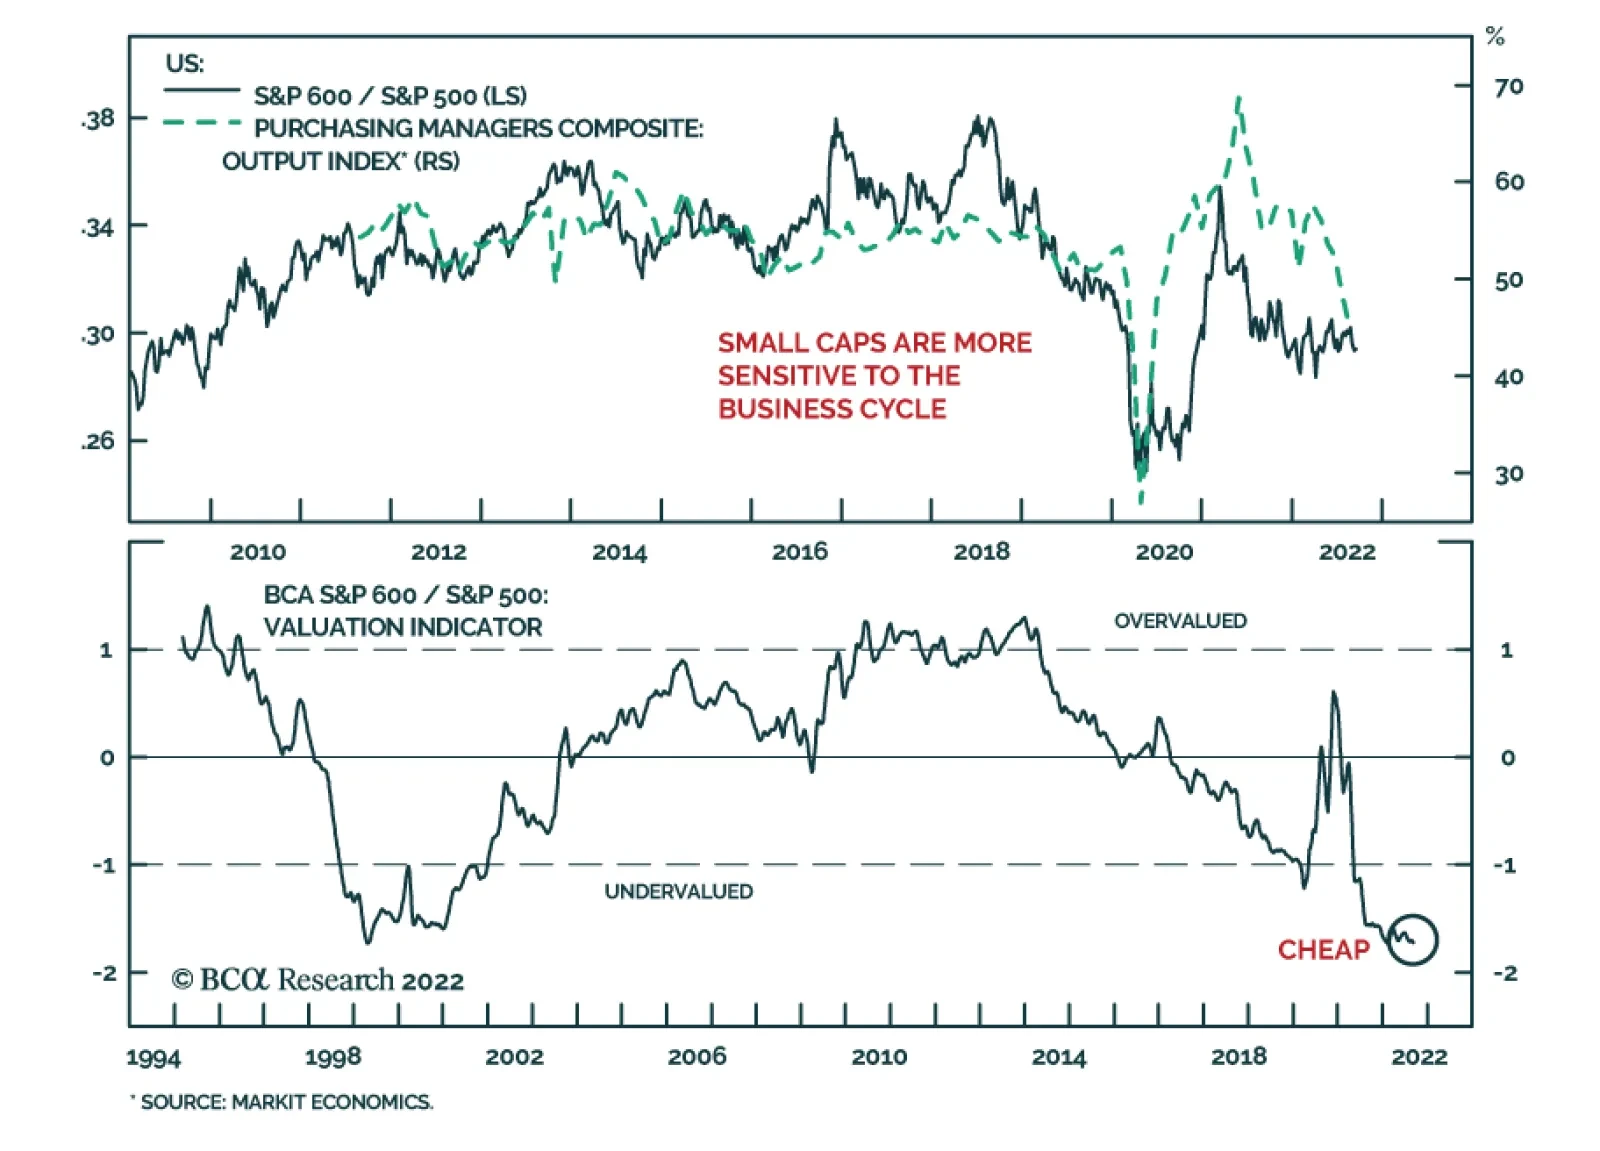
US small cap equities have performed broadly in line with their large cap peers so far this year, with both the S&P 500 and S&P 600 down nearly 14% by Monday’s close. Small caps are typically more sensitive to the business cycle. Indeed, in the…
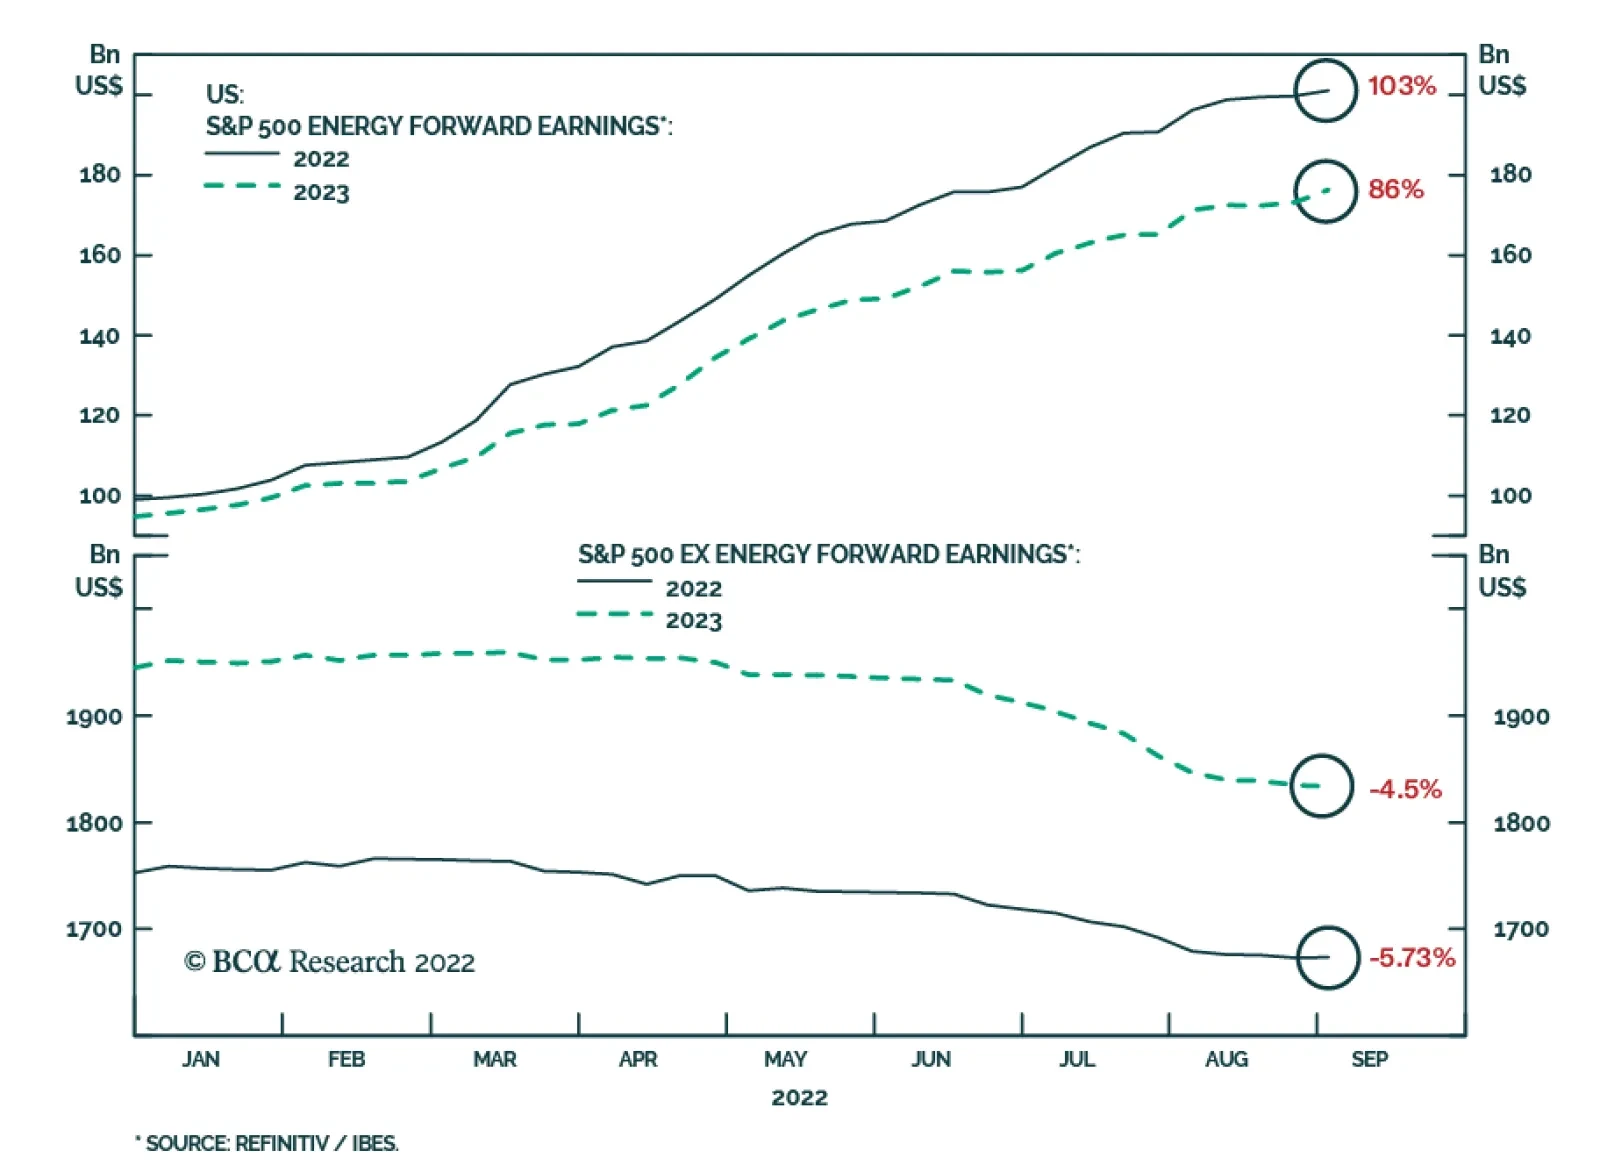
Analysts have been downgrading their S&P 500 earnings expectations for the past three months. Ongoing upwards revisions to estimates for the energy sector – which are currently 103% and 86% above where they stood at the start of the year for 2022 and…
Executive Summary Assessing the future scenarios discounted in asset prices is always a challenge, but investors need a consensus baseline so they can formulate their own investment strategy decisions. The conversations we had at BCA’s annual investment conference last week reinforced our view that investors are overly pessimistic about corporate earnings prospects. Fears about runaway compensation growth are unfounded. The money markets, on the other hand, appear to be overly blasé about the fed funds rate. We think terminal rate expectations will have to be revised higher and that investors will have to wait longer for rate cuts than the OIS curve currently projects. Margins Have Peaked, But They're Still High
Margins Have Peaked, But They're Still High
Margins Have Peaked, But They're Still High
Bottom Line: We remain more optimistic than the consensus over the immediate term and continue to recommend a risk-friendly tilt in multi-asset portfolios over the next six months. We are more cautious about the twelve-month outlook and recommend neutral positioning over that timeframe. Feature BCA held its first in-person conference in three years last week at The Plaza Hotel in New York. The agenda offered attendees a smorgasbord of thought-provoking discussions with recognized experts inside and outside of BCA. We enjoyed the programmed content as well as the impromptu interactions with speakers, attendees, our colleagues and the financial media. Again and again, our unplanned conversations homed in on questions about the expectations embedded in stock prices and bond yields. The future scenarios that securities prices are discounting cannot be directly observed and therefore can never be known definitively in real time. If investors do not continuously approximate them, however, they will be unable to evaluate the likelihood that actual outcomes will be better or worse than expected. Our view that markets and the economy can surprise on the upside has been built on the idea that expectations are overly gloomy. That is still our view on balance, as we think the S&P 500 is pricing in a worse near-term earnings outlook than is likely to occur, though we expect the Fed to surprise markets hawkishly before this rate hiking cycle ends. The combination of positive earnings surprises over the next few quarters and a negative monetary policy surprise coming sometime by the second half of next year leaves us optimistic about risk assets over the next six months but wary of them over the next twelve months and beyond. Earnings The analyst consensus currently estimates that S&P 500 earnings per share over the next four quarters will exceed the second quarter’s annualized run rate by just 0.3% and the trailing four quarters by 5.5% (Table 1). Modest as those expectations may be, we do not sense that investors are counting on them. Financial media reports and our discussions with clients and colleagues suggest that investors are braced for peak-to-trough earnings declines in the double digits, consistent with past recessions (Chart 1). Those bandying about estimates of a 10-20% decline are not necessarily calling for them to occur in the next four quarters, but we think it is clear that the forward S&P 500 whisper number is below the official I/B/E/S consensus. Table 1The Official Bar Is Low, The Whisper Bar Is Lower
What Are Markets Discounting?
What Are Markets Discounting?
Chart 1Recessions Are Hard On Earnings
Recessions Are Hard On Earnings
Recessions Are Hard On Earnings
For nominal earnings growth to miss such meager expectations while inflation is high, profit margins will have to contract sharply, but we would also expect declining revenues to play a major role, as in the 2001 and 2007-2009 recessions (Chart 2). That expectation follows from our view that nominal GDP growth is a solid proxy for S&P 500 sales growth (Chart 3), with nominal GDP explaining 41% of the variation in S&P 500 sales since 1997 (64% correlation). Nominal GDP grew at close to a 10% clip in the first half, and if inflation is around 6% in the second half, we would expect 8% growth over the next two quarters and about 6% growth in the first half of next year.1 Chart 2Sales Fall In Downturns, Too
Sales Fall In Downturns, Too
Sales Fall In Downturns, Too
Chart 3As Goes GDP, So Go Corporate Revenues
As Goes GDP, So Go Corporate Revenues
As Goes GDP, So Go Corporate Revenues
Despite the revenue buffer provided by 7% nominal GDP growth, we expect S&P 500 profit margins will extend their decline from the 2Q21 peak (Chart 4). Investors nearly unanimously expect that margins are imperiled, but we are more sanguine about the pace of the decline than the consensus and suspect the difference comes down to the pace of wage growth. Compensation is the largest expense category by a wide margin and has the capacity to move the aggregate margin needle on its own. Just as the US growth outlook may rest on consumption, compensation may be the key to margins’ future path. Chart 4A Slower-Than-Expected Decline
A Slower-Than-Expected Decline
A Slower-Than-Expected Decline
Much has been made of the shortage of available workers and its impact on wages, which are rising at the fastest pace in decades (Chart 5). In real terms, however, wage growth has been deeply negative ever since frontline workers stopped receiving hazard pay early in the pandemic (Chart 6). Real wages should find a footing as inflation cools and may eventually break into positive territory, but rampant talk of a wage-price spiral suggests that the consensus is factoring in much more. We think the prospects of a wage-price spiral like the one in the late seventies are being dramatically overestimated. Chart 5The Nominal Gains Have Been Great ...
The Nominal Gains Have Been Great ...
The Nominal Gains Have Been Great ...
Chart 6... But They're Way Behind Consumer Prices
... But They're Way Behind Consumer Prices
... But They're Way Behind Consumer Prices
We will not revisit the rationale for our wage-price spiral view in detail, but it is founded on the notion that workers’ current advantage, even if it were to persist for the rest of the Biden administration’s term, will not be sufficient to offset four decades of employers’ structural gains. Labor surely has the upper hand from a cyclical perspective – demand for workers exceeds supply – but we do not think it can convert its near-term advantage into durable gains. Private sector union membership has dwindled from over 30% at its mid-sixties peak to less than 7% today, leaving workers badly outgunned when trying to assemble a sellers’ cartel to counter the formidable buyers’ cartel enabled by 40 years of lax anti-trust enforcement. Even the “most pro-labor president leading the most pro-labor administration you’ve ever seen” isn’t likely to be able to counter several decades of weakened state-level labor protections.2 History says that employers will take as hard a line with their employees as is socially acceptable and what is deemed kosher has moved so far in their favor since President Reagan crushed the air traffic controllers’ union early in his first term that the seventies template does not apply. Monetary Policy If the earnings mood is unduly glum, however, it would seem to be offset by what strikes us as unfounded expectations that the Fed will stand down from its inflation fight before too long. Perhaps BCA strategists are a bit too credulous, but we are inclined to take the Fed at its word that, as former Vice Chair Richard Clarida put it at the conference, “failure [to subdue inflation] is not an option.” While we side with the consensus in our expectation that inflation will soon recede to 4% of its own accord as COVID bottlenecks are cleared, we judge that monetary and fiscal policymakers overstimulated aggregate demand in their efforts to shelter the economy from the pandemic. As a result, we expect that the Fed will have to administer much harsher monetary medicine to achieve its inflation mandate than markets are currently discounting. We have two objections to the money market’s fed funds rate expectations as derived from the overnight index swap curve (Chart 7). We think the fed funds rate will peak well north of 4% in this hiking cycle and there is almost no chance that the Fed will cut rates at any point in 2023. While markets have gotten more realistic about the monetary policy path than they were after the FOMC’s July meeting, we think they are still clinging to a vain hope. All financial assets will have to be repriced once it is snuffed out, and that repricing represents a significant risk to our constructive six-month view if it occurs before underweight asset managers are forced back into risk assets to protect their funds’ relative performance. Chart 7Magical Thinking
Magical Thinking
Magical Thinking
The wide range of views about the neutral, or equilibrium, rate that demarcates the line where the fed funds rate flips from accommodative to restrictive explains the terminal rate uncertainty. The neutral rate cannot be directly observed and everyone from investors to central bankers is left to infer its location from the variables that they can see. We think the neutral rate is north of 4%, possibly as high as 4.5-5%, especially given our view that inflation will likely linger at 4%. New York Fed president John Williams suggested in a Wall Street Journal interview two weeks ago that it may be in the mid-3s. “We need to get the interest rate, relative to where inflation is expected to be over the next year, into a positive space and probably even higher.” The article said Williams expects inflation to range between 2.5 and 3% next year, suggesting that the real funds rate is on course to turn positive this fall. Melting one-year inflation expectations as implied by TIPS break-evens suggest that it’s been rising in sizable chunks week after week since the FOMC’s July meeting (Chart 8). We would take the over on Thursday’s 1.71% close if only it were available on New York’s newly legalized online sports books but someone who does expect sub-2% inflation next year might logically conclude that the Fed will be cutting rates soon. Chart 8Garbage In, Garbage Out
Garbage In, Garbage Out
Garbage In, Garbage Out
Investment Implications Our conversations at the conference and its margins left us essentially where we began. We think investors are underestimating the economy’s ability to grow at a rate that will support continued corporate earnings growth over the next four quarters, albeit at a decelerating rate. On the other hand, we think markets face a reckoning when they are forced to price in a longer and more extensive rate hiking campaign than they currently expect. We square the circle from an investment strategy perspective by conditioning our views on investor timeframes. Because we think the earnings whisper numbers will be meaningfully revised higher before monetary policy expectations are reset more hawkishly, we remain tactically bullish. If rate expectations were to reset sooner than we currently expect (sometime early next year), our tactical call would be at significant risk and we would likely become as cautious over the six-month timeframe as we are over the twelve-month timeframe. As it stands now, we continue to recommend overweighting equities in balanced portfolios over the next six months while pursuing neutral risk asset positioning over timeframes of twelve months or more. Doug Peta, CFA Chief US Investment Strategist dougp@bcaresearch.com Footnotes 1 Our nominal growth expectations assume the US economy maintains real growth at close to its 2% trend level, as consumption is supported by households’ considerable excess savings, but we do not repeat our case here. 2 The weather is fine, and the Saturday football unmatched, but it is flimsy labor protections that drew Boeing’s Dreamliner assembly work and a slew of foreign automakers to the Southeastern Conference’s legacy Deep South footprint and the other states competing for good factory jobs have taken notice.
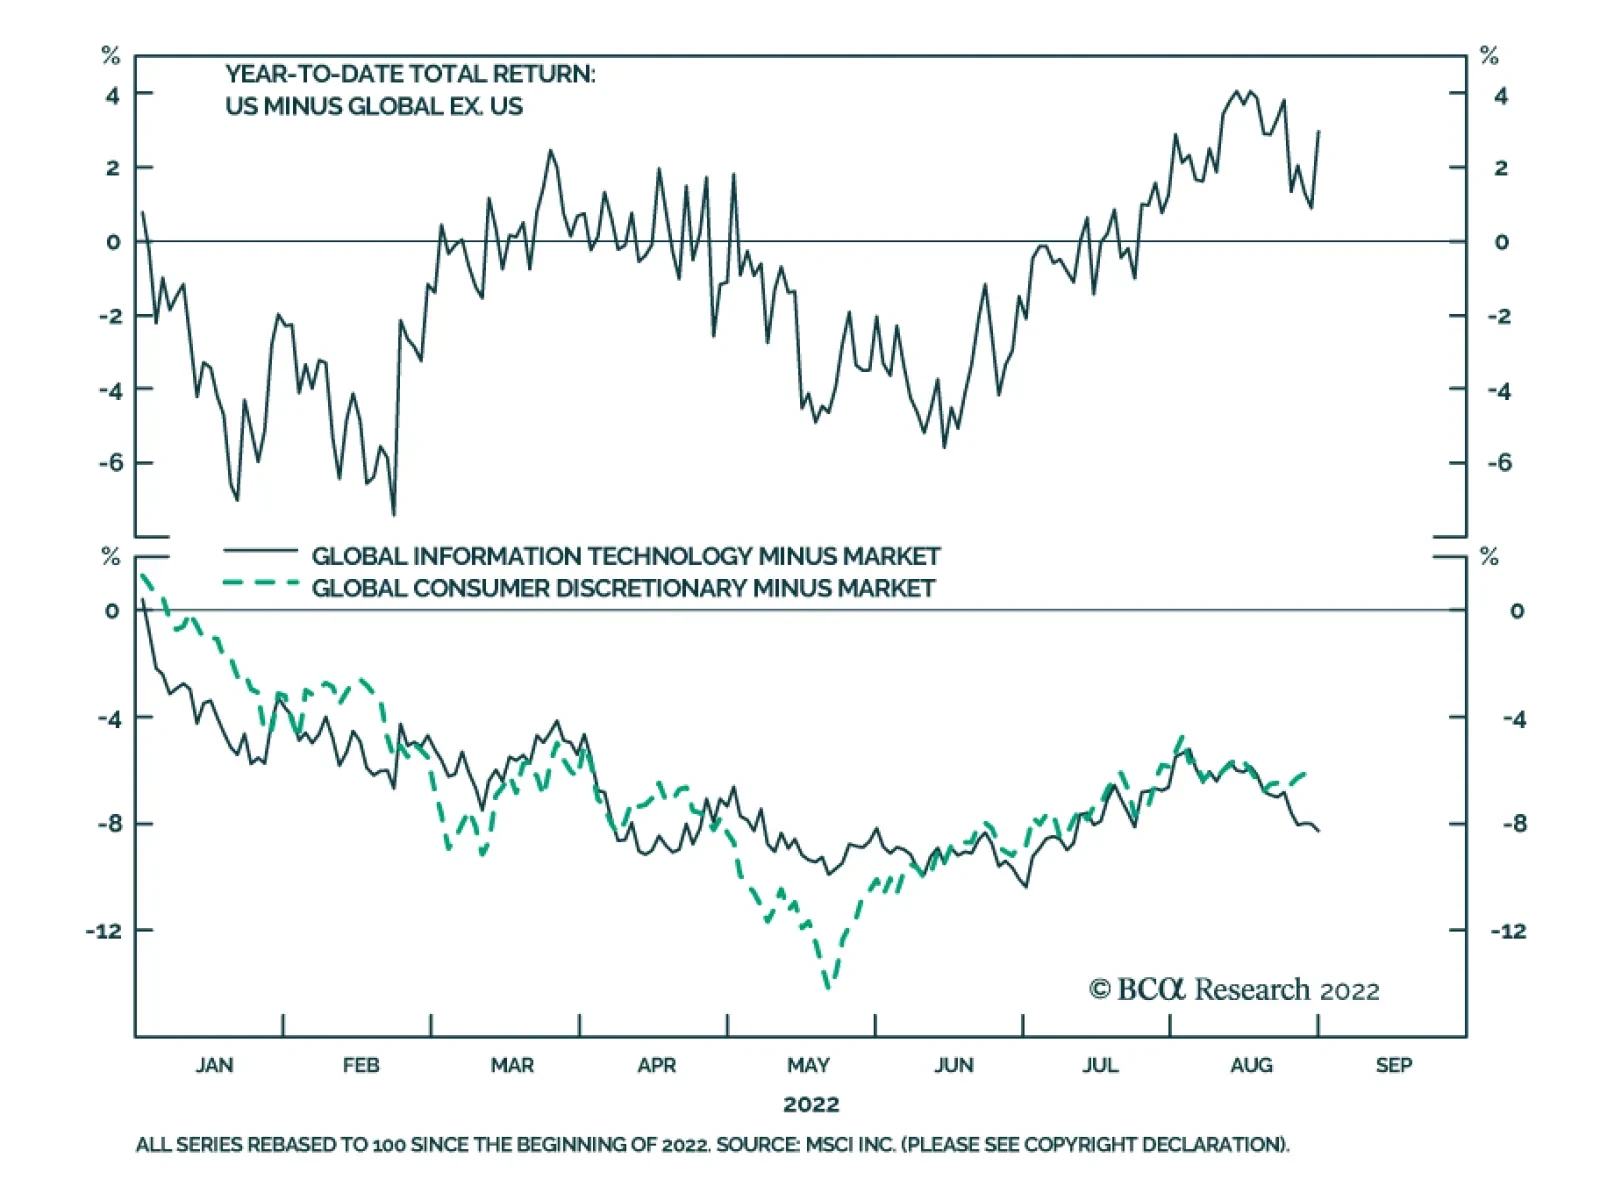
US stocks have outperformed their global counterparts by almost 3% year-to-date. On the surface this might be surprising: Sectors like Information Technology and Consumer Discretionary, which are overrepresented in the US stock market, have underperformed the…
Listen to a short summary of this report Executive Summary On the eve of the pandemic, most developed economies were operating at close to full capacity – the aggregate supply curve, in other words, had become very steep (or inelastic). Not surprisingly, in such an environment, pandemic-related stimulus, rather than boosting output, simply stoked inflation. Looking out, the inverse may turn out to be true: Just as an increase in aggregate demand did more to lift prices than output during the pandemic, a decrease in aggregate demand may allow inflation to fall without much loss in production or employment. Skeptics will argue that such benign disinflations rarely occur, pointing to the 1982 recession. But long-term inflation expectations were close to 10% back then. Today, they are broadly in line with the Fed’s target. Equities will recover from their recent correction as headline inflation continues to fall and the risks of a US recession diminish. Go long EUR/USD on any break below 0.99. Contrary to the prevailing pessimistic view, Europe is heading for a V-shaped recovery. The Aggregate Supply Curve Becomes Very Steep When Spare Capacity Is Exhausted
Inelastic Supply: The Secret To A Soft Landing?
Inelastic Supply: The Secret To A Soft Landing?
Bottom Line: The US economy is entering a temporary Goldilocks period of falling inflation and stronger growth. The latest correction in stocks will end soon. Investors should overweight global equities over the next six months but look to turn more defensive thereafter. Dear Client, I will be attending BCA’s annual conference in New York City next week. Instead of our regular report, we will be sending you a Special Report written by Mathieu Savary, BCA’s Chief European Strategist, and Robert Robis, BCA’s Chief Fixed Income Strategist, on Monday, September 12. Their report will discuss estimates of global neutral interest rates. We will resume our regular publication schedule on September 16. Best Regards, Peter Berezin, Chief Global Strategist The Hawks Descend On Jackson Hole Chart 1Markets Still Think The Fed Will Start Cutting Rates Next Year
Markets Still Think The Fed Will Start Cutting Rates Next Year
Markets Still Think The Fed Will Start Cutting Rates Next Year
Jay Powell’s Jackson Hole address jolted the stock market last week. Citing the historical danger of allowing inflation to remain above target for too long, the Fed chair stressed the need for “maintaining a restrictive policy stance for some time.” Powell’s comments were consistent with the Fed’s dot plot, which expects rates to remain above 3% right through to the end of 2024. However, with the markets pricing in rate cuts starting in mid 2023, his remarks came across as decidedly hawkish (Chart 1). While Fedspeak can clearly influence markets in the near term, our view is that the economy calls the shots over the medium-to-long term. The Fed sees the same data as everyone else. If inflation comes down rapidly over the coming months, the FOMC will ratchet down its hawkish rhetoric, opting instead for a wait-and-see approach. The Slope of Hope Could inflation fall quickly in the absence of a deep recession? The answer depends on a seemingly esoteric concept: the slope of the aggregate supply curve. Economists tend to depict the aggregate supply curve as being convex in nature – fairly flat (or “elastic”) when there is significant spare capacity and becoming increasingly steep (or “inelastic”) as spare capacity is exhausted (Chart 2). The basic idea is that firms do not require substantially higher prices to produce more output when they have a lot of spare capacity, but do require increasingly high prices to produce more output when spare capacity is low. Chart 2The Aggregate Supply Curve Becomes Very Steep When Spare Capacity Is Exhausted
Inelastic Supply: The Secret To A Soft Landing?
Inelastic Supply: The Secret To A Soft Landing?
When the aggregate supply curve is very elastic, an increase in aggregate demand will mainly lead to higher output rather than higher prices. In contrast, when the aggregate supply curve is inelastic, rising demand will primarily translate into higher prices rather than increased output. In early 2020, most of the developed world found itself on the steep side of the aggregate supply curve. The unemployment rate in the OECD stood at 5.3%, the lowest in 40 years (Chart 3). In the US, the unemployment rate had reached a 50-year low of 3.5%. Thus, not surprisingly, as fiscal and monetary policy turned simulative, inflation moved materially higher. Goods inflation, in particular, accelerated during the pandemic (Chart 4). Perhaps most notably, the exodus of people to the suburbs, combined with the reluctance to use mass transit, led to a surge in both new and used car prices (Chart 5). The upward pressure on auto prices was exacerbated by a shortage of semiconductors, itself a consequence of the spike in the demand for electronic goods. Chart 3The Pandemic Began When The Unemployment Rate In The OECD Was At A Multi-Decade Low
The Pandemic Began When The Unemployment Rate In The OECD Was At A Multi-Decade Low
The Pandemic Began When The Unemployment Rate In The OECD Was At A Multi-Decade Low
Chart 4With Supply Unable To Meet Demand, Goods Prices Surged During The Pandemic
With Supply Unable To Meet Demand, Goods Prices Surged During The Pandemic
With Supply Unable To Meet Demand, Goods Prices Surged During The Pandemic
The supply curve for labor also became increasingly inelastic over the course of the pandemic. Once the US unemployment rate fell back below 4%, wages began to accelerate sharply. The kink in the Phillips curve had been reached (Chart 6). Chart 5Car Prices Went On Quite A Ride During The Pandemic
Car Prices Went On Quite A Ride During The Pandemic
Car Prices Went On Quite A Ride During The Pandemic
Chart 6Wage Growth Soared When The Economy Moved Beyond Full Employment
Inelastic Supply: The Secret To A Soft Landing?
Inelastic Supply: The Secret To A Soft Landing?
Chart 7Job Switchers Usually See Faster Wage Growth
Job Switchers Usually See Faster Wage Growth
Job Switchers Usually See Faster Wage Growth
Faster labor market churn further turbocharged wage growth. Both the quits rate and the hiring rate rose during the pandemic. Typically, workers who switch jobs experience faster wage growth than those who do not (Chart 7). This wage premium for job switching increased during the pandemic, helping to lift overall wage growth. A Symmetric Relationship? All this raises a critical question: If an increase in aggregate demand along the inelastic side of the aggregate supply curve mainly leads to higher prices rather than increased output and employment, is the inverse also true – that is, would a comparable decrease in aggregate demand simply lead to much lower inflation without much of a loss in output or employment? If so, this would greatly increase the odds of a soft landing. Skeptics would argue that disinflations are rarely painless. They would point to the 1982 recession which, until the housing bubble burst, was the deepest recession in the post-war era. The problem with that comparison is that long-term inflation expectations were extremely high in the early 1980s. Both consumers and professional forecasters expected inflation to average nearly 10% over the remainder of the decade (Chart 8). To bring down long-term inflation expectations, Paul Volcker had to engineer a deep recession. Chart 8Long-Term Inflation Expectations Are Much Better Anchored Now Than In The Early 1980s
Inelastic Supply: The Secret To A Soft Landing?
Inelastic Supply: The Secret To A Soft Landing?
Chart 9Real Long Terms Bond Yields Are Currently A Fraction Of What They Were Four Decades Ago
Real Long Terms Bond Yields Are Currently A Fraction Of What They Were Four Decades Ago
Real Long Terms Bond Yields Are Currently A Fraction Of What They Were Four Decades Ago
Jay Powell does not face such a problem. Both survey-based and market-based long-term inflation expectations are well anchored. Whereas real long-term bond yields reached 8% in 1982, the 30-year TIPS yield today is still less than 1% (Chart 9). The Impact of Lower Home Prices Chart 10Supply-Side Constraints Limited Home Building During The Pandemic, Helping To Push Up Home Prices
Supply-Side Constraints Limited Home Building During The Pandemic, Helping To Push Up Home Prices
Supply-Side Constraints Limited Home Building During The Pandemic, Helping To Push Up Home Prices
While falling consumer prices would boost real incomes, helping to keep the economy out of recession, a drop in home prices would have the opposite effect on consumer spending. As occurred with other durable goods, a shortage of building materials and qualified workers prevented US homebuilders from constructing as many new homes as they would have liked during the pandemic. The producer price index for construction materials soared by over 50% between May 2020 and May 2022 (Chart 10). As a result, rising demand for homes largely translated into higher home prices rather than increased homebuilding. Real home prices, as measured by the Case-Shiller index, have increased by 25% since February 2020, rising above their housing bubble peak. As we discussed last week, US home prices will almost certainly fall in real terms and probably in nominal terms as well over the coming years. Chart 11Despite Higher Home Prices, Households Have Not Been Using Their Homes As ATMs
Despite Higher Home Prices, Households Have Not Been Using Their Homes As ATMs
Despite Higher Home Prices, Households Have Not Been Using Their Homes As ATMs
How much of a toll will falling home prices have on the economy? It took six years for home prices to bottom following the bursting of the housing bubble. It will probably take even longer this time around, given that the homeowner vacancy rate is at a record low and reasonably prudent mortgage lending standards will limit foreclosure sales. Thus, while there will be a negative wealth effect from falling home prices, it probably will not become pronounced until 2024 or so. Moreover, unlike during the housing boom, US households have not been tapping the equity in their homes to finance consumption (Chart 11). This also suggests that the impact of falling home prices on consumption will be far smaller than during the Great Recession. Inelastic Commodity Supply While inelastic supply curves had the redeeming feature of preventing a glut of, say, new autos or homes from emerging, they also limited the output of many commodities that face structural shortages. Compounding this problem is the fact that the demand for many commodities is very inelastic in the short run. When you combine a very steep supply curve with a very steep demand curve, small shifts in either curve can produce wild swings in prices. Nowhere is this problem more evident than in Europe, where a rapid reduction in oil and gas flows has caused energy prices to soar, forcing policymakers to scramble to find new sources of supply. Europe’s Energy Squeeze At this point, it looks like both the UK and the euro area will enter a recession. In continental Europe, the near-term outlook is grimmer in Germany and Italy than it is in France or Spain. The latter two countries are less vulnerable to an energy crunch (Spain imports a lot of LNG while France has access to nuclear energy). Both countries also have fairly resilient service sectors (Spain, in particular, is benefiting from a boom in tourism). The good news is that even in the most troubled European economies, the bottom for growth is probably closer at hand than widely feared. Despite the fact that imports of Russian gas have fallen by more than 60%, Europe has been able to rebuild gas inventories to about 80% of capacity, roughly in line with prior years (Chart 12). It has been able to achieve this feat by aggressively buying gas on the open market, no matter the price. While this has caused gas prices to soar, it sets the stage for a possible retreat in prices in 2023, something that the futures market is already discounting (Chart 13). Chart 12Europe: Squirrelling Away Gas For The Winter
Europe: Squirrelling Away Gas For The Winter
Europe: Squirrelling Away Gas For The Winter
Chart 13Natural Gas Prices In Europe Will Come Back Down To Earth
Natural Gas Prices In Europe Will Come Back Down To Earth
Natural Gas Prices In Europe Will Come Back Down To Earth
Europe is also moving with uncharacteristic haste to secure new sources of energy supply. In less than one year, Europe has become America’s biggest overseas market for LNG. A new gas pipeline linking Spain with the rest of Europe should be operational by next spring. In the meantime, Germany is building two “floating” LNG terminals. Germany has also postponed plans to mothball its nuclear power plants and has approved increased use of coal-fired electricity generators. Chart 14The Euro Is Undervalued
The Euro Is Undervalued
The Euro Is Undervalued
France is seeking to boost nuclear capacity. As of August 29, 57% of nuclear generation capacity was offline. Electricité de France expects daily production to rise to around 50 gigawatts (GW) by December from around 27 GW at present. For its part, the Dutch government is likely to raise output from the massive Groningen natural gas field. All this suggests that contrary to the prevailing pessimistic view, Europe is heading for a V-shaped recovery. The euro, which is 30% undervalued against the US dollar on a purchasing power parity basis, will rally (Chart 14). Go long EUR/USD on any break below 0.99. Investment Conclusions Chart 15Falling Inflation Should Boost Real Wages And Buoy Consumer Confidence
Falling Inflation Should Boost Real Wages And Buoy Consumer Confidence
Falling Inflation Should Boost Real Wages And Buoy Consumer Confidence
On the eve of the pandemic, most developed economies were operating at close to full capacity – the aggregate supply curve, in other words, had become very steep (or inelastic). Not surprisingly, in such an environment, pandemic-related stimulus, rather than boosting output, simply stoked inflation. Looking out, the inverse may turn out to be true: Just as an increase in aggregate demand did more to lift prices than output during the pandemic, a decrease in aggregate demand may allow inflation to fall with little loss in production or employment. Will this be the end of the story? Probably not. As inflation falls, US real wage growth, which is currently negative, will turn positive. Consumer confidence will improve, boosting consumer spending in the process (Chart 15). The aggregate demand curve will shift outwards again, triggering a “second wave” of inflation in the back half of 2023. Rather than cutting rates next year, as the market still expects, the Fed will raise rates to 5%. This will set the stage for a recession in 2024. Investors should overweight global equities over the next six months but look to turn more defensive thereafter. Peter Berezin Chief Global Strategist peterb@bcaresearch.com Follow me on LinkedIn & Twitter Global Investment Strategy View Matrix
Inelastic Supply: The Secret To A Soft Landing?
Inelastic Supply: The Secret To A Soft Landing?
Special Trade Recommendations Current MacroQuant Model Scores
Inelastic Supply: The Secret To A Soft Landing?
Inelastic Supply: The Secret To A Soft Landing?
Next week, on September 7-8, is the BCA New York Conference, the first in-person version since 2019. I look forward to seeing many of you there, and if you haven’t already booked your place, you still can! (a virtual version is also available). As such, the next Counterpoint report will come out on September 15. Executive Summary The 2022-23 = 1981-82 template for markets is working well. If it continues to hold, these are the major investment implications: Bonds: The 30-year T-bond (price) will trend sideways for the next few months, albeit with a potential correction that lifts the yield to 3.5 percent. However, bond prices will enter a sustained rally in 2023, in which the 30-year T-bond yield will fall to sub-2.5 percent. Stocks: A coordinated global recession will depress profits, causing the S&P 500 to test 3500. However, once past the worst of the recession, a strong rally will lift it through 5000 later in 2023. Sector allocation: Longer duration defensive sectors (such as healthcare) will strongly outperform shorter duration cyclical sectors (such as basic resources) until mid-2023, after which it will be time to flip back into cyclicals. Industrial metals: A tactical rebound in copper could lift it to $8500/MT after which the structural downtrend will resume, taking it to sub-$7000/MT in 2023. Oil: Just as in 1981-82, supply shortages will provide near-term support. But ultimately, demand destruction will dominate, depressing the price to, at best, $85, though our central case is $55 in 2023. If 2022-23 = 1981-82, Then This Is What Happens To The Copper Price
If 2022-23 = 1981-82, Then This Is What Happens To The Copper Price
If 2022-23 = 1981-82, Then This Is What Happens To The Copper Price
Bottom Line: The 2022-23 = 1981-82 template for markets is working well, and should continue to do so. Feature History doesn’t repeat, but it does rhyme. And the period that rhymes closest with the current episode in the global economy and markets is 1981-82, a rhyming which we first highlighted four months ago in Markets Echo 1981, When Stagflation Morphed Into Recession, and then developed in More On 2022-23 = 1981-82, And The Danger Ahead. In those reports, we presented three compelling reasons why 2022-23 rhymes with 1981-82: 1981-82 is the period that rhymes closest with the current episode in the global economy and markets. First, the simultaneous sell-off in stocks, bonds, inflation protected bonds, industrial commodities, and gold in the second quarter of 2022 is uniquely linked with an identical ‘everything sell-off’ in the second quarter of 1981. It is extremely rare for stocks, bonds, inflation protected bonds, industrial commodities, and gold to sell off together. Such a simultaneous sell-off has happened in just these 2 calendar quarters out of the last 200. Meaning a ‘1-in-a-100’ event conjoins 2022 with 1981 (Chart I-1 and Chart I-2). Chart I-1A 1-In-A-100 Event: The 'Everything Sell-Off' In 2022...
A 1-In-A-100 Event: The 'Everything Sell-Off' In 2022...
A 1-In-A-100 Event: The 'Everything Sell-Off' In 2022...
Chart I-2...And The 'Everything Sell-Off' In 1981
...And The 'Everything Sell-Off' In 1981
...And The 'Everything Sell-Off' In 1981
Second, the Jay Powell Fed equals the Paul Volcker Fed. Now just as then, the world’s central banks are obsessed with ‘breaking the back’ of inflation. And now, just as then, the central banks are desperate to repair their badly battered credibility in managing inflation. Third, the Russia/Ukraine war that started in February 2022 equals the Iraq/Iran war that started in September 1980. Now, just as then, a war between two commodity producing neighbours has unleashed a supply shock which is adding to the inflation paranoia. To repeat, it is a 1-in-a-100 event for all financial assets to sell off together. This is because it requires an extremely rare star alignment. Inflation fears first morph to stagflation fears and then to recession fears. Leaving investors with nowhere to hide, as no mainstream asset performs well in inflation, stagflation, and recession. So, the once-in-a-generation star alignment conjoining 2022 with 1981 is as follows: Inflation paranoia is worsened by a major war between commodity producing neighbours, forcing reputationally damaged central banks to become trigger-happy in their battle against inflation, dragging the world economy into a coordinated recession. September 2022 Equals August 1981 If 2022-23 = 1981-82, then where exactly are we in the analogous episode? There are two potential synchronization points. One potential synchronization is that the Russia/Ukraine war which started on February 24, 2022 equals the Iraq/Iran war which started on September 22, 1980. In which case, September 2022 equals April 1981. But given that inflation is public enemy number one, a better synchronization is the Fed’s preferred measure of underlying inflation, the US core PCE deflator. Aligning the respective peaks in core PCE inflation, we can say that February 2022 equals January 1981. Meaning that our original report in May 2022 aligned with April 1981, and September 2022 equals August 1981 (Chart I-3 and Chart I-4). Chart I-3The Peak In Core PCE Inflation In ##br##February 2022
The Peak In Core PCE Inflation In February 2022
The Peak In Core PCE Inflation In February 2022
Chart I-4...Aligns With The Peak In Core PCE Inflation In ##br##January 1981
...Aligns With The Peak In Core PCE Inflation In January 1981
...Aligns With The Peak In Core PCE Inflation In January 1981
In which case, how has the template worked since we introduced it on May 19th? The answer is, very well. The template predicted that the long bond price would track sideways, which it has. The template predicted that the S&P 500 would decline from 4200 to 4000, which it has. The template predicted that the copper price would decline from $9250/MT to $8500/MT. In fact, it has fallen even further to $8200/MT. In the case of oil, the better synchronization is the starts of the respective wars. This template predicted that the Brent crude price would decline sharply from a knee-jerk peak in the $120s, which it has. Not a bad set of predictions! If 2022-23 = 1981-82, Here’s What Happens Next Assuming the template continues to hold, here are the major implications for investors: Bond prices will enter a sustained rally in 2023. Bonds: The 30-year T-bond (price) will trend sideways for the next few months, albeit with a potential tactical correction that takes its yield to 3.5 percent. However, bond prices will enter a sustained rally in 2023 in which the 30-year T-bond yield will fall to sub-2.5 percent (Chart I-5). Chart I-5If 2022-23 = 1981-82, Then This Is What Happens To Bond Prices
If 2022-23 = 1981-82, Then This Is What Happens To Bond Prices
If 2022-23 = 1981-82, Then This Is What Happens To Bond Prices
Stocks: A coordinated global recession will depress profits, causing the S&P 500 to test 3500 in the coming months. However, once past the worst of the recession, a strong rally will lift it through 5000 later in 2023 (Chart I-6). Chart I-6If 2022-23 = 1981-82, Then This Is What Happens To Stock Prices
If 2022-23 = 1981-82, Then This Is What Happens To Stock Prices
If 2022-23 = 1981-82, Then This Is What Happens To Stock Prices
Sector allocation: Longer duration defensive sectors (such as healthcare) will strongly outperform shorter duration cyclical sectors (such as basic resources) until mid-2023, after which it will be time to flip back into cyclicals (Chart I-7). Chart I-7If 2022-23 = 1981-82, Then This Is What Happens To Sector Allocation
If 2022-23 = 1981-82, Then This Is What Happens To Sector Allocation
If 2022-23 = 1981-82, Then This Is What Happens To Sector Allocation
Industrial metals: A tactical rebound in copper could lift it to $8500/MT after which the structural downtrend will resume, taking it to sub-$7000/MT in 2023 (Chart I-8). Chart I-8If 2022-23 = 1981-82, Then This Is What Happens To The Copper Price
If 2022-23 = 1981-82, Then This Is What Happens To The Copper Price
If 2022-23 = 1981-82, Then This Is What Happens To The Copper Price
Oil: Just as in 1981-82, supply shortages will provide near-term support. But ultimately, demand destruction will dominate, depressing the price to, at best, $85 (Chart I-9) though our central case is $55 in 2023. Chart I-9If 2022-23 = 1981-82, Then This Is What Happens To The Oil Price
If 2022-23 = 1981-82, Then This Is What Happens To The Oil Price
If 2022-23 = 1981-82, Then This Is What Happens To The Oil Price
But What If 2022-23 Doesn’t = 1981-82? And yet, and yet…what if the Jay Powell Fed doesn’t equal the Paul Volcker Fed? What if central banks lose their nerve before inflation is slayed? Long bond yields could gap much higher, or at least not come down, causing a completely different set of investment outcomes. In this case, the correct template would not be 1981-82, but the 1970s. If central banks lose the stomach to slay inflation, then the consequent housing market crash will do the job for them. However, there is one huge difference between now and the 1970s, which makes that template highly unlikely. In the 1970s, the global real estate market was worth just one times world GDP, whereas today it has become a monster worth four times world GDP, and whose value is highly sensitive to the long bond yield. In the US, the mortgage rate has surged to well above the rental yield for the first time in 15 years. Simply put, it is now more expensive to buy than to rent a home, causing a disappearance of would be homebuyers, a flood of home-sellers, and an incipient reversal in home prices (Chart I-10). Chart I-10If Bond Yields Don't Come Down, Then House Prices Will Crash
If Bond Yields Don't Come Down, Then House Prices Will Crash
If Bond Yields Don't Come Down, Then House Prices Will Crash
Hence, if long bond yields were to gap much higher, or even stay where they are, it would trigger a housing market crash whose massive deflationary impulse would swamp any inflationary impulse. The upshot is that the 2022-23 = 1981-82 template would suffer a hiatus. Ultimately though, it would come good, because a crash in the $400 trillion global housing market would obliterate inflation. In other words, if central banks lose the stomach to slay inflation, then the consequent housing market crash will do the job for them. Fractal Trading Watchlist As just discussed, copper’s tactical rebound is approaching exhaustion. This is confirmed by the 130-day fractal structure of copper versus tin reaching the point of extreme fragility that has consistently marked turning-points in this pair trade (Chart I-11). Chart I-11Copper's Tactical Rebound Is Exhausted
Copper's Tactical Rebound Is Exhausted
Copper's Tactical Rebound Is Exhausted
Hence, this week’s recommendation is to short copper versus tin, setting the profit target and symmetrical stop-loss at 12 percent. Chart 1Expect Hungarian Bonds To Rebound
Expect Hungarian Bonds To Rebound
Expect Hungarian Bonds To Rebound
Chart 2Copper Is Experiencing A Tactical Rebound
Copper Is Experiencing A Tactical Rebound
Copper Is Experiencing A Tactical Rebound
Chart 3US REITS Are Oversold Versus Utilities
US REITS Are Oversold Versus Utilities
US REITS Are Oversold Versus Utilities
Chart 4FTSE100 Outperformance Vs. Euro Stoxx 50 Is Vulnerable To Reversal
FTSE100 Outperformance Vs. Euro Stoxx 50 Is Vulnerable To Reversal
FTSE100 Outperformance Vs. Euro Stoxx 50 Is Vulnerable To Reversal
Chart 5Netherlands' Underperformance Vs. Switzerland Has Ended
Netherlands' Underperformance Vs. Switzerland Has Ended
Netherlands' Underperformance Vs. Switzerland Has Ended
Chart 6The Sell-Off In The 30-Year T-Bond At Fractal Fragility
The Sell-Off In The 30-Year T-Bond At Fractal Fragility
The Sell-Off In The 30-Year T-Bond At Fractal Fragility
Chart 7Food And Beverage Outperformance Is Exhausted
Food And Beverage Outperformance Is Exhausted
Food And Beverage Outperformance Is Exhausted
Chart 8German Telecom Outperformance Has Started To Reverse
German Telecom Outperformance Has Started To Reverse
German Telecom Outperformance Has Started To Reverse
Chart 9Japanese Telecom Outperformance Vulnerable To Reversal
Japanese Telecom Outperformance Vulnerable To Reversal
Japanese Telecom Outperformance Vulnerable To Reversal
Chart 10The Strong Trend In The 18-Month-Out US Interest Rate Future Has Ended
The Strong Trend In The 18-Month-Out US Interest Rate Future Has Ended
The Strong Trend In The 18-Month-Out US Interest Rate Future Has Ended
Chart 11The Strong Downtrend In The 3 Year T-Bond Has Ended
The Strong Downtrend In The 3 Year T-Bond Has Ended
The Strong Downtrend In The 3 Year T-Bond Has Ended
Chart 12A Potential Switching Point From Tobacco Into Cannabis
A Potential Switching Point From Tobacco Into Cannabis
A Potential Switching Point From Tobacco Into Cannabis
Chart 13Biotech Is A Major Buy
Biotech Is A Major Buy
Biotech Is A Major Buy
Chart 14Norway's Outperformance Has Ended
Norway's Outperformance Has Ended
Norway's Outperformance Has Ended
Chart 15Cotton Versus Platinum Has Reversed
Cotton Versus Platinum Has Reversed
Cotton Versus Platinum Has Reversed
Chart 16Switzerland's Outperformance Vs. Germany Is Exhausted
Switzerland's Outperformance Vs. Germany Is Exhausted
Switzerland's Outperformance Vs. Germany Is Exhausted
Chart 17USD/EUR Is Vulnerable To Reversal
USD/EUR Is Vulnerable To Reversal
USD/EUR Is Vulnerable To Reversal
Chart 18The Outperformance Of MSCI Hong Kong Versus China Has Ended
The Outperformance Of MSCI Hong Kong Versus China Has Ended
The Outperformance Of MSCI Hong Kong Versus China Has Ended
Chart 19US Utilities Outperformance Vulnerable To Reversal
US Utilities Outperformance Vulnerable To Reversal
US Utilities Outperformance Vulnerable To Reversal
Chart 20The Outperformance Of Oil Versus Banks Is Exhausted
The Outperformance Of Oil Versus Banks Is Exhausted
The Outperformance Of Oil Versus Banks Is Exhausted
Dhaval Joshi Chief Strategist dhaval@bcaresearch.com Fractal Trading System Fractal Trades
Markets Still Echoing 1981-82, So Here’s What Happens Next
Markets Still Echoing 1981-82, So Here’s What Happens Next
Markets Still Echoing 1981-82, So Here’s What Happens Next
Markets Still Echoing 1981-82, So Here’s What Happens Next
6-12 Month Recommendations Structural Recommendations Closed Fractal Trades Indicators To Watch - Bond Yields Chart II-1Indicators To Watch - Bond Yields - Euro Area
Indicators To Watch - Bond Yields - Euro Area
Indicators To Watch - Bond Yields - Euro Area
Chart II-2Indicators To Watch - Bond Yields - Europe Ex Euro Area
Indicators To Watch - Bond Yields - Europe Ex Euro Area
Indicators To Watch - Bond Yields - Europe Ex Euro Area
Chart II-3Indicators To Watch - Bond Yields - Asia
Indicators To Watch - Bond Yields - Asia
Indicators To Watch - Bond Yields - Asia
Chart II-4Indicators To Watch - Bond Yields - Other Developed
Indicators To Watch - Bond Yields - Other Developed
Indicators To Watch - Bond Yields - Other Developed
Indicators To Watch - Interest Rate Expectations Chart II-5Indicators To Watch - Interest Rate Expectations
Indicators To Watch - Interest Rate Expectations
Indicators To Watch - Interest Rate Expectations
Chart II-6Indicators To Watch - Interest Rate Expectations
Indicators To Watch - Interest Rate Expectations
Indicators To Watch - Interest Rate Expectations
Chart II-7Indicators To Watch - Interest Rate Expectations
Indicators To Watch - Interest Rate Expectations
Indicators To Watch - Interest Rate Expectations
Chart II-8Indicators To Watch - Interest Rate Expectations
Indicators To Watch - Interest Rate Expectations
Indicators To Watch - Interest Rate Expectations
Our US Investment strategists have shown that bull markets – defined as the period between two NBER-designated recessions – have the tendency to start off with a bang, and sprint to the finish line. A decomposition into deciles of the nine bull markets…