Equities
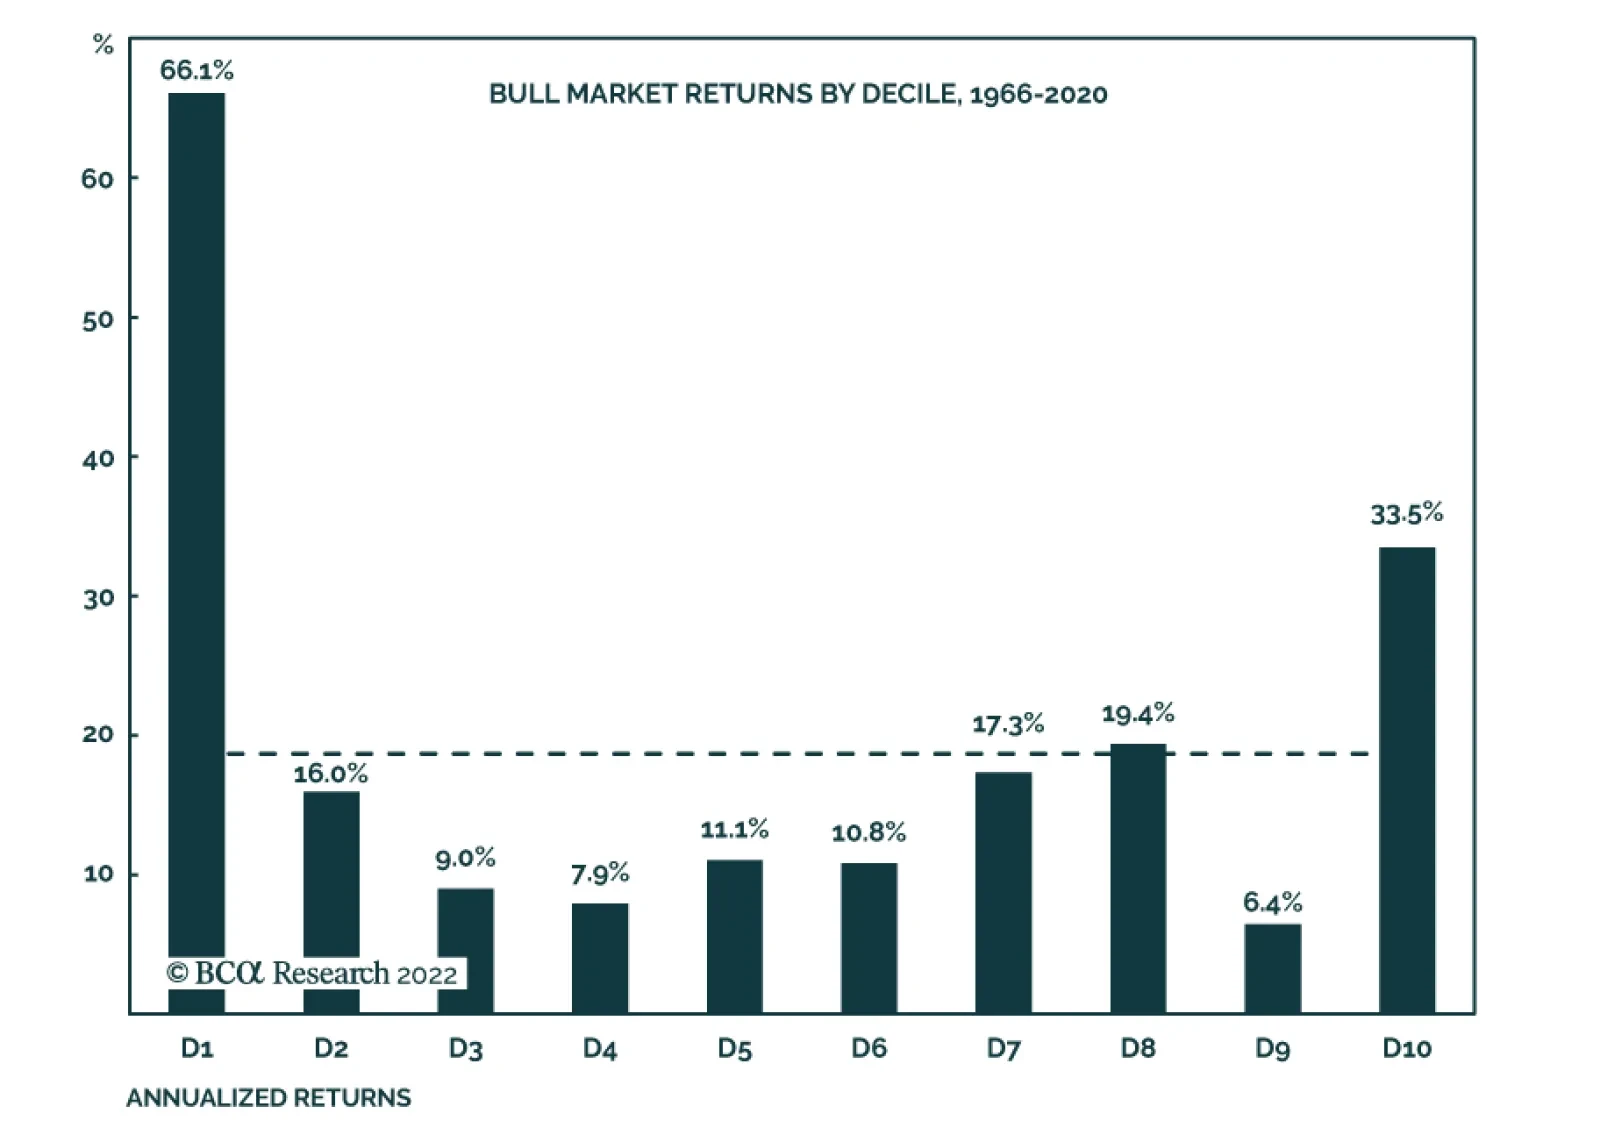
Our US Investment strategists have shown that bull markets – defined as the period between two NBER-designated recessions – have the tendency to start off with a bang, and sprint to the finish line. A decomposition into deciles of the nine bull markets…
US industrial stocks face conflicting forces. On the one hand, the macroeconomic environment poses challenges to this sector. Industrial stocks typically underperform when economic growth conditions deteriorate. Our US Equity strategists recently showed…

Executive Summary Reshoring And FDI Job Creation Have Accelerated After The Pandemic
Industrials: A Trifecta Of Positives
Industrials: A Trifecta Of Positives
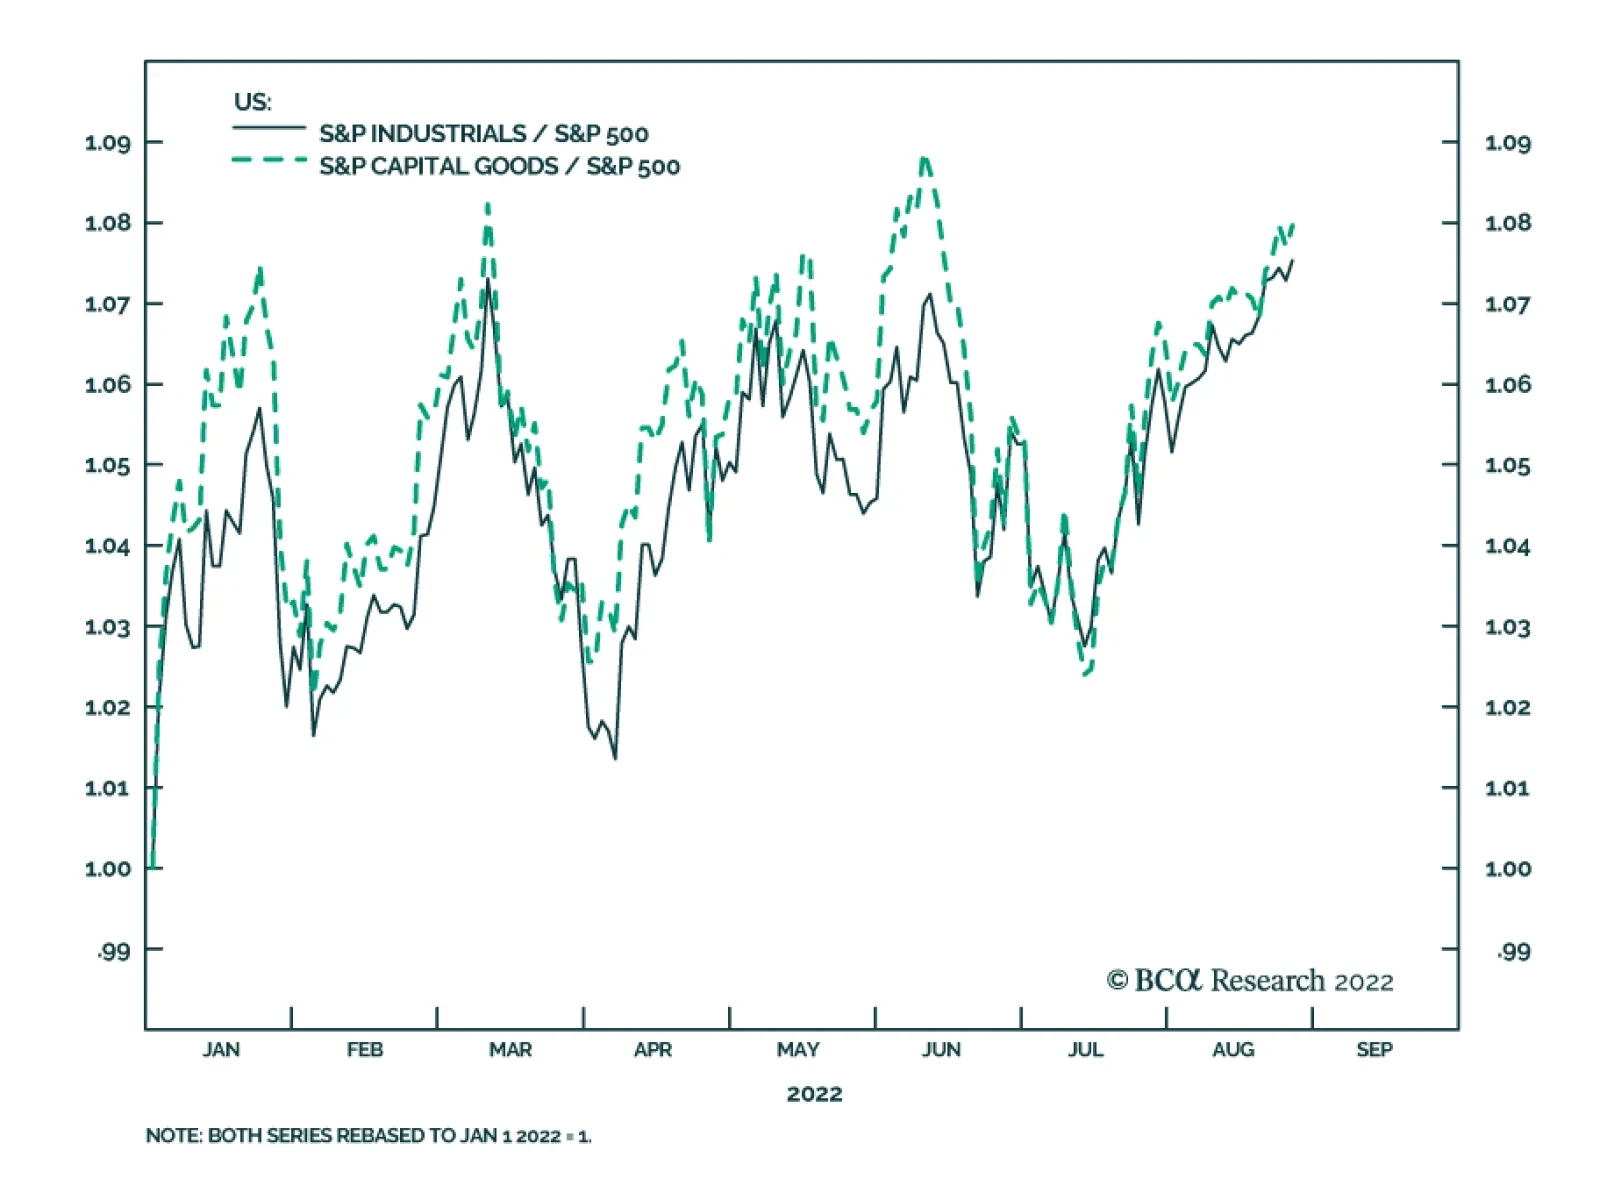
The US is entering a period of an industrial boom thanks to limited manufacturing capacity paired with strong demand for industrial and consumer goods. In addition, a trifecta of positive developments is further boosting US manufacturing: Onshoring, automation, and fiscal stimulus. Onshoring has accelerated after the onset of the pandemic and reshoring announcements are growing steadily. Automation and robotization allow industrial companies to circumvent labor shortages and rising wages and, hence, boost their profit margins. The domestic political landscape in the US is also favorable for industrial stocks given the three major legislative Acts (Infrastructure Investment & Jobs, Inflation Reduction, and National Defense Authorization) that will secure a healthy demand pipeline. While long-term trends are favorable for the sector, a macroeconomic backdrop of slowing growth is a headwind. However, thanks to a confluence of positive long-term trends, most companies are optimistic. Bottom Line: The US industrial sector is in the middle of a boom fueled by onshoring, automation, and favorable government policy. This trifecta of positives helps the sector to defy the gravity of the slowing economy. We remain overweight Industrials on both tactical and strategical time horizons but will continue to monitor it closely, watching out for potential cracks in operating performance. Feature A little over a year ago EMS, GIS, and USES co-published a report “Industrials as equity sector winner in the coming years”. In that report, we posited that the Industrial sector is poised for outperformance as it enjoys a boom thanks to strong new trends in onshoring and automation. In addition to the tectonic shifts described above, the sector has also found itself at the epicenter of the US legislative activity, which will provide a significant tailwind for its performance. Since we published the report on July 30, 2021, Industrials have performed in line with the S&P 500. However, since the beginning of the year, Industrials and Capital Goods outperformed the index by 7%, showing impressive resilience (Chart 1 and Table 1). Chart 1A Resilient Cyclical Sector
A Resilient Cyclical Sector
A Resilient Cyclical Sector
In this week’s report, we take a close look at the trends highlighted above and conduct a deep dive to evaluate whether the sector is still attractive on a tactical basis considering the backdrop of rising rates and slowing economic activity. Our focus is on the Industrial sector in general, and the Capital Goods Industry Group, in particular. We will also assess which industries are best positioned for outperformance. Table 1Industrials Outperformed On The Way Down And During The Summer Rally
Industrials: A Trifecta Of Positives
Industrials: A Trifecta Of Positives
Sneak Preview: The US industrial sector is in the middle of a boom fueled by onshoring, automation, and favorable government policy. This trifecta of positives helps the sector to defy the gravity of the slowing economy. For now, we are both strategically and tactically bullish on the sector but remain vigilant. US Manufacturing Capacity Has Been Severely Limited For Years US manufacturing capacity has been stagnant over the past 20 years, and the level of US manufacturing employment has declined by 30% since 2000 (Charts 2 & 3). Presently, manufacturing employment accounts for only 8% of total US employment. Chart 2US Manufacturing Employment Has Been Shrinking For Decades
US Manufacturing Employment Has Been Shrinking For Decades
US Manufacturing Employment Has Been Shrinking For Decades
Chart 3US Manufacturing Capacity Has Not Expanded In The Past Two Decades
US Manufacturing Capacity Has Not Expanded In The Past Two Decades
US Manufacturing Capacity Has Not Expanded In The Past Two Decades
The reason for the lack of capacity expansion over the past 20 years has been the outsourcing and shifting of production to other countries, especially China. The peak in US manufacturing capacity and employment occurred after the massive Asian currency devaluation in 1998 and China’s WTO admission in 2001. The semiconductor sector, which has recently come into the limelight, is a case in point: From 1990 to 2020, the percentage of chips manufactured in the US has fallen from 37% to 10%, with the lion’s share of chips manufactured in Asia. This trend has brought about The Chips Act which seeks to reverse the trend for national security reasons. Notably, more recently, the decline in manufacturing capacity and employment has started to reverse. More about this later. American Manufacturing Is Booming Again Limited manufacturing capacity paired with a strong demand for industrial and consumer goods translates into an industrial boom. Industrial companies are incentivized to expand given they are already operating at nearly full capacity (Chart 4) and enjoying considerable pricing power. Building industrial capacity in itself lifts demand for industrial goods and the US may be in the early innings of the new Capex cycle, unless the trend is derailed by headwinds from a significantly tighter monetary policy. After all, the age of US capital stock, at 24 years, is two years older than at previous peaks, indicating that many companies are overdue for replacing some of their equipment and machinery (Chart 5). Chart 4Industrial Companies Operate At Nearly Full Capacity
Industrial Companies Operate At Nearly Full Capacity
Industrial Companies Operate At Nearly Full Capacity
Chart 5The US Capital Stock Has To Be Renewed
The US Capital Stock Has To Be Renewed
The US Capital Stock Has To Be Renewed
Indeed, this may already be happening. According to S&P Dow Jones Indices, which analyzed second-quarter earnings season data, capital expenditures of the companies in the S&P 500, have been growing at a faster pace than stock repurchases for the first time since the first quarter of 2021, rising by 20% from a year earlier. Companies from Pepsi to Google to GM are investing in their production capacity, which in itself may be an encouraging sign that they are comfortable with the demand outlook. Of course, the caveat here is that industrials are late in cycle performance, as companies usually wait towards the end of the cycle to expand, only to find waning demand for their products. You Say “Reshoring,” I Say “Onshoring” A multi-decade decline in US manufacturing employment has started to reverse after the GFC, with the onset of the pandemic and geopolitical tensions accelerating the pace of reshoring and Foreign Direct Investing (FDI). Reshoring and FDI job announcements have increased from 6K in 2010 to 345K in 2022 (Chart 6). The resulting cumulative 950,000 incremental hires represent about 7% of US manufacturing employment. The acceleration of jobs coming back combined with the decline in the rate of offshoring has resulted in a 12-year steady uptrend in US manufacturing jobs. Truly amazing! Onshoring remains on top of mind for companies’ management. According to Statista, mentions of onshoring buzzwords in earnings calls and presentations of US public companies have increased from about 100 throughout 2020 to nearly 200 in Q2-2020. Chart 6Reshoring And FDI Job Creation Have Accelerated After The Pandemic
Industrials: A Trifecta Of Positives
Industrials: A Trifecta Of Positives
According to Morgan Stanley’s survey of more than 400 executives of large corporations from the US to Germany to Japan, the most important factor in supply chain decisions is geopolitical stability, followed by skilled labor, physical infrastructure, and a developed supply chain ecosystem. On nearly every count, the US outranked Europe, China, and Mexico. Some 18% of the companies planned to significantly expand US manufacturing in the next 12 months, while 36% anticipated doing so within three years. More than 40% of US companies were taking steps to “onshore” supply chains. The reasons are well publicized: The COVID crisis has revealed over-dependence on imports. China’s decoupling from the US, tensions in the Taiwan Strait, and the Russian/Ukraine war have invoked concerns about the reliability of the existing supply chains. Supply chain disruptions have highlighted corporate vulnerabilities and had made companies realize that “just-in-case” trumps “just-in-time.” The US is pursuing protectionist policies that are to benefit companies operating in the US, Mexico, and Canada. According to Reshoring Initiative,1 Industrial and Tech companies are at the forefront of reshoring: Electrical Equipment, Chemicals, Transportation Equipment, Computer, and Electronic Products, and Medical Equipment suppliers are the leaders in onshoring (Table 2). Many large manufacturers such as Caterpillar have implemented or announced plans to bring offshore manufacturing back to the US. Table 2Reshoring Jobs By Top 5 Industries
Industrials: A Trifecta Of Positives
Industrials: A Trifecta Of Positives
Will onshoring benefit some of the former manufacturing hubs? We believe it will, as Kentucky, North Carolina, Georgia, Ohio, and Alabama are the top five destinations (Table 3). However, there is a hitch. The US unemployment rate, which is at an all-time low of 3.5%, is certainly a speed limit. Moreover, companies that bring their businesses back home do realize that labor costs in this country are many times higher than, say, in Asia. Hence, one of the solutions they pursue is automation. After many years in the making, onshoring is finally gaining pace, benefiting the US manufacturing base. Table 32022 Projected Reshoring Jobs By Top 10 States
Industrials: A Trifecta Of Positives
Industrials: A Trifecta Of Positives
Automation To The Rescue! The Pace of Robotization And Automation Is Accelerating A critical constraint for the expansion of US manufacturing is the labor shortage. Open vacancies in manufacturing are now at a record high, 100% above the 2018 peak (Chart 7, top panel). Notably, industrial companies have been experiencing difficulties hiring qualified staff over the past 10 years which has led to high wage growth (Chart 7, bottom panel). Chart 7US Manufacturers Cannot Fill Vacant Positions, Wages Are Surging
US Manufacturers Cannot Fill Vacant Positions, Wages Are Surging
US Manufacturers Cannot Fill Vacant Positions, Wages Are Surging
Chart 8Automation Expands Profits Margins Of Global Industrials
Automation Expands Profits Margins Of Global Industrials
Automation Expands Profits Margins Of Global Industrials
One remedy is automation. Replacing labor with automation/robots allows companies to produce more and avoid a profit margin squeeze (Chart 8). In a recent report published by the International Federation of Robotics, industrial robots reported record preliminary sales in 2021 with 486,800 units shipped globally, a 27% increase from 2020. The US has been lagging behind other developed countries in terms of automation and robotization (Chart 9). However, labor shortages brought about by the pandemic appear to have “moved the needle.” According to the Association for Advancing Automation (A3),2 the number of robots sold in the US in 2021 rose by 27% over 2020 with 49,900 units installed. 2022 is on pace to exceed previous records, with North American companies ordering a record 11,595 robots. Chart 9US Has Been Lagging Other Developed Nations In Robot Installations
Industrials: A Trifecta Of Positives
Industrials: A Trifecta Of Positives
Non-automotive sales now represent 58% of the total, demonstrating a broadening reach of automation. Metals, Auto, and Food and Consumer Goods have the highest growth in the purchase of robots (Chart 10). Chart 10In 2021 The Pace Of Robot Installation Has Picked Up
Industrials: A Trifecta Of Positives
Industrials: A Trifecta Of Positives
Implications For Industrial Companies The Industrials sector is home to companies that create robots and offer automation solutions as well as companies on the receiving end of the trend. Both sellers and buyers are to benefit: Buyers Of Robots: Manufacturing companies automating production and enlisting robots into their operations will enjoy higher operating leverage, lower labor costs, and more resilient margins. It is easier to automate processes in manufacturing than in service sectors. Consequently, we believe profit margins in manufacturing will outperform those of service sector companies, where automation will be slower. Sellers Of Robots: The sizzling demand for robots demonstrates that technological breakthroughs are no longer just about the Tech companies, and many industrial companies are to benefit from these nascent trends. Rockwell Automation, Eaton, and Caterpillar are the leaders in industrial automation. These companies also reach across the aisle to software companies to leverage their expertise in data storage, computing, and artificial intelligence. Rockwell has just recently partnered with Microsoft, while others are acquiring software companies. Deere has acquired GUSS Automation, a pioneer in semi-autonomous springs for high-value crops. These companies are to benefit from strong demand for their products and should exhibit strong sales and profit growth. To meet strong demand, industrial/manufacturing companies will automate their processes. This will allow them to boost volume and cap costs resulting in widening profit margins. Uncle Sam Loves American Manufacturing Both Biden and Trump before him, have stated that their overarching objective is to revive America’s manufacturing. However, their methods were drastically different, with Trump introducing tax cuts and tariffs, while Biden leans heavily on fiscal stimulus. The following is a recap of some of the recent laws passed by Congress and signed by President Biden. Infrastructure Investment And Jobs Act The $1.2-trillion Infrastructure Investment and Jobs Act will increase US government non-defense spending to bring it to around 3% of GDP, a level comparable to the 1980s-90s and larger than the 2010s. The bill’s focus is on traditional infrastructure – roads, bridges, ports, and electrical grid modernization – but also includes more modern elements such as $65 billion for 5G broadband Internet and $36 billion for electric vehicles and environmental remediation (Table 4). Implementation of the bill is delayed to 2023-24. Table 4Itemized Infrastructure Plan
Industrials: A Trifecta Of Positives
Industrials: A Trifecta Of Positives
However, the market is forward-looking and companies in Construction & Engineering, and Building Products industries are already winners, and are up 12% in relative terms since the bill was passed on November 15, 2021. The potential increase in public construction will help offset a slump in residential construction on the back of the softening housing market (Chart 11). Chart 11The Increase In Public Construction Will Help Offset A Slump In Residential Construction
The Increase In Public Construction Will Help Offset A Slump In Residential Construction
The Increase In Public Construction Will Help Offset A Slump In Residential Construction
Inflation Reduction Act (IRA) The bill earmarks $370 billion for clean energy spending as well as EV tax credits for both new and used cars. We have written on the topic of “Green and Clean” and the effect of the IRA on renewable energy and EV industries, two industries that are major beneficiaries of the bill. However, the bill also creates an enormous opportunity for industrial companies, which can build and service renewable infrastructure, such as Quanta Services (PWR) and Eaton (ETN). Companies that produce and service wind turbines (GE) and solar batteries will also get a revenue boost from the package. Chips Act Congress has passed the CHIPS+ bill to alleviate the chip shortage and shore up US competitiveness with China. Money is earmarked for domestic semiconductor production and research, and factory construction. While the key beneficiaries are chip foundries, construction of new factories will require equipment and services of a wide range from industrial companies from Construction to Machinery. National Defense Authorization Act In December, the House and Senate Armed Services Committee leadership released the Fiscal Year 2022 National Defense Authorization Act (NDAA). This bill introduces an overall discretionary authorization of $768.2 billion including $740.3 billion for base Department of Defense programs and $27.8 billion for national security programs in the Department of Energy. At a later date, another $37 billion was amended to the bill to include $2.5 billion to help pay higher fuel costs; $550 million for Ukraine, funding for five ships, eight Boeing Co-made F-18 Super Hornet fighter jets, and five Lockheed Martin C-130 Hercules planes; and about $1 billion for four Patriot missile units. For FY 2023, the House has already passed $839 billion, which is $37 billion above the White House request. The Senate will work on the bill after the summer recess. But it is already clear that defense spending has become a bipartisan issue. The increase in the defense budget, as well as additional allocation of funds towards Ukraine, have been a major boost for the Aerospace and Defense industry. We overweighted the sector back in January and it is up 24% in relative terms. Overweight Or Not, That Is The Question Macroeconomic Backdrop Business Cycle: Performance of the Industrial sector tends to lag the business cycle, as sector customers tend to wait until they are sure of recovery and have high utilization of their existing capacity before they expand their own production. However, demand is not entirely cyclical, as the need to replace obsolete or aging equipment or machines is relatively stable. There is also a stark difference in behavior of the largest industrial companies and smaller companies in their ecosystems. Larger manufacturers are long-cycle as it takes months to build machines, planes, or equipment. These companies are less sensitive to the business cycle. On the other hand, their suppliers are “short cycle” as they sell parts to many customers, turn their inventory frequently, and are very sensitive to the economic condition. At present, as economic growth is slowing, long-cycle industrial companies are preferable to short-cycle ones. Despite a bifurcation in demand, Industrials tend to underperform in a generic economic slowdown (Chart 12). This is unsurprising as the relative performance of Industrials is correlated to industrial production and the ISM PMI (Chart 13). Chart 12Historically, Industrials Underperformed During The Slowdown Stage Of The Business Cycle
Industrials: A Trifecta Of Positives
Industrials: A Trifecta Of Positives
Chart 13Industrials Usually Underperform When IP And ISM PMI Decline
Industrials Usually Underperform When IP And ISM PMI Decline
Industrials Usually Underperform When IP And ISM PMI Decline
Chart 14Survey Of Capex Intentions Is Weakening
Survey Of Capex Intentions Is Weakening
Survey Of Capex Intentions Is Weakening
And while we touted the beginning of the new industrial boom in the US, and a brand new Capex cycle, we need to monitor it carefully, as multiple surveys of Capex intentions are decelerating (Chart 14). Tighter Monetary Policy: Another potential headwind comes from rising rates. After all, the higher cost of corporate borrowing may weigh on demand for industrial goods. However, historically, US industrial stocks outperformed the S&P 500 Index in the past 70 years during periods of rising bond yields, including the inflation decade of the 1970s (Chart 15). Industrial companies are well positioned to withstand inflation as strong pricing power allows them to pass on their costs to customers. Chart 15When Rates Rise, Industrials Outperform
When Rates Rise, Industrials Outperform
When Rates Rise, Industrials Outperform
The macroeconomic backdrop presents challenges to Industrial companies Fundamentals Are Strong Significant Pricing Power: While dangers are looming in the macroeconomic backdrop, so far industrial companies have been doing well thanks to their significant pricing power (Chart 16), which they enjoy due to high capacity utilization. The relationship between capacity utilization and selling prices is not linear but exponential. When capacity reaches its limit and shortages arise, potential buyers will likely be willing to pay considerably higher prices to secure the supply of goods that they require. High Operating Leverage: In addition to high pricing power, industrial companies enjoy high operating leverage, which implies that while the economy is growing, even if at a slower pace, they can easily convert sales into profits. This will not be the case when the economy is outright contracting – then high operating leverage will become a liability. Chart 16Industrials Enjoy Substantial Pricing Power
Industrials Enjoy Substantial Pricing Power
Industrials Enjoy Substantial Pricing Power
Strong Q2-2022 Earnings And Sales Results: This explains the strong Q2-2022 sales and earnings results of the Industrial sector. Industrial earnings grew at 17.4%, while its sales increased by 13.3% – a remarkable feat, considering that many companies, especially consumer-facing ones, are struggling with shrinking profitability – earnings growth of the Consumer Discretionary sector was down 12.6%. Clearly, business-to-business companies are faring much better than consumer-facing ones, whose demand was pulled forward by the pandemic, and whose customers are reeling from rising prices and are tightening their belts. Looking ahead, margins are expected to shrink by 0.5% (Chart 17), which is modest compared to the 2.5% contraction expected for the S&P 500. In terms of earnings growth expectations, they have fallen but still exceed the market by an impressive 10% even after a series of downgrades. Importantly, earnings growth in real terms is also positive (Charts 18 & 19). Chart 17Operating Margins Are Expected To Hold Up Well
Operating Margins Are Expected To Hold Up Well
Operating Margins Are Expected To Hold Up Well
Chart 18Industrial Earnings Will Grow Faster Than The Market
Industrial Earnings Will Grow Faster Than The Market
Industrial Earnings Will Grow Faster Than The Market
Chart 19Earnings Expectations Have Been Re-calibrated
Earnings Expectations Have Been Re-calibrated
Earnings Expectations Have Been Re-calibrated
What Companies Are Saying All the charts and numbers align well with what we have heard from companies during the earnings season. For instance, nearly every major player within its own respective sub-industry reported healthy demand, low inventories, and a hefty backlog this quarter. Here are a few quotes from the largest players: Caterpillar (CAT): “We expect production and utilization levels will remain elevated, and our autonomous solutions continued to gain momentum … overall demand remained healthy across our segments … was unable to completely satisfy strong customer demand for our machines and engines.” MMM: “Continued strong demand for our solutions in semiconductor, factory automation, and automotive end markets.” GE: “In Renewables, … we are making progress. Our pricing has substantially improved onshore … we're growing our higher-margin businesses, such as grid automation, which delivered double-digit orders growth.” Honeywell (HON): “Orders were up 12% year over year and closing backlog was also up 12% year over year.” The profitability of the Industrial sector is expected to be resilient and to better the market. Valuations And Technicals The Industrial sector and the Capital Goods Industry group trade on par with the S&P 500 on a forward earnings basis (17.7x and 17.9x to 18.0x). The BCA Valuations Indicator signals a neutral level of valuation which is roughly in line with the 10-year average. From the BCA Technical Indicator standpoint, Capitals Goods are also in the neutral zone (Chart 20). Valuations and technicals are moderate for the sector. Chart 20Valuations And Technicals
Valuations And Technicals
Valuations And Technicals
Investment Implications The US industrial sector is in the middle of a boom fueled by a trifecta of positives: Onshoring, automation, and favorable government policy. And while it is hard to fight the Fed and the business cycle, it appears that for now, the sector is defying gravity despite slowing manufacturing surveys and tighter monetary policy. So far fundamentals appear strong, and earnings expectations are robust thanks to the high pricing power and operating leverage of the sector. Within Capital Goods, we favor industries and companies that benefit from these tailwinds: Aerospace and Defense which is to benefit from increased federal defense spending; Robotics and Automation which is overrepresented in the Electrical Equipment industry; and Renewables, i.e., companies that manufacture and service wind turbines and solar panels. Construction and building materials will have a second breath when Infrastructure spending projects will actually get selected and approved. We are both strategically and tactically bullish on the sector but will monitor it closely from a tactical standpoint. After all, industrial surveys are at odds with the resilient earnings expectations. ETFs There are a number of very inexpensive and highly liquid ETFs from Vanguard, iShares, and State Street, that capture the performance of the Industrial sector (Table 5). Table 5Industrial Sector ETFs
Industrials: A Trifecta Of Positives
Industrials: A Trifecta Of Positives
Bottom Line The US industrial sector is in the middle of a boom fueled by onshoring, automation, and favorable government policy. This trifecta of positives helps the sector to defy the gravity of the slowing economy. Companies are optimistic and earnings growth expectations are both robust and resilient. We are both strategically and tactically bullish on the sector but will continue to monitor it closely, watching out for potential cracks in operating performance. Irene Tunkel Chief Strategist, US Equity Strategy irene.tunkel@bcaresearch.com Footnotes 1 Reshoring Initiative reshorenow.org 2 https://www.automate.org/ Recommended Allocation Recommended Allocation: Addendum
What Our Clients Are Asking: The Bear Market 2.0 Webcast Follow Up
What Our Clients Are Asking: The Bear Market 2.0 Webcast Follow Up
Executive Summary Cheap But Challenged
Cheap But Challenged
Cheap But Challenged
European equities have bottomed in absolute terms, but they are still underperforming US ones. Eurozone equities are very cheap compared to US ones, but their profitability remains inferior. Five problems continue to hang over the relative performance of European stocks. The first problem is the Chinese and global growth outlook. The second problem is the natural gas crisis. The third problem is Europe’s expanding liquidity risk. The fourth problem is the weak euro. The fifth problem is Europe’s structural profitability weaknesses. Bottom Line: European stocks may be inexpensive, but too many problems are hanging over their profit outlook. As a result, European shares are unlikely to outperform until natural gas prices peak and the ECB activates the TPI. Until then, continue to underweight European stocks in global equity portfolios. European assets are on sale. Equities are trading at multigenerational lows against their US counterparts. Meanwhile, the euro is back below parity and embedding a 30% discount to purchasing power parity against the US dollar. These observations suggest that European stocks are very attractive relative to their US counterparts — but are they? Related Report European Investment StrategyQuestions From The Road On July 4, 2022, we turned positive on European stocks in absolute terms. Nonetheless, we expected US stocks to outperform because of their larger weighting toward defensive and growth names, which derive greater benefit from lower rates, especially when economic activity remains vulnerable. At this point, we maintain this stance. European valuations are appealing, but the entry point is still not right because the global environment continues to be hostile to the relative performance of European equities. Attractive Valuations Anyway you cut it, European stocks are much less expensive than their US counterparts. In theory, these attractive valuations imply higher long-term rates of return in European markets compared to US ones. Chart 1Cheap European Stocks
Cheap European Stocks
Cheap European Stocks
Based on the MSCI indices, the relative forward P/E ratio of Eurozone shares is 25% below that of US stocks, or the deepest discount in more than 20 years (Chart 1, top panel). European shares should naturally sport lower valuations than US ones due to sectoral biases. However, even when we adjust for those sectoral differences, European stocks stand out as exceptionally cheap. A P/E ratio calculated by giving equal weights to all the sectors in both Europe and the US reveals that, outside of the COVID-19 selloff, the European valuation discount has never been lower in the post-dotcom bubble era (Chart 1, bottom panel). Comparing individual sector performances to earnings reinforces that European stocks are uniquely inexpensive compared to US ones. Since 2018, the relative prices of most European sectors compared to their US competitors have underperformed relative earnings (Chart 2). Chart 2ABroad-based Cheapness
Broad-based Cheapness
Broad-based Cheapness
Chart 2BBroad-based Cheapness
Broad-based Cheapness
Broad-based Cheapness
The problem with valuations is that they can be misleading. If European earnings continue to underperform US ones, European equities are likely to underperform further. And, whether we adjust or not for sector composition, European earnings remain in a pronounced downtrend compared to US profits, which is driving relative performance (Chart 3). Perhaps there is hope for European earnings, but, in the short term, we doubt it. European earnings expectations have been downgraded already, with 2022 and 2023 earnings excluding the energy sector, already down 10% and 12% respectively since their February peak (Chart 4). However, five problems are likely to lead to a greater downgrade relative to the US in the coming months. They are the following: the Chinese and global growth difficulties, the energy market’s ructions, the European liquidity risk, the weakness in the euro, and Europe’s structural lack of profitability. Chart 3Earnings Are In The Driving Seat
Earnings Are In The Driving Seat
Earnings Are In The Driving Seat
Chart 4Downward Revisions Have Begun
Downward Revisions Have Begun
Downward Revisions Have Begun
Bottom Line: Compared to the US, European stocks are very cheap. However, European stocks will only begin to outperform once investors see reasons to upgrade European relative earnings. For now, too many problems continue to place Europe’s profit outlook at a disadvantage. Problem 1: Chinese And Global Growth Chart 5Europe Is More Cyclical than the US
Europe Is More Cyclical than the US
Europe Is More Cyclical than the US
The performance of European equities relative to that of US stocks tracks the evolution of the global manufacturing PMI (Chart 5). This makes sense. Europe’s economy and markets are more specialized in the manufacturing sector, whether consumer or capital goods. Consequently, European earnings are also more geared to the fluctuations of global industrial activity and Chinese imports. Today, China remains one of the major risks to European stocks. Despite efforts by Beijing to stabilize growth, the private sector continues to retrench. The zero-tolerance toward COVID creates a powerful brake on animal spirits as lockdowns shift from one city to the next. Most crucially, the real estate sectors’ woes show no end in sight. Floor spaces sold, started, and completed are contracting at double-digit paces and real estate investment is declining at a 12% annual rate (Chart 6 top and second panels). Moreover, the 47% annual contraction in land purchases indicates that the situation will not improve soon. Consequently, consumer loan growth will decelerate further (Chart 6, bottom panel). While authorities are trying to manage the economic slowdown, they are still too concerned with real estate speculation to push as aggressively as the Chinese economy needs. Even the recent 19-point package from the State Council came with a warning that, although “the foundation of economic recovery is not solid,” Beijing will avoid “resorting to massive stimulus or compromising longer-term interests.” In this context, it is likely that China’s marginal propensity to consume will remain weak, that Chinese yields will decline further, and that the CNY will experience additional weaknesses. All these developments are consistent with a deeper underperformance of European equities (Chart 7). Chart 6China's Real Estate Industry Is Sick
China's Real Estate Industry Is Sick
China's Real Estate Industry Is Sick
Chart 7Weak China = Weak Europe
Weak China = Weak Europe
Weak China = Weak Europe
Looking at the global economy offers little hope. A weak China weighs on EMs’ growth prospects. Moreover, the strong dollar invites EMs’ central banks to tighten domestic liquidity and financial conditions, which historically results in lower growth. This softer economic activity ultimately hurts European earnings more than US ones and causes Eurozone shares to underperform US ones (Chart 8). Beyond EMs, the leading indicators of global economic activity do not inspire much confidence either. Arthur Budaghyan, BCA’s Emerging Market chief strategist, often highlights the downside risk to global exports, which would generate an underperformance of European earnings relative to those of the US. In fact, Taiwanese export orders, which lead global exports, are contracting anew. So is the Global Leading Economic Indicator (Chart 9). Ultimately, the tightening in global policy rates is doing what it should do: slowing global growth. Chart 8EM FCIs Matter To Europe's Relative Performance
EM FCIs Matter To Europe's Relative Performance
EM FCIs Matter To Europe's Relative Performance
Chart 9Clouds Over The Global Economy
Clouds Over The Global Economy
Clouds Over The Global Economy
Bottom Line: The weakness in Chinese economic activity is not over yet. Global growth will also continue to suffer as global exports are set to weaken considerably in the coming months. Together, these forces will hurt the earnings prospects of Europe compared to the US. Problem 2: The Energy Market Chart 10Pricey Nat Gas And Electricity
Pricey Nat Gas And Electricity
Pricey Nat Gas And Electricity
Let’s be more specific here: natural gas continues to weigh more on Europe’s earnings prospects than those of the US. European natural gas prices have surged, even when compared to US ones. As a result, electricity prices have also increased across the Eurozone’s main economies (Chart 10). This is deeply negative for domestic economic activity and hurts the competitiveness of European businesses. Consequently, as long as natural gas prices climb higher, European profitability will deteriorate relative to that of US firms. Unsurprisingly, investors are deeply aware of these dynamics. The more natural gas prices rise, the greater European equities underperform. In fact, since mid-2021, Dutch natural gas prices have become the single best explanatory variable for the relative performance of European stocks (Chart 11). Natural gas is likely to remain a problem for European equities until the beginning of the winter. We are currently in the peak period of upward pressure on natural gas prices in Europe. Relentless inventory buildup introduced an inelastic buyer to the market, which is propelling natural gas prices to new heights even though consumption is receding (Chart 12, top panel). In response to these efforts, European natural gas inventories have hit 80% of capacity and are set to rise to 90% by November, even though Russian flows have collapsed (Chart 12, bottom two panels). However, in November, natural gas prices are likely to peak. The re-stocking effort will be completed, coal power will fill in many gaps, and selective conservation efforts will allow most industries and heating to function. Chart 11Europe vs US = Nat Gas
Europe vs US = Nat Gas
Europe vs US = Nat Gas
Chart 12The Worse Is Now
The Worse Is Now
The Worse Is Now
Bottom Line: The surge in natural gas prices is the key force currently hurting the relative performance of Eurozone equities. However, this negative dynamic is likely to fade in the winter because the current price jump reflects inventory building. By November, inventories will be at the 90% of capacity targeted by the European Commission and coal power will fill the remaining production gap. Until then, natural gas prices will continue to hurt European profit margins. Problem 3: European Liquidity Risk Chart 13Unhinged Credit Markets
Unhinged Credit Markets
Unhinged Credit Markets
European equities are also hurt by an increase in risk premia relative to the US. Italian spreads continue to show upside and European junk spreads are widening compared to US ones (Chart 13). This problem could remain saliant in the coming months. The ECB is tightening policy in an economy already fettered by a severe energy shock. This process increases risk aversion. Moreover, because European inflation is likely to prove more sticky than that of the US this fall, this development will continue to hurt the price of European assets compared to US ones. Chart 14A Key Vulnerability
A Key Vulnerability
A Key Vulnerability
The imbalances in the Euro Area create a further source of liquidity risk. The TARGET2 balances remain extremely large, which indicates that Dutch, Luxembourg, and German savings continue to finance France, Spain, and Italy (Chart 14, top panel). However, the import-boosting impact of high energy costs and the negative effects of weaker global growth on exports are likely to worsen the current account balance of the Eurozone, including that of Germany, which acts as the Eurozone’s banker (Chart 14, bottom panel). The decreasing savings of Germany and the Netherlands in conjunction with the wide difference in neutral rates between Germany and France, Italy and Spain increase the odds that peripheral spreads will widen further in the short term. However, this too is likely to be a temporary risk that ebbs after the winter. First, as we wrote four weeks ago, the differences in neutral rates will force the ECB to activate the TPI before year-end. Second, once energy prices peak, the downward pressure on European gross savings will also ease, which will restore liquidity conditions in European credit markets. Bottom Line: The combination of an ECB tightening policy in a weak economy as well as TARGET2 imbalances and declining savings increase the likelihood of a liquidity shortage in European debt markets. Tremors in the credit market would translate into further underperformance of European equities relative to US ones. Problem 4: The Weak Euro At first glance, the weak euro is positive for European equities since it subsidizes profitability. However, in a context in which costs of production are rising faster in Europe than in the US, this benefit is elusive. The weak euro is not translating into greater pricing power for European firms. The increase in producer prices supercharged by higher natural gas prices (among others) is not met by a commensurate rise in consumer prices. The same is true in the US, but to a much lesser extent; as a result, the ratio of CPI to PPI is declining in Europe relative to the US. Chart 15A Weak Euro Reflects Poor Pricing Power
A Weak Euro Reflects Poor Pricing Power
A Weak Euro Reflects Poor Pricing Power
This lack of pricing power is an important driver of the weakness in the euro. EUR/USD closely tracks the evolution of the CPI-to-PPI ratio in Europe relative to the US (Chart 15). This confirms that a weaker euro is not helping the relative performance of European shares because it indicates a problem with the comparative profitability of European businesses. It also implies that the euro will weaken as long as Dutch natural gas prices are rising (Chart 15, bottom panel). Historically, a weak euro is associated with underperforming European equities. At the most basic level, a depreciating euro arithmetically derails the common-currency performance of European shares. Moreover, because a falling euro is often linked to poor rates of return in the Euro Area, it corresponds to periods when investors prefer foreign shares to European ones. For now, we see a large left tail in short-term distributions of the EUR/USD’s returns, even if the long-term prospects of the euro are brighter. This also signifies that the euro will remain a hurdle for the relative performance of European shares in the coming weeks. Bottom Line: The lack of pricing power of European firms weighs on the profitability of Eurozone businesses compared to that of US ones and on the euro. As long as this problem persists, the euro will suffer, which implies additional weaknesses in the relative performance of European shares. Problem 5: Europe Structurally Poor Profitability Chart 16Europe's Structural Profitability Problem
Europe's Structural Profitability Problem
Europe's Structural Profitability Problem
Since 2008, the EPS of the Eurozone MSCI benchmark have collapsed 73% compared to those of the US index. Moreover, this fall has followed a nearly straight line. This poor performance reflects an underlying structural challenge to European profitability. Europe’s low profit growth follows poor returns on assets. At first glance, lower levels of stock repurchases explain some of the underperformance of European earnings. However, the lower propensity of European firms to conduct buybacks mirrors their poor profitability. As Chart 16 highlights, European firms have much lower RoEs, RoAs, profit margins, and asset utilization rates than their US counterparts. The low profitability of European shares is multifaceted. To a large degree, it corresponds to the Eurozone’s anemic growth, whereby nominal as well as real GDP per capita continue to lag those of the US (Chart 17). This weak per-capita GDP is a consequence of the meager underlying productivity of the Euro Area. Many elements cause Europe’s lower productivity growth. The two most obvious culprits are the region’s greater economic fragmentation and its heavier regulatory burden when compared to the US. But also, the return on investment is much lower in Europe (Chart 17, bottom panel). The lower European return on investment is more complex. A key driver is the greater degree of misallocated capital in Europe than in the US. Europe’s capital stocks, especially in the periphery, represents a much greater share of GDP than it does in the US (Chart 18). A larger capital stock increases the odds that some previous capex was misallocated. Moreover, the greater prevalence of small businesses in Europe compared to the US also increases the likelihood of redundant and misallocated capital. Poor capital allocation hurts investment returns and productivity. Chart 17Weak Growth = Weak ROI
Weak Growth = Weak ROI
Weak Growth = Weak ROI
Chart 18Too Much Capital
Too Much Capital
Too Much Capital
Another reason for Europe’s poor profitability has nothing to do with productivity and tepid growth. European industries are less concentrated than US ones (Chart 19). Lower concentration means higher competition between businesses, which erodes markups and returns on assets. Chart 19Smaller Profitability Moats In Europe
Too Early To Overweight Europe
Too Early To Overweight Europe
None of Europe’s structural weaknesses in relation to profitability has been addressed. Consequently, this drag on the relative performance of Euro Area equities remains firmly in place, which warrants a significant discount in European equity valuations relative to US ones. Bottom Line: The last problem for European shares is the structural under profitability of the Eurozone. Because of lower productivity, misallocated capital, and lower industry concentration, European firms offer permanently weaker returns on assets than US businesses. Their disadvantage remains unaddressed, which suggests that structural forces are unlikely to generate a re-rating of European shares any time soon. Investment Implications Conditions are still not supportive for an outperformance of European equities relative to US ones. European stocks may have already bottomed in absolute terms and they are very cheap compared to US shares, but Euro Area earnings are set to underperform further. European stocks cannot beat US stocks until most of the five headwinds impacting Europe come to pass. The deceleration in Chinese and global growth, the surge in Dutch natural gas prices, the growing liquidity risk in the Eurozone, the collapse of EUR/USD, and the structural impediments to European profitability are just too strong collectively to allow Europe’s attractive valuation to crystalize into immediate high returns. Nonetheless, we cannot be dogmatic. Before year-end, we expect three of these variables to become favorable for European stocks. Namely, we anticipate the natural gas crisis to reach its apex around November 2022, the ECB to activate the TPI, which will tackle the budding illiquidity in European credit markets, and the euro to bottom. Hence, we are in the late stage of this year’s underperformance of European equities. An opportunity to upgrade Europe is around the corner – we are just not there yet. Even after all the cyclical and short-term negatives ebb, one key hurdle for European stocks will remain intact: the structural under profitability. This force suggests that periods of outperformance of European stocks are likely to be short-lived and that, as long as the profitability gap remains open, the structural relative bear market in European stocks will persist. Bottom Line: It is still too early to overweight European equities. Euro Area stocks are much cheaper than their US counterparts, but too many headwinds continue to blow that are likely to weigh on relative performance. Only after European natural gas prices peak will Europe enjoy a period of outperformance. This is unlikely to happen until this winter. Mathieu Savary, Chief European Strategist Mathieu@bcaresearch.com Tactical Recommendations Cyclical Recommendations Structural Recommendations
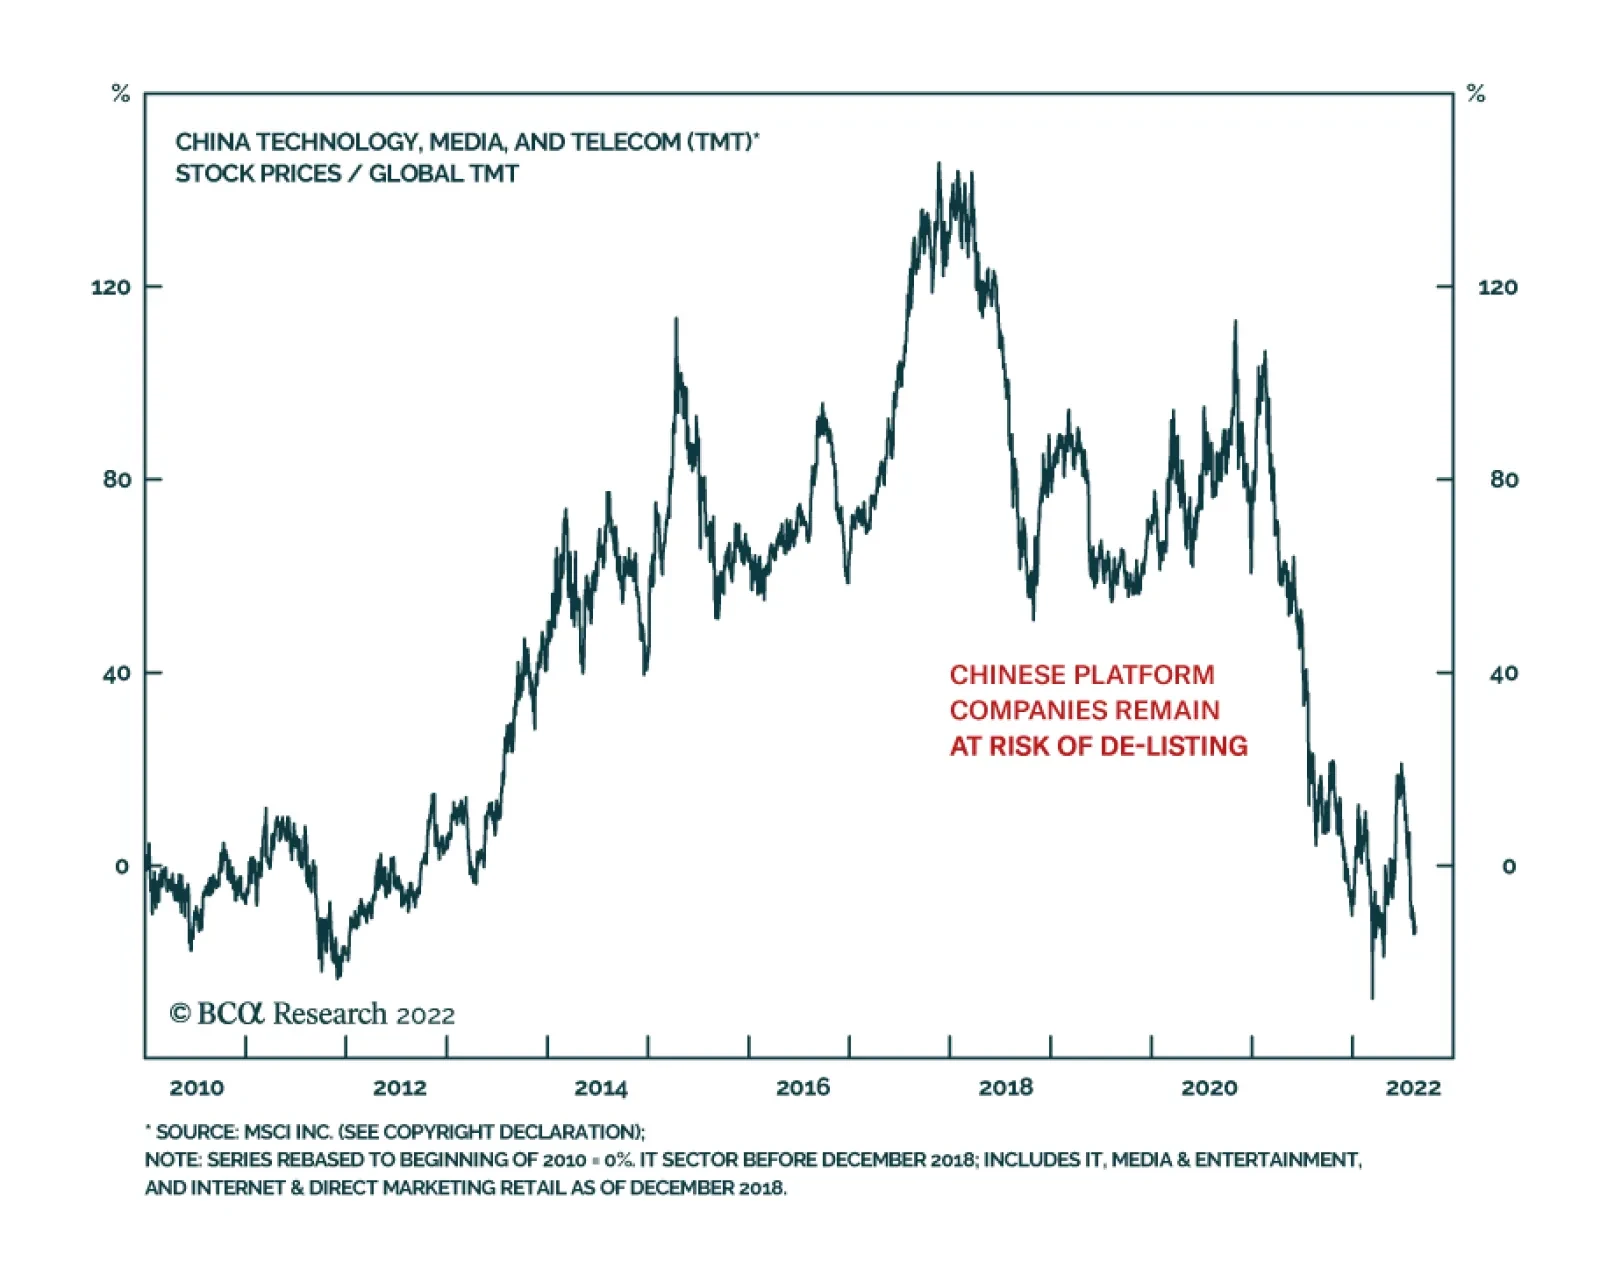
On Friday, the US Securities and Exchange Commission and Public Company Accounting Oversight Board announced that the US and China have reached a preliminary deal allowing American accounting regulators to inspect the audit records of Chinese companies listed…
Listen to a short summary of this report. Executive Summary Housing Activity Should Start To Stabilize By The End Of The Year
Housing Activity Should Start To Stabilize By The End Of The Year
Housing Activity Should Start To Stabilize By The End Of The Year
Home prices in the US are set to decline, almost certainly in real terms and probably in nominal terms as well. Unlike in past episodes, the impact on construction from a drop in home prices should be limited, given that the US has not seen pervasive overbuilding. The drag on US consumption should also be somewhat muted. In contrast to what happened during the mid-2000s, outstanding balances on home equity lines of credit declined during the pandemic housing boom. US banks are on a strong footing today. This should limit the collateral damage from falling home prices on the financial system. Outside the US, the housing outlook is more challenging. This is especially the case in smaller developed economies such as Canada, Australia, New Zealand, and Sweden. It is also the case in China, where the property market may be on the verge of a Japanese-style multi-decade slide. Bottom Line: Softening housing markets around the world will weigh on growth. However, against the backdrop of high inflation, that may not be an unambiguously bad thing. We expect global equities to rise into year end, and then retreat in 2023. The Canary in the Coalmine On the eve of the Global Financial Crisis, Ed Leamer delivered a paper at Jackson Hole with the prescient title “Housing IS the Business Cycle.” Leamer convincingly argued that monetary policy primarily operates through the housing market, and that a decline in residential investment is by far the best warning sign of a recession. Table 1 provides supporting evidence for Leamer’s conclusion. It shows that residential investment is not a particularly important driver of GDP growth during non-recessionary quarters but is the only main expenditure component that regularly turns down in the lead-up to recessions. Table 1A Decline In Residential Investment Typically Precedes Recessions
The Risks From Housing
The Risks From Housing
US real residential investment was essentially flat in Q1 but then contracted at an annualized pace of 16% in Q2, shaving 0.83 percentage points off Q2 GDP growth in the process. The Atlanta Fed GDPNow model forecasts that real residential investment will shrink by 22% in Q3, largely reflecting the steep drop in housing starts and home sales observed over the past few months. Chart 1Housing Activity Should Start To Stabilize By The End Of The Year
Housing Activity Should Start To Stabilize By The End Of The Year
Housing Activity Should Start To Stabilize By The End Of The Year
The recent decline in construction activity is a worrying indicator. Nevertheless, there are several reasons to think that the downturn in housing may not herald an imminent recession. First, the lag between when housing begins to weaken and when the economy falls into recession can be quite long. For example, residential investment hit a high of 6.7% of GDP in Q4 of 2005. However, the Great Recession did not start until Q4 of 2007, when residential investment had already receded to 4.2% of GDP. The S&P 500 peaked during the same quarter. Second, recent weakness in housing activity largely reflects the lagged effects of the spike in mortgage rates earlier this year. To the extent that mortgage rates have been broadly flat since April, history suggests that housing activity should start to stabilize by the end of this year (Chart 1). Third, unlike in the mid-2000s, there is no glut of homes in the US today: Residential investment reached 4.8% of GDP last year, about where it was during the late 1990s, prior to the start of the housing bubble (Chart 2). The construction of new homes has failed to keep up with household formation for the past 15 years (Chart 3). As a result, the homeowner vacancy rate stands at 0.8%, the lowest on record (Chart 4). Chart 2Residential Investment Is Well Below Levels Seen During The Housing Bubble
Residential Investment Is Well Below Levels Seen During The Housing Bubble
Residential Investment Is Well Below Levels Seen During The Housing Bubble
Chart 3Home Construction Has Fallen Short Of Household Formation For The Past 15 Years
Home Construction Has Fallen Short Of Household Formation For The Past 15 Years
Home Construction Has Fallen Short Of Household Formation For The Past 15 Years
Chart 4The Homeowner Vacancy Rate Is At Record Lows
The Homeowner Vacancy Rate Is At Record Lows
The Homeowner Vacancy Rate Is At Record Lows
While new home inventories have risen, this mainly reflects an increase in the number of homes under construction. The inventory of finished homes is still 40% below pre-pandemic levels (Chart 5). The inventory of existing homes available for sale is also quite low, which suggests that a rising supply of new homes could be depleted more quickly than in the past. Chart 5While The Number Of Homes Under Construction Increased, The Inventory Of Newly Built And Existing Homes Remains Low
While The Number Of Homes Under Construction Increased, The Inventory Of Newly Built And Existing Homes Remains Low
While The Number Of Homes Under Construction Increased, The Inventory Of Newly Built And Existing Homes Remains Low
Why Was Housing Supply Slow to Rise? In real terms, the Case-Shiller index is now 5% above its 2006 peak (Chart 6). Why didn’t housing construction respond more strongly to rising home prices during the pandemic? Part of the answer is that the memory of the housing bust curtailed the homebuilders’ willingness to expand operations. Supply shortages also limited the ability of homebuilders to construct new homes in a timely fashion. Chart 7 shows that the producer price index for construction materials increased by nearly 50% between January 2020 and July 2022, outstripping the rise in the overall PPI index. Chart 6Real House Prices Are Above Their 2006 Peak
Real House Prices Are Above Their 2006 Peak
Real House Prices Are Above Their 2006 Peak
Chart 7Producer Prices For Construction Materials Shot Up During The Pandemic
Producer Prices For Construction Materials Shot Up During The Pandemic
Producer Prices For Construction Materials Shot Up During The Pandemic
Chart 8Constraints On Home Building Caused The Housing Market To Clear Mainly Through Higher Prices Rather Than Increased Construction
The Risks From Housing
The Risks From Housing
The lack of building materials and qualified construction workers caused the supply curve for housing to become increasingly steep (or, in the parlance of economics, inelastic). To make matters worse, pandemic-related lockdowns probably caused the supply curve to shift inwards, prompting homebuilders to curb output for any given level of home prices. As Chart 8 illustrates, this meant that the increase in housing demand during the pandemic was largely absorbed through higher home prices rather than through increased output. A Bittersweet Outcome Chart 9Unlike During The Great Recession, Prices For New And Existing Homes Should Fall In Tandem This Time Around
Unlike During The Great Recession, Prices For New And Existing Homes Should Fall In Tandem This Time Around
Unlike During The Great Recession, Prices For New And Existing Homes Should Fall In Tandem This Time Around
The discussion above presents a good news/bad news story about the state of the US housing market. On the one hand, with seasonally-adjusted housing starts now below where they were in January 2020, construction activity is unlikely to fall significantly from current levels. On the other hand, as the supply curve for housing shifts back out, and the demand curve shifts back in towards pre-pandemic levels, home prices are bound to weaken. We expect US home prices to decline, almost certainly in real terms and probably in nominal terms as well. Unlike during the Great Recession, when a wave of foreclosures caused the prices of existing homes to fall more than new homes, the decline in prices across both categories is likely to be similar this time around (Chart 9). The Impact of Falling Home Prices To what extent will lower home prices imperil the US economy? Beyond the adverse impact of lower prices on construction activity, falling home prices can depress aggregate demand through a negative wealth effect as well as by putting strain on the banking system. The good news is that both these channels are less operative today than they were prior to the GFC. Perhaps because home prices rose so rapidly over the past two years, homeowners did not get the chance to spend their windfall. The personal savings rate soared during the pandemic and has only recently fallen below its pre-pandemic average (Chart 10). Households are still sitting on about $2.2 trillion in excess savings, most of which is parked in highly liquid bank accounts. Outstanding balances on home equity lines of credit actually fell during the pandemic, sinking to a 21-year low of 1.3% of GDP in Q2 2022 (Chart 11). All this suggests that the coming decline in home prices will not suppress consumption as much as it did in the past. Chart 10Household Savings Surged During The Pandemic
Household Savings Surged During The Pandemic
Household Savings Surged During The Pandemic
Chart 11Despite Higher Home Prices, Households Are Not Using Their Homes As ATMs
Despite Higher Home Prices, Households Are Not Using Their Homes As ATMs
Despite Higher Home Prices, Households Are Not Using Their Homes As ATMs
The drop in home prices during the GFC generated a vicious circle where falling home prices led to more foreclosures and fire sales, leading to even lower home prices. Such a feedback loop is unlikely to emerge today. As judged by FICO scores, lenders have been quite prudent since the crisis (Chart 12). The aggregate loan-to-value ratio for US household real estate holdings stands near a low of 30%, down from 45% in the leadup to the GFC (Chart 13). Banks are also much better capitalized than they were in the past (Chart 14). Chart 12FICO Scores For Residential Mortgages Have Improved Considerably Since The Pre-GFC Housing Bubble
The Risks From Housing
The Risks From Housing
Chart 13This Is Not 2007
This Is Not 2007
This Is Not 2007
Chart 14US Banks Are Better Capitalized Than Before The GFC
US Banks Are Better Capitalized Than Before The GFC
US Banks Are Better Capitalized Than Before The GFC
The final thing to note is that home prices tend to fall fairly slowly. It took six years for prices to bottom following the housing bubble, and this was in the context of a severe recession. Thus, the negative wealth effect from falling home prices will probably not become pronounced until 2024 or later. A Grimmer Picture Abroad The housing outlook is more challenging in a number of economies outside of the US. While home prices have increased significantly in the US, they have risen much more in smaller developed economies such as Canada, Australia, New Zealand, and Sweden (Chart 15). My colleague, Jonathan LaBerge, has also argued that overbuilding appears to be more of a problem outside the US (Chart 16). Chart 15Rising Rates Will Weigh On Developed Economies With Pricey Housing Markets
Rising Rates Will Weigh On Developed Economies With Pricey Housing Markets
Rising Rates Will Weigh On Developed Economies With Pricey Housing Markets
Chart 16Canada And Several Other DM Countries Have Overbuilt Homes Since The Global Financial Crisis
Canada And Several Other DM Countries Have Overbuilt Homes Since The Global Financial Crisis
Canada And Several Other DM Countries Have Overbuilt Homes Since The Global Financial Crisis
Chart 17Slightly More Than Half Of Canadians Opted For Variable Rate Mortgages Over The Past 12 Months
Slightly More Than Half Of Canadians Opted For Variable Rate Mortgages Over The Past 12 Months
Slightly More Than Half Of Canadians Opted For Variable Rate Mortgages Over The Past 12 Months
The structure of some overseas mortgage markets heightens housing risks. In Canada, for example, more than half of homebuyers chose a variable-rate mortgage over the last 12 months (Chart 17). At present, about one-third of the total stock of mortgages are variable rate compared to less than 20% prior to the pandemic. Moreover, unlike in the US where 30-year mortgages are the norm, fixed-rate mortgages in Canada typically reset every five years. Thus, as the Bank of Canada hikes rates, mortgage payments will rise quite quickly. China: Following Japan’s Path? In the EM space, China stands out as having the most vulnerable housing market. The five major cities with the lowest rental yields in the world are all in China (Chart 18). Home sales, starts, and completions have all tumbled in recent months (Chart 19). The bonds of Chinese property developers are trading at highly distressed levels (Chart 20). Chart 18Chinese Real Estate Shows Vulnerabilities…
The Risks From Housing
The Risks From Housing
Chart 19...Activity And Prices Have Been Falling...
...Activity And Prices Have Been Falling...
...Activity And Prices Have Been Falling...
Chart 20...And the Bonds of Property Developers Are Trading At Distressed Levels
...And the Bonds of Property Developers Are Trading At Distressed Levels
...And the Bonds of Property Developers Are Trading At Distressed Levels
In many respects, the Chinese housing market resembles the Japanese market in the early 1990s. Just as was the case in Japan 30 years ago, Chinese household growth has turned negative (Chart 21). The collapse in the birth rate since the start of the pandemic will only exacerbate this problem. The number of births is poised to fall below 10 million this year, down more than 30% from 2019 (Chart 22). Chart 21China Faces A Structural Decline In The Demand For Housing
China Faces A Structural Decline In The Demand For Housing
China Faces A Structural Decline In The Demand For Housing
Chart 22China's Baby Bust
China's Baby Bust
China's Baby Bust
A few years ago, when inflation was subdued and talk of secular stagnation was all the rage, a downturn in the Chinese property sector would have been a major cause for concern. Things are different today. Global inflation is running high, and to the extent that investors are worried about a recession, it is because they think central banks will need to raise rates aggressively to curb inflation. A weaker Chinese property market would help restrain commodity prices, easing inflationary pressures in the process. As long as the Chinese banking system does not implode – which is highly unlikely given that the major banks are all state-owned – global investors might actually welcome a modest decline in Chinese property investment. Investment Conclusions The downturn in the US housing market suggests that we are in the late stages of the business-cycle expansion. However, given the long lags between when housing begins to weaken and when a recession ensues, it is probable that the US will only enter a recession in 2024. To the extent the stock market typically peaks six months before the outset of a recession, equities may still have further to run, at least in the near term. As we discussed last week, we recommend a neutral allocation on global stocks over a 12-month horizon but would overweight equities over a shorter-term 6-month horizon. In relative terms, the US housing market is more resilient than most other housing markets. We initiated a trade going long Canadian government bonds relative to US bonds on June 30, when the 10-year yield in Canada was 21 basis points above the comparable US yield. Today, the yield on both bonds is almost the same. We expect Canadian bonds to continue to outperform, given the more severe constraints the Bank of Canada faces in raising rates. Peter Berezin Chief Global Strategist peterb@bcaresearch.com Follow me on LinkedIn & Twitter Global Investment Strategy View Matrix
The Risks From Housing
The Risks From Housing
Special Trade Recommendations Current MacroQuant Model Scores
The Risks From Housing
The Risks From Housing
Highlights The risk of a US recession has increased sharply over the past several months. We have not yet concluded that a recession over the coming year is inevitable, but substantial (further) supply-side and pandemic-related disinflation is likely needed for the US economy to avoid a contraction in output. The increased risk of a contraction has caused investors to ponder what the next recession might look like. One very important question concerns the likely behavior of short-term interest rates during the next recession, especially if it occurs sooner rather than later. The historical experience suggests that the Fed may cut interest rates to zero during the next recession, but that the re-establishment of a long-lasting zero interest rate policy and the associated resumption of large-scale asset purchases seem quite unlikely unless the recession is severe. In the post-WWII environment, severe US recessions have been accompanied by aggravating factors that appear to be missing in the current environment. In addition, there are several arguments pointing to the next US recession being a mild one. For fixed-income investors, the implication is that investors should not overstay their welcome in a long-duration position during the next US recession, and should be looking to reduce their duration exposure earlier rather than later. For equity investors, our findings underscore that meaningful downside risk exists for stocks even in a mild recession environment, because the decline in bond yields is not likely to offset a rise in the equity risk premium. Feature Over the past several months, investors have been faced with a sharp increase in the odds of a US recession. Gauging the risk of a recession has featured prominently in our recent reports, and we have concluded, for now, that a US recession over the coming year is not yet inevitable. Still, we acknowledge that the risks are quite elevated, and that substantial (further) supply-side and pandemic-related disinflation is likely needed for the US economy to avoid a contraction in output. Economic expansions do not last forever. This means that the US economy will eventually succumb to a recession at some point over the coming few years. One very important question for investors concerns the likely behavior of short-term interest rates during the next recession, especially if a contraction occurs sooner rather than later. A key aspect of this question is whether the Fed is likely to be forced back towards a zero or negative interest rate policy, and whether it will need to employ asset purchases as part of its stabilization efforts as it has during the last two recessions. If so, long-maturity bond yields are likely to fall significantly during the next recession; if not, investors may be surprised by how modestly long-maturity yields decline. In this report, we examine the historical record of short-term interest rates during recessions and discuss whether the next US recession is likely to be severe or mild. We conclude that the next US recession is more likely to be mild than severe, and that the 10-year Treasury yield is unlikely to fall below 2% during the recession (or fall below this level for very long). In the case of a more severe recession driven by unanchored inflation expectations, the implications would be clearly bearish for bonds. Within a fixed-income portfolio, one conclusion of our analysis is that investors should not overstay their welcome in a long-duration position during the next recession and should be looking to reduce their duration exposure earlier rather than later. For equity investors, our findings underscore that meaningful downside risk exists for stocks even in a mild recession environment, because the decline in bond yields is not likely to offset a rise in the equity risk premium. The Historical Recessionary Path Of Short-Term Interest Rates When projecting how the Fed funds rate is likely to evolve during the next US recession, most investors typically look to the average decline in short-term interest rates during previous recessions as a guide. Based on that approach, Table II-1 highlights that the Fed would likely have to cut rates into negative territory if a recession occurred over the coming 12-18 months, unless it is able to hike interest rates significantly more over the coming year than the market is currently expecting and the FOMC itself is projecting. But in our view, focusing on the historical recessionary decline in interest rates from their peak is not the right approach, because it ignores the fact that recessions typically occur when monetary policy is tight. If a recession occurs within the next 18 months, it will have happened in large part because of a collapse in real wage growth, not just because of the increase in interest rates that has occurred. Chart II-1 highlights that short-term interest rates remain well below potential GDP growth, highlighting that monetary policy would still be easy today – despite the quick pace of increase in short rates – if real wages were growing rather than contracting sharply. In our view, the right approach is to examine how much short-term interest rates have typically fallen during recessions relative to potential or average historical GDP growth. This method captures the degree to which monetary policy easing has typically been required relative to neutral levels to catalyze an economic recovery. Table II-1Based Only On The Historical Decline In Short-Term Interest Rates, The Fed Would Ostensibly Have To Cut Rates Into Negative Territory During The Next Recession
September 2022
September 2022
Chart II-1Monetary Policy Would Still Be Easy Today If Real Wage Growth Was Positive
Monetary Policy Would Still Be Easy Today If Real Wage Growth Was Positive
Monetary Policy Would Still Be Easy Today If Real Wage Growth Was Positive
Based on this approach, Chart II-2 highlights that the Fed might have to cut the target range for the Fed funds rate to 0-0.25% during the next recession, but there are some examples (like the 1990-1991 recession) that point to a cut to just 0.25-0.5%. The goal of this exercise is not to be specific about the exact level to which the Fed will have to cut the Fed funds rate, but rather whether the de facto re-establishment of a long-lasting zero interest rate policy and the associated resumption of large-scale asset purchases is likely. Chart II-2The Fed May Have To Cut To Zero During The Next Recession, But Probably Not Into Negative Territory
September 2022
September 2022
Structural bond bulls might note that there are five recessions in the post-war era that could potentially point to that outcome based on Chart II-2. However, these episodes involved circumstances that we doubt would be present during the next US recession, especially if one were to emerge over the coming 12-18 months. The 1950s Recessions The recessions of 1953-54 and 1957-58 were fairly sizeable based on the total rise in the unemployment rate, but the monetary policy stance at that time was wildly stimulative in a way that is very unlikely to repeat itself today. In the 1950s, the level of interest rates was still an artifact of WWII (with the Treasury-Fed accord having only been agreed upon in March 1951). Monetary policy was both overly responsive to a period of pent-up disinflation following the initial burst of government spending associated with the Korean war and insufficiently responsive to a strongly positive output gap (Chart II-3). This was meaningfully compounded by a poor understanding of the size of the output gap at that time; the deviation of the unemployment rate from its 10-year average was significantly smaller than its deviation from today’s estimate of NAIRU (Chart II-4). In sum, the economic and monetary policy conditions that existed in the 1950s and that contributed to an interest rate level that was well below the prevailing rate of economic growth do not exist today. As such, we strongly doubt that the Fed’s response to the next US recession would resemble what occurred during that decade. Chart II-3We Strongly Doubt The Fed's Response To The Next US Recession Would Resemble What Occurred In The 1950s
We Strongly Doubt The Fed's Response To The Next US Recession Would Resemble What Occurred In The 1950s
We Strongly Doubt The Fed's Response To The Next US Recession Would Resemble What Occurred In The 1950s
Chart II-4Low Interest Rates In The 1950s Were Partly Caused By Wrong Output Gap Estimates
Low Interest Rates In The 1950s Were Partly Caused By Wrong Output Gap Estimates
Low Interest Rates In The 1950s Were Partly Caused By Wrong Output Gap Estimates
1973-1975 The recession that began in 1973 occurred because of a huge energy shock that proved to be stagflationary in the true sense of the word. Excluding the 2020 recession, this was the third largest rise in the unemployment rate of any recession since WWII, following 2008/2009 and the 1981/1982 recessions. There are some parallels between this recession and the current economic environment, but the stability of inflation expectations so far does not point to a truly stagflationary outcome. As such, we do not see the 1973-74 recession as a reasonable parallel to today’s environment. In addition, manufacturing employment – which was heavily impacted by the permanent rise in oil prices due to the sector’s energy intensity – stood at 24% of total nonfarm employment in 1973, compared with 8% today. Finally, the weight of food and energy as a share of total consumer spending today is roughly half of what it was during the 1970s (Chart II-5). 2001 Of the five recessions potentially implying that the Fed may have to cut interest rates into negative territory during the next US recession, the 2001 recession is the most relevant parallel to today. It was a modern recession in which the Fed maintained very easy monetary policy for a significant amount of time, in response to concerns about a significant tightening in financial conditions and the impact of prior corporate sector excesses on aggregate demand. The total rise in the unemployment rate during this recession was not very large, but it took some time for the unemployment rate to return to NAIRU. Still, even though this justified a later liftoff, a Taylor rule approach makes it clear that the Fed overstimulated the economy in response to the recession – a view that is reinforced by the enormous rise in household debt that fueled the housing market bubble during that period (Chart II-6). The Fed was very concerned about the negative wealth effects of the bursting of the equity market bubble, which had been caused by a massive decline in the equity risk premium in the second half of the 1990s. These conditions are simply not present today. Chart II-5Today's US Economy Is Meaningfully Less Impacted By Energy And Food Prices
Today's US Economy Is Meaningfully Less Impacted By Energy And Food Prices
Today's US Economy Is Meaningfully Less Impacted By Energy And Food Prices
Chart II-6The Fed Clearly Overstimulated In Response To The 2001 Recession
The Fed Clearly Overstimulated In Response To The 2001 Recession
The Fed Clearly Overstimulated In Response To The 2001 Recession
2008/2009 Chart II-7A Repeat Of The 2008/2009 Recession In The US Is A Totally Implausible Scenario
A Repeat Of The 2008/2009 Recession In The US Is A Totally Implausible Scenario
A Repeat Of The 2008/2009 Recession In The US Is A Totally Implausible Scenario
Chart II-2 highlighted that the Fed would have to cut interest rates to -1% were the 2008/2009 recession to repeat itself, but we judge that to be a totally implausible scenario given the improvement in US household sector balance sheets and financial sector health since the global financial crisis (Chart II-7). As we discuss below, the next US recession is likely to be meaningfully less severe than the 2008/2009 and 2020 recessions, which we believe carries important significance for the path of interest rates and the response of long-maturity bond yields. The bottom line for investors is that, based on the historical experience of rate cuts during recessions, the Fed may end up cutting interest rates back to or close to the zero lower bound in response to the next recession. But the de facto re-establishment of a long-lasting zero interest rate policy and the associated resumption of large-scale asset purchases seems quite unlikely unless the recession is severe, which we do not expect. Will The Next US Recession Be Severe Or Mild? Chart II-8The Most Severe US Recessions Have Had Aggravating Factors That Do Not Appear To Be Present Today
September 2022
September 2022
How drastically the Fed will be forced to cut interest rates during the next recession will be driven by its severity. Chart II-8 presents the total rise in the unemployment rate during post-WWII recessions (excluding 2020), in order to gauge whether the factors that have led to severe recessions in the past are likely to be present during the next contraction in output. From our perspective, the most severe US recessions in the post-WWII era have been driven by factors that are very unlikely to repeat themselves in the current environment. We noted above that a repeat of the 2008/2009 recession is a totally implausible scenario, leaving the 1981-1982, 1973-1975, and 1950s recessions as potential severe recession analogues. In three of these four cases we see clear signs of an aggravating factor that we do not (yet) believe will be present during the next US recession. Chart II-9Inflation Expectations Have Not Yet Unanchored To The Upside, In Sharp Contrast To The 1970s
Inflation Expectations Have Not Yet Unanchored To The Upside, In Sharp Contrast To The 1970s
Inflation Expectations Have Not Yet Unanchored To The Upside, In Sharp Contrast To The 1970s
In the 1981-1982 recession, the unemployment rate rose significantly as the Federal Reserve confronted the fact that inflation expectations had become severely unanchored to the upside, causing a persistent wage/price spiral. While unanchored inflation expectations is a risk today, so far the evidence suggests that both households and market participants expect that currently elevated inflation will not persist over the long run (Chart II-9). If inflation expectations do become unanchored to the upside at some point over the coming 12-18 months (or beyond), we are very likely to change our view about the severity of the next recession. However, this would be a bond bearish outcome (at least initially), as it would imply sharply higher yields at both the short and long end of the yield curve in order to tame inflation and re-anchor inflation expectations. As noted above, in the 1973-74 recession, the unexpected and permanent rise in oil prices and outright energy shortages rendered a significant amount of capital and labor uneconomic, which is different than what has been occurring during the pandemic. Were the recent rise in natural gas prices to be permanent and no alternatives available, Europe’s current energy situation would be more reminiscent of the 1973-1974 recession than the pandemic-driven price pressures and supply shortages affecting the US and other developed economies. Chart II-10The US Is Currently Experiencing Fiscal Drag, But That Will Lessen Next Year
The US Is Currently Experiencing Fiscal Drag, But That Will Lessen Next Year
The US Is Currently Experiencing Fiscal Drag, But That Will Lessen Next Year
Finally, while the 1957-58 recession appears to be somewhat of an anomaly driven by a mix of factors, the 1953-54 recession was clearly exacerbated by a sharp slowdown in government spending following the end of the Korean war. It is true that the US is currently experiencing fiscal drag (Chart II-10), but this has occurred against the backdrop of a strong labor market, and IMF forecasts imply that the drag will be significantly smaller over the coming year than what the US is currently experiencing. There are several additional points suggesting that the next US recession will be comparatively mild: Chart II-11The Milder US Recessions Were All Seemingly Triggered By Tight Monetary Policy (As Would Be The Case Today)
The Milder US Recessions Were All Seemingly Triggered By Tight Monetary Policy (As Would Be The Case Today)
The Milder US Recessions Were All Seemingly Triggered By Tight Monetary Policy (As Would Be The Case Today)
Chart II-11 highlights that the milder recessions, those which have seen the unemployment rate rise by less than 3% from their previous low, have generally been the recessions that appear to have simply been triggered by monetary policy becoming tight or nearly tight. This would likely be the case during the next US recession. In the lead up to the 1970, 1990-91, and 2001 recessions, short-term interest rates approached or exceeded either potential growth or the rolling 10-year average growth rate of nominal GDP. The 1960-61 recession stands out slightly as an exception to this rule, in that interest rates were still moderately easy, which is based on our definition of the equilibrium short-term interest rate. But interest rates had risen close to 400 basis points from 1958 to 1960 (suggesting a change in addition to a level effect of interest rates on aggregate demand), and it is notable that the 60-61 recession was the mildest in post-war history, based on the total rise in the unemployment rate. Chart II-12Labor Scarcity May Mean That Firms Will Be Somewhat More Reluctant To Shed Labor During The Next Recession
Labor Scarcity May Mean That Firms Will Be Somewhat More Reluctant To Shed Labor During The Next Recession
Labor Scarcity May Mean That Firms Will Be Somewhat More Reluctant To Shed Labor During The Next Recession
We argued in Section 1 of our report that monetary policy is not currently restrictive on its own, and that the recessionary risk currently facing the US is the result of a combination of the speed of adjustment in interest rates, the fact that real wages have fallen sharply, and the fact that the Fed is determined to see inflation quickly return to target levels. However, what this also highlights is that a recession would likely cause a rise in real wages via a significant slowdown in inflation (at least for a time); this would likely help stabilize aggregate demand and cause a comparatively mild rise in the unemployment rate. While the odds and magnitude of this effect are difficult to quantify, the fact that the labor market has been so tight over the past year and that the participation rate has yet to recover to its pre-pandemic levels suggests that some firms may be reluctant to shed labor during a recession (Chart II-12), suggesting that the total rise in unemployment in the next recession could be relatively small. Finally, Chart II-13 shows that the excess savings that have accumulated over the course of the pandemic, now primarily the result of reduced spending on services, dwarf the magnitude of precautionary savings that were generated in the prior three recessions as a % of GDP. We agree that the savings rate would likely still rise during the next recession, but the existence of excess savings implies that the rise in the savings rate may be surprisingly small – which would, in turn, imply a comparatively mild rise in the unemployment rate. We noted above that the household sector has deleveraged significantly, which is strong evidence against an outsized or long-lasting decline in consumer spending as a possible driver of an above-average rise in the unemployment rate during the next recession. One question that we often receive from clients is whether excessive corporate sector leverage could cause a more severe decline in economic activity once a recession emerges. Chart II-14 illustrates that the answer is “probably not.” The chart presents one estimate of the US nonfinancial corporate sector debt service ratio, based on national accounts data. The chart highlights that the current debt burden for the nonfinancial corporate sector is very low, underscoring that elevated corporate sector debt would not likely act as an aggravating factor driving an outsized rise in the unemployment rate were a recession to occur today. The chart also shows that even if the 10-year Treasury yield were to rise to 4% and corporate bond spreads were to widen in the lead up to a recession, the nonfinancial corporate sector debt service burden would rise to a lower peak than seen in the last three recessions. One key risk to a mild recession view is a scenario in which inflation does not return to or below the Fed’s target during the recession. In that kind of environment, the Fed would not likely cut interest rates to as low a level as they have in the past relative to potential growth. But the historical record is clear that recessions cause a deceleration in inflation, and if a recession emerges over the coming 12-18 months it will likely happen after supply-side and pandemic-related disinflation has already occurred. That means that inflation is likely to move back to or below the Fed’s target in a recessionary environment. We should note that this assessment differs somewhat from the scenario described by my former colleague Martin Barnes, who wrote a guest report on inflation published in our July Bank Credit Analyst.1 Chart II-13Today’s Pandemic-Related Excess Savings Dwarf Precautionary Savings During The Prior Three Recessions
September 2022
September 2022
Chart II-14US Corporate Sector Debt Unlikely To Lead To A More Severe Recession, Even In A Higher Yield Environment
US Corporate Sector Debt Unlikely To Lead To A More Severe Recession, Even In A Higher Yield Environment
US Corporate Sector Debt Unlikely To Lead To A More Severe Recession, Even In A Higher Yield Environment
Long-Maturity Bond Yields And The Next US Recession What does our analysis imply for long-maturity bond yields and the duration call over the coming few years? In order to judge what is likely to happen to long-maturity bond yields in a recession scenario over the coming 12-18 months, we first project the fair value of the 5-year Treasury yield based on the following hypothetical circumstances: The onset of recession in March 2023 and a peak in the Fed funds rate at a target range of 3.75-4%. A recession duration of eight months, over which time the Fed steadily cuts the policy rate to 0-0.25%. An initial Fed rate hike in September 2024, nine months following the end of the recession, consistent with a relatively short return of the unemployment rate to NAIRU as an expansion takes hold. A rate hike pace of eight quarter-point hikes per year, with the Fed again raising rates to a peak of 4% A longer-term average Fed funds rate of 3%, which we regard as a low estimate. Chart II-15The 5-Year Treasury Yield Would Not Fall Enormously In A Mild Recessionary Scenario
The 5-Year Treasury Yield Would Not Fall Enormously In A Mild Recessionary Scenario
The 5-Year Treasury Yield Would Not Fall Enormously In A Mild Recessionary Scenario
Chart II-15 highlights the fair value path for the 5-year Treasury yield in this scenario. Not surprisingly, the fair value today is lower than the current level of the 5-year yield, highlighting that a shift to a long duration stance will be warranted at some point over the coming year if the US economy enters a non-technical, typical income-statement recession. However, the chart also highlights that a long duration position is not likely to be warranted for very long, given that the lowest level of the 5-year fair value path is substantially higher than it was in 2020 and 2021 and is also higher than its 10-year average. Chart II-16 reveals the importance of forecasting the near-term path of interest rates when predicting the likely behavior of long-maturity bond yields. Even though near- and long-term interest rate expectations should be at least somewhat differentiated, the chart highlights that the real 5-year/5-year forward Treasury yield is very closely explained by the real 5-year Treasury yield and a 3-year lag of our adaptive inflation expectations model (which is highly consistent with BCA’s Golden Rule of bond investing framework). Chart II-16 shows that long-maturity bond yields should be higher than they are based on the current level of real 5-year yields and lagged inflation expectations, underscoring the point that we made in Section 1 of our report that significant upside risk exists for long-maturity bond yields in a non-recessionary outcome over the coming year. In a recessionary outcome, it is clear that bond yields will fall as the Fed cuts interest rates, as Chart II-15 demonstrated. But, Chart II-17 highlights that during recessions, there is little precedent for a negative 5-10 yield curve slope outside of the context of the persistently high inflation environment of the late 1960s and 1970s. Applying that template to the fair value path that we showed in Chart II-15 suggests that the 10-year Treasury yield will not fall below 2% during the next recession. As we noted in our August report,2 a 10-year Treasury yield decline to 2% would result in significant performance for long-maturity bonds, but it would not end the structural bear market in bonds that began two years ago – a fact that we suspect would be very surprising to bond-bullish investors. Chart II-165-Year Bond Yields Strongly Explain Yields 5-Years/5-Years Forward
5-Year Bond Yields Strongly Explain Yields 5-Years/5-Years Forward
5-Year Bond Yields Strongly Explain Yields 5-Years/5-Years Forward
Chart II-17There Is Not Much Precedent For A Negative 5/10 Yield Curve During Modern Recessions, Suggesting 10-Year Yields Will Not Fall Below 2% During The Next Recession
There Is Not Much Precedent For A Negative 5/10 Yield Curve During Modern Recessions, Suggesting 10-Year Yields Will Not Fall Below 2% During The Next Recession
There Is Not Much Precedent For A Negative 5/10 Yield Curve During Modern Recessions, Suggesting 10-Year Yields Will Not Fall Below 2% During The Next Recession
It is true that bond yields may deviate from the fair value levels shown in Chart II-15 if investors expect a different outcome for the path of the Fed funds rate than we described. However, it is worth noting that changes in our assumed post-recession peak Fed funds rate and the long-term average do not substantially change the outcome shown in Chart II-15. If investors instead assume that the Fed funds rate will peak at 3% during the next expansion, that lowers the fair value path for the 5-year yield by approximately 5 basis points. Changing the long-term average Fed funds rate to 2.4%, the Fed’s current neutral rate expectation, would reduce it by about 25 basis points. These levels would still be significantly above the lows reached in 2011-2013 and in 2020, underscoring that the length of the recession and the speed at which the Fed begins to raise interest rates will be far more important determinants of the path of US Treasury yields. We strongly suspect that investors will recognize that a comparatively mild recession will not result in the same hyper-accomodative monetary policy stance that occurred during the past two recessions, implying that long-maturity bond yields will have less downside during the next recession than may be currently recognized. Investment Conclusions As we have presented, the historical experience suggests that the Fed may cut interest rates to zero during the next recession, but that the re-establishment of a long-lasting zero interest rate policy and the associated resumption of large-scale asset purchases seem quite unlikely unless the recession is severe. In the post-WWII environment, severe US recessions have been accompanied by aggravating factors that appear to be missing in the current environment. In addition to this, there are several arguments pointing to the next US recession being a mild one. In a mild recession scenario, we doubt that the 10-year Treasury yield would fall below 2%, or fall below this level for very long. For fixed-income investors, while bond yields will fall for a time if a recession emerges, the implication is that investors should not overstay their welcome in a long-duration position during the recession and should be looking to reduce their duration exposure earlier rather than later. For equity investors, our findings underscore that meaningful downside risk exists for stocks even in a mild recession environment, because the decline in bond yields is not likely to offset a rise in the equity risk premium. We noted in our July report that if a recession occurred within the coming 6-12 months, that the S&P 500 would likely fall to 3100, even if the recession were average. A mild recession may see the S&P 500 decline less severely than this, but stocks are still likely to incur significant losses during the next recession unless investors price in a much shallower path for short-term interest rates than we believe will be warranted. As noted in Section 1 of our report, we have not yet concluded that a US recession is inevitable over the coming 6-12 months. Still, we acknowledge that the risks are quite elevated, and that substantial (further) supply-side and pandemic-related disinflation is likely needed for the US economy to avoid a contraction in output. Additional changes to our recommended cyclical allocation may thus occur over the coming few months, in response to incoming data, our assessment of the likely implications for monetary policy, and the response of long-maturity government bond yields. Jonathan LaBerge, CFA Vice President The Bank Credit Analyst Footnotes 1 Please see The Bank Credit Analyst "Inflation Whipsaw Ahead," dated June 30, 2022, available at bca.bcaresearch.com 2 Please see The Bank Credit Analyst "August 2022," dated July 28, 2022, available at bca.bcaresearch.com
Highlights The odds of a Goldilocks outcome for the US economy increased somewhat in August, but the risks of a US recession over the coming year remain quite elevated. We continue to recommend that investors stay neutrally positioned towards equities within a global multi-asset portfolio. The disinflationary impulse from the July US CPI report is less compelling than it seems, in that it appears to have been mostly driven by declining energy prices. It is far from clear that energy prices will continue to decline over the coming months and are, in fact, likely to rise even if an Iranian deal takes place. This implies that investors may have jumped the gun in pricing in substantial disinflation and sharply higher odds of a Goldilocks economic outcome. The OIS curve is implying a reasonable path for the Fed funds rate for the remainder of this year, but it is too low 12 months from now based on the Fed’s median rate expectation for year-end 2023. This suggests that a further upward adjustment in the OIS curve is likely warranted, and that a modestly short duration stance is appropriate. Investors believe that the rate hike path priced into the OIS curve would not be recessionary, because short-term inflation expectations are pricing in a very substantial slowdown in headline inflation. From the perspective of market participants, this would both raise the recessionary threshold for interest rates (via stronger real wages) and could potentially allow the Fed to reduce interest rates closer to its (very likely wrong) estimate of neutral. We agree that the odds of a recession will decline if headline inflation does fall below 4% over the coming year, but it is not yet clear that this will occur. And if it does, the resulting improvement in real wages would ultimately allow the Fed to raise interest rates to a higher level before short-circuiting the economic expansion. As such, we expect real long-maturity government bond yields to rise meaningfully in a scenario where real wages recover significantly and a recession is avoided, which will put heavy pressure on equity multiples. This underscores that stock prices face risks in both a recessionary and non-recessionary environment. There are arguments pointing to a decline in the dollar beyond the near term, even within the context of elevated recessionary odds in the US and our recommended neutral stance towards global equities. Stay neutral for now, but look for opportunities to short the dollar beyond the coming few months. Jumping The Gun On Goldilocks The odds of a Goldilocks outcome for the US economy over the coming six to nine months increased somewhat in August. The July CPI report presented some evidence of supply-side and pandemic-related disinflation (Chart I-1), and we saw more resilient manufacturing production in the US – even after excluding the automotive sector – than many manufacturing indicators have been indicating (Chart I-2). In addition, the regional Fed manufacturing index in the especially manufacturing-sensitive state of Pennsylvania surprised significantly to the upside in July, although this was at least somewhat offset by a collapse in the New York and Dallas Fed’s general business conditions indexes (Chart I-3). Chart I-1There Is Now Some Evidence Of Supply-Side & Pandemic-Related Disinflation In The US
There Is Now Some Evidence Of Supply-Side & Pandemic-Related Disinflation In The US
There Is Now Some Evidence Of Supply-Side & Pandemic-Related Disinflation In The US
Chart I-2US Manufacturing Production Has Been More Resilient Than Surveys Would Have Suggested
US Manufacturing Production Has Been More Resilient Than Surveys Would Have Suggested
US Manufacturing Production Has Been More Resilient Than Surveys Would Have Suggested
Against the backdrop of significant recessionary risks, and a debate about whether negative growth in the first half of the year already constitutes a recession in the US, these developments have been positive. The Atlanta Fed’s GDPNow model is pointing to positive (albeit below-trend) growth of 1.4% in Q3, which is consistent with consensus forecasts. The Atlanta Fed’s model is also forecasting the strongest real consumption growth since Q4 2021 (Chart I-4). Equity investors responded to incrementally lower recession odds and a slower pace of inflation by bidding up the S&P 500 from roughly 3800 at the beginning of July to over 4200 in August. Chart I-3Mixed Messages From The Regional Fed Indicators
Mixed Messages From The Regional Fed Indicators
Mixed Messages From The Regional Fed Indicators
Chart I-4The Atlanta Fed GDPNow Model Is Pointing To Positive Growth And Resilient Consumption In Q3
September 2022
September 2022
However, several other developments over the past month continue to highlight that the risks of a US recession over the coming year are quite elevated, which supports our recommendation that investors stay neutrally positioned towards equities within a global multi-asset portfolio: The August flash PMIs were fairly negative, especially for the services sector. The August flash S&P Global manufacturing PMI rose in Germany, but it fell in the US, France, and the UK. Services PMIs declined significantly in all four countries, especially in the US where survey participants noted that “hikes in interest rates and inflation dampened customer spending as disposable incomes were squeezed.” Survey respondents also noted that “new orders contracted at the steepest pace for over two years, as companies highlighted greater client hesitancy in placing new work.” Chart I-5The Conference Board's LEI Is Very Weak
The Conference Board's LEI Is Very Weak
The Conference Board's LEI Is Very Weak
The Conference Board’s leading economic indicator dropped for a fifth month in a row in July, which has always been associated with a US recession (based on the indicator’s current construction). Chart I-5 highlights that the indicator’s market-based and real economy components are both very weak, and that the Conference Board’s coincident indicator has now fallen below its 12-month moving average. While the Philly Fed manufacturing index picked up in July, the new orders component of the regional Fed manufacturing PMIs broadly sank further into contractionary territory (Chart I-6). Chart I-6The Regional Fed New Orders Components Are Very Weak
The Regional Fed New Orders Components Are Very Weak
The Regional Fed New Orders Components Are Very Weak
The Atlanta Fed model shown in Chart I-4 is pointing to a second quarter of negative growth from real residential investment, a component of GDP that reliably peaks in advance of economic contractions.1 Job openings are now pointing to a potential rise in unemployment. The relationship between job openings and unemployment is currently subject to heavy debate, as discussed in a recent report by my colleague Ryan Swift.2 However, abstracting from a theoretical discussion about movements along or shifts in the Beveridge curve, investors should note that the empirical record is fairly clear – Chart I-7 highlights that falling job vacancies occurred alongside a significant rise in the level of unemployment during the last two recessions. We acknowledge that the relationship has seen some deviations since 2018/2019, so this may highlight that a larger decline in job openings will be required for unemployment to trend higher. A 10% rise in the level of unemployment relative to its 12-month moving average has always been associated with a recession, implying that a sustained decline in job openings to 10M or lower would represent a likely recessionary signal – even if that recession proves to be a mild one (see Section 2 of this month’s report). Chart I-7Declining Job Openings Are Pointing To Potentially Higher Unemployment
Declining Job Openings Are Pointing To Potentially Higher Unemployment
Declining Job Openings Are Pointing To Potentially Higher Unemployment
Table I-1 highlights that the disinflationary impulse from the July CPI report is less compelling than it seems, in that it appears to have been mostly driven by declining energy prices (particularly gasoline and fuel oil). Outside of the clear impact that falling fuel prices had on airline fares, there is not yet compelling evidence that core inflation is decelerating due to easing supply-side and pandemic-related effects, or due to slowing demand. As we will discuss below, it is far from clear that energy prices will continue to decline over the coming months and are, in fact, likely to rise even if an Iranian deal takes place. This implies that investors may have jumped the gun in pricing in substantial disinflation and sharply higher odds of a Goldilocks economic outcome. Table I-1The Disinflationary Impulse From The July CPI Report Is Less Compelling Than It Seems
September 2022
September 2022
Inflation And The Fed As we discuss in Section 2 of our report, recessions occur because monetary policy becomes tight, a significant non-policy shock to aggregate demand or supply occurs, or some combination of both develops. We do not believe that monetary policy is currently restrictive on its own (Chart I-8), and we have not yet concluded that a US recession is inevitable. But when combined with the speed of adjustment in interest rates, the fact that real wages have fallen sharply (Chart I-9), and the fact that the Fed is determined to see inflation quickly return to target levels, it is clear that the odds of a recession over the coming 12-18 months remain elevated. Chart I-8Absent Declining Real Wages, The Current Level Of Interest Rates Would Not Be Restrictive
Absent Declining Real Wages, The Current Level Of Interest Rates Would Not Be Restrictive
Absent Declining Real Wages, The Current Level Of Interest Rates Would Not Be Restrictive
Chart I-9But Real Wages Are Declining, And The Pace Of Tightening Has Been Extraordinarily Rapid
But Real Wages Are Declining, And The Pace Of Tightening Has Been Extraordinarily Rapid
But Real Wages Are Declining, And The Pace Of Tightening Has Been Extraordinarily Rapid
Many investors do not appear to fully appreciate the fact that the Fed will continue to tighten policy until it sees clear and unequivocal signs that inflation is easing. Importantly, the minutes of the July FOMC meeting highlighted that this is likely to be true even if unambiguous signs of easing supply-side and pandemic-related inflation present themselves. During the July meeting, FOMC participants noted that “though some inflation reduction might come through improving global supply chains or drops in the prices of fuel and other commodities, some of the heavy lifting would also have to come by imposing higher borrowing costs on households and businesses”. They also emphasized that “a slowing in aggregate demand would play an important role in reducing inflation pressures”. The upshot is that the Fed was aware before the July CPI report that energy-related inflation might fall, but also understood that they would still have to tighten enough to slow aggregate demand to reduce underlying inflationary pressures. It is true that investors are pricing in additional rate hikes from the Fed, but there are two caveats for investors to consider. The first is that while the OIS curve is implying a reasonable path for the Fed funds rate for the remainder of this year, it is too low 12 months from now based on the Fed’s median rate expectation for year-end 2023 (Chart I-10). This suggests that a further upward adjustment in the OIS curve is likely warranted. Second, and more importantly, investors appear to be making the assumption that the rate hikes already built into the OIS curve will not be recessionary. Investors are making this assumption because short-term inflation expectations are pricing in a very substantial slowdown in headline inflation (Chart I-11), which would both raise the recessionary threshold for interest rates (via stronger real wages) and could potentially allow the Fed to reduce interest rates closer to its (very likely wrong) estimate of neutral. Chart I-10A Further Upward Adjustment In The OIS Curve Is Likely Warranted
A Further Upward Adjustment In The OIS Curve Is Likely Warranted
A Further Upward Adjustment In The OIS Curve Is Likely Warranted
Chart I-11Short-Term Inflation Expectations Are Pricing In A Massive Deceleration In Headline Inflation
Short-Term Inflation Expectations Are Pricing In A Massive Deceleration In Headline Inflation
Short-Term Inflation Expectations Are Pricing In A Massive Deceleration In Headline Inflation
We agree with investors that the odds of a recession will decline significantly, ceteris paribus, if headline inflation does drop below 4% over the coming year. But we noted above that it is not yet clear that this will occur. In addition, we disagree with investors that this would result in a reduction in short-term interest rates, because this belief is based on the view that monetary policy is currently in restrictive territory even without the negative impact of sharply lower real wages. Absent the negative real wage effect, our view is that monetary policy would still be stimulative at current interest rates, which is why we believe that the 2023 portion of the OIS curve is too dovish in a non-recessionary scenario. The Outlook for Stocks The equity market rally that began in early July has been based on the assumption that significant supply-side and pandemic-related disinflation is now a fait accompli. If it is, then the odds of a recession over the coming year are indeed meaningfully lower, and the risk to corporate profits is less than feared. We noted above that investors may have jumped the gun in pricing in substantial disinflation and sharply lower odds of a US recession. But even in a scenario in which the odds of recession do come in significantly, stocks still face risks from a significant rise in real bond yields. Chart I-12Long-Maturity TIPS Yields Would Likely Rise In A Non-Recessionary Scenario, Compressing Equity Multiples
Long-Maturity TIPS Yields Would Likely Rise In A Non-Recessionary Scenario, Compressing Equity Multiples
Long-Maturity TIPS Yields Would Likely Rise In A Non-Recessionary Scenario, Compressing Equity Multiples
Investors have been focused on very elevated inflation as the driver of both rising inflation expectations and rising real bond yields, and have assumed that a meaningful slowdown in inflation (as forecast by short-term measures of inflation expectations) implies that the Fed funds rate will return to the Fed’s estimate of neutral. This belief, along with a lower projected Fed funds rate in 2024 than 2023 in the FOMC’s participant forecasts, is the basis for the 2023 “pivot” currently priced into the OIS curve. Given that the Fed funds rate has already reached the Fed’s neutral rate estimate, there is a meaningful chance that this estimate will be revised upwards by the Fed or challenged by investors if economic activity improves in response to a decline in inflation and a corresponding rise in real wages. Such a scenario would highlight to investors that the Fed’s estimate of neutral is likely too low, which would imply a significant increase in real 10-year TIPS yields (which are currently 160 basis points below their pre-2008 average). Chart I-12 highlights the impact that a rise in real long-maturity bond yields could have on equities, even in a non-recessionary scenario where 12-month forward earnings per share grows 8% over the coming year. A rise in 10-year TIPS yields to 1.5% by the middle of 2023 would cause a 16% contraction in the 12-month forward P/E ratio and a 10% decline in stock prices, assuming an unchanged 12-month forward equity risk premium (ERP). It is possible that the ERP could decline in a rising bond yield scenario. Chart I-13 highlights that the ERP is indeed negatively correlated with real bond yields (in part due to the methods that we use to calculate it). The counterpoint is that there are a number of risks that equity investors should be compensated for today that did not exist in the late 1990s or early 2000s, especially the risks of populist policies in many advanced economies and major geopolitical events (as Russia’s invasion of Ukraine recently highlighted). Chart I-14 illustrates that, since 1960, a long-term version of the equity risk premium, calculated using trailing earnings and our adaptive expectations proxy to deflate long-maturity bond yields, has been fairly well explained by the Misery Index (the sum of the unemployment and headline inflation rates). However, the chart also shows that the ERP has been structurally higher over the past decade than the Misery Index would have predicted. It is unclear if this is due to a riskier environment or the negative ERP/real yield correlation that we noted. Chart I-13The Equity Risk Premium Could Come Down As Bond Yields Rise, But That Is Not Guaranteed
The Equity Risk Premium Could Come Down As Bond Yields Rise, But That Is Not Guaranteed
The Equity Risk Premium Could Come Down As Bond Yields Rise, But That Is Not Guaranteed
Chart I-14A Structurally Higher ERP Over The Past Decade Could Represent Needed Compensation For Structural Risks
A Structurally Higher ERP Over The Past Decade Could Represent Needed Compensation For Structural Risks
A Structurally Higher ERP Over The Past Decade Could Represent Needed Compensation For Structural Risks
The conclusion is that investors do not yet appear to have a basis to bet on a declining ERP in a rising bond yield environment, underscoring that even a non-recessionary scenario poses a risk to stock prices. It is worth noting that this second risk facing stocks has essentially been caused by the Fed because of its maintenance of a very low neutral rate estimate that we feel is no longer economically justified. Bond Market Prospects Chart I-15Investors Should Stay Modestly Short Duration, For Now
Investors Should Stay Modestly Short Duration, For Now
Investors Should Stay Modestly Short Duration, For Now
Over the past few months, the Bank Credit Analyst service has continued to recommend that investors maintain a modestly short duration stance even as we recommended reducing equity exposure. The recent rise in the 10-year Treasury yield back to 3% has validated that view (Chart I-15), and reinforces our view that there is significant upside risk to long-maturity bond yields in a non-recessionary scenario. Our expectation that the Fed will raise interest rates to a higher level over the next year than the OIS curve is currently discounting also argues for a modestly short stance, based on BCA’s “Golden Rule” framework. The “Golden Rule” states that investors should set their overall bond portfolio duration based on how their own 12-month fed funds rate expectations differ from the expectations that are priced into the market. As we detail in Section 2 of our report, the Fed has always cut interest rates in response to a recession in the post-WWII environment, so we would certainly recommend a long duration stance if a recession emerges. But given our view that a recession is still a risk rather than a likely event, we feel that a modestly short duration stance is currently appropriate. Chart I-16US Corporate Bond Value Has Improved, But Not Enough To Trump The Cycle
US Corporate Bond Value Has Improved, But Not Enough To Trump The Cycle
US Corporate Bond Value Has Improved, But Not Enough To Trump The Cycle
As noted above in our discussion of the risks facing stock prices in a non-recessionary scenario, falling inflation that is not associated with a recession will ironically be a bearish signal for long-maturity bonds, because it means that the Fed will have greater capacity to raise interest rates without ending the recovery. The short end of the yield curve could be flat or move modestly lower in response to a significant easing in inflation, but the long end of the curve would be at serious risk of moving higher. We are thus very likely to recommend a short duration stance in response to solid evidence of true supply-side and pandemic-related disinflation, assuming it emerges outside of the context of a recession. Within the credit space, the rise in US corporate bond spreads since the start of the year has meaningfully improved the value of investment- and speculative-grade corporate bonds (Chart I-16), but not so much that it justifies a positive stance towards these assets relative to government bonds given the risks facing the US economy. We continue to recommend an underweight stance towards investment-grade and a neutral stance towards speculative-grade within a fixed-income portfolio. The Outlook For Energy Prices Chart I-17The EU's Oil Embargo Will Cause Russian Oil Production To Tank
The EU's Oil Embargo Will Cause Russian Oil Production To Tank
The EU's Oil Embargo Will Cause Russian Oil Production To Tank
The likely path of commodity prices, particularly that of oil, is an extremely important determinant of whether the US is likely to experience a recession over the coming year. We are among those who have downplayed the significance of oil price shocks in driving contractions in economic output over the past two decades,3 but the current situation is unique given the role that very elevated inflation has played in driving real wages lower. In a recent Strategy Report from our Commodity & Energy Strategy service, my colleague Robert P. Ryan underscored the impact that the European Union’s embargo of Russian oil will likely have on the energy market. If fully implemented, ~ 2.3mm barrels/day of seaborne imports of Russian crude oil will be excluded from EU markets by year-end. EU, UK and US shipping insurance and reinsurance sanctions are also scheduled to be implemented in December, which means that “surplus” Russian oil production cannot be fully reoriented to other countries. Chart I-17 presents the likely impact on Russia’s crude oil output, namely a ~ 2mm barrels/day decline in oil output by the end of next year – nearly equal to the amount of oil set to be embargoed. Our base case view remains that supply and demand in the oil market will remain relatively balanced going into the winter, but the removal from the market of Russian oil production because of the various EU embargoes – even if it is offset by the return of 1mm b/d of Iranian exports on the back of a deal with the US – will ultimately push crude oil prices higher and inventories lower (Chart I-18). The price impact of this event could happen earlier than the immediate supply/demand balance would suggest, if investors have not fully priced in the extent of the decline in Russian oil production that our commodity team is forecasting. Our commodity team’s forecast serves as an important reminder that the economic consequences of Russia’s invasion of Ukraine may not be fully behind us. It also highlights that the recent disinflation observed in the US, which was mostly driven by lower energy prices in July, may not be sustained. Chart I-19 highlights what could happen to US gasoline prices based on the path for oil shown in Chart I-18, and how that forecast is sharply at odds with the current gasoline futures curve. Chart I-20 highlights that US gasoline stocks are currently below their 5-year average; the last time this occurred was in Q1 2021, which was an environment of rising gasoline prices to levels that were higher than what would usually be implied by crude oil prices. Chart I-18Oil Prices Are More Likely To Rise Than Fall
Oil Prices Are More Likely To Rise Than Fall
Oil Prices Are More Likely To Rise Than Fall
Chart I-19Higher Oil Prices Would Cause Gasoline Prices To Deviate Significantly From Market Expectations
Higher Oil Prices Would Cause Gasoline Prices To Deviate Significantly From Market Expectations
Higher Oil Prices Would Cause Gasoline Prices To Deviate Significantly From Market Expectations
Chart I-20Gasoline Stocks Are Low In The US, Underscoring The Upside Risk To Prices
Gasoline Stocks Are Low In The US, Underscoring The Upside Risk To Prices
Gasoline Stocks Are Low In The US, Underscoring The Upside Risk To Prices
The upshot is that our commodity team expects oil prices to move higher over the coming 6-12 months, under the assumption that the EU’s embargo against Russian oil moves forward as announced. This poses a clear threat to imminent supply-side and pandemic-related disinflation, and underscores the risks to a Goldilocks economic outcome over the coming few months. The Dollar: Value, Technical Conditions, And The Cycle Chart I-21The Dollar Is Reliably Countercyclical, But It Has Registered Outsized Gains Over The Past Year
The Dollar Is Reliably Countercyclical, But It Has Registered Outsized Gains Over The Past Year
The Dollar Is Reliably Countercyclical, But It Has Registered Outsized Gains Over The Past Year
The US dollar moved higher over the past month, after first retreating from its mid-July high for the year. We tempered our view about the likelihood of a falling dollar over the near term in last month’s report, but from a bigger picture perspective we have been surprised by the degree of dollar strength this year. The US dollar is a reliably countercyclical currency, so clearly some of the dollar’s strength has been the result of weakness in risky asset prices (Chart I-21). But the bottom panel of Chart I-21 highlights that the broad trade-weighted dollar has performed even better over the past year than returns to the S&P 500 would have implied, underscoring that the magnitude of the dollar’s strength has been atypical. The last two times that the US dollar performed substantially better than the trend in risky assets would have implied were in 2012 and 2015, years in which euro area breakup risk was a driving force in markets. Alongside the fact that EURUSD has fallen below parity and USDEUR has outperformed even more than the broad trade-weighted dollar has, “excess” dollar returns point strongly to Europe’s energy woes in the aftermath of Russia’s invasion of Ukraine as the key driver of outsized broad dollar strength. Chart I-22 highlights that European natural gas prices have exceeded the level that we had forecasted would occur in a complete cutoff scenario, meaning that Europe’s energy crunch is likely happening now, rather than in the winter. However, even considering the negative economic outlook facing the euro area, there are arguments pointing to a decline in the dollar beyond the near term – even within the context of elevated recessionary odds in the US and our recommended neutral stance towards global equities. First, Chart I-23 highlights that EURUSD has undershot what the trend in relative real interest rates would suggest, which has historically led changes in the euro. This implies that the euro has declined partly because of the introduction of a sizeable risk premium, which may dissipate after the winter. Chart I-22The Euro Has Been Heavily Impacted By Europe's Energy Crunch
The Euro Has Been Heavily Impacted By Europe's Energy Crunch
The Euro Has Been Heavily Impacted By Europe's Energy Crunch
Chart I-23EURUSD Has Undershot What The Trend In Relative Real Interest Rates Would Suggest
EURUSD Has Undershot What The Trend In Relative Real Interest Rates Would Suggest
EURUSD Has Undershot What The Trend In Relative Real Interest Rates Would Suggest
Second, Chart I-24 highlights that the US dollar is extremely overbought and is technically extended to a point that has historically been associated with reversals in the broad dollar trend. Finally, Chart I-25 highlights that the US dollar is extraordinarily expensive based on our valuation models, underscoring that an eventual decline in the dollar may be quite severe. We agree that valuation is not usually an effective market timing tool, but investors should place a greater weight on valuation measures as they are stretched further. Based either on our models or a more traditional PPP approach, the degree of US dollar overvaluation is extreme – arguing for a bearish bias on a 6-12 month timeline barring an unambiguous move towards recession in the US. Chart I-24US Dollar And Indicator The US Dollar Is Heavily Overbought
US Dollar And Indicator The US Dollar Is Heavily Overbought
US Dollar And Indicator The US Dollar Is Heavily Overbought
Chart I-25The US Dollar Is Extremely Expensive
The US Dollar Is Extremely Expensive
The US Dollar Is Extremely Expensive
Investment Conclusions Considering the economic developments over the past month and the reaction of financial markets, the takeaway for investors seems clear. Market participants have eagerly shifted towards the Goldilocks economic and financial market outcome, based on (so far) incomplete evidence of supply-side and pandemic-related disinflation that has predominantly been driven by declining energy prices. Given significant potential upside risks to oil and US gasoline prices over the coming few months, investors should wait for more durable signs of significant disinflation before downgrading the odds of a US recession over the coming year. We would certainly recommend cutting global equity exposure to underweight were we to determine that the US is likely to experience an imminent recession, but the avoidance of a recession does not necessarily suggest that an overweight stance is warranted. Sharply lower inflation would reduce the odds of a recession, but it would also raise real wages and would ultimately allow the Fed to raise interest rates to a higher level before short-circuiting the economic expansion. As such, we expect real long-maturity government bond yields to rise meaningfully in a scenario where real wages recover significantly and a recession is avoided, which will put meaningful pressure on equity multiples. Barring a decline in the equity risk premium, US stocks could face a loss on the order of 10% over the coming year in such a scenario (even under the assumption of positive earnings growth), reinforcing our view that a neutral stance towards global equities is currently appropriate. In addition to a neutral global asset allocation stance, we recommend that investors maintain a neutral regional equity position and a neutral stance towards cyclicals versus defensives, although we do recommend a modest overweight towards value stocks given our view that a modestly short duration stance is appropriate. Although we recommend a neutral stance towards USD over the next few months, we also see ample scope for a decline in the dollar beyond the near term – even within the context of elevated recessionary odds in the US and our recommended neutral stance towards global equities. We believe that there are upside risks to energy prices, which our Commodity & Energy Strategy service recommends playing via the iShares GSCI Commodity Dynamic Roll Strategy (COMT) ETF. As a final point, we remain cognizant of the fact that financial markets rarely trend sideways over 6-to-12 month periods. We continue to regard a neutral global asset allocation stance as a temporary stepping stone either to a further downgrade of risky assets to underweight, or to an increase in risky asset exposure back to a high-conviction overweight. The latter is still possible, especially if we see unequivocal signs of a substantial and broad-based slowdown in the US headline inflation rate, and if long-maturity real bond yields are well-behaved in response or if we see clear signs of a declining equity risk premium. Thus, investors should note that additional changes to our recommended cyclical allocation may occur over the coming few months, in response to incoming data, our assessment of the likely implications for monetary policy, and the response of long-maturity government bond yields. Jonathan LaBerge, CFA Vice President The Bank Credit Analyst August 25, 2022 Next Report: September 29, 2022 II. The Fed Funds Rate, Bond Yields, And The Next US Recession The risk of a US recession has increased sharply over the past several months. We have not yet concluded that a recession over the coming year is inevitable, but substantial (further) supply-side and pandemic-related disinflation is likely needed for the US economy to avoid a contraction in output. The increased risk of a contraction has caused investors to ponder what the next recession might look like. One very important question concerns the likely behavior of short-term interest rates during the next recession, especially if it occurs sooner rather than later. The historical experience suggests that the Fed may cut interest rates to zero during the next recession, but that the re-establishment of a long-lasting zero interest rate policy and the associated resumption of large-scale asset purchases seem quite unlikely unless the recession is severe. In the post-WWII environment, severe US recessions have been accompanied by aggravating factors that appear to be missing in the current environment. In addition, there are several arguments pointing to the next US recession being a mild one. For fixed-income investors, the implication is that investors should not overstay their welcome in a long-duration position during the next US recession, and should be looking to reduce their duration exposure earlier rather than later. For equity investors, our findings underscore that meaningful downside risk exists for stocks even in a mild recession environment, because the decline in bond yields is not likely to offset a rise in the equity risk premium. Over the past several months, investors have been faced with a sharp increase in the odds of a US recession. Gauging the risk of a recession has featured prominently in our recent reports, and we have concluded, for now, that a US recession over the coming year is not yet inevitable. Still, we acknowledge that the risks are quite elevated, and that substantial (further) supply-side and pandemic-related disinflation is likely needed for the US economy to avoid a contraction in output. Economic expansions do not last forever. This means that the US economy will eventually succumb to a recession at some point over the coming few years. One very important question for investors concerns the likely behavior of short-term interest rates during the next recession, especially if a contraction occurs sooner rather than later. A key aspect of this question is whether the Fed is likely to be forced back towards a zero or negative interest rate policy, and whether it will need to employ asset purchases as part of its stabilization efforts as it has during the last two recessions. If so, long-maturity bond yields are likely to fall significantly during the next recession; if not, investors may be surprised by how modestly long-maturity yields decline. In this report, we examine the historical record of short-term interest rates during recessions and discuss whether the next US recession is likely to be severe or mild. We conclude that the next US recession is more likely to be mild than severe, and that the 10-year Treasury yield is unlikely to fall below 2% during the recession (or fall below this level for very long). In the case of a more severe recession driven by unanchored inflation expectations, the implications would be clearly bearish for bonds. Within a fixed-income portfolio, one conclusion of our analysis is that investors should not overstay their welcome in a long-duration position during the next recession and should be looking to reduce their duration exposure earlier rather than later. For equity investors, our findings underscore that meaningful downside risk exists for stocks even in a mild recession environment, because the decline in bond yields is not likely to offset a rise in the equity risk premium. The Historical Recessionary Path Of Short-Term Interest Rates When projecting how the Fed funds rate is likely to evolve during the next US recession, most investors typically look to the average decline in short-term interest rates during previous recessions as a guide. Based on that approach, Table II-1 highlights that the Fed would likely have to cut rates into negative territory if a recession occurred over the coming 12-18 months, unless it is able to hike interest rates significantly more over the coming year than the market is currently expecting and the FOMC itself is projecting. But in our view, focusing on the historical recessionary decline in interest rates from their peak is not the right approach, because it ignores the fact that recessions typically occur when monetary policy is tight. If a recession occurs within the next 18 months, it will have happened in large part because of a collapse in real wage growth, not just because of the increase in interest rates that has occurred. Chart II-1 highlights that short-term interest rates remain well below potential GDP growth, highlighting that monetary policy would still be easy today – despite the quick pace of increase in short rates – if real wages were growing rather than contracting sharply. In our view, the right approach is to examine how much short-term interest rates have typically fallen during recessions relative to potential or average historical GDP growth. This method captures the degree to which monetary policy easing has typically been required relative to neutral levels to catalyze an economic recovery. Table II-1Based Only On The Historical Decline In Short-Term Interest Rates, The Fed Would Ostensibly Have To Cut Rates Into Negative Territory During The Next Recession
September 2022
September 2022
Chart II-1Monetary Policy Would Still Be Easy Today If Real Wage Growth Was Positive
Monetary Policy Would Still Be Easy Today If Real Wage Growth Was Positive
Monetary Policy Would Still Be Easy Today If Real Wage Growth Was Positive
Based on this approach, Chart II-2 highlights that the Fed might have to cut the target range for the Fed funds rate to 0-0.25% during the next recession, but there are some examples (like the 1990-1991 recession) that point to a cut to just 0.25-0.5%. The goal of this exercise is not to be specific about the exact level to which the Fed will have to cut the Fed funds rate, but rather whether the de facto re-establishment of a long-lasting zero interest rate policy and the associated resumption of large-scale asset purchases is likely. Chart II-2The Fed May Have To Cut To Zero During The Next Recession, But Probably Not Into Negative Territory
September 2022
September 2022
Structural bond bulls might note that there are five recessions in the post-war era that could potentially point to that outcome based on Chart II-2. However, these episodes involved circumstances that we doubt would be present during the next US recession, especially if one were to emerge over the coming 12-18 months. The 1950s Recessions The recessions of 1953-54 and 1957-58 were fairly sizeable based on the total rise in the unemployment rate, but the monetary policy stance at that time was wildly stimulative in a way that is very unlikely to repeat itself today. In the 1950s, the level of interest rates was still an artifact of WWII (with the Treasury-Fed accord having only been agreed upon in March 1951). Monetary policy was both overly responsive to a period of pent-up disinflation following the initial burst of government spending associated with the Korean war and insufficiently responsive to a strongly positive output gap (Chart II-3). This was meaningfully compounded by a poor understanding of the size of the output gap at that time; the deviation of the unemployment rate from its 10-year average was significantly smaller than its deviation from today’s estimate of NAIRU (Chart II-4). In sum, the economic and monetary policy conditions that existed in the 1950s and that contributed to an interest rate level that was well below the prevailing rate of economic growth do not exist today. As such, we strongly doubt that the Fed’s response to the next US recession would resemble what occurred during that decade. Chart II-3We Strongly Doubt The Fed's Response To The Next US Recession Would Resemble What Occurred In The 1950s
We Strongly Doubt The Fed's Response To The Next US Recession Would Resemble What Occurred In The 1950s
We Strongly Doubt The Fed's Response To The Next US Recession Would Resemble What Occurred In The 1950s
Chart II-4Low Interest Rates In The 1950s Were Partly Caused By Wrong Output Gap Estimates
Low Interest Rates In The 1950s Were Partly Caused By Wrong Output Gap Estimates
Low Interest Rates In The 1950s Were Partly Caused By Wrong Output Gap Estimates
1973-1975 The recession that began in 1973 occurred because of a huge energy shock that proved to be stagflationary in the true sense of the word. Excluding the 2020 recession, this was the third largest rise in the unemployment rate of any recession since WWII, following 2008/2009 and the 1981/1982 recessions. There are some parallels between this recession and the current economic environment, but the stability of inflation expectations so far does not point to a truly stagflationary outcome. As such, we do not see the 1973-74 recession as a reasonable parallel to today’s environment. In addition, manufacturing employment – which was heavily impacted by the permanent rise in oil prices due to the sector’s energy intensity – stood at 24% of total nonfarm employment in 1973, compared with 8% today. Finally, the weight of food and energy as a share of total consumer spending today is roughly half of what it was during the 1970s (Chart II-5). 2001 Of the five recessions potentially implying that the Fed may have to cut interest rates into negative territory during the next US recession, the 2001 recession is the most relevant parallel to today. It was a modern recession in which the Fed maintained very easy monetary policy for a significant amount of time, in response to concerns about a significant tightening in financial conditions and the impact of prior corporate sector excesses on aggregate demand. The total rise in the unemployment rate during this recession was not very large, but it took some time for the unemployment rate to return to NAIRU. Still, even though this justified a later liftoff, a Taylor rule approach makes it clear that the Fed overstimulated the economy in response to the recession – a view that is reinforced by the enormous rise in household debt that fueled the housing market bubble during that period (Chart II-6). The Fed was very concerned about the negative wealth effects of the bursting of the equity market bubble, which had been caused by a massive decline in the equity risk premium in the second half of the 1990s. These conditions are simply not present today. Chart II-5Today's US Economy Is Meaningfully Less Impacted By Energy And Food Prices
Today's US Economy Is Meaningfully Less Impacted By Energy And Food Prices
Today's US Economy Is Meaningfully Less Impacted By Energy And Food Prices
Chart II-6The Fed Clearly Overstimulated In Response To The 2001 Recession
The Fed Clearly Overstimulated In Response To The 2001 Recession
The Fed Clearly Overstimulated In Response To The 2001 Recession
2008/2009 Chart II-7A Repeat Of The 2008/2009 Recession In The US Is A Totally Implausible Scenario
A Repeat Of The 2008/2009 Recession In The US Is A Totally Implausible Scenario
A Repeat Of The 2008/2009 Recession In The US Is A Totally Implausible Scenario
Chart II-2 highlighted that the Fed would have to cut interest rates to -1% were the 2008/2009 recession to repeat itself, but we judge that to be a totally implausible scenario given the improvement in US household sector balance sheets and financial sector health since the global financial crisis (Chart II-7). As we discuss below, the next US recession is likely to be meaningfully less severe than the 2008/2009 and 2020 recessions, which we believe carries important significance for the path of interest rates and the response of long-maturity bond yields. The bottom line for investors is that, based on the historical experience of rate cuts during recessions, the Fed may end up cutting interest rates back to or close to the zero lower bound in response to the next recession. But the de facto re-establishment of a long-lasting zero interest rate policy and the associated resumption of large-scale asset purchases seems quite unlikely unless the recession is severe, which we do not expect. Will The Next US Recession Be Severe Or Mild? Chart II-8The Most Severe US Recessions Have Had Aggravating Factors That Do Not Appear To Be Present Today
September 2022
September 2022
How drastically the Fed will be forced to cut interest rates during the next recession will be driven by its severity. Chart II-8 presents the total rise in the unemployment rate during post-WWII recessions (excluding 2020), in order to gauge whether the factors that have led to severe recessions in the past are likely to be present during the next contraction in output. From our perspective, the most severe US recessions in the post-WWII era have been driven by factors that are very unlikely to repeat themselves in the current environment. We noted above that a repeat of the 2008/2009 recession is a totally implausible scenario, leaving the 1981-1982, 1973-1975, and 1950s recessions as potential severe recession analogues. In three of these four cases we see clear signs of an aggravating factor that we do not (yet) believe will be present during the next US recession. Chart II-9Inflation Expectations Have Not Yet Unanchored To The Upside, In Sharp Contrast To The 1970s
Inflation Expectations Have Not Yet Unanchored To The Upside, In Sharp Contrast To The 1970s
Inflation Expectations Have Not Yet Unanchored To The Upside, In Sharp Contrast To The 1970s
In the 1981-1982 recession, the unemployment rate rose significantly as the Federal Reserve confronted the fact that inflation expectations had become severely unanchored to the upside, causing a persistent wage/price spiral. While unanchored inflation expectations is a risk today, so far the evidence suggests that both households and market participants expect that currently elevated inflation will not persist over the long run (Chart II-9). If inflation expectations do become unanchored to the upside at some point over the coming 12-18 months (or beyond), we are very likely to change our view about the severity of the next recession. However, this would be a bond bearish outcome (at least initially), as it would imply sharply higher yields at both the short and long end of the yield curve in order to tame inflation and re-anchor inflation expectations. As noted above, in the 1973-74 recession, the unexpected and permanent rise in oil prices and outright energy shortages rendered a significant amount of capital and labor uneconomic, which is different than what has been occurring during the pandemic. Were the recent rise in natural gas prices to be permanent and no alternatives available, Europe’s current energy situation would be more reminiscent of the 1973-1974 recession than the pandemic-driven price pressures and supply shortages affecting the US and other developed economies. Chart II-10The US Is Currently Experiencing Fiscal Drag, But That Will Lessen Next Year
The US Is Currently Experiencing Fiscal Drag, But That Will Lessen Next Year
The US Is Currently Experiencing Fiscal Drag, But That Will Lessen Next Year
Finally, while the 1957-58 recession appears to be somewhat of an anomaly driven by a mix of factors, the 1953-54 recession was clearly exacerbated by a sharp slowdown in government spending following the end of the Korean war. It is true that the US is currently experiencing fiscal drag (Chart II-10), but this has occurred against the backdrop of a strong labor market, and IMF forecasts imply that the drag will be significantly smaller over the coming year than what the US is currently experiencing. There are several additional points suggesting that the next US recession will be comparatively mild: Chart II-11The Milder US Recessions Were All Seemingly Triggered By Tight Monetary Policy (As Would Be The Case Today)
The Milder US Recessions Were All Seemingly Triggered By Tight Monetary Policy (As Would Be The Case Today)
The Milder US Recessions Were All Seemingly Triggered By Tight Monetary Policy (As Would Be The Case Today)
Chart II-11 highlights that the milder recessions, those which have seen the unemployment rate rise by less than 3% from their previous low, have generally been the recessions that appear to have simply been triggered by monetary policy becoming tight or nearly tight. This would likely be the case during the next US recession. In the lead up to the 1970, 1990-91, and 2001 recessions, short-term interest rates approached or exceeded either potential growth or the rolling 10-year average growth rate of nominal GDP. The 1960-61 recession stands out slightly as an exception to this rule, in that interest rates were still moderately easy, which is based on our definition of the equilibrium short-term interest rate. But interest rates had risen close to 400 basis points from 1958 to 1960 (suggesting a change in addition to a level effect of interest rates on aggregate demand), and it is notable that the 60-61 recession was the mildest in post-war history, based on the total rise in the unemployment rate. Chart II-12Labor Scarcity May Mean That Firms Will Be Somewhat More Reluctant To Shed Labor During The Next Recession
Labor Scarcity May Mean That Firms Will Be Somewhat More Reluctant To Shed Labor During The Next Recession
Labor Scarcity May Mean That Firms Will Be Somewhat More Reluctant To Shed Labor During The Next Recession
We argued in Section 1 of our report that monetary policy is not currently restrictive on its own, and that the recessionary risk currently facing the US is the result of a combination of the speed of adjustment in interest rates, the fact that real wages have fallen sharply, and the fact that the Fed is determined to see inflation quickly return to target levels. However, what this also highlights is that a recession would likely cause a rise in real wages via a significant slowdown in inflation (at least for a time); this would likely help stabilize aggregate demand and cause a comparatively mild rise in the unemployment rate. While the odds and magnitude of this effect are difficult to quantify, the fact that the labor market has been so tight over the past year and that the participation rate has yet to recover to its pre-pandemic levels suggests that some firms may be reluctant to shed labor during a recession (Chart II-12), suggesting that the total rise in unemployment in the next recession could be relatively small. Finally, Chart II-13 shows that the excess savings that have accumulated over the course of the pandemic, now primarily the result of reduced spending on services, dwarf the magnitude of precautionary savings that were generated in the prior three recessions as a % of GDP. We agree that the savings rate would likely still rise during the next recession, but the existence of excess savings implies that the rise in the savings rate may be surprisingly small – which would, in turn, imply a comparatively mild rise in the unemployment rate. We noted above that the household sector has deleveraged significantly, which is strong evidence against an outsized or long-lasting decline in consumer spending as a possible driver of an above-average rise in the unemployment rate during the next recession. One question that we often receive from clients is whether excessive corporate sector leverage could cause a more severe decline in economic activity once a recession emerges. Chart II-14 illustrates that the answer is “probably not.” The chart presents one estimate of the US nonfinancial corporate sector debt service ratio, based on national accounts data. The chart highlights that the current debt burden for the nonfinancial corporate sector is very low, underscoring that elevated corporate sector debt would not likely act as an aggravating factor driving an outsized rise in the unemployment rate were a recession to occur today. The chart also shows that even if the 10-year Treasury yield were to rise to 4% and corporate bond spreads were to widen in the lead up to a recession, the nonfinancial corporate sector debt service burden would rise to a lower peak than seen in the last three recessions. One key risk to a mild recession view is a scenario in which inflation does not return to or below the Fed’s target during the recession. In that kind of environment, the Fed would not likely cut interest rates to as low a level as they have in the past relative to potential growth. But the historical record is clear that recessions cause a deceleration in inflation, and if a recession emerges over the coming 12-18 months it will likely happen after supply-side and pandemic-related disinflation has already occurred. That means that inflation is likely to move back to or below the Fed’s target in a recessionary environment. We should note that this assessment differs somewhat from the scenario described by my former colleague Martin Barnes, who wrote a guest report on inflation published in our July Bank Credit Analyst.4 Chart II-13Today’s Pandemic-Related Excess Savings Dwarf Precautionary Savings During The Prior Three Recessions
September 2022
September 2022
Chart II-14US Corporate Sector Debt Unlikely To Lead To A More Severe Recession, Even In A Higher Yield Environment
US Corporate Sector Debt Unlikely To Lead To A More Severe Recession, Even In A Higher Yield Environment
US Corporate Sector Debt Unlikely To Lead To A More Severe Recession, Even In A Higher Yield Environment
Long-Maturity Bond Yields And The Next US Recession What does our analysis imply for long-maturity bond yields and the duration call over the coming few years? In order to judge what is likely to happen to long-maturity bond yields in a recession scenario over the coming 12-18 months, we first project the fair value of the 5-year Treasury yield based on the following hypothetical circumstances: The onset of recession in March 2023 and a peak in the Fed funds rate at a target range of 3.75-4%. A recession duration of eight months, over which time the Fed steadily cuts the policy rate to 0-0.25%. An initial Fed rate hike in September 2024, nine months following the end of the recession, consistent with a relatively short return of the unemployment rate to NAIRU as an expansion takes hold. A rate hike pace of eight quarter-point hikes per year, with the Fed again raising rates to a peak of 4% A longer-term average Fed funds rate of 3%, which we regard as a low estimate. Chart II-15The 5-Year Treasury Yield Would Not Fall Enormously In A Mild Recessionary Scenario
The 5-Year Treasury Yield Would Not Fall Enormously In A Mild Recessionary Scenario
The 5-Year Treasury Yield Would Not Fall Enormously In A Mild Recessionary Scenario
Chart II-15 highlights the fair value path for the 5-year Treasury yield in this scenario. Not surprisingly, the fair value today is lower than the current level of the 5-year yield, highlighting that a shift to a long duration stance will be warranted at some point over the coming year if the US economy enters a non-technical, typical income-statement recession. However, the chart also highlights that a long duration position is not likely to be warranted for very long, given that the lowest level of the 5-year fair value path is substantially higher than it was in 2020 and 2021 and is also higher than its 10-year average. Chart II-16 reveals the importance of forecasting the near-term path of interest rates when predicting the likely behavior of long-maturity bond yields. Even though near- and long-term interest rate expectations should be at least somewhat differentiated, the chart highlights that the real 5-year/5-year forward Treasury yield is very closely explained by the real 5-year Treasury yield and a 3-year lag of our adaptive inflation expectations model (which is highly consistent with BCA’s Golden Rule of bond investing framework). Chart II-16 shows that long-maturity bond yields should be higher than they are based on the current level of real 5-year yields and lagged inflation expectations, underscoring the point that we made in Section 1 of our report that significant upside risk exists for long-maturity bond yields in a non-recessionary outcome over the coming year. In a recessionary outcome, it is clear that bond yields will fall as the Fed cuts interest rates, as Chart II-15 demonstrated. But, Chart II-17 highlights that during recessions, there is little precedent for a negative 5-10 yield curve slope outside of the context of the persistently high inflation environment of the late 1960s and 1970s. Applying that template to the fair value path that we showed in Chart II-15 suggests that the 10-year Treasury yield will not fall below 2% during the next recession. As we noted in our August report,5 a 10-year Treasury yield decline to 2% would result in significant performance for long-maturity bonds, but it would not end the structural bear market in bonds that began two years ago – a fact that we suspect would be very surprising to bond-bullish investors. Chart II-165-Year Bond Yields Strongly Explain Yields 5-Years/5-Years Forward
5-Year Bond Yields Strongly Explain Yields 5-Years/5-Years Forward
5-Year Bond Yields Strongly Explain Yields 5-Years/5-Years Forward
Chart II-17There Is Not Much Precedent For A Negative 5/10 Yield Curve During Modern Recessions, Suggesting 10-Year Yields Will Not Fall Below 2% During The Next Recession
There Is Not Much Precedent For A Negative 5/10 Yield Curve During Modern Recessions, Suggesting 10-Year Yields Will Not Fall Below 2% During The Next Recession
There Is Not Much Precedent For A Negative 5/10 Yield Curve During Modern Recessions, Suggesting 10-Year Yields Will Not Fall Below 2% During The Next Recession
It is true that bond yields may deviate from the fair value levels shown in Chart II-15 if investors expect a different outcome for the path of the Fed funds rate than we described. However, it is worth noting that changes in our assumed post-recession peak Fed funds rate and the long-term average do not substantially change the outcome shown in Chart II-15. If investors instead assume that the Fed funds rate will peak at 3% during the next expansion, that lowers the fair value path for the 5-year yield by approximately 5 basis points. Changing the long-term average Fed funds rate to 2.4%, the Fed’s current neutral rate expectation, would reduce it by about 25 basis points. These levels would still be significantly above the lows reached in 2011-2013 and in 2020, underscoring that the length of the recession and the speed at which the Fed begins to raise interest rates will be far more important determinants of the path of US Treasury yields. We strongly suspect that investors will recognize that a comparatively mild recession will not result in the same hyper-accomodative monetary policy stance that occurred during the past two recessions, implying that long-maturity bond yields will have less downside during the next recession than may be currently recognized. Investment Conclusions As we have presented, the historical experience suggests that the Fed may cut interest rates to zero during the next recession, but that the re-establishment of a long-lasting zero interest rate policy and the associated resumption of large-scale asset purchases seem quite unlikely unless the recession is severe. In the post-WWII environment, severe US recessions have been accompanied by aggravating factors that appear to be missing in the current environment. In addition to this, there are several arguments pointing to the next US recession being a mild one. In a mild recession scenario, we doubt that the 10-year Treasury yield would fall below 2%, or fall below this level for very long. For fixed-income investors, while bond yields will fall for a time if a recession emerges, the implication is that investors should not overstay their welcome in a long-duration position during the recession and should be looking to reduce their duration exposure earlier rather than later. For equity investors, our findings underscore that meaningful downside risk exists for stocks even in a mild recession environment, because the decline in bond yields is not likely to offset a rise in the equity risk premium. We noted in our July report that if a recession occurred within the coming 6-12 months, that the S&P 500 would likely fall to 3100, even if the recession were average. A mild recession may see the S&P 500 decline less severely than this, but stocks are still likely to incur significant losses during the next recession unless investors price in a much shallower path for short-term interest rates than we believe will be warranted. As noted in Section 1 of our report, we have not yet concluded that a US recession is inevitable over the coming 6-12 months. Still, we acknowledge that the risks are quite elevated, and that substantial (further) supply-side and pandemic-related disinflation is likely needed for the US economy to avoid a contraction in output. Additional changes to our recommended cyclical allocation may thus occur over the coming few months, in response to incoming data, our assessment of the likely implications for monetary policy, and the response of long-maturity government bond yields. Jonathan LaBerge, CFA Vice President The Bank Credit Analyst III. Indicators And Reference Charts In contrast to the recent rally in equities, BCA’s equity indicators continue to paint a bearish outlook for stock prices. Our Monetary, Technical, and Speculative indicators have stopped falling, but they remain very weak. Meanwhile, the recent rally has pushed our valuation indicator back towards a level indicating stocks are considerably overvalued. While it is still a risk and not yet a likely event, the odds of a US recession over the next 12 months remain elevated. We maintain a neutral stance for stocks versus bonds over the coming year. Forward earnings are no longer being revised up, but bottom-up analysts’ expectations for earnings are likely still too optimistic. Although earnings growth will be positive over the coming year if a US recession is avoided, it will be in the mid-to-low single-digits given ongoing pressure on profit margins. Within a global equity portfolio, we maintain a neutral stance on cyclicals versus defensives, small caps versus large, and a neutral stance on regional equity allocation. We recommend a modest overweight towards value versus growth stocks, given our recommendation of a modestly short duration stance within a global fixed-income portfolio. Commodity prices have stopped falling, and our composite technical indicator now highlights that commodities are oversold. Our base-case view is that oil prices are likely to rise over the coming 12-months, barring a US recession. Global food prices have come down in the wake of deal between Russia and Ukraine to allow the latter to resume its agricultural exports. But the recent surge in European natural gas prices suggests that global food inflation may remain elevated, given that natural gas is used in the production of fertilizer. Ongoing weakness in the Chinese property market argues for a neutral stance towards industrial metals, until compelling signs of a more aggressive policy response emerge. US and global LEIs have now fallen into negative territory, underscoring that the risk of a global recession is elevated. Some indicators are easing back towards positive territory, such as our global LEI Diffusion Index and our US Financial Conditions Index, but it is not yet clear if they are heralding a reacceleration in economic activity or merely a less intense pace of decline. Jonathan LaBerge, CFA Vice President The Bank Credit Analyst Gabriel Di Lullo Research Associate EQUITIES: Chart III-1US Equity Indicators
US Equity Indicators
US Equity Indicators
Chart III-2Willingness To Pay For Risk
Willingness To Pay For Risk
Willingness To Pay For Risk
Chart III-3US Equity Sentiment Indicators
US Equity Sentiment Indicators
US Equity Sentiment Indicators
Chart III-4US Stock Market Breadth
US Stock Market Breadth
US Stock Market Breadth
Chart III-5US Stock Market Valuation
US Stock Market Valuation
US Stock Market Valuation
Chart III-6US Earnings
US Earnings
US Earnings
Chart III-7Global Stock Market And Earnings: Relative Performance
Global Stock Market And Earnings: Relative Performance
Global Stock Market And Earnings: Relative Performance
Chart III-8Global Stock Market And Earnings: Relative Performance
Global Stock Market And Earnings: Relative Performance
Global Stock Market And Earnings: Relative Performance
FIXED INCOME: Chart III-9US Treasurys And Valuations
US Treasurys And Valuations
US Treasurys And Valuations
Chart III-10Yield Curve Slopes
Yield Curve Slopes
Yield Curve Slopes
Chart III-11Selected US Bond Yields
Selected US Bond Yields
Selected US Bond Yields
Chart III-1210-Year Treasury Yield Components
10-Year Treasury Yield Components
10-Year Treasury Yield Components
Chart III-13US Corporate Bonds And Health Monitor
US Corporate Bonds And Health Monitor
US Corporate Bonds And Health Monitor
Chart III-14Global Bonds: Developed Markets
Global Bonds: Developed Markets
Global Bonds: Developed Markets
Chart III-15Global Bonds: Emerging Markets
Global Bonds: Emerging Markets
Global Bonds: Emerging Markets
CURRENCIES: Chart III-16US Dollar And PPP
US Dollar And PPP
US Dollar And PPP
Chart III-17US Dollar And Indicator
US Dollar And Indicator
US Dollar And Indicator
Chart III-18US Dollar Fundamentals
US Dollar Fundamentals
US Dollar Fundamentals
Chart III-19Japanese Yen Technicals
Japanese Yen Technicals
Japanese Yen Technicals
Chart III-20Euro Technicals
Euro Technicals
Euro Technicals
Chart III-21Euro/Yen Technicals
Euro/Yen Technicals
Euro/Yen Technicals
Chart III-22Euro/Pound Technicals
Euro/Pound Technicals
Euro/Pound Technicals
COMMODITIES: Chart III-23Broad Commodity Indicators
Broad Commodity Indicators
Broad Commodity Indicators
Chart III-24Commodity Prices
Commodity Prices
Commodity Prices
Chart III-25Commodity Prices
Commodity Prices
Commodity Prices
Chart III-26Commodity Sentiment
Commodity Sentiment
Commodity Sentiment
Chart III-27Speculative Positioning
Speculative Positioning
Speculative Positioning
ECONOMY: Chart III-28US And Global Macro Backdrop
US And Global Macro Backdrop
US And Global Macro Backdrop
Chart III-29US Macro Snapshot
US Macro Snapshot
US Macro Snapshot
Chart III-30US Growth Outlook
US Growth Outlook
US Growth Outlook
Chart III-31US Cyclical Spending
US Cyclical Spending
US Cyclical Spending
Chart III-32US Labor Market
US Labor Market
US Labor Market
Chart III-33US Consumption
US Consumption
US Consumption
Chart III-34US Housing
US Housing
US Housing
Chart III-35US Debt And Deleveraging
US Debt And Deleveraging
US Debt And Deleveraging
Chart III-36US Financial Conditions
US Financial Conditions
US Financial Conditions
Chart III-37Global Economic Snapshot: Europe
Global Economic Snapshot: Europe
Global Economic Snapshot: Europe
Chart III-38Global Economic Snapshot: China
Global Economic Snapshot: China
Global Economic Snapshot: China
Footnotes 1 Please see The Bank Credit Analyst "Is The US Housing Market Signaling An Imminent Recession?" dated May 26, 2022, available at bca.bcaresearch.com 2 Please see US Bond Strategy "The Great Soft Landing Debate," dated August 2, 2022, available at usbs.bcaresearch.com 3 Please see The Bank Credit Analyst "April 2022," dated March 31, 2022, available at bca.bcaresearch.com 4 Please see The Bank Credit Analyst "Inflation Whipsaw Ahead," dated June 30, 2022, available at bca.bcaresearch.com 5 Please see The Bank Credit Analyst "August 2022," dated July 28, 2022, available at bca.bcaresearch.com
Executive Summary US Companies Will Attempt To Raise Selling Prices To Protect Their Profit Margins
US Companies Will Attempt To Raise Selling Prices To Protect Their Profit Margins
US Companies Will Attempt To Raise Selling Prices To Protect Their Profit Margins
China needs lower interest rates and a weaker currency to battle deflationary pressures. In the US, the main problem is elevated inflation. This heralds higher interest rates and a stronger currency. Hence, the Chinese yuan will depreciate against the greenback. When the RMB weakens versus the US dollar, commodity prices usually fall, and EM currencies and asset prices struggle. Faced with surging unit labor costs, US companies will continue to raise their prices to protect their profit margins and profitability. This will lead to one of the following two possible scenarios in the months ahead. Scenario 1: If customers are willing to pay considerably higher prices, nominal sales will remain robust, profits will not collapse, and a recession is unlikely. However, this also implies that the Fed will have to tighten policy by more than what is currently priced in by markets. Scenario 2: If customers push back against higher prices and curtail their purchases, then the economy will enter a recession. In this scenario, inflation will plummet, corporate margins will shrink, and their profits will plunge. In both scenarios, the outlook for stocks is poor. However, one key difference is that scenario 1 is bearish for US Treasurys while scenario 2 is bond bullish. Bottom Line: On the one hand, the US has a genuine inflation problem. The upshot is that the Fed cannot pivot too early. The Fed’s hawkish rhetoric will support the US dollar. A strong greenback is bad for EM financial markets. On the other hand, the Chinese economy and global trade are experiencing deflation/recession dynamics. Cyclical assets underperform and the US dollar generally appreciates in this environment. This is also a toxic backdrop for EM financial markets. Financial markets have been caught in contradictions. The reason is that investors cannot decide if the global economy is heading into a recession with deflationary forces prevailing, or whether a goldilocks economy or a period of inflation or stagflation will emerge in the foreseeable future. There are also plenty of contradictory data to support all the above scenarios. As such, financial markets are volatile, swinging wildly as market participants absorb new economic data points. The S&P 500 index has rebounded from its 3-year moving average, which had previously served as a major support (Chart 1). Yet, the rebound has faltered at its 200-day moving average. Its failure to break decisively above this 200-day moving average entails that a new cyclical rally is not yet in the cards. Chart 1The S&P 500 Is Stuck Between Technical Resistance And Support Lines
The S&P 500 Is Stuck Between Technical Resistance And Support Lines
The S&P 500 Is Stuck Between Technical Resistance And Support Lines
The S&P 500 index will remain between these resistance and support lines until investors make up their minds about the economic outlook. The EM equity index has been unable to rebound strongly alongside US stocks. A major technical support that held up in the 1998, 2001, 2002, 2008, 2015 and 2020 bear markets is about 15% below the current level (Chart 2). Hence, we recommend that investors remain on the sidelines of EM stocks. Chart 2EM Share Prices Are Still 15% Above Their Long-Term Technical Support Level
EM Share Prices Are Still 15% Above Their Long-Term Technical Support Level
EM Share Prices Are Still 15% Above Their Long-Term Technical Support Level
BCA’s Emerging Markets Strategy team’s macro themes and views remain as follows: Related Report Emerging Markets StrategyCharts That Matter In China, the main economic risk is deflation and the continuation of underwhelming economic growth. Core and service consumer price inflation are both below 1% and property prices are deflating. Falling prices amid high debt levels is a recipe for debt deflation. We discussed the government’s stimulus – including measures enacted for the property market – in the August 11 report. The latest announcement about the RMB 1 trillion stimulus does not change our analysis. In fact, we expected an additional RMB 1.5 trillion in local government bond issuance for the remainder of the current year. Yet, the government authorized only an additional RMB 0.5 trillion. This is substantially below what had been expected by analysts and commentators in recent months. In Chinese and China-related financial markets, a recession/deflation framework remains appropriate. Onshore interest rates will drop further, the yuan will depreciate more, and Chinese stocks and China related plays will continue experiencing growth/profit headwinds. Meanwhile, the US economy has been experiencing stagflation this year. Chart 3 shows that even though the nominal value of final sales has expanded by 8-10%, sales and output have stagnated in real terms (close to zero growth). Hence, nominal sales and corporate profits have so far held up because companies have been able to raise prices by 8-9.5% (Chart 4). Is this bullish for the stock market? Not really. Chart 3US Stagflation: Strong Nominal Growth, But Small In Real Terms
US Stagflation: Strong Nominal Growth, But Small In Real Terms
US Stagflation: Strong Nominal Growth, But Small In Real Terms
Chart 4US Corporate Profits Have Held Up Because Of Pricing Power/Inflation
US Corporate Profits Have Held Up Because Of Pricing Power/Inflation
US Corporate Profits Have Held Up Because Of Pricing Power/Inflation
The fact that companies have been able to raise their selling prices at this rapid pace implies that the Fed cannot stop hiking rates. Besides, US wages and unit labor costs are surging (Chart 9 below). The implication is that inflation will be entrenched and core inflation will not drop quickly and significantly enough to allow the Fed to pivot anytime soon. Overall, US economic data releases have been consistent with our view that although real growth is slowing, the US economy is experiencing elevated inflations, i.e., a stagflationary environment. Critically, wages and inflation lag the business cycle and are also very slow moving variables. Hence, US core inflation will not drop below 4% quickly enough to provide relief for the Fed and markets. Is a US recession imminent? It depends. One thing we are certain of is that faced with surging unit labor costs, US companies will attempt to raise their prices to protect their profit margins and profitability. Our proxy for US corporate profit margins signals that they are already rolling over (Chart 5). Hence, business owners and CEOs will attempt to raise selling prices further. Chart 5US Companies Will Attempt To Raise Selling Prices To Protect Their Profit Margins
US Companies Will Attempt To Raise Selling Prices To Protect Their Profit Margins
US Companies Will Attempt To Raise Selling Prices To Protect Their Profit Margins
This will lead to one of two possible scenarios for the US economy in the months ahead. Scenario 1: If customers (households and businesses) are willing to pay considerably higher prices, nominal sales will remain very robust, and profits will not collapse, reducing the likelihood of a recession. Yet, this means that inflation will become even more entrenched, and employees will continue to demand higher wages. A wage-price spiral will persist. The Fed will have to raise rates much more than what is currently priced in financial markets. This is negative for US share prices. Scenario 2: If customers push back against higher prices and curtail their purchases, output volume will relapse, i.e., the economy will enter a recession. In this scenario, inflation will plummet, corporate margins will shrink (prices received will rise much less than unit labor costs) and profits will plunge. Suffering a profit squeeze, companies will lay off employees, wage growth will decelerate, and high inflation will be extinguished. In this scenario, bond yields will drop significantly but plunging corporate profits will weigh on share prices. We are not certain which of these two scenarios will prevail: it is hard to determine the point at which US consumers will push back against rising prices. Nevertheless, it is notable that in both scenarios, the outlook for stocks is poor. Finally, as we have repeatedly written, global trade is about to contract. Charts 10-18 below elaborate on this theme. This is disinflationary/recessionary. Investment Conclusions On the one hand, the Chinese economy and global trade are experiencing deflation/recession dynamics. Cyclical assets struggle and the US dollar does well in this environment. This constitutes a toxic backdrop for EM financial markets. On the other hand, the US has a genuine inflation problem. The upshot is that the Fed cannot pivot too early. The Fed’s hawkish rhetoric will support the US dollar. A strong greenback is also bad for EM financial markets. Thus, we do not see any reason to alter our negative view on EM equities, credit and currencies. Investors should continue underweighting EM in global equity and credit portfolios. Local currency bonds offer value, but further currency depreciation and more rate hikes remain a risk to domestic bonds. We continue to short the following currencies versus the USD: ZAR, COP, PEN, PLN and IDR. In addition, we recommend shorting HUF vs. CZK, KRW vs. JPY, and BRL vs. MXN. Arthur Budaghyan Chief Emerging Markets Strategist arthurb@bcaresearch.com Messages From Various US High-Beta / Cyclical Stock Prices US high-beta consumer discretionary, industrials, tech and early cyclical stocks have not yet broken out. The rebounds in high-beta tech and industrials have been rather muted. We are watching these and many other market signs and technical indicators to gauge if the recent rebounds can turn into a cyclical bull market. Chart 6
Messages From Various US High-Beta / Cyclical Stock Prices
Messages From Various US High-Beta / Cyclical Stock Prices
Chart 7
Messages From Various US High-Beta / Cyclical Stock Prices
Messages From Various US High-Beta / Cyclical Stock Prices
Falling Global Trade + Sticky US Inflation = US Dollar Overshot On the one hand, US household spending on goods ex-autos is already contracting and will drop further. The same is true for EU demand. The reasons are excessive consumption of goods over the past two years and shrinking household real disposable income. As a result, global trade is set to shrink, which is positive for the US dollar. On the other hand, surging US unit labor costs entail that core CPI will be very sticky at levels well above the Fed’s target. Hence, the Fed will likely maintain its hawkish bias for now, which is also bullish for the greenback. In short, the US dollar will continue overshooting. Chart 8
Falling Global Trade + Sticky US Inflation = US Dollar Overshot
Falling Global Trade + Sticky US Inflation = US Dollar Overshot
Chart 9
Falling Global Trade + Sticky US Inflation = US Dollar Overshot
Falling Global Trade + Sticky US Inflation = US Dollar Overshot
Chinese Exports Will Contract, And Imports Will Fail To Recover Chinese export volume growth has come to a halt. Shrinking imports of inputs used for re-export (imports for processing trade) are pointing to an imminent contraction in the mainland’s exports. Further, Chinese import volumes have been contracting for the past 12 months. The value of imports has not plunged only because of high commodity prices. As commodity prices drop, import values will converge to the downside with import volumes. This is negative for economies/industries selling to China. Chart 10
Chinese Exports Will Contract, And Imports Will Fail to Recover
Chinese Exports Will Contract, And Imports Will Fail to Recover
Chart 11
Chinese Exports Will Contract, And Imports Will Fail to Recover
Chinese Exports Will Contract, And Imports Will Fail to Recover
Global Manufacturing / Trade Downtrend Is Intact China buys a lot of inputs from Taiwan that are used in its exports. That is why the mainland’s imports from Taiwan lead the global trade cycle. This is presently heralding a considerable deterioration in global trade. In addition, falling freight rates and depreciating Emerging Asian (ex-China) currencies are all currently pointing to a further underperformance of global cyclicals versus defensive sectors. Chart 12
Global Manufacturing / Trade Downtrend Is Intact
Global Manufacturing / Trade Downtrend Is Intact
Chart 13
Global Manufacturing / Trade Downtrend Is Intact
Global Manufacturing / Trade Downtrend Is Intact
Chart 14
Global Manufacturing / Trade Downtrend Is Intact
Global Manufacturing / Trade Downtrend Is Intact
Taiwan Is A Canary In A Coal Mine Taiwanese manufacturing companies have seen their export orders plunge and their customer inventories surge. This has occurred in its overall manufacturing and semiconductor companies. This corroborates our thesis that global export volumes will contract in the coming months. Chart 15
Taiwan Is A Canary In A Coal Mine
Taiwan Is A Canary In A Coal Mine
Chart 16
Taiwan Is A Canary In A Coal Mine
Taiwan Is A Canary In A Coal Mine
Korean Exporters Are Struggling Korean export companies are experience the same dynamics as their Taiwanese peers. Semiconductor prices and sales are falling hard in Korea. Export volume growth has come to a halt and will soon shrink. Chart 17
Korean Exporters Are Struggling
Korean Exporters Are Struggling
Chart 18
Korean Exporters Are Struggling
Korean Exporters Are Struggling
EM Equities: Cheap And Unloved? The EM cyclically adjusted P/E (CAPE) ratio has fallen to one standard deviation below its mean. Based on this measure, EM stocks are currently as cheap as they were at their bottoms in 2020, 2015 and 2008. EM share prices in USD deflated by US CPI are now at two standard deviations below their long-term time-trend. This is as bad as it got when EM stocks bottomed in the previous bear markets. The reason for EM stocks poor performance and such “cheapness” is corporate profits. EM EPS in USD has been flat, i.e., posting zero growth in the past 15 years. Besides, EM narrow money (M1) growth points to further EM EPS contraction in the months ahead. Chart 19
EM Equities: Cheap And Unloved?
EM Equities: Cheap And Unloved?
Chart 20
EM Equities: Cheap And Unloved?
EM Equities: Cheap And Unloved?
Chart 21
EM Equities: Cheap And Unloved?
EM Equities: Cheap And Unloved?
Chart 22
EM Equities: Cheap And Unloved?
EM Equities: Cheap And Unloved?
Commodity Prices Remain At Risk China needs lower interest rates and a weaker currency to battle deflationary pressures. In the US, the problem is inflation, which heralds higher interest rates and a stronger currency to fight rising prices. Hence, the yuan will depreciate versus the greenback. When the RMB depreciates versus the US dollar, commodity prices usually fall. Further, commodity currencies (an average of AUD, NZD and CAD) continue drafting lower. This indicator correlates with commodity prices and also presages further relapse in resource prices. Chart 23
Commodity Prices Remain At Risk
Commodity Prices Remain At Risk
Chart 24
Commodity Prices Remain At Risk
Commodity Prices Remain At Risk
Oil Prices: A Major Top In Place, But Geopolitics Will Drive Near-Term Fluctuations Chinese crude oil imports have been contracting for almost a year. Global (including US) demand for gasoline has relapsed. Meantime, Russia’s oil and oil product exports have fallen only by a mere 5% from their January level. This explains why oil prices have recently fallen. Oil lags business cycles: its consumption will shrink as global growth downshifts. However, geopolitics remain a wild card. Hence, we are uncertain about the near-term outlook for oil prices. That said, oil has made a major top and any rebound will fail to last much longer or push prices above recent highs. Chart 25
Oil Prices: A Major Top In Place, But Geopolitics Will Drive Near-Term Fluctuations
Oil Prices: A Major Top In Place, But Geopolitics Will Drive Near-Term Fluctuations
Chart 26
Oil Prices: A Major Top In Place, But Geopolitics Will Drive Near-Term Fluctuations
Oil Prices: A Major Top In Place, But Geopolitics Will Drive Near-Term Fluctuations
Chart 27
Oil Prices: A Major Top In Place, But Geopolitics Will Drive Near-Term Fluctuations
Oil Prices: A Major Top In Place, But Geopolitics Will Drive Near-Term Fluctuations
Chart 28
Oil Prices: A Major Top In Place, But Geopolitics Will Drive Near-Term Fluctuations
Oil Prices: A Major Top In Place, But Geopolitics Will Drive Near-Term Fluctuations
What Is Next For The Chinese RMB? The Chinese yuan will continue depreciating versus the US dollar. China needs lower interest rates and a weaker currency to battle deflationary pressures. While currency is moderately cheap, exchange rates tend to overshoot/undershoot and can remain cheap/expensive for a while. The CNY/USD has technically broken down. Interestingly, the periods of RMB depreciation coincide with deteriorating global US dollar liquidity and, in turn, poor performance by EM assets and commodities. Chart 29
What Is Next For The Chinese RMB?
What Is Next For The Chinese RMB?
Chart 30
What Is Next For The Chinese RMB?
What Is Next For The Chinese RMB?
Chart 31
What Is Next For The Chinese RMB?
What Is Next For The Chinese RMB?
Stay Put On Chinese Equities Odds are rising that Chinese platform companies will likely be delisted from the US as we have argued for some time. Hence, international investors will continue dampening US-listed Chinese stocks. The outlook for China’s economic recovery and profits is downbeat. This will weigh on non-TMT stocks and A shares. Within the Chinese equity universe, we continue to recommend the long A-shares / short Investable stocks strategy, a position we initiated on March 4, 2021. Chart 32
Stay Put On Chinese Equities
Stay Put On Chinese Equities
Chart 33
Stay Put On Chinese Equities
Stay Put On Chinese Equities
Chart 34
Stay Put On Chinese Equities
Stay Put On Chinese Equities
Chart 35
Stay Put On Chinese Equities
Stay Put On Chinese Equities
Messages For Stocks From Corporate Bonds Historically, rising US and EM corporate bond yields led to a selloff in US and EM share prices, respectively. Corporate bond yields are the cost of capital that matters for equities. Unless US and EM corporate bond yields start falling on a sustainable basis, their share prices will struggle. Corporate bond yields could increase because of either rising US Treasury yields or widening credit spreads. Chart 36
Messages For Stocks From Corporate Bonds
Messages For Stocks From Corporate Bonds
Chart 37
Messages For Stocks From Corporate Bonds
Messages For Stocks From Corporate Bonds
EM Currencies And Fixed-Income: An Unfinished Adjustment The profiles of EM FX and credit spreads suggest that their adjustment might not be complete. We expect further EM currency depreciation and renewed EM credit spread widening. EM domestic bond yields have risen significantly and offer value. However, if and as US TIPS yields rise and/or EM currencies continue to depreciate, local bond yields are unlikely to fall. To recommend buying EM local bonds aggressively, we need to change our view on the US dollar. Chart 38
EM Currencies And Fixed-Income: An Unfinished Adjustment
EM Currencies And Fixed-Income: An Unfinished Adjustment
Chart 39
EM Currencies And Fixed-Income: An Unfinished Adjustment
EM Currencies And Fixed-Income: An Unfinished Adjustment
Chart 40
EM Currencies And Fixed-Income: An Unfinished Adjustment
EM Currencies And Fixed-Income: An Unfinished Adjustment
Chart 41
EM Currencies And Fixed-Income: An Unfinished Adjustment
EM Currencies And Fixed-Income: An Unfinished Adjustment
Footnotes Strategic Themes (18 Months And Beyond) Equities Cyclical Recommendations (6-18 Months) Cyclical Recommendations (6-18 Months)
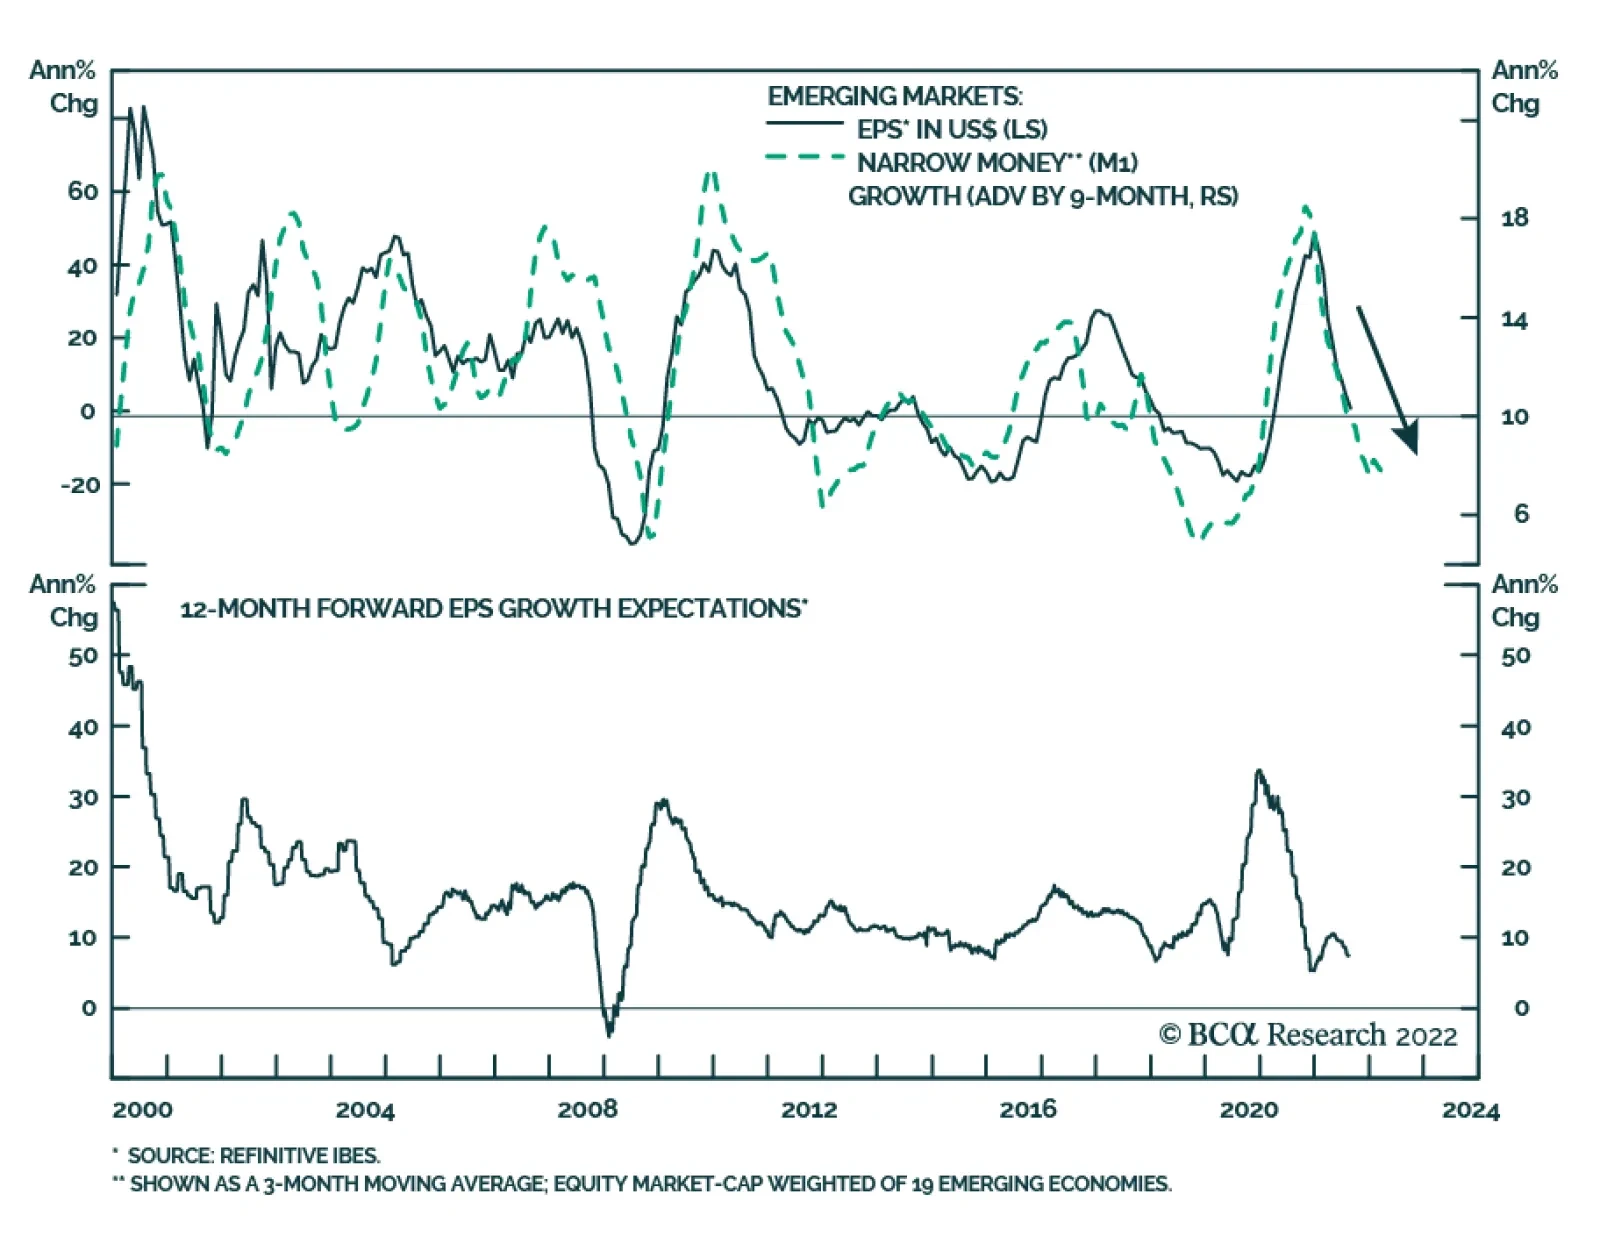
Earlier this week we highlighted that Taiwanese export orders for July and South Korean exports in the first 20 days of August both suggest that the global manufacturing engine is slowing. This dynamic is particularly negative for emerging market financial…