Equities

Executive Summary The Fed Versus The Market
The Fed Versus The Market
The Fed Versus The Market
In today’s report, we summarize the arguments of bulls and bears to examine the possible longevity of the rally. The Bulls’ view is centered around several key themes: Inflation has turned. The Fed is less hawkish than initially assumed, and Jay Powell is not Paul Volcker. The economy is resilient, and consumers are spending. Corporate earnings will surprise on the upside thanks to consumer strength. Meanwhile, the bears argue that: Growth is slowing and a soft landing is elusive, which will lead to earnings disappointment. Valuations and Technicals are no longer attractive – the best part of the rally is likely over, and risk-reward is skewed to the downside. Inflation is embedded and broad-based and it will take many months to reach the level that is palatable to the Fed. Bottom Line: The rally was expected, but its force and durability took us by surprise. Now, after a strong rebound, risks are skewed to the downside and the markets are fragile, but the rally may continue. We offer our take on what can bring this rally to a halt, and the “danger” signs investors need to be on the lookout for. Feature The fast and furious rally off the June 16 lows has taken many investors by surprise. Over the past two months, the S&P 500 has rebounded by 17%, the NASDAQ is up 22%, while Growth has outperformed Value by 9%. Thematic small-cap growth ETFs have fared even better (Chart 1) with Cathie Wood’s ARKG and ARKK up nearly 50%. The Technology and Consumer Discretionary sectors are up 23% and 28% respectively, while Energy and Materials are relatively flat, showcasing a rotation away from the inflation winners to losers. In this week’s report, we will “dissect” the rally and its key drivers to better understand what can bring this rally to a halt. We will also summarize the arguments of the bulls and present our “bearish” rebuttal to some of the assumptions. Sneak Preview: After the powerful rebound, the market is fragile, and risks are skewed to the downside. By summarizing the arguments of bulls and bears, we are offering our take on what can bring this rally to a halt, i.e., hawkish Fed speeches, disappointing inflation readings, rising rates, and bad earnings. However, a positive surprise along each of these dimensions may also result in the next leg up. Chart 1ETF Universe Overview
What Can Bring This Rally To A Halt?
What Can Bring This Rally To A Halt?
Anatomy Of The Rally To understand what fuels the rally, we need to understand what its key catalysts are. Oversold: First and foremost, in mid-June, US equities were severely oversold – the BCA Capitulation Indicator hit levels last seen in the spring of 2020 (Chart 2). The BoA institutional survey has also reported an extreme level of bearishness. Pull back in the price of energy: This created fertile ground for a rebound, but the catalyst came from the turn in commodities and energy prices. Extreme pessimism about global growth after the Fed’s aggressive response to a disappointing inflation print has triggered a sell-off in oil and metals. Since mid-June, the GSCI Commodities and the GSCI Energy index are in a bear market downtrend, 21% and 25% off their peaks. Inflation moderating: This disinflationary development has unleashed a positive reinforcement loop: Lower energy prices led to a turn in the CPI print. And many still believe that, after all, inflation is transitory: With supply disruptions clearing and prices of energy and commodities turning, inflation will dissipate just as fast as it arrived. We know this because inflation breakevens are currently at levels last seen a year ago (Chart 3). Chart 2Capitulated
Capitulated
Capitulated
Chart 3Cooling Off : Back To 2021
Cooling Off : Back to 2021
Cooling Off : Back to 2021
Gentler Fed: That is when the market decided that easing price pressures in concert with slowing growth would compel the Fed to pursue a shallower and shorter path of interest rate increases than initially expected – rate increases derived from OIS started to undershoot the “dot plot” (Chart 4). Effectively, the bond market started to forecast that the Fed will end the year at 3.5% and ease as soon as early 2023. In other words, the Fed is nearing the end of the hiking cycle. Naturally, the long end of the Treasury curve has pulled back to April levels, despite a much higher Fed rate. One way or another, yields have stabilized. Lower rates are a boon for equities: As a long-duration asset, equity valuations are inversely correlated with long yields (Chart 5). A better-than-expected Q2 earnings season was the icing on the cake. Chart 4The Market Expects Cuts As Soon As Early 2023
The Market Expects Cuts As Soon As Early 2023
The Market Expects Cuts As Soon As Early 2023
Chart 5Falling Yields Propelled Equities Higher
Falling Yields Propelled Equities Higher
Falling Yields Propelled Equities Higher
Was The Rally Surprising? The rally itself did not surprise us – after all, we did expect the market to turn on a dime at the earliest whiff of falling inflation (Chart 6). Admittedly, we were taken aback by its strength and longevity. With inflation turning, we also expected a change in leadership from the Energy and Materials sectors to Technology and Consumer Discretionary (Chart 7). We also predicted back in January in our “Are We There Yet?!” report that, based on the previous hiking cycles, Tech would rebound roughly three months after the first rate hike (Chart 8), which was taking us to June. Chart 6When Inflation Turns, Equities Rebound
What Can Bring This Rally To A Halt?
What Can Bring This Rally To A Halt?
Chart 7Turn in Inflation Triggers A Change In Sector Leadership
What Can Bring This Rally To A Halt?
What Can Bring This Rally To A Halt?
Chart 8A Closer Look At Technology
What Can Bring This Rally To A Halt?
What Can Bring This Rally To A Halt?
In early July, we upgraded Growth to overweight as an asset that would benefit from an anticipated turn in CPI, rate stabilization, and slowing growth (Chart 9). We have also reaffirmed our overweight in Software and Services as a way to play Growth on a sector level. We have downgraded Energy to underweight to reduce exposure to Value. Chart 9Growth And Quality Lead Markets Higher When Inflation Abates
What Can Bring This Rally To A Halt?
What Can Bring This Rally To A Halt?
What The Bulls Think Let’s summarize what the bulls think are the catalysts for the next leg up: Inflation has turned. Looking for further signs that inflation is easing. The Fed is less hawkish than initially assumed, and Jay Powell is not Paul Volcker. Looking for signs that the Fed is getting closer to the end of the hiking cycle. So far, the economy is resilient, and consumers are spending – excess savings and excess demand for labor will soften the blow. Looking for signs that the recession can be avoided. Corporate earnings will surprise on the upside thanks to consumer strength. In the next section, I will juxtapose these optimistic expectations with those of a bear, i.e., of yours truly. A full disclosure – I am not a perma-bear but even eight weeks into the best recovery rally ever, I can’t shake off my pessimism. After all, I am used to the markets going up on injections of liquidity and expect them to shudder when liquidity is mopped out of the system. What The Bears Think, Or A Litany Of Worries Inflation is embedded and broad-based Broad-based: While headline inflation is turning, mostly thanks to prices of energy and materials, it will take a long time for core inflation to revert to the desired 2% as it is broad-based. This is evident from trimmed and median CPI metrics, which continue their ascent. Inflation has also spilled into sticky service items, such as rent (Chart 10). Wage-price spiral: Then there is that pesky wage-price spiral that is manifesting itself in soaring labor costs (Chart 11), which companies pass on to their customers. In the meantime, productivity is falling, and unit labor costs are increasing at 9.5% per year, a rate of growth last seen in 1980s (Chart 12). Demand for labor still exceeds supply with 1.8 job openings for every job seeker, and much more tightening is required to bring supply and demand into balance. Chart 10Entrenched?
Entrenched?
Entrenched?
Chart 11Wage-price Spiral
Wage-price Spiral
Wage-price Spiral
Chart 12ULC Soaring
ULC Soaring
ULC Soaring
Wages and service inflation are more important to structural inflation than energy. Rent and its equivalents constitute 30% of the CPI basket, while wages are roughly 50% of corporate sales and by far the largest component of the cost structure. Inflation is embedded and broad-based and it will take many months to reach the level that is palatable to the Fed. What Does The Fed Think? Fed minutes: Fortunately, we don’t need to guess. The Fed minutes state that "participants agreed that there was little evidence to date that inflation pressures were subsiding" and that inflation “would likely stay uncomfortably high for some time.” Further, “though some inflation reduction might come through improving global supply chains or drops in the prices of fuel and other commodities … Participants emphasized that a slowing in aggregate demand would play an important role in reducing inflation pressures," the minutes said. The Fed minutes state that in moving expeditiously to neutral and then into restrictive territory, “the Committee was acting with resolve to lower inflation to 2% and anchor inflation expectations at levels consistent with that longer-run goal.” In its previous communications, the Fed emphasized that its commitment to a 2% target is unconditional. Is powell more like burns or volcker? In addition, there is an ongoing debate between bulls and bears on the character of the Fed – is Jay Powell a strong-willed hawk like Paul Volker, or more of a waverer like Arthur Burns, who presided over the relentless march of inflation in the seventies? We think that the Chairman can channel Paul Volcker. After all, the Fed has surprised investors by acting swiftly and decisively. Back in March, the Fed dot plot indicated that by the end of the year, the target rate will reach a mere 1.75%. However, we hit a 2.25%-2.50% rate range as soon as July. Jay Powell is concerned about his legacy: He would not want to be remembered as a Chair who mishandled inflation by keeping rates too low despite historically low unemployment and resilient consumers whose accounts are padded with excess post-pandemic savings. The Fed is more hawkish than what the majority of market participants, unscathed by the inflation of the seventies and eighties, believe. The Fed dot plot, to which the Chairman referred on multiple occasions, projects a Fed funds rate of 4% at year-end and of 4.5-5.0% next year (Chart 13). Meanwhile, Fed funds futures are only pricing a rate of about 3.4% for December 2022, even after the hawkish talk from both ex-dove Kashkari and a hawk Bullard (3.75%-4.0% by year-end and 4.4% by the end of 2023). Further, the Fed itself states in its minutes that rates would have to reach a "sufficiently restrictive level" and remain there for "some time" to control inflation that was proving far more persistent than anticipated. The Chicago Fed President Charles Evans has also affirmed that the Fed is definitely not cutting rates in March 2023. Chart 13The Fed Versus The Market
The Fed Versus The Market
The Fed Versus The Market
Doves latch on to comments from the meeting that the Fed will be data-driven, and that it is concerned about overtightening. To us, these are just the musings of the “responsible grown-ups.” Quantitative Tightening: Now let’s not forget another leg of the stool – Quantitative Tightening. QT has been very tame so far and, since the program commenced, the size of the Fed’s balance sheet, $8.9 trillion, has barely budged. In September, the Fed is scheduled to step up QT to a maximum pace of $95 billion from $47.5 billion— running off up to $60 billion in Treasuries, and $35 billion of mortgage securities. Shortages of securities available for run-off due to a dearth of refinancing may trigger a shift to outright selling, further tightening financial conditions. Equities are at odds with the Fed: Last, but not least, equity markets are on a collision course with the Fed. Since June, financial conditions have eased as opposed to tightened, making the Fed’s job so much harder (Chart 14). Chart 14The Rally Eased Financial Conditions
The Rally Eased Financial Conditions
The Rally Eased Financial Conditions
The Fed may prove to be more hawkish than in the past as it is on a quest to combat inflation and takes its mission very seriously. “Don’t fight the Fed” the adage holds. Economic Growth Is Slowing The BCA Business Cycle Indicator signals that economic growth is slowing (Chart 15), which is also evident from a host of economic data releases, ranging from GDP growth to business surveys to housing data. One of the few data series that has defied gravity so far is the jobs report, but the job creation rate is a coincidental indicator at best, and a lagging one at worst. Jobs are usually lost after the start of a recession (Chart 16). Chart 15Economy Is Slowing
Economy Is Slowing
Economy Is Slowing
Chart 16Unemployment Never "Just Ticks Up"
Unemployment Never "Just Ticks Up"
Unemployment Never "Just Ticks Up"
Can consumers save the day? After all, $2.2 trillion in excess savings should help to handle the pressures of negative real wage growth and income growth that is below trend. Yes and no. Gasoline savings can certainly support increases in discretionary spending, all else equal. As for excess savings – adding this money back into the economy may ignite another bout of inflation, working against the Fed, and triggering more rate increases. Many clients ask us if we anticipate a recession. Broadly speaking we do, as the Fed has an arduous task ahead of it in balancing the supply and demand of labor. However, we do not expect a recession in 2022 or even early 2023. Can the Fed succeed by only reducing excess job openings from 1.8 to 1, thus avoiding a rise in unemployment? This is possible, but the probability of such an outcome is low as unemployment never “just ticks up” (Chart 16). However, what the market is pricing is also important. At the moment, the rally shows that it considers the current growth slowdown just a growth scare to be shrugged off. Will there be more disappointments? We think so, as the US economy is facing multiple headwinds from slowing demand for exports due to geopolitical turbulence and payback of overstimulated consumer demand at home. And it is not a recession per se, but a growth disappointment, that may take equities on the next leg down. Growth is slowing and a soft landing is illusive. Earnings Growth Will Continue Its March Towards Zero We believe that earnings growth will continue to slow into year-end – flagging consumer demand at home and abroad, a strong dollar, and soaring unit labor costs that can no longer be fully passed on to stretched consumers, as corporate pricing power is decelerating. Even in Q2-2022, ex-Energy EPS growth is already negative at -1.5%, with Consumer Discretionary, Financials, Communications, and Utilities reporting an earnings contraction. As we predicted back in October, the S&P 500 margins are also compressing, currently at 50bps off their peak, with consensus expecting them to lose another two points within the next 12 months as companies are grappling with rising costs (Chart 17). Analysts are finally in a downgrading mode (Chart 18), with growth over the next 12 months now expected to be 7.7% compared to 10% earlier this summer. Analyst downgrades will continue, and an earnings recession is highly probable as early as Q4-2022. Chart 17Profitability Is Under Pressure
Profitability Is Under Pressure
Profitability Is Under Pressure
Chart 18Earnings Are Finally Being Downgraded
Earnings Are Finally Being Downgraded
Earnings Are Finally Being Downgraded
In terms of the durability of the rally – earnings growth disappointment will be enough to cause equities to pull back. Earnings growth is slowing and more disappointments may be in store. Valuations And Technicals The S&P 500 is currently trading at 18x forward earnings, which is nearly a two-point rebound off the market trough of 15.8x. This is roughly where PE NTM was in April when the 10-year yield stood at 2.80%. Therefore, the multiple reverted on the back of falling rates, and the market is fairly valued considering where rates are now. And another factor to consider: Analysts are slashing earnings expectations, and with E in a P/E likely to be downgraded further – the “true” forward multiple is likely higher than it appears. The BCA Valuation Indicator is also flashing “overvalued” (Chart 19). From the equity risk premium standpoint, 3% is low by historical standards (Chart 20). And if we consider Shiller PE, it has come down from an eye-watering 38x to a still elevated 29x. Chart 19Pricey Again?
Pricey Again?
Pricey Again?
Chart 20Equities Are No Longer Cheap By ERP Or Shiller PE Metrics
Equities Are No Longer Cheap By ERP Or Shiller PE Metrics
Equities Are No Longer Cheap By ERP Or Shiller PE Metrics
Therefore, it is hard to call equities cheap at this point. But being generous, we will call them “fairly priced.” Regardless – at these levels of valuations, the best part of the rally is likely over, and risk-reward is no longer favorable. From a technical standpoint, this rally is broad-based with nearly 90% of the S&P 500 industries trading above their 50-day moving average (Chart 21). But according to the BCA Technical Indicator, equities are no longer oversold and have just crossed into neutral territory (Chart 22). Interestingly, once the Technical indicator starts to rise, it usually ascends for a while, making us wary to boldly call an immediate end to this rally. Chart 21Thrusting
Thrusting
Thrusting
Chart 22No Longer Oversold?
No Longer Oversold?
No Longer Oversold?
Valuations and Technicals are no longer attractive – the best part of the rally is likely over and risk-reward is skewed to the downside. Investment Implications Or Can This Rally Continue? Timing the market is hard at best, impossible at worst. After a 17% rise from the bottom, the S&P 500 is no longer cheap or oversold. Buying equities for valuations or technical reasons is too late – risks are skewed to the downside. Our working assumption is that the rally will pause waiting for the new data that will trigger a new leg up or down. Further, as we pointed out in the Fat and Flat report, the current period is reminiscent of the 1980-1982 Volcker era. So far, the market is following this pattern to a T (Chart 23). The problem is that each leg of the up-and-down market may take months. As such, being (eventually) right and principled does not pay off. After all, the economy is not a market. Therefore, until one of the following happens, the music will continue and the markets can keep dancing, which may be for a while. Chart 23Volcker Era Redux
Volcker Era Redux
Volcker Era Redux
The rally will continue until: There is a communication from the Fed re-emphasizing its hawkish stance and determination to get inflation back to 2%. It may be as one of the FOMC member’s speeches broadcast at Jackson Hole. Long-term Treasury yields pick up either because of the Fed’s actions or speeches or because the economy is overheating. Negative inflation surprise – it may come as either a higher-than-expected inflation reading or evidence that inflation is entrenched, such as rising service or rent inflation, soaring wages, a pick-up in the price of oil or commodities, or a growth surprise out of China, to name but a few. Negative earnings surprise – guidance from a number of companies indicating that economic growth is slowing, and earnings will disappoint. A negative economic surprise may be perceived by the market as “bad news is good news.” We recommend the following: Maintain a well-diversified portfolio, with sufficient allocation to both cyclicals and defensives. Increase exposure to Growth sectors, such as Technology. We particularly favor Software and Services as it leverages the pervasive theme of digitization and migration to the cloud. Reduce allocation to Energy and Materials – these sectors tend to underperform when inflation turns. They are also quintessential value sectors. Maintain some allocation to cyclicals – we are overweight the Industrial sector as it leverages a long-term theme of onshoring and automation. We may be upgrading the Consumer Discretionary sector in the near future. We are also overweight Banks and Insurance for portfolio diversification – these sectors benefit from rising rates and positive growth surprise. Markets turn on a dime and it is good to be prepared. Allocate capital to long-term investment themes: Green and Clean and EV, benefiting from the funds allocated by the IRA bill, Cyber Security, and Defense. Bottom Line: The rally was expected, but its force and durability took us by surprise. Now, after a strong rebound, risks are skewed to the downside and the markets are fragile, but the rally may still continue. We offer our take on what can bring this rally to a halt, and the “danger” signs investors need to be on the lookout for. In the meantime, overweight Growth and maintain a well-diversified portfolio. Irene Tunkel Chief Strategist, US Equity Strategy irene.tunkel@bcaresearch.com Recommended Allocation Recommended Allocation: Addendum
What Our Clients Are Asking: The Bear Market 2.0 Webcast Follow Up
What Our Clients Are Asking: The Bear Market 2.0 Webcast Follow Up
Executive Summary Definitions Matter
Definitions Matter
Definitions Matter
Year-to-date, cyclical stocks have underperformed their defensive counterparts. It is difficult to quantify this underperformance precisely considering the divergence in definitions of what makes a sector cyclical or defensive. We offer a novel way to classify sectors based on a combination of equity beta coefficients and correlations with global macro and financial variables. Importantly, we acknowledge the importance of granularity by looking at the GICS2 sectors. This new approach leads to a cyclicals/defensives equity performance that is superior and more in line with the global economic cycle. Bottom Line: A proper definition of what constitutes a cyclical and a defensive equity sector is essential – whether a recession is around the corner and investors adopt a more defensive portfolio tilt or markets are just responding to what might simply be a mid-cycle slowdown. Investors around the globe are holding their breath over two questions: Has inflation peaked? And will the US and Europe enter a recession? A peak in inflation may be enough to avoid a hard landing, as it would allow the Federal Reserve and the ECB to moderate their policy tightening. However, if inflation is not peaking, central banks will be forced to engineer recessions. Related Report European Investment StrategyPlenty Of Risks For Cyclical Stocks In turn, the answers to these questions will determine how cyclical equities perform relative to defensives. So far, the underperformance of cyclical sectors relative to defensives has mostly reflected a valuation squeeze. But if a recession takes place, relative profits will drive the next phase of this market cycle. For now, European defensive sectors are likely to retain the upper hand until EM/China economic activity recovers enough to provide a lift to cyclical sectors, and/or the US dollar rally reverses course on a sustained basis. Chart 1Definitions Matter
Definitions Matter
Definitions Matter
Despite their recent rebound, Euro Area cyclical stocks have underperformed relative to their defensive counterparts over the past nine months. However, quantifying this underperformance depends on how one defines cyclicals and defensives (Chart 1). The aim of this Special Report is to address this issue. There is no perfect way to define a sector as a cyclical or a defensive. In this piece, we review the generally accepted definitions. We draw two conclusions from our assessment; (i) the GICS1 sectors are too broad to get an accurate representation of cyclicals/defensives, and (ii) the use of only one indicator of cyclicality, such as the OECD Composite Leading Indicator (LEI), is lacking. We propose a different approach, which looks at the GICS2 sectors and applies an average of the market beta and the correlations to a set of global macro as well as financial variables sensitive to the global economy. This novel approach leads to a cyclicals/defensives equity performance that is more properly aligned with the global economic cycle. Challenging the Accepted Approach Each of the definitions of the cyclicals/defensives split has its own merit. For example, our own preferred definition of cyclical equities excludes the tech sector, because it sports a negative correlation with interest rates. Finance theory posits that companies (or sectors) may be categorized based on how they perform in different phases of the business cycle. Consequently, cyclical companies should perform better in the first stages of a new business cycle (especially coming out of a recession) and defensive companies should shine during downturns. Table 1Definitions Matter
Revisiting Cyclicals Versus Defensives
Revisiting Cyclicals Versus Defensives
MSCI defines cyclical and defensive sectors by measuring the correlation between sectors’ relative annual performance to the annual change in the OECD Composite Leading Indicator (LEI) of the corresponding region.1 Table 1 presents the current MSCI classification. There are two issues with this approach. First, results differ substantially depending on the sample period (Table 2). GICS1 sectors match their definitions when using the full history available (from 1995 to present). However, on shorter samples, starting for example from 2005 or 2015, the correlations do not necessarily support the current MSCI classification; the communication services sector correlates negatively with the Euro Area OECD LEI from 2005 to present,2 while the energy sector displays a positive correlation since 2015. Table 2Cyclicality Changes Over Time
Revisiting Cyclicals Versus Defensives
Revisiting Cyclicals Versus Defensives
Looking at the five-year moving correlation of the relative performance of European sectors to the annual change in OECD LEI, four things stand out (Chart 2). First, the energy sector displays a positive correlation, meaning that it behaves as a cyclical. Second, it is not clear that communication services should be labeled a cyclical sector. Third, although tech has on average displayed a five-year moving correlation with activity of around 0.5, it is increasingly behaving like a defensive sector. And fourth, over the past 20 years, all sectors have at one point or another moved from a positive (negative) correlation to a negative (positive) one. Chart 2Cyclicality Is Not Static
Cyclicality Is Not Static
Cyclicality Is Not Static
The second issue with the MSCI approach is the use of the OECD LEIs. While the OECD LEIs are satisfactory at capturing the peaks and troughs in economic activity, we have some concerns over relying on this measure alone to label a sector as cyclical or defensive. Many of the country’s LEIs already include stock prices. Moreover, academic studies have found that the LEIs performed worse than some of their single component indicators, but displayed more accuracy – that is, fewer false signals. In particular, financial components used in some of the country’s LEIs, such as interest rates, spreads, and credit indicators, proved to be better classifiers of both growth and business cycles than the overall LEIs. Chart 3Global Growth Sensitivity
Global Growth Sensitivity
Global Growth Sensitivity
Finally, many (if not most) of the components of the LEIs are domestic variables. As a result, they may not properly reflect how the global economic and trade cycles affect an economy such as that of the Euro Area. In fact, the correlation between the relative performance of Euro Area cyclicals versus defensives and the annual change in the US and Global LEIs is similar to the correlation between the cyclical/defensive split and the Euro Area LEI (Chart 3).3 Reclassifying Cyclicals And Defensives We may draw two conclusions from our earlier assessment; (i) the GICS1 sectors are too broad to secure an accurate definition of cyclicals/defensives, and (ii) the use of only one indicator of cyclicality, such as the OECD LEI, is insufficient. Granularity Holds The Key Many industries or sectors have experienced profound changes over the past decades. Industries evolve and new ones emerge that may disrupt the status quo. For instance, today’s tech sector shares few similarities with its past-self twenty years ago. Chart 4AMore Granularity Needed (I)
More Granularity Needed (I)
More Granularity Needed (I)
Without getting to the company level, many GICS2 sectors already exhibit characteristics deviating substantially from those of the GICS1 sectors of which they are a part (Chart 4A & 4B). Most noticeably: Within industrials: commercial and professional services (9% weight) have a negative correlation with the LEI of -0.23 (Chart 4A, top panel). Within consumer discretionary: the correlation of the retailing sector with the LEI (15% weight) went from 0.75 in the early 2010s to -0.5 in 2018 and has since been trending toward 0 (Chart 4A, third panel). Within tech: software and services (46% weight) sport a negative moving correlation of -0.25, and highlight that this sector has effectively become akin to “digital utilities.” Meanwhile, technology hardware and equipment display a correlation close to 0 (Chart 4A, fourth panel). Chart 4BMore Granularity Needed (II)
More Granularity Needed (II)
More Granularity Needed (II)
Within communication services: telecommunication services (78% weight) still behave like a defensive sector, and it appears that the cyclicality of the GICS1 sector is driven by media and entertainment stocks (Chart 4B, top panel). Within consumer staples: food beverage and tobacco (53% weight) now display a positive correlation of 0.1 with the LEI, whereas it used to have a -0.8 correlation until 2018 (Chart 4B, second panel). Within energy: GICS2 sectors have displayed positive correlations since 2015 (Chart 4B, third panel). For the remaining GICS1 sectors, namely materials, financials, utilities, and healthcare, except for large swings observed in the past, their respective GICS2 sub-sectors currently display correlation coefficients sharing the same sign as their broader aggregates. Thus, adding granularity by looking at the GICS2 sector level instead of the GICS1 classification when creating cyclical and defensive baskets offers a more accurate picture. Good Old Beta Is the market itself the best indicator of a stock’s cyclicality? The returns on the stocks of cyclical (defensive) sectors should reflect high (low) correlation with the market index’s returns. Table 3A presents the beta coefficients obtained from linearly regressing the monthly equity returns of European GICS1 sectors on the monthly equity returns of the All-Country World benchmark. We run into the same issue of getting different results based on the sample period. Historically, the energy sector has had a beta coefficient below 1, but, from 2005, its beta has risen to 1.12. Meanwhile, communication services has a beta coefficient below 1 across all three sample periods selected. Table 3AGICS1 Beta Coefficients
Revisiting Cyclicals Versus Defensives
Revisiting Cyclicals Versus Defensives
We perform the same exercise at the European GICS2 sector level (Table 3B). The results reify the benefit of additional granularity when defining cyclicals and defensives. Table 3BGICS2 Beta Coefficients
Revisiting Cyclicals Versus Defensives
Revisiting Cyclicals Versus Defensives
Combining Correlations With Macro And Financial Variables While stock prices are certainly anticipatory, at times they can also decouple from the business cycle. Equity markets and stock indices are becoming more concentrated, which means that measuring cyclicality through beta alone is no longer sufficient. We complement the use of the beta coefficients with a composite measure of cyclicality based on correlations with global macro and financial variables. We select the following global macro variables (Chart 5A): Global Manufacturing PMI Global Industrial Production G3 Capital New Orders Global Exports Chart 5AGlobal Macro Variables Selected
Global Macro Variables Selected
Global Macro Variables Selected
Chart 5BFinancial Variables Selected
Financial Variables Selected
Financial Variables Selected
And we opt for the following high-frequency financial variables (Chart 5B): Trade-weighted USD: The cyclicals-to-defensives ratio and the trade-weighted US dollar display a robust negative correlation. A strong dollar both tightens global financial conditions and indicates weaker economic growth. GS Commodity Price Index: Commodity prices reflect both global supply and demand dynamics. Strong economic activity usually lifts commodity prices, while a slowdown hurts commodity demand. US 10-year Treasury Yield: The relationship with the US 10-year Treasury yield is somewhat more complex. At the beginning of a new business cycle, higher yields reflect reflation and usually correlate with an outperformance of cyclical equities. However, if yields rise too much, they start hurting growth prospects and end up damaging cyclicals. If they fall, it usually reflects increasing growth fears, which is negative for cyclical shares. Junk Spreads: US high-yield corporate bond spreads and the cyclicals/defensives ratio have a strong negative correlation. Widening junk spreads coincide with the end of the business cycle when fears of rising default risk precede a recession. Although these financial variables are highly anticipatory, they are also prone to whipsaws. Consequently, they must be viewed in conjunction with macro variables. We also compute the five-year moving correlations between monthly equity returns of European sectors relative to the ACW benchmark and the two sets of macro and financial variables (Table 4A & 4B). The results are broadly consistent between the long-term correlations with macro and financial variables, as well as with the beta coefficients,4 which comforts us into using a simple average of the three. Table 4ACombining Coefficients For GICS1 Sectors
Revisiting Cyclicals Versus Defensives
Revisiting Cyclicals Versus Defensives
Table 4BCombining Coefficients For GICS2 Sectors
Revisiting Cyclicals Versus Defensives
Revisiting Cyclicals Versus Defensives
At the GICS1 sector level, our new approach indicates that the energy sector should be treated as a cyclical, not a defensive. In fact, it displays more cyclicality than the tech sector. Communication services should also be defined as cyclicals, although it is less of a clear cut than for the other sectors since the adjusted beta coefficient is the culprit behind the negative sign. Taking a closer look at the GICS2 sector level once again provides valuable insight. The computed mean correlation for cyclical GICS2 sectors is 0.34, with a variance of 0.04 and standard deviation of 0.2. For defensive GICS2 sectors, the computed mean correlation is -0.23, with a variance of 0.02 and a standard deviation of 0.13. Assessing This New Approach Having reclassified the GICS2 sectors as cyclicals or defensives, the next step is to assess how this approach performs compared to the MSCI definition of cyclicals/defensives. To do so, we use the average coefficients displayed on Table 4B to create a dynamic basket of cyclicals and defensives GICS2 sectors. These baskets are weighted by market capitalization and are updated monthly. Chart 6New Baskets Of Cyclicals/Defensives
New Baskets Of Cyclicals/Defensives
New Baskets Of Cyclicals/Defensives
Chart 6 shows how the novel cyclical vs. defensives performs over time in the Euro Area relative to the other definitions. Next, we perform a simple back-testing exercise to assess the performance over time of the new cyclicals-to-defensives ratio, with the Global Manufacturing PMI as a control variable. A superior definition of cyclicals vs. defensives should lead to a better performance of cyclicals when the PMI is above its 50 boom/bust line and improving, and to a better performance of defensives when the PMI is below 50 and deteriorating. We look at coincident equity returns (Table 5A). Overall, the results indicate that our new approach is superior and more accurate, both on a 3- and 12-month time horizon. This is especially true when the global economy is deteriorating. When the PMI is below 50 and falling, our basket of defensives outperforms our basket of cyclicals on average by 20% on a 12-month horizon, compared to 14% using the MSCI definition. Table 5AAssessing The Performance (I)
Revisiting Cyclicals Versus Defensives
Revisiting Cyclicals Versus Defensives
The subsequent performance of cyclicals relative to defensives following certain thresholds for the PMI also reinforces our new approach (Table 5B). Interestingly, our new basket of defensives is the only one to outperform cyclicals twelve months after the Global Manufacturing PMI deteriorated over several months and is below 50. Table 5BAssessing The Performance (II)
Revisiting Cyclicals Versus Defensives
Revisiting Cyclicals Versus Defensives
Bottom Line: We are introducing a new approach to defining cyclical versus defensive equities. GICS1 sectors are too broad to achieve an accurate definition of cyclicality. However, the GICS2 classification offers the necessary level of granularity to do so. Moreover, we broaden the set of variables used to determine whether a GICS2 sector is cyclical or defensive. This new approach offers tighter links with the state of the global economy when selecting cyclical or defensive portfolio biases. For now, since EM economies and China remain under duress and the USD has yet to roll over clearly, we maintain our preference for defensive stocks over their cyclical counterparts within equity portfolios. Jeremie Peloso, Editor/Strategist JeremieP@bcaresearch.com Amr Hanafy Associate Editor AmrH@bcaresearch.com Mathieu Savary, Chief European Strategist Mathieu@bcaresearch.com Footnotes 1 Applied Research MSCI, “Index Performance in Changing Economic Environments,” 2014, p. 4. 2 Admittedly, communications services – formerly known as telecommunication services – was removed from the list of defensive sectors and classified as a cyclical one following the 2018 GICS structure adjustment. 3 In the remainder of the report, the relative equity performance of European sectors is measured against the ACW index. 4 We normalized the beta coefficients to have a mean of zero, to be comparable with correlation coefficients.
Executive Summary We continue to recommend overweighting risk assets in multi-asset portfolios over the next six months because we believe financial markets have prematurely priced in too much pessimism. Against a particularly uncertain macroeconomic backdrop, we think all investors should have reduced conviction in their views. Asking how one could be getting it wrong is especially relevant today. We identify seven prominent risks to our view, with unanchored inflation expectations and consumer retrenchment posing the biggest threats to our risk-friendly recommendations. The former would imply economic overheating that would prompt the Fed to squash the expansion; the latter would herald a period of insufficient growth. Inflation Expectations Are Still Contained
Inflation Expectations Are Still Contained
Inflation Expectations Are Still Contained
Bottom Line: We are on the alert for several ways our glass-half-full view could be disappointed but none of them has yet emerged. We continue to recommend positioning a portfolio in line with it. Feature We will be taking our summer vacation this week and will not publish next Monday, August 29th. We will resume our regular publication schedule on September 5th. Chart 1Overdone
Overdone
Overdone
We held our quarterly webcast last week, in which we reiterated three main points that will be familiar to US Investment Strategy readers. One, the demise of the American consumer has been greatly exaggerated. Two, monetary policy works with a lag. Three, stubbornly high inflation will bring about the end of the expansion and the bull markets in equities and credit, but not just yet. Those points reinforce our view that equities and credit will outperform Treasuries and cash over the rest of the year and place us at the more bullish end of the continuum inside and outside of BCA for the near term, though we are much more circumspect about the prospect for risk assets over the next twelve months and beyond. We also spent some time digging into the reasons that we are more constructive than the average bear. Those reasons largely revolved around the idea that financial markets prematurely discounted the negative effects that will follow sometime after the Fed flips monetary policy settings from easy to tight. After tightening sharply over the first half of the year (Chart 1, top panel), we think financial conditions are due for a break as Treasury yields settle into a well-defined range (Chart 1, second panel), credit spreads consolidate their retracement after sharply widening (Chart 1, third panel), the S&P 500 finds a footing and retraces more of its first half losses (Chart 1, fourth panel) and the dollar, cooling off after a torrid run (Chart 1, bottom panel), prepares to weaken over the intermediate term. We did not have time to answer all the questions from the webcast Q&A before the hour was up and we spent much of the week replying to them over email. Several of the questions asked what we are most worried about, or which indicators are most likely to signal that we are getting the outlook wrong. We ask ourselves these questions continuously and they are an ideal way to conclude a gathering like last Monday’s. Although we didn’t get to address them live, examining the biggest risks to our view as a coda in this week's bulletin is the next best thing. Risk #1: Unanchored Inflation Expectations We view a breakout in inflation expectations as the biggest risk to our view. If households, businesses and investors were to expect that inflation would inflect meaningfully higher over the long term, they would adjust their behavior in ways that could make high inflation beget still higher inflation. The ensuing self-reinforcing cycle would become much more difficult for the Fed to break and would presumably involve a stark repricing of Treasury securities and risk assets. Related Report US Investment StrategyRisks To Our View We have been warily monitoring inflation expectations over the near term (0-2 years, top panel in Charts 2 and 3), the intermediate term (3-5 years, middle panel) and the long term (6-10 years, bottom panel), as has the Fed. We have become increasingly emboldened by the stability of the intermediate- and long-term series, even in the face of the highest measured inflation in 40-plus years. Now that near-term expectations have rolled over, some of the risk that elevated current inflation will begin to bleed into long-run expectations is fading. We remain relieved that businesses, investors and consumers (Chart 4) have not yet assumed high inflation will persist but if longer-run inflation expectations threaten to become unanchored, we will abandon our constructive take on the economy and risk assets. Chart 2High Reported Inflation ...
High Reported Inflation ...
High Reported Inflation ...
Chart 3... Has Yet To Translate Into ...
... Has Yet To Translate Into ...
... Has Yet To Translate Into ...
Chart 4... Meaningfully Higher Long-Run Inflation Expectations
... Meaningfully Higher Long-Run Inflation Expectations
... Meaningfully Higher Long-Run Inflation Expectations
Risk #2: A Renewed COVID Breakout The other risks are not as significant as unmoored inflation expectations but they are meaningful nonetheless. A renewed COVID breakout that imposed the de facto equivalent of rolling blackouts in production and transportation would partially undo the supply chain improvements that have helped relieve some of the upward pressure on goods inflation while hampering global growth. That could have the doubly negative impact of squeezing S&P 500 earnings while rekindling inflation pressures, nudging the US and global economies toward stagflation. Effective vaccinations and treatments have rendered COVID little more than a nuisance in the States (Chart 5) and other developed nations, but if the pandemic surges back to life elsewhere in the world, we would have to reconsider our more constructive take. Chart 5Initially A Scourge, COVID Is Now An Annoyance
Initially A Scourge, COVID Is Now An Annoyance
Initially A Scourge, COVID Is Now An Annoyance
Risk #3: Geopolitical Pressures Our in-house geopolitical experts were among the first to sound the alarm on Ukraine early in the year. A worsening of the conflict there, or anything that imperils Europe’s access to energy supplies or further restricts global supplies of grain, will also cloud the picture for risk assets. Our geopolitical team has long viewed the Taiwan Strait as a potential major geopolitical flashpoint and a sharp increase in Sino-American tensions would make us reconsider our thesis as well. Our in-house team warns that Iran could be another source of instability and we will have to remain aware of the potential for geopolitics to throw a wrench into otherwise neutral-to-bullish macro conditions. Risk #4: US Consumers Lose Their Nerve Though we haven’t tried to rank the risks beyond a breakout in inflation expectations, a big pickup in the savings rate is the second largest risk on our list. If households reverse field and start saving their disposable income at a rate above their post-crisis/pre-pandemic average (Chart 6), it would signal that their aggregate consumption decisions were beginning to match their gloomy responses to confidence surveys. That would erode our conviction that they will deploy their excess pandemic savings to keep consumption – and the US economy – expanding near its trend rate. If consumers begin to circle the wagons in paradox-of-thrift fashion, it would present a nearly insurmountable obstacle for our thesis. Chart 6A Massive Savings Cushion To Support Consumption ...
A Massive Savings Cushion To Support Consumption ...
A Massive Savings Cushion To Support Consumption ...
Risk #5: Consumer Credit Deterioration As SIFI bank executives noted in last month’s second quarter earnings calls, consumer credit has performed spectacularly well. Credit card net charge-offs are hovering at all-time lows, mortgage foreclosure rates are microscopic, and the only signs of stress have emerged, faintly, at the lowest ends of the wealth and income distributions. The very gentle softening in consumer credit that lenders have seen so far (Chart 7) could turn into something more worrisome if inflation fails to moderate and/or the jobs market goes south. If consumer credit begins palpably deteriorating, it would signal that the excess savings buffer does not offer as much protection as we thought. Chart 7... And Consumer Credit
Risks To Our View (Again)
Risks To Our View (Again)
Risk #6: A Softening Labor Market Chart 8Still A Lot Of Help Wanted
Still A Lot Of Help Wanted
Still A Lot Of Help Wanted
An extremely robust labor market has helped solidify our conviction that a sizable moat protects the US economy from unwelcome near-term surprises. Despite evident deceleration in growth over the first half of the year, net payrolls have continued to grow at a rapid clip and ongoing demand for additional hires (Chart 8) remains strong. The labor market could soften more rapidly than it has so far or than we project it will in the near term. Risk assets’ window for outperformance will shorten the faster the labor demand moat shrinks. Risk #7: Technical Support Could Prove Fleeting We have been further encouraged by the ease with which the S&P 500 sliced through resistance around 4,175 on its second try last week and has remained above that level (Chart 9). We see 4,175 providing tactical support to the index, limiting its near-term downside. If the support were to fail a test, we will be forced to re-evaluate US equities’ near-term risk-reward profile. Chart 9The S&P 500 Appears To Have Some Near-Term Technical Support
Risks To Our View (Again)
Risks To Our View (Again)
A client alerted us last week to a longer-term technical pattern that might serve to put a bottom under equities. Since 1950, no bear market has made new lows after retracing at least 50% of its decline. We explored the pattern beginning with the November 1968-May 1970 bear market and found that tests of the 50% retracement level were few and far between. The bear market action of the last 50-plus years by no means guarantees that the S&P 500 will encounter difficulty punching back through the 50% threshold (4,231.67) it crossed on Friday August 12th, but the index has gathered some positive technical omens during its two-month rally. Investment Implications There is no shortage of potential risks right now and we reiterate our heightened vigilance. Investors must contend with the combination of a once-in-a-century global pandemic, the unprecedented fiscal and monetary responses to its outbreak, the first major cross-border war in Europe since 1945 and four-decade highs in inflation across major developed economies. Our conviction levels are lower than normal and our inherent compulsion to ask where we could be getting it wrong now verges on paranoia. Though we are continuously looking over our shoulder, we are comforted by nearly unanimous glass-half-empty sentiment. We still believe that it won’t take much for corporate earnings and the economy to surprise to the upside. The latest iteration of the Bank of America Merrill Lynch portfolio manager survey revealed that sentiment is no longer “apocalyptically bearish,” but we still expect that relative performance pressures will prod many bearishly positioned managers to cover their risk asset underweights. We remain constructive on risk assets over the next six months, though we will likely take some chips off the table if the S&P 500 rallies into the 4,500-to-4,600 range as we expect. It is a core part of our process to seek out information that may invalidate our hypotheses and we don’t even have to venture beyond the confines of BCA to gather it right now. Our differences with our colleagues are not as large as they might seem in our daily BCA Live and Unfiltered live stream, however, as they boil down to timing. We are neutral-to-bearish twelve months out, as we anticipate another equity bear market will begin around the second half of next year once it becomes apparent that the FOMC will not stand down from its 2% inflation goal. We simply think there’s money to be made from the long side in the interim. Doug Peta, CFA Chief US Investment Strategist dougp@bcaresearch.com
Dispatches From The Future: From Goldilocks To President DeSantis
Listen to a short summary of this report. Executive Summary Back From The Future: An Investor’s Almanac
Dispatches From The Future: From Goldilocks To President DeSantis
Dispatches From The Future: From Goldilocks To President DeSantis
Stocks will rally over the next six months as recession risks abate but then begin to swoon as it becomes clear the Fed will not cut rates in 2023. A second wave of inflation will begin in mid-2023, forcing the Fed to raise rates to 5%. The 10-year US Treasury yield will rise above 4%. While financial conditions are currently not tight enough to induce a recession, they will be by the end of next year. In the past, the US unemployment rate has gone through a 20-to-22 month bottoming phase. This suggests that a recession will start in early 2024. The US dollar will soften over the next six months but then get a second wind as the Fed is forced to turn hawkish again. Over the long haul, the dollar will weaken, reflecting today’s extremely stretched valuations. Bottom Line: Investors should remain tactically overweight global equities but look to turn defensive early next year. Somewhere in Hilbert Space I have long believed that anything that can possibly happen in financial markets (as well as in life) will happen. Sometimes, however, it is useful to focus on a “base case” or “modal” outcome of what the world will look like. In this week’s report, we do just that, describing the evolution of the global economy from the perspective of someone who has already seen the future unfold. September 2022 – Goldilocks! US headline inflation continues to decline thanks to lower food and gasoline prices (Chart 1). Supply-chain bottlenecks ease, as evidenced by falling transportation costs and faster delivery times (Chart 2). Most measures of economic activity bottom out and then begin to rebound. The surge in bond yields earlier in 2022 pushed down aggregate demand, but with yields having temporarily stabilized, demand growth returns to trend. The S&P 500 moves up to 4,400. Chart 1ALower Food And Gasoline Prices Will Drag Down Headline Inflation (I)
Lower Food And Gasoline Prices Will Drag Down Headline Inflation (I)
Lower Food And Gasoline Prices Will Drag Down Headline Inflation (I)
Chart 1BLower Food And Gasoline Prices Will Drag Down Headline Inflation (II)
Lower Food And Gasoline Prices Will Drag Down Headline Inflation (II)
Lower Food And Gasoline Prices Will Drag Down Headline Inflation (II)
October 2022 – Europe’s Prospects of Avoiding a Deep Freeze Improve: Economic shocks are most damaging when they come out of the blue. With about half a year to prepare for a cut-off of Russian gas, the EU responds with uncharacteristic haste: Coal-fired electricity production ramps up; the planned closure of Germany’s nuclear power plants is postponed; the French government boosts nuclear capacity, which had been running at less than 50% earlier in 2022; and, for its part, the Dutch government agrees to raise output from the massive Groningen natural gas field after the EU commits to establishing a fund to compensate the surrounding community for any damage from increased seismic activity. EUR/USD rallies to 1.06. November 2022 – Divided Congress and Trump 2.0: In line with pre-election polling, the Democrats retain the Senate but lose the House (Chart 3). Markets largely ignore the outcome. To no one’s surprise, Donald Trump announces his candidacy for the 2024 election. Over the following months, however, the former president has trouble rekindling the magic of his 2016 bid. His attacks on his main rival, Florida governor Ron DeSantis, fall flat. At one rally in early 2023, Trump’s claim that “Ron is no better than Jeb” is greeted with boos. Chart 2Supply-Chain Pressures Are Easing
Supply-Chain Pressures Are Easing
Supply-Chain Pressures Are Easing
Chart 3Democrats Will Lose The House But Retain The Senate
Dispatches From The Future: From Goldilocks To President DeSantis
Dispatches From The Future: From Goldilocks To President DeSantis
December 2022 – China’s “At Least One Child Policy”: The 20th Party Congress takes place against the backdrop of strict Covid restrictions and a flailing housing market. In addition to reaffirming his Common Prosperity Initiative, President Xi stresses the need for actions that promote “family formation.” The number of births declined by nearly 30% between 2019 and 2021 and all indications suggest that the birth rate fell further in 2022 (Chart 4). Importantly for investors, Xi says that housing policy should focus not on boosting demand but increasing supply, even if this comes at the expense of lower property prices down the road. Base metal prices rally on the news. Chart 4China's Baby Bust
China's Baby Bust
China's Baby Bust
January 2023 – Putin Declares Victory: Faced with continued resistance by Ukrainian forces – which now have wider access to advanced western military technology – Putin declares that Russia’s objectives in Ukraine have been met. Following the playbook in Crimea and the Donbass, he orders referenda to be held in Zaporizhia, Kherson, and parts of Kharkiv, asking the local populations if they wish to join Russia. The legitimacy of the referenda is immediately rejected by the Ukrainian government and the EU. Nevertheless, the Russian military advance halts. While the West pledges to maintain sanctions against Russia, the geopolitical risk premium in oil prices decreases. February 2023 – Credit Spreads Narrow Further: At the worst point for credit in early July 2022, US high-yield spreads were pricing in a default rate of 8.1% over the following 12 months (Chart 5). By late August, the expected default rate has fallen to 5.2%, and by January 2023, it has dropped to 4.5%. Perceived default risks decline even more in Europe, where the economy is on the cusp of a V-shaped recovery following the prior year’s energy crunch. Chart 5The Spread-Implied Default Rate Has Room To Fall If Recession Fears Abate
The Spread-Implied Default Rate Has Room To Fall If Recession Fears Abate
The Spread-Implied Default Rate Has Room To Fall If Recession Fears Abate
March 2023 – Wages: The New Core CPI? US inflation continues to drop, but a heated debate erupts over whether this merely reflects the unwinding of various pandemic-related dislocations or whether it marks true progress in cooling down the economy. Those who argue that higher interest rates are cooling demand point to the decline in job openings. Skeptics retort that the drop in job openings has been matched by rising employment (Chart 6). To the extent that firms have been converting openings into new jobs, the skeptics conclude that labor demand has not declined. In a series of comments, Jay Powell stresses the need to focus on wage growth as a key barometer of underlying inflationary pressures. Given that wage growth remains elevated, market participants regard this as a hawkish signal (Chart 7). The 10-year Treasury yield rises to 3.2%. The DXY index, having swooned from over 108 in July 2022 to just under 100 in February 2023, moves back to 102. After hitting a 52-week high of 4,689 the prior month, the S&P 500 drops back below 4,500. Chart 6Drop In Job Openings Is Matched By Rise In Employment
Drop In Job Openings Is Matched By Rise In Employment
Drop In Job Openings Is Matched By Rise In Employment
Chart 7Wage Growth Remains Strong
Wage Growth Remains Strong
Wage Growth Remains Strong
April 2023 – Covid Erupts Across China: After successfully holding back Covid for over three years, the dam breaks. When lockdowns fail to suppress the outbreak, the government shifts to a mitigation strategy, requiring all elderly and unvaccinated people to isolate at home. It helps that China’s new mRNA vaccines, launched in late 2022, prove to be successful. By early 2023, China also has sufficient supplies of Pfizer’s Paxlovid anti-viral drug. Nevertheless, the outbreak in China temporarily leads to renewed supply-chain bottlenecks. May 2023 – Biden Confirms He Will Stand for Re-Election: Saying he is “fit as a fiddle,” President Biden confirms that he will seek a second term in office. Little does he know that the US will be in a recession during most of his re-election campaign. Chart 8Consumer Confidence And Real Wages Tend To Move Together
Consumer Confidence And Real Wages Tend To Move Together
Consumer Confidence And Real Wages Tend To Move Together
June 2023 – Inflation: The Second Wave Begins: The decline in inflation between mid-2022 and mid-2023 sows the seeds of its own demise. As prices at the pump and in the grocery store decline, real wage growth turns positive. Consumer confidence recovers (Chart 8). Household spending, which never weakened that much to begin with, surges. The economy starts to overheat again, leading to higher inflation. After having paused raising rates at 3.5% in early 2023, the Fed indicates that further hikes may be necessary. The DXY index strengthens to 104. The S&P 500 dips to 4,300. July 2023 – Tech Stock Malaise: Higher bond yields weigh on tech stocks. Making matters worse, investors start to worry that many of the most popular US tech names have gone “ex-growth.” The evolution of tech companies often follows three stages. In the first stage, when the founders are in charge, the company grows fast thanks to the introduction of new, highly innovative products or services. In the second stage, as the tech company matures, the founders often cede control to professional managers. Company profits continue to grow quickly, but less because of innovation and more because the professional managers are able to squeeze money from the firm’s customers. In the third stage, with all the low-lying fruits already picked, the company succumbs to bureaucratic inertia. As 2023 wears on, it becomes apparent that many US tech titans are entering this third stage. August 2023 – Long-term Inflation Expectations Move Up: Unlike in 2021-22, when long-term inflation expectations remained well anchored in the face of rising realized inflation, the second inflation wave in 2023 is accompanied by a clear rise in long-term inflation expectations. Consumer expectations of inflation 5-to-10 years out in the University of Michigan survey jump to 3.5%. Whereas back in August 2022, the OIS curve was discounting 100 basis points of Fed easing starting in early 2023, it now discounts rate hikes over the remainder of 2023 (Chart 9). The 10-year yield rises to 3.8%. The 10-year TIPS yield spikes to 1.2%, as investors price in a higher real terminal rate. The S&P 500 drops to 4,200. The financial press is awash with comparisons to the early 1980s (Chart 10). Chart 9The Markets Expect The Fed To Cut Rates By Over 100 Basis Points Starting In 2023
The Markets Expect The Fed To Cut Rates By Over 100 Basis Points Starting In 2023
The Markets Expect The Fed To Cut Rates By Over 100 Basis Points Starting In 2023
Chart 10The Early-1980s Playbook
The Early-1980s Playbook
The Early-1980s Playbook
October 2023 – Hawks in Charge: After a second round of tightening, featuring three successive 50 basis-point hikes, the Fed funds rate reaches a cycle peak of 5%. The 10-year Treasury yield gets up to as high as 4.28%. The 10-year TIPS yield hits 1.62%. The DXY index rises to 106. The S&P 500 falls to 4,050. November 2023 – Housing Stumbles: With mortgage yields back above 6%, the US housing market weakens anew. The fallout from rising global bond yields is far worse in some smaller developed economies such as Canada, Australia, and New Zealand, where home price valuations are more stretched (Chart 11). Chart 11Rising Rates Will Weigh On Developed Economies With Pricey Housing Markets
Rising Rates Will Weigh On Developed Economies With Pricey Housing Markets
Rising Rates Will Weigh On Developed Economies With Pricey Housing Markets
January 2024 – Unemployment Starts to Rise: After moving sideways since March 2022, the US unemployment rate suddenly jumps 0.2 percentage points to 3.6%, with payrolls contracting for the first time since the start of the pandemic. The 22-month stretch of a flat unemployment rate is broadly in line with the historic average (Table 1). Table 1In Past Cycles, The Unemployment Rate Has Moved Sideways For Nearly Two Years Before A Recession Began
Dispatches From The Future: From Goldilocks To President DeSantis
Dispatches From The Future: From Goldilocks To President DeSantis
February 2024 – The US Recession Begins: Although there was considerable debate about whether the US was entering a recession at the time, in early 2025, the NBER would end up declaring that February 2024 marked the start of the recession. The 10-year yield falls back below 4% while the S&P 500 drops to 3,700. Lower bond yields are no longer protecting stocks. March 2024 – The Fed Remains in Neutral: Jay Powell says further rate hikes are unwarranted in light of the weakening economy, but with core inflation still running at 3.5%, the Fed is in no position to ease. April 2024 – The Global Recession Intensifies: The US unemployment rate rises to 4.7%. The economic downdraft is especially sharp in America’s neighbor to the north, where the Canadian housing market is in shambles. Back in June 2022, the Canadian 10-year yield was 21 basis points above the US yield. By April 2024, it is 45 basis points below. Europe and Japan also fall into recession. Commodity prices continue to drop, with Brent oil hitting $60/bbl. May 2024 – The Fed Cuts Rates: Reversing its position from just two months earlier, the Federal Reserve cuts rates for the first time since March 2020, lowering the Fed funds rate from 5% to 4.5%. The Fed funds rate will ultimately bottom at 2.5%, below the range of 3.5%-to-4% that most economists will eventually recognize as neutral. August 2024 – Republican National Convention: Unwilling to spend much of his own money on the campaign, and with most donations flowing to DeSantis, Trump’s bid to reclaim the White House fizzles. While the former president never formally bows out of the race, the last few months of his primary campaign end up being a nostalgia tour of his past accomplishments, interspersed with complaints about all the ways that he has been wronged. In the end, though, Trump makes a lasting imprint on the Republican party. During his acceptance speech, in typical Trumpian style, Ron DeSantis attacks Joe Biden for “eating ice cream while the economy burns” and declares, to thunderous applause, that “Americans are sick and tired of having woke nonsense hurled in their faces and then being dared to deny it at the risk of losing their jobs.” Chart 12The Dollar Is Very Overvalued
The Dollar Is Very Overvalued
The Dollar Is Very Overvalued
October 2024 – The Stock Market Hits Bottom: While the unemployment rate continues to rise for another 12 months, ultimately reaching 6.4%, the S&P troughs at 3,200. The 10-year Treasury yield settles at 3.1% before starting to drift higher. The US dollar, which began to weaken anew after the Fed starts cutting rates, enters a prolonged bear market. As in past cycles, the dollar is unable to defy the gravitational force from extremely stretched valuations (Chart 12). November 2024 – President DeSantis: Against the backdrop of rising unemployment, uncomfortably high inflation, and a sinking stock market, Ron DeSantis cruises to victory in the 2024 presidential election. Unlike Trump, DeSantis deemphasizes corporate tax cuts and deregulation during his presidency, focusing instead on cultural issues. With the Democrats still committed to progressive causes, big US corporations discover that for the first time in modern history, neither of the two major political parties are willing to champion their interests. Peter Berezin Chief Global Strategist peterb@bcaresearch.com Follow me on LinkedIn & Twitter Global Investment Strategy View Matrix
Dispatches From The Future: From Goldilocks To President DeSantis
Dispatches From The Future: From Goldilocks To President DeSantis
Special Trade Recommendations Current MacroQuant Model Scores
Dispatches From The Future: From Goldilocks To President DeSantis
Dispatches From The Future: From Goldilocks To President DeSantis
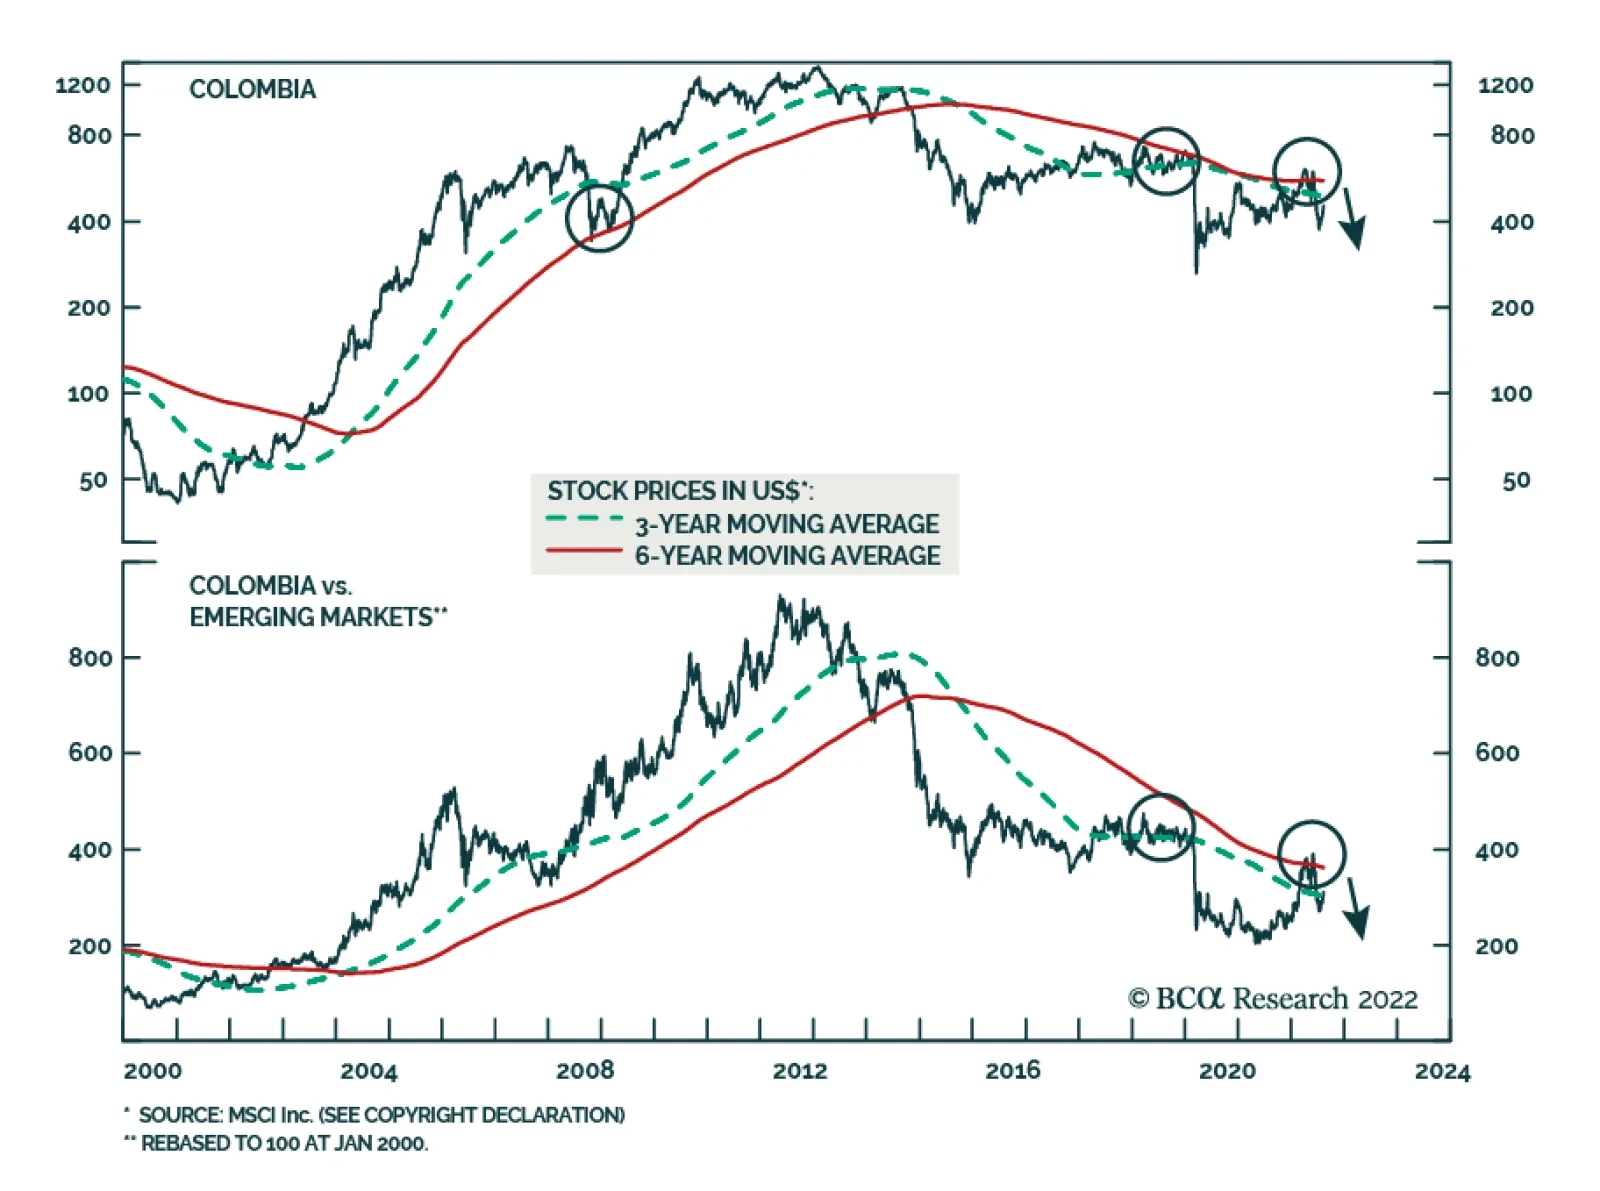
A combination of cyclical and structural forces will cause Colombian risk assets to plummet. Cyclically, the economy is overheating. Inflation is at a multi-decade high, the labor market is tight, and growth is hitting capacity constraints. In fact,…
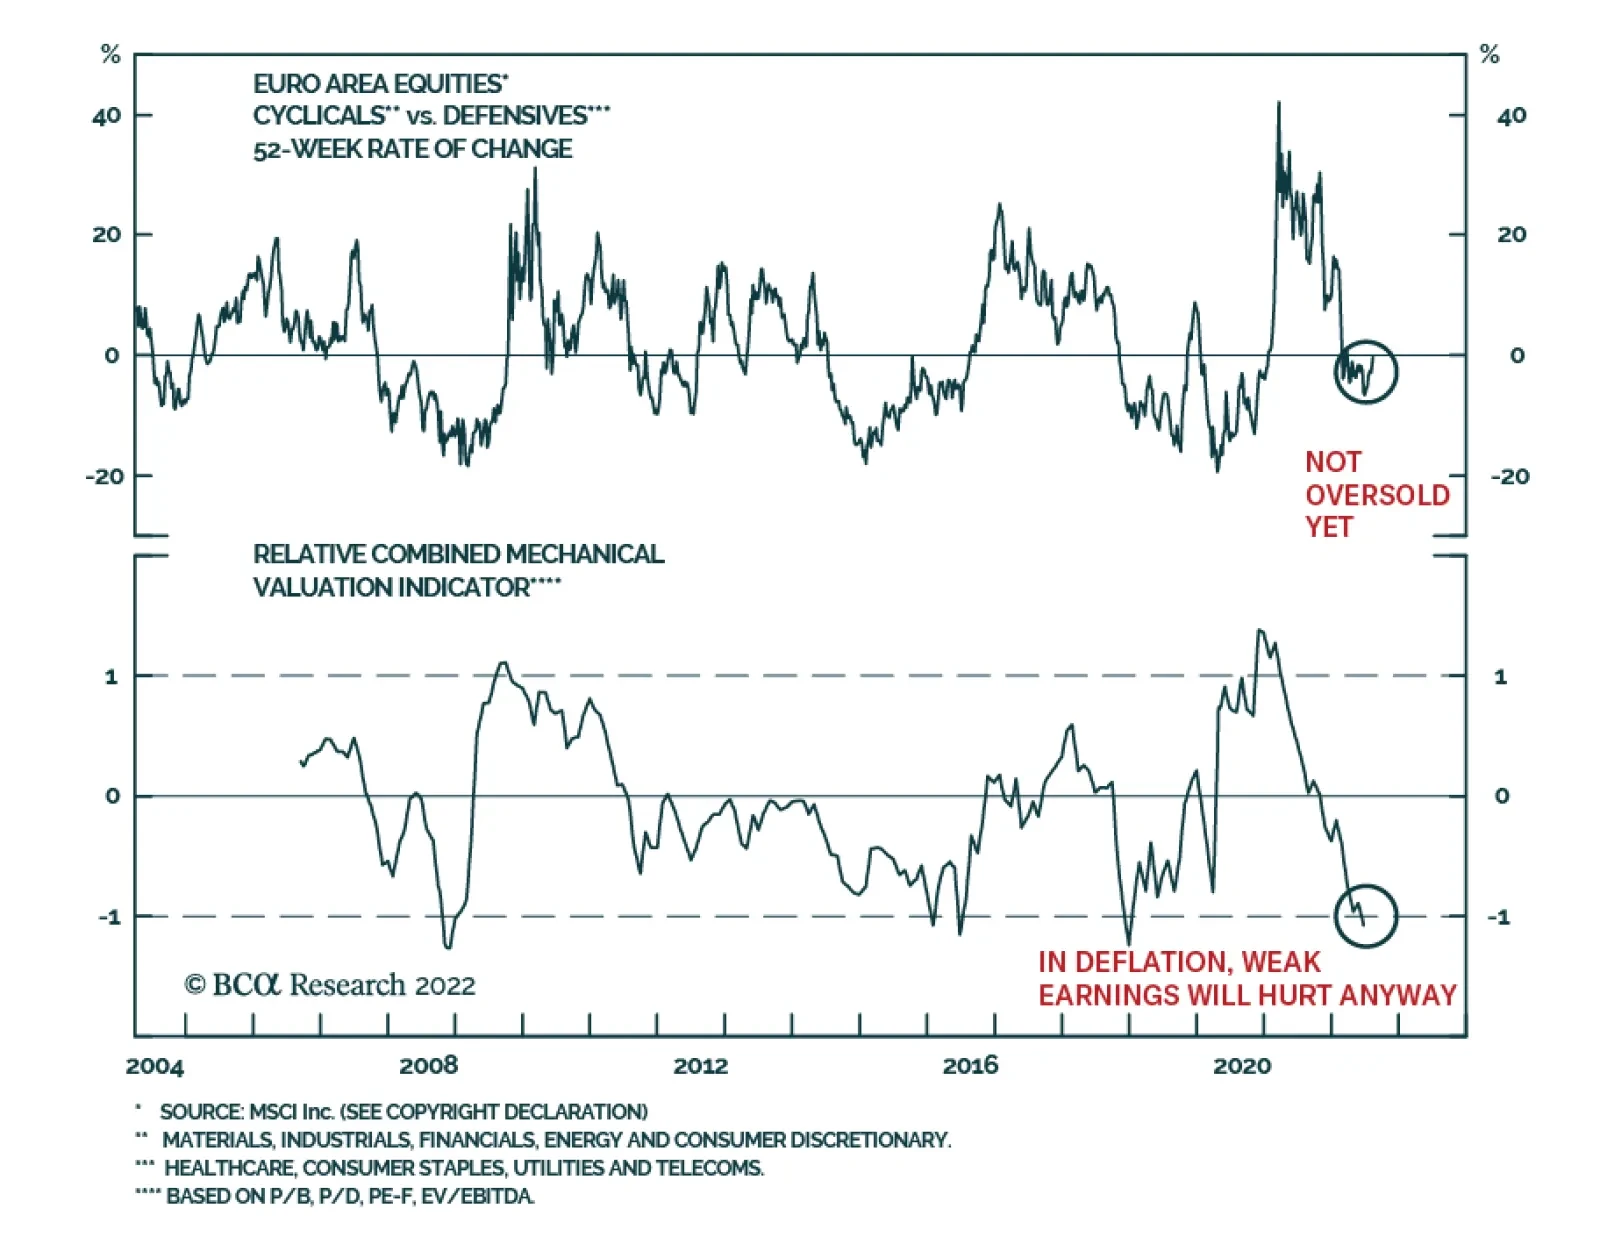
According to BCA Research’s European Investment Strategy service, the risk of deflation is greater than investors currently appreciate, which would be especially painful for European equities. European equities are more cyclical than their US counterparts,…
Executive Summary Then And Now
Then And Now
Then And Now
Investors are fixated on inflation; for now, the peak in US CPI is a positive for global stocks. However, this tailwind could easily transform into fear if inflation becomes deflation. The risk of deflation is greater than investors currently appreciate. In the early 1920s, the policy-driven inflation of World War One quickly morphed into a violent deflationary shock, which prompted a severe bear market. Even in the absence of the gold standard, many contemporary factors parallel those that were apparent before 1921. As a result, if commodity prices do not stabilize by year-end, investors will start to worry about deflation. This fear could prompt another sell-off in stocks, which would be particularly painful in Europe. Buy protection against deflation while it is cheap by selling EUR/JPY. Continue to favor defensive over cyclical equities. Bottom Line: The deflation risk for 2023 is greater than the investment community currently appreciates. While it remains a tail risk, it is an underpriced one. As a result, investors should use the current rebound in stocks to buy protection against deflation. Last week, the NASDAQ entered a new bull market following a decline in US inflation. European stocks have rallied too, albeit considerably less so, only rising 12.5% since their July 5th low. We have participated in this rally, having taken a more constructive view on European equities and other risk assets since our return from a trip visiting clients in Europe. Related Report European Investment StrategyQuestions From The Road The decline in US inflation is likely to remain a tailwind for global equities in the near future. The pandemic-related factors that spiked inflation in the past quarters are ebbing, and commodity inflation is decreasing. However, BCA’s US bond strategists expect this window to be short-lived. Labor market tightness and strong rents suggest that core CPI will stabilize around 4%. Nonetheless, as long as this window is open, stocks should remain bid. Investors expecting the demise of this current rebound continue to pin their view on stubborn inflation. While sticky inflation is an undeniable risk, it is a threat well understood by the market. However, another danger lurks, which is much less appreciated by investors: deflation. Investors currently underestimate its odds, when deflation could prove even more damaging to the market than sticky inflation. Remembering 1921 Chart 1The 1921 Bear Market
The 1921 Bear Market
The 1921 Bear Market
The most famous period of deflation in US economic history is the Great Depression. This is not, however, an appropriate parallel. The 1921 recession, at which time deflation hit a historical low of 16% per annum, is the more direct potential equivalent to today. It was accompanied by a 47% crash in the market that brought the Shiller P/E to five (Chart 1, top panel). At the end of WWI, the stock market experienced a rapid rally, with the Dow Jones jumping 58% from its low in March 1918 to its peak in November 1919. In that time frame, inflation was robust, with headline CPI averaging 16% between 1917 and 1920. Inflation was high because of a combination of factors: The war had forced a substantial loosening of fiscal policy with the Federal debt rising from 2.7% of GDP in 1916, before the entry of the US in the conflict, to 32.9% in 1921. The money supply experienced an unprecedented surge. At the beginning of the war, the US was a neutral party and European powers purchased large quantities of US goods. The resulting trade surplus pushed the US stock of gold from $1.5bn in 1914 to $2.6bn in 1920. Meanwhile, to help finance the government’s wartime expenditures, the newly created Federal Reserve expanded its banknote issuance and its claims on the banking system, which meant that Fed money rose from 21% of high-power money in April 1917 to 59% by November 1918. As a result of these two concurrent trends, the money supply doubled between 1916 and June 1920. The Fed was slow to remove the accommodation. The New York discount rate, which had fallen from 6% to 4% as war broke out in Europe, was only increased to 4.75% in the Spring of 1918 and stayed there until January 1920. The global economy was facing potent supply constraints. Large swaths of the European capital stock had been destroyed by the war, at the same time as the US economy had been redesigned to supply military goods, not consumer goods. As a result, inflation remained perky in 1919 and 1920, despite the end of the conflict. The fiscal and monetary supports suddenly ended in 1920, and the economy entered a vicious contraction that caused industrial production to plunge by 36% in 1921 and deflation to hit 16% (Chart 1, second and third panel). The fiscal easing suddenly shifted toward fiscal rectitude under the administration of Warren Harding, which greatly hurt domestic demand in 1921. Additionally, the inflow of gold from the war period morphed into outflow, as European powers enjoyed trade surpluses after their currencies fell 60% to 30% against the dollar between 1919 and the start of 1921. Moreover, the Fed increased the discount rate to 6% in 1920 and cut back the ratio of Fed money to gold, which caused M2 to swing from a 20% growth annual growth rate in Q1 1920 to a 7% contraction in Q3 1921. Simultaneously, corporate borrowing rates soared (Chart 1, fourth and fifth panel) The shock of stagflation and the associated deep output contraction caused the Dow Jones to collapse by 47% from late 1919 to August 1921. The market only stabilized once deflationary pressures ebbed, after the Fed had cut back the discount rate to 6% and around the same time when commodity prices began to firm up. By the end of the bear market, the reconstituted S&P 500 was trading at a cyclically-adjusted P/E of 5.2, and profits had fallen 81% from their 1916 peak. Bottom Line: The 1921 bear market was one of the most violent of the twentieth century. It was caused by an economic contraction and deep deflation that engulfed the US economy after the monetary and fiscal support of WWI had been removed. It only ended once deflationary forces began to ebb, after commodity prices found a floor. What Are The Parallels? At first glance, the parallels between 1921 and today seem negligible. Yes, inflation was raging in 1920, but deflation was a direct consequence of the gold standard that forced a rapid contraction in high-powered money, especially as gold fled the US in 1921. Chart 2Inflationary Fiscal And Monetary Policy
Inflationary Fiscal And Monetary Policy
Inflationary Fiscal And Monetary Policy
The similarities, however, are remarkable too. As a result of the COVID-19 pandemic, the economy was subjected to similar conditions as that of the US around WWI. The US economy witnessed a massive explosion of fiscal stimulus that pushed the Federal deficit from 5% in 2019, to 10% and 6% of GDP in 2020 and 2021, respectively. Moreover, the Federal Reserve generated extremely accommodative monetary conditions during and after the pandemic, when its balance sheet more than doubled and M2 grew by 41% (Chart 2). Additionally, the global economy has witnessed extraordinary supply-side disruptions that have added to inflationary pressures created by the extreme push to aggregate demand from fiscal and monetary policy.1 Chart 3The Money Supply Is Contracting
The Money Supply Is Contracting
The Money Supply Is Contracting
However, as in 1921, these forces are moving in the opposite direction. The fiscal thrust in the US was deeply negative in 2021 and 2022, when fiscal policy subtracted 4% and 2% from GDP growth, respectively. Moreover, the Fed’s policy tightening campaign is exceptionally aggressive. The Fed has increased rates by 2.25% in five months, and, based on the OIS curve, will push up interest rates by an additional 1.3% by the year-end (Chart 3). As a result, the recent contraction in M2 has further to run, even if the US economy is not constrained by its golden tethers (Chart 3, bottom panel). Between 1920 and 1921, investors had trouble judging how far the Fed would tolerate money contraction, which is again the case. Chart 4The Dollar Is Deflationary
The Dollar Is Deflationary
The Dollar Is Deflationary
While the gold standard has been dissolved, the recent wave of dollar strength creates deflationary forces that are similar to the bullion anchor in the 1920s. In the US, the strength in the dollar is limiting imported inflation. US import prices have rolled over, a trend likely to continue. Once converted in USD, Chinese PPI is almost contracting today, which is no small matter when China is the marginal supplier of goods for the world (Chart 4). A strong dollar is deflationary for the global economy, not just that of the US. A rising greenback hurts commodity prices and also tightens global liquidity conditions. Already, the dollar-based liquidity is contracting and EM FX reserves – which are a form of high-powered money similar to gold flows in the 1920s – are tanking, even after adjusting for the confiscation of Russian reserves in the wake of the Ukrainian conflict (Chart 4, bottom panel). To defend their currencies as the dollar rallies, EM central banks are forced to tighten policy, which hurts their domestic economies. This phenomenon is also visible in advanced economies. The weak euro has played a role inching the ECB toward aggressive rate hikes, while the Riksbank and the Swiss National Bank are both lifting interest rates to fight the inflationary impact of their currencies falling against the greenback. Global supply constraints are also defusing. The price of shipping commodities and goods around the world is declining meaningfully (Chart 5). Meanwhile, deliveries by suppliers are accelerating globally, which is contributing to a very rapid easing of our indicator of US Supply Constraints (Chart 5, bottom panel). Beyond these parallels with the early 1920s, demand is already weakening globally. Hampered by the current rise in living costs, households have begun to reduce the volume of goods they purchase, while companies have maintained robust production schedules. As a result, inventories are swelling around the world (Chart 6). Historically, the best cure for elevated inventories is lower prices. Chart 5Easing Supply Constraints
Easing Supply Constraints
Easing Supply Constraints
Chart 6Inventories And Weak Demand Are Deflationary
Inventories And Weak Demand Are Deflationary
Inventories And Weak Demand Are Deflationary
Bottom Line: There is no guarantee that deflation will become the prevailing force in the global economy. However, the risk is there—and this threat is woefully underappreciated by the investment community. At this current juncture, investors are welcoming lower commodity prices as they take the edge off ebullient inflation. However, if commodity prices do not stabilize by year-end, then investors will begin to worry about deflation. As the 1921 experience showed, deflation is very painful for stocks because it is so negative for profits. While the absence of the gold standard means that the deep deflation of 1921 is extremely unlikely, a period of deflation would nonetheless have a very negative impact on stocks, since they trade at 29 times cyclically-adjusted earnings, not 6.2 times, as was the case in November 1919. What Does This Mean For European Assets? A bout of global deflation would be especially painful for European equities. European equities are more cyclical than their US counterparts, which means that they often underperform when global growth is weak and global export prices of manufactured goods are falling (Chart 7). In other words, a deflationary shock in the US would be felt more acutely in the European market than in that of the US. Additionally, the euro would likely weaken further. Already, the European money impulse (the change in M1 flows) is contracting, which augurs poorly for European economic activity (Chart 8). The addition of a deflationary shock to the weak domestic backdrop would prompt further outflows from Europe, which would hurt the euro even more. Chart 7European Stocks Hate Deflationary Busts
European Stocks Hate Deflationary Busts
European Stocks Hate Deflationary Busts
Chart 8European Activity Is Weak
European Activity Is Weak
European Activity Is Weak
Chart 9A Value Trap?
A Value Trap?
A Value Trap?
Finally, with respect to the European cyclicals-to-defensive ratio, our Combined Mechanical Valuation Indicator suggests that European cyclicals have purged their overvaluation relative to their defensive counterparts (Chart 9). However, in previous deflationary outbreaks such as those in 1921 or the 1930s, cyclicals deeply underperformed defensive equities, no matter how cheap they became. This time around, we would expect the same outcome from cyclicals. Moreover, even if investors do not price in a deflationary risk early next year, European cyclicals remain hampered by the deceleration in the Chinese economy and the energy rationing that will hit Europe this winter. As a result, we continue to fade any rebound in the European cyclicals-to-defensives ratio. Bottom Line: Even if a deflationary shock is a risk that is more likely to emanate from the US, European markets will not be immune. The European economy is already weak, and the cyclicality of European equities creates greater vulnerability to deflation. Thus, while deflation in 2023 is a tail risk, investors should use the current rebound in global risk assets to buy protection cheaply. Selling EUR/JPY and favoring defensive European markets continue to make sense in light of this risk. Mathieu Savary, Chief European Strategist Mathieu@bcaresearch.com Footnotes 1Another similarity is that the Spanish Flu was decimating the population from late WWI to 1921. Tactical Recommendations Cyclical Recommendations Structural Recommendations
Listen to a short summary of this report. Executive Summary Significant Savings Provide A Moat Around Consumers
Significant Savings Provide A Moat Around Consumers
Significant Savings Provide A Moat Around Consumers
Three mega moats will protect the US economy over the next 12 months: 1) A high number of job openings; 2) Significant pent-up demand; and 3) Strong Fed credibility, which has kept bond yields from rising more than they otherwise would have in response to higher inflation. Ironically, a recession will only occur when investors start believing that a recession will not occur. Without more economic optimism, real yields will not rise into restrictive territory. The double-dip 1980/82 recessions, the 1990-91 recession, the 2001 recession, and the 2007-09 Great Recession were all preceded by an almost identical 21-to-23-month period of a flat unemployment rate. The unemployment rate has been fairly stable since March when it hit 3.6%. Given the three moats, we suspect that it will move sideways well into next year. At that point, the trajectory of inflation will determine the path for the unemployment rate and the broader economy. Inflation will fall significantly over the coming months thanks to lower food and energy prices and easing supply-chain pressures. However, falling inflation could sow the seeds of its own demise. As prices at the pump and the grocery store decline, real wage growth will turn positive. This will bolster consumer confidence, leading to more spending, and ultimately, a reacceleration in core inflation. Bottom Line: Stocks will rise over the next six months as recession risks abate, but then decline over the subsequent six months as it becomes clear that the Fed has no intention of cutting rates in 2023 and may even need to raise them further. On balance, we recommend a neutral exposure to global equities over a 12-month horizon. Don’t Bet on a US Recession Just Yet Many investors continue to expect the US economy to slip into recession this year. The OIS curve is discounting over 100 basis points in rate cuts starting in 2023, something that would probably only happen in a recessionary environment (Chart 1). In contrast to the consensus view, we think that the US will avoid a recession. This is good news for stocks in the near term because it means that earnings estimates, which have already fallen meaningfully this year, are unlikely to be cut any further (Chart 2). It is bad news for stocks down the road because it means that rather than cutting rates in 2023, the Fed could very well have to raise them. Chart 1Investors Expect Fed Tightening To Give Way To An Easing Cycle In 2023
Investors Expect Fed Tightening To Give Way To An Easing Cycle In 2023
Investors Expect Fed Tightening To Give Way To An Easing Cycle In 2023
Image
These two conflicting considerations lead us to expect stocks to rise over the next six months but then to fall over the subsequent six months. As such, we recommend an above-benchmark exposure to global equities over a short-term tactical horizon but a neutral exposure over a 12-month horizon. Three mega moats will protect the US economy over the next 12 months: 1) A high number of job openings; 2) Significant pent-up demand; and 3) Strong Fed credibility, which has kept bond yields from rising more than they otherwise would have in response to higher inflation. Let’s explore each in turn. Moat #1: A High Number of Job Openings While job openings have fallen over the past few months, they are still very high by historic standards (Chart 3). In June, there were 1.8 job openings for every unemployed worker, up from 1.2 in February 2020. At the peak of the dotcom bubble, there were 1.1 job openings per unemployed worker. A high job openings rate means that many workers who lose their jobs will have little difficulty finding new ones. This should keep the unemployment rate from rising significantly as labor demand cools on the back of higher interest rates. Some investors have argued that the ease with which companies can advertise for workers these days has artificially boosted reported job openings. We are skeptical of this claim. For one thing, it does not explain why the number of job openings has risen dramatically over the past two years since, presumably, the cost of job advertising has not changed that much. Moreover, the Bureau of Labor Statistics bases its estimates of job openings not on a tabulation of online job postings but on a formal survey of firms. For a job opening to be counted, a firm must have a specific position that it is seeking to fill within the next 30 days. This rules out general job postings for positions that may not exist. We are also skeptical of claims that increased layoffs could significantly push up “frictional” unemployment, a form of unemployment stemming from the time it takes workers to move from one job to another. There is a great deal of churn in the US labor market (Chart 4). In a typical month, net flows in and out of employment represent less than 10% of gross flows. In June, for example, US firms hired 6.4 million workers. On the flipside “separations” totaled 5.9 million in June, 71% of which represented workers quitting their jobs. Chart 3A High Level Of Job Openings Creates A Moat Around The Labor Market
A High Level Of Job Openings Creates A Moat Around The Labor Market
A High Level Of Job Openings Creates A Moat Around The Labor Market
Chart 4Labor Market Churn Tends To Increase As Unemployment Falls
Labor Market Churn Tends To Increase As Unemployment Falls
Labor Market Churn Tends To Increase As Unemployment Falls
In fact, total separations (and hence frictional unemployment) tend to rise when the labor market strengthens since that is when workers feel the most emboldened to quit. The reason that the unemployment rate increases during recessions is not because laid-off workers need time to find a new job but because there are simply not enough new jobs available. Fortunately, that is not much of a problem today. Moat #2: Significant Pent-Up Demand US households have accumulated $2.2 trillion (9% of GDP) of excess savings since the start of the pandemic, most of which reside in highly liquid bank deposits (Chart 5). Admittedly, most of these savings are skewed towards middle- and upper-income households who tend to spend less out of every dollar of income than the poor (Chart 6). Nevertheless, even the top 10% of income earners spend about 80% of their income (Chart 7). This suggests that most of these excess savings will be deployed, supporting consumption in the process. Chart 5Significant Savings Provide A Moat Around Consumers
Significant Savings Provide A Moat Around Consumers
Significant Savings Provide A Moat Around Consumers
Chart 6Unlike The Poor, Middle-To-Upper Income Households Still Hold Much Of Their Pandemic Savings
Unlike The Poor, Middle-To-Upper Income Households Still Hold Much Of Their Pandemic Savings
Unlike The Poor, Middle-To-Upper Income Households Still Hold Much Of Their Pandemic Savings
Some commentators have argued that high inventories will restrain production, even if consumer spending remains buoyant. We doubt that will happen. While retail inventories have risen of late, the retail inventory-to-sales ratio is still near all-time lows (Chart 8). Moreover, real retail sales have returned to their pre-pandemic trend (Chart 9A). Overall goods spending is still above trend, but has retraced two-thirds of its pandemic surge with little ill-effect on the labor market (Chart 9B). Chart 7Even The Wealthy Spend Most Of Their Income
Three Mega Moats Around The US Economy
Three Mega Moats Around The US Economy
Chart 8Retail Inventory-To-Sales Ratios Have Rebounded, But Remain Low
Retail Inventory-To-Sales Ratios Have Rebounded, But Remain Low
Retail Inventory-To-Sales Ratios Have Rebounded, But Remain Low
Chart 9ASpending On Goods Has Been Normalizing (I)
Spending On Goods Has Been Normalizing (I)
Spending On Goods Has Been Normalizing (I)
Chart 9BSpending On Goods Has Been Normalizing (II)
Spending On Goods Has Been Normalizing (II)
Spending On Goods Has Been Normalizing (II)
The latest capex intention surveys point to a deceleration in business investment (Chart 10). Nevertheless, we doubt that capex will decline by very much. Following the dotcom boom, core capital goods orders moved sideways for two decades (Chart 11). The average age of the nonresidential capital stock rose by over two years during this period (Chart 12). Excluding investment in intellectual property, business capex as a share of GDP is barely higher now than it was during the Great Recession. Not only is there a dire need to replenish the existing capital stock, but there is an urgent need to invest in new energy infrastructure and increased domestic manufacturing capacity. Chart 10Capex Intentions Have Dipped
Capex Intentions Have Dipped
Capex Intentions Have Dipped
Chart 11Capex Has Been Moribund For The Past Two Decades (I)
Capex Has Been Moribund For The Past Two Decades (I)
Capex Has Been Moribund For The Past Two Decades (I)
With regards to residential investment, the homeowner vacancy rate has fallen to a record low. The average age of US homes stands at 31 years, the highest since 1948. Chart 13 shows that housing activity has weakened somewhat less than one would have expected based on the significant increase in mortgage rates in the first six months of 2022. Given the recent stabilization in mortgage rates, the chart suggests that housing activity should rebound by the end of the year. Chart 12Capex Has Been Moribund For The Past Two Decades (II)
Capex Has Been Moribund For The Past Two Decades (II)
Capex Has Been Moribund For The Past Two Decades (II)
Chart 13Housing Activity Should Rebound On The Back Of Low Vacancy Rates, An Aging Housing Stock, And Stabilizing Mortgage Rates
Housing Activity Should Rebound On The Back Of Low Vacancy Rates, An Aging Housing Stock, And Stabilizing Mortgage Rates
Housing Activity Should Rebound On The Back Of Low Vacancy Rates, An Aging Housing Stock, And Stabilizing Mortgage Rates
Moat #3: Strong Fed Credibility Even though headline inflation is running at over 8% and most measures of core inflation are in the vicinity of 5%-to-6%, the 10-year bond yield still stands at 2.87%. Two things help explain why bond yields have failed to keep up with inflation. First, investors regard the Fed’s commitment to bringing down inflation as highly credible. The TIPS market is pricing in a rapid decline in inflation over the next two years (Chart 14). The widely-followed 5-year, 5-year forward TIPS inflation breakeven rate is still near the bottom end of the Fed’s comfort zone. Chart 14AWell-Anchored Long-Term Inflation Expectations Have Kept Bond Yields From Rising More Than They Would Have Otherwise
Three Mega Moats Around The US Economy
Three Mega Moats Around The US Economy
Chart 14BWell-Anchored Long-Term Inflation Expectations Have Kept Bond Yields From Rising More Than They Would Have Otherwise
Well-Anchored Long-Term Inflation Expectations Have Kept Bond Yields From Rising More Than They Would Have Otherwise
Well-Anchored Long-Term Inflation Expectations Have Kept Bond Yields From Rising More Than They Would Have Otherwise
Households tend to agree with the market’s assessment. While households expect inflation to average over 5% over the next 12 months, they expect it to fall to 2.9% over the long term. As Chart 15 illustrates, expected inflation 5-to-10 years out in the University of Michigan survey is in line with where it was between the mid-1990s and 2015. This is a major difference from the early 1980s, when households expected inflation to remain near 10%. Back then, Paul Volcker had to engineer a deep recession in order to bring long-term inflation expectations back down to acceptable levels. Such pain is unlikely to be necessary today. Chart 15Households Expect Inflation To Come Back Down
Households Expect Inflation To Come Back Down
Households Expect Inflation To Come Back Down
Chart 16Markets Think That The Real Neutral Rate Is Low
Markets Think That The Real Neutral Rate Is Low
Markets Think That The Real Neutral Rate Is Low
The second factor that is suppressing bond yields is the market’s perception that the real neutral rate of interest is quite low. The 5-year, 5-year TIPS yield – a good proxy for the market’s estimate of the real neutral rate – currently stands at 0.40%, well below its pre-GFC average of 2.5% (Chart 16). Ironically, a recession will only occur when investors start believing that a recession will not occur. Without more economic optimism, real yields will not rise into restrictive territory. When Will the Moats Dry Up? The US unemployment rate is a mean-reverting series. When unemployment is very low, it is more likely to rise than to fall. And when the unemployment rate starts rising, it keeps rising. In the post-war era, the US has never avoided a recession when the unemployment rate has risen by more than one-third of a percentage point over a three-month period (Chart 17). Chart 17When Unemployment Starts Rising, It Usually Keeps Rising
When Unemployment Starts Rising, It Usually Keeps Rising
When Unemployment Starts Rising, It Usually Keeps Rising
With the unemployment rate falling to a 53-year low of 3.5% in July, it is safe to say that we are in the late stages of the business-cycle expansion. When will the unemployment rate move decisively higher? While it is impossible to say with certainty, history does offer some clues. Remarkably, the double-dip 1980/82 recessions, the 1990-91 recession, the 2001 recession, and the 2007-09 Great Recession were all preceded by an almost identical 21-to-23-month period of a flat unemployment rate (Chart 18 and Table 1). Coincidentally, the Covid-19 recession was also preceded by 22 months of a stable unemployment rate. To the extent that the economy was not showing much strain going into the pandemic, it is reasonable to assume that the unemployment rate would have continued to move sideways for most of 2020 had the virus never emerged. Chart 18The Bottoming Phase Of The Unemployment Rate Has Only Begun
The Bottoming Phase Of The Unemployment Rate Has Only Begun
The Bottoming Phase Of The Unemployment Rate Has Only Begun
Image
Inflation is the Key The unemployment rate has been fairly stable since March when it hit 3.6%. Given the three moats discussed in this report, we suspect that it will move sideways well into next year. At that point, the trajectory of inflation will determine the path of the unemployment rate and the broader economy. As this week’s better-than-expected July CPI report foreshadows, inflation will fall significantly over the coming months, thanks to lower food and energy prices and easing supply-chain pressures. The GSCI Agricultural Index has dropped 24% from its highs and is now below where it was before Russia’s invasion of Ukraine (Chart 19). Retail gasoline prices have fallen 19% since June, with the futures market pointing to a substantial further decline over the next 12 months. In general, there is an extremely strong correlation between the change in gasoline prices and headline inflation (Chart 20). Supplier delivery times have also dropped sharply (Chart 21). Chart 19Agricultural Prices Have Started Falling
Agricultural Prices Have Started Falling
Agricultural Prices Have Started Falling
Chart 20Headline Inflation Tends To Track Gasoline Prices
Headline Inflation Tends To Track Gasoline Prices
Headline Inflation Tends To Track Gasoline Prices
Falling inflation could sow the seeds of its own demise, however. As prices at the pump and the grocery store decline, real wage growth will turn positive. That will bolster consumer confidence, leading to more spending (Chart 22). Core inflation, which is likely to decrease only modestly over the coming months, will start to accelerate in 2023, prompting the Fed to turn hawkish again. Stocks will falter at that point. Chart 21Supplier Delivery Times Have Declined
Supplier Delivery Times Have Declined
Supplier Delivery Times Have Declined
Chart 22Falling Inflation Will Boost Real Wages And Consumer Confidence
Falling Inflation Will Boost Real Wages And Consumer Confidence
Falling Inflation Will Boost Real Wages And Consumer Confidence
Peter Berezin Chief Global Strategist peterb@bcaresearch.com Follow me on LinkedIn and Twitter Global Investment Strategy View Matrix
Three Mega Moats Around The US Economy
Three Mega Moats Around The US Economy
Special Trade Recommendations Current MacroQuant Model Scores
Three Mega Moats Around The US Economy
Three Mega Moats Around The US Economy
Roulette With A Five-Shooter
Executive Summary With the fourth Taiwan Strait crisis materializing, the odds of a major war between the world’s great powers have gone up. Our decision trees suggest the odds are around 20%, or double where they stood from the Russian war in Ukraine alone. The world is playing “Russian roulette” … with a five-round revolver. Going forward, our base case is for Taiwan tensions to flatten out (but not fall) after the US and Chinese domestic political events conclude this autumn. However, if China escalates tensions after the twentieth national party congress, then the odds of an invasion will rise significantly. If conflict erupts in Taiwan, then the odds of Russia turning even more aggressive in Europe will rise. Iran is highly likely to pursue nuclear weapons. Not A Lot Of Positive Catalysts In H2 2022
Roulette With A Five-Shooter
Roulette With A Five-Shooter
Tactical Recommendation Inception Date Return LONG US 10-YEAR TREASURY 2022-04-14 1.3% LONG GLOBAL DEFENSIVES / CYCLICALS EQUITIES 2022-01-20 13.8% Bottom Line: Investors should remain defensively positioned at least until the Chinese party congress and the US midterm election conclude this fall. Geopolitical risk next year will depend on China’s actions in the Taiwan Strait. Feature Chart 1Speculation Rising About WWIII
Roulette With A Five-Shooter
Roulette With A Five-Shooter
Pessimists who pay attention to world events have grown concerned in recent years about the risk that the third world war might break out. The term has picked up in online searches since 2019, though it is the underlying trend of global multipolarity, rather than the specific crisis events, that justifies the worry (Chart 1).1 What are the odds of a major war between the US and China, or the US and Russia? How might that be calculated? In this report we present a series of “decision trees” to formalize the different scenarios and probabilities. If we define WWIII as a war in which the United States engages in direct warfare with either Russia or China, or both, then we arrive at a 20% chance that WWIII will break out in the next couple of years! Those are frighteningly high odds – but history teaches that these odds are not unrealistic and that investors should not be complacent. Political scientist Graham Allison has shown that the odds of a US-China war over the long term are about 75% based on historical analogies. The takeaway is that nations will have to confront this WWIII risk and reject it for the global political environment to improve. Most likely they will do so as WWIII, and the risk of nuclear warfare that it would bring, constitutes the ultimate constraint. But the current behavior of the great powers suggests that they have not recognized their constraints yet and are willing to continue with brinksmanship in the short term. The Odds Of A Chinese Invasion Of Taiwan The first question is whether China will invade Taiwan. In April 2021 we predicted that the fourth Taiwan Strait crisis would occur within 12-24 months but that it would not devolve into full-scale war. This view is now being tested. In Diagram 1 we provide a decision tree to map out China’s policy options toward Taiwan and assign probabilities to each option. Diagram 1Decision Tree For Fourth Taiwan Strait Crisis (Next 24 Months)
Roulette With A Five-Shooter
Roulette With A Five-Shooter
While China has achieved the capability to invade Taiwan, the odds of failure remain too high, especially without more progress on its nuclear triad. Hence we give only a 20% chance that China will mobilize for invasion immediately. Needless to say any concrete signs that China is planning an invasion should be taken seriously. Investors and the media dismissed Russia’s military buildup around Ukraine in 2021 to their detriment. At the same time, there is a good chance that the US and China are merely testing the status quo in the Taiwan Strait, which will be reinforced after the current episode. After all, this crisis was the fourth Taiwan Strait crisis – none of the previous crises led to war. If Presidents Biden and Xi Jinping are merely flexing their muscles ahead of important domestic political events this fall, then they have already achieved their objective. No further shows of force are necessary on either side, at least for the next few years. We give 40% odds to this scenario, in which the past week’s tensions will linger but the status quo is reinforced. In that case, the structural problem of the Taiwan Strait would flare up again sometime after the US and Taiwanese presidential elections in 2024, i.e. outside the time frame of the diagram. Unfortunately we are pessimistic over the long run and would give high probability to war in Taiwan. For that reason, we give equal odds (40%) to a deteriorating situation within the coming two years. If China expands drills and sanctions after the party congress, after Xi has consolidated power, then it will be clear that Xi is not merely performing for his domestic audience. Similarly if the Biden administration continues pushing for tighter high-tech export controls against China after the midterm election, and insists that US allies and partners do the same, then the US implicitly believes that China is preparing some kind of offensive operation. The danger of invasion would rise from 20% to 40%. Even in that case, one should still believe that crisis diplomacy between the US and China will prevent full-scale war in 2023-24. But the risk of miscalculation would be very high. The last element of this decision tree holds that China will prefer “gray zone tactics” or hybrid warfare rather than conventional amphibious invasion of the kind witnessed in WWII. The reasons are several. First, amphibious invasions are the most difficult military operations. Second, Chinese forces are inexperienced while the US and its allies are entrenched. Third, hybrid warfare will sow division among the US allies about how best to respond. Fourth, Russia has demonstrated several times over the past 14 years that hybrid warfare works. It is a way of maximizing strategic benefits and minimizing costs. The world knows how the West reacts to small invasions: it uses economic sanctions. It does not yet know how the West reacts to big invasions. So China will be incentivized to take small bites. And yet in Taiwan’s case those tactics may not be sustainable. Our Taiwan decision tree does not account for the likelihood that a hybrid war or “proxy war” will evolve into a major war. But that likelihood is in fact high. So we are hardly overrating the risk of a major US-China war. Bottom Line: Over the next two years, the subjective odds of a US-China proxy war over Taiwan are about 32% while the odds of a direct US-China war are about 4%. The true test comes after Xi Jinping consolidates power at this fall’s party congress. We expect Xi to focus on rebooting the economy so we continue to favor emerging Asian markets excluding China and Taiwan. The Odds Of Russian War With NATO The second question is whether Russia’s war in Ukraine will morph into a broader war with the West. The odds of a major Russia-West war are greater in this case than in China’s, as a war is already raging, whereas tensions in the Taiwan Strait are merely shadow boxing so far. An investor’s base case should hold that the Ukraine war will remain contained in Ukraine, as Europeans do not want to fight a devastating war with Russia merely because of the Donbas. But things often go wrong in times of war. The critical question is whether Russia will attack any NATO members. That would trigger Article Five of the alliance’s treaty, which holds that “an armed attack against one or more [alliance members] in Europe or North America shall be considered an attack against them all,” justifying the use of armed force if necessary to restore security. Since Russia’s invasion of Ukraine this year, President Biden has repeatedly stated that the US will “defend every inch of NATO territory,” including the Baltic states of Latvia, Lithuania, and Estonia, which joined NATO in 2004. This is not a change of policy but it is the US’s red line and highly likely to be defended. Hence it is a major constraint on Russia. In Diagram 2 we map out Russia’s different options and assign probabilities. Diagram 2Decision Tree For Russia-Ukraine War (Next 24 Months)
Roulette With A Five-Shooter
Roulette With A Five-Shooter
We give 55% odds that Russia will declare victory after completing the conquest of Ukraine’s Donbas region and the land bridge to Crimea. It will start looking to legitimize its conquests by means of some diplomatic agreement, i.e. a ceasefire. This is our base case for 2023. There is evidence that Russia is already starting to move toward diplomacy.2 The reason is that Russia’s economy is suffering, global commodity prices are falling, Russian blood and treasure are being spent. President Putin will have largely achieved his goal of hobbling Ukraine as long as he controls the mouth of the Dnieper river and the rest of the territory he has invaded. Putin needs to seal his conquests and try to salvage the economy and society. The sooner the better for Russia, so that Europe can be prevented from forming a consensus and implementing a full natural gas embargo in the coming years. However, there is a risk that Putin’s ambition gets the better of him. So we give 35% odds that the invasion expands to southwestern Ukraine, including the strategic port city of Odessa, and to eastern Moldova, where Russian troops are stationed in the breakaway region of Transdniestria. This new campaign would render Ukraine fully landlocked, neutralize Moldova, and give Russia greater maritime access. But it would unify the EU, precipitate a natural gas embargo, and weaken Russia to a point where it could become desperate. It could retaliate and that retaliation could conceivably lead to a broader war. We allot only a 7% chance that Putin attacks Finland or Sweden for attempting to join NATO. Stalin failed in Finland and Putin’s army could not even conquer Kiev. The UK has pledged to support these states, so an attack on them will most likely trigger a war with NATO. A decision to attack Finland would only occur if Russia believed that NATO planned to station military bases there – i.e. Russia’s declared red line. Any Russian attack on the Baltic states is less likely because they are already in NATO. But there is some risk it could happen if Putin grows desperate. We put the risk of a Baltic invasion at 3%. In short, if Russia uses its energy stranglehold on Europe not to negotiate a favorable ceasefire but rather to expand its invasions, then the odds of a broader war will rise. Bottom Line: The result is a 55% chance of de-escalation over the next 24 months, a 35% chance of a small escalation (e.g. Odessa, Moldova), and a 10% chance of major escalation that involves NATO members and likely leads to a NATO-Russia war. Tactically, investors should buy developed-market European currency and assets if the global economy rebounds and Russia makes a clear pivot to halting its military campaign and pursuing ceasefire talks. Cyclically, there needs to be a deeper US-Russia understanding for a durable bull market in European assets. The Odds Of US-Israeli Strikes On Iran The third geopolitical crisis taking place this year could be postponed as we go to press – if President Biden and Ayatollah Ali Khamenei agree to rejoin the 2015 US-Iran nuclear deal. But we remain skeptical. The Biden administration wants to rejoin the 2015 nuclear deal and free up about one million barrels per day of Iranian crude oil to reduce prices at the pump before the midterm election. US grand strategy also wants to engage with Iran and stabilize the Middle East so that the US can pivot to Asia. The EU is proposing the deal since it has even greater need for Iranian resources and wants to prevent Iran from getting nuclear weapons. Russia and China are also supportive as they want to remove US sanctions for trading with Iran and do not necessarily want Iran to get nukes. There is only one problem: Iran needs nuclear weapons to ensure its regime’s survival over the long run. The question is whether Khamenei is willing to authorize a deal with the Americans a second time. The first deal was betrayed at great cost to his regime. President Ebrahim Raisi, who hopes to replace the 83-year-old Khamenei before long, is surely staunchly opposed to wagering his career and personal security on whether Republicans win the 2024 election. Iran has already achieved nuclear breakout capacity – it has enough 60%-enriched uranium to construct nuclear devices – and it is unclear why it would achieve this capacity if it did not ultimately seek to obtain a nuclear deterrent. Especially given that it may someday need to protect its regime from military attacks by the US and its allies. However, our conviction level is medium because President Biden wants to lift sanctions and can do so unilaterally. The Biden administration has not taken any of the preliminary actions to make a deal come together but that could change.3 There is a good cyclical case to be made for short-term, stop-gap deal. According to BCA’s Commodity & Energy Strategist Bob Ryan, Saudi Arabia and the UAE only have about 1.5 million barrels of spare oil production capacity between them. The EU oil embargo and western sanctions on Russia will force about two million barrels per day to be stopped, soaking up most of OPEC’s capacity. Hence the Biden administration needs the one million barrels that Iran can bring. We cannot deny that the Iranians may sign a deal to allow Biden to lift sanctions. That would benefit their economy. They could allow nuclear inspectors while secretly shifting their focus to warhead and ballistic missile development. While Iran will not give up the long pursuit of a nuclear deterrent, it is adept at playing for time. Still, Iran’s domestic politics do not support a deal – and its grand strategy only supports a deal if the US can provide credible security guarantees, which the US cannot do because its foreign policy is inconsistent. US grand strategy supports a deal but only if it is verifiable, i.e. not if Iran uses it as cover to pursue a bomb anyway. Iran has not capitulated after three years of maximum US sanctions, a pandemic, and global turmoil. And Iran sees a much greater prospect of extracting strategic benefits from Russia and China now that they have turned aggressive against the West. Moscow and Beijing can be strategic partners due to their shared acrimony toward Washington. Whereas the US can betray the Raisi administration just as easily as it betrayed the Rouhani administration, with the result that the economy would be whipsawed again and the Supreme Leader and the political establishment would be twice the fools in the eyes of the public. Diagram 3 spells out Iran’s choices. Diagram 3Decision Tree For Iran Nuclear Crisis (Next 24 Months)
Roulette With A Five-Shooter
Roulette With A Five-Shooter
If negotiations collapse (50% odds), then Iran will make a mad dash for a nuclear weapon before the US and Israel attack. If the US and Iran agree to a deal (40%), then Iran might comply with the deal’s terms through the 2024 US election, removing the issue from investor concerns for now. But their long-term interest in obtaining a nuclear deterrent will not change and the conflict will revive after 2024. If talks continue without resolution (10%), Iran will make gradual progress on its nuclear program without the restraints of the deal (though it may not need to make a mad dash). In short, Russia and China need Iran regardless of whether it freezes its nuclear program, whereas the US and Israel will form a balance-of-power Abraham Alliance to contain Iran even if it does freeze its nuclear program. Bottom Line: Investors should allot 40% odds to a short-term, stop-gap US-Iran nuclear deal. The oil price drop would be fleeting. Long-term supply will not be expanded because the US cannot provide Iran with the security guarantees that it needs to halt its nuclear program irreversibly. The Odds Of World War III Now comes the impossible part, where we try to put these three geopolitical crises together. In what follows we are oversimplifying. But the purpose is to formalize our thinking about the different players and their options. Diagram 4 begins with our conclusions regarding the China/Taiwan conflict, adjusts the odds of a broader Russian war as a result, and adds our view that Iran is highly likely to pursue nuclear weapons. Again the time frame is two years. Diagram 4Decision Tree For World War III (Next 24 Months)
Roulette With A Five-Shooter
Roulette With A Five-Shooter
The alternate conflict scenario to WWIII consists of “limited wars” – a dangerous concept that refers to hybrid and proxy wars in which the US is not involved, or only involved indirectly. Or it could be a conflict with Iran that does not involve Russia and China. We begin with China because China is the most capable and most ambitious global power today. China’s strategic rise is upsetting the global order and challenging the United States. We also start with China because we have some evidence this year that Russia does not intend to expand the war beyond Ukraine. Either China takes further aggressive action in Taiwan – creating a unique opportunity for Russia to take greater risks – or not. If not, then the odds of WWIII fall precipitously over the two-year period. This scenario is our base case. But if China attacks Taiwan and the US defends Taiwan, we give a high probability to Russia invading the Baltics. If China stages hybrid attacks and the US only supports Taiwan indirectly, then we increase the odds of Russian aggression only marginally. The result is 20% odds of WWIII, i.e. a direct war between the US and Russia, or China, or both. Whether this war could remain limited is debatable. War gaming since 1945 shows that any war between major nuclear powers will more likely escalate than not. But nuclear weapons bring mutually assured destruction, the ultimate constraint. The nuclear escalation risk is why we round down the probability of WWIII in our decision trees. The more likely 59% risk scenario of “limited wars” may seem like a positive outcome but it includes major increases in geopolitical tensions from today’s level, such as a Chinese hybrid war against Taiwan. Bottom Line: According to this exercise the odds of WWIII could be as high as 20%. This is twice the level in our Russia decision tree, which is appropriate given that our Taiwan crisis forecast has materialized. The critical factor is whether Beijing continues escalating the pressure on Taiwan after the party congress this fall. That could unleash a dangerous chain reaction. The global economy and financial markets still face downside risk from geopolitics but 2023 could see improvements if Russia moves toward a ceasefire and China delays action against Taiwan to reboot its economy. Investment Takeaways When Russia invaded Ukraine earlier this year, our colleague Peter Berezin, Chief Global Strategist, argued that the odds of nuclear Armageddon were 10%. At very least this is a reasonable probability for the odds that Russia and NATO come to blows. Now the expected Taiwan crisis has materialized. We guess that the odds of a major war have doubled to 20%. The corollary is an 80% chance of a better outcome. Analytically, we still see Russia as pursuing a limited objective – neutralizing Ukraine so that it cannot be prosperous and militarily powerful – while China also pursues a limited objective – intimidating Taiwan so that it pursues subordination rather than nationhood. Unless these objectives change, we are still far from World War III. The world can live with a hobbled Ukraine and a subordinated Taiwan. However, there can be no denying that the trajectory of global affairs since the 2008 global financial crisis has followed a pathway uncomfortably similar to the lead up to World War II: financial crisis, economic recession, deflation, domestic unrest, currency depreciation, trade protectionism, debt monetization, military buildup, inflation, and wars of aggression. If roulette is the game, then the odds of a global war are one-sixth or 17%, not far from the 20% outcome of our decision trees. Even assuming that we are alarmist, the fact that we can make a cogent, formal argument that the odds of WWIII are as high as 20% suggests that investors should wait for the current tensions over Ukraine and Taiwan to decrease before making large new risky bets. A simple checklist shows that the global macro and geopolitical context is gloomy (Table 1). We need improvement on the checklist before becoming more optimistic. Table 1Not A Lot Of Positive Catalysts In H2 2022
Roulette With A Five-Shooter
Roulette With A Five-Shooter
Chart 2Stay Defensively Positioned In H2 2022
Stay Defensively Positioned In H2 2022
Stay Defensively Positioned In H2 2022
Specifically what investors need is to be reasonably reassured that Russia will not expand the war to NATO and that China will not invade Taiwan anytime soon. This requires a new diplomatic understanding between the Washington and Moscow and Washington and Beijing that forestalls conflict. That kind of understanding can only be forged in crisis. The relevant crises are under way but not yet complete. There is likely more downside for global equity investors before war risks are dispelled through the usual solution: diplomacy. Wait for concrete and credible improvements to the global system before taking a generally overweight stance toward risky assets. Favor government bonds over stocks, US stocks over global stocks, defensive sectors over cyclicals, and disfavor Chinese and Taiwanese currency and assets (Chart 2). Matt Gertken Chief Geopolitical Strategist mattg@bcaresearch.com Footnotes 1 See Graham Allison, Destined For War: Can America and China Escape Thucydides’s Trap? (New York: Houghton Miffin Harcourt, 2017). 2 For example, the Turkish brokered deal to ship grain out of Odessa, diplomatic support for rejoining the 2015 Iran nuclear deal, referendums in conquered territories like Kherson, and attempts to build up leverage in arms reduction talks. Cutting off Europe’s energy is ultimately a plan to coerce Europe into settling a ceasefire favorable for Russia. 3 Iran is still making extraneous demands – most recently that the IAEA drop a probe into how certain manmade uranium particles appeared in undisclosed nuclear sites in Iran. The IAEA has not dropped this probe and its credibility will suffer if it does. Meanwhile Biden is raising not lowering sanctions on Iran, even though sanction relief is a core Iranian demand. Biden has not removed the Iranian Revolutionary Guards or the Qods Force from the terrorism list. None of these hurdles are prohibitive but we would at least expect to see some movement before changing our view that a deal is more likely to fail than succeed. Strategic Themes Open Tactical Positions (0-6 Months) Open Cyclical Recommendations (6-18 Months) Regional Geopolitical Risk Matrix "Batting Average": Geopolitical Strategy Trades ()
Executive Summary Unit Labor Costs, Not Oil Prices, Are The Key To US Core Inflation
Unit Labor Costs, Not Oil Prices, Are The Key To US Core Inflation
Unit Labor Costs, Not Oil Prices, Are The Key To US Core Inflation
Inflation is not about oil, food or used car prices. Looking at prices of individual components of a consumer basket is akin to missing the forest for the trees. Despite the latest drop in US headline inflation, various core CPI measures continue trending up and registered considerable month-on-month rises in July. Wages and, more specifically, unit labor costs are the true measure of genuine and persistent inflation. US wage growth is very elevated, and the pace of unit labor cost gains has surged to a 40-year high. The conditions for sustainable and persistent disinflation in the US are not yet present. US inflation will prove to be much stickier and more entrenched than many market participants presently believe. The recovery in China will be U- rather than V-shaped, with risks tilted to the downside. The mainland’s property market breakdown is structural, not cyclical. Excesses are very large, and problems are snowballing, rendering the enacted policy stimulus insufficient. Bottom Line: US core inflation lingering above 4% and easing financial conditions will compel the Fed to continue hiking rates. This will cap global risk asset prices and put a floor under the US dollar. We continue to recommend an underweight allocation to EM in global equity and credit portfolios. Consistently, we are also reluctant to chase EM currencies higher. Feature The bullish macro narrative circulating in the investment community is that conditions for a cyclical rally in global risk assets have fallen into place. Specifically: US inflation will drop sharply as US growth has crested and commodity prices have plunged; The Fed is nearing the end of a tightening cycle; China has stimulated sufficiently, and its economy is about to recover, which will boost economic conditions among its trading partners in general and EM in particular. These assumptions along with the fact that the S&P 500 index has found support at a 3-year moving average – a proven line of defense – suggest that US share prices have likely bottomed (Chart 1). Are we witnessing déjà vu of the 2011, 2016, 2018 and 2020 market bottoms? Chart 1Déjà Vu? Is 2022 Like The 2011, 2016 And 2018 Bottoms In The S&P 500?
Déjà Vu? Is 2022 Like The 2011, 2016 And 2018 Bottoms In The S&P 500?
Déjà Vu? Is 2022 Like The 2011, 2016 And 2018 Bottoms In The S&P 500?
We have reservations about all of the above fundamental conjectures. We elaborate on these reservations in this report. On the whole, we contend that the current environment is different, and the roadmaps of all post-2009 equity market bottoms are not necessarily currently applicable. BCA’s Emerging Markets Strategy team believes that (1) US consumer price inflation is much more entrenched and will prove stickier than is commonly believed; and (2) the Chinese property market’s breakdown is structural, not cyclical; hence, the recovery will not gain traction easily. Is This The End Of The US Inflation Problem? Not Quite This week’s US inflation data confirmed that headline CPI inflation has probably peaked: prices in several categories plunged. However, inflation is not about oil, food or used car prices. Chart 2 reveals that historically there have been several episodes whereby core inflation remains elevated despite plunging oil prices. Chart 2US Core Inflation Does Not Always Follow Oil Prices
US Core Inflation Does Not Always Follow Oil Prices
US Core Inflation Does Not Always Follow Oil Prices
Looking at price dynamics among the individual components of the CPI basket is akin to missing the forest for the trees. Inflation is a very inert and persistent phenomenon. Underlying inflation does not change its direction often and/or quickly. That is why we believe that it is premature to celebrate the end of the US inflation problem. A few observations on this matter: Despite the drop in US headline inflation, various core CPI measures − like trimmed-mean CPI, median CPI and core sticky CPI − all continue trending up and registered substantial month-on-month rises in July (Chart 3). The range of core inflation based on these annual and month-month annualized rates is between 4-7%. In brief, the rate of genuine/sticky inflation is well above the Fed’s 2% target. Given its unconditional commitment to bringing inflation down to 2%, the Fed will continue hiking interest rates ceteris paribus. Chart 3US Core CPI Measures Are Still Very High
US Core CPI Measures Are Still Very High
US Core CPI Measures Are Still Very High
Chart 4US Wages Growth Has Been Surging
US Wages Growth Has Been Surging
US Wages Growth Has Been Surging
We continue to emphasize that wages and, more specifically, unit labor costs are the true measures of persistent and genuine inflation. We have written at length about why wages and unit labor costs are more important to inflation than oil or food prices. US wage growth is very elevated and is accelerating (Chart 4). Unit labor costs, calculated as hourly wages divided by productivity, have also been surging to a 40-year high (Chart 5, top panel). Chart 5Unit Labor Costs, Not Oil Prices, Are The Key To US Core Inflation
Unit Labor Costs, Not Oil Prices, Are The Key To US Core Inflation
Unit Labor Costs, Not Oil Prices, Are The Key To US Core Inflation
The reason for this very strong wage growth and swelling unit labor costs is the very tight labor market. The bottom panel of Chart 5 demonstrates that labor demand is still outpacing labor supply by a wide margin. Hence, wage inflation will not subside until the unemployment rate rises meaningfully. Bottom Line: Conditions for sustainable and persistent disinflation in the US are not yet present. Inflation will prove to be much stickier and more entrenched than many market participants presently believe. Core inflation lingering above 4% and easing financial conditions will compel the Fed to continue hiking rates. This will cap risk asset prices and put a floor under the US dollar. China: Is This Time Different? If one believes that China’s current business cycle is similar to all previous ones seen since 2009, odds are that a buying opportunity in China-related financial markets is at hand. Chart 6 illustrates that the credit and fiscal spending impulse leads the business cycle by about nine months. Given that this impulse bottomed late last year, a trough in the Chinese business cycle is due. Chart 6Is A Recovery In China's Business Cycle Imminent?
Is A Recovery In China's Business Cycle Imminent?
Is A Recovery In China's Business Cycle Imminent?
It is always risky to suggest that this time is different. Nevertheless, at the risk of being wrong, we contend that a combination of (1) property markets woes, (2) an impending export contraction, and (3) the dynamic zero-COVID policy will reduce the multiplier effect of current stimulus measures. Hence, a meaningful recovery in economic activity will likely fail to materialize in the coming months. The challenges facing the mainland property market are now well known. Yet, excesses are very large, and problems are snowballing, making policy stimulus insufficient. In particular: Authorities are contemplating bailout funds for property developers in the range of RMB 300-400 billion to enable them to complete housing that has been pre-sold. This is not sufficient financing for overall property construction. Table 1How Large Are Property Developers Bailout Funds?
Déjà Vu?
Déjà Vu?
Table 1 illustrates that these amounts are equal to just 3-4% of annual fixed-asset investment in real estate excluding land purchases, 1.5-2% of total financing of developers, and 3-4% of the advance payments that property developers received for pre-sold housing in 2021. Property developers will not be receiving any cash upon the completion and delivery of presold housing units because they were paid in advance. Hence, without liquidating their other assets, homebuilders cannot repay the bailout financing. Consequently, only state financing can work here because, from the viewpoint of providers of this financing, this scheme de-facto means throwing good money after bad. The property industry in China is extremely fragmented. This makes bailouts difficult to organize and execute. There are officially about 100,000 property developers in China. The overwhelming majority of them are not state-owned companies. Plus, the two largest property developers, Evergrande (before defaulting) and Country Garden, had only 3.8% and 3.3% of market share respectively in 2020. The failure of homebuilders to complete and deliver pre-sold housing units could unleash a death spiral for them. In recent years, 90% of housing units have been pre-sold, i.e., buyers made advance payments/prepayments, often taking out mortgages (Chart 7, top panel). Witnessing the inability of developers to deliver on presold units, a rising number of people may decide to wait to buy. The largest source of developers’ financing – advance payments for pre-sold housing units – might very well dry up. This source has accounted for 50% of real estate developers’ total financing in recent years (Chart 7, bottom panel). In brief, a vicious cycle is possible. The lack of financing for homebuilders bodes ill for construction activity (Chart 8). Chart 7China: Housing Presales And Pre-Payments Are Critical To Developers
China: Housing Presales And Pre-Payments Are Critical To Developers
China: Housing Presales And Pre-Payments Are Critical To Developers
Chart 8Lack Of Homebuilder Financing = Shrinking Construction Activity
Lack Of Homebuilder Financing = Shrinking Construction Activity
Lack Of Homebuilder Financing = Shrinking Construction Activity
Chart 9Chinese Property Developers Are Extremely Leveraged
Chinese Property Developers Are Extremely Leveraged
Chinese Property Developers Are Extremely Leveraged
Besides, property developers are very leveraged with an assets-to-equity ratio close to nine (Chart 9). They have grown accustomed to borrowing heavily to accumulate real estate assets. They have been starting but not completing construction (Chart 10, top panel). We have been referring to this phenomenon as the biggest carry trade in the world. The bottom panel of Chart 10 shows two different measures of residential floor space inventories held by property developers. One measure subtracts completed floor space from started floor space, and another one deducts sold floor space from started floor space. On both measures, residential inventories are enormous. In theory, they could raise funds by selling their real estate assets. However, if they all try to sell simultaneously, there will not be enough buyers, and asset prices will plunge, which could lead to a full-blown debt deflation spiral. The last time the real estate market was similarly distressed in 2014-15, the central bank launched the Pledged Supplementary Lending (PSL) facility. This was effectively a QE program to monetize housing. This was the reason why housing recovered strongly in 2016-2017. There is currently no such program up for discussion. On the whole, odds are that the current property market breakdown is structural, not cyclical. Financial markets – the prices of stocks and USD bonds of property developers – convey a similar message and continue to plunge (Chart 11). Chart 10Excessive Property Inventories
Excessive Property Inventories
Excessive Property Inventories
Chart 11No Green Light From Property Stocks And Corporate Bond Prices
No Green Light From Property Stocks And Corporate Bond Prices
No Green Light From Property Stocks And Corporate Bond Prices
Chart 12There Has Been No Recovery In China Without A Revival in Real Estate
There Has Been No Recovery In China Without A Revival in Real Estate
There Has Been No Recovery In China Without A Revival in Real Estate
Without an improvement in the housing market, a meaningful business cycle recovery is unlikely in China. Chart 12 illustrates that all recoveries in the Chinese broader economy since 2009 occurred alongside a revival in property sales. The importance of the property market goes beyond its size. Rising property prices lift household and business confidence, boosting aggregate spending and investment. The sluggish housing market and falling house prices will impair consumer and business confidence. This, along with uncertainty related to the dynamic zero-COVID policy, will dent consumer spending and private investments. Finally, the upcoming contraction in Chinese exports will dampen national income growth. Taken together, the multiplier effect of stimulus in the upcoming months will be lower than it has been in previous periods of stimulus. There are two areas that will see meaningful improvement in the coming months: infrastructure spending and autos. BCA’s China Investment Strategy service discussed the outlook for auto sales in a recent report. Chart 13Green Shoots In China's Infrastructure Investment
Green Shoots In China's Infrastructure Investment
Green Shoots In China's Infrastructure Investment
On the infrastructure front, there has been mixed evidence of an improvement in activity. The top and middle panels of Chart 13 demonstrate that Komatsu machinery’s operational hours and the number of approved infrastructure projects might be bottoming. However, the installation of high-power electricity lines has fallen to a 15-year low (Chart 13, bottom panel). As we elaborated in last month’s report, the new financing/stimulus for infrastructure development will not result in new investments. Rather, it will by and large offset the drop in local government (LG) revenues from land sales this year. In short, there is little new stimulus for infrastructure beyond what was approved in the budget plan earlier this year. Bottom Line: The recovery in China will be U- rather than V-shaped, with risks tilted to the downside. Investment Recommendations Our bias is that the rebound in global risk assets could last for a few more weeks. The basis is that investor positioning in risk assets was very light when this rebound began. Plus, falling oil prices could reinforce the idea among investors that US inflation is no longer a problem. Looking beyond the next several weeks, the outlook for global and EM risk assets is dismal. Markets will realize that the Fed cannot halt its tightening with core inflation well above 4-5%. Hawkish Fed policy and contracting global trade will boost the US dollar and weigh on cyclical assets. We continue to recommend an underweight allocation to EM in global equity and credit portfolios. Consistently, we are also reluctant to chase EM currencies higher. EM local bonds offer value, as we have argued over the past couple of months, but for now we prefer to focus on yield curve flattening trades. We continue betting on yield curve flattening/inversion in Mexico and Colombia and are long Brazilian 10-year domestic bonds while hedging the currency risk. In addition, we recommend investors continue receiving 10-year swap rates in China and Malaysia. Arthur Budaghyan Chief Emerging Markets Strategist arthurb@bcaresearch.com Strategic Themes (18 Months And Beyond) Equities Cyclical Recommendations (6-18 Months) Cyclical Recommendations (6-18 Months)