Equities

Executive Summary Then And Now
Then And Now
Then And Now
Investors are fixated on inflation; for now, the peak in US CPI is a positive for global stocks. However, this tailwind could easily transform into fear if inflation becomes deflation. The risk of deflation is greater than investors currently appreciate. In the early 1920s, the policy-driven inflation of World War One quickly morphed into a violent deflationary shock, which prompted a severe bear market. Even in the absence of the gold standard, many contemporary factors parallel those that were apparent before 1921. As a result, if commodity prices do not stabilize by year-end, investors will start to worry about deflation. This fear could prompt another sell-off in stocks, which would be particularly painful in Europe. Buy protection against deflation while it is cheap by selling EUR/JPY. Continue to favor defensive over cyclical equities. Bottom Line: The deflation risk for 2023 is greater than the investment community currently appreciates. While it remains a tail risk, it is an underpriced one. As a result, investors should use the current rebound in stocks to buy protection against deflation. Last week, the NASDAQ entered a new bull market following a decline in US inflation. European stocks have rallied too, albeit considerably less so, only rising 12.5% since their July 5th low. We have participated in this rally, having taken a more constructive view on European equities and other risk assets since our return from a trip visiting clients in Europe. Related Report European Investment StrategyQuestions From The Road The decline in US inflation is likely to remain a tailwind for global equities in the near future. The pandemic-related factors that spiked inflation in the past quarters are ebbing, and commodity inflation is decreasing. However, BCA’s US bond strategists expect this window to be short-lived. Labor market tightness and strong rents suggest that core CPI will stabilize around 4%. Nonetheless, as long as this window is open, stocks should remain bid. Investors expecting the demise of this current rebound continue to pin their view on stubborn inflation. While sticky inflation is an undeniable risk, it is a threat well understood by the market. However, another danger lurks, which is much less appreciated by investors: deflation. Investors currently underestimate its odds, when deflation could prove even more damaging to the market than sticky inflation. Remembering 1921 Chart 1The 1921 Bear Market
The 1921 Bear Market
The 1921 Bear Market
The most famous period of deflation in US economic history is the Great Depression. This is not, however, an appropriate parallel. The 1921 recession, at which time deflation hit a historical low of 16% per annum, is the more direct potential equivalent to today. It was accompanied by a 47% crash in the market that brought the Shiller P/E to five (Chart 1, top panel). At the end of WWI, the stock market experienced a rapid rally, with the Dow Jones jumping 58% from its low in March 1918 to its peak in November 1919. In that time frame, inflation was robust, with headline CPI averaging 16% between 1917 and 1920. Inflation was high because of a combination of factors: The war had forced a substantial loosening of fiscal policy with the Federal debt rising from 2.7% of GDP in 1916, before the entry of the US in the conflict, to 32.9% in 1921. The money supply experienced an unprecedented surge. At the beginning of the war, the US was a neutral party and European powers purchased large quantities of US goods. The resulting trade surplus pushed the US stock of gold from $1.5bn in 1914 to $2.6bn in 1920. Meanwhile, to help finance the government’s wartime expenditures, the newly created Federal Reserve expanded its banknote issuance and its claims on the banking system, which meant that Fed money rose from 21% of high-power money in April 1917 to 59% by November 1918. As a result of these two concurrent trends, the money supply doubled between 1916 and June 1920. The Fed was slow to remove the accommodation. The New York discount rate, which had fallen from 6% to 4% as war broke out in Europe, was only increased to 4.75% in the Spring of 1918 and stayed there until January 1920. The global economy was facing potent supply constraints. Large swaths of the European capital stock had been destroyed by the war, at the same time as the US economy had been redesigned to supply military goods, not consumer goods. As a result, inflation remained perky in 1919 and 1920, despite the end of the conflict. The fiscal and monetary supports suddenly ended in 1920, and the economy entered a vicious contraction that caused industrial production to plunge by 36% in 1921 and deflation to hit 16% (Chart 1, second and third panel). The fiscal easing suddenly shifted toward fiscal rectitude under the administration of Warren Harding, which greatly hurt domestic demand in 1921. Additionally, the inflow of gold from the war period morphed into outflow, as European powers enjoyed trade surpluses after their currencies fell 60% to 30% against the dollar between 1919 and the start of 1921. Moreover, the Fed increased the discount rate to 6% in 1920 and cut back the ratio of Fed money to gold, which caused M2 to swing from a 20% growth annual growth rate in Q1 1920 to a 7% contraction in Q3 1921. Simultaneously, corporate borrowing rates soared (Chart 1, fourth and fifth panel) The shock of stagflation and the associated deep output contraction caused the Dow Jones to collapse by 47% from late 1919 to August 1921. The market only stabilized once deflationary pressures ebbed, after the Fed had cut back the discount rate to 6% and around the same time when commodity prices began to firm up. By the end of the bear market, the reconstituted S&P 500 was trading at a cyclically-adjusted P/E of 5.2, and profits had fallen 81% from their 1916 peak. Bottom Line: The 1921 bear market was one of the most violent of the twentieth century. It was caused by an economic contraction and deep deflation that engulfed the US economy after the monetary and fiscal support of WWI had been removed. It only ended once deflationary forces began to ebb, after commodity prices found a floor. What Are The Parallels? At first glance, the parallels between 1921 and today seem negligible. Yes, inflation was raging in 1920, but deflation was a direct consequence of the gold standard that forced a rapid contraction in high-powered money, especially as gold fled the US in 1921. Chart 2Inflationary Fiscal And Monetary Policy
Inflationary Fiscal And Monetary Policy
Inflationary Fiscal And Monetary Policy
The similarities, however, are remarkable too. As a result of the COVID-19 pandemic, the economy was subjected to similar conditions as that of the US around WWI. The US economy witnessed a massive explosion of fiscal stimulus that pushed the Federal deficit from 5% in 2019, to 10% and 6% of GDP in 2020 and 2021, respectively. Moreover, the Federal Reserve generated extremely accommodative monetary conditions during and after the pandemic, when its balance sheet more than doubled and M2 grew by 41% (Chart 2). Additionally, the global economy has witnessed extraordinary supply-side disruptions that have added to inflationary pressures created by the extreme push to aggregate demand from fiscal and monetary policy.1 Chart 3The Money Supply Is Contracting
The Money Supply Is Contracting
The Money Supply Is Contracting
However, as in 1921, these forces are moving in the opposite direction. The fiscal thrust in the US was deeply negative in 2021 and 2022, when fiscal policy subtracted 4% and 2% from GDP growth, respectively. Moreover, the Fed’s policy tightening campaign is exceptionally aggressive. The Fed has increased rates by 2.25% in five months, and, based on the OIS curve, will push up interest rates by an additional 1.3% by the year-end (Chart 3). As a result, the recent contraction in M2 has further to run, even if the US economy is not constrained by its golden tethers (Chart 3, bottom panel). Between 1920 and 1921, investors had trouble judging how far the Fed would tolerate money contraction, which is again the case. Chart 4The Dollar Is Deflationary
The Dollar Is Deflationary
The Dollar Is Deflationary
While the gold standard has been dissolved, the recent wave of dollar strength creates deflationary forces that are similar to the bullion anchor in the 1920s. In the US, the strength in the dollar is limiting imported inflation. US import prices have rolled over, a trend likely to continue. Once converted in USD, Chinese PPI is almost contracting today, which is no small matter when China is the marginal supplier of goods for the world (Chart 4). A strong dollar is deflationary for the global economy, not just that of the US. A rising greenback hurts commodity prices and also tightens global liquidity conditions. Already, the dollar-based liquidity is contracting and EM FX reserves – which are a form of high-powered money similar to gold flows in the 1920s – are tanking, even after adjusting for the confiscation of Russian reserves in the wake of the Ukrainian conflict (Chart 4, bottom panel). To defend their currencies as the dollar rallies, EM central banks are forced to tighten policy, which hurts their domestic economies. This phenomenon is also visible in advanced economies. The weak euro has played a role inching the ECB toward aggressive rate hikes, while the Riksbank and the Swiss National Bank are both lifting interest rates to fight the inflationary impact of their currencies falling against the greenback. Global supply constraints are also defusing. The price of shipping commodities and goods around the world is declining meaningfully (Chart 5). Meanwhile, deliveries by suppliers are accelerating globally, which is contributing to a very rapid easing of our indicator of US Supply Constraints (Chart 5, bottom panel). Beyond these parallels with the early 1920s, demand is already weakening globally. Hampered by the current rise in living costs, households have begun to reduce the volume of goods they purchase, while companies have maintained robust production schedules. As a result, inventories are swelling around the world (Chart 6). Historically, the best cure for elevated inventories is lower prices. Chart 5Easing Supply Constraints
Easing Supply Constraints
Easing Supply Constraints
Chart 6Inventories And Weak Demand Are Deflationary
Inventories And Weak Demand Are Deflationary
Inventories And Weak Demand Are Deflationary
Bottom Line: There is no guarantee that deflation will become the prevailing force in the global economy. However, the risk is there—and this threat is woefully underappreciated by the investment community. At this current juncture, investors are welcoming lower commodity prices as they take the edge off ebullient inflation. However, if commodity prices do not stabilize by year-end, then investors will begin to worry about deflation. As the 1921 experience showed, deflation is very painful for stocks because it is so negative for profits. While the absence of the gold standard means that the deep deflation of 1921 is extremely unlikely, a period of deflation would nonetheless have a very negative impact on stocks, since they trade at 29 times cyclically-adjusted earnings, not 6.2 times, as was the case in November 1919. What Does This Mean For European Assets? A bout of global deflation would be especially painful for European equities. European equities are more cyclical than their US counterparts, which means that they often underperform when global growth is weak and global export prices of manufactured goods are falling (Chart 7). In other words, a deflationary shock in the US would be felt more acutely in the European market than in that of the US. Additionally, the euro would likely weaken further. Already, the European money impulse (the change in M1 flows) is contracting, which augurs poorly for European economic activity (Chart 8). The addition of a deflationary shock to the weak domestic backdrop would prompt further outflows from Europe, which would hurt the euro even more. Chart 7European Stocks Hate Deflationary Busts
European Stocks Hate Deflationary Busts
European Stocks Hate Deflationary Busts
Chart 8European Activity Is Weak
European Activity Is Weak
European Activity Is Weak
Chart 9A Value Trap?
A Value Trap?
A Value Trap?
Finally, with respect to the European cyclicals-to-defensive ratio, our Combined Mechanical Valuation Indicator suggests that European cyclicals have purged their overvaluation relative to their defensive counterparts (Chart 9). However, in previous deflationary outbreaks such as those in 1921 or the 1930s, cyclicals deeply underperformed defensive equities, no matter how cheap they became. This time around, we would expect the same outcome from cyclicals. Moreover, even if investors do not price in a deflationary risk early next year, European cyclicals remain hampered by the deceleration in the Chinese economy and the energy rationing that will hit Europe this winter. As a result, we continue to fade any rebound in the European cyclicals-to-defensives ratio. Bottom Line: Even if a deflationary shock is a risk that is more likely to emanate from the US, European markets will not be immune. The European economy is already weak, and the cyclicality of European equities creates greater vulnerability to deflation. Thus, while deflation in 2023 is a tail risk, investors should use the current rebound in global risk assets to buy protection cheaply. Selling EUR/JPY and favoring defensive European markets continue to make sense in light of this risk. Mathieu Savary, Chief European Strategist Mathieu@bcaresearch.com Footnotes 1Another similarity is that the Spanish Flu was decimating the population from late WWI to 1921. Tactical Recommendations Cyclical Recommendations Structural Recommendations
Listen to a short summary of this report. Executive Summary Significant Savings Provide A Moat Around Consumers
Significant Savings Provide A Moat Around Consumers
Significant Savings Provide A Moat Around Consumers
Three mega moats will protect the US economy over the next 12 months: 1) A high number of job openings; 2) Significant pent-up demand; and 3) Strong Fed credibility, which has kept bond yields from rising more than they otherwise would have in response to higher inflation. Ironically, a recession will only occur when investors start believing that a recession will not occur. Without more economic optimism, real yields will not rise into restrictive territory. The double-dip 1980/82 recessions, the 1990-91 recession, the 2001 recession, and the 2007-09 Great Recession were all preceded by an almost identical 21-to-23-month period of a flat unemployment rate. The unemployment rate has been fairly stable since March when it hit 3.6%. Given the three moats, we suspect that it will move sideways well into next year. At that point, the trajectory of inflation will determine the path for the unemployment rate and the broader economy. Inflation will fall significantly over the coming months thanks to lower food and energy prices and easing supply-chain pressures. However, falling inflation could sow the seeds of its own demise. As prices at the pump and the grocery store decline, real wage growth will turn positive. This will bolster consumer confidence, leading to more spending, and ultimately, a reacceleration in core inflation. Bottom Line: Stocks will rise over the next six months as recession risks abate, but then decline over the subsequent six months as it becomes clear that the Fed has no intention of cutting rates in 2023 and may even need to raise them further. On balance, we recommend a neutral exposure to global equities over a 12-month horizon. Don’t Bet on a US Recession Just Yet Many investors continue to expect the US economy to slip into recession this year. The OIS curve is discounting over 100 basis points in rate cuts starting in 2023, something that would probably only happen in a recessionary environment (Chart 1). In contrast to the consensus view, we think that the US will avoid a recession. This is good news for stocks in the near term because it means that earnings estimates, which have already fallen meaningfully this year, are unlikely to be cut any further (Chart 2). It is bad news for stocks down the road because it means that rather than cutting rates in 2023, the Fed could very well have to raise them. Chart 1Investors Expect Fed Tightening To Give Way To An Easing Cycle In 2023
Investors Expect Fed Tightening To Give Way To An Easing Cycle In 2023
Investors Expect Fed Tightening To Give Way To An Easing Cycle In 2023
Image
These two conflicting considerations lead us to expect stocks to rise over the next six months but then to fall over the subsequent six months. As such, we recommend an above-benchmark exposure to global equities over a short-term tactical horizon but a neutral exposure over a 12-month horizon. Three mega moats will protect the US economy over the next 12 months: 1) A high number of job openings; 2) Significant pent-up demand; and 3) Strong Fed credibility, which has kept bond yields from rising more than they otherwise would have in response to higher inflation. Let’s explore each in turn. Moat #1: A High Number of Job Openings While job openings have fallen over the past few months, they are still very high by historic standards (Chart 3). In June, there were 1.8 job openings for every unemployed worker, up from 1.2 in February 2020. At the peak of the dotcom bubble, there were 1.1 job openings per unemployed worker. A high job openings rate means that many workers who lose their jobs will have little difficulty finding new ones. This should keep the unemployment rate from rising significantly as labor demand cools on the back of higher interest rates. Some investors have argued that the ease with which companies can advertise for workers these days has artificially boosted reported job openings. We are skeptical of this claim. For one thing, it does not explain why the number of job openings has risen dramatically over the past two years since, presumably, the cost of job advertising has not changed that much. Moreover, the Bureau of Labor Statistics bases its estimates of job openings not on a tabulation of online job postings but on a formal survey of firms. For a job opening to be counted, a firm must have a specific position that it is seeking to fill within the next 30 days. This rules out general job postings for positions that may not exist. We are also skeptical of claims that increased layoffs could significantly push up “frictional” unemployment, a form of unemployment stemming from the time it takes workers to move from one job to another. There is a great deal of churn in the US labor market (Chart 4). In a typical month, net flows in and out of employment represent less than 10% of gross flows. In June, for example, US firms hired 6.4 million workers. On the flipside “separations” totaled 5.9 million in June, 71% of which represented workers quitting their jobs. Chart 3A High Level Of Job Openings Creates A Moat Around The Labor Market
A High Level Of Job Openings Creates A Moat Around The Labor Market
A High Level Of Job Openings Creates A Moat Around The Labor Market
Chart 4Labor Market Churn Tends To Increase As Unemployment Falls
Labor Market Churn Tends To Increase As Unemployment Falls
Labor Market Churn Tends To Increase As Unemployment Falls
In fact, total separations (and hence frictional unemployment) tend to rise when the labor market strengthens since that is when workers feel the most emboldened to quit. The reason that the unemployment rate increases during recessions is not because laid-off workers need time to find a new job but because there are simply not enough new jobs available. Fortunately, that is not much of a problem today. Moat #2: Significant Pent-Up Demand US households have accumulated $2.2 trillion (9% of GDP) of excess savings since the start of the pandemic, most of which reside in highly liquid bank deposits (Chart 5). Admittedly, most of these savings are skewed towards middle- and upper-income households who tend to spend less out of every dollar of income than the poor (Chart 6). Nevertheless, even the top 10% of income earners spend about 80% of their income (Chart 7). This suggests that most of these excess savings will be deployed, supporting consumption in the process. Chart 5Significant Savings Provide A Moat Around Consumers
Significant Savings Provide A Moat Around Consumers
Significant Savings Provide A Moat Around Consumers
Chart 6Unlike The Poor, Middle-To-Upper Income Households Still Hold Much Of Their Pandemic Savings
Unlike The Poor, Middle-To-Upper Income Households Still Hold Much Of Their Pandemic Savings
Unlike The Poor, Middle-To-Upper Income Households Still Hold Much Of Their Pandemic Savings
Some commentators have argued that high inventories will restrain production, even if consumer spending remains buoyant. We doubt that will happen. While retail inventories have risen of late, the retail inventory-to-sales ratio is still near all-time lows (Chart 8). Moreover, real retail sales have returned to their pre-pandemic trend (Chart 9A). Overall goods spending is still above trend, but has retraced two-thirds of its pandemic surge with little ill-effect on the labor market (Chart 9B). Chart 7Even The Wealthy Spend Most Of Their Income
Three Mega Moats Around The US Economy
Three Mega Moats Around The US Economy
Chart 8Retail Inventory-To-Sales Ratios Have Rebounded, But Remain Low
Retail Inventory-To-Sales Ratios Have Rebounded, But Remain Low
Retail Inventory-To-Sales Ratios Have Rebounded, But Remain Low
Chart 9ASpending On Goods Has Been Normalizing (I)
Spending On Goods Has Been Normalizing (I)
Spending On Goods Has Been Normalizing (I)
Chart 9BSpending On Goods Has Been Normalizing (II)
Spending On Goods Has Been Normalizing (II)
Spending On Goods Has Been Normalizing (II)
The latest capex intention surveys point to a deceleration in business investment (Chart 10). Nevertheless, we doubt that capex will decline by very much. Following the dotcom boom, core capital goods orders moved sideways for two decades (Chart 11). The average age of the nonresidential capital stock rose by over two years during this period (Chart 12). Excluding investment in intellectual property, business capex as a share of GDP is barely higher now than it was during the Great Recession. Not only is there a dire need to replenish the existing capital stock, but there is an urgent need to invest in new energy infrastructure and increased domestic manufacturing capacity. Chart 10Capex Intentions Have Dipped
Capex Intentions Have Dipped
Capex Intentions Have Dipped
Chart 11Capex Has Been Moribund For The Past Two Decades (I)
Capex Has Been Moribund For The Past Two Decades (I)
Capex Has Been Moribund For The Past Two Decades (I)
With regards to residential investment, the homeowner vacancy rate has fallen to a record low. The average age of US homes stands at 31 years, the highest since 1948. Chart 13 shows that housing activity has weakened somewhat less than one would have expected based on the significant increase in mortgage rates in the first six months of 2022. Given the recent stabilization in mortgage rates, the chart suggests that housing activity should rebound by the end of the year. Chart 12Capex Has Been Moribund For The Past Two Decades (II)
Capex Has Been Moribund For The Past Two Decades (II)
Capex Has Been Moribund For The Past Two Decades (II)
Chart 13Housing Activity Should Rebound On The Back Of Low Vacancy Rates, An Aging Housing Stock, And Stabilizing Mortgage Rates
Housing Activity Should Rebound On The Back Of Low Vacancy Rates, An Aging Housing Stock, And Stabilizing Mortgage Rates
Housing Activity Should Rebound On The Back Of Low Vacancy Rates, An Aging Housing Stock, And Stabilizing Mortgage Rates
Moat #3: Strong Fed Credibility Even though headline inflation is running at over 8% and most measures of core inflation are in the vicinity of 5%-to-6%, the 10-year bond yield still stands at 2.87%. Two things help explain why bond yields have failed to keep up with inflation. First, investors regard the Fed’s commitment to bringing down inflation as highly credible. The TIPS market is pricing in a rapid decline in inflation over the next two years (Chart 14). The widely-followed 5-year, 5-year forward TIPS inflation breakeven rate is still near the bottom end of the Fed’s comfort zone. Chart 14AWell-Anchored Long-Term Inflation Expectations Have Kept Bond Yields From Rising More Than They Would Have Otherwise
Three Mega Moats Around The US Economy
Three Mega Moats Around The US Economy
Chart 14BWell-Anchored Long-Term Inflation Expectations Have Kept Bond Yields From Rising More Than They Would Have Otherwise
Well-Anchored Long-Term Inflation Expectations Have Kept Bond Yields From Rising More Than They Would Have Otherwise
Well-Anchored Long-Term Inflation Expectations Have Kept Bond Yields From Rising More Than They Would Have Otherwise
Households tend to agree with the market’s assessment. While households expect inflation to average over 5% over the next 12 months, they expect it to fall to 2.9% over the long term. As Chart 15 illustrates, expected inflation 5-to-10 years out in the University of Michigan survey is in line with where it was between the mid-1990s and 2015. This is a major difference from the early 1980s, when households expected inflation to remain near 10%. Back then, Paul Volcker had to engineer a deep recession in order to bring long-term inflation expectations back down to acceptable levels. Such pain is unlikely to be necessary today. Chart 15Households Expect Inflation To Come Back Down
Households Expect Inflation To Come Back Down
Households Expect Inflation To Come Back Down
Chart 16Markets Think That The Real Neutral Rate Is Low
Markets Think That The Real Neutral Rate Is Low
Markets Think That The Real Neutral Rate Is Low
The second factor that is suppressing bond yields is the market’s perception that the real neutral rate of interest is quite low. The 5-year, 5-year TIPS yield – a good proxy for the market’s estimate of the real neutral rate – currently stands at 0.40%, well below its pre-GFC average of 2.5% (Chart 16). Ironically, a recession will only occur when investors start believing that a recession will not occur. Without more economic optimism, real yields will not rise into restrictive territory. When Will the Moats Dry Up? The US unemployment rate is a mean-reverting series. When unemployment is very low, it is more likely to rise than to fall. And when the unemployment rate starts rising, it keeps rising. In the post-war era, the US has never avoided a recession when the unemployment rate has risen by more than one-third of a percentage point over a three-month period (Chart 17). Chart 17When Unemployment Starts Rising, It Usually Keeps Rising
When Unemployment Starts Rising, It Usually Keeps Rising
When Unemployment Starts Rising, It Usually Keeps Rising
With the unemployment rate falling to a 53-year low of 3.5% in July, it is safe to say that we are in the late stages of the business-cycle expansion. When will the unemployment rate move decisively higher? While it is impossible to say with certainty, history does offer some clues. Remarkably, the double-dip 1980/82 recessions, the 1990-91 recession, the 2001 recession, and the 2007-09 Great Recession were all preceded by an almost identical 21-to-23-month period of a flat unemployment rate (Chart 18 and Table 1). Coincidentally, the Covid-19 recession was also preceded by 22 months of a stable unemployment rate. To the extent that the economy was not showing much strain going into the pandemic, it is reasonable to assume that the unemployment rate would have continued to move sideways for most of 2020 had the virus never emerged. Chart 18The Bottoming Phase Of The Unemployment Rate Has Only Begun
The Bottoming Phase Of The Unemployment Rate Has Only Begun
The Bottoming Phase Of The Unemployment Rate Has Only Begun
Image
Inflation is the Key The unemployment rate has been fairly stable since March when it hit 3.6%. Given the three moats discussed in this report, we suspect that it will move sideways well into next year. At that point, the trajectory of inflation will determine the path of the unemployment rate and the broader economy. As this week’s better-than-expected July CPI report foreshadows, inflation will fall significantly over the coming months, thanks to lower food and energy prices and easing supply-chain pressures. The GSCI Agricultural Index has dropped 24% from its highs and is now below where it was before Russia’s invasion of Ukraine (Chart 19). Retail gasoline prices have fallen 19% since June, with the futures market pointing to a substantial further decline over the next 12 months. In general, there is an extremely strong correlation between the change in gasoline prices and headline inflation (Chart 20). Supplier delivery times have also dropped sharply (Chart 21). Chart 19Agricultural Prices Have Started Falling
Agricultural Prices Have Started Falling
Agricultural Prices Have Started Falling
Chart 20Headline Inflation Tends To Track Gasoline Prices
Headline Inflation Tends To Track Gasoline Prices
Headline Inflation Tends To Track Gasoline Prices
Falling inflation could sow the seeds of its own demise, however. As prices at the pump and the grocery store decline, real wage growth will turn positive. That will bolster consumer confidence, leading to more spending (Chart 22). Core inflation, which is likely to decrease only modestly over the coming months, will start to accelerate in 2023, prompting the Fed to turn hawkish again. Stocks will falter at that point. Chart 21Supplier Delivery Times Have Declined
Supplier Delivery Times Have Declined
Supplier Delivery Times Have Declined
Chart 22Falling Inflation Will Boost Real Wages And Consumer Confidence
Falling Inflation Will Boost Real Wages And Consumer Confidence
Falling Inflation Will Boost Real Wages And Consumer Confidence
Peter Berezin Chief Global Strategist peterb@bcaresearch.com Follow me on LinkedIn and Twitter Global Investment Strategy View Matrix
Three Mega Moats Around The US Economy
Three Mega Moats Around The US Economy
Special Trade Recommendations Current MacroQuant Model Scores
Three Mega Moats Around The US Economy
Three Mega Moats Around The US Economy
Roulette With A Five-Shooter
Executive Summary With the fourth Taiwan Strait crisis materializing, the odds of a major war between the world’s great powers have gone up. Our decision trees suggest the odds are around 20%, or double where they stood from the Russian war in Ukraine alone. The world is playing “Russian roulette” … with a five-round revolver. Going forward, our base case is for Taiwan tensions to flatten out (but not fall) after the US and Chinese domestic political events conclude this autumn. However, if China escalates tensions after the twentieth national party congress, then the odds of an invasion will rise significantly. If conflict erupts in Taiwan, then the odds of Russia turning even more aggressive in Europe will rise. Iran is highly likely to pursue nuclear weapons. Not A Lot Of Positive Catalysts In H2 2022
Roulette With A Five-Shooter
Roulette With A Five-Shooter
Tactical Recommendation Inception Date Return LONG US 10-YEAR TREASURY 2022-04-14 1.3% LONG GLOBAL DEFENSIVES / CYCLICALS EQUITIES 2022-01-20 13.8% Bottom Line: Investors should remain defensively positioned at least until the Chinese party congress and the US midterm election conclude this fall. Geopolitical risk next year will depend on China’s actions in the Taiwan Strait. Feature Chart 1Speculation Rising About WWIII
Roulette With A Five-Shooter
Roulette With A Five-Shooter
Pessimists who pay attention to world events have grown concerned in recent years about the risk that the third world war might break out. The term has picked up in online searches since 2019, though it is the underlying trend of global multipolarity, rather than the specific crisis events, that justifies the worry (Chart 1).1 What are the odds of a major war between the US and China, or the US and Russia? How might that be calculated? In this report we present a series of “decision trees” to formalize the different scenarios and probabilities. If we define WWIII as a war in which the United States engages in direct warfare with either Russia or China, or both, then we arrive at a 20% chance that WWIII will break out in the next couple of years! Those are frighteningly high odds – but history teaches that these odds are not unrealistic and that investors should not be complacent. Political scientist Graham Allison has shown that the odds of a US-China war over the long term are about 75% based on historical analogies. The takeaway is that nations will have to confront this WWIII risk and reject it for the global political environment to improve. Most likely they will do so as WWIII, and the risk of nuclear warfare that it would bring, constitutes the ultimate constraint. But the current behavior of the great powers suggests that they have not recognized their constraints yet and are willing to continue with brinksmanship in the short term. The Odds Of A Chinese Invasion Of Taiwan The first question is whether China will invade Taiwan. In April 2021 we predicted that the fourth Taiwan Strait crisis would occur within 12-24 months but that it would not devolve into full-scale war. This view is now being tested. In Diagram 1 we provide a decision tree to map out China’s policy options toward Taiwan and assign probabilities to each option. Diagram 1Decision Tree For Fourth Taiwan Strait Crisis (Next 24 Months)
Roulette With A Five-Shooter
Roulette With A Five-Shooter
While China has achieved the capability to invade Taiwan, the odds of failure remain too high, especially without more progress on its nuclear triad. Hence we give only a 20% chance that China will mobilize for invasion immediately. Needless to say any concrete signs that China is planning an invasion should be taken seriously. Investors and the media dismissed Russia’s military buildup around Ukraine in 2021 to their detriment. At the same time, there is a good chance that the US and China are merely testing the status quo in the Taiwan Strait, which will be reinforced after the current episode. After all, this crisis was the fourth Taiwan Strait crisis – none of the previous crises led to war. If Presidents Biden and Xi Jinping are merely flexing their muscles ahead of important domestic political events this fall, then they have already achieved their objective. No further shows of force are necessary on either side, at least for the next few years. We give 40% odds to this scenario, in which the past week’s tensions will linger but the status quo is reinforced. In that case, the structural problem of the Taiwan Strait would flare up again sometime after the US and Taiwanese presidential elections in 2024, i.e. outside the time frame of the diagram. Unfortunately we are pessimistic over the long run and would give high probability to war in Taiwan. For that reason, we give equal odds (40%) to a deteriorating situation within the coming two years. If China expands drills and sanctions after the party congress, after Xi has consolidated power, then it will be clear that Xi is not merely performing for his domestic audience. Similarly if the Biden administration continues pushing for tighter high-tech export controls against China after the midterm election, and insists that US allies and partners do the same, then the US implicitly believes that China is preparing some kind of offensive operation. The danger of invasion would rise from 20% to 40%. Even in that case, one should still believe that crisis diplomacy between the US and China will prevent full-scale war in 2023-24. But the risk of miscalculation would be very high. The last element of this decision tree holds that China will prefer “gray zone tactics” or hybrid warfare rather than conventional amphibious invasion of the kind witnessed in WWII. The reasons are several. First, amphibious invasions are the most difficult military operations. Second, Chinese forces are inexperienced while the US and its allies are entrenched. Third, hybrid warfare will sow division among the US allies about how best to respond. Fourth, Russia has demonstrated several times over the past 14 years that hybrid warfare works. It is a way of maximizing strategic benefits and minimizing costs. The world knows how the West reacts to small invasions: it uses economic sanctions. It does not yet know how the West reacts to big invasions. So China will be incentivized to take small bites. And yet in Taiwan’s case those tactics may not be sustainable. Our Taiwan decision tree does not account for the likelihood that a hybrid war or “proxy war” will evolve into a major war. But that likelihood is in fact high. So we are hardly overrating the risk of a major US-China war. Bottom Line: Over the next two years, the subjective odds of a US-China proxy war over Taiwan are about 32% while the odds of a direct US-China war are about 4%. The true test comes after Xi Jinping consolidates power at this fall’s party congress. We expect Xi to focus on rebooting the economy so we continue to favor emerging Asian markets excluding China and Taiwan. The Odds Of Russian War With NATO The second question is whether Russia’s war in Ukraine will morph into a broader war with the West. The odds of a major Russia-West war are greater in this case than in China’s, as a war is already raging, whereas tensions in the Taiwan Strait are merely shadow boxing so far. An investor’s base case should hold that the Ukraine war will remain contained in Ukraine, as Europeans do not want to fight a devastating war with Russia merely because of the Donbas. But things often go wrong in times of war. The critical question is whether Russia will attack any NATO members. That would trigger Article Five of the alliance’s treaty, which holds that “an armed attack against one or more [alliance members] in Europe or North America shall be considered an attack against them all,” justifying the use of armed force if necessary to restore security. Since Russia’s invasion of Ukraine this year, President Biden has repeatedly stated that the US will “defend every inch of NATO territory,” including the Baltic states of Latvia, Lithuania, and Estonia, which joined NATO in 2004. This is not a change of policy but it is the US’s red line and highly likely to be defended. Hence it is a major constraint on Russia. In Diagram 2 we map out Russia’s different options and assign probabilities. Diagram 2Decision Tree For Russia-Ukraine War (Next 24 Months)
Roulette With A Five-Shooter
Roulette With A Five-Shooter
We give 55% odds that Russia will declare victory after completing the conquest of Ukraine’s Donbas region and the land bridge to Crimea. It will start looking to legitimize its conquests by means of some diplomatic agreement, i.e. a ceasefire. This is our base case for 2023. There is evidence that Russia is already starting to move toward diplomacy.2 The reason is that Russia’s economy is suffering, global commodity prices are falling, Russian blood and treasure are being spent. President Putin will have largely achieved his goal of hobbling Ukraine as long as he controls the mouth of the Dnieper river and the rest of the territory he has invaded. Putin needs to seal his conquests and try to salvage the economy and society. The sooner the better for Russia, so that Europe can be prevented from forming a consensus and implementing a full natural gas embargo in the coming years. However, there is a risk that Putin’s ambition gets the better of him. So we give 35% odds that the invasion expands to southwestern Ukraine, including the strategic port city of Odessa, and to eastern Moldova, where Russian troops are stationed in the breakaway region of Transdniestria. This new campaign would render Ukraine fully landlocked, neutralize Moldova, and give Russia greater maritime access. But it would unify the EU, precipitate a natural gas embargo, and weaken Russia to a point where it could become desperate. It could retaliate and that retaliation could conceivably lead to a broader war. We allot only a 7% chance that Putin attacks Finland or Sweden for attempting to join NATO. Stalin failed in Finland and Putin’s army could not even conquer Kiev. The UK has pledged to support these states, so an attack on them will most likely trigger a war with NATO. A decision to attack Finland would only occur if Russia believed that NATO planned to station military bases there – i.e. Russia’s declared red line. Any Russian attack on the Baltic states is less likely because they are already in NATO. But there is some risk it could happen if Putin grows desperate. We put the risk of a Baltic invasion at 3%. In short, if Russia uses its energy stranglehold on Europe not to negotiate a favorable ceasefire but rather to expand its invasions, then the odds of a broader war will rise. Bottom Line: The result is a 55% chance of de-escalation over the next 24 months, a 35% chance of a small escalation (e.g. Odessa, Moldova), and a 10% chance of major escalation that involves NATO members and likely leads to a NATO-Russia war. Tactically, investors should buy developed-market European currency and assets if the global economy rebounds and Russia makes a clear pivot to halting its military campaign and pursuing ceasefire talks. Cyclically, there needs to be a deeper US-Russia understanding for a durable bull market in European assets. The Odds Of US-Israeli Strikes On Iran The third geopolitical crisis taking place this year could be postponed as we go to press – if President Biden and Ayatollah Ali Khamenei agree to rejoin the 2015 US-Iran nuclear deal. But we remain skeptical. The Biden administration wants to rejoin the 2015 nuclear deal and free up about one million barrels per day of Iranian crude oil to reduce prices at the pump before the midterm election. US grand strategy also wants to engage with Iran and stabilize the Middle East so that the US can pivot to Asia. The EU is proposing the deal since it has even greater need for Iranian resources and wants to prevent Iran from getting nuclear weapons. Russia and China are also supportive as they want to remove US sanctions for trading with Iran and do not necessarily want Iran to get nukes. There is only one problem: Iran needs nuclear weapons to ensure its regime’s survival over the long run. The question is whether Khamenei is willing to authorize a deal with the Americans a second time. The first deal was betrayed at great cost to his regime. President Ebrahim Raisi, who hopes to replace the 83-year-old Khamenei before long, is surely staunchly opposed to wagering his career and personal security on whether Republicans win the 2024 election. Iran has already achieved nuclear breakout capacity – it has enough 60%-enriched uranium to construct nuclear devices – and it is unclear why it would achieve this capacity if it did not ultimately seek to obtain a nuclear deterrent. Especially given that it may someday need to protect its regime from military attacks by the US and its allies. However, our conviction level is medium because President Biden wants to lift sanctions and can do so unilaterally. The Biden administration has not taken any of the preliminary actions to make a deal come together but that could change.3 There is a good cyclical case to be made for short-term, stop-gap deal. According to BCA’s Commodity & Energy Strategist Bob Ryan, Saudi Arabia and the UAE only have about 1.5 million barrels of spare oil production capacity between them. The EU oil embargo and western sanctions on Russia will force about two million barrels per day to be stopped, soaking up most of OPEC’s capacity. Hence the Biden administration needs the one million barrels that Iran can bring. We cannot deny that the Iranians may sign a deal to allow Biden to lift sanctions. That would benefit their economy. They could allow nuclear inspectors while secretly shifting their focus to warhead and ballistic missile development. While Iran will not give up the long pursuit of a nuclear deterrent, it is adept at playing for time. Still, Iran’s domestic politics do not support a deal – and its grand strategy only supports a deal if the US can provide credible security guarantees, which the US cannot do because its foreign policy is inconsistent. US grand strategy supports a deal but only if it is verifiable, i.e. not if Iran uses it as cover to pursue a bomb anyway. Iran has not capitulated after three years of maximum US sanctions, a pandemic, and global turmoil. And Iran sees a much greater prospect of extracting strategic benefits from Russia and China now that they have turned aggressive against the West. Moscow and Beijing can be strategic partners due to their shared acrimony toward Washington. Whereas the US can betray the Raisi administration just as easily as it betrayed the Rouhani administration, with the result that the economy would be whipsawed again and the Supreme Leader and the political establishment would be twice the fools in the eyes of the public. Diagram 3 spells out Iran’s choices. Diagram 3Decision Tree For Iran Nuclear Crisis (Next 24 Months)
Roulette With A Five-Shooter
Roulette With A Five-Shooter
If negotiations collapse (50% odds), then Iran will make a mad dash for a nuclear weapon before the US and Israel attack. If the US and Iran agree to a deal (40%), then Iran might comply with the deal’s terms through the 2024 US election, removing the issue from investor concerns for now. But their long-term interest in obtaining a nuclear deterrent will not change and the conflict will revive after 2024. If talks continue without resolution (10%), Iran will make gradual progress on its nuclear program without the restraints of the deal (though it may not need to make a mad dash). In short, Russia and China need Iran regardless of whether it freezes its nuclear program, whereas the US and Israel will form a balance-of-power Abraham Alliance to contain Iran even if it does freeze its nuclear program. Bottom Line: Investors should allot 40% odds to a short-term, stop-gap US-Iran nuclear deal. The oil price drop would be fleeting. Long-term supply will not be expanded because the US cannot provide Iran with the security guarantees that it needs to halt its nuclear program irreversibly. The Odds Of World War III Now comes the impossible part, where we try to put these three geopolitical crises together. In what follows we are oversimplifying. But the purpose is to formalize our thinking about the different players and their options. Diagram 4 begins with our conclusions regarding the China/Taiwan conflict, adjusts the odds of a broader Russian war as a result, and adds our view that Iran is highly likely to pursue nuclear weapons. Again the time frame is two years. Diagram 4Decision Tree For World War III (Next 24 Months)
Roulette With A Five-Shooter
Roulette With A Five-Shooter
The alternate conflict scenario to WWIII consists of “limited wars” – a dangerous concept that refers to hybrid and proxy wars in which the US is not involved, or only involved indirectly. Or it could be a conflict with Iran that does not involve Russia and China. We begin with China because China is the most capable and most ambitious global power today. China’s strategic rise is upsetting the global order and challenging the United States. We also start with China because we have some evidence this year that Russia does not intend to expand the war beyond Ukraine. Either China takes further aggressive action in Taiwan – creating a unique opportunity for Russia to take greater risks – or not. If not, then the odds of WWIII fall precipitously over the two-year period. This scenario is our base case. But if China attacks Taiwan and the US defends Taiwan, we give a high probability to Russia invading the Baltics. If China stages hybrid attacks and the US only supports Taiwan indirectly, then we increase the odds of Russian aggression only marginally. The result is 20% odds of WWIII, i.e. a direct war between the US and Russia, or China, or both. Whether this war could remain limited is debatable. War gaming since 1945 shows that any war between major nuclear powers will more likely escalate than not. But nuclear weapons bring mutually assured destruction, the ultimate constraint. The nuclear escalation risk is why we round down the probability of WWIII in our decision trees. The more likely 59% risk scenario of “limited wars” may seem like a positive outcome but it includes major increases in geopolitical tensions from today’s level, such as a Chinese hybrid war against Taiwan. Bottom Line: According to this exercise the odds of WWIII could be as high as 20%. This is twice the level in our Russia decision tree, which is appropriate given that our Taiwan crisis forecast has materialized. The critical factor is whether Beijing continues escalating the pressure on Taiwan after the party congress this fall. That could unleash a dangerous chain reaction. The global economy and financial markets still face downside risk from geopolitics but 2023 could see improvements if Russia moves toward a ceasefire and China delays action against Taiwan to reboot its economy. Investment Takeaways When Russia invaded Ukraine earlier this year, our colleague Peter Berezin, Chief Global Strategist, argued that the odds of nuclear Armageddon were 10%. At very least this is a reasonable probability for the odds that Russia and NATO come to blows. Now the expected Taiwan crisis has materialized. We guess that the odds of a major war have doubled to 20%. The corollary is an 80% chance of a better outcome. Analytically, we still see Russia as pursuing a limited objective – neutralizing Ukraine so that it cannot be prosperous and militarily powerful – while China also pursues a limited objective – intimidating Taiwan so that it pursues subordination rather than nationhood. Unless these objectives change, we are still far from World War III. The world can live with a hobbled Ukraine and a subordinated Taiwan. However, there can be no denying that the trajectory of global affairs since the 2008 global financial crisis has followed a pathway uncomfortably similar to the lead up to World War II: financial crisis, economic recession, deflation, domestic unrest, currency depreciation, trade protectionism, debt monetization, military buildup, inflation, and wars of aggression. If roulette is the game, then the odds of a global war are one-sixth or 17%, not far from the 20% outcome of our decision trees. Even assuming that we are alarmist, the fact that we can make a cogent, formal argument that the odds of WWIII are as high as 20% suggests that investors should wait for the current tensions over Ukraine and Taiwan to decrease before making large new risky bets. A simple checklist shows that the global macro and geopolitical context is gloomy (Table 1). We need improvement on the checklist before becoming more optimistic. Table 1Not A Lot Of Positive Catalysts In H2 2022
Roulette With A Five-Shooter
Roulette With A Five-Shooter
Chart 2Stay Defensively Positioned In H2 2022
Stay Defensively Positioned In H2 2022
Stay Defensively Positioned In H2 2022
Specifically what investors need is to be reasonably reassured that Russia will not expand the war to NATO and that China will not invade Taiwan anytime soon. This requires a new diplomatic understanding between the Washington and Moscow and Washington and Beijing that forestalls conflict. That kind of understanding can only be forged in crisis. The relevant crises are under way but not yet complete. There is likely more downside for global equity investors before war risks are dispelled through the usual solution: diplomacy. Wait for concrete and credible improvements to the global system before taking a generally overweight stance toward risky assets. Favor government bonds over stocks, US stocks over global stocks, defensive sectors over cyclicals, and disfavor Chinese and Taiwanese currency and assets (Chart 2). Matt Gertken Chief Geopolitical Strategist mattg@bcaresearch.com Footnotes 1 See Graham Allison, Destined For War: Can America and China Escape Thucydides’s Trap? (New York: Houghton Miffin Harcourt, 2017). 2 For example, the Turkish brokered deal to ship grain out of Odessa, diplomatic support for rejoining the 2015 Iran nuclear deal, referendums in conquered territories like Kherson, and attempts to build up leverage in arms reduction talks. Cutting off Europe’s energy is ultimately a plan to coerce Europe into settling a ceasefire favorable for Russia. 3 Iran is still making extraneous demands – most recently that the IAEA drop a probe into how certain manmade uranium particles appeared in undisclosed nuclear sites in Iran. The IAEA has not dropped this probe and its credibility will suffer if it does. Meanwhile Biden is raising not lowering sanctions on Iran, even though sanction relief is a core Iranian demand. Biden has not removed the Iranian Revolutionary Guards or the Qods Force from the terrorism list. None of these hurdles are prohibitive but we would at least expect to see some movement before changing our view that a deal is more likely to fail than succeed. Strategic Themes Open Tactical Positions (0-6 Months) Open Cyclical Recommendations (6-18 Months) Regional Geopolitical Risk Matrix "Batting Average": Geopolitical Strategy Trades ()
Executive Summary Unit Labor Costs, Not Oil Prices, Are The Key To US Core Inflation
Unit Labor Costs, Not Oil Prices, Are The Key To US Core Inflation
Unit Labor Costs, Not Oil Prices, Are The Key To US Core Inflation
Inflation is not about oil, food or used car prices. Looking at prices of individual components of a consumer basket is akin to missing the forest for the trees. Despite the latest drop in US headline inflation, various core CPI measures continue trending up and registered considerable month-on-month rises in July. Wages and, more specifically, unit labor costs are the true measure of genuine and persistent inflation. US wage growth is very elevated, and the pace of unit labor cost gains has surged to a 40-year high. The conditions for sustainable and persistent disinflation in the US are not yet present. US inflation will prove to be much stickier and more entrenched than many market participants presently believe. The recovery in China will be U- rather than V-shaped, with risks tilted to the downside. The mainland’s property market breakdown is structural, not cyclical. Excesses are very large, and problems are snowballing, rendering the enacted policy stimulus insufficient. Bottom Line: US core inflation lingering above 4% and easing financial conditions will compel the Fed to continue hiking rates. This will cap global risk asset prices and put a floor under the US dollar. We continue to recommend an underweight allocation to EM in global equity and credit portfolios. Consistently, we are also reluctant to chase EM currencies higher. Feature The bullish macro narrative circulating in the investment community is that conditions for a cyclical rally in global risk assets have fallen into place. Specifically: US inflation will drop sharply as US growth has crested and commodity prices have plunged; The Fed is nearing the end of a tightening cycle; China has stimulated sufficiently, and its economy is about to recover, which will boost economic conditions among its trading partners in general and EM in particular. These assumptions along with the fact that the S&P 500 index has found support at a 3-year moving average – a proven line of defense – suggest that US share prices have likely bottomed (Chart 1). Are we witnessing déjà vu of the 2011, 2016, 2018 and 2020 market bottoms? Chart 1Déjà Vu? Is 2022 Like The 2011, 2016 And 2018 Bottoms In The S&P 500?
Déjà Vu? Is 2022 Like The 2011, 2016 And 2018 Bottoms In The S&P 500?
Déjà Vu? Is 2022 Like The 2011, 2016 And 2018 Bottoms In The S&P 500?
We have reservations about all of the above fundamental conjectures. We elaborate on these reservations in this report. On the whole, we contend that the current environment is different, and the roadmaps of all post-2009 equity market bottoms are not necessarily currently applicable. BCA’s Emerging Markets Strategy team believes that (1) US consumer price inflation is much more entrenched and will prove stickier than is commonly believed; and (2) the Chinese property market’s breakdown is structural, not cyclical; hence, the recovery will not gain traction easily. Is This The End Of The US Inflation Problem? Not Quite This week’s US inflation data confirmed that headline CPI inflation has probably peaked: prices in several categories plunged. However, inflation is not about oil, food or used car prices. Chart 2 reveals that historically there have been several episodes whereby core inflation remains elevated despite plunging oil prices. Chart 2US Core Inflation Does Not Always Follow Oil Prices
US Core Inflation Does Not Always Follow Oil Prices
US Core Inflation Does Not Always Follow Oil Prices
Looking at price dynamics among the individual components of the CPI basket is akin to missing the forest for the trees. Inflation is a very inert and persistent phenomenon. Underlying inflation does not change its direction often and/or quickly. That is why we believe that it is premature to celebrate the end of the US inflation problem. A few observations on this matter: Despite the drop in US headline inflation, various core CPI measures − like trimmed-mean CPI, median CPI and core sticky CPI − all continue trending up and registered substantial month-on-month rises in July (Chart 3). The range of core inflation based on these annual and month-month annualized rates is between 4-7%. In brief, the rate of genuine/sticky inflation is well above the Fed’s 2% target. Given its unconditional commitment to bringing inflation down to 2%, the Fed will continue hiking interest rates ceteris paribus. Chart 3US Core CPI Measures Are Still Very High
US Core CPI Measures Are Still Very High
US Core CPI Measures Are Still Very High
Chart 4US Wages Growth Has Been Surging
US Wages Growth Has Been Surging
US Wages Growth Has Been Surging
We continue to emphasize that wages and, more specifically, unit labor costs are the true measures of persistent and genuine inflation. We have written at length about why wages and unit labor costs are more important to inflation than oil or food prices. US wage growth is very elevated and is accelerating (Chart 4). Unit labor costs, calculated as hourly wages divided by productivity, have also been surging to a 40-year high (Chart 5, top panel). Chart 5Unit Labor Costs, Not Oil Prices, Are The Key To US Core Inflation
Unit Labor Costs, Not Oil Prices, Are The Key To US Core Inflation
Unit Labor Costs, Not Oil Prices, Are The Key To US Core Inflation
The reason for this very strong wage growth and swelling unit labor costs is the very tight labor market. The bottom panel of Chart 5 demonstrates that labor demand is still outpacing labor supply by a wide margin. Hence, wage inflation will not subside until the unemployment rate rises meaningfully. Bottom Line: Conditions for sustainable and persistent disinflation in the US are not yet present. Inflation will prove to be much stickier and more entrenched than many market participants presently believe. Core inflation lingering above 4% and easing financial conditions will compel the Fed to continue hiking rates. This will cap risk asset prices and put a floor under the US dollar. China: Is This Time Different? If one believes that China’s current business cycle is similar to all previous ones seen since 2009, odds are that a buying opportunity in China-related financial markets is at hand. Chart 6 illustrates that the credit and fiscal spending impulse leads the business cycle by about nine months. Given that this impulse bottomed late last year, a trough in the Chinese business cycle is due. Chart 6Is A Recovery In China's Business Cycle Imminent?
Is A Recovery In China's Business Cycle Imminent?
Is A Recovery In China's Business Cycle Imminent?
It is always risky to suggest that this time is different. Nevertheless, at the risk of being wrong, we contend that a combination of (1) property markets woes, (2) an impending export contraction, and (3) the dynamic zero-COVID policy will reduce the multiplier effect of current stimulus measures. Hence, a meaningful recovery in economic activity will likely fail to materialize in the coming months. The challenges facing the mainland property market are now well known. Yet, excesses are very large, and problems are snowballing, making policy stimulus insufficient. In particular: Authorities are contemplating bailout funds for property developers in the range of RMB 300-400 billion to enable them to complete housing that has been pre-sold. This is not sufficient financing for overall property construction. Table 1How Large Are Property Developers Bailout Funds?
Déjà Vu?
Déjà Vu?
Table 1 illustrates that these amounts are equal to just 3-4% of annual fixed-asset investment in real estate excluding land purchases, 1.5-2% of total financing of developers, and 3-4% of the advance payments that property developers received for pre-sold housing in 2021. Property developers will not be receiving any cash upon the completion and delivery of presold housing units because they were paid in advance. Hence, without liquidating their other assets, homebuilders cannot repay the bailout financing. Consequently, only state financing can work here because, from the viewpoint of providers of this financing, this scheme de-facto means throwing good money after bad. The property industry in China is extremely fragmented. This makes bailouts difficult to organize and execute. There are officially about 100,000 property developers in China. The overwhelming majority of them are not state-owned companies. Plus, the two largest property developers, Evergrande (before defaulting) and Country Garden, had only 3.8% and 3.3% of market share respectively in 2020. The failure of homebuilders to complete and deliver pre-sold housing units could unleash a death spiral for them. In recent years, 90% of housing units have been pre-sold, i.e., buyers made advance payments/prepayments, often taking out mortgages (Chart 7, top panel). Witnessing the inability of developers to deliver on presold units, a rising number of people may decide to wait to buy. The largest source of developers’ financing – advance payments for pre-sold housing units – might very well dry up. This source has accounted for 50% of real estate developers’ total financing in recent years (Chart 7, bottom panel). In brief, a vicious cycle is possible. The lack of financing for homebuilders bodes ill for construction activity (Chart 8). Chart 7China: Housing Presales And Pre-Payments Are Critical To Developers
China: Housing Presales And Pre-Payments Are Critical To Developers
China: Housing Presales And Pre-Payments Are Critical To Developers
Chart 8Lack Of Homebuilder Financing = Shrinking Construction Activity
Lack Of Homebuilder Financing = Shrinking Construction Activity
Lack Of Homebuilder Financing = Shrinking Construction Activity
Chart 9Chinese Property Developers Are Extremely Leveraged
Chinese Property Developers Are Extremely Leveraged
Chinese Property Developers Are Extremely Leveraged
Besides, property developers are very leveraged with an assets-to-equity ratio close to nine (Chart 9). They have grown accustomed to borrowing heavily to accumulate real estate assets. They have been starting but not completing construction (Chart 10, top panel). We have been referring to this phenomenon as the biggest carry trade in the world. The bottom panel of Chart 10 shows two different measures of residential floor space inventories held by property developers. One measure subtracts completed floor space from started floor space, and another one deducts sold floor space from started floor space. On both measures, residential inventories are enormous. In theory, they could raise funds by selling their real estate assets. However, if they all try to sell simultaneously, there will not be enough buyers, and asset prices will plunge, which could lead to a full-blown debt deflation spiral. The last time the real estate market was similarly distressed in 2014-15, the central bank launched the Pledged Supplementary Lending (PSL) facility. This was effectively a QE program to monetize housing. This was the reason why housing recovered strongly in 2016-2017. There is currently no such program up for discussion. On the whole, odds are that the current property market breakdown is structural, not cyclical. Financial markets – the prices of stocks and USD bonds of property developers – convey a similar message and continue to plunge (Chart 11). Chart 10Excessive Property Inventories
Excessive Property Inventories
Excessive Property Inventories
Chart 11No Green Light From Property Stocks And Corporate Bond Prices
No Green Light From Property Stocks And Corporate Bond Prices
No Green Light From Property Stocks And Corporate Bond Prices
Chart 12There Has Been No Recovery In China Without A Revival in Real Estate
There Has Been No Recovery In China Without A Revival in Real Estate
There Has Been No Recovery In China Without A Revival in Real Estate
Without an improvement in the housing market, a meaningful business cycle recovery is unlikely in China. Chart 12 illustrates that all recoveries in the Chinese broader economy since 2009 occurred alongside a revival in property sales. The importance of the property market goes beyond its size. Rising property prices lift household and business confidence, boosting aggregate spending and investment. The sluggish housing market and falling house prices will impair consumer and business confidence. This, along with uncertainty related to the dynamic zero-COVID policy, will dent consumer spending and private investments. Finally, the upcoming contraction in Chinese exports will dampen national income growth. Taken together, the multiplier effect of stimulus in the upcoming months will be lower than it has been in previous periods of stimulus. There are two areas that will see meaningful improvement in the coming months: infrastructure spending and autos. BCA’s China Investment Strategy service discussed the outlook for auto sales in a recent report. Chart 13Green Shoots In China's Infrastructure Investment
Green Shoots In China's Infrastructure Investment
Green Shoots In China's Infrastructure Investment
On the infrastructure front, there has been mixed evidence of an improvement in activity. The top and middle panels of Chart 13 demonstrate that Komatsu machinery’s operational hours and the number of approved infrastructure projects might be bottoming. However, the installation of high-power electricity lines has fallen to a 15-year low (Chart 13, bottom panel). As we elaborated in last month’s report, the new financing/stimulus for infrastructure development will not result in new investments. Rather, it will by and large offset the drop in local government (LG) revenues from land sales this year. In short, there is little new stimulus for infrastructure beyond what was approved in the budget plan earlier this year. Bottom Line: The recovery in China will be U- rather than V-shaped, with risks tilted to the downside. Investment Recommendations Our bias is that the rebound in global risk assets could last for a few more weeks. The basis is that investor positioning in risk assets was very light when this rebound began. Plus, falling oil prices could reinforce the idea among investors that US inflation is no longer a problem. Looking beyond the next several weeks, the outlook for global and EM risk assets is dismal. Markets will realize that the Fed cannot halt its tightening with core inflation well above 4-5%. Hawkish Fed policy and contracting global trade will boost the US dollar and weigh on cyclical assets. We continue to recommend an underweight allocation to EM in global equity and credit portfolios. Consistently, we are also reluctant to chase EM currencies higher. EM local bonds offer value, as we have argued over the past couple of months, but for now we prefer to focus on yield curve flattening trades. We continue betting on yield curve flattening/inversion in Mexico and Colombia and are long Brazilian 10-year domestic bonds while hedging the currency risk. In addition, we recommend investors continue receiving 10-year swap rates in China and Malaysia. Arthur Budaghyan Chief Emerging Markets Strategist arthurb@bcaresearch.com Strategic Themes (18 Months And Beyond) Equities Cyclical Recommendations (6-18 Months) Cyclical Recommendations (6-18 Months)
S&P 500 Chart 1Macroeconomic Backdrop
Macroeconomic Backdrop
Macroeconomic Backdrop
Chart 2Profitability
Profitability
Profitability
Chart 3Valuations And Technicals
Valuations And Technicals
Valuations And Technicals
Chart 4Uses Of Cash
Uses Of Cash
Uses Of Cash
Cyclicals Vs Defensives Chart 5Macroeconomic Backdrop
Macroeconomic Backdrop
Macroeconomic Backdrop
Chart 6Profitability
Profitability
Profitability
Chart 7Valuation And Technicals
Valuation And Technicals
Valuation And Technicals
Chart 8Uses Of Cash
Uses Of Cash
Uses Of Cash
Growth Vs Value Chart 9Macroeconomic Backdrop
Macroeconomic Backdrop
Macroeconomic Backdrop
Chart 10Profitability
Profitability
Profitability
Chart 11Valuations And Technicals
Valuations And Technicals
Valuations And Technicals
Chart 12Uses Of Cash
Uses Of Cash
Uses Of Cash
Small Vs Large Chart 13Macroeconomic Backdrop
Macroeconomic Backdrop
Macroeconomic Backdrop
Chart 14Profitability
Profitability
Profitability
Chart 15Valuations and Technicals
Valuations and Technicals
Valuations and Technicals
Chart 16Uses Of Cash
Uses Of Cash
Uses Of Cash
Table 1Performance
Chartbook: Style Chart Pack
Chartbook: Style Chart Pack
Table 2Valuations And Forward Earnings Growth
Chartbook: Style Chart Pack
Chartbook: Style Chart Pack
Recommended Allocation
Executive Summary The constructive economic view that has us at odds with the consensus rests on three premises: excess pandemic savings will allow consumption to grow at trend, despite inflation; inflation will soon peak, moving to around 4% by year end; and inflation expectations will remain well anchored, keeping the Fed from moving immediately to stifle the economy. Our consumption thesis remains intact. Real consumption has kept pace despite falling real incomes, thanks to a steady, modest drawdown of excess savings. Though our calls for an inflation peak have been consistently premature, recent data suggest that inflation pressures are abating. Gasoline prices have been falling for seven weeks; the fever has broken in ISM survey price measures; and the labor market, notwithstanding July's potent employment report, is becoming less tight. Longer-run inflation expectations have resisted becoming unmoored despite soaring measured inflation and a breakout does not appear to be imminent. A Mighty Savings Cushion
A Mighty Savings Cushion
A Mighty Savings Cushion
Bottom Line: We continue to expect the economy will be surprisingly resilient, allowing equities to rally further before the Fed squashes the expansion. We doubt the rally will persist very far into 2023, however, so we are reducing equities to equal weight over a twelve-month timeframe. Feature We will be holding our quarterly webcast next Monday, August 15th at 9:00 a.m. Eastern time in lieu of publishing a Weekly Report. Please join us with your questions to make it a fully interactive event. We will resume our regular publication schedule on the 22nd. Last week, an investor we were meeting for the first time asked us how anyone could have published on a weekly basis this year. “Things are so uncertain and they’re moving so fast, how do you keep up? What have you been writing about?” At long last, we felt seen. Feeding the weekly beast is not easy under the best of circumstances and investors know that this year has been far from ideal. Related Report US Investment StrategyThe High Bar For Getting Worse Once the warm glow of unexpected empathy receded, we replied that we’ve been doing our best to anticipate how the key macro issues will impact financial markets over our cyclical 3-to-12-month timeframe, paying particular attention to consumers, inflation and the Fed. The outlook for consumption has been our primary focus from a growth perspective; we’ve been trying to assess how representative the key drivers of inflation are and how persistent they’ll be; and we’ve continuously monitored longer-run inflation expectations to determine if inflation has gotten far enough into economic agents’ heads to become self-reinforcing and compel the Fed to dislodge it, no matter the near-term economic cost. We review what we see on all three fronts in today’s report, and how events are unfolding relative to our expectations. The direction remains especially uncertain, but our theses remain intact, and we are sticking with our constructive outlook on risk assets and the economy for the rest of the year. We are pulling in our horns on our twelve-month optimism, however, in line with the BCA house view and the dawning realization that twelve months of equity outperformance is overly ambitious. We continue to believe the recession will arrive too late for the gloomy consensus of investors judged by their quarterly performance, forcing them back into risk assets, but the rebound may not persist beyond the FOMC’s first 2023 meeting at the beginning of February. The Consumer’s Staying Power Since CARES Act transfer payments began driving a surge in personal savings, we have viewed them as dry powder to support consumption once households regained the freedom to spend as they see fit. When the payments stopped flowing and the pandemic continued to delay a return to normal, that view came under some fire. We are of the mind that households merely deferred much of the services demand they would otherwise have slaked in 2020 and 2021; others argue that consumption deferred is consumption destroyed, as households will be reluctant to spend windfall transfers that they’d mentally sorted as savings. While it will take a while for data to confirm either thesis, we are encouraged by what we’ve seen so far. The savings rate has declined considerably so far in 2022, supporting the view that households would be willing to reach into their savings to maintain trend consumption (Chart 1). It dipped to 5.2% in the second quarter from 5.6% in the first quarter, well below February 2020’s 8.3% pre-pandemic level and 2011 to 2019’s 7.4% quarterly mean (Chart 2). Based on the series’ stability over the previous nine years, 2020’s and 2021’s forced savings rates amounted to 11- and 6-sigma post-crisis events and this year’s approximately -2.5-sigma drawdown suggests the pendulum has further to swing in the direction of dissaving. We disagree with knee-jerk conclusions that spending in excess of income is unsustainable – it’s plenty sustainable for households who socked away a mountain of savings over the previous eight quarters while bars, restaurants, stadiums, concert venues and resorts were idled. Chart 1Right On Target
Right On Target
Right On Target
Chart 22020 And 2021 Savings Were Enormous
2020 And 2021 Savings Were Enormous
2020 And 2021 Savings Were Enormous
The estimates of excess savings that we’ve been calculating every month since the summer of 2020 peaked just above $2.3 trillion last August and remained around that level before embarking on a steady decline in the first half to reach our current estimate above $2 trillion (Chart 3, bottom panel). Quoting that figure has been nagging at us lately, however, as one of the two assumptions we used to calculate households’ no-pandemic savings baseline – annualized disposable income growth of 4% – took 2% annual inflation as given, a condition that no longer applies after a twelve-month stretch in which year-over-year CPI inflation has averaged 7.1%. Chart 3Nominal Excess Savings
Taking Stock
Taking Stock
To determine how much households' purchasing power has eroded, we deflated our monthly excess savings estimates to a level equating to 2% annualized inflation (Chart 4, top panel). The adjustment knocked $450 billion off our current estimate, trimming it to $1.6 trillion (Chart 4, bottom panel). Perhaps more importantly for the outlook, our adjustment doubled the year-to-date burn rate to $500 billion. We have always worked with the (deliberately conservative) assumption that households would spend half of their excess savings; if inflation doesn’t decelerate soon, their cushion may not last very far beyond the end of the year. Chart 4Adjusted Excess Savings
Taking Stock
Taking Stock
Bottom Line: Households have been willing to dip into savings to maintain trend consumption so far this year, in line with our hypothesis. We expect they will continue to do so, and the savings rate will remain around 5% or fall even lower, but inflation has eaten up some of their dry powder. Will Inflation Ever Peak? Shredding widely shared expectations that inflation would peak sometime in the first half, the year-over-year increase in headline CPI has kept climbing, all the way to 9% in June. July should finally provide some relief, as the average national retail gasoline price has fallen for seven consecutive weeks and ended July 13% below its June 30 level (Chart 5). Last week’s ISM manufacturing and services PMIs also suggested that inflation has begun to ease its grip somewhat, with the manufacturing input prices series plunging by nearly 20 points to its two-decade mean (Chart 6, top panel) and the services prices component cooling by 8 points, though it remains quite high (Chart 6, bottom panel). Chart 5Four Bucks A Gallon Is High, But Not Unfamiliar
Four Bucks A Gallon Is High, But Not Unfamiliar
Four Bucks A Gallon Is High, But Not Unfamiliar
Chart 6The Fever May Have Broken ...
The Fever May Have Broken ...
The Fever May Have Broken ...
Chart 7... Though The Job Market Is Still Quite Hot
... Though The Job Market Is Still Quite Hot
... Though The Job Market Is Still Quite Hot
The tight-as-a-drum labor market has been a fertile source of inflation worries, but there are signs that it is becoming less tight. Job openings remain 40% above their pre-COVID high but declined by 600,000 in June and are 10% off of March’s all-time peak (Chart 7). Elevated quits reveal that it's still easy to get a job, but the net share of small businesses in the NFIB survey planning to hire in the next three months is down 40% from its peak last summer (Chart 8). The July employment report challenged the under-the-radar indicators’ implication that the labor market is cooling, as net payroll expansion reaccelerated along with average hourly earnings growth (Chart 9). We are confident that net payroll growth will slow but compensation clearly has the cyclical wind at its back, and it is not certain that labor’s structural headwind will largely offset it, as per our thesis. Chart 8Hiring Intentions Are Back To More Normal Levels ...
Hiring Intentions Are Back To More Normal Levels ...
Hiring Intentions Are Back To More Normal Levels ...
Chart 9... But Wage Growth Remains Elevated
... But Wage Growth Remains Elevated
... But Wage Growth Remains Elevated
Inflation Expectations Longer-run inflation expectations are a critical piece of the puzzle because they are the pathway for rising inflation to become self-reinforcing. If they expect persistently higher inflation, workers will negotiate more fiercely for larger compensation increases to stay ahead of it; businesses will push more vigorously to pass on their increased costs to preserve profit margins; lenders and bond investors will demand higher interest rates to protect their real returns; and consumers will seek to buy more now to get the most from their dwindling purchasing power, exacerbating supply-demand imbalances and keeping the heat on near-term inflation readings. We are therefore closely watching inflation expectations. Market-based measures like TIPS break-evens and CPI swaps shed some light on investor and business expectations, while the monthly University of Michigan consumer sentiment survey offers insight into households’ views. Market-based measures remain well-anchored: intermediate-term expectations as implied by TIPS break-evens are just nosing above the top of the Fed’s preferred 2.3-2.5% range (Chart 10, middle panel) while long-term expectations remain below it, as they have for most of the year (Chart 10, bottom panel). Intermediate- and long-term expectations derived from CPI swaps remain 20 to 30 basis points higher but are in the same position relative to their year-to-date path (Chart 11, bottom two panels). Chart 10Market-Based Inflation Expectations ...
Market-Based Inflation Expectations ...
Market-Based Inflation Expectations ...
Chart 11... Are Not Problematic
... Are Not Problematic
... Are Not Problematic
Chart 12Just Say No (To Bottleneck Prices)
Just Say No (To Bottleneck Prices)
Just Say No (To Bottleneck Prices)
The Michigan survey doesn’t betray any pressing long-run concerns. The preliminary 3.3% June reading hinting at a breakout turned out to be a false alarm, as June’s final figure was 3.1% and July’s was 2.9%. Survey respondents continue to shun big-ticket purchases because they expect prices will fall from their current levels (Chart 12). 2-year TIPS and swaps price in an optimistic near-term outlook that is likely to be disappointed, as we think inflation will prove to be sticky around the 4% level, and that disappointment could bleed into higher longer-run expectations. While expectations are not problematic now, investors will need to watch them carefully going forward. Investment Implications It was policy, monetary and fiscal, that inspired our bullish turn in 2020 once we digested the COVID shock. We thought the macro backdrop would come down to policymakers versus the virus and our money was on the former. We remained bullish across 2021 on the idea that monetary and fiscal support would remain in place well after they ceased to be necessary. Mindful that there is no such thing as a free lunch, we expected that the emergency pandemic measures would ultimately have the effect of overstimulating demand, but we entered 2022 thinking that equities and credit would enjoy one more year of sizable excess returns over Treasuries and cash before the overstimulation manifested itself. Overweighting (underweighting) equities in a multi-asset portfolio is our default position when monetary policy is easy (tight), though we will override that default when appropriate. We have no appetite for overriding it once it becomes clear that market expectations for 2023 rate cuts are going to be disappointed and tight policy is just around the bend. Given our view that inflation will linger around 4% after easing smartly over the rest of this year, we expect that the Fed will impose restrictive monetary policy settings by the second half of 2023 in its quest to drive inflation back down to its 2% target. Markets’ overly rosy Fed expectations look sure to be disappointed and they could face a reckoning after the FOMC’s January 31-February 1 meeting. Chart 13Consolidation Now, 10%+ By The End Of The Year
Consolidation Now, 10%+ By The End Of The Year
Consolidation Now, 10%+ By The End Of The Year
That meeting could herald an inflection for risk assets’ relative performance and we are therefore joining our colleagues in adopting a neutral 12-month view on equities. We continue to differ from the BCA consensus, however, in expecting a meaningful equity rally before year end. While we expect technical resistance at 4,200 will restrain the S&P 500 in the immediate term (Chart 13), we think it will find its way back into the mid-to-high 4,000s before the Fed signals that it will take the funds rate to 4% or above, dashing hopes for a February peak around 3.5%. We still want to overweight equities in multi-asset portfolios, but only until year-end or 4,500 to 4,600, whichever comes first. Doug Peta, CFA Chief US Investment Strategist dougp@bcaresearch.com
Executive Summary The US economy is experiencing a period of stagflation: booming nominal economic growth amid a lack of volume expansion. Very strong nominal growth (due to high inflation), a tight labor market, and more evidence of a wage-price spiral will cause the Fed to err on the side of hawkishness. Global trade volumes will contract and commodity prices will drop further. The former is bearish for Emerging Asian financial markets and the latter is negative for Latin American markets. Equities are currently rallying from very oversold levels and the rebound could continue in the coming weeks. However, if we are correct about our outlook on US inflation, Fed policy and global trade, then risk assets will resume their decline and the US dollar will rally. Strong Nominal, Weak Real Growth = Stagflation
Strong Nominal, Weak Real Growth = Stagflation
Strong Nominal, Weak Real Growth = Stagflation
Bottom Line: Stay defensive and continue underweighting EM in global equity and credit portfolios. The greenback will resume its uptrend sooner rather than later. This will depress EM share prices and fixed-income markets. Financial markets interpreted Fed chairman Powell’s comments in last Wednesday’s (July 27) FOMC press conference as a dovish pivot, catalyzing a sharp rebound in the S&P500. Is the bear market over? Should investors buy risk assets, including EM ones? Chart 1No Strong Rebound In EM Share Prices
No Strong Rebound In EM Share Prices
No Strong Rebound In EM Share Prices
We are hesitant to declare an end to the bear market and to recommend higher exposure to EM risk assets and currencies. In fact, the rebound in EM stocks has been feeble (Chart 1, top panel). As a result, the relative performance of EM equities versus their DM peers has fallen back to its lows of earlier this year (Chart 1, bottom panel). Overall, we reiterate what we wrote two weeks ago “…our macro themes of Fed tightening amid slowing global growth, the US dollar overshooting, and China’s disappointing recovery remain intact. These factors still warrant a defensive investment strategy, despite a possible near-term rebound in the S&P 500. EMs will lag and underperform in this rebound.” Can The Fed Afford To Pivot? With entrenched and persistent inflation in the US running well above the Fed’s target, the Fed cannot afford to – and will not – pivot for now. A simple rollover in inflation that reflects falling commodity and goods prices will not be sufficient for the Fed to make a policy U-turn and cut rates by 50 basis points next year (as fixed-income markets expect). We have been arguing that the US is already experiencing broad-based genuine inflation and has developed a wage-price spiral. Chart 2US Wage Growth Is At Its Fastest Rate In 40 years
US Wage Growth Is At Its Fastest Rate In 40 years
US Wage Growth Is At Its Fastest Rate In 40 years
US wage growth has surged to a 40-year high of 5.7% (Chart 2). Even though the labor market is set to soften on the margin, its tightness will keep wage growth elevated. Importantly, real wages have fallen significantly, and employees will be demanding higher wages to offset lost purchasing power. US companies have been raising their prices at the fastest rate in decades. Prices charged by non-farm businesses rose at an annual rate of 8-9% in Q2, the highest in the past 40 years (Chart 3). Chart 3US Companies Are Raising Their Prices At Their Fastest Rate In 40 years
US Companies Are Raising Their Prices At Their Fastest Rate In 40 years
US Companies Are Raising Their Prices At Their Fastest Rate In 40 years
Chart 4Strong Nominal, Weak Real Growth = Stagflation
Strong Nominal, Weak Real Growth = Stagflation
Strong Nominal, Weak Real Growth = Stagflation
Even though volumes have stagnated, corporate profits have been holding up because companies have been able to raise prices. Final sales to domestic purchasers in real terms registered zero growth in Q2 from Q1(Chart 4). This entails that the US economy is currency experiencing stagflation. Given that companies are able to raise prices (generating strong nominal sales) and are facing very tight labor market conditions, they might be willing to raise wages further. In brief, a wage-price spiral is unfolding in the US. US core inflation is running well above the Fed’s 2% target. The average of seven core PCE and CPI measures – our “super core” gauge of consumer price inflation − stands at 5.5% (Chart 5). Although falling commodity and goods prices (Chart 6) could cap the upside in core inflation, they are unlikely to bring it down below 4%. Hence, core inflation will remain well above the Fed’s target of 2%. This will lead the Fed to keep tightening monetary policy. Chart 5US Super Core Inflation Is At 5.5% and Rising
US Super Core Inflation Is At 5.5% and Rising
US Super Core Inflation Is At 5.5% and Rising
Chart 6US Import Prices From Asia Will Fall
US Import Prices From Asia Will Fall
US Import Prices From Asia Will Fall
Finally, in our opinion, financial markets are underappreciating how entrenched and persistent US inflation has become and are overlooking the unfolding wage-price spiral. The latest easing in US financial conditions will cause the Fed to refocus on inflation rather than growth. That is why we maintain our theme that the Fed and US equity markets remain on a collision course. We are open to the idea that the Fed could ultimately pivot earlier than required and eventually cut rates. However, odds are that the Fed has not yet pivoted and will ramp up its hawkishness in the coming months. The bar for the Fed to turn dovish is currently much higher than at any other time in the past 35 years, as inflation is much more entrenched and higher today. In our view, Powell would not like to be remembered as the chairman under whose watch inflation became enduring. He would prefer to be remembered as Paul Volcker, and not as Arthur Burns. Under the latter’s watch in the 1970s, the US experienced a devastating era of high and persistent inflation. Global equities, credit markets and US Treasurys were very oversold a few weeks ago. That is why even a minor hint from the Fed of a possible end to the hiking cycle produced such a strong rebound in stocks and fixed-income markets. This rally could persist in the coming weeks. However, if we are correct about the outlook on US inflation, Fed policy and global trade (see the section below), then risk assets will resume their decline and the US dollar will rally. Bottom Line: The US economy is experiencing a period of stagflation: booming nominal economic growth amid a lack of volume expansion. Very strong nominal growth (due to high inflation) a tight labor market, and more evidence of a wage-price spiral will cause the Fed to err on the side of hawkishness. As a result, the current rally in risk assets is unsustainable. Global Manufacturing / Trade Contraction Global manufacturing and trade are entering a period of contraction: According to manufacturing PMI data for July, Taiwanese new export orders for overall manufacturing and the semiconductor industry have plunged to 37 and 34, respectively (Chart 7). Meanwhile, their customer inventories have surged to a 10-year high (Chart 8). Taiwan is a major supplier of semiconductors and other inputs to many industries around the world. Hence, these data suggest that industrial companies globally have stopped ordering chips and other inputs. This development is a sign of broad-based industrial weakness. Therefore, we believe that global trade volumes are set to shrink in H2 this year. Chart 7Taiwan: Overall And Semiconductor New Orders Have Plunged...
Taiwan: Overall And Semiconductor New Orders Have Plunged...
Taiwan: Overall And Semiconductor New Orders Have Plunged...
Chart 8...And Customer Inventories Have Surged
...And Customer Inventories Have Surged
...And Customer Inventories Have Surged
A similar situation is unfolding in the Korean semiconductor sector. The DRAM DXI index (revenue proxy) is falling, and DRAM and NAND spot prices are deflating (Chart 9). Notably, Korea’s overall export sector is also reeling. Business confidence among Korean exporters is plunging – this includes the latest datapoint from August (Chart 10, top panel). The nation’s export volume growth is already close to zero and export value growth is only holding up because of higher prices (Chart 10, bottom panel). Chart 9Korea: Semiconductor Prices Are Deflating
Korea: Semiconductor Prices Are Deflating
Korea: Semiconductor Prices Are Deflating
Chart 10Downside Risks For Korean Exports
Downside Risks For Korean Exports
Downside Risks For Korean Exports
Chart 11US Goods Imports Are Set To Contract
US Goods Imports Are Set To Contract
US Goods Imports Are Set To Contract
US import volumes are set to shrink in the coming months. This will deepen the global trade slump. Chart 11 illustrates that US consumption of goods-ex autos has been contracting and retail inventory of goods ex-autos has skyrocketed. Together, these developments foreshadow a major contraction in US imports and global trade volumes. Commodity prices are heading south. Chinese commodity consumption will remain in the doldrums, and US/EU demand for commodities will weaken as global manufacturing contracts. The sanctions imposed on Russia initially led buyers to increase their precautionary and speculative purchases of various commodities, creating a tailwind for prices earlier this year. However, these precautionary and speculative purchases have since been halted or reversed, causing commodity prices to plunge. We made the case for falling oil prices in our July 21 report, and BCA’s China Investment Strategy’s Special Report on copper from July 27 concludes that copper prices will decline further. Chart 12China: Has The Post-Reopening Bounce Ran Its Course?
China: Has The Post-Reopening Bounce Ran Its Course?
China: Has The Post-Reopening Bounce Ran Its Course?
Finally, the Chinese manufacturing PMI rolled over in July following the rebound in May and June. New orders, backlog orders and import subcomponents have relapsed anew (Chart 12). The Chinese economy is facing considerable headwinds from the property market, rolling lockdowns resulting from the dynamic zero-COVID policy and a contraction in exports. As we argued in our July 13 report, policy stimulus has so far been insufficient. Bottom Line: Global trade volumes will contract and commodity prices will drop further. The former is bearish for Emerging Asian financial markets and the latter is negative for Latin American markets. Investment Strategy Although the rebound in global risk assets could persist for several weeks, their risk-reward profile is not attractive. Stay defensive and continue underweighting EM in global equity and credit portfolios. The Fed’s hawkish bias as well as contracting global trade are bullish for the US dollar. As a result, the greenback will resume its uptrend sooner rather than later. This will cap the upside in EM stocks and fixed-income markets. We continue to short the following currencies versus the USD: ZAR, COP, PEN, PLN, PHP, and IDR. In addition, we recommend shorting HUF vs. CZK, KRW vs. JPY, and BRL vs. MXN. Although we find good value in many EM local yields, we do not yet recommend buying them aggressively. The basis is our view on EM currencies versus the US dollar. For now, we prefer to bet on flattening yield curves. Our current favorite markets for flatteners are Mexico and Colombia. Arthur Budaghyan Chief Emerging Markets Strategist arthurb@bcaresearch.com Strategic Themes (18 Months And Beyond) Equities Cyclical Recommendations (6-18 Months) Cyclical Recommendations (6-18 Months)
Counterpoint’s August schedule: Next week, I am travelling to see clients in Australia, New Zealand, and Singapore, so we will send you a report on China’s 20th National Party Congress written by our Chief Geopolitical Strategist, Matt Gertken. Given that the outlook for the $100 trillion Chinese real estate market is crucial for the global economy and markets, Matt’s insights will be very interesting. Then on August 18, I will host the monthly Counterpoint webcast, which I hope you can join. We will then take a week’s summer holiday and return with a report on September 1. Executive Summary In the topsy-turvy recession of 2022, real wages have collapsed. This means profits have stayed resilient and firms have not laid off workers. Making this recession a ‘cost of living crisis’ rather than a ‘jobs crisis’. If inflation comes down slowly, then the ‘cost of living crisis’ will persist. But if inflation comes down quickly while wage inflation remains sticky, firms will lay off workers to protect their profits, turning the ‘cost of living crisis’ into a ‘jobs crisis’. Either way, this will keep a choke on consumer spending, and particularly the spending on goods, which is likely to remain in recession. Meanwhile, until mortgage rates move meaningfully lower, housing investment will also remain in recession. The double choke on growth means that the bear market in the 30-year T-bond is likely over. This suggests that the bear market in stock market valuations is also over, but that ‘cyclical value’ is now vulnerable to profit downgrades. Hence, equity investors should stick with ‘defensive growth’, specifically healthcare and biotech. Fractal trading watchlist: GBP/USD and Hungarian versus Polish bonds. In The 2008 Recession, Real Wage Rates ##br##Went Up So Employment Went Down…
In The 2008 Recession, Real Wage Rates Went Up So Employment Went Down...
In The 2008 Recession, Real Wage Rates Went Up So Employment Went Down...
…But In The 2022 Recession, Real Wage Rates##br##Went Down So Employment Went Up!
...But In The 2022 Recession, Real Wage Rates Went Down So Employment Went Up!
...But In The 2022 Recession, Real Wage Rates Went Down So Employment Went Up!
Bottom Line: The bear market in the 30-year T-bond and stock market valuations is likely over, but equity investors should stick with ‘defensive growth’, specifically healthcare and biotech. Feature The US economy has just contracted for two consecutive quarters, meeting the rule-of-thumb definition of a recession. Other major economies are likely to follow. Yet many economists and strategists are in denial. This cannot be a ‘proper’ recession, they say, because the economy remains at full employment. But the recession-deniers are wrong. It is a recession, albeit it is a ‘topsy-turvy’ recession in which employment remains high (so far) because real wage rates have collapsed, circumventing the need for lay-offs. This contrasts with a typical recession when real wage rates remain high, forcing the need for lay-offs.1 The Topsy-Turvy Recession Of 2022 When do firms lay off workers? The answer is, when they need to protect their profits. Profits are nothing more than revenues minus costs, and in a typical recession revenues slow much faster than the firms’ biggest cost, the wage bill. In this event, the only way that firms can protect their profits is to lay off workers. Chart I-1 confirms that every time that nominal sales have shrunk relative to wage rates, the unemployment rate has gone up. Without exception. Chart I-1Unemployment Goes Up Whenever Firms' Wage Rates Rise Faster Than Their Revenues...
Unemployment Goes Up Whenever Firms' Wage Rates Rise Faster Than Their Revenues...
Unemployment Goes Up Whenever Firms' Wage Rates Rise Faster Than Their Revenues...
But what happens during a recession in which nominal sales do not shrink relative to wage rates? In this event, profits stay resilient, so firms do not need to lay off workers. Welcome to the topsy-turvy recession of 2022! In the topsy-turvy recession of 2022, there has been much greater inflation in consumer prices and nominal sales than in nominal wage rates (Chart I-2). The result is that real wage rates have collapsed, profits have stayed resilient, and firms have not needed to lay off workers… so far. Chart I-2...But In The 2022 Recession, Wage Rates Have Risen Slower Than Revenues, So Unemployment Hasn't Gone Up
...But In The 2022 Recession, Wage Rates Have Risen Slower Than Revenues, So Unemployment Hasn't Gone Up
...But In The 2022 Recession, Wage Rates Have Risen Slower Than Revenues, So Unemployment Hasn't Gone Up
In a typical recession, the pain falls on the minority of workers who lose their jobs, as well as on profits. Paradoxically, for the majority that keep their jobs, real wages go up. This is because sticky wage inflation tends to hold up more than collapsing price inflation. For example, in the 2008 recession, the real wage rate surged by 4 percent (Chart I-3), and in the 2020 recession it rose by 2 percent. Chart I-3In The 2008 Recession, Real Wage Rates Went Up So Employment Went Down...
In The 2008 Recession, Real Wage Rates Went Up So Employment Went Down...
In The 2008 Recession, Real Wage Rates Went Up So Employment Went Down...
Yet in the 2022 recession, the real wage rate has shrunk by 4 percent, meaning that the pain of the recession has fallen on all of us (Chart I-4). In one sense therefore, this recession is ‘fairer’ because ‘we’re all in it together’. This is confirmed by the current malaise being characterised not as a ‘jobs crisis’, but as a ‘cost of living crisis’. In another sense though, the recession is unfair because the pain has not been shared by corporate profits, which have remained resilient… so far. Chart I-4...But In The 2022 Recession, Real Wage Rates Went Down So Employment Went Up!
...But In The 2022 Recession, Real Wage Rates Went Down So Employment Went Up!
...But In The 2022 Recession, Real Wage Rates Went Down So Employment Went Up!
The crucial question is, what happens next? Using the US as our template, wage rates are growing at 5-6 percent, and this growth rate is typically stickier than sales growth. Assuming inflation drifts lower, nominal sales growth will also drift lower from its current 7 percent clip, meaning that it could soon dip below sticky wage growth. Once the growth in firms’ revenues has dipped below that in nominal wage rates, profits will finally keel over. To repeat, profits are nothing more than revenues minus costs, where the biggest cost is the wage bill (Chart I-5).2 Chart I-5Profits Are Nothing More Than Revenues Minus Costs
Profits Are Nothing More Than Revenues Minus Costs
Profits Are Nothing More Than Revenues Minus Costs
At this point, the downturn will become more conventional. To protect profits, firms will be forced to lay off workers who will bear the pain of the downturn alongside falling profits. Meanwhile, with inflation easing, real wage growth for the majority that keep their jobs will turn positive. But to repeat, this is the typical pattern in a recession. Accelerating real wage rates are entirely consistent with a contracting economy as we witnessed in both 2008 and 2020. As Two Huge Imbalances Correct, Demand Will Be Pegged Back All of this assumes that real demand will remain under pressure, so the question is what is pegging back real demand? The answer is: corrections in two huge imbalances in the global economy. A breakdown of the -1.3 percent contraction in the US economy reveals these two corrections:3 Spending on goods, which contributed -1.2 percent Housing investment, which contributed -0.7 percent. These corrections are not over. As we presciently explained back in February in A Massive Economic Imbalance, Staring Us In The Face: “The pandemic overspend on goods constitutes one of the greatest imbalances in economic history. An overspend on goods is corrected by a subsequent underspend; but an underspend on services is not corrected by a subsequent overspend. The pandemic overspend on goods constitutes one of the greatest imbalances in economic history. This unfortunate asymmetry means that the recent overspend on goods at the expense of services makes the economy vulnerable to a recession. And the risk is exacerbated by central banks’ intentions to hike rates in response to inflation” (Chart I-6). Chart I-6The Pandemic Overspend On Goods Constitutes One Of The Greatest Imbalances In Economic History
The Pandemic Overspend On Goods Constitutes One Of The Greatest Imbalances In Economic History
The Pandemic Overspend On Goods Constitutes One Of The Greatest Imbalances In Economic History
Then, in The Global Housing Boom Is Over, As Buying Becomes More Expensive Than Renting, we identified a second major imbalance that is starting to correct. Specifically, the global housing boom of the past decade, which has doubled the worth of global real estate to $370 trillion, was predicated on ultra-low mortgage rates that made buying a home more attractive than renting. But in many parts of the world now, buying a home has become more expensive than renting (Chart I-7). Disappearing US and European homebuyers combined with a flood of home-sellers will weigh on home prices and housing investment – at least until policymakers are forced to bring down mortgage rates (Chart I-8 and Chart I-9). Chart I-7Buying A Home Has Become More Expensive Than Renting!
Buying A Home Has Become More Expensive Than Renting!
Buying A Home Has Become More Expensive Than Renting!
Chart I-8Homebuyers Have Disappeared...
Homebuyers Have Disappeared...
Homebuyers Have Disappeared...
Chart I-9...While Home-Sellers Are Flooding The Market
...While Home-Sellers Are Flooding The Market
...While Home-Sellers Are Flooding The Market
Meanwhile, as Chinese policymakers try and gently let the air out of the $100 trillion Chinese real estate market, a collapse in Chinese property development and construction activity will have negative long-term implications for commodities, emerging Asia, and developing countries that produce raw materials. More Investment Conclusions In addition to the long-term investment conclusions just described, we can draw some shorter-term conclusions: If inflation comes down slowly, then the current ‘cost of living crisis’, which is pummelling everyone’s real incomes, will persist. But if inflation comes down quickly while wage inflation remains sticky, firms will be forced to lay off workers to protect their profits, turning the ‘cost of living crisis’ into a ‘jobs crisis’. Either way, this will keep a choke on consumer spending, and particularly the spending on goods, which is likely to remain in recession. Meanwhile, until mortgage rates move meaningfully lower, housing investment will also remain in recession. Equityinvestors should stick with ‘defensive growth’, specifically healthcare and biotech. This double choke on growth is likely to keep a lid on ultra-long bond yields, even if central banks need to hike short-term rates more than expected to slay inflation. Our proprietary fractal analysis confirms that the sell-off in the 30-year T-bond is likely over (Chart I-10). Chart I-10The Bear Market In The 30-Year T-Bond Is Likely Over
The Bear Market In The 30-Year T-Bond Is Likely Over
The Bear Market In The 30-Year T-Bond Is Likely Over
For the stock market, this suggests that the valuation bear market is now over, but that ‘cyclical value’ sectors are now vulnerable to profit downgrades. Hence, equity investors should stick with ‘defensive growth’, specifically healthcare and biotech. Fractal Trading Watchlist This week we noticed that the sudden 20 percent collapse of Hungarian versus Polish 10-year bonds, has reached the point of short-term fractal fragility that suggests an imminent rebound. Hence, we are adding this to our watchlist. Go long GBP/USD. But our trade is GBP/USD. UK political risk is diminishing, the BoE is likely to be as, or more, hawkish than the Fed, and the 260-day fractal structure of GBP/USD is at the point of fragility that has signalled major turning points in 2014, 15, 16, 18 and 21 (Chart I-11). Accordingly the recommendation is long GBP/USD, setting the profit target and symmetrical stop-loss at 5 percent. Chart I-11Go Long GBP/USD
Go Long GBP/USD Go Long GBP/USD
Go Long GBP/USD Go Long GBP/USD
Expect Hungarian Bonds To Rebound
Expect Hungarian Bonds To Rebound
Expect Hungarian Bonds To Rebound
Chart 1CNY/USD At A Potential Turning Point
CNY/USD At A Potential Turning Point
CNY/USD At A Potential Turning Point
Chart 2Expect Hungarian Bonds To Rebound
Expect Hungarian Bonds To Rebound
Expect Hungarian Bonds To Rebound
Chart 3Copper's Selloff Has Hit Short-Term Resistance
Copper's Selloff Has Hit Short-Term Resistance
Copper's Selloff Has Hit Short-Term Resistance
Chart 4US REITS Are Oversold Versus Utilities
US REITS Are Oversold Versus Utilities
US REITS Are Oversold Versus Utilities
Chart 5CAD/SEK Is Reversing
CAD/SEK Is Reversing
CAD/SEK Is Reversing
Chart 6Financials Versus Industrials Has Reversed
Financials Versus Industrials Has Reversed
Financials Versus Industrials Has Reversed
Chart 7The Outperformance Of Resources Versus Biotech Has Ended
The Outperformance Of Resources Versus Biotech Has Ended
The Outperformance Of Resources Versus Biotech Has Ended
Chart 8The Outperformance Of Resources Versus Healthcare Has Ended
The Outperformance Of Resources Versus Healthcare Has Ended
The Outperformance Of Resources Versus Healthcare Has Ended
Chart 9FTSE100 Outperformance Vs. Euro Stoxx 50 Is Vulnerable To Reversal
FTSE100 Outperformance Vs. Euro Stoxx 50 Is Vulnerable To Reversal
FTSE100 Outperformance Vs. Euro Stoxx 50 Is Vulnerable To Reversal
Chart 10Netherlands' Underperformance Vs. Switzerland Has Ended
Netherlands' Underperformance Vs. Switzerland Has Ended
Netherlands' Underperformance Vs. Switzerland Has Ended
Chart 11The Sell-Off In The 30-Year T-Bond At Fractal Fragility
The Sell-Off In The 30-Year T-Bond At Fractal Fragility
The Sell-Off In The 30-Year T-Bond At Fractal Fragility
Chart 12The Sell-Off In The NASDAQ Is Approaching Fractal Fragility
The Sell-Off In The NASDAQ Is Approaching Fractal Fragility
The Sell-Off In The NASDAQ Is Approaching Fractal Fragility
Chart 13Food And Beverage Outperformance Is Exhausted
Food And Beverage Outperformance Is Exhausted
Food And Beverage Outperformance Is Exhausted
Chart 14German Telecom Outperformance Has Started To Reverse
German Telecom Outperformance Has Started To Reverse
German Telecom Outperformance Has Started To Reverse
Chart 15Japanese Telecom Outperformance Vulnerable To Reversal
Japanese Telecom Outperformance Vulnerable To Reversal
Japanese Telecom Outperformance Vulnerable To Reversal
Chart 16ETH Is Approaching A Possible Capitulation
ETH Is Approaching A Possible Capitulation
ETH Is Approaching A Possible Capitulation
Chart 17The Strong Trend In The 18-Month-Out US Interest Rate Future Has Ended
The Strong Trend In The 18-Month-Out US Interest Rate Future Has Ended
The Strong Trend In The 18-Month-Out US Interest Rate Future Has Ended
Chart 18The Strong Downtrend In The 3 Year T-Bond Has Ended
The Strong Downtrend In The 3 Year T-Bond Has Ended
The Strong Downtrend In The 3 Year T-Bond Has Ended
Chart 19A Potential Switching Point From Tobacco Into Cannabis
A Potential Switching Point From Tobacco Into Cannabis
A Potential Switching Point From Tobacco Into Cannabis
Chart 20Biotech Is A Major Buy
Biotech Is A Major Buy
Biotech Is A Major Buy
Chart 21Norway's Outperformance Has Ended
Norway's Outperformance Has Ended
Norway's Outperformance Has Ended
Chart 22Cotton Versus Platinum Has Reversed
Cotton Versus Platinum Has Reversed
Cotton Versus Platinum Has Reversed
Chart 23Switzerland's Outperformance Vs. Germany Is Exhausted
Switzerland's Outperformance Vs. Germany Is Exhausted
Switzerland's Outperformance Vs. Germany Is Exhausted
Chart 24USD/EUR Is Vulnerable To Reversal
USD/EUR Is Vulnerable To Reversal
USD/EUR Is Vulnerable To Reversal
Chart 25The Outperformance Of MSCI Hong Kong Versus China Has Ended
The Outperformance Of MSCI Hong Kong Versus China Has Ended
The Outperformance Of MSCI Hong Kong Versus China Has Ended
Chart 26A Potential New Entry Point Into Petcare
A Potential New Entry Point Into Petcare
A Potential New Entry Point Into Petcare
Chart 27US Utilities Outperformance Vulnerable To Reversal
US Utilities Outperformance Vulnerable To Reversal
US Utilities Outperformance Vulnerable To Reversal
Chart 28The Outperformance Of Oil Versus Banks Is Exhausted
The Outperformance Of Oil Versus Banks Is Exhausted
The Outperformance Of Oil Versus Banks Is Exhausted
Dhaval Joshi Chief Strategist dhaval@bcaresearch.com Footnotes 1 The best measure of wage rates is the employment cost index (ECI) because it includes all forms of compensation including benefits and bonuses. 2 In fact, stock market profits are even more cyclical because, as well as wages, there are other sticky deductions from revenues such as interest and taxes. 3 All expressed as annualised rates. Fractal Trading System Fractal Trades
Welcome To The Topsy-Turvy Recession Of 2022!
Welcome To The Topsy-Turvy Recession Of 2022!
Welcome To The Topsy-Turvy Recession Of 2022!
Welcome To The Topsy-Turvy Recession Of 2022!
6-12 Month Recommendations Structural Recommendations Closed Fractal Trades Indicators To Watch - Bond Yields Chart II-1Indicators To Watch - Bond Yields - Euro Area
Indicators To Watch - Bond Yields - Euro Area
Indicators To Watch - Bond Yields - Euro Area
Chart II-2Indicators To Watch - Bond Yields - Europe Ex Euro Area
Indicators To Watch - Bond Yields - Europe Ex Euro Area
Indicators To Watch - Bond Yields - Europe Ex Euro Area
Chart II-3Indicators To Watch - Bond Yields - Asia
Indicators To Watch - Bond Yields - Asia
Indicators To Watch - Bond Yields - Asia
Chart II-4Indicators To Watch - Bond Yields - Other Developed
Indicators To Watch - Bond Yields - Other Developed
Indicators To Watch - Bond Yields - Other Developed
Indicators To Watch - Interest Rate Expectations Chart II-5Indicators To Watch - Interest Rate Expectations
Indicators To Watch - Interest Rate Expectations
Indicators To Watch - Interest Rate Expectations
Chart II-6Indicators To Watch - Interest Rate Expectations
Indicators To Watch - Interest Rate Expectations
Indicators To Watch - Interest Rate Expectations
Chart II-7Indicators To Watch - Interest Rate Expectations
Indicators To Watch - Interest Rate Expectations
Indicators To Watch - Interest Rate Expectations
Chart II-8Indicators To Watch - Interest Rate Expectations
Indicators To Watch - Interest Rate Expectations
Indicators To Watch - Interest Rate Expectations
Executive Summary Biden Taps China-Bashing Consensus
Biden's Midterm Tactics Bear Fruit… But There's A Snake
Biden's Midterm Tactics Bear Fruit… But There's A Snake
House Speaker Nancy Pelosi’s visit to Taiwan reflects one of our emerging views in 2022: the Biden administration’s willingness to take foreign policy risks ahead of the midterm elections. Biden’s foreign policy will continue to be reactive and focused on domestic politics through the midterms. Hence global policy uncertainty and geopolitical risk will remain elevated at least until November 8. Biden is seeing progress on his legislative agenda. Congress is passing a bill to compete with China while the Democrats are increasingly likely to pass a second reconciliation bill, both as predicted. These developments support our view that President Biden’s approval rating will stabilize and election races will tighten, keeping domestic US policy uncertainty elevated through November. These trends pose a risk to our view that Republicans will take the Senate, but the prevailing macroeconomic and geopolitical environment is still negative for the ruling Democratic Party. We expect legislative gridlock and frozen US fiscal policy in 2023-24. Close Recommendation (Tactical) Initiation Date Return Long Refinitiv Renewables Vs. S&P 500 Mar 30, 2022 25.4% Long Biotech Vs. Pharmaceuticals Jul 8, 2022 -3.3% Bottom Line: While US and global uncertainty remain high, we will stay long US dollar, long large caps over small caps, and long US Treasuries versus TIPS. But these are tactical trades and are watching closely to see if macroeconomic and geopolitical factors improve later this year. Feature President Biden’s average monthly job approval rating hit its lowest point, 38.5%, in July 2022. However, Biden’s anti-inflation campaign and midterm election tactics are starting to bear fruit: gasoline prices have fallen from a peak of $5 per gallon to $4.2 today, the Democratic Congress is securing some last-minute legislative wins, and women voters are mobilizing to preserve abortion access. These developments mean that the Democratic Party’s electoral prospects will improve marginally between now and the midterm election, causing Senate and congressional races to tighten – as we have expected. US policy uncertainty will increase. Investors will see a rising risk that Democrats will keep control of the Senate – and conceivably even the House – and hence retain unified control of the executive and legislative branches. This “Blue Sweep” risk will challenge the market consensus, which overwhelmingly (and still correctly) expects congressional gridlock in 2023-24. A continued blue sweep would mean larger tax hikes and social spending, while gridlock would neutralize fiscal policy for the next two years. Investors should fade this inflationary blue sweep risk and continue to plan for disinflationary gridlock. First, our quantitative election models still predict that Democrats will lose control of both House and Senate (Appendix). Second, Biden’s midterm tactics face very significant limitations, particularly emanating from geopolitics – the snake in this report’s title. Pelosi’s Trip To Taiwan Raises Near-Term Market Risks One of Biden’s election tactics is our third key view for 2022: reactive foreign policy. Initially we viewed this reactiveness as “risk-averse” but in May we began to argue that Biden could take risky bets given his collapsing approval ratings. Either way, Biden is using foreign policy as a means of improving his party’s domestic political fortunes. In particular, he is willing to take big risks with China, Russia, Iran, and terrorist groups like Al Qaeda. The template is the 1962 congressional election, when President John F. Kennedy largely defied the midterm election curse by taking a tough stance against Russia in the Cuban Missile Crisis (Chart 1). If Biden achieves a foreign policy victory, then Democrats will benefit. If he instigates a crisis, voters will rally around his administration out of patriotism. Nancy Pelosi’s visit to Taipei is the prominent example of this key view. The trip required full support from the US executive branch and military and was not only the swan song of a single politician. It was one element of the Biden administration’s decision to maintain the Trump administration’s hawkish China policy. Thus while Congress passes the $52 billion Chips and Science Act to enhance US competitiveness in technology and semiconductor manufacturing, Biden is also contemplating tightening export controls on computer chip equipment that China needs to upgrade its industry.1 Biden is reacting to a bipartisan and popular consensus holding that the US needs to take concrete measures to challenge China and protect American industry (Chart 2). This is different from the old norm of rhetorical China-bashing during midterms. Chart 1Biden Provokes Foreign Rivals
Biden's Midterm Tactics Bear Fruit… But There's A Snake
Biden's Midterm Tactics Bear Fruit… But There's A Snake
Chart 2Biden Taps China-Bashing Consensus
Biden's Midterm Tactics Bear Fruit… But There's A Snake
Biden's Midterm Tactics Bear Fruit… But There's A Snake
Reactive US foreign policy will continue through November and possibly beyond – including but not limited to China. The US chose to sell long-range weapons to Ukraine and provide intelligence targeting Russian forces, prompting Russia to declare that the US is now “directly” involved in the Ukraine conflict. The US decision to eradicate Al Qaeda leader Ayman Al-Zawahiri also reflects this foreign policy trend. Reactive foreign policy will increase the near-term risk of new negative geopolitical surprises for markets. Note that the 1962 Cuban Missile Crisis analogy is inverted when it comes to the Taiwan Strait. China is willing to take much greater risks than the US in its sphere of influence. The same goes for Russia in Ukraine. If US policy backfires then it may assist the Democrats in the election – but not if Biden suffers a humiliation or if the US economy suffers as a result. Chart 3US Import Prices Will Stay High From Greater China
US Import Prices Will Stay High From Greater China
US Import Prices Will Stay High From Greater China
US import prices will continue to rise from Greater China (Chart 3), undermining Biden’s anti-inflation agenda. Supply kinks in the semiconductor industry will become relevant again whenever demand rebounds (Chart 4). Global energy prices will also remain high as a result of the EU’s oil embargo and Russia’s continued tightening of European natural gas supplies. Chart 4New Semiconductor Kinks Will Appear When Demand Recovers
New Semiconductor Kinks Will Appear When Demand Recovers
New Semiconductor Kinks Will Appear When Demand Recovers
OPEC has decided only to increase oil production by 100,000 barrels per day, despite Biden’s visit to Saudi Arabia cap in hand. We argued that the Saudis would give a token but would largely focus on weakening global demand rather than pumping substantially more oil to help Biden and the Democrats in the election. The Saudis know that Biden is still attempting to negotiate a nuclear deal with Iran that would free up Iranian exports. So the Saudis are not giving much relief, and if Biden fails on Iran, oil supply disruptions will increase. Bottom Line: Price pressures will intensify as a result of the US-China and US-Russia standoffs – and probably also the US-Iran standoff. Hawkish foreign policy is not conducive to reducing inflationary ills. Global policy uncertainty and geopolitical risk will remain high throughout the midterm election season, causing continued volatility for US equities. Abortion Boosts Democratic Election Odds Earlier this year we highlighted that the Supreme Court’s overturning of the 1972 Roe v. Wade decision would lead to a significant mobilization of women voters in favor of the Democratic Party ahead of the midterm election. The first major electoral test since the court’s ruling, a popular referendum in the state of Kansas, produced a surprising result on August 2 that confirms and strengthens this thesis. Kansas is a deeply religious and conservative state where President Trump defeated President Biden by a 15% margin in 2020. The referendum was held during the primary election season, when electoral turnout skews heavily toward conservatives and the elderly. Yet Kansans voted by an 18% margin (59% versus 41%) not to amend the constitution, i.e. not to empower the legislature to tighten regulations on abortion. Voter turnout is not yet reported but likely far higher than in recent non-presidential primary elections. Kansans voted in the direction of nationwide opinion polling on whether abortion should be accessible in cases where the mother’s health is endangered. They did not vote in accordance with more expansive defenses of abortion, which are less popular (Chart 5). If the red state of Kansas votes this way then other states will see an even more substantial effect, at least when abortion is on the ballot. Chart 5Abortion Will Mitigate Democrats’ Losses
Biden's Midterm Tactics Bear Fruit… But There's A Snake
Biden's Midterm Tactics Bear Fruit… But There's A Snake
The question is how much of this Roe v. Wade effect will carry over to the general congressional elections. The referendum focused exclusively on abortion. Voters did not vote on party lines. Voters never like it when governments try to take away rights or privileges that have previously been granted. But in November the election will center on other topics, including inflation and the economy. And midterm elections almost always penalize the incumbent party. Our quantitative election models imply that Democrats will lose 22 seats in the House and two seats in the Senate, yielding Congress to the Republicans next year (Appendix). Still, women’s turnout presents a risk to our models. Women’s support for the Democratic Party has not improved markedly since the Supreme Court ruling, as we have shown in recent reports (Chart 6). But the polling could pick up again. Women’s turnout could be a significant tailwind in a year of headwinds for the Democrats. Bottom Line: Democrats’ electoral prospects have improved, as we anticipated earlier this year (Chart 7). This trend will continue as a result of the mobilization of women. Republicans are still highly likely to take Congress but our conviction on the Senate is much lower than it is on the House. Chart 6Biden’s And Democrats’ Approval Among Women
Biden's Midterm Tactics Bear Fruit… But There's A Snake
Biden's Midterm Tactics Bear Fruit… But There's A Snake
Chart 7Democrats’ Odds Will Improve On Margin
Biden's Midterm Tactics Bear Fruit… But There's A Snake
Biden's Midterm Tactics Bear Fruit… But There's A Snake
Reconciliation Bill: Still 65% Chance Of Passing Ultimately Democrats’ electoral performance will depend on inflation, the economy, and cyclical dynamics. If inflation falls over the course of the next three months, then Democrats will have a much better chance of stemming midterm losses. That is why President Biden rebranded his slimmed down “Build Back Better” reconciliation bill as the “Inflation Reduction Act.” We maintain our 65% odds that the bill will pass, as we have done all year. There is still at least a 35% chance that Senator Kyrsten Sinema of Arizona could defect from the Democrats, given that she opposed any new tax hikes and the reconciliation bill will impose a 15% minimum tax on corporations. A single absence or defection would topple the budget reconciliation process, which enables Democrats to pass the bill on a simple majority vote. We have always argued that Sinema would ultimately fall in line rather than betraying her party at the last minute before the election. This is even more likely given that moderate-in-chief, Senator Joe Manchin of West Virginia, negotiated and now champions the bill. But some other surprise could still erase the Democrats’ single-seat majority, so we stick with 65% odds. Most notably the bill will succeed because it actually reduces the budget deficit – by an estimated $300 billion over a decade (Table 1). Deficit reduction was the original purpose of lowering the number of votes required to pass a bill under the budget reconciliation process. Now Democrats are using savings generated from new government caps on pharmaceuticals (a popular measure) to fund health and climate subsidies. Given deficit reduction, it is conceivable that a moderate Republican could even vote for the bill. Table 1Democrats’ Inflation Reduction Act (Budget Reconciliation)
Biden's Midterm Tactics Bear Fruit… But There's A Snake
Biden's Midterm Tactics Bear Fruit… But There's A Snake
Bottom Line: Democrats are more likely than ever to pass their fiscal 2022 reconciliation bill by the September 30 deadline. The bill will cap some drug prices and reduce the deficit marginally, so it can be packaged as an anti-inflation bill, giving Democrats a legislative win ahead of the midterm. However, its anti-inflationary impact will ultimately be negligible as $300 billion in savings hardly effects the long-term rising trajectory of US budget deficits relative to output. The bill will add to voters’ discretionary income and spur the renewable energy industry. And if it helps the Democrats retain power, then it enables further spending and tax hikes down the road, which would prove inflationary. The reconciliation bill, annual appropriations, and the China competition bill were the remaining bills that we argued would narrowly pass before the US Congress became gridlocked again. So far this view is on track. Investment Takeaways Companies that paid a high effective corporate tax rate before President Trump’s tax cuts have benefited relative to those that paid a low effective rate. They stood to suffer most if Trump’s tax cuts were repealed. But Democrats were forced to discard their attempt to raise the overall corporate tax rate last year. Instead the minimum corporate rate will rise to 15%, hitting those that paid the lowest effective rate, such as Big Tech companies, relative to high-tax rate sectors such as energy (Chart 8, top panel). Tactically energy may still underperform tech but cyclically energy could outperform and the reconciliation bill would feed into that trend. Similarly, companies that faced high foreign tax risk, because they made good income abroad but paid low foreign tax rates, stand to suffer most from the imposition of a minimum corporate tax rate (Chart 8, bottom panel). Again, Big Tech stands to suffer, although it has already priced a lot of bad news and may not perform poorly in the near term. Chart 8Market Responds To Minimum Corporate Tax
Market Responds To Minimum Corporate Tax
Market Responds To Minimum Corporate Tax
Chart 9Market Responds To New Climate Subsidies
Market Responds To New Climate Subsidies
Market Responds To New Climate Subsidies
Renewable energy stocks have rallied sharply on the news of the Democrats’ reconciliation bill getting back on track (Chart 9). We are booking a 25.4% gain on this tactical trade and will move to the sidelines for now, although renewable energy remains a secular investment theme. Health stocks, particularly pharmaceuticals, have taken a hit from the new legislation as we expected. However, biotech has not outperformed pharmaceuticals as we expected, so we will close this tactical trade for a loss of 3.3%. The reconciliation bill will cap drug prices for only the most popular generic drugs and does not pose as much of a threat to biotech companies (Chart 10). Biotech should perform well tactically as long bond yields decline – they are also historically undervalued, as noted by Dhaval Joshi of our Counterpoint strategy service. So we will stick to long Biotech versus the broad market. US semiconductors remain in a long bull market and will be in heavy demand once global and US economic activity stabilize. They are also likely to outperform competitors in Greater China that face a high and persistent geopolitical risk premium (Chart 11). Chart 10Market Responds To Drug Price Caps
Market Responds To Drug Price Caps
Market Responds To Drug Price Caps
Chart 11Market Responds To China Competition Bill
Market Responds To China Competition Bill
Market Responds To China Competition Bill
Tactically we prefer bonds to stocks, US equities to global equities, defensive sectors to cyclicals, large caps to small caps, and growth stocks to value stocks (Chart 12). The US is entering a technical recession, Europe is entering recession, China’s economy is weak, and geopolitical tensions are at extreme highs over Ukraine, Taiwan, and Iran. The US is facing an increasingly uncertain midterm election. These trends prevent us from adding risk in our portfolio in the short term. However, much bad news is priced and we are on the lookout for positive economic surprises and successful diplomatic initiatives to change the investment outlook for 2023. If the US and China recommit to the status quo in the Taiwan Strait, if Russia moves toward ceasefire talks in Ukraine, if the US and Iran rejoin the 2015 nuclear deal, then we will take a much more optimistic attitude. Some political and geopolitical risks could begin to recede in the fourth quarter – although that remains to be seen. And even then, geopolitical risk is rising on a secular basis. Chart 12Tactically Recession And Geopolitics Will Weigh On Risk Assets
Tactically Recession And Geopolitics Will Weigh On Risk Assets
Tactically Recession And Geopolitics Will Weigh On Risk Assets
Matt Gertken Senior Vice President Chief US Political Strategist mattg@bcaresearch.com Footnotes 1 Alexandra Alper and Karen Freifeld, “U.S. considers crackdown on memory chip makers in China,” Reuters, August 1, 2022, reuters.com. Strategic View Open Tactical Positions (0-6 Months) Open Cyclical Recommendations (6-18 Months) Table A2Political Risk Matrix
Biden's Midterm Tactics Bear Fruit… But There's A Snake
Biden's Midterm Tactics Bear Fruit… But There's A Snake
Table A3US Political Capital Index
Biden's Midterm Tactics Bear Fruit… But There's A Snake
Biden's Midterm Tactics Bear Fruit… But There's A Snake
Chart A1Presidential Election Model
Third Quarter US Political Outlook: Last Ditch Effort
Third Quarter US Political Outlook: Last Ditch Effort
Chart A2Senate Election Model
Third Quarter US Political Outlook: Last Ditch Effort
Third Quarter US Political Outlook: Last Ditch Effort
Table A4House Election Model
Biden's Midterm Tactics Bear Fruit… But There's A Snake
Biden's Midterm Tactics Bear Fruit… But There's A Snake
Table A5APolitical Capital: White House And Congress
Biden's Midterm Tactics Bear Fruit… But There's A Snake
Biden's Midterm Tactics Bear Fruit… But There's A Snake
Table A5BPolitical Capital: Household And Business Sentiment
Biden's Midterm Tactics Bear Fruit… But There's A Snake
Biden's Midterm Tactics Bear Fruit… But There's A Snake
Table A5CPolitical Capital: The Economy And Markets
Biden's Midterm Tactics Bear Fruit… But There's A Snake
Biden's Midterm Tactics Bear Fruit… But There's A Snake
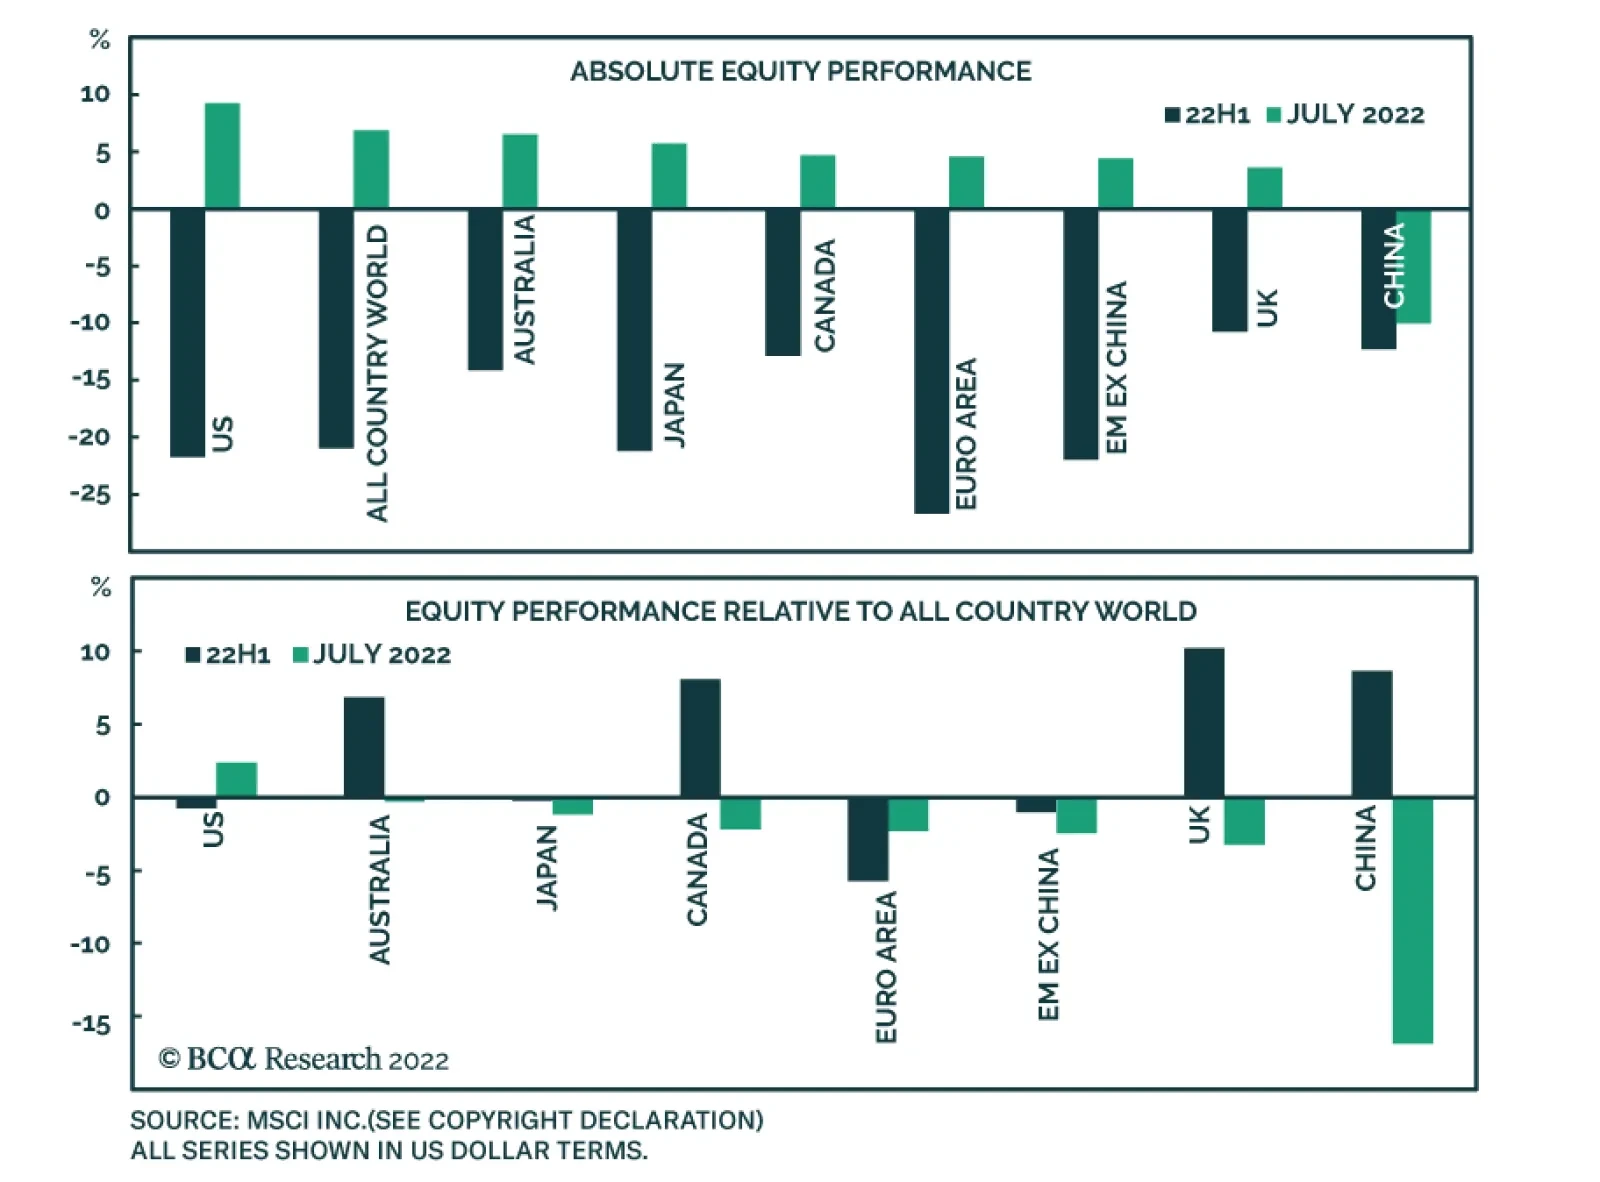
Earlier this week, we highlighted that with the exception of Chinese stocks, all major global equity indices advanced in July. Falling bond yields created a tailwind for global stocks. Bond market dynamics partially explain relative equity performance…