Equities
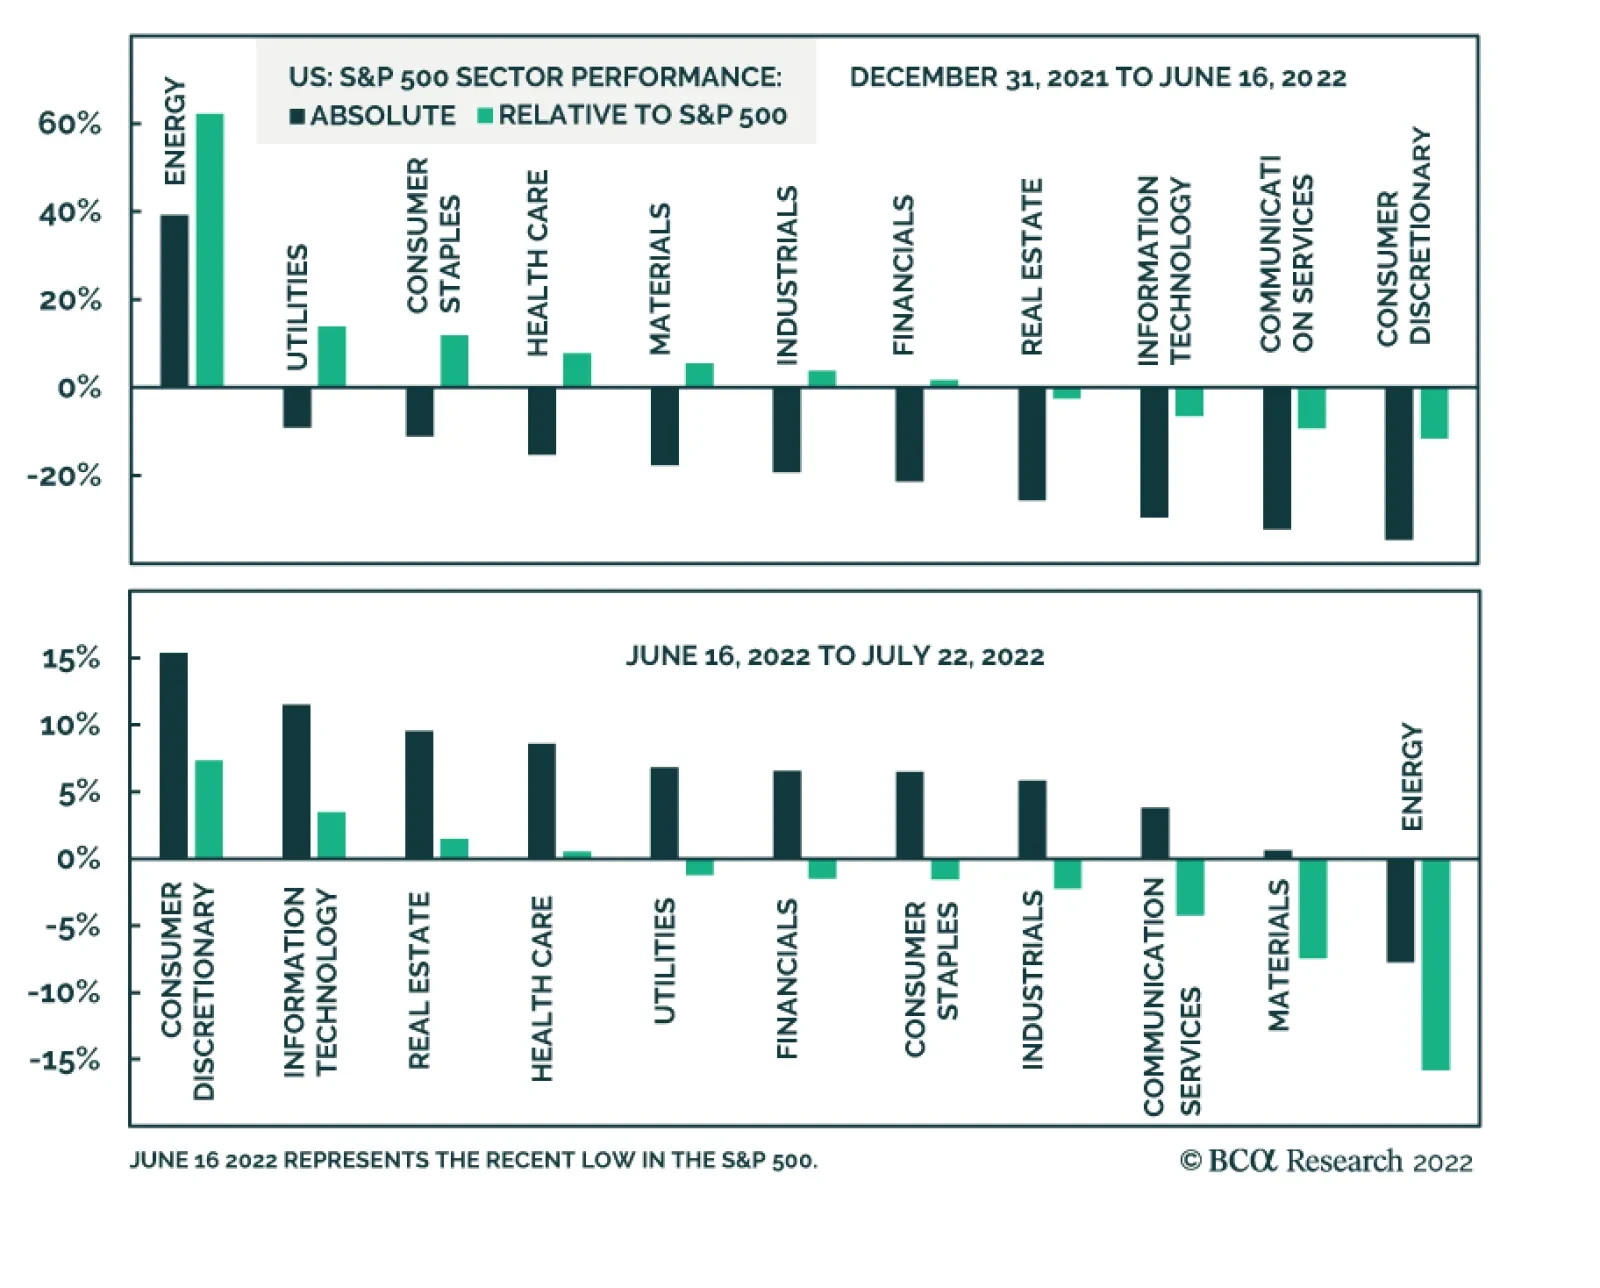
This year’s US equity selloff has been broad-based. Energy is the only S&P 500 sector that has posted year-to-date gains. The indiscriminate nature of the slump highlights that macro forces are behind the weakness. The Fed’s abrupt hawkish pivot has…

Executive Summary More Tightening To Come
More Tightening To Come
More Tightening To Come
In the following report we answer the most asked questions from our recent “Bear Market 2.0” webcast. Macroeconomic backdrop and inflation: While commodity prices falling, the wage-price spiral is in full force, implying that it will take many months to reach the level of PCE inflation palatable to the Fed. The Fed will continue to tighten monetary conditions until entrenched inflation reaches its target, which may take longer than the market expects. Earnings outlook: Q2-2022 results show that an earnings slowdown has already commenced and is bound to get worse over the next couple of quarters. However, earnings forecasts are still too optimistic and a slowdown in earnings growth is not yet priced in. Investment themes: We recommend topping up allocation to Tech as it benefits from rate stabilization. However, be judicious in your choices, staying away from the more cyclical areas, such as Hardware and Equipment, and Semiconductors. We are overweight Software and Services, which is dominated by profitable and stable growth companies. Bottom Line: We continue to recommend that investors remain patient and prudent in range-bound markets. Earnings growth is likely to deteriorate into the year end. Feature Last Monday, July 18, I hosted a webcast called “Bear Market 2.0.” A total of 675 people dialed in, and I was honored. The webcast generated a significant number of client questions which I aim to address in this weekly publication. Broadly speaking, questions fell under each of the three rubrics of the webcast: Macroeconomic backdrop, earnings outlook, and investment themes, with the latter generating the lion’s share of questions. In today’s report, we will discuss inflation and rates, earnings season results, potential S&P 500 targets, whether the S&P 500 rally is sustainable, and if it is a good idea to top up Tech. We will address remaining questions on Energy and Materials, and Semiconductor in the near future. And as always, we are looking forward to more questions! Macroeconomic Backdrop How do you reconcile your inflation outlook with an assumption that long yields may have peaked? In the “Fat and Flat” and “Adaptive Expectations” reports, we outline our view that the market’s focus is shifting away from concerns about inflation and the hawkish Fed toward worries about growth. Indeed, the 10-year rate has stabilized at 2.78% on fears of impending slowdown (Chart 1). How does this reconcile with our view that inflation is entrenched and broadening (Chart 2), especially in light of the recent pullback in energy and commodities prices? Chart 1Yields Are Stabilizing
Yields Are Stabilizing
Yields Are Stabilizing
Chart 2Inflation Is Entrenched
Inflation Is Entrenched
Inflation Is Entrenched
Even if energy and commodities prices are falling, the latest wage survey from the Atlanta Fed demonstrates wage growth is not letting up, and labor costs, at over 50% of sales as per NIPA accounts, are a more important component of the US corporate cost structure than the cost of energy. Inflation is embedded as, companies pass on wage increases to customers by increasing prices – and, voilà, the wage-price spiral is becoming pervasive. This dynamic implies the following: Even if inflation peaks over the next several months, it will take many months to reach the level of PCE inflation palatable to the Fed. After having mismanaged inflation over the past 18 months, the Fed will err on the side of tighter policy. In fact, in its official statement, the Fed has asserted that its commitment to bringing inflation to its 2% target is unconditional. Therefore, we are still in the early innings of the monetary tightening cycle (Chart 3), where elevated inflation coexists with slowing growth and range-bound long rates. Bottom Line: The Fed will continue to tighten monetary conditions until entrenched inflation reaches its target, which may take longer than the market expects. Chart 3More Tightening To Come
More Tightening To Come
More Tightening To Come
Earnings Outlook What are your takeaways from the earnings seasons so far? In the Daily Insight, which we published on July 21, we offer our initial reaction to the results. In short, so far earnings have been good, but margins are under pressure (Chart 4) from rising wages and fading pricing power (Chart 5). We have also heard quite a few negative comments from companies concerning the effects of inflation and rising costs, a strong dollar, and withdrawal from Russia. Some of the largest Technology companies announced slowdowns in hiring as they anticipate falls in demand. Forward guidance has also been concerning. Most companies talk about deteriorating economic conditions. Chart 4Margins Are Expected To Contract
Margins Are Expected To Contract
Margins Are Expected To Contract
Chart 5Pricing Power Turning
Pricing Power Turning
Pricing Power Turning
We are still convinced that street forecasts of earnings growing at about a 10% rate over the next 12 months and 11% into year-end (Table 1), despite ubiquitous negative corporate guidance, are unrealistically high. Even in this reporting season for Q2-22, earnings growth is -3%, excluding Energy. Table 1S&P 500 EPS: Actual And Expected
What Our Clients Are Asking: The Bear Market 2.0 Webcast Follow Up
What Our Clients Are Asking: The Bear Market 2.0 Webcast Follow Up
It is unlikely that, over the next several months, macro headwinds, such as slowing growth, the hawkish Fed, stubborn inflation, and rising wages will dissipate. There is little consensus among analysts on forecasts (Chart 6) and downgrades are likely. We take it a step further, and call an earnings recession in three to six months. Chart 6Analysts Have Little Confidence In Their Forecasts
Analysts Have Little Confidence In Their Forecasts
Analysts Have Little Confidence In Their Forecasts
Bottom Line: Q2-2022 results show that an earnings slowdown has most likely already commenced and is bound to get worse over the next couple of quarters. However, earnings forecasts are still too optimistic and a slowdown in earnings growth is not yet priced in. Do you think that the slowdown in earnings might trigger multiple expansion? Earnings contraction, everything else equal, translates into multiple expansion, as the denominator of the fraction gets smaller. For example, according to our back-of-the-envelope estimates, earnings contracting by 10% will increase the forward multiple from the current 16x to 19x. Therefore, the key question here is how likely is it that everything else will indeed stay equal, as opposed to the market selling off in line with earnings? Multiples will expand if the market is able to see past negative earnings growth, identifying a catalyst for an imminent rebound. That was the case in 2020 as investors anticipated earnings bouncing back helped by easy monetary and fiscal policy, and COVID receding. What will be a catalyst for earnings rebound in, say, 2023? We can only speculate but one of the potential reasons for faster earnings growth is perhaps normalization of growth outside of the US: A weaker dollar, peace in Ukraine, resolution of the energy crisis, or ultra-loose monetary and fiscal policy in China. At home, the anticipation of a soft landing and a more dovish monetary policy coupled with a positive real wage growth boosting consumers’ spending power may be sufficient to reassure investors that earnings growth turning positive is imminent. However, all of these developments are probably months away. And we expect the market to sell off if earnings growth disappoints. Where do you see the S&P 500 by the end of the year? Broadly speaking, BCA Research does not provide targets but rather aims to offer insights into market trends. However, in the “Is Earnings Recession In The Cards?” report, we presented a matrix outlining different scenarios of earnings growth vs. forward multiples to arrive at a potential range of the outcomes for the index. We assume that the forward multiple stays at 16x, as the multiple contraction stage of the bear market is likely completed, but there is still no clear catalyst for earnings rebound. We will approximate CY 2022 results using the Next Twelve Months Matrix (Table 2). Table 2The S&P 500 Price Target Scenarios
What Our Clients Are Asking: The Bear Market 2.0 Webcast Follow Up
What Our Clients Are Asking: The Bear Market 2.0 Webcast Follow Up
We can distill the matrix into three likely scenarios: Earnings growth delivered by companies in line with analyst expectations of 11% over the six months; flat earnings (0% growth) broadly in line with the forecast based on our earnings model; and the worst-case scenario of a severe earnings contraction of -10% into year-end. We assign 25% to both extreme cases and about 50% to earnings staying flat for the next six months (earnings recession commencing in 2023). Best-case scenario: Earnings grow into year-end by 11%, and by 9.7% over the next 12 months. In that case, the S&P 500 will end the year at 3,837 or 3% off the current level. This is what is being priced in. Most likely scenario: Earnings growth trends to zero by the end of the year with the S&P 500 hitting 3500 or downshifting roughly 10% from here. Worst-case scenario: Earnings contract by 10%, and with the multiple staying at 16x, the S&P 500 price target will be 3287 or about 17% lower than today. With “E” falling so much, perhaps the multiple expands to 17x, in which case the market will fall “only” 11% from here. Bottom Line: We expect flagging earnings to cause another leg of the bear market, which is likely to be 5-10% into year-end, and perhaps another 5-10% in 2023. Equity Market Outlook And Key Investment Themes Are investors capitulating? Are we near or even past the bottom? The decline in oil and food prices and the easing of supply-side bottlenecks have alleviated market worries about US inflation. This, coupled with oversold risk assets, and apparent extreme pessimism in investor sentiment, has resulted in the S&P 500 rebounding 8% from its June lows. Sectors that have sold off the most over the past six months have bounced back the hardest (Chart 7). Naturally, the question that is top of mind for investors is whether this rebound is sustainable. Should they add beaten-down cyclicals to their portfolios to partake in the rally? Of course, no one can predict what Mr. Market will do with 100% certainty but here are some thoughts: Chart 7Sector Performance Overview
What Our Clients Are Asking: The Bear Market 2.0 Webcast Follow Up
What Our Clients Are Asking: The Bear Market 2.0 Webcast Follow Up
Positives Many risk assets are severely oversold, and for long-term investors, an entry point is attractive valuation-wise. So far, many investors find earnings season results somewhat encouraging: Netflix soared on what its CEO Hawkins called “less bad results.” Multiples have contracted and priced in most of the primary effects of high inflation and rising rates. Negatives The Fed is determined to extinguish inflation, and this hiking cycle may end up much longer and steeper than the market is pricing in. We do not anticipate monetary easing in the first half of 2023. Financial markets are currently underrating the risk of a seriously hawkish Fed. Economic growth is slowing, and consensus forecasts of earnings growth are still overly optimistic. Earnings contraction over the next several quarters is likely but is certainly not priced in, and disappointment may rock markets. The catalyst for this summer’s rebound is two-fold: The market is celebrating the end of inflation worries and is rebounding from severely oversold conditions. Black swan “generators” such as China and Russia, may have more surprises in stock (Table 3). We continue to stick to “fat and down” expectations for the equities outlined in the “Adaptive Expectations” report and anticipate a range-bound market where relief rallies are alternated with pullbacks, mostly triggered by growth disappointments and realizations that the Fed has dug in its heels and is unlikely to let up anytime soon. The “down” leg will ensue if earnings contract. Yet we recommend investors take a granular approach to industry selection and start tilting portfolios away from assets that benefit from rising inflation, such as Energy and Materials, towards the “growthy” assets that benefit from rate stabilization and falling growth. We picked up on the turning point and upgraded Growth to overweight in early July, funding it from Value. Table 3Scorecard
What Our Clients Are Asking: The Bear Market 2.0 Webcast Follow Up
What Our Clients Are Asking: The Bear Market 2.0 Webcast Follow Up
Bottom Line: We consider the recent rebound in US equities a bear market rally, and don’t believe that it is sustainable. The Fed and the stock market are on a collision course – easier financial conditions will make the Fed even more aggressive. Is it time to buy Tech? As we have highlighted in the “Are We There Yet?!” report back in January, Tech’s worst performance is two to three months prior to the first rate hike, and the rebound is two to three months after the beginning of the monetary cycle. The slump and a recent rally are perfectly in line with history (Chart 8). Rates have stabilized and “growthy” Tech has pounced (Chart 9). Another issue that was holding the sector back earlier in the year was a slowdown in demand for Tech investment (Chart 10). Recently, business demand for Tech has picked up. However, US consumer spending on Tech is falling, as demand for consumer goods, pulled forward by the pandemic, is fading (Chart 11). Therefore, we need to be judicious in our selection of technology stocks. Chart 8Tech Performance During A Hiking Cycle
What Our Clients Are Asking: The Bear Market 2.0 Webcast Follow Up
What Our Clients Are Asking: The Bear Market 2.0 Webcast Follow Up
Chart 9Technology Rebounded On The Back Of Yields Peaking
Technology Rebounded On The Back Of Yields Peaking
Technology Rebounded On The Back Of Yields Peaking
Chart 10Corporate Demand For Tech Has Picked Up…
Corporate Demand For Tech Has Picked Up…
Corporate Demand For Tech Has Picked Up…
We reiterate our overweight in Software and Services, which is least exposed to consumer demand. Our thesis is that this industry group represents “defensive growth” thanks to the key trends of digitization of the US economy and migration to cloud. Spending on digitization and the cloud are pervasive across non-tech companies and capture a large swath of corporate America by both size and industry. Also, software and services companies tend to have stable earnings growth throughout the cycle, as software improves productivity and cuts costs (Chart 12). Chart 11...But Consumer Spending Slowed
...But Consumer Spending Slowed
...But Consumer Spending Slowed
Chart 12Software Is Defensive Growth
Software Is Defensive Growth
Software Is Defensive Growth
We are underweight more cyclical Hardware and Equipment, and Semiconductors industry groups as they are more exposed to the slowing economy and the flagging demand for hardware and chips. We will take a close look at the Semiconductor Industry Group in the near future. Bottom Line: We recommend topping up allocation to tech as it benefits from rate stabilization. However, be judicious in your choices, staying away from the more cyclical areas, such as Hardware and Equipment, and Semiconductors. We are overweight Software and Services, which is dominated by profitable and stable growth companies. Irene Tunkel Chief Strategist, US Equity Strategy irene.tunkel@bcaresearch.com Recommended Allocation Recommended Allocation: Addendum
What Our Clients Are Asking: The Bear Market 2.0 Webcast Follow Up
What Our Clients Are Asking: The Bear Market 2.0 Webcast Follow Up
Executive Summary Iran Reaches Nuclear Breakout
Biden And Putin Court The Middle East
Biden And Putin Court The Middle East
The next geopolitical crisis will stem from the Middle East. The US, Russia, and China are striving for greater influence there and Iran’s nuclear quest is reaching a critical juncture. The risk of US-Israeli attacks against Iran remains 40% over the medium term and will rise sharply if Iran attempts to construct a deliverable nuclear device. Saudi Arabia may increase oil production but only if global demand holds up, which OPEC will assess at its August 3 meeting. Global growth risks will prevail in the short term and reduce its urgency. Russia will continue to squeeze supplies of energy and food for the outside world. The restart of Nord Stream 1 and the Turkey-brokered grain export proposal are unreliable signals. Russia’s aim is victory in Ukraine and any leverage will be used. The US may be done with the Middle East but the Middle East may not be done with the US. Structurally we remain bullish on gold and European defense stocks but we are booking 17% and 18% gains on our current trades. The deterioration in global growth and likely pullback in inflation will temporarily undercut these trades. Tactical Recommendation Inception Date Return LONG GOLD (CLOSED) 2019-06-12 17.1% LONG EUROPEAN AEROSPACE & DEFENSE / EUROPEAN TECH EQUITIES (CLOSED) 2022-03-18 17.9% Bottom Line: Global demand is weakening, which will weigh on bond yields and commodities. Yet underlying oil supply constraints persist – and US-Iran conflict will exacerbate global stagflation. Feature Chart 1Equity Volatility And Oil Price Volatility
Equity Volatility And Oil Price Volatility
Equity Volatility And Oil Price Volatility
US President Joe Biden visited Saudi Arabia last week in a belated attempt to make amends with OPEC, increase oil production, and reduce inflation ahead of the midterm election. Biden also visited Israel to deter Iran, which is the next geopolitical crisis that markets are underrating. Meanwhile Russian President Vladimir Putin went to Iran on his second trip outside of Russia since this year’s invasion of Ukraine. Putin sought an ally in his conflict with the West, while also negotiating with Turkish President Recep Erdogan, who sought to position himself as a regional power broker. In this report we analyze Biden’s and Putin’s trips and what they mean for the global economy and macro investors. Macroeconomics is bearish for oil in the short term but geopolitics is bullish for oil in the short-to-medium term. The result is volatility (Chart 1). OPEC May Pump More Oil But Not On Biden’s Time Frame Here are the important developments from Biden’s trip: A credible threat against Iran: The US and Israel issued a joint declaration underscoring their red line against Iranian nuclear weaponization.1 Meanwhile the Iranians claimed to have achieved “nuclear breakout,” i.e. enough highly enriched uranium to construct a nuclear device (Chart 2). A balance-of-power coalition to contain Iran: Israel and Saudi Arabia improved relations on the margin. Each took action to build on the strategic détente between Israel and various Arab states that is embodied in the 2020 Abraham Accords.2 This strategic détente has staying power because it is a self-interested attempt by the various nations to protect themselves against common rivals, particularly Iran (Chart 3). Biden also tried to set up a missile defense network with Israel and the Arabs, although it was not finalized.3 Chart 2Iran Reaches Nuclear Breakout
Biden And Putin Court The Middle East
Biden And Putin Court The Middle East
A reaffirmed US-Saudi partnership: The US and Saudi Arabia reaffirmed their partnership despite a rocky patch over the past decade. The rocky patch arises from US energy independence, China’s growth, and US attempts to normalize ties with Iran (Chart 4). These trends caused the Saudis to doubt US support and to view China as a strategic hedge. Chart 3Iran: Surrounded And Outgunned
Biden And Putin Court The Middle East
Biden And Putin Court The Middle East
President Biden came into office aiming to redo the Iran deal and halt arms sales to Saudi Arabia. Since then he has been chastened by high energy prices, a low approval rating, and hawkish Iranian policy. On this trip he came cap in hand to the Saudis in a classic example of geopolitical constraints. If the US-Iran deal is verifiably dead, then US-Saudi ties will improve sustainably. (Though of course the Saudis will still do business with China and even start trading with China in the renminbi.) What global investors want to know is whether the Saudis and OPEC will pump more oil. The answer is maybe someday. The Saudis will increase production to save the global business cycle but not the Democrats’ election cycle. They told Biden that they will increase production only if there is sufficient global demand. Global Brent crude prices have fallen by 6% since May, when Biden booked his trip, so the kingdom is not in a great rush to pump more. Its economy is doing well this year (Chart 5). Chart 4Drivers Of Saudi Anxiety
Drivers Of Saudi Anxiety
Drivers Of Saudi Anxiety
Chart 5Saudis Won't Pump If Demand Is Weak
Saudis Won't Pump If Demand Is Weak
Saudis Won't Pump If Demand Is Weak
At the same time, if global demand rebounds, the Saudis will not want global supply constraints to generate punitive prices that cap the rebound or kill the business cycle. After all, a global recession would deplete Saudi coffers, set back the regime’s economic reforms, exacerbate social problems, and potentially stir up political dissent (Chart 6). Related Report Geopolitical StrategyThird Quarter Geopolitical Outlook: Thunder And Lightning Hence the Saudis will not increase production substantially until they have assessed the global economy and discussed the outlook with the other members of the OPEC cartel in August and September, when the July 2021 agreement to increase production expires. We expect global demand to weaken as Europe and China continue to struggle. Our Commodity & Energy Strategist Bob Ryan argues that further escalation in the energy war between the EU and Russia could push prices above $220 per barrel by Q4 2023, whereas an economic collapse could push Brent down to $60 per barrel. His base case Brent price forecast remains $110 per barrel on average in 2022 and $117 per barrel in 2023 (Chart 7). Chart 6Saudis Will Pump To Prevent Recession
Saudis Will Pump To Prevent Recession
Saudis Will Pump To Prevent Recession
Chart 7BCA's July 2022 Oil Price Forecast
BCA's July 2022 Oil Price Forecast
BCA's July 2022 Oil Price Forecast
The geopolitical view suggests upside oil risks over the short-to-medium time frame but the macroeconomic view suggests that downside risks will be priced first. Bottom Line: Saudi Arabia may increase production but not at any US president’s beck and call. The Saudis are not focused on US elections, they benefit from the current level of prices, and they do not suffer if Republicans take Congress in November. The downside risk in oil prices stems from demand disappointments in global growth (especially China) rather than any immediate shifts in Saudi production discipline. Volatility will remain high. US-Iran Talks: Dying But Not Dead Yet In fact the Middle East underscores underlying and structural oil supply constraints despite falling global demand. While Iran is a perennial geopolitical risk, the world is reaching a critical juncture over the next couple of years. Investors should not assume that Iran can quietly achieve nuclear arms like North Korea. Since August 2021 we have argued that the US and Iran would fail to put back together the 2015 nuclear deal (the Joint Comprehensive Plan of Action or JCPA). This failure would in turn lead to renewed instability across the Middle East and sporadic supply disruptions as the different nations trade military threats and potentially engage in direct warfare. This forecast is on track after Biden’s and Putin’s trip – but we cannot yet say that it is fully confirmed. Biden’s joint declaration with Israeli Prime Minister Yair Lapid closed any daylight that existed between the US and Israel. Given that there was some doubt about the intentions of Biden and the Democrats, it is now crystal clear that the US is determined to prevent Iran from getting nuclear weapons even if it requires military action. The US specifically said that it will use “all instruments of national power” to prevent that outcome. Chart 8Iran Not Forced To Capitulate
Iran Not Forced To Capitulate
Iran Not Forced To Capitulate
Judging by the tone of the statement, the Israelis wrote the document and Biden signed it.4 Biden’s foreign policy emphasizes shoring up US alliances and partnerships, which means letting allies and partners set the line. Israel’s Begin Doctrine – which says that Israel is willing to attack unilaterally and preemptively to prevent a hostile neighbor from obtaining nuclear weapons – has been reinforced. The US is making a final effort to intimidate Iran into rejoining the deal. By clearly and unequivocally reiterating its stance on nuclear weapons, and removing doubts about its stance on Israel, there is still a chance that the Iranian calculus could change. This is possible notwithstanding Ayatollah Khamenei’s friendliness with Putin and criticisms of western deception.5 After all, why would the Iranians want to be attacked by the US and Israeli militaries? Iran will need to think very carefully about what it does next. Khamenei just turned 83 years old and is trying to secure the Islamic Republic’s power transition and survival after his death. Here are the risks: Iran’s economy, buoyed by the commodity cycle, is not so weak as to force Khamenei to capitulate. Back in 2015 oil prices had collapsed and his country was diplomatically isolated. Today the economy has somewhat weathered the storm of the US’s maximum pressure sanctions (Chart 8). Iran is in bad shape but it has not been brought to its knees. Another risk is that Khamenei believes the American public lacks the appetite for war. Americans say they are weary of Middle Eastern wars and do not feel particularly threatened by Iran. However, this would be a miscalculation. US war-weariness is nearing the end of its course. The US engages in a major military expedition roughly every decade. Americans are restless and divided – and the political elite fear populism – so a new foreign distraction is not as unlikely as the consensus holds. Moreover a nuclear Iran is not an idle threat but would trigger a regional nuclear arms race and overturn the US grand strategy of maintaining a balance of power in the Middle East (as in other regions). In short, the US government can easily mobilize the people to accept air strikes to prevent Iran from going nuclear because there is latent animosity toward Iran in both political parties (Chart 9). Chart 9Risk: Iran Overrates US War-Weariness
Biden And Putin Court The Middle East
Biden And Putin Court The Middle East
Another risk is that Iran forges ahead believing that the US and Israel are unwilling or unable to attack and destroy its nuclear program. The western powers might opt for containment like they did with North Korea or they might attack and fail to eliminate the program. This is hard to believe but Iran clearly cannot accept US security guarantees as an alternative to a nuclear deterrent when it seeks regime survival. At the same time Russia is courting Iran, encouraging it to join forces against the American empire. Iran is planning to sell drones to Russia for use in Ukraine, while Russia is maintaining nuclear and defense cooperation with Iran. Putin’s trip highlighted a growing strategic partnership despite a low base of economic ties (Chart 10).6 Chart 10Russo-Iranian Ties
Russo-Iranian Ties
Russo-Iranian Ties
Chart 11West Vulnerable To Middle East War
Biden And Putin Court The Middle East
Biden And Putin Court The Middle East
While Russia does not have an interest in a nuclear-armed Iran, it is not afraid of Iran alone, and it would benefit enormously if the US and Israel got bogged down in a new war that destabilized the Middle East. Oil prices would rise, the US would be distracted, and Europe would be even more vulnerable (Chart 11). Chart 12China's Slowdown And Dependency On Middle East
China's Slowdown And Dependency On Middle East
China's Slowdown And Dependency On Middle East
China’s interest is different. It would prefer for Iran to undermine the West by means of a subtle and long-term game of economic engagement rather than a destabilizing war in the region that would upset China’s already weak economy. However, Beijing will not join with the US against Iran, especially if Iran and Russia are aligned. Ultimately China needs to access Iranian energy reserves via overland routes so that it gains greater supply security vis-à-vis the American navy (Chart 12). Since June 2019, we have maintained 40% odds of a military conflict with Iran. The logic is outlined in Diagram 1, which we have not changed. Conflict can take various forms since the western powers prefer sabotage or cyber-attacks to outright assault. But in the end preventing nuclear weapons may require air strikes – and victory is not at all guaranteed. We are very close to moving to the next branch in Diagram 1, which would imply odds of military conflict rise from 40% to 80%. We are not making that call yet but we are getting nervous. Diagram 1Iran Nuclear Crisis: Decision Tree
Biden And Putin Court The Middle East
Biden And Putin Court The Middle East
Moreover it is the saber rattling around this process – including an extensive Iranian campaign to deter attack – that will disrupt oil distribution and transport sooner rather than later. Bottom Line: The US and Iran could still find diplomatic accommodation to avoid the next step in our decision tree. Therefore we are keeping the odds of war at a subjective 40%. But we have reached a critical juncture. The next step in the process entails a major increase in the odds of air strikes. Putin’s Supply Squeeze Will Continue As we go to press, financial markets are reacting to President Putin’s marginal easing of Russian political pressure on food and energy supplies. First, Putin took steps toward a deal, proposed by Turkish President Erdogan, to allow Ukrainian grain exports to resume from the Black Sea. Second, Putin allowed a partial restart of the Nord Stream 1 natural gas pipeline, after a total cutoff occurred during the regular, annual maintenance period. However, these moves should be kept into perspective. Nord Stream 1 is still operating at only 40% of capacity. Russia reduced the flow by 60% after the EU agreed to impose a near-total ban on Russian oil exports by the end of the year. Russia is imposing pain on the European economy in pursuit of its strategic objectives and will continue to throttle Europe’s natural gas supply. Russia’s aims are as follows: (1) break up European consensus on Russia and prevent a natural gas embargo from being implemented in future (2) pressure Europe into negotiating a ceasefire in Ukraine that legitimizes Russia’s conquests (3) underscore Russia’s new red line against NATO military deployments in Finland and Sweden. Europe, for its part, will continue to diversify its natural gas sources as rapidly as possible to reduce Russia’s leverage. The European Commission is asking countries to decrease their natural gas consumption by 15% from August to March. This will require rationing regardless of Russia’s supply squeeze. The collapse in trust incentivizes Russia to use its leverage while it still has it and Europe to try to take that leverage away. The economic costs are frontloaded, particularly this winter. The same goes for the Turkish proposal to resume grain exports. Russia will continue to blockade Ukraine until it achieves its military objectives. The blockade will be tightened or loosened as necessary to achieve diplomatic goals. Part of the reason Russia invaded in the first place was to seize control of Ukraine’s coast and hold the country’s ports, trade, and economy hostage. Bottom Line: Russia’s relaxation of food and energy flows is not reliable. Flows will wax and wane depending on the status of strategic negotiations with the West. Europe’s economy will continue to suffer from a Russia-induced supply squeeze until Russia achieves a ceasefire in Ukraine. So will emerging markets that depend on grain imports, such as Turkey, Egypt, and Pakistan. Investment Takeaways The critical juncture has arrived for our Iran view. If Iran does not start returning to nuclear compliance soon, then a fateful path of conflict will be embarked upon. The Saudis will not give Biden more oil barrels just yet. But they may end up doing that if global demand holds up and the US reassures them that their regional security needs will be met. First, the path for oil over the next year will depend on the path of global demand. Our view is negative, with Europe heading toward recession, China struggling to stimulate its economy effectively, and the Fed unlikely to achieve a soft landing. Second, the path of conflict with Iran will lead to a higher frequency of oil supply disruptions across the Middle East that will start happening very quickly after the US-Iran talks are pronounced dead. In other words, oil prices will be volatile in a stagflationary environment. In addition, while inflation might roll over for various reasons, it is not likely to occur because of any special large actions by Saudi Arabia. The Saudis are waiting on global cues. Of these, China is the most important. We are booking a 17% gain on our long gold trade as real rates rise and China’s economy deteriorates (Chart 13). This is in line with our Commodity & Energy Strategy, which is also stepping aside on gold for now. Longer term we remain constructive as we see a secular rise in geopolitical risk and persistent inflation problems. Chart 13Book Gains On Gold ... For Now
Book Gains On Gold ... For Now
Book Gains On Gold ... For Now
We are booking an 18% gain on our long European defense / short European tech trade. Falling bond yields will benefit European tech (Chart 14). We remain bullish on European and global defense stocks. Chart 14Book Gains On EU Defense Vs Tech ... For Now
Book Gains On EU Defense Vs Tech ... For Now
Book Gains On EU Defense Vs Tech ... For Now
Chart 15Markets Underrate Middle East Geopolitical Risk
Biden And Putin Court The Middle East
Biden And Putin Court The Middle East
Stay long US equities relative to UAE equities. Middle Eastern geopolitical risk is underrated (Chart 15). Matt Gertken Chief Geopolitical Strategist mattg@bcaresearch.com Footnotes 1 The White House, “The Jerusalem U.S.-Israel Strategic Partnership Joint Declaration,” July 14, 2022, whitehouse.gov. 2 Israel and the US will remove international peacekeepers from the formerly Egyptian Red Sea islands of Tiran and Sanafir, which clears the way for Saudi Arabia to turn them into tourist destinations. Saudi Arabia also removed its tight airspace restrictions on Israel, enabling civilian Israeli airlines to fly through Saudi airspace on normal basis. Of course, Saudi allowance for Israeli military flights to pass through Saudi airspace would be an important question in any future military operation against Iran. 3 The US has long wanted regional missile defense integration. The Biden administration is proposing “integrated air defense cooperation” that would include Israel as well as the Gulf Cooperation Council (GCC). A regional “air and missile defense architecture” would counter drones and missiles from rival states and non-state actors such as Iran and its militant proxies. Simultaneously the Israelis are putting forward the proposed Middle East Air Defense Alliance (MEAD) in meetings with the same GCC nations. Going forward, Iran’s nuclear ambitions will give more impetus to these attempts to cooperate on air defense. 4 This is apparent from the hard line on Iran and the relatively soft line on Russia in the document. Israel is wary of taking too hard of a line against Russia because of its security concerns in Syria where Russian forces are present. See footnote 1 above. 5 Khamenei called for long-term cooperation between Russia and Iran; he justified Russia’s invasion of Ukraine as a defense against NATO encroachment; he called for the removal of the US dollar as the global reserve currency. See “Khamenei: Tehran, Moscow must stay vigilant against Western deception,” Israel Hayom, July 20, 2022, israelhayom.com. 6 Russia’s natural gas champion Gazprom signed an ostensible $40 billion memorandum of understanding with Iran’s National Oil Company to develop gas fields and pipelines. See Nadeen Ebrahim, “Iran and Russia’s friendship is more complicated than it seems,” CNN, July 20, 2022, cnn.com. However, while there are longstanding obstacles to Russo-Iranian cooperation, the West’s tough new sanctions on Russia and EU diversification will make Moscow more willing to invest in Iran. Strategic Themes Open Tactical Positions (0-6 Months) Open Cyclical Recommendations (6-18 Months) Regional Geopolitical Risk Matrix
Listen to a short summary of this report. Executive Summary The odds of a recession in the US are lower than widely perceived. The probability of a recession is higher in Europe, although this week’s partial resumption of gas flows through the Nord Stream 1 pipeline, along with increased use of coal-fired power plants, should soften the blow. Chinese growth should rebound in the second half of the year. However, the specter of future lockdowns, the shift in global spending away from manufactured goods towards services, and the weakening property sector will continue to weigh on activity. With the Twentieth Party Congress slated for later this year, it is increasingly likely that the authorities will open up a firehose of stimulus. Fading recession risks will buoy stocks in the near term. However, a brighter economic outlook also means that the Fed, and several other central banks, may see little need to cut policy rates in 2023, as the markets are currently discounting. The end result is that government bond yields will rise from current levels, implying that stock valuations will not return to last year’s levels even if a recession is averted. After Rapidly Raising Rates, Markets Expect Some DM Central Banks To Start Easing Next Year
The Downside Of A Soft Landing
The Downside Of A Soft Landing
Bottom Line: We recommend a modest overweight on global equities for now but would turn neutral if the S&P 500 were to rise above 4,050. Dear Client, I am delighted to announce that Ritika Mankar, CFA, has joined the Global Investment Strategy team. Ritika will be writing occasional special reports on a variety of topical issues. Next week, she will make the case that the US economy’s ability to spawn mega-sized companies may become increasingly compromised over the next decade. Best regards, Peter Berezin, Chief Global Strategist The Case for a Soft Landing in the US Chart 1Cyclicals Underperformed Defensives As Recession Risks Intensified
Cyclicals Underperformed Defensives As Recession Risks Intensified
Cyclicals Underperformed Defensives As Recession Risks Intensified
Over the last few months, investors have become concerned that the Fed and many other central banks will need to engineer a recession in order to bring inflation down to more comfortable levels. While these fears have abated over the past trading week, they still continue to dominate market action (Chart 1). We place the odds of a US recession at about 40%. This is arguably more optimistic than the consensus view. According to Bank of America, the majority of fund managers saw recession as likely in this month’s survey. Not surprisingly, investors consider recession to be a major risk for equities over the next 12 months (Chart 2). Chart 2Many Investors Now See Recession As Baked In The Cake
The Downside Of A Soft Landing
The Downside Of A Soft Landing
Even if a recession does occur, we have contended that it will likely be a mild one, perhaps so mild that it will be difficult to distinguish it from a soft landing. A number of things make a soft landing in the US more probable than in the past: Labor supply has scope to increase. The labor participation rate is still 1.2 percentage points below its pre-pandemic level, two-thirds of which is due to decreased participation among workers under the age of 55 (Chart 3). The share of workers holding multiple jobs is also below its pre-pandemic level (Chart 4). The number of multiple job holders has been rising briskly lately. That is one reason why job growth in the payroll survey – which double counts workers if they hold more than one job – has been stronger than job growth in the household survey. Increased labor supply would obviate the need for the Fed to take drastic actions to curtail labor demand in its effort to restore balance to the labor market. Chart 3Labor Supply Has Scope To Rise
Labor Supply Has Scope To Rise
Labor Supply Has Scope To Rise
Chart 4The Number Of Multiple Job Holders Is Still Below Pre-Pandemic Levels
The Number Of Multiple Job Holders Is Still Below Pre-Pandemic Levels
The Number Of Multiple Job Holders Is Still Below Pre-Pandemic Levels
A high level of job openings creates a moat around the labor market. There are almost two times as many job openings as there are unemployed workers in the US (Chart 5). Many firms are likely to pull job openings before they cut jobs in response to a slowing economy. A high level of job openings will also allow workers who lose their jobs to find employment more quickly than usual, thus limiting the rise in so-called frictional unemployment. It is worth noting that the job openings rate has declined from a record 7.3% in March to a still-high 6.9% in May, with no change in the unemployment rate over this period. Chart 5A High Level Of Job Openings Creates A Moat Around The Labor Market
A High Level Of Job Openings Creates A Moat Around The Labor Market
A High Level Of Job Openings Creates A Moat Around The Labor Market
A steep Phillips curve implies that only a modest increase in unemployment may be necessary to knock down inflation towards the Fed’s target. Just as was the case in the 1960s, the Phillips curve has proven to be kinked near full employment (Chart 6). Unlike in the late 1960s, however, when rising realized inflation caused long-term inflation expectations to reset higher, expectations have remained well anchored this time around (Chart 7). Chart 6The Phillips Curve Is Kinked At Very Low Levels Of Unemployment
The Downside Of A Soft Landing
The Downside Of A Soft Landing
Chart 7Long-Term Inflation Expectations Are Well Anchored
Long-Term Inflation Expectations Are Well Anchored
Long-Term Inflation Expectations Are Well Anchored
The unwinding of pandemic and war-related dislocations should push down inflation. A recent study by the San Francisco Fed estimates that about half of May’s PCE inflation print was the result of supply-side disturbances (Chart 8). While the ongoing war in Ukraine and the threat of another Covid wave in China will continue to unsettle global supply chains, these problems should fade over time. Falling inflation would allow real wages to start rising again. This would bolster confidence, making a soft landing more likely (Chart 9). Chart 8Supply Factors Explain Half Of The Increase In Prices Over The Past Year
The Downside Of A Soft Landing
The Downside Of A Soft Landing
Chart 9Positive Real Wage Growth Will Bolster Consumer Confidence
Positive Real Wage Growth Will Bolster Consumer Confidence
Positive Real Wage Growth Will Bolster Consumer Confidence
A lack of major financial imbalances makes the US economy more resilient to economic shocks. As a share of disposable income, US household debt is 34 percentage points below its 2008 peak (Chart 10). Relative to net worth, household debt is at multi-decade lows. About two-thirds of mortgages carry a FICO score above 760 compared to only one-third during the housing bubble (Chart 11). Non-mortgage consumer credit also remains in good shape, as my colleague Doug Peta elaborated in this week’s US Investment Strategy report. While corporate debt has risen over the past decade, the ratio of corporate debt-to-assets today is still below where it was during the 1990s. Moreover, thanks to stronger corporate profitability, the interest coverage ratio is near an all-time high (Chart 12). Chart 10AUS Household Debt Is Not Especially High Anymore (I)
US Household Debt Is Not Especially High Anymore (I)
US Household Debt Is Not Especially High Anymore (I)
Chart 10BUS Household Debt Is Not Especially High Anymore (II)
US Household Debt Is Not Especially High Anymore (II)
US Household Debt Is Not Especially High Anymore (II)
Chart 11FICO Scores For Residential Mortgages Have Improved Considerably Since The Pre-GFC Housing Bubble
The Downside Of A Soft Landing
The Downside Of A Soft Landing
Chart 12Corporate Balance Sheets Are In Decent Shape
Corporate Balance Sheets Are In Decent Shape
Corporate Balance Sheets Are In Decent Shape
Chart 13Tight Supply Limits The Downside Risks To Housing
Tight Supply Limits The Downside Risks To Housing
Tight Supply Limits The Downside Risks To Housing
Just like the US does not suffer from major financial imbalances, it does not suffer from any major economic imbalances either. The homeowner vacancy rate is near a record low, which should put a floor under residential investment (Chart 13). Outside of investment in intellectual property, which is not especially sensitive to the business cycle, nonresidential investment is still below pre-pandemic levels and not much above where it was as a share of GDP during the Great Recession (Chart 14). Spending on consumer durable goods has retraced four-fifths of its pandemic surge, with little ill-effect on aggregate employment (Chart 15). Chart 14Outside Of IP, Nonresidential Investment Is Still Low
Outside Of IP, Nonresidential Investment Is Still Low
Outside Of IP, Nonresidential Investment Is Still Low
Chart 15Spending On Durable Goods Has Been Normalizing Without Derailing The Economy
Spending On Durable Goods Has Been Normalizing Without Derailing The Economy
Spending On Durable Goods Has Been Normalizing Without Derailing The Economy
Europe: A Deep Freeze Will Likely Be Avoided Chart 16Russia Can Potentially Cause Significant Economic Damage In The EU If It Closes The Taps
The Downside Of A Soft Landing
The Downside Of A Soft Landing
The macroeconomic picture is less benign outside the US. Four years ago, German diplomats laughed off warnings that their country had become dangerously dependent on Russian energy. They are not laughing anymore. German industry, just like industry across much of Europe, is facing a major energy crunch. The IMF estimates that output losses associated with a full Russian gas shutoff over the next 12 months could amount to as much as 2.7% of GDP in the EU (Chart 16). In Central and Eastern Europe, output could shrink by 6%. Among the major economies, Germany and Italy are the most at risk. Fortunately, Europe is finally stepping up to the challenge. The highly ambitious REPowerEU plan seeks to displace two-thirds of Russian gas by the end of 2022. The plan does not include any additional energy that could be generated by increased usage of coal-fired power plants, a strategy that the European political establishment (including the German Green Party!) has only recently begun to champion. It is possible that EU leaders felt the need to generate a crisis mentality to justify the decision to burn more coal. Dire warnings about how Europe is prepared to ration gas also send a message to Russia that the EU is ready to suffer in order to thwart Putin’s despotic regime. Whether Europe actually follows through is a different story. It is worth noting that the Nord Stream 1 pipeline resumed operations this week after Germany received, over Ukrainian objections, a repaired turbine from Canada. The resumption of partial flows through the pipeline, along with increased fiscal support for households and firms, reduces the risks of a “deep freeze” recession in Europe. The unveiling of the ECB’s new Transmission Protection Instrument (TPI) this week should also help anchor sovereign credit spreads across the euro area. While the exact conditions under which the TPI will be engaged have yet to be fleshed out, we expect the terms to be fairly liberal, reflecting not only the lessons learned from last decade’s euro debt crisis, but also to serve as a powerful bulwark against Putin’s efforts to destabilize the EU economy. China: Government’s Growth Target Looks Increasingly Unrealistic Stronger growth in China would help European exporters (Chart 17). Chinese real GDP grew by just 0.4% in the second quarter from a year earlier as the economy was battered by Covid lockdowns. Activity should pick up in the second half of the year, but at this point, the government’s 5.5% growth target looks completely unachievable. The specter of future lockdowns, the shift in global spending away from manufactured goods towards services, and the weakening Chinese property sector are all weighing on the economy (Chart 18). Chart 17European Exporters Would Welcome A Stronger Chinese Economy
European Exporters Would Welcome A Stronger Chinese Economy
European Exporters Would Welcome A Stronger Chinese Economy
The authorities will likely seek to stimulate the economy by allowing local governments to bring forward $220 billion in bond issuance that had been originally slated for 2023. The problem is that land sales – the main source of local government revenue – have collapsed. Worried about the ability of local governments to service their obligations, both retail investors and banks have shied away from buying local government debt. Chart 18A Slowing Property Market And Covid Lockdowns Have Been Weighing On The Chinese Economy
A Slowing Property Market And Covid Lockdowns Have Been Weighing On The Chinese Economy
A Slowing Property Market And Covid Lockdowns Have Been Weighing On The Chinese Economy
Meanwhile, the inability of property developers to secure adequate financing to complete construction projects has left a growing number of home buyers in the lurch. In most cases, these properties were purchased off-the-plan. Understandably, home buyers have balked at the prospect of having to make mortgage payments on properties that they do not possess. With the Twentieth Party Congress slated for later this year, it is increasingly likely that the authorities will open up a firehose of stimulus, including increased assistance for property developers and banks, as well as income-support measures for households. While such measures will not address China’s myriad structural problems, they will help keep the economy afloat. Equity Valuations in a Soft-Landing Scenario A few weeks ago, the consensus view was that stocks would tumble in the second half of the year as the global economy fell into recession but would then rally in 2023 as central banks began lowering rates. We argued the opposite, namely that stocks would likely rebound in the second half of the year as the economy outperformed expectations but would then face renewed pressure in 2023 as it became clear that the Fed and several other central banks had no reason to cut rates (Chart 19). Chart 19After Rapidly Raising Rates, Markets Expect Some DM Central Banks To Start Easing Next Year
The Downside Of A Soft Landing
The Downside Of A Soft Landing
Chart 20Real Rates Have Jumped This Year
Real Rates Have Jumped This Year
Real Rates Have Jumped This Year
In a baseline scenario where a recession is averted, we argued that the S&P 500 could rise to 4,500 (60% odds). In contrast, we noted that the S&P 500 could fall to 3,500 in a mild recession scenario (30% odds) and to 2,900 in a deep recession scenario (10% odds). It is worth stressing that even at 4,500, the S&P 500 would still be 11% lower in real terms than it was on January 4th. At the stock market’s peak in January, the 10-year TIPS yield stood at -0.91%, while the 30-year TIPS yield stood at -0.27%. Today, they stand at 0.58% and 0.93%, respectively (Chart 20). If real rates do not return to their prior lows, it is unlikely that equity valuations will return to their prior highs. This limits the upside for stocks, even in a soft-landing scenario. The sharp rally in stocks over the past week has priced out some of this recession risk, moving equity valuations closer towards what we regard as fair value. As we noted last week, we will turn neutral on equities if the S&P 500 were to rise above 4,050. As we go to press, we are only 1.3% from that level. Peter Berezin Chief Global Strategist peterb@bcaresearch.com Follow me on LinkedIn & Twitter Global Investment Strategy View Matrix
The Downside Of A Soft Landing
The Downside Of A Soft Landing
Special Trade Recommendations Current MacroQuant Model Scores
The Downside Of A Soft Landing
The Downside Of A Soft Landing
Table 1
Q2-2022 Earnings Commentary
Q2-2022 Earnings Commentary
Q2-22 reporting season is of paramount importance for investors as it may help shape market expectations into the balance of the year. After all, the multiples compression stage of the bear market, driven by entrenched inflation and monetary tightening, is likely complete. Now all eyes are on the growth and the ability of the companies to navigate the economy that is being slowed down by the Fed. The following is a quick snapshot of the results and expectations: As of July 20th, 60 S&P 500 companies have reported. According to Refinitiv, the S&P 500 EPS is expected to grow at 5.9% this quarter based on the expectations and the early results (blended). Excluding the Energy sector, the blended growth rate drops to -3.5% (Table 1). The S&P 500 blended sales growth is expected to be 11.2%. Excluding Energy, the rate falls to -3.9% (Table 1). 24 of the 60 companies that have reported are in the Financials sector, making it the only sector with a “critical mass” of results (24 out 42 in the sector). So far, the Financials sector has delivered a sales surprise of 1.3%, and an earnings surprise of 4.2% with 75% of companies beating analyst earnings expectations. The caveat here is that the bar for the sector has been set low, with analysts expecting earnings to contract by 21.7%. Some initial thoughts: Sales growth expectations by far exceed earnings growth expectations, signaling margins compression, and exacerbating trends that have started in Q1-2022. We have anticipated 2022 margins compression in the “Marginally Worse” report back in October 2021. So far corporate results have been reassuring, with a high share of companies beating both sales and earnings expectations. However, it is too early to draw far-reaching conclusions. On a positive note, the largest US banks have reported that their Net Income Margins (NIM) have expanded and describe US consumers as “healthy”. However, there are some red flags and negative guidance: Most banks have increased non-performing loan reserves which reflect their concerns about slowing growth and deteriorating credit conditions. Companies are reporting the adverse effects of withdrawing from Russia – IBM. The largest technology companies have announced hiring slowdowns on the back of the weakening demand for their products and overall concerns about the economy – Apple, Google, Amazon Companies across the board are mentioning the negative effects of dollar appreciation on their earnings from abroad – Microsoft pre-announcement, Johnson & Johnson, Pepsico, IBM, Halliburton, Netflix Slowdown in demand for chips – Micron, Nvidia Forward guidance has also been concerning. Most companies talk about deteriorating economic conditions. Chart 1
CHART 1
CHART 1
Despite the negative commentary summarized above, so far earnings have been strong. Then why are we worried about corporate earnings? First, analysts are still forecasting earnings to grow at about a 10% rate over the next 12 months despite ubiquitous negative corporate guidance. As Chart 1 highlights, most of that EPS growth is expected to come in Q3-22, which implies that over the next several months at least some of the macro headwinds (slowing growth, the hawkish Fed, stubborn inflation, energy crisis, and rising wages) will dissipate. We don’t consider this to be a high probability outcome as we are now halfway through the quarter, and macroeconomic conditions are not improving. Moreover, analysts themselves have little confidence in their own forecasts as is evident in the elevated earnings uncertainty (Chart 2). In all likelihood, downgrades are on the way. Second, our earnings growth regression model indicates that earnings growth is slowing, and earnings recession is likely within six months or so (Chart 3). Chart 2
CHART 2
CHART 2
Image
Bottom Line: We continue to recommend that investors remain patient and prudent in the range-bound markets. Earnings growth is likely to deteriorate into the year end.
Executive Summary China: Can The Economy Recover Without Housing Revival
Can The Economy Recover Without Housing Revival
Can The Economy Recover Without Housing Revival
The rebound in China’s business activity in June reflects the release of pent-up demand from the economic reopening after lockdowns in April and May. China’s credit growth recovered meaningfully in June due to large local government (LG) bond issuance. Private sector sentiment and credit demand remain sluggish. Home sales relapsed in the first two weeks of July after a one-off improvement in June, corroborating that the housing market’s fundamentals remain gloomy. Despite posting strong growth in June, Chinese exports are facing strong headwinds from weakening external demand. A contraction in exports is very likely in the second half of this year. Chinese domestic demand remains weak. Renewed rolling lockdowns are likely in view of the escalating Covid-19 cases related to a more infectious Omicron subvariant. The RMB will probably continue to depreciate relative to the US dollar in the next few months. Bottom Line: Investors should maintain a neutral stance on Chinese onshore stocks and an underweight stance on investable stocks in a global equity portfolio. The risk-reward profile of Chinese onshore and offshore stocks in absolute terms is not yet attractive. Chart 1High-Frequancy(Daily) Economic Indicators
High-Frequancy(Daily) Economic Indicators
High-Frequancy(Daily) Economic Indicators
The recent recovery in economic activity in June mainly reflects the release of pent-up demand after reopening from lockdowns in April and May. Odds are that this rebound will fade. The relapse in house sales and slowdown in steel production during the first two weeks of July suggest that China’s economy is still struggling to gain traction (Chart 1). China’s business cycle recovery will be more U shaped rather than a repeat of the V-shaped resurgence experienced following the early 2020 lockdown. At that time, a quick and strong revival in the property market and exports shored up China’s recovery in 2H20. In contrast, the economy’s progress in the second half of this year will be dragged down by shrinking exports, weak consumption and depressed demand for housing. China’s recovery will be more U shaped than V shaped for the following reasons: New financing schemes for infrastructure investment recently announced by authorities will not lead to a surge in infrastructure investments in 2H22. The basis is that these new funding sources will largely offset a shortfall in local government (LG) revenues from this year’s land sales, as we discussed in last week’s report. Thus, there will be little new stimulus for infrastructure beyond what was already approved in the budget plan earlier this year. Rolling lockdowns will persist as long as China’s stringent dynamic zero-Covid policy remains in place. The recent flare-up of the more infectious Omicron BA.5 subvariant cases in a few cities raise the likelihood of more lockdowns. The number of cities under mobility restrictions or some form of lockdown climbed during the second week of July (Chart 2). These cities account for around 11% of China’s GDP. The rolling lockdowns will continue to disrupt the economy. Private sector sentiment remains in the doldrums. The willingness to spend or invest among households and enterprises remains very depressed (Chart 3). This will ensure that the multiplier effect of fiscal and credit stimulus will be small. Chart 2The Odds Of Renewed Lockdowns Are Rising
The Odds Of Renewed Lockdowns Are Rising
The Odds Of Renewed Lockdowns Are Rising
Chart 3Sluggish Sentiment Among Chinese Households And Enterprises
Sluggish Sentiment Among Chinese Households And Enterprises
Sluggish Sentiment Among Chinese Households And Enterprises
Chart 4China: Can The Economy Recover Without Housing Revival
Can The Economy Recover Without Housing Revival
Can The Economy Recover Without Housing Revival
Since 2008 there has been no recovery in the mainland economy without buoyant real estate construction and surging property prices (Chart 4). Chinese exports are set to contract as the demand for goods from US and European consumers continues to shrink. Bottom Line: In absolute terms, the risk-reward profile of Chinese stocks is not yet attractive. We continue to recommend that investors maintain a neutral stance on China’s onshore stocks and underweight allocation on Chinese investable stocks within a global equity portfolio. Qingyun Xu, CFA Associate Editor qingyunx@bcaresearch.com Peeling Off Credit Data Chart 5June's Credit Growth Was Largely Driven By LG Bond Issuance
June's Credit Growth Was Largely Driven By LG Bond Issuance
June's Credit Growth Was Largely Driven By LG Bond Issuance
June’s strong credit growth was again driven by large LG bond issuance (Chart 5, top panel). Consequently, the credit impulse – calculated as a 12-month change in the flow of total social financing (TSF) as a percentage of nominal GDP – is much more muted when LG bond issuance is excluded (Chart 5, bottom panel). Medium- to long-term corporate loan growth only ticked up in June, but short-term bill financing has dropped dramatically (Chart 6). While it is difficult to quantify, it is highly likely that the modest upturn in corporate credit flow was due to (1) corporates’ pent-up demand for financing after the spring lockdowns and (2) the PBoC’s moral suasion used to boost the banks’ credit origination. Meanwhile, a PBoC survey released on June 29-30, showed that loan demand for all types of industrial enterprises plunged sharply in Q2, suggesting that sentiment is very weak among corporates (Chart 7). Chart 6Corporate Loan Growth Improved In June...
Corporate Loan Growth Improved In June...
Corporate Loan Growth Improved In June...
Chart 7… But Corporate Loan Demand Remains Very Weak
... But Corporates Remain Low Demand Very Weak
... But Corporates Remain Low Demand Very Weak
Household loan demand, which is highly correlated with home sales, remains shaky too (Chart 8, top panel). Medium- to long-term consumer loans continued to plunge, and the annual change in household loan origination remains negative (Chart 8, bottom panel). Chart 8Household Loan Demand Is Still Depressed
Household Loan Demand Is Still Depressed
Household Loan Demand Is Still Depressed
Chart 9The Credit And Fiscal Impulse Will Be Moderate
The Credit And Fiscal Impulse Will Be Moderate
The Credit And Fiscal Impulse Will Be Moderate
Overall, our projections for the combined credit and fiscal spending impulse for the rest of this year suggest that the aggregate fiscal and credit impulse will be improving but will be smaller than in 2020, 2016, 2013 and 2009 (Chart 9). Property Market: A Vicious Cycle Unfolding Home sales relapsed in the first two weeks of July after a one-off rebound in June. The weakness was broad-based across all city tiers. This implies that June’s bounce was driven by pent-up demand after lockdowns and does not represent a sustained revival (Chart 10). Sentiment among home buyers remains downbeat. The percentage of households planning to buy homes slipped further according to the PBoC’s urban household survey released on June 29 (Chart 11, top panel). Moreover, the percentage of households expecting home prices to rise has dived to the lowest level since early 2015 according to the same survey (Chart 11, bottom panel). Chart 10No Snapback In Housing Sales
No Snapback In Housing Sales
No Snapback In Housing Sales
Chart 11Downbeat Sentiment Among Home Buyers
Downbeat Sentiment Among Home Buyers
Downbeat Sentiment Among Home Buyers
Chart 12Real Estate Developers' Deteriorating Funding Will Further Dampen Housing Construction
Real Estate Developers' Deteriorating Funding Will Further Dampen Housing Construction
Real Estate Developers' Deteriorating Funding Will Further Dampen Housing Construction
Property developers are caught in a vicious cycle. Financing has not strengthened because the “three red lines” policy remains in place, and developers’ borrowing from banks shows no signs of amelioration (Chart 12, top panel). Critically, the plunge in the sector’s financing is resulting in shrinking housing completions (Chart 12, bottom panel). As property developers are suffering from liquidity shortages, they are dragging on existing construction projects. The upshot is that many Chinese cities are seeing delays in the completion of new homes. The latter is depressing buyers’ sentiment, generating a reluctance to buy properties, and curtailing deposits and advances to developers. In recent years, deposits and advances accounted for 50% of property developers’ financing. Without a substantial improvement in their financing, developers will not be in a position to service their excessive debts and deliver houses they have presold in the recent years. The latter will undermine their financing, closing the vicious cycle. In short, real estate developers’ liquidity shortfalls are evolving into solvency problems. These will continue dampening construction activity. An Export Contraction Ahead China’s exports were robust in June as supply chain and logistic disruptions faded. This was corroborated by last month’s advance in suppliers’ delivery times and production subindexes of China’s official Purchasing Managers’ Index (PMI) (Chart 13). Chart 13Chinese Logistics And Backlog Orders Pressures Have Eased In June
Chinese Logistics And Backlog Orders Pressures Have Eased In June
Chinese Logistics And Backlog Orders Pressures Have Eased In June
Yet, China’s new exports orders remain in contractionary territory (Chart 14). Moreover, the softness of Shanghai’s export container freight index is also signaling weakness in China’s exports (Chart 15). Chart 14External Demand For Chinese Export Goods Will Be Dwindling
External Demand For Chinese Export Goods Will Be Dwindling
External Demand For Chinese Export Goods Will Be Dwindling
Chart 15Signs Of Moderation In China's Exports
Signs Of Moderation In China's Exports
Signs Of Moderation In China's Exports
The shift in consumer spending in developed economies from manufactured goods to services has created headwinds for Chinese exports. US and European consumption of goods (ex-autos) is set to decline below its long-term trend (Chart 16). Given that retail inventories in the US have skyrocketed well above their pre-pandemic trend, US demand for consumer goods and, hence, Chinese exports will dwindle significantly when US retailers start to destock (Chart 17). Falling real household disposable income in the US and Europe will also fortify the downward trend in demand for consumer goods that China is a major producer of. Therefore, we expect shrinking Asian and Chinese exports in the second half of this year. Chart 16Developed Economies’ Household Demand For Goods ex-Autos Will Shrink
Developed Economies' Household Demand For Goods ex-Autos Will Experience Mean Reversion
Developed Economies' Household Demand For Goods ex-Autos Will Experience Mean Reversion
Chart 17Well-Stocked Shelves In The US Bode Poorly For Chinese Exports
Well-Stocked Shelves In The US Bode Poorly For Chinese Export
Well-Stocked Shelves In The US Bode Poorly For Chinese Export
Very Sluggish Domestic Demand Both consumer spending and capital expenditure remain in the doldrums. Traditional infrastructure investments picked up strongly in June, while investments in the real estate sector weakened further (Chart 18). Contracting exports will weigh on investments in manufacturing. Even as infrastructure investment recovers modestly, the downtrend in manufacturing and property fixed-asset investments will cap China’s capital spending in 2H22. Capital spending in traditional infrastructure, real estate and manufacturing account for 24%, 19% and 31% of fixed-asset investment, respectively. Chart 18Shrinking Real Estate Investment Will Remain A Drag On Chinese Investment Growth In 2H
Shrinking Real Estate Investment Will Remain A Drag On Chinese Investment Growth In 2H
Shrinking Real Estate Investment Will Remain A Drag On Chinese Investment Growth In 2H
Chart 19Contracting Import Volume Reflects China's Sluggish Domestic Demand
Contracting Import Volume Reflects China's Sluggish Domestic Demand
Contracting Import Volume Reflects China's Sluggish Domestic Demand
Imports for domestic consumption (excluding imports for processing and re-exports) are a good proxy for domestic demand trajectory. In June, import volumes contracted deeply at 12% on a year-on-year basis, reflecting sluggish domestic demand (Chart 19). Worryingly, import volume contraction is widespread from key commodities to semiconductors and capital goods (Chart 20A and 20B). Chart 20ABroad-Based Contraction In Imports
Broad-Based Contraction In ... Chinese Imports Of Key Commodities Deteriorated In June
Broad-Based Contraction In ... Chinese Imports Of Key Commodities Deteriorated In June
Chart 20BBroad-Based Contraction In Imports
... Imports And key Imports Categories Chinese Domestic Demand Has Been Absent Over The Past 12 Months
... Imports And key Imports Categories Chinese Domestic Demand Has Been Absent Over The Past 12 Months
Chart 21Rising New Covid Cases In China Will Constrain Domestic Consumption Recovery
Rising New Covid Cases In China Will Constrain Domestic Consumption Recovery
Rising New Covid Cases In China Will Constrain Domestic Consumption Recovery
Moreover, the recent increase in Covid-19 cases and ensuing lockdowns in China will curb household consumption and the service sector’s activities in the next few months (Chart 21). Newly released labor market data show a mixed picture. The nationwide urban survey-based unemployment rate fell in June, but the unemployment rate among younger workers surged to the highest point since data collection began in 2018 (Chart 22, top panel). Reflecting weak employment conditions, new urban job creation in the first half of the year withered compared with the same period last year (Chart 22, bottom panel). Rapidly deteriorating income prospects are reinforcing households’ downbeat sentiment. A PBoC survey released on June 29 shows that confidence of future income in Q2 plummeted to its lowest level during the past two decades, while the preference for more saving deposits soared to the highest level since data collection began in 2002 (Chart 23). The latter entails that households’ consumption recovery will be gradual and halting, at best, in the second half of this year. Chart 22Skyrocketed Unemployment Rate Among Young Workers Is A Big Problem Of Chinese Labor Market
Skyrocketed Unemployment Rate Among Young Workers Is A Big Problem Of Chinese Labor Market
Skyrocketed Unemployment Rate Among Young Workers Is A Big Problem Of Chinese Labor Market
Chart 23Low Confidence In Future Income Contributes To Households' Unwillingness To Consume
low Confidence In Future Income Contributes To Households' Unwillingness To Consume
low Confidence In Future Income Contributes To Households' Unwillingness To Consume
The RMB Is Facing Downside Risks In The Near Term Chart 24RMB Is Still Vulnerable
RMB Is Still Vulnerable
RMB Is Still Vulnerable
The RMB has depreciated by about 6% against the US dollar since March, and we believe this trend will continue in the next few months. China’s interest rate differential versus the US dollar has fallen deeper into negative territory, and the gap may widen even more given that the inflation and monetary policy cycles in China and the US will continue to diverge (Chart 24, top panel). Thus, Chinese fixed-income market outflow pressures could endure this year (Chart 24, bottom panel). Moreover, as discussed in the section above, Chinese exports are set to shrink in the second half of the year. This will also weigh on the RMB. Notably, Chinese companies have started to increase their demand for USD. The net FX settlement rate by banks on behalf of clients has fallen below zero, albeit only marginally (Chart 25). This means more non-financial enterprises (such as exporters and investors) bought from than sold foreign currency to banks (Chart 25, bottom panel). Furthermore, foreign outflows from the onshore equity market have resumed and will likely be sustained, at least through the next few months (Chart 26). Foreign investors will likely flee from Chinese onshore stocks as global stocks continue selling off and China’s economic recovery disappoints in the second half of this year. Chart 25Contracting Exports Will Weigh On The RMB
Contracting Exports Will Weigh On The RMB
Contracting Exports Will Weigh On The RMB
Chart 26Onshore Equity Market Foreign Outflow Pressures Remain, At Least In The Near Term
Onshore Equity Market Foreign Outflow Pressures Remain, At Least In The Near Term
Onshore Equity Market Foreign Outflow Pressures Remain, At Least In The Near Term
Chinese Equity Market Technicals: Tell-Tale Signs Chart 27A-Shares Has Not Broken Above 200-Day Moving Average
A-Shares Has Not Broken Above 200-Day Moving Average
A-Shares Has Not Broken Above 200-Day Moving Average
The rebound in China’s onshore CSI 300 stock index had been obstructed at its 200-day moving average (Chart 27). A failure to break above this technical resistance would imply non-trivial downside – a retest of its recent lows, at least. The relative performance of the MSCI China All-Share Index – which includes all onshore- and offshore-listed stocks – versus the global equity index has petered off at its previous troughs (Chart 28). This is a tell-tale sign of a major relapse. Chart 28A Tell-Sign Of Major Downtrend
A Tell-Sign Of Major Downtrend
A Tell-Sign Of Major Downtrend
Chart 29Chinese Tech Stocks Still Appear Fragile
Chinese Tech Stocks Still Appear Fragile
Chinese Tech Stocks Still Appear Fragile
The Hang Seng Tech index – which tracks Chinese offshore tech stocks/platform companies – has also failed to break above its 200-day moving average (Chart 29). This entails that the bear market in these share prices might not be yet over. Chart 30Two Large-Cap Chinese Stocks
Two Large-Cap Chinese Stocks
Two Large-Cap Chinese Stocks
China’s two largest stocks (by market capitalization) – Tencent and Alibaba – may not be out of the woods: Alibaba has failed at its 200-day moving average (Chart 30, top panel). Tencent has failed to rebound at all (Chart 30, bottom panel). Odds are it will likely drop more. Table 1China Macro Data Summary
China’s Recovery: U Or V Shaped?
China’s Recovery: U Or V Shaped?
Table 2China Financial Market Performance Summary
China’s Recovery: U Or V Shaped?
China’s Recovery: U Or V Shaped?
Footnotes Strategic Themes Cyclical Recommendations
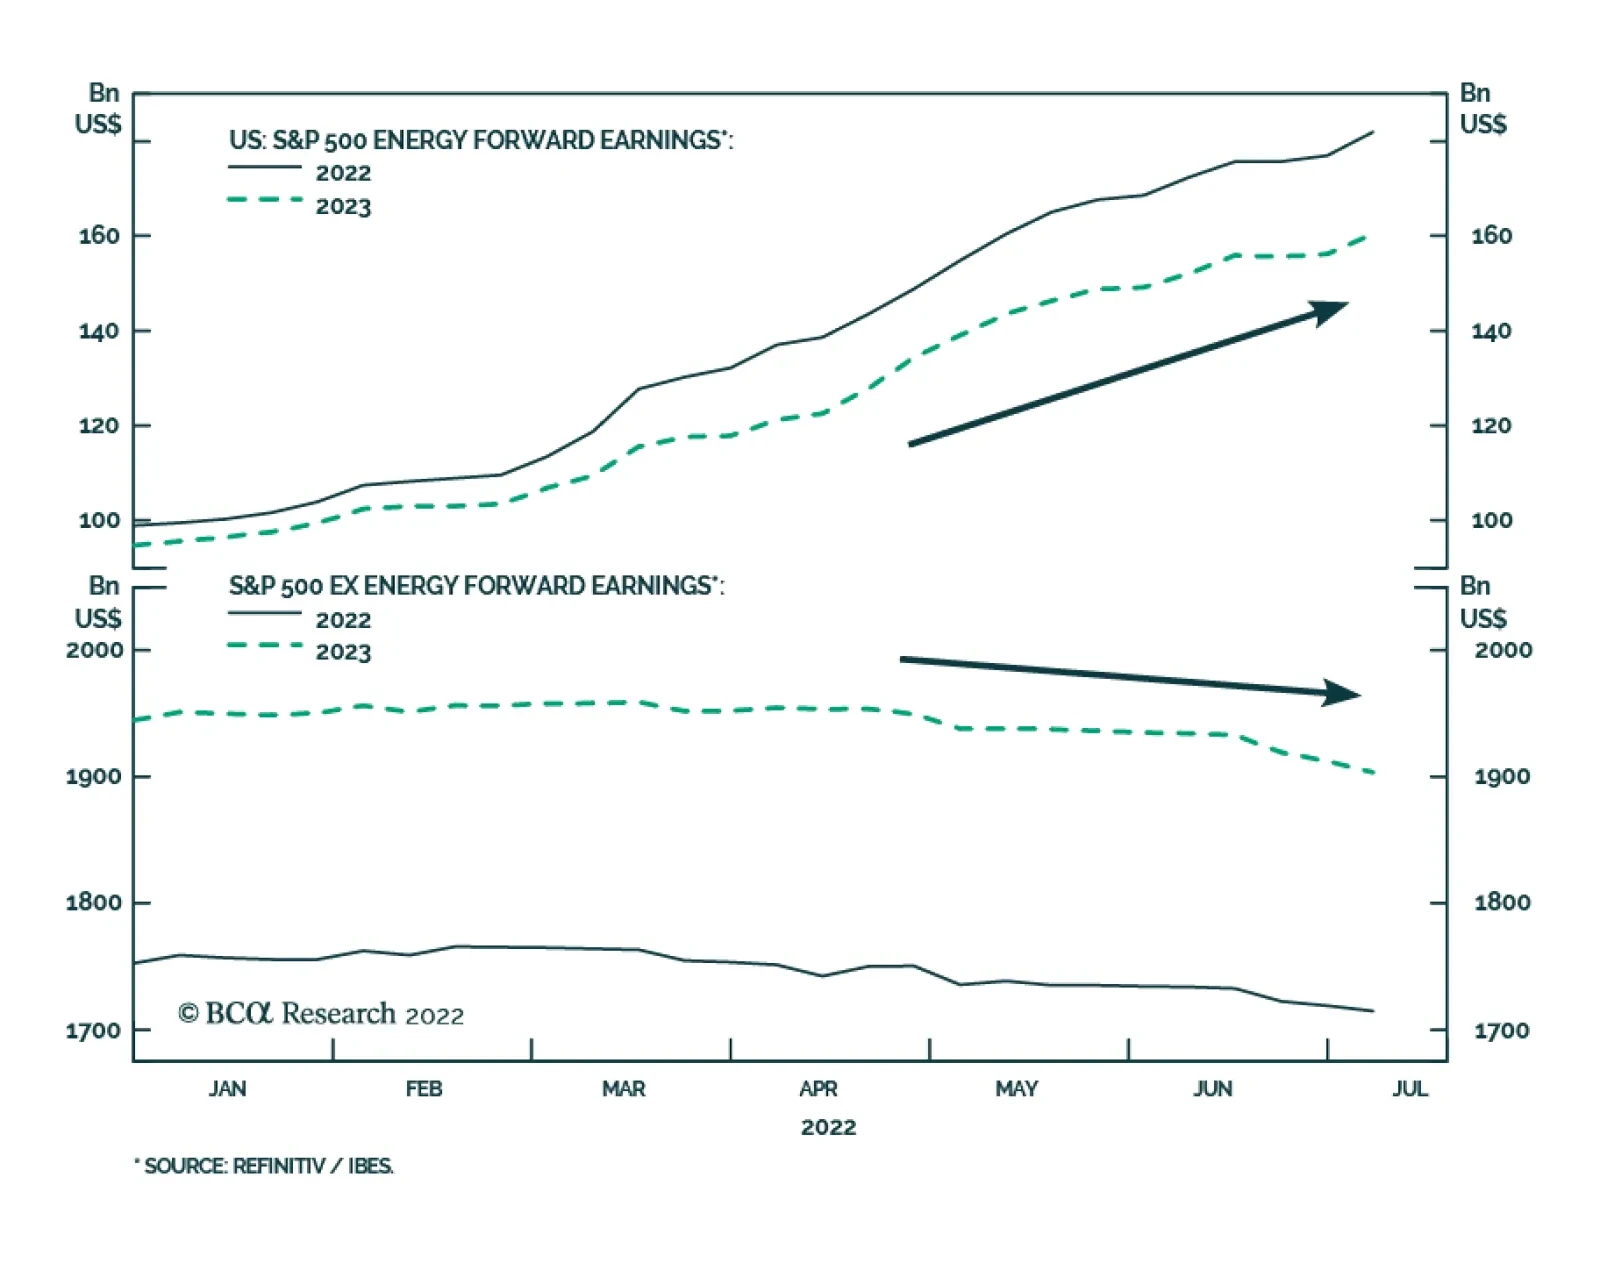
Valuations are largely responsible for the year-to-date equity selloff. Meanwhile, earnings estimates have remained relatively resilient even though global growth has slowed globally. Two factors explain this earnings puzzle. First, soaring energy…
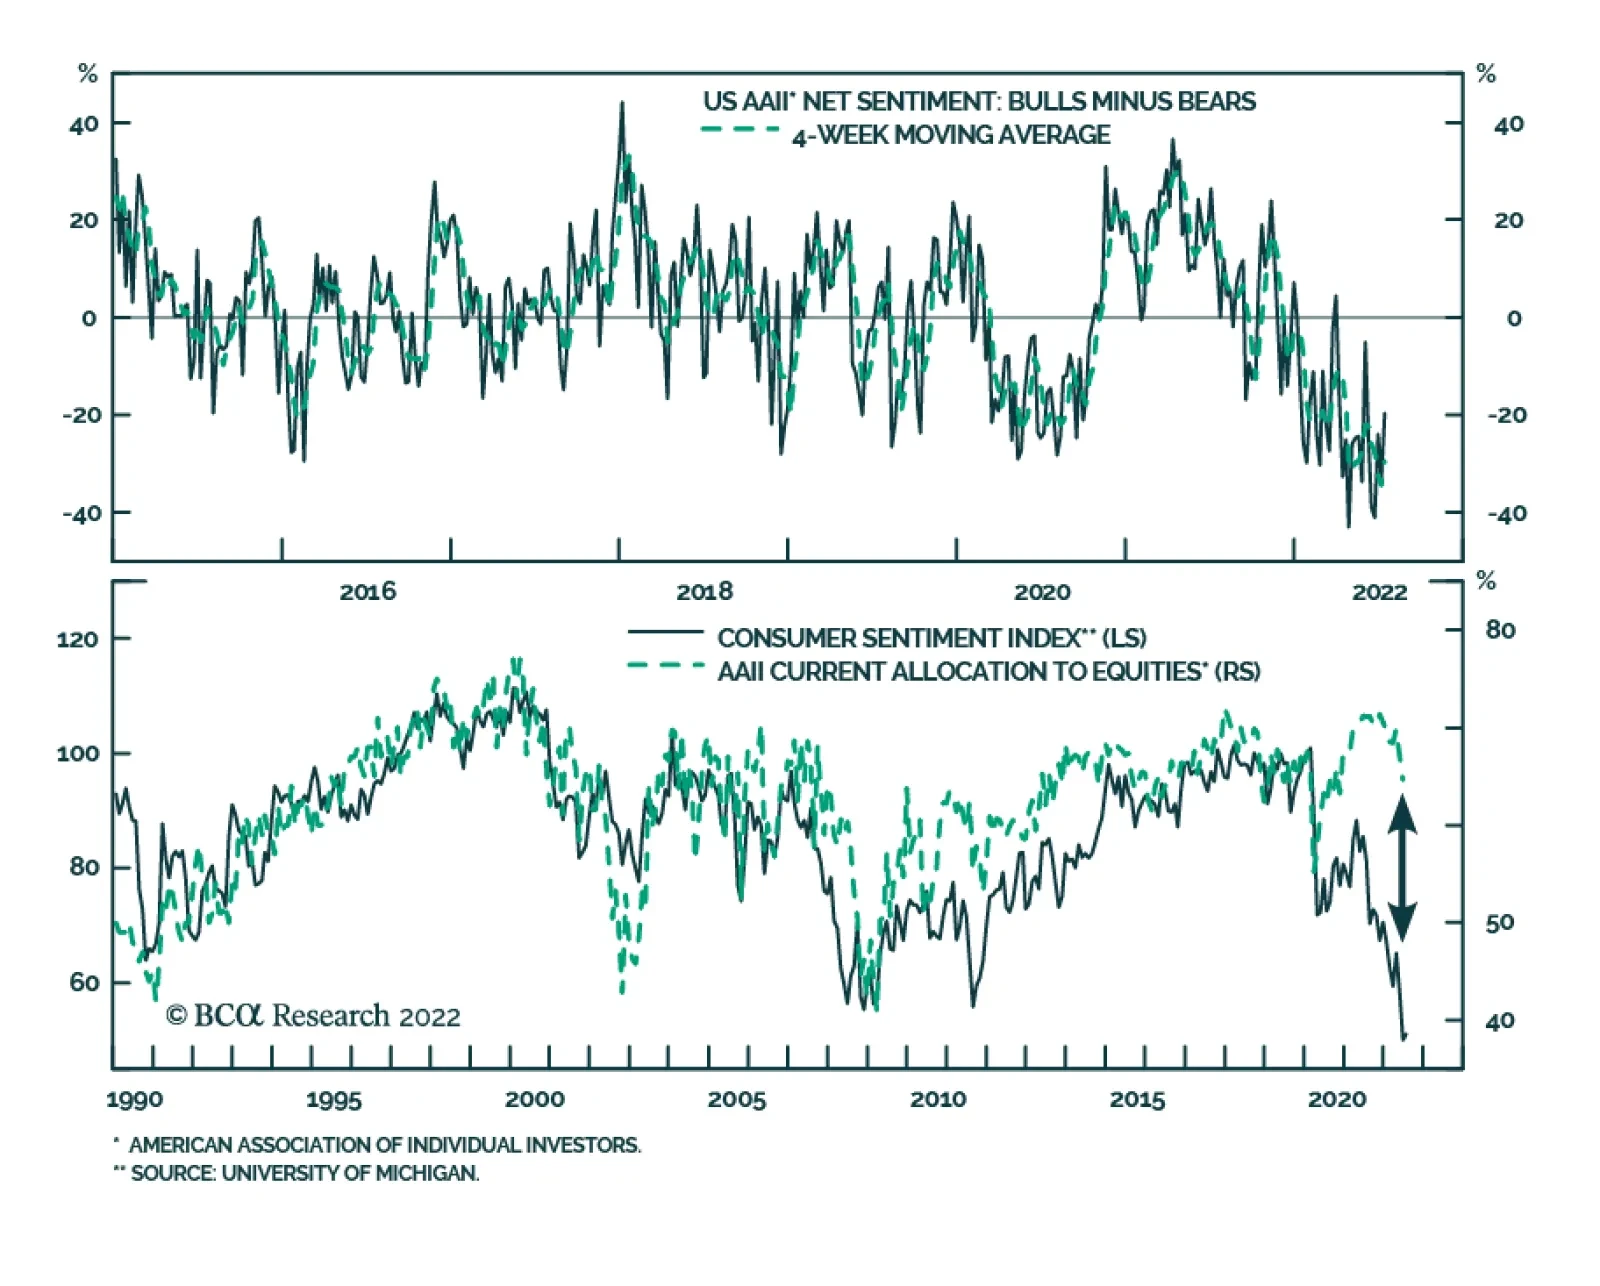
According to the latest Bank of America monthly fund manager survey, investors’ allocation to stocks collapsed to lows not seen since October 2008. Similarly, exposure to cash is now at the highest level since 2001 and a net 58% of respondents reported taking…
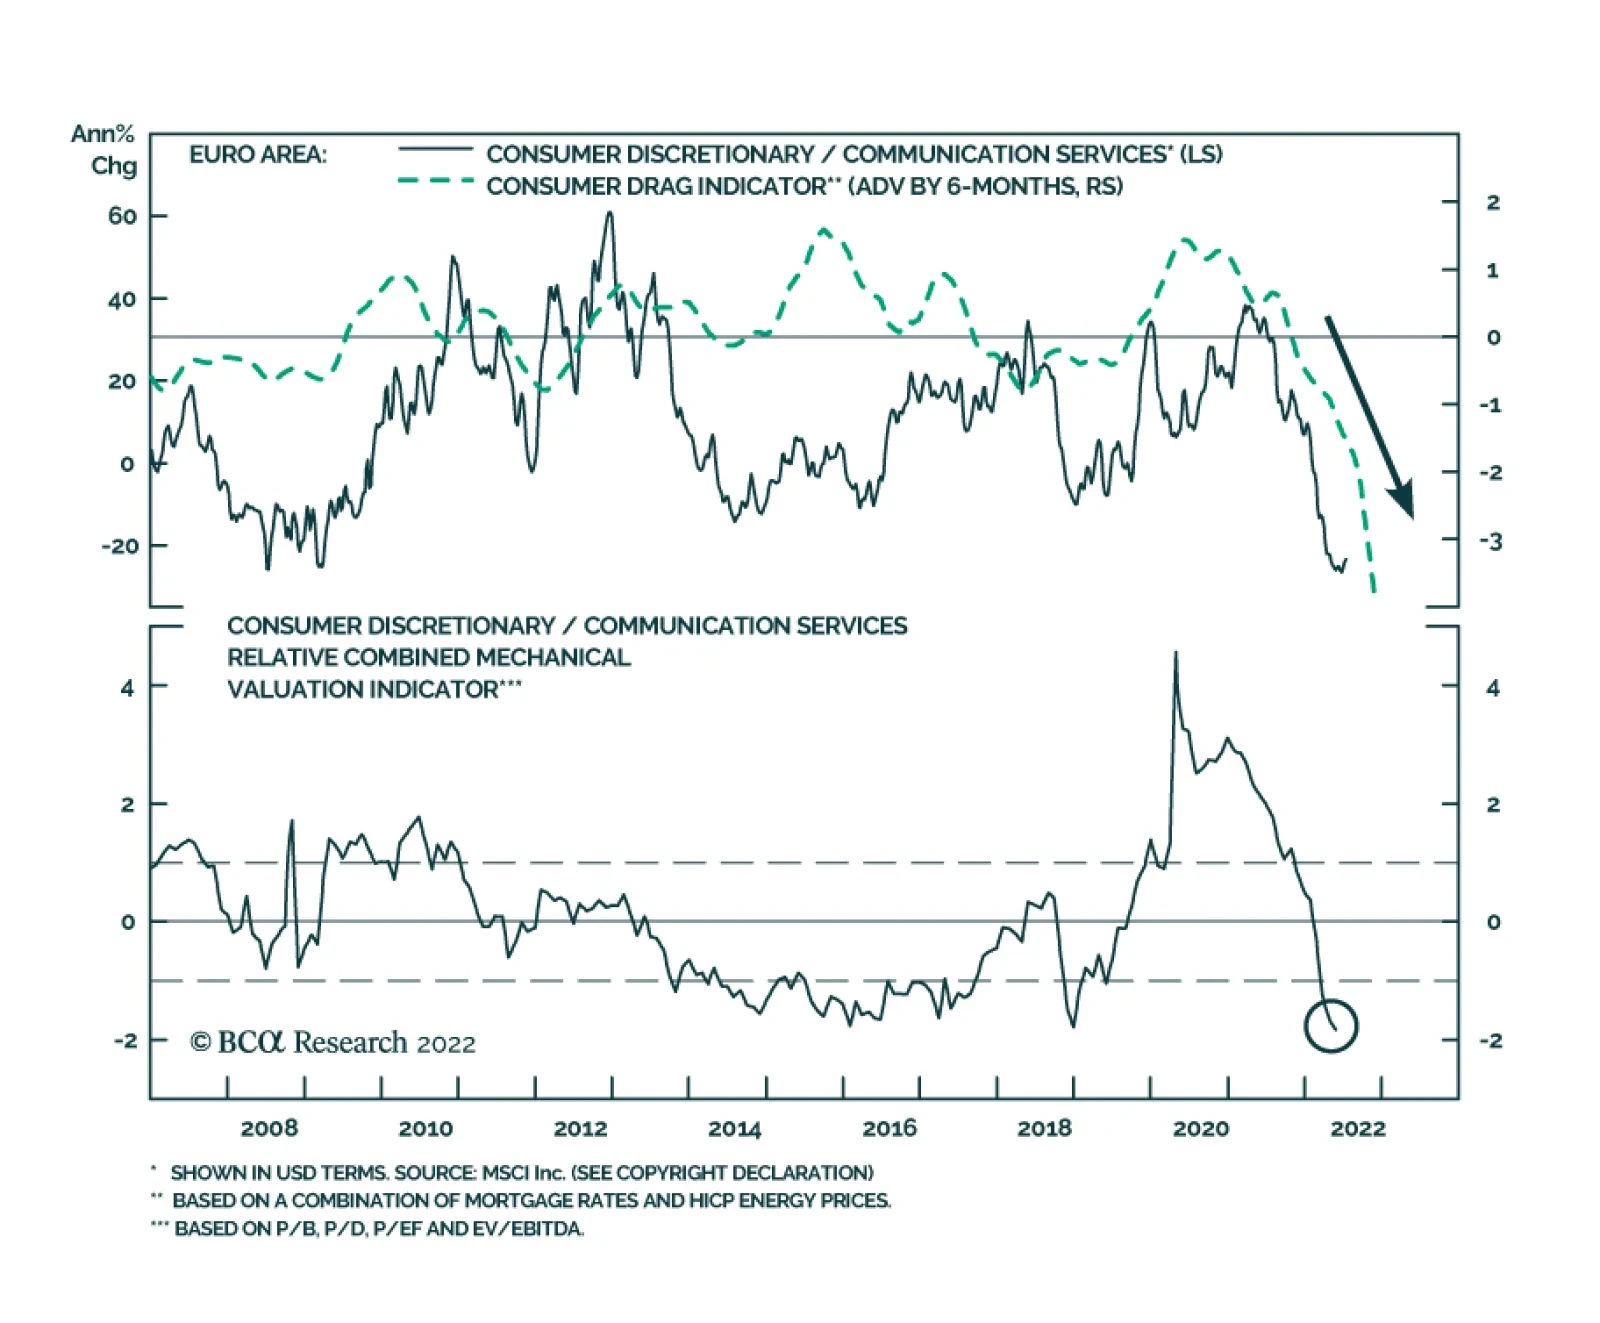
The energy crisis remains a headwind to the eurozone economy, raising the possibility that Europe will need to ration electricity this winter. Indeed, the European Commission’s measure of consumer confidence slumped this year and is now broadly in line with…
Listen to a short summary of this report. Executive Summary The TIPS Market Foresees A Sharp Deceleration In Inflation
What If The TIPS Are Right?
What If The TIPS Are Right?
TIPS breakevens are pointing to a rapid decline in US inflation over the next two years. If the TIPS are right, the Fed will not need to raise rates faster than what is already discounted over the next six months. Falling inflation will allow real wages to start rising again. This will bolster consumer confidence, making a recession less likely. The surprising increase in analyst EPS estimates this year partly reflects the contribution of increased energy profits and the fact that earnings are expressed in nominal terms while economic growth is usually expressed in real terms. Nevertheless, even a mild recession would probably knock down operating earnings by 15%-to-20%. While a recession in the US is not our base case, it is for Europe. A European recession is likely to be short-lived with the initial shock from lower Russian gas flows counterbalanced by income-support measures and ramped-up spending on energy infrastructure and defense. We are setting a limit order to buy EUR/USD at 0.981. Bottom Line: Stocks lack an immediate macro driver to move higher, but that driver should come in the form of lower inflation prints starting as early as next month. Investors should maintain a modest overweight to global equities. That said, barring any material developments, we would turn neutral on stocks if the S&P 500 were to rise above 4,050. US CPI Surprises to the Upside… Again Investors hoping for some relief on the inflation front were disappointed once again this week. The US headline CPI rose 1.32% month-over-month in June, above the consensus of 1.1%. Core inflation increased to 0.71%, surpassing consensus estimates of 0.5%. The key question is how much of June’s report is “water under the bridge” and how much is a harbinger of things to come. Since the CPI data for June was collected, oil prices have dropped to below $100/bbl. Nationwide gasoline prices have fallen for four straight weeks, with the futures market pointing to further declines in the months ahead. Agriculture and metals prices have swooned. Used car prices are heading south. Wage growth has slowed to about 4% from around 6.5% in the second half of last year. The rate of change in the Zillow rent index has rolled over, albeit from high levels (Chart 1). The Zumper National Rent index is sending a similar message as the Zillow data. All this suggests that inflation may be peaking. The TIPS market certainly agrees. It is discounting a rapid decline in US inflation over the next few years. This week’s inflation report did little to change that fact (Chart 2). Chart 1Some Signs That Inflation Has Peaked
Some Signs That Inflation Has Peaked
Some Signs That Inflation Has Peaked
Chart 2Investors Expect Inflation To Fall Rapidly Over The Next Few Years
What If The TIPS Are Right?
What If The TIPS Are Right?
TIPS Still Siding with Team Transitory If the TIPS market is right, this would have two important implications. First, the Fed would not need to raise rates more quickly over the next six months than the OIS curve is currently discounting (although it probably would not need to cut rates in 2023 either, given our higher-than-consensus view of where the US neutral rate lies) (Chart 3). The second implication is that real wages, which have declined over the past year, will start rising again as inflation heads lower. Falling real wages have sapped consumer confidence. As real wage growth turns positive, confidence will improve, helping to bolster consumer spending (Chart 4). To the extent that consumption accounts for nearly 70% of the US economy – and other components of GDP such as investment generally take their cues from consumer spending – this would significantly raise the odds of a soft landing. Chart 3The Fed Is Signaling That It Will Raise Rates To Almost 4% In 2023
The Fed Is Signaling That It Will Raise Rates To Almost 4% In 2023
The Fed Is Signaling That It Will Raise Rates To Almost 4% In 2023
Chart 4Positive Real Wage Growth Will Provide A Boost To Consumer Confidence
Positive Real Wage Growth Will Provide A Boost To Consumer Confidence
Positive Real Wage Growth Will Provide A Boost To Consumer Confidence
Chart 5Long-Term Inflation Expectations Remain Well Anchored
Long-Term Inflation Expectations Remain Well Anchored
Long-Term Inflation Expectations Remain Well Anchored
Of course, the TIPS market could be wrong. Bond traders do not set prices and wages. Businesses and workers, interacting with each other, ultimately determine the direction of inflation. Yet, the view of the TIPS market is broadly in sync with the view of most households and businesses. Expected inflation 5-to-10 years out in the University of Michigan survey has risen since the pandemic began, but at about 3%, it is close to where it was for most of the period between 1995 and 2015 (Chart 5). As we pointed out in our recently published Third Quarter Strategy Outlook, and as I discussed in last week’s webcast, the fact that long-term inflation expectations are well anchored implies that the sacrifice ratio – the amount of output that must be forgone to bring down inflation by a given amount — may be quite low. This also raises the odds of a soft landing. Investors Now See Recession as the Base Case Our relatively sanguine view of the US economy leaves us in the minority camp. According to recent polling, more than 70% of US adults expect the economy to be in recession by year-end. Within the investment community, nearly half of retail traders and three-quarters of high-level asset allocators expect a recession within the next 12 months (Chart 6). Chart 6Many Investors Now See Recession As Baked In The Cake
What If The TIPS Are Right?
What If The TIPS Are Right?
Reflecting the downbeat mood among investors, bears exceeded bulls by 20 points in the most recent weekly poll by the American Association of Individual Investors (Chart 7). A record low percentage of respondents in the New York Fed’s Survey of Consumer Expectations believes stocks will rise over the next year (Chart 8). Chart 7Bears Exceed The Bulls By A Wide Margin
Bears Exceed The Bulls By A Wide Margin
Bears Exceed The Bulls By A Wide Margin
Chart 8Households Are Pessimistic On Stocks
Households Are Pessimistic On Stocks
Households Are Pessimistic On Stocks
Resilient Earnings Estimates Admittedly, while sentiment on the economy and the stock market has soured, analyst earnings estimates have yet to decline significantly. In fact, in both the US and the euro area, EPS estimates for 2022 and 2023 are higher today than they were at the start of the year (Chart 9). What’s going on? Part of the explanation reflects the sectoral composition of earnings. In the US, earnings estimates for 2022 are up 2.4% so far this year. Outside of the energy sector, however, 2022 earnings estimates are down 2.2% year-to-date and down 2.9% from their peak in February (Chart 10). Chart 9US And European EPS Estimates Are Up Year-To-Date
US And European EPS Estimates Are Up Year-To-Date
US And European EPS Estimates Are Up Year-To-Date
Another explanation centers on the fact that earnings estimates are expressed in nominal terms while GDP growth is usually expressed in real terms. When inflation is elevated, the difference between real and nominal variables can be important. For example, while US real GDP contracted by 1.6% in Q1, nominal GDP rose by 6.6%. Gross Domestic Income (GDI), which conceptually should equal GDP but can differ due to measurement issues, rose by 1.8% in real terms and by a whopping 10.2% in nominal terms in Q1. Chart 10Soaring Energy Prices Have Boosted Earnings Estimates
Soaring Energy Prices Have Boosted Earnings Estimates
Soaring Energy Prices Have Boosted Earnings Estimates
How Much Bad News Has Been Discounted? Historically, stocks have peaked at approximately the same time as forward earnings estimates have reached their apex. This time around, stocks have swooned well in advance of any cut to earnings estimates (Chart 11). At the time of writing, the S&P 500 was down 25% in real terms from its peak on January 3. Chart 11Unlike In Past Cycles, Stocks Peaked Well Before Earnings
What If The TIPS Are Right?
What If The TIPS Are Right?
This suggests that investors have already discounted some earnings cuts, even if analysts have yet to pencil them in. Consistent with this observation, two-thirds of investors in a recent Bloomberg poll agreed that analysts were “behind the curve” in responding to the deteriorating macro backdrop (Chart 12). Chart 12Most Investors Expect Analyst Earnings Estimates To Come Down
What If The TIPS Are Right?
What If The TIPS Are Right?
Nevertheless, it is likely that stocks would fall further if the economy were to enter a recession. Even in mild recessions, operating profits have fallen by about 15%-to-20% (Chart 13). That is probably a more severe outcome than the market is currently discounting. Chart 13Even A Mild Recession Could Significantly Knock Down Earnings Estimates
Even A Mild Recession Could Significantly Knock Down Earnings Estimates
Even A Mild Recession Could Significantly Knock Down Earnings Estimates
Subjectively, we would expect the S&P 500 to drop to 3,500 over the next 12 months in a mild recession scenario where growth falls into negative territory for a few quarters (30% odds) and to 2,900 in a deep recession scenario where the unemployment rate rises by more than four percentage points from current levels (10% odds). On the flipside, we would expect the S&P 500 to rebound to 4,500 in a scenario where a recession is completely averted (60% odds). A probability-weighted average of these three scenarios produces an expected total return of 8.3% (Table 1). This is enough to warrant a modest overweight to stocks, but just barely. Barring any material developments, we would turn neutral on stocks if the S&P 500 were to rise above 4,050. Table 1A Scenario Analysis For The S&P 500
What If The TIPS Are Right?
What If The TIPS Are Right?
What’s the Right Framework for Thinking About a European Recession? Whereas we would assign 40% odds to a recession in the US over the next 12 months, we would put the odds of a recession in Europe at around 60%. With a recession in Europe looking increasingly probable, a key question is what the nature of this recession would be. The pandemic may provide a useful framework for answering that question. Just as the pandemic represented an external shock to the global economy, the disruption to energy supplies, stemming from Russia’s invasion of Ukraine, represents an external shock to the European economy. In the initial phase of the pandemic, economic activity in developed economies collapsed as millions of workers were forced to isolate at home. Over the following months, however, the proliferation of work-from-home practices, the easing of lockdown measures, and ample fiscal support permitted growth to recover. Eventually, vaccines became available, which allowed for a further shift to normal life. Just as it took about two years for vaccines to become widely deployed, it will take time for Europe to wean itself off its dependence on Russian natural gas. Earlier this year, the IEA reckoned that the EU could displace more than a third of Russian gas imports within a year. The more ambitious REPowerEU plan foresees two-thirds of Russian gas being displaced by the end of 2022. In the meantime, some Russian gas will be necessary. Canada’s decision over Ukrainian objections to return a repaired turbine to Germany for use in the Nord Stream 1 gas pipeline suggests that a full cutoff of Russian gas flows is unlikely. Chart 14The Euro Is 26% Undervalued Against The Dollar Based On PPP
The Euro Is 26% Undervalued Against The Dollar Based On PPP
The Euro Is 26% Undervalued Against The Dollar Based On PPP
During the pandemic, governments wasted little time in passing legislation to ease the burden on households and businesses. The European energy crunch will elicit a similar response. Back when I worked at the IMF, a common mantra in designing lending programs was that one should “finance temporary shocks but adjust to permanent ones.” The current situation Europe is a textbook example for the merits of providing income support to the private sector, financed by temporarily larger public deficits. The ECB’s soon-to-be-launched “anti-fragmentation” program will allow the central bank to buy the government debt of Italy and other at-risk sovereign borrowers without the need for a formal European Stability Mechanism (ESM) program, provided that the long-term debt profile of the borrowers remains sustainable. Get Ready to Buy the Euro All this suggests that Europe could see a fairly brisk rebound after the energy crunch abates. If the euro area recovers quickly, the euro – which is now about as undervalued against the dollar as anytime in its history (Chart 14) – will soar. With that in mind, we are setting a limit order to buy EUR/USD at 0.981. Peter Berezin Chief Global Strategist peterb@bcaresearch.com Follow me on LinkedIn & Twitter Global Investment Strategy View Matrix
What If The TIPS Are Right?
What If The TIPS Are Right?
Special Trade Recommendations Current MacroQuant Model Scores
What If The TIPS Are Right?
What If The TIPS Are Right?