Equities

Executive Summary China's Unemployment
Questions From The Road
Questions From The Road
Over the past week we have been visiting clients along the US west coast. In this report we hit some of the highlights from the most important and frequently asked questions. Xi Jinping is seizing absolute power just as the country’s decades-long property boom turns to bust. He will stimulate the economy but Chinese stimulus is less effective than it used to be. The US and Israel are underscoring their red line against Iranian nuclear weaponization. If Iran does not freeze its nuclear program, the Middle East will begin to unravel again. The UK’s domestic instability is returning, with Scotland threatening to leave the union. Brexit, the pandemic, and inflation make a Scottish referendum a more serious risk than in the past. Shinzo Abe’s assassination makes him a martyr for a vision of Japan as a “normal country” – i.e. one that is not pacifist but capable of defending itself. Japan’s rearmament, like Germany’s, points to the decline of the WWII peace settlement and the return of great power competition. Bottom Line: Investors need a new global balance to be achieved through US diplomacy with Russia, China, and Iran. That is not forthcoming, as the chief nations face instability at home and a stagflationary global economy. Feature The world is becoming less stable as stagflation combines with great power competition. Global uncertainty is through the roof. From a macroeconomic perspective, investors need to know whether central banks can whip inflation without triggering a recession. From a geopolitical perspective, investors need to know whether Russia’s conflict with the West will expand, whether US-China and US-Iran tensions will escalate in a damaging way, and whether domestic political rotations in the US and China this fall will lead to more stable and productive economies. China: What Will Happen At The Communist Party Reshuffle? General Secretary Xi Jinping will cement another five-to-10 years in power while promoting members of his faction into key positions on the Politburo and Politburo Standing Committee. By December Xi will roll out a pro-growth strategy for 2023 and the government will signal that it will start relaxing Covid-19 restrictions. But China’s structural problems ensure that this good news for global growth will only have a fleeting effect. China’s governance is shifting from single-party rule to single-person rule. It is also shifting from commercially focused decentralization to national security focused centralization. Xi has concentrated power in himself, in the party, and in Beijing at the expense of political opponents, the private economy, and outlying regions like Hong Kong, the South China Sea, and Xinjiang. The subordination of Taiwan is the next major project, ensuring that China will ally with Russia and that the US and China cannot repair or deepen their economic partnership. Related Report Geopolitical StrategyWill China Let 100 Flowers Bloom? Only Briefly. Xi and the Communist Party began centralizing political power and economic control shortly after the Great Recession. At that time it became clear that a painful transition away from export manufacturing and close relations with the United States was necessary. The transition would jeopardize China’s long-term economic, social, political, and geopolitical stability. The Communist Party believed it needed to revive strongman leadership (autocracy) rather than pursuing greater liberalization that would ultimately increase the odds of political revolution (democratization). The Xi administration has struggled to manage the country’s vast debt bubble, given that total debt standing has surged to 287% of GDP. The global pandemic forced the government to launch another large stimulus package, which it then attempted to contain. Corporate and household deleveraging ensued. The property and infrastructure boom of the past three decades has stalled, as the regime has imposed liquidity and capital requirements on banks and property developers to try to avoid a financial crisis. Regulatory tightening occurred in other sectors to try to steer investment into government-approved sectors and reduce the odds of technological advancement fanning social dissent. China’s draconian “zero Covid” policy sought to limit the disease’s toll, improve China’s economic self-reliance, and eliminate the threat of social protest during the year of the twentieth party congress. But it also slammed the brakes on growth. China is highly vulnerable to social instability for both structural and cyclical reasons. Chinese social unrest was our number one “Black Swan” for this year and it is now starting to take shape in the form of angry mortgage owners across the country refusing to make mortgage payments on houses that were pre-purchased but not yet built and delivered (Chart 1). Chart 1China: Mortgage Payment Boycott
Questions From The Road
Questions From The Road
The mortgage payment boycott is important because it is stemming from the outstanding economic and financial imbalance – the property sector – and because it is a form of cross-regional social organization, which the Communist Party will disapprove. There are other social protests emerging, including low-level bank runs, which must be monitored very closely. Local authorities will act quickly to stop the spread of the mortgage boycott. But unhappy homeowners will be a persistent problem due to the decline of the property sector and industry. China’s property sector looks uncomfortably like the American property sector ahead of the 2006-08 bust. Prices for existing homes are falling while new house prices are on the verge of falling (Chart 2). While mortgages only make up 15% of bank assets, and household debt is only 62% of GDP, households are no longer taking on new debt (Chart 3). Chart 2China's Falling Property Prices
China's Falling Property Prices
China's Falling Property Prices
Chart 3China's Property Crisis
China's Property Crisis
China's Property Crisis
Chart 4China's Unemployment
China's Unemployment
China's Unemployment
Most likely China’s property sector is entering the bust phase that we have long expected – if not, then the reason will be a rapid and aggressive move by authorities to expand monetary and fiscal stimulus and loosen economic restrictions. That process of broad-based easing – “letting 100 flowers bloom” – will not fully get under way until after the party congress, say in December. Unemployment is rising across China as the economy slows, another point of comparison with the United States ahead of the 2008 property collapse (Chart 4). Unemployment is a manipulated statistic so real conditions are likely worse. There is no more important indicator. China’s government will be forced to ease policy, creating a positive impact on global growth in 2023, but the impact will be fleeting. Bottom Line: The underlying debt-deflationary context will prevail before long in China, weighing on global growth and inflation expectations on a cyclical basis. Middle East: Why Did Biden Go And What Will He Get? President Biden traveled to Israel and now Saudi Arabia because he wants Saudi Arabia and the Gulf Arab members of OPEC to increase oil production to reduce gasoline prices at the pump for Americans ahead of the midterm elections (Chart 5). Chart 5Biden Goes To Israel And Saudi Arabia
Biden Goes To Israel And Saudi Arabia
Biden Goes To Israel And Saudi Arabia
True, fears of recession are already weighing on prices, but Biden embarked on this mission before the growth slowdown was fully appreciated and he is not going to lightly abandon the anti-inflation fight before the midterm election. Biden also went because one of his top foreign policy priorities – the renegotiation of the 2015 nuclear deal with Iran – is falling apart. The Iranians do not want to freeze their nuclear program because they want regime survival and security. While Biden is offering a return to the 2015 deal, the conditions that produced the deal are no longer applicable: Russia and China are not cooperating with the US and EU to isolate Iran. Russia is courting Iran, oil prices are high and sanction enforcement is weak (unlike 2015). The Iranians now know, after the Trump administration, that they cannot trust the Americans to give credible security guarantees that will last across parties and administrations. The war in Ukraine also underscores the weakness of diplomatic security guarantees as opposed to a nuclear deterrent. Hence the joint US and Israeli declaration that Iran will never be allowed to obtain nuclear weapons. The good news is that this kind of joint statement is precisely what needed to occur – the underscoring of the red line – to try to change Ayatollah Ali Khamenei’s calculus regarding his drive to achieve nuclear breakout. In 2015 Khamenei gave diplomacy a chance to try to improve the economy, stave off social unrest, prepare the way for his eventual leadership succession process, and secure the Islamic Republic. The bad news is that Khamenei probably cannot make the same decision this time, as the hawkish faction now runs his government, the Americans are unreliable, and Russia and China are offering an alternative strategic orientation. The Saudis will pump more oil if necessary to save the global business cycle but not at the beck and call of a US president. The drop in oil prices reduces their urgency. The Americans can reassure the Saudis and Israel as long as the deal with Iran is not going forward. That looks to be the case. But then the US and Israel will have to undertake joint actions to underline their threat to Iran – and Iran will have to threaten to stage attacks across the region so as to deter any attack. Bottom Line: If a US-Iran deal does not materialize at the last minute, Middle Eastern instability will revive and a new source of oil supply constraint will plague the global economy. We continue to believe a US-Iran deal is unlikely, with only 40% odds of happening. Europe: Will Russia Turn Back On The Natural Gas? Russia’s objective in cutting off European natural gas is to inflict a recession on Europe. It wants a better bargaining position on strategic matters. Therefore we assume Russia will continue to squeeze supplies from now through the winter, when European demand rises and Russian leverage will peak. If Russia allows some flow to return, then it will be part of the negotiating process and will not preclude another cutoff before winter. It is possible that Russia is merely giving Europe a warning and will revert back to supplying natural gas. The problem is that Russia’s purpose is to achieve a strategic victory in Ukraine and in negotiations over NATO’s role in the Nordic countries. Russia has not achieved these goals, so natural gas cutoff will likely continue. Russia also hopes that by utilizing its energy leverage – while it still has it – it will bring forward the economic pain of Europe’s transition away from reliance on Russian energy. In that case European countries will experience recession and households will begin to change their view of the situation. European governments will be more likely to change their policies, to become more pragmatic and less confrontational toward Russia. Or European governments will be voted out of power and do the same thing. Other states could join Hungary in saying that Europe should never impose a full natural gas embargo on Russia. Russia would be able to salvage some of its energy trade with Europe over the long run, despite the war in Ukraine and the inevitable European energy diversification. In recent months we highlighted Italy as the weakest link in the European chain and the country most likely to see such a shift in policy occur. Italy’s national unity coalition had lost its reason for being, while the combination of rising bond yields and natural gas prices weighed on the economy. The Italian bond spread over German bunds has long served as our indicator of European political stress – and it is spiking now, forcing the European Central Bank to rush to plan an anti-fragmentation strategy that would theoretically enable it to tighten monetary policy while preventing an Italian debt crisis (Chart 6). The European Union remains unlikely to break up – Russian aggression was always one of our chief arguments for why the EU would stick together. But Italy will undergo a recession and an election (due by June 2023 but that could easily happen this fall), likely producing a new government that is more pragmatic with regard to Russia so as to reduce the energy strain. Chart 6Italy's Crisis Points To EU Divisions On Russia
Italy's Crisis Points To EU Divisions On Russia
Italy's Crisis Points To EU Divisions On Russia
Italy’s political turmoil shows that European states are feeling the energy crisis and will begin to shift policies to reduce the burden on households. Households will lose their appetite for conflict with Russia on behalf of Ukrainians, especially if Russia begins offering a ceasefire after completing its conquest of the Donetsk area. If Russia expands its invasion, then Europe will expand sanctions and the risk of further strategic instability will go up. But most likely Russia will seek to quit while it is ahead and twist Europe’s arm into foisting a ceasefire onto Ukraine. Bottom Line: A change of government in Italy will increase the odds that the EU will engage in diplomacy with Russia in the coming year, if Russia offers, so as to reach a new understanding, restore natural gas flows, and salvage the economy. This would leave NATO enlargement unresolved but a shift in favor of a ceasefire in Ukraine in 2023 would be less negative for European assets and the euro. UK: Who Will Replace Boris Johnson? Last week UK Prime Minister Boris Johnson fell from power and now the Conservative Party is engaging in a leadership competition to replace him. We gave up on Johnson after he survived his no-confidence vote and yet it became clear that he could not recover in popular opinion. The inflation outburst destroyed his premiership and wiped away whatever support he had gained from executing Brexit. In fact it reinforced the faction that believed Brexit was the wrong decision. Going forward the UK will be consumed with domestic political turmoil as the cost of stagflation mounts, and geopolitical turmoil as Scotland attempts to hold a second independence referendum, possibly by October 2023. Global investors should focus primarily on Scotland’s attempt to secede, since the breakup of the United Kingdom would be a momentous historical event and a huge negative shock for pound sterling. While only 44.7% of Scots voted for independence in 2014, now they have witnessed Brexit, Covid-19, and stagflation, producing tailwinds for the Scots nationalist vote (Chart 7). Chart 7Forget Bojo's Exit, Watch Scotland
Questions From The Road
Questions From The Road
There are still major limitations on Scotland exiting, since its national capabilities are limited, it would need to join the European Union, and Spain and possibly others will threaten to veto its membership in the European Union for fear of feeding their own secessionist movements. But any new referendum – including one done without the approval of Westminster – should be taken very seriously by investors. Bottom Line: Johnson’s removal will only marginally improve the Tories’ ability to manage the rebellion brewing in the north. A snap election that brings the Labour Party back into power would have a greater chance of keeping Scotland in the union, although it is not clear that such a snap election will happen in time to affect any Scottish decision. The UK faces economic and political turmoil between now and any referendum and investors should steer clear of the pound. (Though we still favor GBP over eastern European currencies). Britain will remain aggressive toward Russia but its ability to affect the Russian dynamic will fall, leaving the US and EU to decide the fate of Russian relations. Japan: What Is The Significance Of Shinzo Abe’s Assassination? Former Japanese Prime Minister Shinzo Abe was assassinated by a lone fanatic with a handmade gun. The significance of the incident is that Abe will become a martyr for a certain vision of Japan – his vision of Japan, which is that Japan can become a “normal country” that moves beyond the shackles of the guilt of its imperial aggression in World War II. A normal country is one that is economically stable and militarily capable of defending itself – not a pacifist country mired in debt-deflation. Abe stood for domestic reflation and a proactive foreign policy, along with the normalization of the Japanese Self-Defense Forces (JSDF). True, economic policy can become less dovish if necessary to deal with inflation. Some changes at the Bank of Japan may usher in a less dovish shift in monetary policy in particular. But monetary policy cannot become outright hawkish like it was before Abe. And Abe’s fiscal policy was never as loose as it was made out to be, given that he executed several hikes to the consumption tax. Japan’s structural demographic decline and large debt burden will continue to weigh on economic activity whenever real rates and the yen rise. The government will be forced to reflate using monetary and fiscal policy whenever deflation threatens to return. Debt monetization will remain an option for future Japanese governments, even if it is restrained during times of high inflation. Chart 8Shinzo Abe's Legacy
Questions From The Road
Questions From The Road
This is not only because Japanese households will become depressed if deflation is left unchecked but also because economic growth must be maintained in order to sustain the nation’s new and growing national defense budgets. Japan’s growing need for self defense stems from China’s strategic rise, Russia’s aggression, and North Korea’s nuclearization, plus uncertainty about the future of American foreign policy. These trends will not change anytime soon. Indeed the Liberal Democratic Party’s popularity has increased under Abe’s successor, Prime Minister Fumio Kishida, who will largely sustain Abe’s vision. The Diet still has a supermajority in favor of constitutional revision so as to enshrine the self-defense forces (Chart 8). And the de facto policy of rearmament continues even without formal revision. Bottom Line: Any Japanese leader who attempts to promote a hawkish BoJ, and a dovish JSDF, will fail sooner rather than later. The revolving door of prime ministers will accelerate. As Japan’s longest-serving prime minister, Shinzo Abe opened up the reliable pathway, which is that of a dovish BoJ and a hawkish foreign policy. This is important for the world, as well as Japan, because a more hawkish Japan will increase China’s fears of strategic containment. The frozen conflicts in Asia will continue to thaw, perpetuating the secular rise in geopolitical risk. We remain long JPY-KRW, since the BoJ may adjust in the short term and Chinese stimulus is still compromised, but that trade is on downgrade watch. Investment Takeaways Russia’s energy cutoff is aimed at pushing Europe into recession so as to force policy changes or government changes in Europe that will improve Russia’s position at the negotiating table over Ukraine, NATO, and other strategic disputes. Hence Russia is unlikely to increase the natural gas flow until it believes it has achieved its strategic aims and multiple veto players in the EU will prevent the EU from ever implementing a full-blown natural gas embargo. Chinese stimulus cannot be fully effective until it relaxes Covid-19 restrictions, likely beginning in December or next year when Xi Jinping uses his renewed political capital to try to stabilize the economy. However, China’s government powers alone are insufficient to prevent the debt-deflationary tendency of the property bust. The Middle East faces rising geopolitical tensions that will take markets by surprise with additional energy supply constraints. The implication is continued oil volatility given that global growth is faltering. Once global demand stabilizes, the Middle East’s turmoil will add to existing oil supply constraints to create new price pressures. The odds are not very high of the Federal Reserve achieving a “soft landing” in the context of a global energy shock and a stagflationary Europe and China. Matt Gertken Chief Geopolitical Strategist mattg@bcaresearch.com Strategic Themes Open Tactical Positions (0-6 Months) Open Cyclical Recommendations (6-18 Months) Regional Geopolitical Risk Matrix "Batting Average": Geopolitical Strategy Trades () Section II: Special (EDIT this Header) Section III: Geopolitical Calendar
In lieu of next week’s report, I will host the monthly Counterpoint Webcast on Monday, July 25. Please mark the date in your calendar, and I do hope you can join. Executive Summary Central banks face a ‘Sophie’s choice’. Inflation at 2 percent, or full employment? If they choose inflation at 2 percent, they will have to take the economy into recession. To take the economy into recession, bond yields and energy prices do not need to move any higher. They just need to stay where they are. The stock market has not yet discounted a recession. With stocks and bonds having become equally ‘cheaper’ this year, but stocks now vulnerable to substantial downgrades to their profits, stocks are likely to underperform bonds over the coming 6-12 months. In the event of recession followed by plunging inflation, a valuation uplift for bonds will also underpin stock prices and limit further downside in absolute terms. The biggest loser will be commodities. On a 6-12 month horizon, the optimal asset allocation is: overweight bonds, neutral stocks, underweight commodities. Fractal trading watchlist: Ethereum. The Bear Market Is A Valuation Bear Market. Profits Are Not Discounting A Recession… Yet
Stocks Caught Between Scylla And Charybdis
Stocks Caught Between Scylla And Charybdis
Bottom Line: On a 6-12 month horizon, overweight bonds, neutral stocks, underweight commodities. Feature The Greek mythological sea monsters, Scylla and Charybdis, sat on opposite sides of the narrow Strait of Messina, with one monster likened to a shoal of rocks, the other to a vortex. Avoiding the rocks meant getting too close to the vortex, and avoiding the vortex meant getting too close to the rocks. In today’s stock market, if Scylla is the monster of high bond yields, then Charybdis is the monster of falling profits. Whether the stock market can safely navigate these twin monsters without further damage depends on a sequence of questions. In today’s stock market, if Scylla is the monster of high bond yields, then Charybdis is the monster of falling profits. If the market can escape high bond yields, can it also escape falling profits? The answer to this depends on a second question. Can central banks guide inflation back to 2 percent without taking the economy into recession? The answer to this depends on a third question. Is 2 percent inflation still consistent with full employment? Central Banks Face A ‘Sophie’s Choice’ – Low Inflation, Or Full Employment? In the US, the main transmission mechanism from employment to inflation is through so-called ‘rent of shelter’. Because, to put it bluntly, you need a steady job to pay the rent. And rent comprises 41 percent of the core inflation basket. For the past couple of decades, the Fed could have its cake and eat it: full employment and inflation running close to 2 percent. This was because full employment was consistent with rent of shelter inflation running at 3.5 percent, which itself was consistent with core inflation running at 2 percent. The Fed faces a ‘Sophie’s choice’. Inflation at 2 percent, or full employment? If it chooses inflation at 2 percent, then the Fed will have to take the economy into recession. But recently, there has been a phase-shift between the employment market and rent of shelter inflation. The current state of full employment equates to rent of shelter inflation running not at 3.5 percent, but at 5.5 percent (Chart I-1). Chart I-1Central Banks Face A 'Sophie's Choice' - Low Inflation, Or Full Employment?
Central Banks Face A 'Sophie's Choice' - Low Inflation, Or Full Employment?
Central Banks Face A 'Sophie's Choice' - Low Inflation, Or Full Employment?
Hence, the Fed faces a ‘Sophie’s choice’. Inflation at 2 percent, or full employment? If it chooses inflation at 2 percent, the unemployment rate will have to rise by 2 percent. Meaning, the Fed will have to take the economy into recession. The Economy Tries The ‘Cold Pressor Test’ To take the economy into recession, bond yields and energy prices do not need to move any higher – they just need to stay where they are. This is because the damage from elevated bond yields and energy prices doesn’t come just from their level. It comes from their level multiplied by the length of time that they stay elevated. Try putting your hand in a bucket of ice water. For the first few seconds, or even tens of seconds, you will not feel any discomfort. After a few minutes though, the pain becomes excruciating. This so-called ‘cold pressor test’ tells us that your discomfort results not just from the temperature level of the ice water, but equally from the length of time that you keep your hand in it. Likewise, a short-lived spike in the mortgage rate or in the price of natural gas, or a short-lived collapse in your stock market wealth will not cause any discomfort. But the longer the mortgage rate stays elevated, and more and more people are buying or refinancing a home at a much higher rate, the greater becomes the economic pain. In the same vein, most Europeans will not notice the sky-high prices of natural gas in the summer when the heating is off. But come the cold of October and November, many people will have to choose literally between physical or economic pain. Some commentators counter that the “war chest of savings” accumulated during the pandemic will buffer households against higher mortgage rates and energy prices. We strongly disagree. The savings accumulated during the pandemic just added to, and became indistinguishable from, other wealth. Yet now, in case you hadn’t noticed, wealth has been pummelled. In case you hadn’t noticed, wealth has been pummelled. The impact of wealth on spending is a huge topic which we will expand upon in a future report. In a nutshell, most spending comes from income and income proxies. Wealth generates income, but it also generates an income proxy via capital gain. So, to the extent that wealth can drive spending growth, the biggest contributor comes from the change in capital gain, also known as the ‘wealth impulse’. Unfortunately, the wealth impulse is now in deeply negative territory (Chart I-2). Chart I-2The Wealth Impulse Is In Deeply Negative Territory
The Wealth Impulse Is In Deeply Negative Territory
The Wealth Impulse Is In Deeply Negative Territory
The Stock Market Has Not Yet Discounted A Recession Coming back to the stock market, does the 2022 bear market mean that it has already discounted a recession? No, this year’s bear market is entirely due to a collapse in valuations. Since the start of the year, US profit expectations have held up. If the bear market were front running profit downgrades, then it would be underperforming its valuation component, but it is not. The counterargument is that analysts are notoriously slow to downgrade their profit estimates. Isn’t the bear market the ‘real-time’ stock market ‘front running’ big downgrades to these profit estimates? Again, no. If the market were front running profit downgrades, then it would be underperforming its valuation component, but it is not (Chart I-3). Chart I-3The Bear Market Is A Valuation Bear Market. Profits Are Not Discounting A Recession...Yet
The Bear Market Is A Valuation Bear Market. Profits Are Not Discounting A Recession...Yet
The Bear Market Is A Valuation Bear Market. Profits Are Not Discounting A Recession...Yet
The bear market in the S&P 500 has near-perfectly tracked the bear market in its valuation component, the 30-year T-bond price. The valuation component of the S&P 500 is the 30-year T-bond price because the duration of the S&P 500 equals the duration of the 30-year T-bond. Several clients have asked how to prove that the duration of the S&P 500 equals that of the 30-year T-bond. We can do it either a difficult theoretical way, or an easy empirical way. The difficult theoretical way is to take the projected cashflows, and calculate the weighted average time to those cashflows, where the weights are the discounted values of those cashflows. The much easier empirical way is to show that the S&P 500 tracks its profits multiplied by the 30-year T-bond price more faithfully than if we use a shorter maturity bond, such as the 10-year T-bond (Chart I-4 and Chart I-5) Chart I-4The S&P 500 Tracks Profits Multiplied By The 30-Year T-Bond Price More Faithfully...
The S&P 500 Tracks Profits Multiplied By The 30-Year T-Bond Price More Faithfully...
The S&P 500 Tracks Profits Multiplied By The 30-Year T-Bond Price More Faithfully...
Chart I-5...Than Profits Multiplied By The 10-Year T-Bond Price
...Than Profits Multiplied By The 10-Year T-Bond Price
...Than Profits Multiplied By The 10-Year T-Bond Price
One important upshot is that any valuation comparison of the S&P 500 with a bond other than the 30-year T-bond is a fundamental error of duration mismatch. Most strategists compare the S&P 500 with the 10-year T-bond because it is convenient. But the duration mismatch makes this ‘apples versus oranges’ valuation comparison one of the most common mistakes in finance. Overweight Bonds, Neutral Stocks, Underweight Commodities All of this is important to answer a crucial question about stock market valuations. With the stock market 20 percent down this year when expected profits have held up, it might appear that stocks have become much cheaper. The truth is more nuanced. Relative to expected profits over the next 12 months the US stock market is indeed much cheaper (Chart I-6). The caveat is that these expected profits are vulnerable to substantial downgrades in the event of a recession. Chart I-6The US Stock Market Is Cheaper Versus Expected Profits, But These Profits Are Too Optimistic
The US Stock Market Is Cheaper Versus Expected Profits, But These Profits Are Too Optimistic
The US Stock Market Is Cheaper Versus Expected Profits, But These Profits Are Too Optimistic
Chart I-7The US Stock Market Is Not Cheaper Versus The 30-Year T-Bond
The US Stock Market Is Not Cheaper Versus The 30-Year T-Bond
The US Stock Market Is Not Cheaper Versus The 30-Year T-Bond
But relative to the equal duration 30-year T-bond, the US stock market is not cheaper. Since, the start of the year, the uplift in the stock market’s (forward earnings) yield is precisely the same as the that on the 30-year T-bond yield (Chart I-7). Relative to the equal duration 30-year T-bond, the US stock market has not become cheaper. With stocks and bonds having become equally ‘cheaper’ this year, but stocks now vulnerable to substantial downgrades to their profits, stocks are likely to underperform bonds over the coming 6-12 months. The good news is that a valuation uplift for bonds will also underpin stock prices, and limit further downside in absolute terms. Unfortunately, the same cannot be said for commodities, whose real prices are still close to the upper end of their 40-year trading range (Chart I-8) Chart I-8The Real Price Of Metals Is Still At The Upper End Of Its 40-Year Trading Range
The Real Price Of Metals Is Still At The Upper End Of Its 40-Year Trading Range
The Real Price Of Metals Is Still At The Upper End Of Its 40-Year Trading Range
In the event of recession followed by plunging inflation, the biggest winner will be bonds and the biggest loser will be commodities. Therefore, on a 6-12 horizon, the optimal asset allocation is: Overweight bonds. Neutral stocks. Underweight commodities. Fractal Trading Watchlist This week we are adding Ethereum to our watchlist, as its 130-day fractal structure is approaching the capitulation point that signalled previous major trend reversals in 2018 (a bottom) and 2021 (a top). The full watchlist of 27 investments that are approaching, or at, potential trend reversals is available on our website: cpt.bcaresearch.com Fractal Trading Watchlist: New Additions Chart I-9Fractal Trading Watch List
Fractal Trading Watch List
Fractal Trading Watch List
Chart 1CNY/USD At A Potential Turning Point
CNY/USD At A Potential Turning Point
CNY/USD At A Potential Turning Point
Chart 2US REITS Are Oversold Versus Utilities
US REITS Are Oversold Versus Utilities
US REITS Are Oversold Versus Utilities
Chart 3CAD/SEK Is Vulnerable To Reversal
CAD/SEK Is Vulnerable To Reversal
CAD/SEK Is Vulnerable To Reversal
Chart 4Financials Versus Industrials Has Reversed
Financials Versus Industrials Has Reversed
Financials Versus Industrials Has Reversed
Chart 5The Outperformance Of Resources Versus Biotech Has Ended
The Outperformance Of Resources Versus Biotech Has Ended
The Outperformance Of Resources Versus Biotech Has Ended
Chart 6The Outperformance Of Resources Versus Healthcare Has Ended
The Outperformance Of Resources Versus Healthcare Has Ended
The Outperformance Of Resources Versus Healthcare Has Ended
Chart 7FTSE100 Outperformance Vs. Euro Stoxx 50 Is Vulnerable To Reversal
FTSE100 Outperformance Vs. Euro Stoxx 50 Is Vulnerable To Reversal
FTSE100 Outperformance Vs. Euro Stoxx 50 Is Vulnerable To Reversal
Chart 8Netherlands' Underperformance Vs. Switzerland Is Ending
Netherlands' Underperformance Vs. Switzerland Is Ending
Netherlands' Underperformance Vs. Switzerland Is Ending
Chart 9The Sell-Off In The 30-Year T-Bond At Fractal Fragility
The Sell-Off In The 30-Year T-Bond At Fractal Fragility
The Sell-Off In The 30-Year T-Bond At Fractal Fragility
Chart 10The Sell-Off In The NASDAQ Is Approaching Fractal Fragility
The Sell-Off In The NASDAQ Is Approaching Fractal Fragility
The Sell-Off In The NASDAQ Is Approaching Fractal Fragility
Chart 11Food And Beverage Outperformance Is Exhausted
Food And Beverage Outperformance Is Exhausted
Food And Beverage Outperformance Is Exhausted
Chart 12German Telecom Outperformance Vulnerable To Reversal
German Telecom Outperformance Vulnerable To Reversal
German Telecom Outperformance Vulnerable To Reversal
Chart 13Japanese Telecom Outperformance Vulnerable To Reversal
Japanese Telecom Outperformance Vulnerable To Reversal
Japanese Telecom Outperformance Vulnerable To Reversal
Chart 14ETH Is Approaching A Possible Capitulation
ETH Is Approaching A Possible Capitulation
ETH Is Approaching A Possible Capitulation
Chart 15The Strong Trend In The 18-Month-Out US Interest Rate Future Has Ended
The Strong Trend In The 18-Month-Out US Interest Rate Future Has Ended
The Strong Trend In The 18-Month-Out US Interest Rate Future Has Ended
Chart 16The Strong Downtrend In The 3 Year T-Bond Has Ended
The Strong Downtrend In The 3 Year T-Bond Has Ended
The Strong Downtrend In The 3 Year T-Bond Has Ended
Chart 17A Potential Switching Point From Tobacco Into Cannabis
A Potential Switching Point From Tobacco Into Cannabis
A Potential Switching Point From Tobacco Into Cannabis
Chart 18Biotech Is A Major Buy
Biotech Is A Major Buy
Biotech Is A Major Buy
Chart 19Norway's Outperformance Has Ended
Norway's Outperformance Has Ended
Norway's Outperformance Has Ended
Chart 20Cotton Versus Platinum Has Reversed
Cotton Versus Platinum Has Reversed
Cotton Versus Platinum Has Reversed
Chart 21Switzerland's Outperformance Vs. Germany Has Ended
Switzerland's Outperformance Vs. Germany Has Ended
Switzerland's Outperformance Vs. Germany Has Ended
Chart 22USD/EUR Is Vulnerable To Reversal
USD/EUR Is Vulnerable To Reversal
USD/EUR Is Vulnerable To Reversal
Chart 23The Outperformance Of MSCI Hong Kong Versus China Has Ended
The Outperformance Of MSCI Hong Kong Versus China Has Ended
The Outperformance Of MSCI Hong Kong Versus China Has Ended
Chart 24A Potential New Entry Point Into Petcare
A Potential New Entry Point Into Petcare
A Potential New Entry Point Into Petcare
Chart 25GBP/USD At A Potential Turning Point
GBP/USD At A Potential Turning Point
GBP/USD At A Potential Turning Point
Chart 26US Utilities Outperformance Vulnerable To Reversal
US Utilities Outperformance Vulnerable To Reversal
US Utilities Outperformance Vulnerable To Reversal
Chart 27The Outperformance Of Oil Versus Banks Is Exhausted
The Outperformance Of Oil Versus Banks Is Exhausted
The Outperformance Of Oil Versus Banks Is Exhausted
Dhaval Joshi Chief Strategist dhaval@bcaresearch.com Fractal Trading System Fractal Trades
Stocks Caught Between Scylla And Charybdis
Stocks Caught Between Scylla And Charybdis
Stocks Caught Between Scylla And Charybdis
Stocks Caught Between Scylla And Charybdis
6-12 Month Recommendations Structural Recommendations Closed Fractal Trades Indicators To Watch - Bond Yields Chart II-1Indicators To Watch - Bond Yields - Euro Area
Indicators To Watch - Bond Yields - Euro Area
Indicators To Watch - Bond Yields - Euro Area
Chart II-2Indicators To Watch - Bond Yields - Europe Ex Euro Area
Indicators To Watch - Bond Yields - Europe Ex Euro Area
Indicators To Watch - Bond Yields - Europe Ex Euro Area
Chart II-3Indicators To Watch - Bond Yields - Asia
Indicators To Watch - Bond Yields - Asia
Indicators To Watch - Bond Yields - Asia
Chart II-4Indicators To Watch - Bond Yields - Other Developed
Indicators To Watch - Bond Yields - Other Developed
Indicators To Watch - Bond Yields - Other Developed
Indicators To Watch - Interest Rate Expectations Chart II-5Indicators To Watch - Interest Rate Expectations
Indicators To Watch - Interest Rate Expectations
Indicators To Watch - Interest Rate Expectations
Chart II-6Indicators To Watch - Interest Rate Expectations
Indicators To Watch - Interest Rate Expectations
Indicators To Watch - Interest Rate Expectations
Chart II-7Indicators To Watch - Interest Rate Expectations
Indicators To Watch - Interest Rate Expectations
Indicators To Watch - Interest Rate Expectations
Chart II-8Indicators To Watch - Interest Rate Expectations
Indicators To Watch - Interest Rate Expectations
Indicators To Watch - Interest Rate Expectations
Executive Summary No Funding For Property Developers, No Land Sales
No Funding For Property Developers, No Land Sales
No Funding For Property Developers, No Land Sales
Beijing’s plan to bring forward RMB 2.6 trillion of financing for infrastructure expenditures in H2 2022 is a considerable stimulus. However, this new funding will not result in new investments. Rather, it will, by and large, offset the drop in local government (LG) revenues from land sales this year. In short, there is little new stimulus for infrastructure beyond what has been approved in the budget plan earlier this year. Not only is the credit and fiscal impulse smaller in this cycle than in the previous ones, but also the multiplier effect will be lower. This will hinder the recovery in domestic demand. After the one-off rebound in economic activity following the lockdowns in April and May of this year, China’s business cycle recovery will be more U shaped rather than V shaped. Bottom Line: For absolute-return investors neither A-shares nor investable stocks offer an attractive risk-reward profile. Within a global equity portfolio, we continue to recommend a neutral allocation to China’s A-shares and an underweight allocation to Chinese investable stocks. Relative to the EM equity benchmark, investors should continue to overweight A-shares and remain neutral on investable stocks. Maintain the long A-shares / short offshore investable Chinese stocks position. Alleged plans of an additional RMB 1.5 trillion local government (LG) special bond issuance in H2 2022 have prompted investors to speculate about whether this stimulus initiative is sufficient to produce a considerable acceleration in infrastructure investment. This stimulus would be added to RMB 800 billion and 300 billion of policy bank funding for infrastructure that the government approved earlier in Q2 this year. Hence, the combined new infrastructure financing made available by Beijing is RMB 2.6 trillion. Below, we elaborate on how this RMB 2.6 trillion of additional infrastructure financing will be largely offset by a drop in LG revenues from land sales. In short, the stimulus will preclude downside in infrastructure investment rather than herald a major acceleration. In addition, the economic recovery still faces substantial headwinds from other segments of the economy. We believe that, approached as a whole, China’s business cycle recovery will be more U shaped than V shaped. Quantifying Infrastructure Stimulus The degree of new financing for infrastructure is considerable. This RMB 2.6 trillion in new financing in H2 2022 is equal to 7% of planned 2022 LG aggregate expenditures, 6% of planned 2022 aggregate total central and local government spending including budgetary and managed funds, 14% of fixed-asset investment (FAI) in traditional infrastructure, and 2% of GDP. The composition of general government spending is presented in Table 1. Table 1Structure And Composition Of Government Spending In China
Making Sense Of China’s New Stimulus
Making Sense Of China’s New Stimulus
However, a caveat is in order: this new funding will not result in new investments. Rather, it will, by and large, offset the drop in LG revenues from land sales. The primary source of financing infrastructure investment is LG managed funds. LG managed funds budgets, however, are under severe stress because of the plunge in revenues from land sales. Notably, proceeds from land sales account for 23% of aggregate LG expenditures (Chart 1). Land sales have contracted by about 30% in the January-June period of this year, and there is little hope that they will pick up in H2 2022. The reason is that property developers’ financing is down by 30% and is unlikely to recover soon (Chart 2). Chart 1Land Sales Are Critical For LG Expenditures
Land Sales Are Critical For LG Expenditures
Land Sales Are Critical For LG Expenditures
Chart 2No Funding For Property Developers, No Land Sales
No Funding For Property Developers, No Land Sales
No Funding For Property Developers, No Land Sales
Chart 3Property Developers Are Facing Debt Deflation
Property Developers Are Facing Debt Deflation
Property Developers Are Facing Debt Deflation
As we have argued in our past reports, property developers carry a substantial inventory of real estate assets funded by a massive debt build-up (Chart 3, top panel). With housing prices beginning to deflate, property developers are about to face debt deflation – falling asset prices and a high debt burden (Chart 3, bottom panel). Thereby, they have little appetite or capacity to expand their assets and leverage. Assuming land sales for the full year will decline by 30%, this drop would lead to an RMB 2.52 trillion reduction in LGs managed fund revenues in 2022 (Table 2). Hence, the new RMB 2.6 trillion infrastructure financing will be used to offset the RMB 2.5 trillion shortfall in LG managed funds budgets because of the plunge in land transfer proceeds. Table 2China: New Stimulus For Infrastructure in H2 2022
Making Sense Of China’s New Stimulus
Making Sense Of China’s New Stimulus
On the whole, there will be very little new funding available to boost infrastructure spending beyond what has been approved by the 2022 National People’s Congress (NPC) earlier this year. Chart 4The Credit And Fiscal Impulse Will Be Moderate
The Credit And Fiscal Impulse Will Be Moderate
The Credit And Fiscal Impulse Will Be Moderate
Hence, for this full year, there is no change to the aggregate fiscal spending impulse that incorporates central and local government budgetary spending as well as managed funds’ expenditures (Chart 4, top panel). The two scenarios for the non-government credit impulse are shown in the middle panel of Chart 4. The optimistic scenario assumes non-government credit will accelerate to 9.5% from 8.7%, and the pessimistic scenario is based on no acceleration in non-government credit growth. Finally, the bottom panel of Chart 4 illustrates the projections for the combined credit and fiscal spending impulse for the remainder of this year. Although the aggregate fiscal and credit impulse is non-trivial, it is smaller than those in 2020, 2016, 2013, and 2009. Bottom Line: The government has announced RMB 1.1 trillion in infrastructure funding and will likely raise the LG special bond quota by RMB 1.5 trillion. Yet, this RMB 2.6 trillion financing will only offset the shortfall in infrastructure financing from plunging land transfer revenue. In brief, there is little new stimulus for infrastructure beyond what has been approved in the budget plan from early this year. Economic Headwinds Chart 5China's Reopening Rebound
China's Reopening Rebound
China's Reopening Rebound
Economic activity in China has rebounded following the reopening of the economy. Chart 5 illustrates that high-frequency data, such as car sales, house sales, commercial truck cargo, and steel production have all recently improved. We expect the one-off renormalization of economic activity following the lockdowns in April and May to give way to more subdued growth. The reason is that the mainland economy is facing several major headwinds: The real estate market is unlikely to recover meaningfully given the “three red lines” policy has not been eased, and many of property market excesses have not been purged. Hence, the question remains whether the Chinese economy can stage a robust recovery without the participation of the property market. We doubt it can because of the vital role that real estate has played in the economy in the past 20 years as the result of its large share in GDP and its impact on consumer and business sentiment. Since 2008, there has been no business cycle recovery in China without the property market firing on all cylinders (Chart 6). Chart 6All Economic Recoveries Were Accompanied By A Revival In The Property Market
All Economic Recoveries Were Accompanied By A Revival In The Property Market
All Economic Recoveries Were Accompanied By A Revival In The Property Market
Chart 7China: The Willingness To Spend And Invest Is Very Low
China: The Willingness To Spend And Invest Is Very Low
China: The Willingness To Spend And Invest Is Very Low
Rolling lockdowns will likely persist. This will weigh on household and private business confidence. Diminishing confidence will undermine the willingness to spend, invest, and hire. Our marginal propensity to spend indicators for households & enterprises remain very depressed (Chart 7). Low propensity to spend entails that the multiplier effect of fiscal and credit stimulus will be lower in this cycle than in the previous ones. Not only is the credit and fiscal impulse smaller than in the previous cycles but also the multiplier will be lower. This will hinder the recovery in domestic demand. Finally, Chinese exports are set to contract in H2 2022 because of shrinking demand for consumer goods (ex-autos) in the US and Europe as well as mainstream EM. Bottom Line: After the one-off rebound in economic activity following the lockdowns in April and May, the business cycle recovery will be more U shaped rather than V shaped. Investment Conclusions For absolute-return investors, neither A-shares nor investable stocks offer an attractive risk-reward profile. Within the A-share market, our strongest conviction is to overweight interest rate-sensitive sectors like consumer staples, utilities, and healthcare. Consumer discretionary stocks should also be a slight overweight now. We continue to recommend a neutral allocation to Chinese A-shares and an underweight allocation to investable stocks within a global equity portfolio. Relative to the EM equity benchmark, investors should continue to overweight A-shares and remain neutral on investable Chinese stocks. Maintain the long A-shares / short offshore investable stocks position. The yuan, like all other emerging Asian currencies, is still facing near-term downside risk versus the US dollar. Chinese onshore government bond yields will likely drop further. Arthur Budaghyan Chief Emerging Markets Strategist arthurb@bcaresearch.com Strategic Themes Cyclical Recommendations
Executive Summary Don’t Try Catching Falling Euros
Don"t Try Catching Falling Euros
Don"t Try Catching Falling Euros
The euro is inexorably moving toward parity. However, many positives could still save EUR/USD, a cheap currency that will benefit if the fears of a global recession recede and if European inflation peaks by the fall. Nonetheless, many fundamental risks still weigh on the euro, including the dollar’s momentum and the continuing ructions in the European energy market. Moreover, technical vulnerabilities are likely to amplify the potential weakness in the euro. There is greater than a 30% chance that EUR/USD will fall to 0.9 or below. As a result, it is preferable to stay on the sidelines and opt for a neutral stance on the EUR/USD. Selling EUR/JPY offers a more attractive reward-to-risk ratio than EUR/USD. The GBP remains under threat. Bottom Line: Don’t be a hero. At this juncture, the EUR/USD outlook remains particularly uncertain. While EUR/USD possesses ample upside over the coming 12 months, there is roughly a 1/3 chance that it will plunge to 0.9 by the winter. Investors should sell EUR/JPY instead. The euro’s race toward parity continues. From May 12 to July 1, EUR/USD attempted to form a triple bottom at 1.0375 that could have marked the end of this year’s decline. Alas, the euro did not hold that floor and now traders are inexorably pushing the common currency lower. The outlook for the euro is complex. At current levels, it is inexpensive and discounts many negative developments affecting both the global and European economies. However, the EUR/USD’s weakness is also a story of dollar strength, and the deteriorating global economic momentum remains the Greenback’s best friend, to the euro’s detriment. For now, we stick to our mantra of the past few months: don’t be a hero. The euro may soon bottom, but enough risks lie ahead that a move below 0.9 against the dollar should not be discarded. The risk-reward from bottom fishing is therefore poor. Instead, investors should sell EUR/JPY, for which downside remains ample. What We Like About The Euro… Despite the pervasive negativity engulfing the euro, there are plenty of positives that will soon help EUR/USD form a bottom. First, the euro is cheap on most metrics. The Purchasing Power Parity (PPP) model developed by BCA’s Foreign Exchange Strategists adjust for the different consumption baskets in the Eurozone and the US. It currently shows that EUR/USD trades 25% below fair value, its deepest discount since 2001. This degree of undervaluation is associated with a high probability of strong long-term returns for the euro (Chart 1). Based on interest rate parity and risk aversion, the euro also trades well below its fair value. Steep discounts are often followed by an imminent rebound in the currency (Chart 2). However, the euro hit a similar discount in January, but failed to rally because of the problems in the energy markets prompted by Russia’s invasion of Ukraine. Chart 1Strong Long-Term Returns based on PPP
Strong Long-Term Returns based on PPP
Strong Long-Term Returns based on PPP
Chart 2Oversold on Many Metrics
Oversold on Many Metrics
Oversold on Many Metrics
Second, the euro is oversold. Both BCA’s Intermediate-Term Technical Indicator and the Citi FX Euro PAIN Index are very depressed, which indicates pervasive negative sentiment toward the euro (Chart 2, bottom two panels). This kind of extremes in momentum are often followed by a euro rally. Chart 3Global Recession Fears Hurt EUR/USD
Global Recession Fears Hurt EUR/USD
Global Recession Fears Hurt EUR/USD
Third, global economic pessimism is widespread. EUR/USD is a pro-cyclical pair, which mostly reflects the counter-cyclicality of the dollar and the great liquidity of the euro. It is therefore not surprising that spikes in global recession concerns are associated with a weakening EUR/USD (Chart 3). The recent wave of depreciation happened contemporaneously with a spike in Google searches for the word “recession.” If these fears, which reached extreme levels, subside further in the months ahead, the euro may benefit greatly. Fourth, pessimism toward China may ease, which would lift the euro in the process. Last week, it was announced that Beijing is considering allowing local governments to sell RMB1.5 trillion of special government bonds in the second half of the year to fund infrastructure spending. The news caused a rebound in the AUD, Brazilian assets, and copper. Europe too would benefit from greater activity in China. Chart 4Chinese Salvation?
Chinese Salvation?
Chinese Salvation?
Chinese monetary conditions are also easing, which historically supports industrial activity in Europe relative to the US (Chart 4, top panel). The change in approach in the implementation of the zero-COVID policy is helping Chinese PMIs rebound, which will eventually translate into higher European shipments to China. Moreover, the rate of change of the performance of real estate stocks relative to the broad market has turned the corner, which may facilitate a stabilization of Chinese real estate transactions (Chart 4, second panel). Ultimately, the expanding excess reserves in the Chinese banking system point toward a stabilization of the performance of EUR/USD later this year (Chart 4, bottom panel). Fifth, our expectation that European inflation will peak by the autumn will prove the greatest help to the euro. The EUR/USD’s weakness over the past twelve months has coincided with a surge in European inflation surprises (Chart 5, top panel). This relationship reflects the negative impact on European real rates of both stronger realized and expected inflation (Chart 5, second panel). Investors understand that Europe’s inflation crisis is driven by a relative price shock in the energy market that greatly hurts economic activity in the Eurozone. Hence, even if they expect the ECB to increase interest rates, they believe policy rates will lag inflation because of Europe’s poor growth outlook. This is particularly true when compared to the US Fed. As a result, European real rates continue to lag far behind US ones and the European yield curve is steeper than that of the US, because traders foresee easier policy on the Eastern shores of the Atlantic (Chart 5, panel three and four). Chart 5Inflation Hurts the Euro
Inflation Hurts the Euro
Inflation Hurts the Euro
Chart 6Declining Inflation Expectations? Declining Inflation Expectations?
Declining Inflation Expectations? Declining Inflation Expectations?
Declining Inflation Expectations? Declining Inflation Expectations?
This situation is fluid and inflation expectations have begun to decrease. The recent easing in energy prices has contributed to a decline in long-term inflation expectations (Chart 6). We argued last week that the energy inflation is arithmetically set to decrease over the coming twelve months, which suggests further downside in inflation expectations is likely. Moreover, four of the five largest weights in the Eurozone HICP are running hot, but all are linked to commodity inflation, which confirms our bias that European inflation will soon peak (Chart 7). A top in both headline and core inflation will drag short- and long-term inflation expectations lower, which will help European real rates (Chart 8). Meanwhile, lower imported energy inflation will limit the damage to European economic activity, allowing the ECB to increase rates anyway. Chart 7Key HICP Components
Key HICP Components
Key HICP Components
Chart 8A durable Decline In Expected Inflation Depends On Realized Inflation
A durable Decline In Expected Inflation Depends On Realized Inflation
A durable Decline In Expected Inflation Depends On Realized Inflation
Chart 9Balance Of Payment Support
Balance Of Payment Support
Balance Of Payment Support
Bottom Line: The euro benefits from important tailwinds that suggest EUR/USD will be higher 12 to 18 months from now. It is cheap and oversold and the pervasive gloom among investors about the state of the global economy indicates that many negatives are already embedded in its pricing. Moreover, the Chinese economy could stabilize in the second half of 2022 and into 2023, which will hurt the dollar and boost the euro. Crucially, a peak in European inflation will allow European real rates to recover and curtail the handicap keeping EUR/USD under pressure, especially as the basic balance of payment remains in the euro’s favor (Chart 9). … And What We Don’t EUR/USD may benefit from some important tailwinds, but it is still burdened by massive handicaps. The first problem that will place downward pressure on the euro is that its weakness is not unique and that it reflects broad-based dollar strength (Chart 10). This is a problem for the euro because the dollar (and the yen) is the foremost momentum currency in the G10. Its strength begets further strength, and the momentum signal from moving average crossovers remains dollar-bullish. This headwind for the euro could even intensify in the coming months. JP Morgan EM FX Index is breaking down to new lows, which points to further tightening in EM financial conditions. Historically, tighter EM FCIs translate in both weaker Eurozone stock prices and a weaker EUR/USD, which reflects the closer link between the Euro Area and EM economies than between the US and EM (Chart 11). Chart 10The Dollar's Strength Is Broad-Based
The Dollar's Strength Is Broad-Based
The Dollar's Strength Is Broad-Based
Chart 11More Trouble In Store
More Trouble In Store
More Trouble In Store
This phenomenon is exacerbated by the underlying weakness in global economic activity. Arthur Budaghyan, BCA’s EM Chief Strategist, often reminds us that Asian exports remain soft. Additionally, the deterioration in US economic activity is likely to continue, as suggested by the weakness in the ISM new orders-to-inventories ratio and by the poor readings from the Regional Fed Surveys. Slowing US growth will generate a further decline in the business-sales-to-inventory ratio, which often coincides in a strong dollar and a weak euro. Chart 12Past Chinese Weaknesses Linger
Past Chinese Weaknesses Linger
Past Chinese Weaknesses Linger
The second problem for EUR/USD is that China’s economic outlook may be improving in the future, but, for now, the impact of the recent Chinese slowdown continues to hamper Europe. More specifically, the recent decline in Chinese import volumes is consistent with a euro-bearish backdrop for the remainder of this year (Chart 12, top panel). In fact, even if the CNY remains stable against the USD, this does not guarantee a positive outcome for the euro as the past weakness in Chinese import volumes is also consistent with a depreciating EUR/CNY (Chart 12, bottom panel) The third euro-negative force is the natural gas market. As we showed last week, Dutch natural gas prices must settle between EUR500-600/MWh this upcoming winter to have the same inflationary impact as they did over the past 18 months. This is unlikely to happen, even according to the direst forecasts of BCA’s Commodity and Energy strategists. However, there is a greater than 30% chance that Europe must ration electricity this winter, which would cause a violent output contraction. As a result, any fluctuation in natural gas flows in Europe will cause the market-based odds of a European recession to swing widely. Consequently, the negative correlation between EUR/USD and TTF prices observed over the past twelve months is likely to remain intact (Chart 13). Related Report European Investment StrategyQuestions From The Road The fourth issue hurting the euro is the US’s comparative isolation from the energy market’s travails. The US is a haven of relative economic stability today. Yes, its growth will slow further, but it is nonetheless set to outperform the Eurozone. The US is not under threat of rationing energy this winter. Moreover, the US terms of trades benefit from rising energy prices, unlike Europe (Chart 14). Furthermore, the US output gap is closing faster than that of in the Eurozone (Chart 14, bottom panel). As a result, the odds of dovish surprises by the ECB are much greater than those by the Fed. Chart 13Neutral Gas Is Still A Drag
Neutral Gas Is Still A Drag
Neutral Gas Is Still A Drag
Chart 14The US As A Haven Of Stability
The US As A Haven Of Stability
The US As A Haven Of Stability
The US’s relative resilience might also impact equity flows over the next few months in a euro-bearish fashion. US EPS have been stable relative to Euro Area ones, even in local currency terms. Interestingly, because relative EPS reflect broader economic forces, EUR/USD follows them (Chart 15). Thus, if the European economic outlook deteriorates further relative to that of the US, chances are high that Eurozone EPS estimates will be revised down relative to the US, which will coincide with a lower EUR/USD. In fact, the recent underperformance of Eurozone small-cap stocks (which are domestically focused) relative to European large-cap equities (which derive a greater proportion of their sales abroad) and US small-cap shares also confirms the worsening relative economic outlook between Europe and the US, and thus portend significant near-term risks to EUR/USD (Chart 16). Chart 15Follow Earnings Estimates
Follow Earnings Estimates
Follow Earnings Estimates
Chart 16Small Caps Indicate More EUR Selling
Small Caps Indicate More EUR Selling
Small Caps Indicate More EUR Selling
Chart 17An ECB Bungle Would Burden The Euro
An ECB Bungle Would Burden The Euro
An ECB Bungle Would Burden The Euro
The last major fundamental risk weighing on EUR/USD is the significant probability that the ECB will disappoint markets with respect to its anti-fragmentation tool to be announced in July. Investor expectations are lofty. However, internal divisions within the ECB Governing Council remain, and, most importantly, the ECB is hamstrung by previous ECJ and German Constitutional Court rulings on bond purchases. Thus, our base case remains that the development of an appropriate bond purchase program will be an iterative process resulting from a back-and-forth between market tensions and ECB responses. As a result, there are risks of further widening in Italian spreads as well as European corporate bond spreads. These developments would further hurt the euro (Chart 17). Chart 18Much Selling To Be Unleashed Sentiment Could Get More Negative
Much Selling To Be Unleashed Sentiment Could Get More Negative
Much Selling To Be Unleashed Sentiment Could Get More Negative
These fundamental problems with EUR/USD do not guarantee that the euro will punch below parity. After all, there are also plenty of positives with this currency. However, the risk of a violent selloff is elevated, at around 30%, because of underlying technical vulnerabilities. Global market liquidity has deteriorated in recent years, and this phenomenon is also impacting FX markets, resulting in sudden jumps being more frequent. Most crucially, the odds are high that automatic selling will be triggered if the euro tests parity, which would result in a cascading decline for a euro entering territory that has not been charted for the past 20 years. Specifically, speculators are marginally short the euro (Chart 18, top panel) and 1-month and 3-month risk reversals in the option markets are not yet at a capitulation point (Chart 18, bottom panel). Thus, if panic sets in, the euro could easily fall below 0.9, where the strongest supports lie. In essence, we worry that a sudden crash in the euro is becoming a growing threat. Bottom Line: The combination of the dollar’s momentum, the lagging impact of China’s economic woes, the risks to Europe’s energy supplies, the relative stability of the US economy, and the heightened chance that the ECB underdelivers with respect to its anti-fragmentation tool later next week all point to significant risks to the euro in the coming months. Moreover, the technical vulnerabilities present in the FX market suggest that, if further downside takes place, it will not only be large but also rapid. Investment Conclusions The dilemma between views and strategy is greatest with the euro today. There are many positives highlighted in this report that suggest that the euro has upside on a 12-month basis. However, the risks are abundant, and the potential downside in the coming six months not only carries a large probability, it is also likely to be pronounced if it takes place. As a result of this configuration, we fall back to the strategy we had adopted for European equities earlier this year: don’t be a hero. Even if the euro bottoms tomorrow, the risks are such that capital preservation remains paramount. Consequently, we recommend that investors stay on the sideline and maintain a neutral stance on EUR/USD. It is just as risky to try to bottom fish this pair as it is to chase it lower from current levels. Chart 19Sell EUR/JPY
Sell EUR/JPY
Sell EUR/JPY
Instead, we follow BCA’s Foreign Exchange Strategists recommendation to go short EUR/JPY as a bet with a lower risk-reward ratio. Global recession worries and weakening commodity inflation are likely to allow for greater downside in global yields, which often results in a lower EUR/JPY (Chart 19). Additionally, investors do not expect much out of the BoJ this year, but if recession risks intensify in Europe because of energy rationing this winter, there is room to curtail the interest rate pricing for the ECB embedded in the €STR curve. Furthermore, the JPY is the cheapest currency in the G10. Finally, investors wanting to build greater exposure to European currencies should do so via the Swiss franc. We argued three weeks ago that the CHF enjoys significant structural tailwinds because of the Swiss economy’s strong productivity. Additionally, the SNB is no longer intervening to limit the CHF upside, as demonstrated by the decline in its current deposits. Instead, a stronger Swiss franc is the most potent weapon in the SNB’s arsenal to combat inflation. Moreover, the CHF offers a hedge against both recession risks in the Eurozone and further widening in European spreads. Bottom Line: Don’t be a hero. EUR/USD’s outlook is uniquely uncertain now. While many factors point to positive returns on a 12-to-18 month basis, if the euro hits parity in response to the many clouds still hanging over Europe, technical factors could plunge this currency to EUR/USD 0.9 into a steep decline. Instead, the clearer call is to sell EUR/JPY. Investors who want to assume a European FX exposure today should do so through the Swiss franc, not the euro. A Few Words On The UK Last week, Prime Minister Boris Johnson resigned. The initial response of the pound was to rebound. This reaction should fade. BCA Geopolitical strategists argue that, even though the person sitting at 10 Downing Street is about to change, the fundamental problems with the UK remain the same. The Labour Party is ascending, but it will still have to deal with the Brexit aftermath, rising populism, and popular discontent across the country. The economy is still fragile and engulfed in an inflationary spiral. Meanwhile, the risks created by a looming Scottish independence referendum are much more significant than was the case in 2014. As a result, the pound is likely to remain under stress over the coming quarters. Mathieu Savary, Chief European Strategist Mathieu@bcaresearch.com Tactical Recommendations Cyclical Recommendations Structural Recommendations
Executive Summary Economic growth is decelerating and recession talk is unavoidable, but the data series the business cycle dating committee tracks suggest the expansion is still alive and kicking. Despite unacceptably high inflation readings and a wildly swinging near-term outlook, intermediate- and long-term inflation expectations have remained well anchored all year. Market-based measures have been remarkably well behaved and the preliminary reading from the University of Michigan consumer survey that spooked the Fed was revised down to a more comfortable level. The FOMC minutes for June left no doubt that the committee is prepared to accept a recession as the price of subduing inflation, but markets already discounted that in their June swoon. The swiftness with which financial conditions have tightened in response to the beginning of the Fed’s rate-hiking campaign is unprecedented. It may have the effect of reducing the lag between FOMC actions and economic impacts while front-loading the pain from the inevitable slowdown. It Won't Be Easy To Get Worse
It Won't Be Easy To Get Worse
It Won't Be Easy To Get Worse
Bottom Line: The domestic economic backdrop is challenging and international uncertainties could make things worse, but a severe recession and bear market are not inevitable. The consensus is underestimating the potential for upside surprises that could lead equities to outperform fixed income and cash over the next three-to-twelve months. Feature Feed a cold, starve a fever is a simple prescription with an obvious read-through for monetary policymakers. If growth is sluggish, a central bank can stimulate its economy by lowering interest rates to encourage consumption and investment. If the economy is overheating, it can raise interest rates to cool household and business spending and dial back activity to a more sustainable level. Related Report US Investment StrategyA Difference Of Opinion Things get hairy when it’s a sluggish economy that needs to be slowed. The specter of stagflation – stagnant growth and high inflation – has been haunting financial markets as consumer prices have increased by at least 7% year-over-year every month since December amidst a clear deceleration in growth. Economic activity contracted in the first quarter, in terms of real GDP, and the Atlanta Fed’s GDPNow model projects that it did so again in the second quarter. According to the definition every introductory economics student learns, two consecutive quarters of contraction make a recession. Financial markets are a forward discounting mechanism and stocks’ and bonds’ ugly first-half performances may have foreshadowed the expansion's demise. We suspect the immediate future might not be as bad as financial market performance would imply, though we acknowledge that the risks to our comparatively constructive view have risen. We do not think that everything is hunky-dory; as we’ve previously noted, inflation will likely ease to 4% of its own accord, but getting it back down to the 2% target will require the Fed to squash the economy. That will bring about the definitive end to the expansion and risk assets’ extended romp. Our best guess is that the policy day of reckoning will not become apparent until 2024 and that the S&P 500 can recover a meaningful amount of ground between now and next July. We therefore remain overweight equities over the twelve-month cyclical timeframe, in contrast to the neutral house view. Recession Already? Probably Not Chart 1The Expansion Looks Sound
The Expansion Looks Sound
The Expansion Looks Sound
Despite the Econ 101 rule of thumb, business cycles are defined by the National Bureau of Economic Research’s Business Cycle Dating Committee, not the ups and downs of real GDP. The committee considers a broad range of activity measures when determining economic peaks and troughs, with employment (Chart 1, top panel), income and consumption (Chart 1, second panel), industrial production (Chart 1, third panel) and real manufacturing and trade sales (Chart 1, bottom panel) drawing particular attention. Those series do not warn of a recession now, and neither does still-positive real final domestic demand growth (Chart 2), which backs inventory adjustments and net exports out of GDP to provide a better read on the domestic economy. Per its dual mandate, the Fed is charged with maintaining price stability and full employment. Now that inflation is unacceptably high and growth is slowing, several clients have remarked on the incompatibility of the individual mandates. The Fed can choose price stability and kill the economy, a la Volcker in the early eighties, or it can protect employment at the cost of inflation. We have limited faith in central bankers’ ability to fine-tune economic outcomes with the blunt tools at their disposal, but there is room for the labor market to cool without denting the economy too terribly. Chair Powell has cited the ratio of job openings to unemployed workers as a metric that’s well beyond full-employment levels and has mused that it might offer an avenue for the Fed to engineer a soft landing. It eased a bit in May, as per the JOLTS job openings data released last week, and the labor market would presumably remain robust if it fell to a level at or around 1 (Chart 3). Getting the ratio to settle in the desired range is easier said than done, of course, but if a meaningful share of the working-age Americans who remain AWOL come back to the work force, it will be possible for payrolls to continue to expand even as the unemployment rate rises to the Fed’s estimated long-run full employment level of 4.1%. Chart 2Real Final Domestic Demand Is Still Growing
Real Final Domestic Demand Is Still Growing
Real Final Domestic Demand Is Still Growing
Chart 3The Job Market Can Cool Without Shrinking
The Job Market Can Cool Without Shrinking
The Job Market Can Cool Without Shrinking
Inflation Expectations Remain Contained We view longer-run inflation expectations as an important driver of economic participants’ actions. If households, businesses and investors expect that inflation will not be an issue over the long run, they will not alter their behavior to protect themselves from it. If they begin to believe that high inflation will linger for an extended period, they will take actions that serve to entrench it. The evolution of long-run inflation expectations, then, can provide advance warning that a vicious circle in which high prices beget higher prices is brewing. They also offer insight into the course of monetary policy. Chair Powell regularly cites inflation expectations as an important driver of the Fed’s actions, and the prospect that inflation expectations could become unanchored would prompt Volcker-like moves that would surely throttle financial markets and the economy. Powell explicitly cited the 3.3% preliminary long-run inflation expectation reading from the University of Michigan consumer sentiment survey as a catalyst for the FOMC’s eleventh-hour decision to hike the fed funds rate by 75 basis points in June. The final reading was revised down to a less noteworthy 3.1%, but the episode showed that the Fed responds to any suggestion that inflation expectations are at risk of breaking out. We monitor the CPI swaps market, and the TIPS and nominal Treasury markets, to get a read on investors’ and businesses’ intermediate- and long-term inflation expectations. Despite wild swings in 2-year expectations, which made a run at 5% in late March before setting (Chart 4, top panel) or approaching (Chart 5, top panel) new 2022 lows last week, 3-to-5- and 6-to-10-year expectations have been remarkably well behaved. TIPS break-evens imply intermediate- (Chart 4, middle panel) and long-term (Chart 4, bottom panel) inflation expectations that are 20 basis points (bps) below the 2.3-2.5% range consistent with the Fed’s 2% inflation target. Intermediate- and long-term expectations derived from the CPI swaps curve sit about 30 bps higher, but their path has been similar, with the former making a new year-to-date low last week (Chart 5, middle panel) and the latter nearing one (Chart 5, middle panel). Chart 4Investors' Longer-Run Expectations Remain Well-Anchored, ...
Investors' Longer-Run Expectations Remain Well-Anchored, ...
Investors' Longer-Run Expectations Remain Well-Anchored, ...
Chart 5... And Businesses' Do, Too
... And Businesses' Do, Too
... And Businesses' Do, Too
The bottom line is that investors and the Fed should take some comfort from how well anchored inflation expectations have remained all year. They will not remain that way indefinitely if real-time inflation does not head convincingly lower soon, but apparently no longer-run damage has been done yet. For all the things that have turned out worse than expected this year, longer-run inflation expectations have been a meaningfully positive surprise. The Fed’s Next Moves Chart 6Act On The Rumor, Ignore The News
Act On The Rumor, Ignore The News
Act On The Rumor, Ignore The News
While watching Chair Powell’s press conference following the June FOMC meeting, we were struck by how doggedly he stuck to the theme that price stability was the committee’s foremost concern. In a performance that must have warmed the heart of anyone who’s ever worked as a behind-the-scenes aide, he unwaveringly hammered the primary talking point he’d been coached to hit. Last week’s release of the June meeting’s minutes revealed that he was speaking for the full committee when he emphasized that nothing could dissuade it from restoring inflation to its target level. Though FOMC members’ hawkish/dovish leanings occupy a broad spectrum, the minutes painted a picture of a committee unified by its concern about inflation. Although the minutes made it clear that the committee is willing to sacrifice growth to gain control over inflation, and media coverage trumpeted that theme, they didn’t tell us anything new. They may have been a bit outdated, now that the Michigan survey’s final inflation expectations turned out not to be a big deal, and subsequent price action in real and financial asset markets suggest inflation pressures are easing, but markets already discounted the consequences of the Fed’s hawkish pivot when the committee let it be known that it was considering a 75-bps hike. The S&P 500 fell 12% in just seven sessions, culminating in its year-to-date closing low the day after the meeting concluded, 23.5% below its all-time closing high set at the beginning of January (Chart 6, top panel). Treasuries had embarked on a wild ride ahead of the meeting, as well, with the 10-year yield rising 45 bps in three sessions to 3.49% on the first day of the two-day meeting before bottoming for the time being at 2.82% last week (Chart 6, bottom panel). The minutes underlined members’ understanding of the tradeoff involved in crushing inflation and their resolve to enter into it. “Most [participants] agreed that risks to inflation were skewed to the upside … [while assessing] that the risks to … growth were skewed to the downside.” Despite the stagflation risks, “[p]articipants concurred that the economic outlook warranted moving to a restrictive stance of policy, and they recognized the possibility that an even more restrictive stance could be appropriate if elevated inflation pressures were to persist.” We have no doubt that the Fed will induce a recession if it proceeds along the course it has charted, but that doesn’t mean that it will be a severe one, or that it will begin imminently, leaving room for equities and credit to rally in the interim. About That Monetary Policy Lag Chart 7It's Hard To Keep Missing A Progressively Lower Target
It's Hard To Keep Missing A Progressively Lower Target
It's Hard To Keep Missing A Progressively Lower Target
Our contention that risk assets have a path to rally over the next twelve months underpins our recommendation to overweight equities within a multi-asset portfolio over that timeframe. We are not saying that skies are blue and everything is great; we simply think that the gloom has gone too far and the equity selloff is overdone. As the saying goes, more money is made owning stocks from terrible to bad than it is from good to great. Judging by the economic surprise index, the bar for getting more terrible has been set pretty high (Chart 7). The unprecedentedly rapid tightening of financial conditions at the outset of a rate-hiking campaign also raises questions. It is widely assumed that Fed actions take around twelve months to filter their way through the economy. While the prime rate moves higher immediately after the FOMC meeting, rates impacting households can be slow to reset, and it typically takes some time to reverse spending and investing momentum. If households and businesses foresee an extended series of rate hikes, the first ones may be stimulative in the near term as they line up to deploy their consumption and investment capital while they can obtain it on relatively favorable terms. Chart 8No Lag This Time
No Lag This Time
No Lag This Time
Financial conditions do not typically become maximally tight until a couple of years after the Fed completes its rate hike campaigns (Chart 8). The swiftness with which financial conditions have tightened this time has us wondering if they have already reached peak tightness or are about to do so. If activity troughs around the time the financial conditions index peaks, is it possible that the worst of the downturn isn’t far away? The conditions that have attended this cycle are unique, and all we can say for sure is that Treasury yields, corporate bond spreads, equity indexes and the dollar have combined to tighten financial conditions to the tune of about two-and-a-half percentage points of real GDP1 solely on anticipation. Financial markets’ proactive moves may have been hasty. We are closely monitoring the ongoing flow of data to determine if it will vindicate or discredit our thesis, but we remain more open to positive surprises than the consensus. Doug Peta, CFA Chief US Investment Strategist dougp@bcaresearch.com Footnotes 1 Goldman Sachs’ Financial Conditions Index is calibrated such that a one-point move in the index is meant to be equivalent to a one-percentage-point move in real GDP.
Dear client, In lieu of July 18 publication, I will be hosting our quarterly webcast that I invite you to join. Our regular weekly publication will resume Monday, July 25. Kind Regards, Irene Tunkel Chief Strategist, US Equity Strategy Deploy Fresh Capital Into Growth At The Expense Of Value In early June, we closed our Growth/Value underweight by moving the ratio to benchmark allocation and crystallizing just under 9% in gains. At the time, we also wrote that we would upgrade Growth and downgrade Value once uncertainty about inflation and the Fed’s action recedes. Today, we believe that the time is ripe for making a move: We are upgrading Growth to overweight, and downgrade Value to underweight. The following are the reasons for a change in positioning: Chart 1Deploy Fresh Capital Into Growth At The Expense Of Value
Deploy Fresh Capital Into Growth At The Expense Of Value
Deploy Fresh Capital Into Growth At The Expense Of Value
Inflationary pressures will ease: There are early signs that inflation is about to turn - prices of energy and commodities are down 20% and 13% off their peaks respectively. A turn in inflation heralds a change in market leadership from Value to Quality and Growth (Chart 1). Chart 2
Deploy Fresh Capital Into Growth At The Expense Of Value
Deploy Fresh Capital Into Growth At The Expense Of Value
Economic growth is slowing: The market focus has shifted away from inflation and has turned towards worries about growth as is evident in the falling 10-year Treasury yield, which decreased from its peak at 3.5% to 3.0% over the past couple of weeks. The environment of slowing growth and falling rates is a tailwind for growth stocks. In a world where growth is becoming scarcer, companies that can deliver growth will shine. These are “growth” companies, i.e., large, stable companies with strong balance sheets that are able to generate positive cash flow and churn out strong earnings even under economic duress. Quality growth outperforms during slowdowns (Chart 2). Earnings Growth Expectations: Analysts expect earnings of Value to grow by over 10% over the next twelve months and Growth by 8.0%. While earnings growth expectations for value stocks appear more attractive, we believe that they will be downgraded. Value stocks are dominated by cyclicals (Chart 3), and as we wrote in the Tuesday's publication, this is the area of the market in which analysts have the least certainty in their estimates and downgrades are imminent. Growth is oversold relative to Value: The Growth/Value ratio is extremely oversold sitting at a level exceeded only during the dot-com crash and on par with the 1970-1980 inflationary era (Chart 4). Chart 3
Deploy Fresh Capital Into Growth At The Expense Of Value
Deploy Fresh Capital Into Growth At The Expense Of Value
Chart 4
Deploy Fresh Capital Into Growth At The Expense Of Value
Deploy Fresh Capital Into Growth At The Expense Of Value
Bottom Line: Slowing growth, impending turn in inflation, and attractive technicals are key reasons for our upgrade of Growth to overweight at the expense of Value.
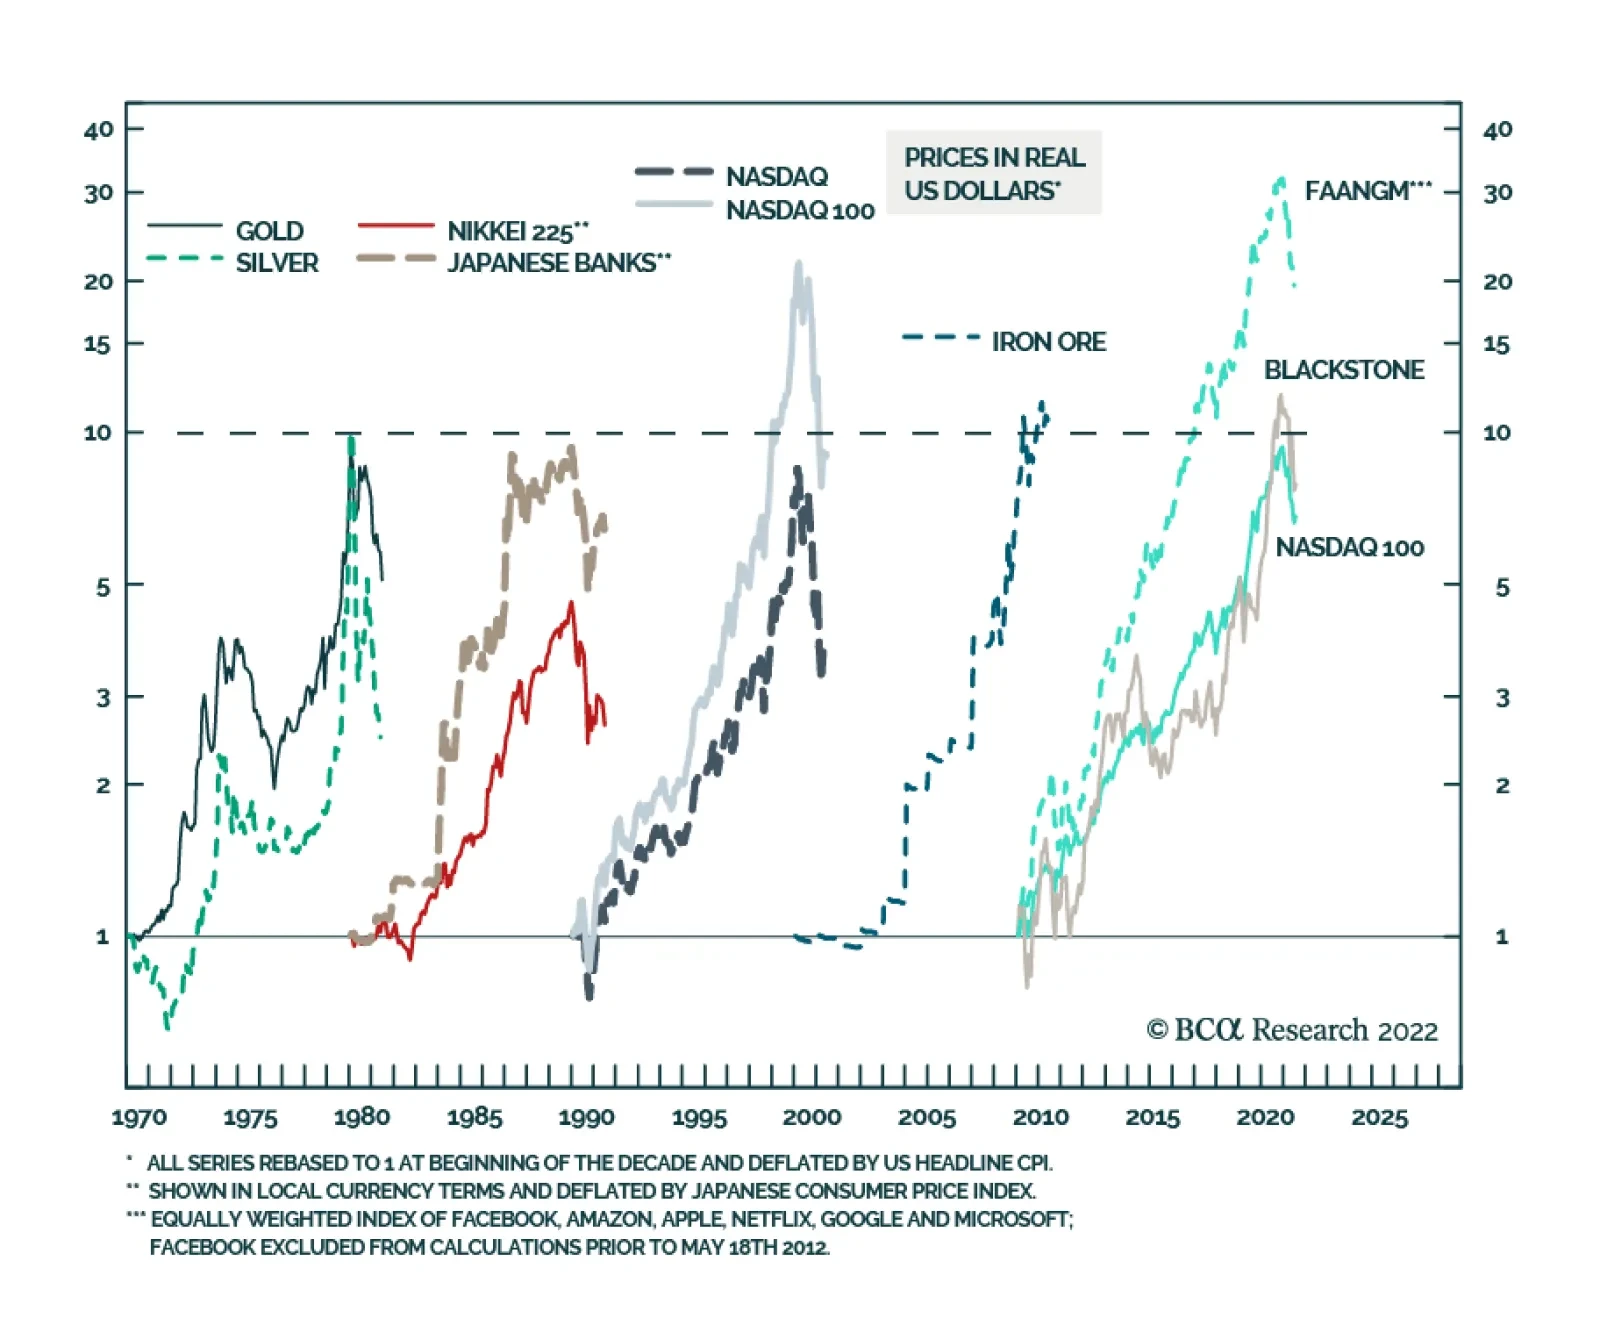
While BCA Research’s Emerging Markets Strategy service is not entirely convinced that US tech stocks are a bubble waiting to burst, they view the odds of this happening as nontrivial. There are a lot of similarities between dynamics prevailing in US tech…
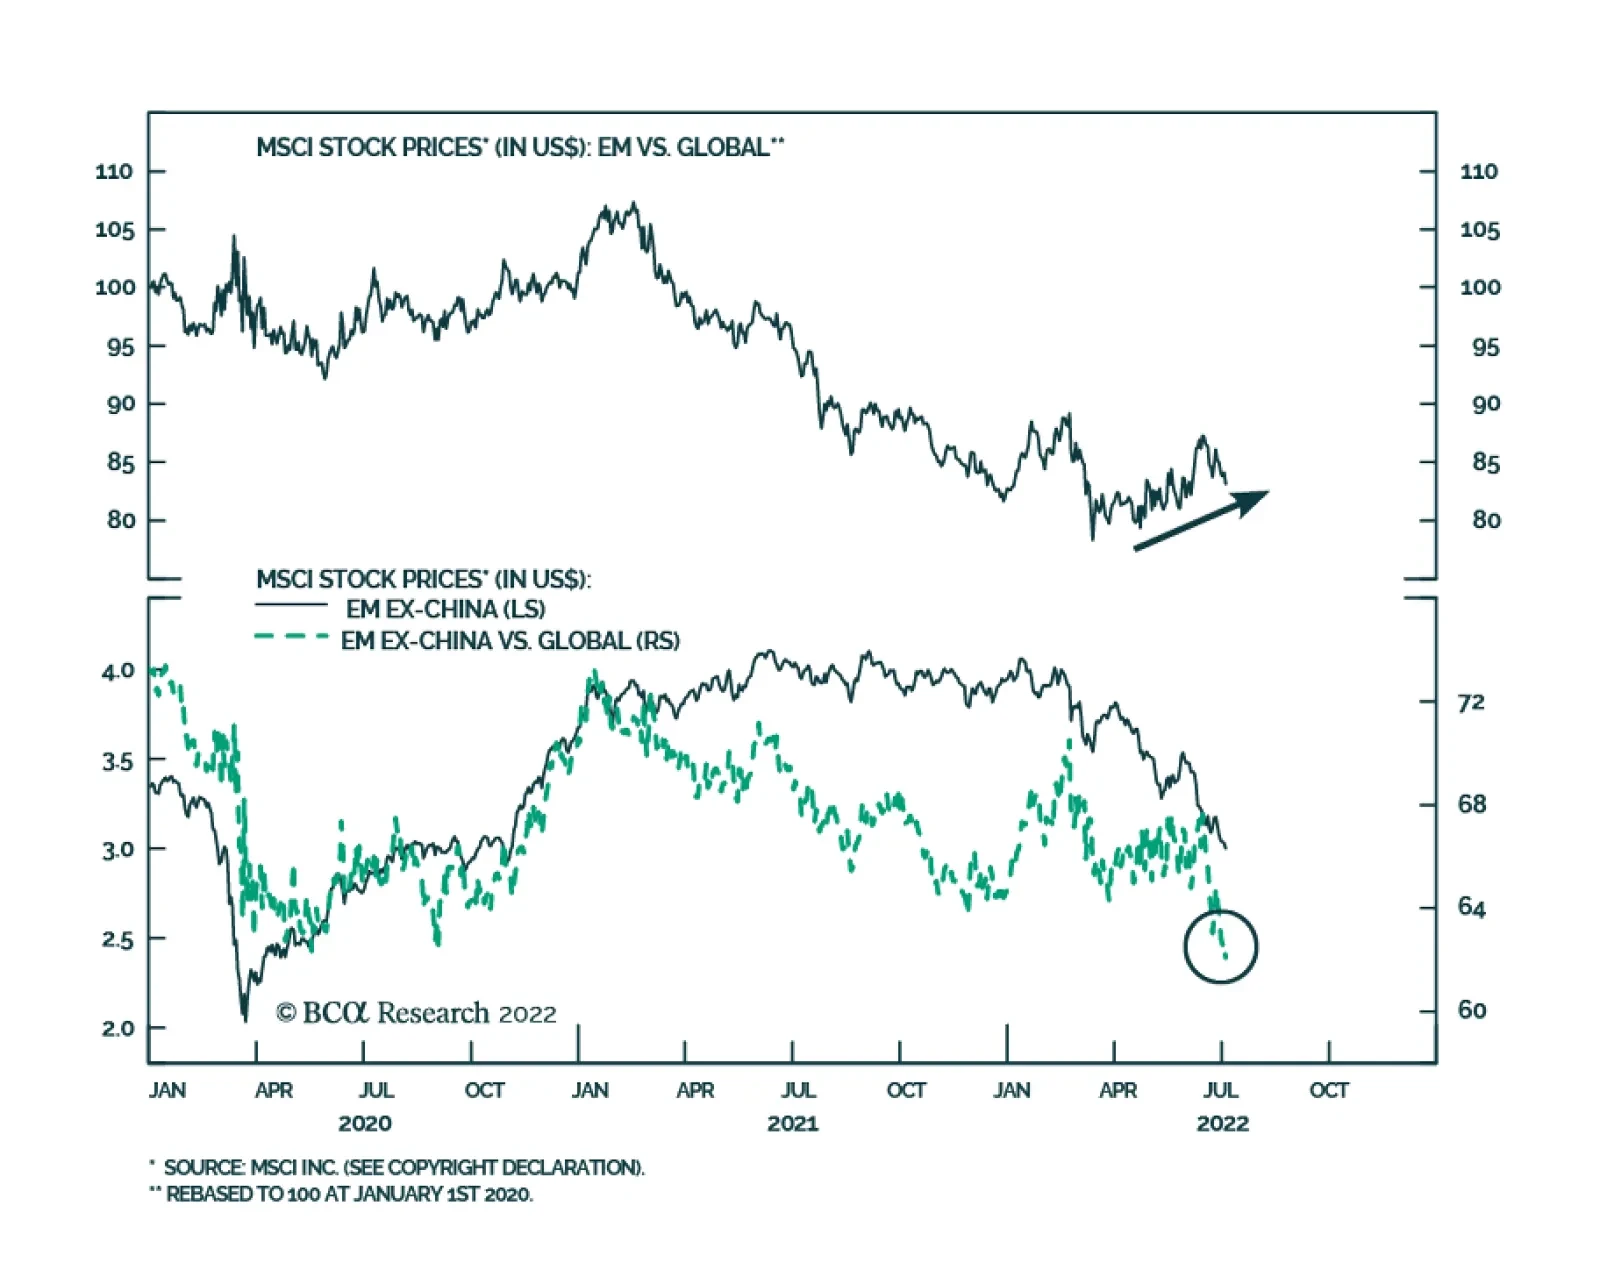
Emerging market equities have been outperforming their global peers over the past few months – marking a reversal in trend from their relative underperformance since February 2021. However, we doubt that this shift in leadership is sustainable. First, the…
Executive Summary Global risk assets are oversold, and investor sentiment is downbeat. In this context, a technical equity rebound cannot be ruled out. However, we do not think it will be the beginning of a major cyclical rally. The Fed and the stock market remain on a collision course. An equity rally and easing financial conditions would make the Fed even more resolute to continue hiking interest rates. There are many similarities between dynamics that prevailed in US tech stocks and in previous bubbles. While it is not our baseline view, the odds of a protracted bear market are nontrivial. Resource prices and commodity plays have more downside. The History Of Financial Bubbles: Is This Time Different?
On A Bull Case, Bubbles And Commodity Prices
On A Bull Case, Bubbles And Commodity Prices
Bottom Line: The decline in commodity prices and the relentless US dollar rally will ensure that EM currencies, bonds and stocks continue to sell off even if the US equity market rebounds in the near term. Feature Among the most frequently discussed topics in recent client calls are the upside and downside risks to our baseline view. We elaborate on these risks in this report. To recap, our baseline view is as follows: EM and DM stocks have another 15% downside in USD terms, the US dollar will continue overshooting and commodity prices will fall. Global yields are topping out, and the US yield curve will soon invert. Hence, defensive positioning for absolute-return investors is still warranted, and global equity and fixed-income portfolios should continue to underweight EM. The rationale is that US and EU demand for goods ex-autos, and hence global trade, is about to contract while the Fed is straightjacketed by high and broad-based inflation. China’s economy will be struggling to recover. In EM ex-China, domestic demand will relapse. Chart 1Will The S&P 500's Technical Support Hold?
Will The S&P 500's Technical Support Hold?
Will The S&P 500's Technical Support Hold?
If one believes that the US equity bull market that began in 2009 is still alive (i.e. the March 2020 selloff is a short-lived red herring), odds are that the S&P 500 drawdown is over. The reasoning is that the S&P 500 is already down 23% from its 2021 peak, on par with the selloffs that occurred in 2011, 2015-16 and 2018 (Chart 1). However, if one believes that the structural bull market is over, the magnitude of the current equity selloff is likely to exceed the ones in 2011, 2015-16 and 2018. Hence, a bearish stance is still warranted. As we argue below, after a 12-year bull run, the excesses in the US equity market in general, and US tech stocks in particular, have become extreme. There are many signs of a bubble, or at least of a major top. Even though we risk overstaying in our negative view, our bias is that the global equity market rout is not yet over. A Bullish Scenario A (hypothetical) bullish case would look something like this: Weakening global and US growth and falling commodity prices bring down US inflation and Treasury yields. As US bond yields drop further, the S&P 500 rallies given their negative correlation of the past 18 months or so. As US inflation declines rapidly, the Fed makes a dovish pivot, reinforcing the risk asset rally and reversing the US dollar’s uptrend. Finally, Chinese stimulus produces a robust business cycle recovery in China that propels commodity prices higher and lifts the rest of EM out of the abyss. Chart 2Keep An Eye On Rising US Trimmed-Mean Inflation
Keep An Eye On Rising US Trimmed-Mean Inflation
Keep An Eye On Rising US Trimmed-Mean Inflation
In our opinion, this scenario has no more than a 25% chance of playing out. Even if there are apparent signs of a US/global slowdown, elevated US core inflation and accelerating wages and unit labor costs would keep the Fed from dialing down its hawkishness Critically, even though US core PCE inflation has rolled over and will likely decline further, its trimmed-mean PCE inflation is rising (Chart 2). The latter means that inflation is broadening even as some volatile items like food, energy and used-auto prices deflate. As we have written extensively, wages and inflation are lagging variables. Despite the ongoing slowdown in the US economy, it will take many months before the underlying core inflation rate drops below 3%. We maintain that the Fed and the stock market remain on a collision course. An equity rally and easing financial conditions would make the Fed even more resolute to hike interest rates. The basis is that even if core inflation falls in the coming months, it would still be well above the Fed’s target of 2%. Notably, the Fed has recently communicated that its commitment to bring down inflation to 2% is unconditional. Chart 3The Anatomy Of The US Equity Bear Market In 2000-2002
The Anatomy Of The US Equity Bear Market In 2000-2002
The Anatomy Of The US Equity Bear Market In 2000-2002
This policy stance represents a major departure from the past several decades when the Fed was very sensitive to any tightening in financial conditions and often eased preemptively. In short, with inflation still well above its target, the Fed will, for now, err on the side of hawkishness if financial conditions ease. Importantly, US corporate profits will likely contract even if US real GDP does not shrink. As US corporate top-line growth slows and unit labor costs accelerate, profit margins will shrink. For example, the 2001-2002 recession was very mild – consumer spending did not contract at all, and housing boomed (Chart 3, top two panels). Yet, the S&P 500 operating earnings dropped by 30%, and the S&P 500 fell by 50% (Chart 3, bottom two panels). In brief, a devastating bear market does not necessarily require a hard landing. Concerning China, the recovery will likely be U-shaped rather than V-shaped with risks skewed to the downside. Finally, contracting global trade and falling commodity prices will continue, which are negative for EM currencies and assets. Notably, industry data from Taiwan’s manufacturing PMI suggest that the slowdown in the Asian and global economies is widespread. Taiwan’s substantial trade linkages with mainland China signify that the slowdown is not limited to the US and the EU but includes China too. Taiwanese PMI export orders of both semiconductor and basic material producers have plunged to 40 and 30, respectively (Chart 4). Barring a quick turnaround, global semiconductor and basic materials stocks have more downside. Even as US Treasury yields drop, the dollar will continue firming versus EM currencies, including those of Emerging Asian countries. In such a scenario, EM stocks and bonds will weaken further (Chart 5). Chart 4A Broad-Based Contraction In Global Trade Is In The Cards
A Broad-Based Contraction In Global Trade Is In The Cards
A Broad-Based Contraction In Global Trade Is In The Cards
Chart 5A Free Fall In EM Ex-China Stocks And Currencies
A Free Fall In EM Ex-China Stocks And Currencies
A Free Fall In EM Ex-China Stocks And Currencies
Bottom Line: The S&P 500 is oversold, and investor sentiment is downbeat. In this context, a technical equity rebound can occur at any moment. However, we do not think it will be the beginning of a major cyclical rally. A Bearish Case: Are US TMT Stocks A Bubble? What is a more bearish scenario than our baseline case? The bursting of bubbles or the unwinding of excesses would entail a more protracted and devastating bear market than the 15% drop in global share prices we currently expect. We can identify two major excesses in the global economy and financial system: In US TMT (Technology, Media & Entertainment and Internet & Catalog Retail) stocks and private equity In Chinese real estate. We have written extensively about property market excesses in China. Below we discuss the recent sharp selloff in commodities, which is partially linked to Chinese property construction. We also present the case for major excesses in US stocks. Chart 6 illustrates the history of bubbles of the past several decades: The Nifty-fifty (involving the 50 US large-cap stocks) bubble occurred in the 1960s and burst in the 1970s (not shown in the chart). The commodity bubble took place in the 1970s and burst in the 1980s. Japanese equity and property prices rose exponentially in the 1980s and deflated in the 1990s. The Nasdaq bubble occurred in the 1990s and was shattered in the early 2000s. Commodities/EM/China were the leaders of the 2000s, and they were devastated in the 2010s. We use iron ore in this chart because its price surged the most in the 2000s. FAANGM stocks, the Nasdaq 100 index and private equity were by far the biggest beneficiaries of the 2010s. No one can be certain about bubbles in real time because there are always superior fundamentals or persuasive stories that justify exponential price appreciation. That said, there are a lot of similarities between dynamics prevailing in US tech and private equity and in previous bubbles: In the past decade, FAANGM stocks, the Nasdaq 100 index and private equity companies registered gains comparable to the bubbles of the previous 60 years. Furthermore, as Chart 6 illustrates, the equal-weighted FAANGM index in inflation-adjusted terms rose 30-fold, much more than the bubbles of the previous decades. The Nasdaq 100 index and share prices of Blackstone, the largest private equity company, have risen by nearly 10-fold in real (inflation-adjusted terms) between 2010 and the end of 2021. Chart 6The History Of Financial Bubbles: Is This Time Different?
On A Bull Case, Bubbles And Commodity Prices
On A Bull Case, Bubbles And Commodity Prices
The final phase of bubbles is often characterized by growing retail investor participation. This is exactly what happened with US tech/new economy stocks. Chart 7US TMT Stocks: Exponential Growth Rarely Ends Well
US TMT Stocks: Exponential Growth Rarely Ends Well
US TMT Stocks: Exponential Growth Rarely Ends Well
Toward the end of the decade, not only retail but also institutional capital stampedes into the winners of the decade. This played out with US large-cap tech stocks as well as in private equity and private debt spaces. Inflows into private equity and private debt have been enormous. As a result of these inflows into US large-cap stocks, the market cap share of US TMT stocks as a percentage of total US market cap has surpassed 40%, its peak in 2000 (Chart 7). Bubbles often thrive during periods of low interest rates and crash when the cost of capital rises. This is exactly what has been happening in global financial markets since early 2019. The parameters of the overall US equity market were also excessive prior to this bear market. As of last year, the S&P 500 stock prices in real (inflation-adjusted) terms became as elevated relative to their long-term time trend as they were in the late 1960s and the late 1990s − the peaks of previous secular bull markets (Chart 8, top panel). Chart 8The S&P 500 and Operating Profits: A Long-Term Perspective
The S&P 500 and Operating Profits: A Long-Term Perspective
The S&P 500 and Operating Profits: A Long-Term Perspective
Chart 9Equity Issuance Marks Market Tops
Equity Issuance Marks Market Tops
Equity Issuance Marks Market Tops
The S&P 500’s operating earnings in real terms have surpassed two standard deviations above its time trend (Chart 8, bottom panel). Some sort of mean reversion to its long-term trend is in the cards. US corporate profits have benefited from fiscal/monetary stimulus, low labor costs and pricing power. All of these are now working against profits. Finally, new share issuance in the US mushroomed in 2021, another sign of a major top (Chart 9). Bottom Line: We are not entirely convinced that US TMT stocks are a bubble waiting to burst. Yet, the odds of this happening are nontrivial. This time might not be different. A Word On Commodities The selloff in the commodity space has been broad-based. Odds are that it will continue for the following reasons: A global business cycle downtrend is always bearish for commodity prices. In fact, oil prices are often lagging and are typically the last shoe to drop during global slowdowns. US sales of gasoline have started to contract. Besides, Saudi Arabia will likely increase its oil output and shipments following President Biden’s visit to the Kingdom next week. Chart 10Investors Have Been Long Commodity Futures
Investors Have Been Long Commodity Futures
Investors Have Been Long Commodity Futures
As we have argued in recent months, China’s demand for commodities was contracting and, in our opinion, the rally in resource prices over the past 12 months was supported by investment demand for commodities, i.e., financial inflows into the commodity space. Many portfolios have bought commodities as an inflation hedge. When a hedge becomes a consensus trade and crowded, it stops being a hedge. Chart 10 demonstrates that net long positions in 17 commodities have been very elevated. The speed at which liquidation is taking place corroborates our thesis that it is investors not producers or consumers who have been caught being long commodities. China’s business cycle recovery will be U-shaped at best. Domestic orders point to weaker import volumes in the months ahead (Chart 11, top panel). Corporate loan demand has plunged suggesting that liquidity provisions by the PBoC might fail to produce a meaningful recovery in credit growth (Chart 11, bottom panel). Finally, technicals bode ill for commodity prices. As Chart 12 illustrates, copper prices and global material stocks have probably formed medium-term tops, and risks are skewed to the downside. Chart 11China: The Economy Is Struggling To Gain Traction
China: The Economy Is Struggling To Gain Traction
China: The Economy Is Struggling To Gain Traction
Chart 12A Major Top In Commodity Prices?
A Major Top In Commodity Prices?
A Major Top In Commodity Prices?
Bottom Line: Commodity prices and their plays have more downside. Investment Strategy The decline in commodity prices and the relentless US dollar rally will ensure that EM currencies, bonds and stocks continue to sell off even if the US equity market rebounds in the near term driven by lower Treasury yields. Global equity and fixed-income portfolios should continue underweighting EM. We also continue to short the following currencies versus the USD: ZAR, COP, PEN, PLN, PHP and IDR; as well as HUF vs. CZK, and KRW vs. JPY. Arthur Budaghyan Chief Emerging Markets Strategist arthurb@bcaresearch.com Strategic Themes (18 Months And Beyond) Equities Cyclical Recommendations (6-18 Months) Cyclical Recommendations (6-18 Months)
Executive Summary Buying a home is now more expensive than renting in many parts of the world. In the US and UK, disappearing homebuyers combined with a flood of home-sellers will weigh on home prices over the next 6-12 months. Falling employment and falling house prices risk becoming a self-reinforcing negative feedback loop that turns a mild recession into a severe recession. To stop such a vicious cycle running out of control, policymakers will eventually bring down mortgage rates. For this reason, on a time horizon of 6-12 months, overweight bonds. A collapse in Chinese property development and construction activity will have negative long-term implications for commodities, emerging Asia, and developing countries that produce raw materials. Structurally underweight. On the other hand, stay structurally overweight the China 30-year government bond. Fractal trading watchlist: US Biotech versus Utilities. Buying A Home Is Now More Expensive Than Renting!
Buying A Home Is Now More Expensive Than Renting!
Buying A Home Is Now More Expensive Than Renting!
Bottom Line: The decade-long global housing boom is over. Feature For the first time since 2018, the number of Brits wanting to buy a home is less than the number of Brits wanting to sell their home. The balance of homebuyers versus homes for sale is the main driver of any housing market. When multiple homebuyers are competing for a home for sale, the subsequent bidding war puts upward pressure on house prices. But when, multiple homes for sale are competing for a homebuyer, the subsequent discounting war puts downward pressure on house prices. The balance of homebuyers versus homes for sale is the main driver of any housing market. This makes the number of homebuyers versus homes for sale the best leading indicator of house prices. The recent collapse of this leading indicator in the UK warns that UK house prices are likely to soften through the remainder of 2022 and into 2023 (Chart I-1). Chart I-1With Fewer UK Homebuyers Than UK Home-Sellers, UK House Prices Are Set To Drop
With Fewer UK Homebuyers Than UK Home-Sellers, UK House Prices Are Set To Drop
With Fewer UK Homebuyers Than UK Home-Sellers, UK House Prices Are Set To Drop
Homebuyers Are Disappearing While Home-Sellers Are Flooding The Market Disappearing homebuyers combined with a flood of home-sellers is also evident in the US. According to Realtor.com: “Weary US homebuyers face not only sky-high home prices but also rising mortgage rates, and that financial double whammy is hitting homebuyers hard: Compared with just a year ago, the cost of financing 80 percent of a typical home rose 57.6 percent, amounting to an extra $745 per month.” Compared with just a year ago, the cost of financing 80 percent of a typical US home rose 57.6 percent, amounting to an extra $745 per month. Unsurprisingly, US mortgage applications for home purchase have recently plunged by a third (Chart I-2) and homebuyer demand has declined by 16 percent since last June.1 Meanwhile, the inventory of homes actively for sale on a typical day in June has increased by 19 percent, the largest increase in the data history. Chart I-2With The Cost Of Financing A US Home Purchase Surging, Mortgage Applications Have Collapsed
With The Cost Of Financing A US Home Purchase Surging, Mortgage Applications Have Collapsed
With The Cost Of Financing A US Home Purchase Surging, Mortgage Applications Have Collapsed
The flood of new homes on the market means that the dwindling pool of homebuyers will have more negotiating leverage on the asking price (Chart I-3 and Chart I-4). This will balance the highly lopsided negotiating dynamics in the raging seller’s market of the past two years. The shape of things to come can be seen in Austin, Texas, which was one of the hottest markets during the early pandemic real estate frenzy. Chart I-3US Homebuyers Are Disappearing...
US Homebuyers Are Disappearing...
US Homebuyers Are Disappearing...
Chart I-4...While US Home-Sellers Are Flooding The Market
...While US Home-Sellers Are Flooding The Market
...While US Home-Sellers Are Flooding The Market
“Prices are definitely starting to go down again… last Friday, an Austin home was listed at $825,000. The next day, at the open house, no one came. A few months ago, there would have been 20 or more buyers showing up. The sellers didn’t want to test the market, so on Sunday, they dropped it to $790,000. It sold for $760,000.” Buying A Home Is Now More Expensive Than Renting The nub of the problem for homebuyers is that the mortgage rate is higher than the rental yield. In simple terms, buying a home is now more expensive than renting (Chart I-5). The housing bulls counter that the high mortgage rate will force rental yields to adjust upwards by rents going up, but this argument is flawed. Chart I-5Buying A Home Is Now More Expensive Than Renting!
Buying A Home Is Now More Expensive Than Renting!
Buying A Home Is Now More Expensive Than Renting!
The most important driver of rent inflation is the unemployment rate (inversely). Because, to put it bluntly, you need a steady job to pay the rent! Today, the Federal Reserve’s inflation problem, in a nutshell, is that rent inflation is too high even versus the tight jobs market (Chart I-6). Chart I-6The Fed Needs To Push Up Unemployment To Pull Down Rent Inflation
The Fed Needs To Push Up Unemployment To Pull Down Rent Inflation
The Fed Needs To Push Up Unemployment To Pull Down Rent Inflation
Although the Fed cannot say this explicitly, its mechanism to bring down inflation is to push up unemployment, and thereby to pull down rent inflation, which constitutes almost half of the core inflation basket. In this case, the rental yield (rent divided by house price) would adjust upwards by the denominator – house prices – going down. The most important driver of rent inflation is the unemployment rate (inversely). Yet the housing bulls also argue that the housing boom is the result of a structural undersupply of homes. They claim that as this structural undersupply persists, it will underpin house prices. But this ‘housing shortage’ narrative is another myth, which we can debunk with two simple observations. Through the past decade, home prices have risen simultaneously and exponentially everywhere in the world. Now ask yourself, is it plausible that there could be a structural undersupply of homes everywhere in the world at the precisely the same time? If this doesn’t debunk the housing shortage narrative, then try this second observation. Through the past decade, gross rents have tracked nominal GDP. Theory says that gross rents should track nominal GDP, because the quality of the housing stock improves broadly in line with GDP, and therefore so too should rents. If there really was a structural undersupply of housing, then gross rents would be structurally outperforming nominal GDP. But that hasn’t happened in any major economy (Chart I-7). Chart I-7Rents Have Tracked GDP, So There Is No 'Structural Undersupply' Of Homes
Rents Have Tracked GDP, So There Is No 'Structural Undersupply' Of Homes
Rents Have Tracked GDP, So There Is No 'Structural Undersupply' Of Homes
As an aside, if rents track GDP, then why do they constitute almost half of the core inflation basket? The answer is that the rents included in inflation are ‘hedonically adjusted’, meaning that are supposedly deflated for quality improvements – though there is always a niggling doubt whether the statisticians do this adjustment correctly! Pulling all of this together, the synchronized global housing boom of the past decade was not the result of a structural undersupply. Instead, it was the result of a valuation boom – meaning, plummeting rental yields, which in turn were the result of plummeting mortgage rates, which in turn were the result of plummeting bond yields. But now that mortgage rates are much higher than rental yields, this ‘virtuous’ cycle risks turning vicious. Falling employment and falling house prices risk becoming a self-reinforcing negative feedback loop that turns a mild recession into a severe recession. To stop such a vicious cycle running out of control, policymakers will eventually have no other choice than to bring down mortgage rates. For this reason, on a time horizon of 6-12 months, overweight bonds. But The Prize For The Biggest Housing Boom Goes To… China The housing booms in the UK, US and other Western economies, extreme as they are, are small fry compared to the housing boom in China. Chinese real estate, now worth $100 trillion, is by far the largest asset-class in the world. And Chinese rental yields, at around 1 percent, are well below the yield on cash. Begging the question, how can Chinese real estate valuations be in such stratospheric territory, with a yield even less than that on ‘risk-free’ cash? The simple answer is that investors have been led to believe that Chinese real estate is a risk-free investment! Without a social safety net and with limited places to park their money, Chinese savers have for years been encouraged to buy homes, in the widespread belief that property is the safest investment, whose price is only supposed to go up (Chart I-8). Chart I-8Chinese Real Estate Is Perceived To Be A 'Risk Free' Investment
Chinese Real Estate Is Perceived To Be A 'Risk Free' Investment
Chinese Real Estate Is Perceived To Be A 'Risk Free' Investment
With the bulk of Chinese households’ wealth in property acting as a perceived economic safety net, even a 10 percent decline in house prices would constitute a major shock to the household sector’s hopes and expectations of what property is. In turn, the ensuing ‘negative wealth effect’ would be catastrophic for household spending in the world’s second largest economy. Therefore, in contrast to the US housing debacle in 2008, the Chinese government will ensure that its property market adjustment does not come from a collapse in home prices. Rather, it will come from a collapse in property development and construction activity, combined with keeping interest rates structurally low. This will have negative long-term implications for commodities, emerging Asia, and developing countries that produce raw materials. Structurally underweight. On the other hand, Chinese bonds are an excellent investment for those investors who can accept the capital control risks. Stay structurally overweight the China 30-year government bond. Fractal Trading Watchlist Biotech and Utilities are both defensive sectors, based on the insensitivity of theirs profits to economic fluctuations. But whereas Biotech is ‘long duration’, Utilities is ‘shorter duration’. Over the coming months, as the economy falters and bond yields back down, long duration defensives, such as Biotech, are likely to be the winners. This is supported by the recent underperformance reaching the point of fractal fragility that has indicated previous major turning points (Chart I-9). The recommended trade is long US Biotech versus Utilities, setting a profit target and symmetrical stop-loss at 20 percent. This replaces our long US Biotech versus Tech position, which achieved its 17.5 percent profit target, and is now closed. Chart I-9Biotech Is Set To Be A Big Winner
Biotech Is Set To Be A Big Winner
Biotech Is Set To Be A Big Winner
Chart 1CNY/USD Has Reversed
CNY/USD Has Reversed
CNY/USD Has Reversed
Chart 2US REITS Are Oversold Versus Utilities
US REITS Are Oversold Versus Utilities
US REITS Are Oversold Versus Utilities
Chart 3CAD/SEK Reversal Has Started
CAD/SEK Reversal Has Started
CAD/SEK Reversal Has Started
Chart 4Financials Versus Industrials To Reverse
Financials Versus Industrials To Reverse
Financials Versus Industrials To Reverse
Chart 5The Outperformance Of Resources Versus Biotech Has Started To Reverse
The Outperformance Of Resources Versus Biotech Has Started To Reverse
The Outperformance Of Resources Versus Biotech Has Started To Reverse
Chart 6The Outperformance Of Resources Versus Healthcare Is Vulnerable To Reversal
The Outperformance Of Resources Versus Healthcare Is Vulnerable To Reversal
The Outperformance Of Resources Versus Healthcare Is Vulnerable To Reversal
Chart 7FTSE100 Outperformance Vs. Euro Stoxx 50 Is Reversing
FTSE100 Outperformance Vs. Euro Stoxx 50 Is Reversing
FTSE100 Outperformance Vs. Euro Stoxx 50 Is Reversing
Chart 8Netherlands Underperformance Vs. Switzerland Has Been Exhausted
Netherlands Underperformance Vs. Switzerland Has Been Exhausted
Netherlands Underperformance Vs. Switzerland Has Been Exhausted
Chart 9The Sell-Off In The 30-Year T-Bond Is Approaching Fractal Fragility
The Sell-Off In The 30-Year T-Bond Is Approaching Fractal Fragility
The Sell-Off In The 30-Year T-Bond Is Approaching Fractal Fragility
Chart 10The Sell-Off In The NASDAQ Is Approaching Fractal Fragility
The Sell-Off In The NASDAQ Is Approaching Fractal Fragility
The Sell-Off In The NASDAQ Is Approaching Fractal Fragility
Chart 11Food And Beverage Outperformance Has Been Exhausted
Food And Beverage Outperformance Has Been Exhausted
Food And Beverage Outperformance Has Been Exhausted
Chart 12AT REVERSAL
AT REVERSAL
AT REVERSAL
Chart 13AT REVERSAL
AT REVERSAL
AT REVERSAL
Chart 14The Strong Trend In The 18-Month-Out US Interest Rate Future Is Fragile
The Strong Trend In The 18-Month-Out US Interest Rate Future Is Fragile
The Strong Trend In The 18-Month-Out US Interest Rate Future Is Fragile
Chart 15The Strong Trend In The 3 Year T-Bond Is Fragile
The Strong Trend In The 3 Year T-Bond Is Fragile
The Strong Trend In The 3 Year T-Bond Is Fragile
Chart 16A Potential Switching Point From Tobacco Into Cannabis
A Potential Switching Point From Tobacco Into Cannabis
A Potential Switching Point From Tobacco Into Cannabis
Chart 17Biotech Is A Major Buy
Biotech Is A Major Buy
Biotech Is A Major Buy
Chart 18Norway's Outperformance Could End
Norway's Outperformance Could End
Norway's Outperformance Could End
Chart 19Cotton's Outperformance Is Vulnerable To Reversal
Cotton's Outperformance Is Vulnerable To Reversal
Cotton's Outperformance Is Vulnerable To Reversal
Chart 20Fractal Trading Watch List
Fractal Trading Watch List
Fractal Trading Watch List
Chart 21The Rally In USD/EUR Could End
The Rally In USD/EUR Could End
The Rally In USD/EUR Could End
Chart 22The Outperformance Of MSCI Hong Kong Versus China Is Vulnerable To Reversal
The Outperformance Of MSCI Hong Kong Versus China Is Vulnerable To Reversal
The Outperformance Of MSCI Hong Kong Versus China Is Vulnerable To Reversal
Chart 23A Potential New Entry Point Into Petcare
A Potential New Entry Point Into Petcare
A Potential New Entry Point Into Petcare
Chart 24GBP/USD At A Turning Point
GBP/USD At A Turning Point
GBP/USD At A Turning Point
Chart 25Fractal Trading Watch List
Fractal Trading Watch List
Fractal Trading Watch List
Chart 26Fractal Trading Watch List
Fractal Trading Watch List
Fractal Trading Watch List
Dhaval Joshi Chief Strategist dhaval@bcaresearch.com Footnotes 1 Realtor.com gauge homebuyer demand by so-called ‘pending listings’, the number of listings that are at various stages of the selling process that are not yet sold. Fractal Trading System Fractal Trades
The Global Housing Boom Is Over, As Buying Becomes More Expensive Than Renting
The Global Housing Boom Is Over, As Buying Becomes More Expensive Than Renting
The Global Housing Boom Is Over, As Buying Becomes More Expensive Than Renting
The Global Housing Boom Is Over, As Buying Becomes More Expensive Than Renting
6-12 Month Recommendations Structural Recommendations Closed Fractal Trades Indicators To Watch - Bond Yields Chart II-1Indicators To Watch - Bond Yields - Euro Area
Indicators To Watch - Bond Yields - Euro Area
Indicators To Watch - Bond Yields - Euro Area
Chart II-2Indicators To Watch - Bond Yields - Europe Ex Euro Area
Indicators To Watch - Bond Yields - Europe Ex Euro Area
Indicators To Watch - Bond Yields - Europe Ex Euro Area
Chart II-3Indicators To Watch - Bond Yields - Asia
Indicators To Watch - Bond Yields - Asia
Indicators To Watch - Bond Yields - Asia
Chart II-4Indicators To Watch - Bond Yields - Other Developed
Indicators To Watch - Bond Yields - Other Developed
Indicators To Watch - Bond Yields - Other Developed
Indicators To Watch - Interest Rate Expectations Chart II-5Indicators To Watch - Interest Rate Expectations
Indicators To Watch - Interest Rate Expectations
Indicators To Watch - Interest Rate Expectations
Chart II-6Indicators To Watch - Interest Rate Expectations
Indicators To Watch - Interest Rate Expectations
Indicators To Watch - Interest Rate Expectations
Chart II-7Indicators To Watch - Interest Rate Expectations
Indicators To Watch - Interest Rate Expectations
Indicators To Watch - Interest Rate Expectations
Chart II-8Indicators To Watch - Interest Rate Expectations
Indicators To Watch - Interest Rate Expectations
Indicators To Watch - Interest Rate Expectations