Equities
The S&P 500 has fallen by an additional 5% since the hotter-than-expected May CPI release, which prompted the Fed’s latest mega rate hike. This brings the year-to-date decline to 20% with the S&P 500 concluding its worst H1 since 1970. On the one…

Executive Summary Analysts Have Little Confidence In Their Forecasts
Analysts Have Little Confidence In Their Forecasts
Analysts Have Little Confidence In Their Forecasts
In the front section of the sector chart pack, we conduct cross-sectional comparisons. Profitability: Earnings expectations for the cyclical sectors are too high and will come down since analysts have little confidence in their forecasts. But despite their bullishness, analysts also expect margins of the most cyclical sectors to contract over the next 12 months. Balance sheet quality: Post-pandemic demand has resulted in a free cash flow windfall for companies in multiple sectors, which they used to repair their balance sheets. Tech, Materials, and Financials have improved the most. Valuations and technicals: Cyclical sectors appear inexpensive (both in absolute terms and relative to history) because multiples have contracted. Technicals signal that the market is oversold. Much of the bad news is priced in, but “new” bad news is likely on the way: We are still in the early stages of the monetary tightening cycle, there is talk about earnings and economic recessions, rates have not stabilized yet, and inflation has not peaked. Bottom Line: We continue to recommend that investors remain patient and pad the more defensive and quality allocations in their portfolios at the expense of cyclical sectors that are geared to a slowdown. Companies with strong and resilient earnings and quality balance sheets will be able to better weather the storm, if it arrives. This week we are sending you a Sector Chart Pack, which offers macro, fundamentals, valuations, technicals, and uses of cash charts for each sector. In the front section of this publication, we will focus on cross-sectional comparisons. As investors are starting to shift their attention away from worries about intransigent inflation toward concerns about slowing growth, they will seek out companies and sectors that offer the strongest and most resilient earnings growth, pristine balance sheets, and strong cash yield. In other words, companies that have the highest chance of surviving the downturn unscathed and of outperforming the market. Performance vs. Our Portfolio Positioning Chart 1Looking Under The Hood...
Taking Stock Of Sectors And Industry Groups
Taking Stock Of Sectors And Industry Groups
The S&P 500 is down roughly 20% off its January 2022 peak. However, 11 industry groups have performed even worse, with Automobiles and Components down as much as 39% off peak. The rest of this inglorious list is dominated by Consumer Cyclicals, Technology, and Financials (Chart 1). We were foreseeing headwinds, and have preempted some of the damage by shifting our portfolio positioning away from the most cyclical areas of the market: We underweighted Semiconductors back in January, observing that Semis are both highly economically sensitive and “growthy” and will be hit by a double whammy of slowing growth and rising rates. We have been underweight Hardware and Equipment since last summer, moving to this trade a bit too early. We downgraded Consumer Durables And Retailing in February, observing that demand for goods, pulled forward by the pandemic, is waning and consumption is shifting away from goods to services. More recently, we downgraded Media and Entertainment. The sector has fallen significantly, but we reasoned that if an economic downturn is indeed on the way, advertisement expense is one of the first that companies curtail when they are tightening their belts. Last week, we downgraded Travel to underweight: Even well-heeled consumers are starting to feel the pinch of surging prices. And while most will take that long-awaited post-COVID vacation, the outlook beyond summer is bleak with surging costs of fuel and labor. As for Autos, we were complacent in our thinking that car shortages will eventually translate into strong earnings growth. Despite the disappointing performance, the EV Revolution remains a long-term investment theme for us. Also having opened the position in June 2021, we are still in the green at +7% in relative terms. We have also upgraded our position in Staples to overweight on a premise that many Americans are reeling from surging prices of food, fuel, and shelter. Consumer Staples is the only likely beneficiary, and its pricing power is on the rise. Bottom Line: We have been able to contain some of the damage incurred by market rotation away from cyclicals. Profitability Earnings Growth Expectations As we have written extensively in the past (e.g., “Is Earnings Recession In The Cards”,) the analysts' earnings growth forecast for the S&P 500 of 10% is too high, especially considering the number of adverse events that have taken place since the beginning of the year, and the overall trajectory of monetary policy and economic growth. The analysts are yet again missing the turning point, just as they did back in 2008, and even in 2020. Chart 2Earnings Forecasts For Cyclicals Are Still Way Too High
Taking Stock Of Sectors And Industry Groups
Taking Stock Of Sectors And Industry Groups
We have noticed that the cyclical industries with the highest EPS growth forecasts, such as Consumer Services, Transportation, and Auto, are most prone to earnings disappointment. To be fair, EPS growth expectations for Consumer Services and Transportation are down from December when they stood at 550% and 143% respectively (Chart 2). Earnings Uncertainty So how certain are analysts about their projections? A short answer is – not particularly. We gauge earnings uncertainty by looking at the dispersion of analyst EPS expectations scaled by the magnitude of EPS. In a way, this is a measure of analyst consensus, with estimates clustered around a certain number indicating extreme certainty of forecasts. We notice that the advent of COVID-19 rendered panic among analysts with the rate of uncertainty surging. More recently, uncertainty has decreased but remains elevated by historical standards (Chart 3). Looking at earnings projections by industry group (Chart 4), we notice that earnings uncertainty is the highest in the cyclical pockets of the market where the highest EPS growth is still expected: Consumer Services, Transportation, and Retailing. Chart 3Analysts Have Little Confidence In Their Forecasts...
Analysts Have Little Confidence In Their Forecasts
Analysts Have Little Confidence In Their Forecasts
Chart 4... Especially For Cyclical Industry Groups
Taking Stock Of Sectors And Industry Groups
Taking Stock Of Sectors And Industry Groups
Implications? Analysts as a group have little confidence in cyclical sector growth, and downward revisions are imminent. Margins In the “Marginally Worse” and subsequent “Sector Margin Scorecard” reports in October, we called for margins to roll over as early as 2022. Curiously, despite their bullishness, analysts expect the margins of most cyclical sectors to contract over the next 12 months (Chart 5). Chart 5Despite Their Bullishness, Analysts Expect Margins To Contract
Taking Stock Of Sectors And Industry Groups
Taking Stock Of Sectors And Industry Groups
Chart 6Pricing Power Is Declining But There Are Exceptions
Taking Stock Of Sectors And Industry Groups
Taking Stock Of Sectors And Industry Groups
Pricing Power As we observed early on, one of the key reasons for margin contraction is a decline in companies’ pricing power, i.e., their ability to pass costs on to their customers (Chart 6). The Materials sector experienced the most significant decline in pricing power, likely a positive as this may be an early sign that inflation is abating. It is also important to note that three sectors – Consumer Staples, Utilities, and Tech–are still growing their pricing power. Consumer Staples and Utilities are necessities, demand for which is fairly inelastic, while Tech is offering services that are still in high demand, as they help improve productivity and substitute labor, which is in short supply, for capital, which is still abundant. Degree of Operating Leverage Chart 7Low Operating Leverage Helps In Case Of Downturn
Taking Stock Of Sectors And Industry Groups
Taking Stock Of Sectors And Industry Groups
If pricing power is waning, what else can come to the rescue? After all, with inflation in the high single digits, nominal sales growth is to remain robust. The crucial piece of the puzzle is the ability of companies to convert sales into profits, i.e., operating leverage (Chart 7). Companies with high fixed costs enjoy higher operating leverage, and a small increase in sales translates into significant earnings growth (and vice versa). However, in case of an outright sales contraction, we are better off holding industries and sectors with low operating leverage, such as Staples and Healthcare. Earnings Stability Chart 8Defensives Have The Most Resilient Earnings
Taking Stock Of Sectors And Industry Groups
Taking Stock Of Sectors And Industry Groups
What sectors have the most resilient earnings, that won’t let investors down in a downturn? To answer this question empirically, we looked at a historical variation in EPS-realized growth rates by sector1 (Chart 8). We found that Staples, Healthcare, and Technology have had the most stable earnings growth rates. However, the last 12 years or so, characterized by low yields and nearly non-existent inflation, were a boon for long-duration technology stocks – so our experiment may not be pure. Bottom Line: Earnings expectations for the cyclical sectors are too high and will come down as analysts have little confidence in their forecasts. Balance Sheet Quality Free Cash Flow Chart 9Post-pandemic Surge In Demand Resulted In Free Cash Flow Windfall...
Taking Stock Of Sectors And Industry Groups
Taking Stock Of Sectors And Industry Groups
Post-pandemic demand has resulted in a free cash flow windfall for companies in multiple sectors. Technology benefited from the transition to remote working. Energy and Materials have not been able to meet the “reopening” demand after years of underinvestment, which resulted in constrained supply, and soaring prices (Chart 9). Chart 10...Which Companies Used To Repair Their Balance Sheets
Taking Stock Of Sectors And Industry Groups
Taking Stock Of Sectors And Industry Groups
Interest Coverage The companies used this profits windfall to repair their balance sheets and reduce their levels of debt. As a result, the interest coverage ratio has picked up across the board (Chart 10). Bottom Line: Corporate balance sheets across most sectors look strong. Tech, Materials, and Financials have improved the most. Cash Yield Companies that pay dividends and buy back their stocks not only enhance the returns of their shareholders but also signal their confidence in future earnings and the strength of their balance sheets (Chart 11). That is one of the reasons income funds were strong performers over the past few months as investors were seeking out quality investments (Chart 12). Chart 11Cash Yield Has Not Been This Attractive In Years...
Taking Stock Of Sectors And Industry Groups
Taking Stock Of Sectors And Industry Groups
Chart 12High Dividend Yield Signals Corporate Confidence
Taking Stock Of Sectors And Industry Groups
Taking Stock Of Sectors And Industry Groups
Valuations A corollary to our conclusion that earnings estimates are hardly trustworthy, is that forward multiples are not a great valuation metric on the verge of an earnings contraction. Trailing multiples are a better measure of value at this point in the cycle. We sorted PE multiples by their Z-score to 10 years of history (Chart 13) and notice the most cyclical sectors are rather inexpensive, both in absolute terms and relative to history as markets are forward looking. Chart 13High Dividend Yield Signals Corporate Confidence
Taking Stock Of Sectors And Industry Groups
Taking Stock Of Sectors And Industry Groups
Technicals Chart 14US Equities Appear Oversold
Taking Stock Of Sectors And Industry Groups
Taking Stock Of Sectors And Industry Groups
And last, but not least: The US equity market is oversold, and most industry groups are several standard deviations below the neutral reading (Chart 14). Bottom Line: Technicals signal that the market is oversold. Yet, a sustainable rebound may still be months away. Investment Conclusion Is it finally time for bottom fishing? We believe that oversold conditions and sectors trading at 30-40 percent of their peak are “necessary but insufficient conditions.” For the equity market to rebound, all the bad news needs to be fully priced in – however, we are still in the early stages of the monetary tightening cycle, and there is talk about earnings and economic recessions, the severity of which is impossible to gauge at this point. Rates have not stabilized yet, and inflation has not peaked. Much of the bad news is priced in, but “new” bad news is likely on the way. Bottom Line We recommend that investors remain patient and pad the more defensive and quality allocations in their portfolios at the expense of cyclical sectors that are geared to a slowdown. Companies with strong and resilient earnings and quality balance sheets will be able to better weather the storm, if it arrives. Irene Tunkel Chief Strategist, US Equity Strategy irene.tunkel@bcaresearch.com S&P 500 Chart II-1Macroeconomic Backdrop
Macroeconomic Backdrop
Macroeconomic Backdrop
Chart II-2Profitability
Profitability
Profitability
Chart II-3Valuations And Technicals
Valuations And Technicals
Valuations And Technicals
Chart II-4Uses Of Cash
Uses Of Cash
Uses Of Cash
Communication Services Chart II-5Macroeconomic Backdrop
Macroeconomic Backdrop
Macroeconomic Backdrop
Chart II-6Profitability
Profitability
Profitability
Chart II-7Valuations And Technicals
Valuations And Technicals
Valuations And Technicals
Chart II-8Uses Of Cash
Uses Of Cash
Uses Of Cash
Consumer Discretionary Chart II-9Macroeconomic Backdrop
Macroeconomic Backdrop
Macroeconomic Backdrop
Chart II-10Profitability
Profitability
Profitability
Chart II-11Valuations And Technicals
Valuations And Technicals
Valuations And Technicals
Chart II-12Uses Of Cash
Uses Of Cash
Uses Of Cash
Consumer Staples Chart II-13Macroeconomic Backdrop
Macroeconomic Backdrop
Macroeconomic Backdrop
Chart II-14Profitability
Profitability
Profitability
Chart II-15Valuations And Technicals
Valuations And Technicals
Valuations And Technicals
Chart II-16Uses Of Cash
Uses Of Cash
Uses Of Cash
Energy Chart II-17Macroeconomic Backdrop
Macroeconomic Backdrop
Macroeconomic Backdrop
Chart II-18Profitability
Profitability
Profitability
Chart II-19Valuations And Technicals
Valuations And Technicals
Valuations And Technicals
Chart II-20Uses Of Cash
Uses Of Cash
Uses Of Cash
Financials Chart II-21Macroeconomic Backdrop
Macroeconomic Backdrop
Macroeconomic Backdrop
Chart II-22Profitability
Profitability
Profitability
Chart II-23Valuations And Technicals
Valuations And Technicals
Valuations And Technicals
Chart II-24Uses Of Cash
Uses Of Cash
Uses Of Cash
Health Care Chart II-25Sector vs Industry Groups
Sector vs Industry Groups
Sector vs Industry Groups
Chart II-26Profitability
Profitability
Profitability
Chart II-27Valuations And Technicals
Valuations And Technicals
Valuations And Technicals
Chart II-28Uses Of Cash
Uses Of Cash
Uses Of Cash
Industrials Chart II-29Macroeconomic Backdrop
Macroeconomic Backdrop
Macroeconomic Backdrop
Chart II-30Profitability
Profitability
Profitability
Chart II-31Valuations And Technicals
Valuations And Technicals
Valuations And Technicals
Chart II-32Uses Of Cash
Uses Of Cash
Uses Of Cash
Information Technology Chart II-33Macroeconomic Backdrop
Macroeconomic Backdrop
Macroeconomic Backdrop
Chart II-34Profitability
Profitability
Profitability
Chart II-35Valuations And Technicals
Valuations And Technicals
Valuations And Technicals
Chart II-36Uses Of Cash
Uses Of Cash
Uses Of Cash
Materials Chart II-37Macroeconomic Backdrop
Macroeconomic Backdrop
Macroeconomic Backdrop
Chart II-38Profitability
Profitability
Profitability
Chart II-39Valuations And Technicals
Valuations And Technicals
Valuations And Technicals
Chart II-40Uses Of Cash
Uses Of Cash
Uses Of Cash
Real Estate Chart II-41Macroeconomic Backdrop
Macroeconomic Backdrop
Macroeconomic Backdrop
Chart II-42Profitability
Profitability
Profitability
Chart II-43Valuations And Technicals
Valuations And Technicals
Valuations And Technicals
Chart II-44Uses Of Cash
Uses Of Cash
Uses Of Cash
Utilities Chart II-45Macroeconomic Backdrop
Macroeconomic Backdrop
Macroeconomic Backdrop
Chart II-46Profitability
Profitability
Profitability
Chart II-47Valuations And Technicals
Valuations And Technicals
Valuations And Technicals
Chart II-48Uses Of Cash
Uses Of Cash
Uses Of Cash
Table II-1Performance
Taking Stock Of Sectors And Industry Groups
Taking Stock Of Sectors And Industry Groups
Table II-2Valuations And Forward Earnings Growth
Taking Stock Of Sectors And Industry Groups
Taking Stock Of Sectors And Industry Groups
Footnotes 1 Scaled and inverted Recommended Allocation
Executive Summary China: GeoRisk Indicator
China: GeoRisk Indicator
China: GeoRisk Indicator
A new equilibrium between NATO, which now includes Sweden and Finland, and Russia needs to be reestablished before geopolitical risks in Europe subside. Russia aims to inflict a recession on the EU which will revive dormant geopolitical risks embedded in each country. Investors should ignore the apparent drop in China’s geopolitical risk as it could rise further until Xi Jinping consolidates power at the Party Congress this fall. Stay on the sideline on Brazilian, South African, Australian, and Canadian equities despite the commodity bull market, at least until China’s growth stabilizes. Korean risk will rise, albeit by less than Taiwanese risk. The US political cycle ensures that Biden may take further actions against adversaries in Europe, Middle East, and East Asia, putting a floor under global geopolitical risk. Tactical Recommendation Inception Date Return LONG GLOBAL AEROSPACE & DEFENSE / BROAD MARKET EQUITIES 2020-11-27 9.3% Bottom Line: Geopolitical risk will rise in the near term. Stay long gold and global defensive stocks. Feature This month we update our GeoRisk Indicators and make observations about the status of political risk for each territory, and where risks are underrated or overrated by global financial markets. Russia GeoRisk Indicator Our “Original” quantitative measure of Russian political risk – the Russian “geopolitical risk premium” shown in the dotted red line below – has fallen to new lows (Chart 1). One must keep in mind that this geopolitical premium is operating under the assumption of a “free market” but the Russian market in the past few months had been anything but free. The Russian government and central bank had been manipulating the ruble and preventing capital outflows. Hence, Russian assets and any indicator derived from it does not reflect its true risk premium, merely the resolve of its government in the geopolitical struggle. Chart 1Russia: GeoRisk Indicator
Russia: GeoRisk Indicator
Russia: GeoRisk Indicator
While the Russia Risk Premium accurately detected the build-up in tensions before the invasion of Ukraine this year, today it gives the misleading impression that Russian geopolitical risk is low. In reality the risk level remains high due to the lack of strategic stability between Russia and the West, particularly the United States, and particularly over the question of NATO enlargement. Our “Old” Russia GeoRisk Indicator remains elevated but has slightly fallen back. This measure failed to detect the rise in risk ahead of this year’s invasion of Ukraine. We predicted the war based on non-market variables, including qualitative analysis. As a result of the failure of our indicator, we devised a “New” Russia GeoRisk Indicator after this year’s invasion, shown as the green line below. This measure provides the most accurate reading. It is pushing the upper limits, which we truncated at 4, as it did during the invasion of Georgia in 2008 and initial invasion of Ukraine in 2014. Related Report Geopolitical StrategyThird Quarter Geopolitical Outlook: Thunder And Lightning Has Russian geopolitical risk peaked for Europe and the rest of the world? Not until a new strategic equilibrium is established between the US and Russia. That will require a ceasefire in Ukraine and a US-Russia understanding about the role of Finland and Sweden within NATO. However, Hungary is signaling that the EU should impose no further sanctions on Russia. Russia’s cutoff of natural gas exports to Europe will create economic hardship that will start driving change in European governments or policies. A full ban on Russian natural gas may not be implemented in the coming years due to lack of EU unanimity. Still, the EU cannot lift sanctions on Russia because that would enable economic recovery and hence military rehabilitation, which could enable new aggression. Also, Russia will not relinquish the territories it has taken from Ukraine even if President Putin exits the scene. No Russian leader will have the political capital to do that given the sacrifices that Russia has made. Bottom Line: Russia’s management of the ruble is distorting some of our risk indicators. Russia remains un-investable for western investors. Substantial sanction relief will not come until late in the decade, if at all. UK GeoRisk Indicator British political risk is rising, and it may surpass the peaks of the Brexit referendum period in 2016 now that Scotland is pursuing another independence referendum (Chart 2). Chart 2United Kingdom: GeoRisk Indicator
United Kingdom: GeoRisk Indicator
United Kingdom: GeoRisk Indicator
New elections are not due until January 25, 2025 and the ruling Conservative Party has every reason to avoid an election over the whole period so that inflation can come down and the economy can recover. But an early election is possible between now and 2025. Prime Minister Boris Johnson has become a liability to his party but he is still a more compelling leader than the alternatives. If Johnson is replaced, then the change of leadership will only temporarily boost the Tories’ public approval. It will ultimately compound the party’s difficulties by dividing the party without resolving the Scottish question. Regardless, the Tories face stiff headwinds in the coming referendum debate and election, having been in power since 2010 and having suffered a series of major shocks (Brexit, the pandemic, inflation). Bottom Line: The US dollar is not yet peaking against pound sterling, As from a global geopolitical perspective it can go further. Investors should stay cautious about the pound in the short term. But they should prefer the pound to eastern European currencies exposed to Russian instability. Germany GeoRisk Indicator German political risk spiked around the time of the 2021 election and has since subsided, including over the course of the Ukraine war (Chart 3). However, risk will rise again now that Germany has declared that it is under “economic attack” from Russia, which is cutting natural gas in retaliation to Germany’s oil embargo. Chart 3Germany: GeoRisk Indicator
Germany: GeoRisk Indicator
Germany: GeoRisk Indicator
This spike in strategic tensions should not be underrated. Germany is entering a new paradigm in which Russian aggression has caused a break with the past policy of Ostpolitik, or economic engagement. Germany will have to devote huge new resources to energy security and national defense and will have to guard against Russia for the foreseeable future. Domestic political risk will also rise as the economy weakens and industrial activity is rationed. Germany does not face a general election until October 26, 2025. Early elections are rare but cannot be ruled out over the next few years. The ruling coalition does not have a solid foundation. It only has a 57% majority in the Bundestag and consists of an ideological mix of parties (a “traffic light” coalition of Social Democrats, Greens, and Free Democrats). Still, Germany’s confrontation with Russia will keep the coalition in power for now. Bottom Line: From a geopolitical point of view, there is not yet a basis for the dollar to peak and roll over against the euro. That is not likely until there is a ceasefire in Ukraine and/or a new NATO-Russia understanding. France GeoRisk Indicator French political risks are lingering at fairly high levels in the wake of the general election and will only partially normalize given the likelihood of European recession and continued tensions around Russia (Chart 4). Chart 4France: GeoRisk Indicator
France: GeoRisk Indicator
France: GeoRisk Indicator
President Emmanuel Macron was re-elected, as expected, but his Renaissance party (previously En Marche) lost its majority and Macron will struggle to win over 39 deputies to gain a majority of 289 seats in the Assembly. He will, however, be able to draw from an overall right-wing ideological majority – especially the Republicans – when it comes to legislative compromises. The election produced some surprises. The right-wing, anti-establishment National Rally of Marine Le Pen, which usually performs poorly in legislative elections, won 89 seats. The left-wing alliance (NUPES) underperformed opinion polls and has not formed a unified bloc within the Assembly. Still, the left will be a powerful force as it will command 151 seats (the sum of the left-wing anti-establishment leader Jean-Luc Mélenchon’s La France Insoumise party and the Communists, Socialists, and Greens). Macron’s key reform – raising the average retirement age from 62 to 65 – will require an ad hoc majority in the Assembly. The Republicans, with 74 seats, can provide the necessary votes. But some members have already refused to side with Macron on this issue. Macron will most likely get support from the populist National Rally on immigration, including measures to make it harder to be naturalized or obtain long-term residence permits, and measures making it easier to expel migrants whose asylum applications have been refused. France will remain hawkish on immigration, but Macron will be able to rein in the populists. On energy and the environment, Macron may be able to cooperate with the Left on climate measures, but ultimately any cooperation will be constrained by the fact that Mélenchon opposes nuclear power. The Republicans and the National Rally will support Macron’s bid to shore up France’s nuclear energy sector. Popular opinion will hold up for France’s energy security in the face of Russian weaponization of natural gas. Macron and Mélenchon will clash on domestic security. Police violence has emerged as a major source of controversy since the Yellow Vest protests. Macron and the Right will protect the police establishment while the Left will favor reforms, notably the concept of “proximity police,” which would entail police officers patrolling in a small area to create stronger, more personal links between the police and the population; officers being under the control of the mayor and prefect; and ultimately most officers not carrying lethal weapons, and the ban of physically dangerous arrest techniques. Grievances over the police as well as racial inequality will likely erupt into significant social unrest in the coming years. As a second-term president without a single-party majority, Macron will increasingly focus on foreign policy. He will aim to become the premier European leader on the world stage. He will seek to revive France’s historic role as a leading diplomatic power and arbiter of Europe. He will strengthen France’s position in the EU and NATO, keep selling arms to the Middle East, and maintain a French military presence in the Sahel. Macron will favor Ukraine’s membership in the EU but also a ceasefire with Russia. He will face a difficult decision on whether to join Israeli and American military action against Iran should the latter reach nuclear breakout capacity and pursue weaponization. Bottom Line: The outperformance of French equities is stretched relative to EMU counterparts. But France will not underperform until the EU’s natural gas crisis begins to subside and a new equilibrium is established with Russia. Italy GeoRisk Indicator Italy is perhaps the weakest link in Europe both economically and strategically (Chart 5). Elections are due by June 2023 but could come earlier as the ruling coalition is showing strains. A change of government would likely compromise the EU’s attempt to maintain a unified front against Russia over the war in Ukraine. Chart 5Italy: GeoRisk Indicator
Italy: GeoRisk Indicator
Italy: GeoRisk Indicator
Before the war Italy received 40% of its natural gas from Russia and maintained pragmatic relations with the Putin administration. Now Russia is reducing flows to Italy by 50%, forcing the country into an energy crisis at a time when expected GDP growth had already been downgraded to 2.3% this year and 1.7% in 2023. Meanwhile Italian sovereign bond spreads over German bunds have risen by 64 basis points YTD as a result of the global inflation. The national unity coalition under Prime Minister Mario Draghi came together for two purposes. First, to distribute the EU’s pandemic recovery funds across the country, which amounted to 191.5 billion euros in grants and cheap loans for Italy, 27% of the EU’s total recovery fund and 12% of Italy’s GDP. Second, to elect an establishment politician in the Italian presidency to constrain future populist governments (i.e. re-electing President Sergio Mattarella). Now about 13% of the recovery funds have been distributed in 2021, the economy is slowing, Russia is cutting off energy, and elections are looming. The coalition is no longer stable. Coalition members will jockey for better positioning and pursue their separate interests. The anti-establishment Five Star Movement has already split, with leader Luigi di Maio walking out. Five Star’s popular support has fallen to 12%. The most popular party in the country is now the right-wing, anti-establishment Brothers of Italy, who receive 23% support in polling. Matteo Salvini, leader of the League, another right-wing populist party, has seen its public support fall to 15% and will be looking for opportunities. On the whole, far-right parties command 38% of popular voting intentions, while far-left parties command 17% and centrist parties command 39%. Italy’s elections will favor anti-incumbent parties, especially if the country falls into recession. These parties will be more pragmatic toward Russia and less inclined to expand the EU’s stringent sanctions regime. Implementing a ban on Russian natural gas by 2027 will become more difficult if Italy switches. Italy will be more inclined to push for a ceasefire. A substantial move toward ceasefire will improve investor sentiment, although, again, a durable new strategic equilibrium cannot be established until the US and Russia come to an understanding regarding Finland, Sweden, and NATO enlargement. Bottom Line: Investors should steer clear of Italian government debt and equities until after the next election. Spain GeoRisk Indicator Infighting and power struggles within the People’s Party (PP) have provided temporary relief for the ruling Socialist Worker’s Party (PSOE) and Spanish Prime Minister Pedro Sanchez. However, with Alberto Nunez Feijoo elected as the new leader of PP on April 2, the People’s Party quickly recovered from its setback. It not only retook the first place in the general election polling, but also scored a landslide victory in the Andalusia regional election. Andalusia is the most populous autonomous community in Spain, contributing 17% of the seats in the lower house. The Andalusian regional election was a test run for the parties before next year’s general election. Historically, Andalusia was PSOE’s biggest stronghold, but it was ousted by the center-right People’s Party-Citizens coalition in 2018. Since then, the People’s party has consolidated their presence and popularity in Andalusia. The snap election in June, weeks after Feijoo was elected as the new national party leader, expanded PP’s seats in the regional parliament. It now has an absolute majority in the regional parliament while the Socialists suffered its worst defeat. With the sweeping victory in Andalusia, the People’s Party is well positioned for next year’s general election. In addition, the ruling Socialist Worker’s Party continues to suffer from the stagflationary economic condition. In May, Spain recorded the second highest inflation figure in more than 30 years, slightly below its March number. Furthermore, the recent deadly Melilla incident which resulted in dozens of migrants’ death, also caused some minor setbacks within Sanchez’s ruling coalition. His far-left coalition partner joined the opposition parties in condemning Sanchez for being complacent toward the Moroccan police. The pressure is on the Socialists now, and political risk will rise in the coming months, till after the election (Chart 6). Chart 6Spain: GeoRisk Indicator
Spain: GeoRisk Indicator
Spain: GeoRisk Indicator
Bottom Line: Domestic political risk will remain elevated in this polarized country, as elections are due by December 2023 and could come sooner. Populism may return if Europe suffers a recession. Russia aims to inflict a recession on the EU which is negative for cyclical markets like Spain, but Spain benefits from Europe’s turn to liquefied natural gas and has little to fear from Russia. Investors should favor Spanish stocks relative to Italian stocks. Turkey GeoRisk Indicator Turkey faces extreme political and economic instability between now and the general election due by June 2023 (Chart 7). Chart 7Turkey: GeoRisk Indicator
Turkey: GeoRisk Indicator
Turkey: GeoRisk Indicator
Almost any country would see the incumbent ruling party thrown from power under Turkey’s conditions. The ruling Justice and Development Party has been in charge since 2002, the country’s economy has suffered over that period, and today inflation is running at 73% while unemployment stands at 11%. However, President Recep Tayyip Erdoğan is doing everything he can with his recently expanded presidential powers to stay in office. He is making amends with the Gulf Arab states and seeking their economic support. He is also warming relations with Israel, as Turkey seeks to diversify away from Russian gas and Israel/Egypt are potential suppliers. He is doubling down on military distractions across the Middle East and North Africa. And he waged a high-stakes negotiation with the West over Finnish and Swedish accession to NATO. Russian aggression poses a threat to Turkish national interests. Turkey ultimately agreed to Finnish and Swedish membership after a show of Erdoğan strong hands in negotiating with the West over their membership, to show his domestic audience that he is one of the big boys ahead of the election. A risk to this view is that Erdoğan stages military operations against Greek-controlled Cyprus. This would initiate a crisis within NATO and put Finnish and Swedish accession on hold for a longer period. Bottom Line: Investors should not attempt to bottom-feed Turkish lira or stocks and should sell any rallies ahead of the election. A decisive election that removes Erdoğan from power is the best case for Turkish assets, while a decisive Erdoğan victory is second best. Worse scenarios include indecisive outcomes, a contested or stolen election, a constitutional breakdown, or a military coup. China GeoRisk Indicator China’s geopolitical risk is falling and relative equity performance is picking up now that the government has begun easing monetary, fiscal, and regulatory policy to try to secure the economic recovery (Chart 8). Chart 8China: GeoRisk Indicator
China: GeoRisk Indicator
China: GeoRisk Indicator
Easing regulation on Big Tech has spurred a rebound in heavily sold Chinese tech shares, while the Politburo will likely signal a pro-growth turn in policy at its July economic meeting. The worst news of the country’s draconian “Covid Zero” policy is largely priced, while positive news regarding domestic vaccines, vaccine imports, or anti-viral drugs could surprise the market. However, none of these policy signals are reliable until Xi Jinping consolidates power at the twentieth national party congress sometime between September and November (likely October). Chinese stimulus could fail to pick up as much as the market hopes and policy signals could reverse or could continue to contradict themselves. After the party congress, we expect the Xi administration to intensify its efforts to stabilize the economy. The economic work conference in December will release a pro-growth communique. The March legislative session will provide more government support for the economy if needed. However, short-term measures to stabilize growth should not be mistaken for a major reacceleration, as China will continue to struggle with debt-deflation as households and corporations deleverage and the economic model transitions to a post-manufacturing model. Bottom Line: A Santa Claus rally in the fourth quarter, and/or a 2023 rally, is likely, both for offshore and onshore equities. But long-term investors, especially westerners, should steer clear of Chinese assets. China’s reversion to autocracy and confrontation with the United States will ultimately result in tariffs and sanctions and geopolitical crises and will keep risk premiums high. Taiwan GeoRisk Indicator Taiwan’s geopolitical risk has spiked as expected due to confrontation with China. Tensions will remain high through the Taiwanese midterm election on November 26, the Chinese party congress, and the US midterm (Chart 9). But China is not ready to stage a full-scale military conflict over Taiwan yet – that risk will grow over in the later 2020s and 2030s, depending on whether the US and China provide each other with adequate security assurances. Chart 9Taiwan: GeoRisk Indicator
Taiwan: GeoRisk Indicator
Taiwan: GeoRisk Indicator
Still, Taiwan is the epicenter of global geopolitical risk. China insists that it will be unified with the mainland eventually, by force if not persuasion. China’s potential growth is weakening so it is losing the ability to absorb Taiwan through economic attraction over time. Meanwhile the Taiwanese people do not want to be absorbed – they have developed their own identity and prefer the status quo (or independence) over unification. Taiwan does not have a mutual defense treaty with the United States and yet the US and Taiwan are trying to strengthen their economic and military bonds. This situation is both threatening to China and yet not threatening enough to force China to forswear the military option. At some point China could believe it must assert control over Taiwan before the US increases its military commitment. Meanwhile China, the US, Japan, South Korea, and Europe are all adopting policies to promote semiconductor manufacturing at home, and/or outside Taiwan, so that their industries are not over-reliant on Taiwan. That means Taiwan will lose its comparative advantage over time. Bottom Line: Structurally remain underweight Taiwanese equities. Korea GeoRisk Indicator The newly elected President Yoon reaffirmed the strong military tie between Korea and the US, when he hosted President Biden in Seoul in May. Both Presidents expressed interests in expanding cooperation into new areas like semiconductors, economic security, and stability in the Indo-Pacific region. The new administration is also finding ways to improve relations with Japan, which soured in the past few years over the issue of forced labor during the Japanese occupation of Korea. A way forward is yet to be found, but a new public-private council will be launched on July 4 to seek potential solutions before the supreme court ruling in August which could further damage bilateral ties. President Yoon’s various statements throughout the NATO summit in Madrid on wanting a better relationship with Japan and to resolve historical issues showed this administration’s willingness towards a warming of the relations between the two countries, a departure from the previous administration. On the sideline of the NATO summit, Yoon also engaged with European leaders, dealing Korean defense products, semiconductors, and nuclear technologies, with a receptive European audience eager to bolster their defense, secure supply chain, and diversify energy source. North Korea ramped up its missile tests this year as it tends to do during periods of political transitions in South Korea. It is also rumored to be preparing for another nuclear test. Provocations will continue as the North is responding to the hawkish orientation of the Yoon administration. Investors should expect a rise in geopolitical risk in the peninsular, but on a relative basis, due to its strong alliance network, Korean risk will be lower compared to Taiwan (Chart 10). Korea will benefit from a rebound in China in the near term, but in the long-term, it is a secure source of semiconductors and high-tech exports, as Greater China will be mired in long-term geopolitical instability. Chart 10Korea: GeoRisk Indicator
Korea: GeoRisk Indicator
Korea: GeoRisk Indicator
Bottom Line: Overweight South Korean equities relative to emerging markets as a play on Chinese stimulus. Overweight Korea versus Taiwan. Australia GeoRisk Indicator Australia’s Labor Party ultimately obtained a one-seat majority in the House of Representatives following the general election in May (77 seats where 76 are needed). It does not have a majority in the Senate, where it falls 13 seats short of the 39 it needs. It will rely on the Green Party (12 seats) and a few stragglers to piece together ad hoc coalitions to pass legislation. Hence Prime Minister Anthony Albanese’s domestic agenda will be heavily constrained. Pragmatic policies to boost the economy are likely but major tax hikes and energy sector overhauls are unlikely (Chart 11). Chart 11Australia: GeoRisk Indicator
Australia: GeoRisk Indicator
Australia: GeoRisk Indicator
Fortunately for Albanese, his government is taking power in the wake of the pandemic, inflation, and Chinese slowdown, so that there is a prospect for the macroeconomic context to improve over his term in office. This could give him a tailwind. But for now he is limited. Like President Biden in the US, Albanese can attempt to reduce tensions with China after Xi Jinping consolidates power. But also like Biden, he will not have a basis for broad and durable re-engagement, since China’s regional ambitions threaten Australian national security over the long run. Global commodity supply constraints give Australia leverage over China. Bottom Line: Stay neutral on Australian currency and equities until global and Chinese growth stabilize. Brazil GeoRisk Indicator It would take a bolt of lightning to prevent former President Lula da Silva from winning re-election in Brazil’s October 2 first round election. Lula is more in line with the median voter than sitting President Jair Bolsonaro. Bolsonaro’s term has been marred with external shocks, following on a decade of recession and malaise. Polls may tighten ahead of the election but Lula is heavily favored. While ideologically to the left, Lula is a known quantity to global investors (Chart 12). However, Bolsonaro may attempt to cling to power, straining the constitutional system and various institutions. A military coup is unlikely but incidents of insubordination cannot be ruled out. Once Lula is inaugurated, a market riot may be necessary to discipline his new administration and ensure that his policies do not stray too far into left-wing populism. Chart 12Brazil: GeoRisk Indicator
Brazil: GeoRisk Indicator
Brazil: GeoRisk Indicator
Brazil’s macroeconomic context is less favorable than it was when Lula first ruled. During the 2000s he rode the wave of Chinese industrialization and a global commodity boom. Today China is slipping into a balance sheet recession and the next wave of industrialization has not yet taken off. Brazil’s public debt dynamics discourage a structural overweight on Brazil within emerging markets. At least Brazil is geopolitically secure – far separated from the conflicts marring Russia, East Europe, China, and East Asia. It also has a decade of bad news behind it that is already priced. Bottom Line: Stay neutral Brazilian assets until global and Chinese growth stabilize and the crisis-prone election season is over. South Africa GeoRisk Indicator South Africa’s economy continues to face major headwinds amid persistent structural issues that have yet to be adequately addressed and resolved by policy makers. The latest bout of severe energy supply cuts by the state-run energy producer, Eskom, serve as a reminder to investors that South Africa’s economy is still dealing with a major issue of generating an uninterrupted supply of electricity. Each day that electricity supply is cut to businesses and households, the local economy stalls. Among other macroeconomic issues such as high unemployment and rising inflation, low-income households which are too the median voter, are facing increasing hardships. The political backdrop is geared toward further increases in political risk going forward (Chart 13). Chart 13South Africa: GeoRisk Indicator
South Africa: GeoRisk Indicator
South Africa: GeoRisk Indicator
Fiscal reform and austerity are underway but won’t last long enough to make a material difference in government finances. The 2024 election is not that far out and the ruling political party, the ANC, will look to quell growing economic pressures to shore up voter support and reinforce its voter base. Fiscal austerity will unwind. Meanwhile, the bull market in global metal prices stands to moderate on weakening global growth, which reduces a tailwind for the rand, South African equities relative to other emerging markets, and government coffers, reducing our reasons for slight optimism on South Africa until global growth stabilizes. Bottom Line: Shift to a neutral stance on South Africa until global and Chinese growth stabilize. Canada GeoRisk Indicator Canadian political risk has spiked since the pandemic (Chart 14). Populist politics can grow over time in Canada, especially if the property sector goes bust. However, the country is geopolitically secure and benefits from proximity to the US economy. Chart 14Canada: GeoRisk Indicator
Canada: GeoRisk Indicator
Canada: GeoRisk Indicator
Global commodity supply constraints create opportunities for Canada as governments around the world pursue fiscal programs directed at energy security, national defense, and supply chain resilience. Bottom Line: Stay neutral Canadian currency and equities. While Canada benefits from the high oil price and robust US economy, rising interest rates pose a threat to its high-debt model, while US growth faces disappointments due to Europe’s and China’s troubles. Matt Gertken Chief Geopolitical Strategist mattg@bcaresearch.com Yushu Ma Research Analyst yushu.ma@bcaresearch.com Jesse Anak Kuri Associate Editor jesse.kuri@bcaresearch.com Guy Russell Senior Analyst GuyR@bcaresearch.com Alice Brocheux Research Associate alice.brocheux@bcaresearch.com Strategic Themes Open Tactical Positions (0-6 Months) Open Cyclical Recommendations (6-18 Months) Regional Geopolitical Risk Matrix Section III: Geopolitical Calendar
In this <i>Strategy Outlook</i>, we present the major investment themes and views we see playing out for the rest of the year and beyond.
Executive Summary Accelerating wages will make core consumer inflation sticky in the US. In addition, inflation is a lagging variable and is still well above the Fed’s target. These dynamics imply that the Fed will not make a dovish pivot imminently. Following the re-normalization of economic activity after reopening, China’s recovery will be U-shaped, rather than V-shaped. Global manufacturing and exports are heading into contraction. Contracting global trade is bullish for the trade-weighted US dollar given that it is a counter-cyclical currency. A hawkish Fed is also positive for the greenback. Hence, the US dollar will likely overshoot. EM equities are unlikely to rally/outperform on a sustainable basis until an EM profit contraction is priced in and the US dollar starts depreciating. Asian Currencies Will Depreciate
Asian Currencies Will Depreciate
Asian Currencies Will Depreciate
Bottom Line: Absolute return investors should stay defensive for now. The global equity selloff has entered its final capitulation phase. Feature Global equity and fixed-income portfolios should maintain an underweight allocation to EM. That said, we will likely be upgrading EM versus DM later this year. EM currencies have more downside. Global and EM risk assets will likely continue selling off. Our major macro themes remain intact. Accelerating wages will make core consumer inflation sticky in the US. In addition, inflation is a lagging variable and is still well above the Fed’s target. These dynamics imply that the Fed will not make a dovish pivot imminently. Meanwhile, global growth is slowing rapidly, and global trade volumes are on the verge of contracting. US and EU demand for consumer goods (ex autos) is set to shrink. EM ex-China domestic demand will be weakening from already very low levels. Following the re-normalization of Chinese economic activity after the reopening, China’s recovery will be U-shaped, rather than V-shaped. Overall, global profits − including US and EM –will contract. Our bias is that equity markets have not fully discounted a profit contraction. The combination of shrinking corporate profits and a hawkish Fed that is focused on taming inflationary pressures is bearish for global stocks and risk assets. As long as the Fed maintains its hawkish bias and/or global trade contracts, the US trade-weighted dollar will continue to appreciate. The USD will likely overshoot in the near term. Contracting global trade is bullish for the counter-cyclical greenback. EM currencies will therefore continue to depreciate, weighing on EM bonds and stocks. Typically, EM stocks do not out outperform DM ones when the dollar is strengthening. Even though global risk assets have already sold off significantly and there is a temptation to buy, odds are high that there will be another downleg. Several markets are already breaking down below their technical support lines: The Nasdaq 100 index is slipping below its 3-year moving average which proved to be a major support in past selloffs (Chart 1, top panel). The average exchange rate of AUD, NZD and CAD (which are all cyclical commodity currencies) versus the US dollar has fallen below its 3-year moving average (Chart 1, bottom panel). In the commodity space, we have similar breakdowns. Share prices of gold mining companies, silver prices and the silver-to-gold price ratio have all clearly crossed below their 3-year moving averages (Chart 2). Chart 1Breakdowns in The Nasdaq 100 And Commodity Currencies
Breakdowns in The Nasdaq 100 And Commodity Currencies
Breakdowns in The Nasdaq 100 And Commodity Currencies
Chart 2Precious Metal Prices Are Breaking Down Too
Precious Metal Prices Are Breaking Down Too
Precious Metal Prices Are Breaking Down Too
Emerging Asian financial markets underscore that growth is relapsing and demand for raw materials is weak. The top panel of Chart 3 illustrates that Korean materials stocks have broken below their 3-year moving average. Further, in China, rebar steel, rubber, cement and plate glass prices are all falling (Chart 3, middle and bottom panels). Chart 3Bearish Signals For Raw Materials From Asia
Bearish Signals For Raw Materials From Asia
Bearish Signals For Raw Materials From Asia
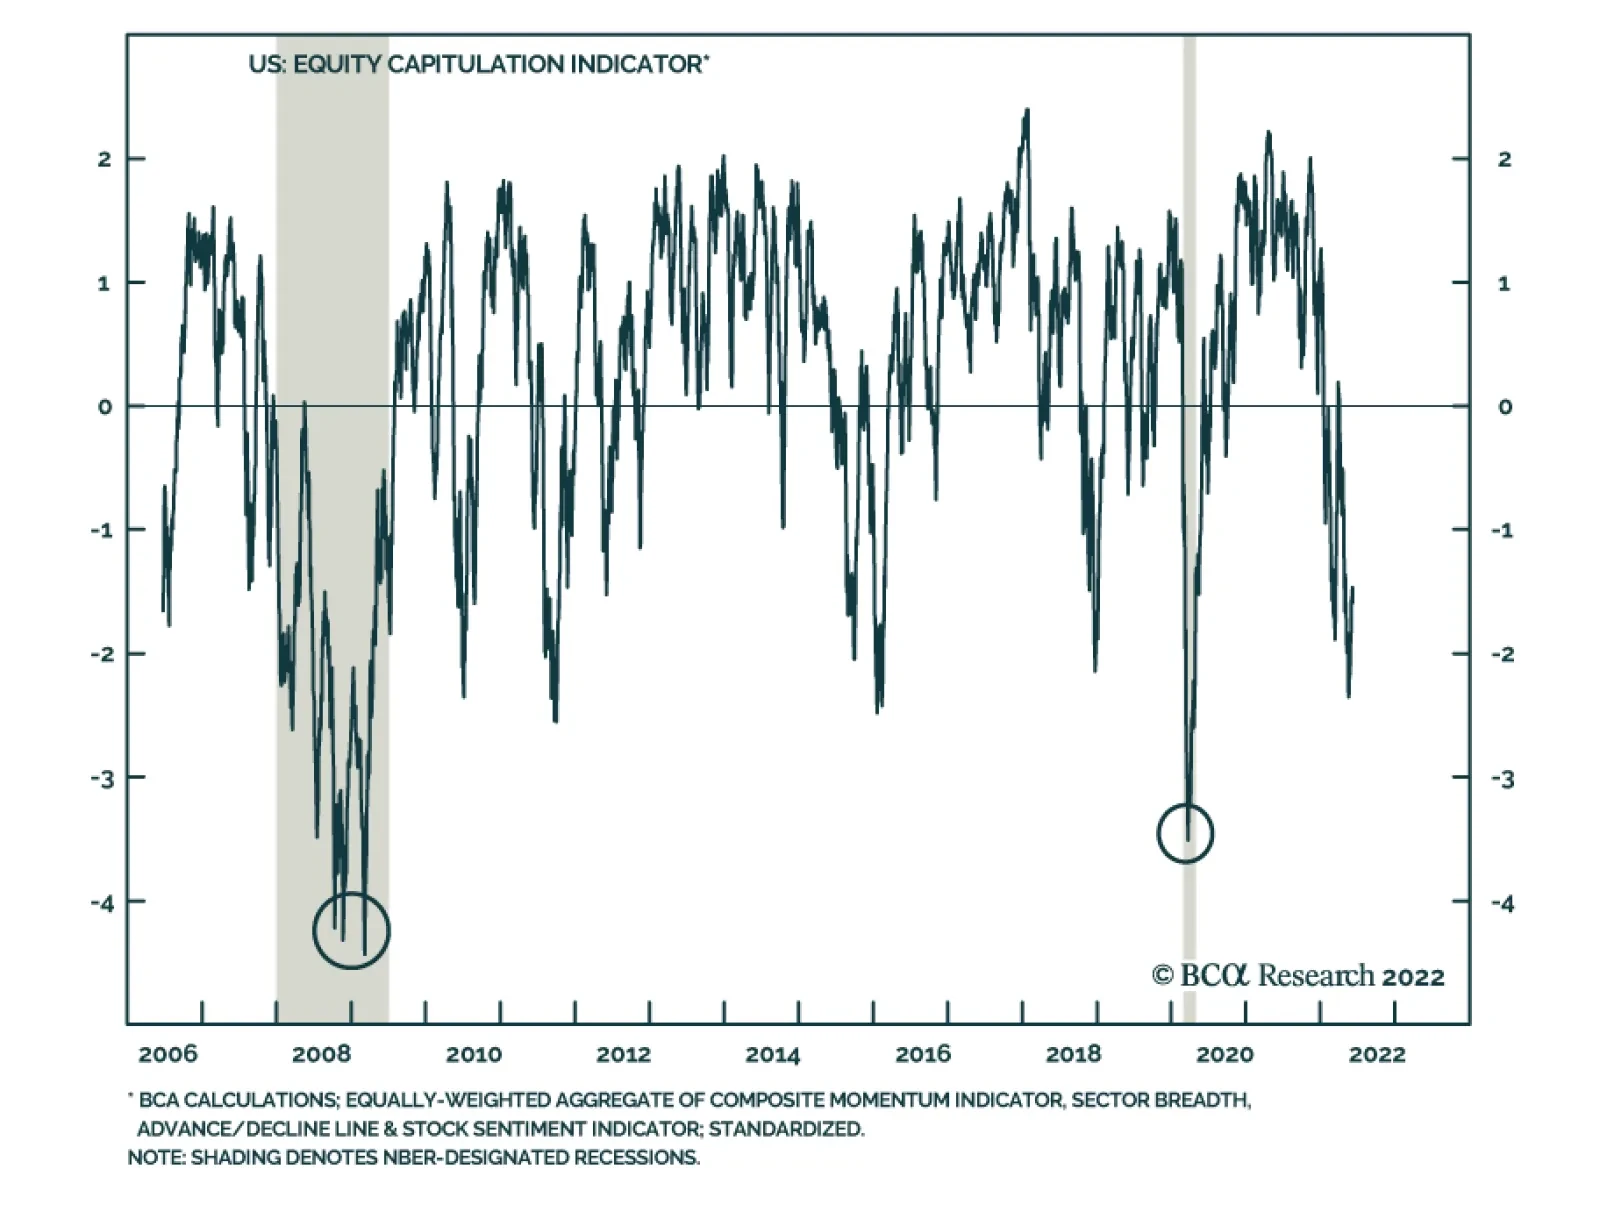
The charts below provide more evidence, supporting our macro themes and investment strategy. Investment Conclusions Absolute return investors should stay defensive for now. The global equity selloff has entered its final capitulation phase. Global equity and fixed-income portfolios should continue underweighting EM. That said, we will likely be upgrading EM versus DM later this year. The US dollar has more upside. EM/Asian FX and commodity currencies are vulnerable. We also continue to short the following currencies versus the USD: ZAR, COP, PEN, PLN, PHP and IDR; as well as HUF vs. CZK, and KRW vs. JPY. A buying opportunity in global and EM risk assets will emerge once US Treasury yields roll over decisively, the US dollar begins its descent and China provides more stimulus. Arthur Budaghyan Chief Emerging Markets Strategist arthurb@bcaresearch.com The US Equity Bear Market: How Advanced Is It? If this US equity selloff is part of an ongoing bull market that began in 2009, then the drop in share prices is probably over. However, if this same bull market has reached its end, then this selloff has further room to go. Our best guess is that it is the latter, i.e., we might be witnessing the end of the S&P 500 bull market that commenced in 2009. Our S&P 500 Capitulation Indicator is low, but it can drop further. Also, the S&P 500 will likely break below its 3-year moving average, which acted as a support in the 2011, 2015-16 and 2018 selloffs. Chart 4The US Equity Bear Market: How Advanced Is It?
The US Equity Bear Market: How Advanced Is It?
The US Equity Bear Market: How Advanced Is It?
US Corporate Credit And Share Prices The US corporate credit market does not yet point to a durable bottom in US share prices. Rising corporate HY ex-energy bond yields, and the underperformance of HY ex-energy corporate credit versus IG credit, point to lower share prices for now. Chart 5US Corporate Credit And Share Prices
US Corporate Credit And Share Prices
US Corporate Credit And Share Prices
Chart 6US Corporate Credit And Share Prices
US Corporate Credit And Share Prices
US Corporate Credit And Share Prices
The US Inflation Genie Is Out Of The Bottle US labor demand is outstripping labor supply by a record margin since 1950. US wages have accelerated and will remain sticky in the coming months. High wage growth and weaker output entail rising unit labor costs. The latter is a key driver of core inflation. Unless the unemployment rate rises, US core inflation will not drop below 3.5-4%. In fact, median and trimmed-mean CPI have continued rising even though core CPI has rolled over. Chart 7The US Inflation Genie Is Out Of The Bottle
The US Inflation Genie Is Out Of The Bottle
The US Inflation Genie Is Out Of The Bottle
Chart 8The US Inflation Genie Is Out Of The Bottle
The US Inflation Genie Is Out Of The Bottle
The US Inflation Genie Is Out Of The Bottle
Chart 9The US Inflation Genie Is Out Of The Bottle
The US Inflation Genie Is Out Of The Bottle
The US Inflation Genie Is Out Of The Bottle
Chart 10The US Inflation Genie Is Out Of The Bottle
The US Inflation Genie Is Out Of The Bottle
The US Inflation Genie Is Out Of The Bottle
US Manufacturing Is Downshifting Rapidly Railroad carload is declining, and new orders from the US regional Feds’ manufacturing surveys are in free fall. The ISM new orders index will drop below the critical 50 line. Chart 11US Manufacturing Is Downshifting Rapidly
US Manufacturing Is Downshifting Rapidly
US Manufacturing Is Downshifting Rapidly
Chart 12US Manufacturing Is Downshifting Rapidly
US Manufacturing Is Downshifting Rapidly
US Manufacturing Is Downshifting Rapidly
Chart 13US Manufacturing Is Downshifting Rapidly
US Manufacturing Is Downshifting Rapidly
US Manufacturing Is Downshifting Rapidly
The US Is Entering A Major Growth Slump US household demand for consumer goods ex-autos will shrink. The basis is excessive goods purchases in the last two years, falling household disposable income in real terms and a shift in preference for services versus goods. US retail inventories of consumer goods ex-autos have surged. Retailers will substantially cut back on their orders. Asian/Chinese exports are set to shrink. US consumption of gasoline is also contracting. Chart 14The US Is Entering A Major Growth Slump
The US Is Entering A Major Growth Slump
The US Is Entering A Major Growth Slump
Chart 15The US Is Entering A Major Growth Slump
The US Is Entering A Major Growth Slump
The US Is Entering A Major Growth Slump
Chart 16The US Is Entering A Major Growth Slump
The US Is Entering A Major Growth Slump
The US Is Entering A Major Growth Slump
Global Manufacturing And Exports Are Heading Into Contraction The relative performance of global cyclical stocks versus defensives points to a major relapse in global manufacturing. Chinese import volumes have been contracting and EM import volumes will drop too with the deteriorating purchasing power of households across many developing economies. Chart 17Global Manufacturing And Exports Are Heading Into Contraction
Global Manufacturing And Exports Are Heading Into Contraction
Global Manufacturing And Exports Are Heading Into Contraction
Chart 18Global Manufacturing And Exports Are Heading Into Contraction
Global Manufacturing And Exports Are Heading Into Contraction
Global Manufacturing And Exports Are Heading Into Contraction
Chart 19Global Manufacturing And Exports Are Heading Into Contraction
Global Manufacturing And Exports Are Heading Into Contraction
Global Manufacturing And Exports Are Heading Into Contraction
Contracting Asian Exports Are Negative For Asian Currencies There are already signs of contraction in Asian manufacturing/exports. Downshifting global trade typically leads to Asian currency depreciation. Chart 20Contracting Asian Exports Are Negative For Asian Currencies
Contracting Asian Exports Are Negative For Asian Currencies
Contracting Asian Exports Are Negative For Asian Currencies
Chart 21Contracting Asian Exports Are Negative For Asian Currencies
Contracting Asian Exports Are Negative For Asian Currencies
Contracting Asian Exports Are Negative For Asian Currencies
Chart 22Contracting Asian Exports Are Negative For Asian Currencies
Contracting Asian Exports Are Negative For Asian Currencies
Contracting Asian Exports Are Negative For Asian Currencies
Chart 23Contracting Asian Exports Are Negative For Asian Currencies
Contracting Asian Exports Are Negative For Asian Currencies
Contracting Asian Exports Are Negative For Asian Currencies
The USD Has More Upside, EM FX More Downside The EM ex-China currency total return index has failed to break above its technical resistance line. This entails a major downside. The underperformance of global cyclicals versus defensives points to lower Asian currencies. The US dollar (shown inverted on Chart 24) will be supported by a deceleration in global US dollar liquidity. Chart 24The USD Has More Upside, EM FX More Downside
The USD Has More Upside, EM FX More Downside
The USD Has More Upside, EM FX More Downside
Chart 25The USD Has More Upside, EM FX More Downside
The USD Has More Upside, EM FX More Downside
The USD Has More Upside, EM FX More Downside
Chart 26The USD Has More Upside, EM FX More Downside
The USD Has More Upside, EM FX More Downside
The USD Has More Upside, EM FX More Downside
EM Equity Capitulation Our EM Equity Capitulation Indicator has dropped significantly but is still above its 2008, 2015-16 and 2020 lows. Given the global and EM macro backdrops, odds point to an undershoot in EM share prices. Chart 27EM Equity Capitulation
EM Equity Capitulation
EM Equity Capitulation
EM Equity And Bond Sentiment Investor sentiment on EM stocks and EM USD bonds is downbeat. This is positive from a contrarian perspective. However, as global risk assets continue selling off and the US dollar overshoots, EM stocks and bonds might undershoot. Chart 28EM Equity And Bond Sentiment
EM Equity And Bond Sentiment
EM Equity And Bond Sentiment
Chart 29EM Equity And Bond Sentiment
EM Equity And Bond Sentiment
EM Equity And Bond Sentiment
EM Equity Valuations And Profits Based on our cyclically adjusted P/E ratio, EM equity valuations have improved to one standard deviation below the mean. Relative to the S&P 500, EM stock valuations are at their record low based on a similar measure. Nevertheless, EM equities are unlikely to rally/outperform on a sustainable basis until an EM profit contraction is priced in and the US dollar starts depreciating. Chart 30EM Equity Valuations And Profits
EM Equity Valuations And Profits
EM Equity Valuations And Profits
Chart 31EM Equity Valuations And Profits
EM Equity Valuations And Profits
EM Equity Valuations And Profits
Chart 32EM Equity Valuations And Profits
EM Equity Valuations And Profits
EM Equity Valuations And Profits
Chart 33EM Equity Valuations And Profits
EM Equity Valuations And Profits
EM Equity Valuations And Profits
Four Large-Cap EM Stocks The four largest EM stocks (by market value) might not be out of the woods. Alibaba is facing resistance at its 200-day moving average. Tencent, TSMC and Samsung will likely drop to their next technical support lines. Chart 34Four Large-Cap EM Stocks
Four Large-Cap EM Stocks
Four Large-Cap EM Stocks
Chart 35Four Large-Cap EM Stocks
Four Large-Cap EM Stocks
Four Large-Cap EM Stocks
Chart 36Four Large-Cap EM Stocks
Four Large-Cap EM Stocks
Four Large-Cap EM Stocks
Chart 37Four Large-Cap EM Stocks
Four Large-Cap EM Stocks
Four Large-Cap EM Stocks
Chinese And EM ex-China Stocks The rally in the Chinese onshore CSI 300 stock index will probably dwindle at its 200-day moving average. Technical supports have held up for Chinese investable TMT and non-TMT stocks. However, the recent rebound is unlikely to be sustained if the global selloff continues. Finally, EM ex-China stocks have been in a free fall. Chart 38Chinese And EM ex-China Stocks
Chinese And EM ex-China Stocks
Chinese And EM ex-China Stocks
Chart 39Chinese And EM ex-China Stocks
Chinese And EM ex-China Stocks
Chinese And EM ex-China Stocks
Chart 40Chinese And EM ex-China Stocks
Chinese And EM ex-China Stocks
Chinese And EM ex-China Stocks
Chart 41Chinese And EM ex-China Stocks
Chinese And EM ex-China Stocks
Chinese And EM ex-China Stocks
Global Cross-Asset Interlinkages Rising US TIPS yields will keep upward pressure on EM local bond yields and downward pressure on EM currencies. The mainstream EM ex-China currencies are not cheap. Without EM currencies rallying, it will be difficult for EM stocks to outperform DM ones. Chart 42Global Cross-Asset Interlinkages
Global Cross-Asset Interlinkages
Global Cross-Asset Interlinkages
Chart 43Global Cross-Asset Interlinkages
Global Cross-Asset Interlinkages
Global Cross-Asset Interlinkages
Chart 44Global Cross-Asset Interlinkages
Global Cross-Asset Interlinkages
Global Cross-Asset Interlinkages
A Structural Breakdown In Chinese Real Estate The Chinese real estate market is experiencing a structural breakdown, as is illustrated by the collapse in share prices of Chinese property developers and their corporate bond prices. The breakdown in property developers’ financing heralds lower construction volumes with negative implications for raw material prices. Chart 45A Structural Breakdown In Chinese Real Estate
A Structural Breakdown In Chinese Real Estate
A Structural Breakdown In Chinese Real Estate
Chart 46A Structural Breakdown In Chinese Real Estate
A Structural Breakdown In Chinese Real Estate
A Structural Breakdown In Chinese Real Estate
Chart 47A Structural Breakdown In Chinese Real Estate
A Structural Breakdown In Chinese Real Estate
A Structural Breakdown In Chinese Real Estate
Chart 48A Structural Breakdown In Chinese Real Estate
A Structural Breakdown In Chinese Real Estate
A Structural Breakdown In Chinese Real Estate
Chinese Domestic Demand Has Been Absent Over The Past 12 Months Chinese imports of various commodities and goods have been contracting over the past 12 months. The resilience of commodity prices has not been due to China. As investors start pricing in the US economic downturn and the need for inflation protection wanes, commodity prices could gap down. Chart 49Chinese Domestic Demand Has Been Absent Over The Past 12 Months
Chinese Domestic Demand Has Been Absent Over The Past 12 Months
Chinese Domestic Demand Has Been Absent Over The Past 12 Months
Chart 50Chinese Domestic Demand Has Been Absent Over The Past 12 Months
Chinese Domestic Demand Has Been Absent Over The Past 12 Months
Chinese Domestic Demand Has Been Absent Over The Past 12 Months
Will The Pendulum Swing From Inflation To Deflation? The US equity and bond market selloffs of the past 12 months have wiped out about $12 trillion and $3.5 trillion of their respective market value, respectively. This adds up to a combined $15 trillion or about 60% of US GDP, which already exceeds the wipeouts that occurred during the March 2020 crash and all other bear markets. Such wealth destruction and a hawkish Fed could swing the pendulum from inflation to deflation. Commodity prices are currently vulnerable. Stay tuned. Chart 51Will The Pendulum Swing From Inflation To Deflation?
Will The Pendulum Swing From Inflation To Deflation?
Will The Pendulum Swing From Inflation To Deflation?
Chart 52Will The Pendulum Swing From Inflation To Deflation?
Will The Pendulum Swing From Inflation To Deflation?
Will The Pendulum Swing From Inflation To Deflation?
Chart 53Will The Pendulum Swing From Inflation To Deflation?
Will The Pendulum Swing From Inflation To Deflation?
Will The Pendulum Swing From Inflation To Deflation?
Footnotes Strategic Themes (18 Months And Beyond) Equities Cyclical Recommendations (6-18 Months) Cyclical Recommendations (6-18 Months)
Highlights We now recommend that investors maintain a neutral stance towards stocks versus bonds in a global multi-asset portfolio. We also recommend that investors increase their allocation to government bonds within a global fixed income portfolio (to overweight), at the expense of corporate bonds. We still believe that the US will likely avoid a recession over the coming year, but we are less convinced that this is true than we were a few months ago. The fact that mortgage rates have risen to neutral territory means it is possible that the usual ingredients for a recession – tight monetary policy plus a shock to aggregate demand in the form of a sharp decline in real wages – are currently present or soon will be. In addition, the Fed is now very concerned that long-term household inflation expectations may become unanchored to the upside. Headline inflation has seemingly been a more impactful driver of long-term inflation expectations than core measures, implying that the Fed may have to crowd out demand for goods and services that are comparatively less affected by supply-side constraints in order to contain rising inflation expectations. That would be clearly negative for economic growth and is potentially recessionary in nature. We see no compelling signs of an acceleration in European or Chinese growth that could act as a ballast to support the global economy. The European energy situation is worsening, China’s post-lockdown rebound has so far been tepid, and market-based indicators of Chinese economic growth are deteriorating. The US equity market is not priced for a typical “income-statement” recession induced by monetary policy. We expect the S&P 500 to fall to 3100 in a recession scenario, driven mostly by declining earnings. In a recession scenario, we do not expect long-maturity government bond yields to fall enough to offset a likely increase in the equity risk premium. Financial markets rarely trend sideways over 6-to-12 month periods. We regard a neutral global asset allocation stance as a temporary stepping stone to either a further downgrade of risky assets to underweight, or an increase in risky asset exposure back to a high-conviction overweight. The latter is still possible, especially if we soon see a substantial slowdown in the US headline inflation rate. Thus, additional changes to our recommended cyclical allocation may occur over the coming few months, in response to the incoming data and our assessment of the likely implications for monetary policy. Downgrading Risky Assets To Neutral Every month, BCA strategists hold a house view meeting to discuss the most important issues driving the macroeconomy and financial markets. As highlighted in a recent Special Alert from our Global Investment Strategy service,1 BCA strategists voted at our June meeting to change our House View to a neutral asset allocation stance towards equities, with a slight plurality favoring an outright underweight. Table I-1We Now Recommend More Conservative Positioning Than We Did In May
July 2022
July 2022
The view of the Bank Credit Analyst service is in line with the consensus of BCA strategists on this issue, and we consequently recommend a neutral stance towards stocks versus bonds in a global multi-asset portfolio. We also recommend that investors increase their allocation to government bonds within a global fixed income portfolio (to overweight), at the expense of corporate bonds (Table I-1). We noted in our April report2 – when the S&P 500 index stood at 4530 – that the outlook for equities had deteriorated meaningfully since the beginning of the year and that investors should maintain at most a very modest overweight toward equities in a global multi-asset portfolio. A formal downgrade to neutral is thus not a large change in our recommended positioning, but it reflects what we view as a legitimate increase in the odds of a US recession over the coming year. It is not yet our view that a US recession is a probable outcome, but it is important to distinguish between one’s forecast of the economic outlook and the appropriate investment strategy. The unique inflationary pressure created by the COVID-19 pandemic has created a large confidence interval around our forecast, underscoring that an aggressive stance towards risky assets is not warranted. Financial markets rarely trend sideways over 6-to-12 month periods. We regard a neutral stance as a temporary stepping stone to either a further downgrade of risky assets to underweight or an increase in risky asset exposure back to a high-conviction overweight. The latter is still possible, especially if we see a substantial slowdown in the US headline inflation rate. But as we will discuss below, that slowdown will have to materialize soon in order for us to recommend an overweight risky asset stance. Reviewing Our Previously Constructive View On US Economic Growth Chart I-1Recessionary Concerns Have Escalated Significantly Since The 2-10 Yield Curve Inverted
Recessionary Concerns Have Escalated Significantly Since The 2-10 Yield Curve Inverted
Recessionary Concerns Have Escalated Significantly Since The 2-10 Yield Curve Inverted
Concerns about a potential US recession have been growing since the Fed’s hawkish pivot in November, especially following Russia’s invasion of Ukraine. Previously, these concerns centered around two core issues: the aggressive pace at which the Fed communicated it would raise the policy rate, and the fact that the 2-10 yield curve flattened sharply in the first quarter and finally inverted (based on closing prices) on April 1st (Chart I-1). We had pushed back against those concerns, for several reasons. Our deeply-held view is that recessions typically occur when a significant shock to aggregate demand emerges against the backdrop of tight monetary policy. Sometimes the debt-service and credit demand impact of high interest rates itself is the shock. In other cases, recessions have been triggered in an environment of restrictive monetary policy by a sudden change in key input costs (such as oil prices), the bursting of a financial asset bubble, or a major shift in fiscal spending (typically following a period of war). But the core point is that recessions rarely occur when monetary policy is easy, even when shocks to aggregate demand occur. We abstract here from special cases such as the recession that occurred during the early phase of the COVID-19 pandemic. That event saw the introduction of government policies that purposely arrested economic activity, which in our view would have caused a recession under any conceivable fiscal and/or monetary policy alignment. As a business cycle indicator, the yield curve is significant for investors because it essentially represents the bond market’s assessment of the monetary policy stance. The 2-10 yield curve inversion in early April occurred, in part, because of the speed at which the Fed signaled it would raise interest rates, but also because the 10-year Treasury yield stood just under 2.4% at the point of inversion. This level of long-maturity bond yields reflected the view of both the Fed and most investors that the neutral rate of interest permanently fell following the 2008/2009 global financial crisis (GFC), a view that we have argued against in several previous reports.3 As such, the first reason we pushed back against earlier recessionary concerns is that we believe that the natural/neutral rate of interest is higher than the Fed and investors believe (even though we warned that a recessionary scare was quite likely). Chart I-2A Large Portion Of Currently Elevated Inflation Is Due To Supply-Side And Pandemic-Related Factors
July 2022
July 2022
The second reason that we had pushed back against recessionary concerns was our view that a meaningful portion of currently elevated US inflation is a function of supply-side and pandemic-related factors that will eventually abate. Chart I-2 highlights credible estimates showing that roughly half of the year-over-year change in the headline PCE deflator is the result of supply-side factors, versus 40-50% for core inflation. It has been and remains our view that a substantial portion of these supply-side and pandemic-related factors will dissipate as the pandemic continues to recede in importance, with several price categories likely to deflate outright. Chart I-3Excess Savings Should Still Support Higher Services Spending
Excess Savings Should Still Support Higher Services Spending
Excess Savings Should Still Support Higher Services Spending
Finally, we have argued in several reports that US goods spending has been well above-trend and is likely to slow, but also that services spending is far too low and is likely to rise. Chart I-3 highlights that close to $3 trillion in excess savings have accrued during the pandemic, which formed because of a combination of rising disposable income and falling services spending. We noted that the continued transition of the US and global economies towards a post-pandemic state would boost services spending, providing (an admittedly atypical) source of support for overall aggregate demand. Why The Odds Of A US Recession Have Increased We still believe that the US will more likely than not avoid a recession over the coming year, but it is true that the strength of all three of the arguments presented above has weakened. Regarding the stance of monetary policy, Charts I-4 and I-5 highlight that it is still true that the Fed funds rate and 5-year/5-year forward Treasury yields remain below our estimate of the neutral rate (nominal potential GDP growth). However, Chart I-6 highlights that the sharp rise in consumer price inflation has caused a substantial reduction in real wage growth, which certainly constitutes a non-monetary aggregate demand shock. Chart I-4The Policy Rate Is Not Yet At Neutral, But Mortgage Rates Are
The Policy Rate Is Not Yet At Neutral, But Mortgage Rates Are
The Policy Rate Is Not Yet At Neutral, But Mortgage Rates Are
Chart I-5Long-Maturity Government Bond Yields Would Have Room To Move A Lot Higher Absent Any Shocks To Demand...
Long-Maturity Government Bond Yields Would Have Room To Move A Lot Higher Absent Any Shocks To Demand...
Long-Maturity Government Bond Yields Would Have Room To Move A Lot Higher Absent Any Shocks To Demand...
Chart I-6...Unfortunately, US Consumers Are Clearly Experiencing A Shock In The Form Of Sharply Lower Real Wages
...Unfortunately, US Consumers Are Clearly Experiencing A Shock In The Form Of Sharply Lower Real Wages
...Unfortunately, US Consumers Are Clearly Experiencing A Shock In The Form Of Sharply Lower Real Wages
Panel 2 of Chart I-4 also shows that the 30-year mortgage rate in the US is now at neutral levels, in contrast to government bond yields and the US policy rate. Chart I-7 highlights that our models for US home sales and starts, featured in last month’s report,4 are still not pointing to a severe slowdown in the housing market. However, the fact that mortgage rates have risen to neutral territory means that it is possible that the usual ingredients for a recession – tight monetary policy plus a shock to aggregate demand – are currently present or soon will be. On the question of services spending acting as a support for US economic growth as goods spending slows, we continue to believe that services spending will recover back towards its pre-pandemic trend – funded by excess savings that accrued during the pandemic. However, Chart I-8, presented by my colleague Arthur Budaghyan in a recent Emerging Markets Strategy report,5 underscores the extent of the wealth destruction that has occurred because of the joint effect of falling stock and bond prices. At least some of the services-boosting effect of excess savings will likely be blunted by a negative wealth effect stemming from these financial market losses, especially since the remaining excess savings in the US are likely held by middle-to-upper income households – who are the disproportionate holders of publicly-traded financial assets. Chart I-7No Sign Yet Of A Sharp Slowdown In The Housing Market, But The Ingredients Of A Typical Recession May Be Present
No Sign Yet Of A Sharp Slowdown In The Housing Market, But The Ingredients Of A Typical Recession May Be Present
No Sign Yet Of A Sharp Slowdown In The Housing Market, But The Ingredients Of A Typical Recession May Be Present
Chart I-8A Significant Wealth Shock May Blunt The Deployment Of The Excess Savings Accrued During The Pandemic
A Significant Wealth Shock May Blunt The Deployment Of The Excess Savings Accrued During The Pandemic
A Significant Wealth Shock May Blunt The Deployment Of The Excess Savings Accrued During The Pandemic
On the inflation front, the May CPI release – and the Fed’s reaction to it – underscores that the US economy is at risk of a recession unless supply-side inflation dissipates quickly. Chart I-9 highlights that the May CPI release directly contradicted the view that the monthly rate of change in inflation has peaked. In addition, Chart I-10 presents a breakdown of the percent change in May’s headline consumer price index, with each bar in the chart representing the contribution of that category to headline CPI rising faster than 4% (annualized). The note next to each bar highlights our view of the main driver of that price category, and the color of the bars denotes how probable it is that we will soon see a significant easing in price pressure. Chart I-9The May CPI Report Was Clearly Inconsistent With A Peak Inflation Narrative
The May CPI Report Was Clearly Inconsistent With A Peak Inflation Narrative
The May CPI Report Was Clearly Inconsistent With A Peak Inflation Narrative
Chart I-10Some Elements Of Outsized CPI Will Dissipate Soon. Others May Not.
July 2022
July 2022
The chart makes it clear that certain price categories that have been strongly contributing to outsized headline inflation are likely to peak or even turn deflationary over the next few months. Gasoline and fuel oil inflation is clearly being driven by the trend in crude oil prices, which in our view will likely be flat for the rest of the year. In addition, motor vehicles and parts inflation continues to be driven by the impact of supply-chain shortages on vehicle production. Over the past year, the volume of industrial production of motor vehicle assemblies has averaged just 83% of its pre-pandemic level, which we noted in last month’s report now finally seems to be normalizing (Chart I-11). And while airlines have experienced legitimate cost increases due to rising fuel prices and COVID-related labor shortages, panel 2 of Chart I-11 highlights that real airfares have risen well above their pre-pandemic level. This underscores that a moderation in airfares is quite likely over the coming several months. However, Chart I-10 also highlights that there are several price categories that are less likely to ease quickly. Outsized food and energy services inflation has recently been tied to natural gas prices, given that natural gas is used to generate electricity and is a key element used in the production of fertilizer. Chart I-12 highlights that food inflation has been strongly correlated with the producer price index for pesticide, fertilizer, and other agricultural chemicals, and that there is no sign yet of the latter abating. Despite the fact that global wheat prices have recently been falling, the recent increase in European natural gas prices is likely to exacerbate US food inflation, as fertilizer is used to produce all major planted crops. In addition, European energy insecurity has created an even stronger link between the US and European natural gas markets than what prevailed prior to the Ukrainian war, because of what is likely to be permanently higher LNG demand from Europe. Chart I-11Vehicle And Airfare Inflation Is Likely To Ease Soon
Vehicle And Airfare Inflation Is Likely To Ease Soon
Vehicle And Airfare Inflation Is Likely To Ease Soon
Chart I-12Food Inflation May Remain Elevated For Some Time
Food Inflation May Remain Elevated For Some Time
Food Inflation May Remain Elevated For Some Time
On top of what is likely to be persistent food and energy services inflation, shelter inflation is likely to stay elevated for some time – a point highlighted by my esteemed former colleague, Martin Barnes, in Section 2 of this month’s report. The unemployment rate and house prices are the two main drivers of shelter inflation, and the effect of the latter clearly lags because owner’s equivalent rent is a surveyed measure. The fact that mortgage rates have risen so significantly points to a meaningful slowdown in house price appreciation and possibly even mild deflation, so shelter inflation will eventually slow. The Federal Reserve has made it clear, however, that they are now focused on quickly bringing down consumer prices, even at the cost of a recession. The justification for the Fed’s impatience comes straight from the Modern-Day Phillips Curve, which we discussed in great detail in our January 2021 Special Report.6 Economic theory dictates that inflation should be “normal” when the economy is in equilibrium – defined as economic growth in line with potential growth, no economic/labor market slack, and no supply-side shocks affecting prices. In the minds of many investors, “normal” inflation means the central bank’s target for inflation, but that is not necessarily the case. The experience of the 1970s highlighted that “normal” inflation is the rate that is expected by households and firms, and that the Fed will only succeed at achieving target inflation under normal economic conditions if inflation expectations are consistent with its target. The Fed’s failure to prevent inflation expectations from shifting higher on a structural basis led to two debilitating recessions in the early 1980s, and a prolonged period over which the Fed had to maintain comparatively tight monetary policy. This is a mistake that the Fed does not want to make again. Chart I-13Headline Inflation, Not Core, Is Driving Long-Term Inflation Expectations
Headline Inflation, Not Core, Is Driving Long-Term Inflation Expectations
Headline Inflation, Not Core, Is Driving Long-Term Inflation Expectations
Consistent with that view, Jerome Powell made it clear during the June FOMC meeting press conference that the Fed is now very concerned that long-term household inflation expectations may become unanchored to the upside. Powell implicitly referenced the University of Michigan’s 5-10 year median household inflation expectations survey during the press conference, which we have described in several previous reports as one of the most important macro data series for investors to monitor. The final reading for June came in materially lower than what was suggested by the preliminary report, but they were already at risk of a breakout even before the June release. In addition, Chart I-13 highlights that it is headline inflation (not core) that appears to be the main driver of rising long-term household inflation expectations, which raises a troubling point. If the Fed decides that inflation expectations need to be quickly reined in even at the cost of a higher unemployment rate, that decision implies that it is headline inflation that needs to return rapidly towards the Fed’s target, not just core. Given that some price categories shown in Chart I-10 are likely to be sticky for some time, and that the chart accounted for deviations in headline inflation from 4% (which itself is above the Fed’s target), the implication is that the Fed may have to crowd out demand for goods and services that are comparatively less affected by supply-side constraints. That would be clearly negative for economic growth, and is potentially recessionary in nature. As a final point, it is not just the potential for future economic weakness that concerns us. The US economy was already slowing prior to the Fed’s hawkish pivot and Russia’s invasion of Ukraine, and important indicators for economic activity continue to deteriorate. Chart I-14 highlights that the S&P Global US manufacturing and services PMIs fell meaningfully in June, and Chart I-15 highlights that the Conference Board’s US leading economic indicator continues to deteriorate. In fact, the Conference Board’s LEI has now decreased for three consecutive months, and the bottom panel of Chart I-15 highlights that four consecutive month-over-month declines have all essentially been associated with a recession. 2006 seemingly stands out as an exception to this rule, but given the fact that the housing market downturn began two years before the recession officially started, we simply regard this as an early recessionary signal rather than a false one. Chart I-14The US Is Losing Economic Momentum
The US Is Losing Economic Momentum
The US Is Losing Economic Momentum
Chart I-15The Conference Board's LEI May Soon Send A Recessionary Signal
The Conference Board's LEI May Soon Send A Recessionary Signal
The Conference Board's LEI May Soon Send A Recessionary Signal
No Help From Europe Or China An overweight stance towards global equities might still be warranted in the face of a significant slowdown in US economic activity if economic growth in Europe or China were accelerating. However, the European outlook has been strongly tied to natural gas flows from Russia since the invasion of Ukraine, which tightened meaningfully in June in response to Europe’s oil ban, the looming expansion of NATO, and Europe’s success at replenishing its amount of natural gas in storage. Russia has not fully weaponized its natural gas exports and its actions so far have fallen well short of a complete cutoff, but prices have risen close to 70% over the past month, forcing Germany to trigger the alert level of its emergency gas plan. Aside from the negative impact that higher natural gas prices will have on headline inflation globally, this is obviously incrementally negative for European economic activity. Chart I-16 highlights that the German IFO business climate indexes have led the S&P Global Germany PMI lower over the past few months, and that they imply further manufacturing weakness. And while the services climate index for Germany ticked higher, it remains meaningfully below the levels that prevailed last summer and implies a deterioration in German services activity over the coming few months. In China, we see no compelling signs of a sustainable pickup in economic activity that will provide a ballast to slowing growth in the DM world. We have seen a bounce back in some activity indicators following the significant easing of restrictions in Shanghai and Beijing (Chart I-17). These indicators, however, are still quite weak, and it is likely that China will experience significant further COVID outbreaks over the coming 6-12 months. Chart I-16Europe's Economy Is Likely To Slow Further
Europe's Economy Is Likely To Slow Further
Europe's Economy Is Likely To Slow Further
Chart I-17China's Post-Lockdown 'Recovery' Remains Tepid
China's Post-Lockdown 'Recovery' Remains Tepid
China's Post-Lockdown 'Recovery' Remains Tepid
While Chinese stocks have been rallying in absolute terms over the past few weeks, Chart I-18 highlights that this is essentially the only positive market-based signal about the pace of economic activity in China. The chart highlights that our market-based China Growth Indicator has experienced a renewed down leg, and that the diffusion index never rose above the boom/bust line earlier this year. The recent decline in industrial metals prices is also not a positive market-based signal for Chinese economic activity (Chart 19). Some investors have argued that weak metals prices reflect growth concerns outside of China, but even if that is the case, it implies that China’s reopening will not be forceful enough to offset slowing global ex-China growth. Chart I-18Market-Based Signals Are Not Pointing To An Improvement In Chinese Economic Activity
Market-Based Signals Are Not Pointing To An Improvement In Chinese Economic Activity
Market-Based Signals Are Not Pointing To An Improvement In Chinese Economic Activity
Chart I-19Metals Prices Are Now Falling, Highlighting Mounting Global Growth Fears
Metals Prices Are Now Falling, Highlighting Mounting Global Growth Fears
Metals Prices Are Now Falling, Highlighting Mounting Global Growth Fears
Has The US Equity Market Already Priced In A Recession? One very important question for investors to answer is how much further downside is likely to occur for US equities in the event of a US recession. At its worst point in mid-June, the S&P 500 fell close to 24% from its early January high, and many investors have since questioned whether the US equity market is already priced for a potential contraction in output. Chart I-20The S&P 500 Is Not Currently Priced For A US Recession
July 2022
July 2022
We disagree with this perspective, and believe that the S&P 500 would fall close to 3100 in a typical recession scenario. Chart I-20 presents a range of estimates for the S&P 500 based on a Monte Carlo approach, using what we believe are feasible ranges for the US equity risk premium, real 10-year government bond yields, and the extent of the decline in 12-month forward earnings per share. The chart shows that the equity market only has a positive return at the 5th percentile, which can be interpreted as just a 5% chance that the US equity market has already priced in the impact of a recession. Charts I-21 and I-22 highlight the range of possible outcomes that we used when modeling the likely decline in stock prices in a recession scenario. We assume that the equity risk premium, defined here as the difference between the S&P 500 12-month forward earnings yield and 10-year TIPS yields, rises on average to its early-March level in the wake of Russia’s invasion of Ukraine. We assume that both 10-year nominal Treasury yields and 10-year breakeven inflation rates fall to 2%, reflecting an expectation that 10-year TIPS yields will not return to negative territory in a recessionary scenario. Finally, we expect that S&P 500 forward EPS will decline by 15% from current levels, which is in line with the historical average decline in 12-month trailing operating EPS during recessions. Chart I-21We Do Not Expect Real Bond Yields To Fall Back Into Negative Territory In A Typical Recession Scenario
We Do Not Expect Real Bond Yields To Fall Back Into Negative Territory In A Typical Recession Scenario
We Do Not Expect Real Bond Yields To Fall Back Into Negative Territory In A Typical Recession Scenario
Chart I-22We Expect Earnings To Decline Between 10-20% In A Recession
We Expect Earnings To Decline Between 10-20% In A Recession
We Expect Earnings To Decline Between 10-20% In A Recession
One key takeaway from our analysis is that the likely recessionary equity market decline projected by our approach is fairly close to our estimate of the likely decline in earnings. One potential pushback against our view that earnings will fall in line with what usually occurs during recessions is the fact that nominal revenue growth may only mildly contract or may not contract at all in a recession that is occurring due to high rates of inflation (and thus higher prices charged by firms). Chart I-23 highlights that 12-month trailing S&P 500 sales per share growth never turned negative in the 1970s, even following the 1970 and 1974 recessions. Chart I-23Revenue Growth Did Not Contract In The 1970s, And May Not Contract Significantly If A Recession Occurs Today...
Revenue Growth Did Not Contract In The 1970s, And May Not Contract Significantly If A Recession Occurs Today...
Revenue Growth Did Not Contract In The 1970s, And May Not Contract Significantly If A Recession Occurs Today...
There are two counterpoints to this argument. First, the current risk of a recession mostly stems from the Fed’s determination not to repeat the mistakes that it made during the 1970s, meaning that inflation expectations are unlikely to rise to the level that they did during that period in advance of a recession. That implies that actual inflation, and thus corporate pricing power, will come down significantly during a recession. Second, even in a scenario in which a recession occurs and S&P 500 revenue growth contracts less aggressively than it has during previous recessions, Chart I-24 highlights that the mean-reversion risks to earnings from falling profit margins are quite high. The chart shows that even if profit margins were merely to return to their pre-pandemic levels during a recession (which would actually be a comparatively mild decline given the historical behavior of margins during recessions), it would imply close to a 20% contraction in earnings if sales per share growth were flat. Given this, we feel that our assumption of a 10-20% decline in earnings per share in a recessionary scenario is reasonable. Chart I-24But Profit Margins Are At Great Risk Of A Significant Decline If The Economy Contracts
But Profit Margins Are At Great Risk Of A Significant Decline If The Economy Contracts
But Profit Margins Are At Great Risk Of A Significant Decline If The Economy Contracts
There is another important takeaway from our analysis, which is that the decline in bond yields that will occur in a recessionary scenario will likely be more than offset by a rise in the equity risk premium. Another potential pushback against our view that the US equity market has already priced in a recession is focused on our assumption that the 10-year US Treasury yield will only fall back to 2%, and that real 10-year yields will not return to negative territory. For some investors, this assumption seems far too high, given the structural decline in long-maturity bond yields over the past decade and the fact that the 10-year yield stood below 2% at the beginning of the year when the odds of a recession were lower than they are today. In response to this, we offer three points for structurally-bullish bond investors to consider. The first is that the decline in the nominal 10-year US Treasury yield to 0.5% in 2020 was extremely irregular and it occurred because of the extent of the essentially unprecedented economic weakness wrought by the pandemic. This is absolutely the wrong yield benchmark to use in a typical recession scenario, because the Fed’s response to the recession will be much less aggressive. The second point is related to the first, in that negative real 10-year government bond yields have been heavily driven by the secular stagnation narrative and the general view that the natural/neutral rate of interest has permanently fallen. We agree that the neutral rate of interest fell for a time following the global financial crisis, but we believe strongly that it rose in the latter half of the last economic expansion as US households aggressively deleveraged their balance sheets. Academic estimates of R-star, such as that derived from the previously popular (but now discontinued) Laubach-Williams model, continued to point to a low neutral rate from 2015-2019 because of the deflationary impact of an energy-driven decline in long-term inflation expectations on actual inflation, a factor that is clearly no longer present. Chart I-25We Doubt That The Fed Will Resort To QE When The Next Recession Occurs
We Doubt That The Fed Will Resort To QE When The Next Recession Occurs
We Doubt That The Fed Will Resort To QE When The Next Recession Occurs
Finally, we agree that the existence of the Fed’s asset purchase program has likely had some impact on the 10-year term premium over the past decade. We doubt that the Fed would resort to QE as a monetary policy tool in response to a conventional recession, implying that the term premium will not fall as low as it has over the past decade when growth slowed or contracted. Chart I-25 highlights one important reason for this. Since 2008, the Fed’s use of asset purchases has been part of a strategy to ease monetary policy further when the policy rate had already fallen to zero, to meet its dual mandate of maximum employment and price stability. The chart highlights that even just prior to the pandemic, a persistent gap existed between the headline and core PCE deflator and the level that would have prevailed if both deflators had grown at a 2% annual rate since the onset of the 2008 recession. The chart makes it clear that this gap will completely disappear within the next 12 months for both the headline and core deflator, if the recent pace of change in prices is sustained. In effect, Chart I-25 highlights that the entire post-GFC missed inflation-target era is almost over, which severely undercuts the idea that the Fed will resort to QE as a monetary policy tool in a recession scenario unless the contraction is very severe as it was in 2008 and 2020. We doubt that this will be the case if a recession does occur, implying that both a deeply negative term premium and a significant decline in the 5-year/5-year forward bond yield in a typical recession scenario is unlikely. Investment Conclusions Wayne Gretsky’s famous quotation, that he “skate[s] to where the puck is going, not where it has been” is often invoked by BCA strategists. Successful active investing requires anticipation rather than reaction, and it is legitimate for investors to ask whether downgrading risky assets at the current juncture represents the latter rather than the former. We are cognizant of that risk, but we are also mindful of the importance of capital preservation. When we wrote our annual outlook last year, we believed fairly confidently that inflation would peak and specifically that supply-side inflation would wane. We still believe that pandemic-related effects on consumer prices will eventually dissipate, and it is still possible that inflation is in the process of peaking. Recent evidence, however, about the pace of price advances, the clear impact that high inflation is having on real wage growth, and the Fed’s desire to see consumer prices fall quickly back toward its target, means that the cyclical economic outlook is now highly dependent on the speed at which prices normalize – not just whether it will occur. To us, that implies that investors need to have a high-conviction view that supply-side inflation will normalize soon in order to stay overweight risky assets, and that the Fed will look through elevated housing-related inflation that is likely to persist for several months. At least in the case of supply-side inflation, we think normalization is probable but we no longer have high conviction about the speed of adjustment. As such, we recommend that investors maintain no more than a neutral stance towards stocks versus bonds in a global multi-asset portfolio. We also recommend that investors increase their allocation to government bonds within a global fixed income portfolio (to overweight), at the expense of corporate bonds, as part of an overall shift towards more defensive positions. In terms of other important asset class allocations, we recommend the following: Within a global equity portfolio, maintain a neutral regional allocation, a neutral stance toward cyclicals versus defensives, and a neutral stance towards small-cap stocks versus their large-cap peers. Modestly favor value stocks over growth stocks, as most of the outsized outperformance of growth stocks during the pandemic has already reversed. Within a fixed-income portfolio, a modestly short stance is warranted over the coming 6- to 12-months. Extremely stretched technical and valuation conditions point to a bearish view towards the US dollar over the coming 6- to 12-months, but USD will likely remain well-bid over the nearer-term. We are only likely to upgrade our cyclical USD call in a scenario in which we recommend underweighting global equities within a multi-asset portfolio. As noted above, financial markets rarely trend sideways over 6-to-12 month periods. We regard a neutral global asset allocation stance as a temporary stepping stone to either a further downgrade of risky assets to underweight or an increase in risky asset exposure back to a high-conviction overweight. Thus, additional changes to our recommended cyclical allocation may occur over the coming few months, in response to the incoming data and our assessment of the likely implications for monetary policy. Stay tuned! Jonathan LaBerge, CFA Vice President The Bank Credit Analyst June 30, 2022 Next Report: July 28, 2022 II. Inflation Whipsaw Ahead Dear Client, This month’s Special Report has been written by Martin Barnes, BCA’s former Chief Economist. Martin, who retired from BCA Research last year after a long and illustrious career, discusses the long-run outlook for inflation. The views expressed in this report are his, and may not be consistent with those of the Bank Credit Analyst or other BCA Research services. But Martin’s warning of future stagflation is sobering, and I trust you will find his report both interesting and insightful. Jonathan LaBerge, CFA The Bank Credit Analyst Overly stimulative policies meant that inflation was set to rise even before the disruptions caused by the pandemic and Ukraine conflict. Inflation should decline sharply over the coming year in response to weaker economic growth and an easing in supply problems. But it will be a temporary respite. Central banks will not have the stomach to keep policy tight enough for long enough to squeeze inflation out of the system. Price pressures will return as economies bottom and the environment will become one of stagflation. Financial assets will rally strongly when inflation fears subside but subsequent stagflation will not be bullish for markets. Former Federal Reserve Chairman Alan Greenspan once defined price stability as existing when “households and businesses need not factor expectations of changes in the average level of prices into their decisions”. Until recently, that state of affairs was the case for much of the past 30 years and for many, inflation was quiescent during their entire working lives. But inflation is now back as a huge issue and there is massive debate and uncertainty about whether it will be a temporary or lasting problem. I lean toward the latter view. Major changes in the economic and/or financial environment more often are identified in hindsight than in real time. It is easier to attribute large trend deviations to temporary factors than to make bold predictions about structural shifts. Obviously, the pandemic and conflict in Ukraine have had a significant impact on the near-term inflation picture via massive supply-side disruptions and represent temporary events. Thus, inflation will retreat from current elevated levels as those disruptions diminish. But the conditions for higher inflation were already in place before those two unfortunate events occurred. Specifically, central banks have been erring on the side of stimulus for several years and they will find it extremely difficult, if not impossible, to put the inflation genie back into the bottle. Inflation has moved from a non-issue to the most important factor driving markets. Over the next year, the next big surprise might be how fast inflation retreats and investors and policymakers will then breathe a big sigh of relief. However, this will prove to be a temporary respite because it will not take long for inflation to move back up and remain stubbornly above central bank targets. In other words, a whipsaw is in prospect over the next few years as inflation goes from up, to down, and to up again. The Current Inflation Problem The biggest increases in consumer prices have occurred in areas most affected by supply problems, with energy attracting the most attention. Nevertheless, in most countries, inflation has risen across the majority of goods and services. The core inflation rate (i.e. consumer prices excluding food and energy) in the G7 economies climbed from 2% to 4.8% between April 2021 and April 2022 (Chart II-1). Meanwhile, the Cleveland Fed’s trimmed mean measure of US consumer price inflation has spiked dramatically higher, consistent with a broad-based acceleration in inflation.7 The rise in underlying inflation is a bigger problem in the US, UK and Canada than in Japan or the Euro Area. Chart II-2 shows current core inflation rates relative to the target rate of 2% pursued by most central banks. That geographical divergence will be touched on later and in the meantime, the focus will be on the US situation. Chart II-1A Broad-Based Pickup In Inflation
A Broad-Based Pickup in Inflation
A Broad-Based Pickup in Inflation
Chart II-2The US, UK And Canada Have A Bigger Inflation Problem
July 2022
July 2022
The latest US inflation data for a range of goods and services is shown in Table II-1. The table shows the three- and six-month annualized changes in prices because 12-month rates can be affected by a base effect given the impact of pandemic-related shutdowns and disruptions a year ago. Also, a comparison of the three- and six-month rates shows if momentum is building or fading. The trends are not encouraging in that momentum has accelerated, not diminished in many key areas. Table II-1Selected Inflation Rates In The US CPI
July 2022
July 2022
Even if the data show a moderation in core inflation in the months ahead, it is important to note that rent inflation – the CPI component with the biggest weight – is seriously underestimated. This is one of the few items where prices are collected with a lag and real estate industry reports highlight that rent inflation is running at double-digit rates in the major cities. According to one report, average rents nationally increased by more than 25% in the year to May.8 The CPI data will eventually catch up with reality, providing at least a partial offset to any inflation improvements in other areas. Another problem for inflation is the acceleration in wage growth against the backdrop of an unusually tight labor market. Currently, the number of unfilled vacancies is almost twice the number of unemployed and it is thus no surprise that wage growth has picked up sharply (Chart II-3). The Atlanta Fed’s measure of annual wage inflation has risen above 6%, its highest reading since the data began in 1997. Wage growth is unlikely to suddenly decline absent a marked rise in the unemployment rate. There is much debate about whether the US economy is on the verge of recession, but let’s not get bogged down in semantics. Regardless of whether the technical definition of recession is met (at least two consecutive quarters of negative GDP growth), the pace of activity is set to slow sharply. Plunging consumer and business confidence, contracting real incomes and a peaking in housing activity all point to a significant weakening in growth, even if the labor market stays healthy (Chart II-4). Chart II-3A Very Tight US Labor Market
A Very Tight US Labor Market
A Very Tight US Labor Market
Chart II-4The US Economy Is In Trouble
The US Economy is in Trouble
The US Economy is in Trouble
Softer economic growth eventually will take the edge off inflationary pressures in many goods and services. Combined with an easing in supply-side disruptions, the inflation rate is certain to decline in the coming year, even if oil prices move higher in the short run. Currently, the Fed is talking tough about dealing with inflation and there is little doubt that further rate hikes are on the way. However, policymakers will have little stomach for inflicting enough economic pain to completely squeeze inflation out of the system. Once there are clear signs of a significant economic slowdown, the Fed will back off quickly. What Causes Inflation Anyway? Economics 101 teaches that prices are determined by the interaction of supply and demand. If the demand for a good or service exceeds supply, then prices will rise to bring things back into balance. Seems simple enough but, unfortunately, this leaves many unanswered questions. How much must prices rise and for how long in order to restore balance? What if there are structural impediments to supply? What if there are monopolies in key commodities or services? What if policy interferes with the operation of market-clearing solutions? And, finally, what measure of inflation should we be looking at? Chart II-5Inflation Is A 'Modern' Issue
Inflation is a 'Modern' Issue
Inflation is a 'Modern' Issue
For much of economic history, deflation was just as prevalent as inflation, with the latter only being a problem during periods of war (Chart II-5). As the pre-WWII world pre-dated fiat money, automatic stabilizers (e.g. the welfare state), and counter-cyclical fiscal policy, economies were prone to regular depressions that served to wash out financial and economic excesses and any inflationary pressures. But those days are long gone and free market forces should not be expected to keep inflation under wraps. I rather like the simple explanation of inflation’s roots as being “too much money chasing too few goods”. In that sense, the control of inflation lies firmly at the door of central banks. In the “old days” (i.e. before the 1990s), it was possible to use the growth in the money supply to gauge the stance of policy because there was a fairly stable and predictable relationship between monetary and economic trends. That all ended when financial deregulation and the explosion in non-bank financial activities meant that monetary trends ceased to be a reliable indicator of economic growth and inflation. As a result, the Fed stopped setting monetary growth targets more than 20 years ago and since then, money supply data has rarely been mentioned in FOMC discussions. Chart II-6A Simple Measure Of The Monetary Stance
A Simple Measure of the Monetary Stance
A Simple Measure of the Monetary Stance
Fortunately, all is not lost. The gap between the federal funds rate and nominal GDP growth is a reasonably good proxy for the stance of monetary policy. Conditions are easy when rates are persistently below GDP growth and vice versa when they are above. As can be seen in Chart II-6, rates were below GDP growth during most of the 1960s and 1970s, a period when inflation rose sharply. And inflation fell steadily in the 1980s into the first half of the 1990s when the Fed kept interest rates above GDP growth. And look at what has happened in the past decade: rates have been significantly below GDP growth, suggesting an aggressively easy monetary stance. It was only a matter of time before inflation picked up, even without the recent supply-side disruptions. The FOMC’s latest projections show long-run growth of 3.8% in nominal GDP while the fed funds rate is expected to average only 2.5%. That implies a continued accommodative stance, yet inflation is forecast to be in line with the 2% target. That all seems very unlikely. Fed policymakers spend a lot of time trying to figure out the level of the equilibrium real interest rate – the level consistent with steady non-inflationary economic growth. It would be very helpful to have this number but coming up with an accurate measure is a largely futile exercise. It cannot be measured empirically and its estimation requires a lot of assumptions, explaining why there is no broad agreement on what the right number is. I think there is a case for the simpler approach of using the nominal growth in GDP as a proxy for where rates should be in normal circumstances. As noted above, that suggests monetary policy was excessively accommodative for an extended period. If US Policy Was Too Easy, Why Was Inflation Low For So Long? The Fed’s preferred measure of underlying inflation is the change in the personal consumption deflator, excluding food and energy. In the 25 years to 2019, inflation by this measure averaged only 1.7%, compared to the Fed’s desired level of 2%. Thus, even though the level of interest rates implied very accommodative policy over that period, inflation remained tame. This leads to an important caveat. The stance of monetary policy plays the key role in driving inflation, but it is not everything. Offsetting forces on inflation (in both directions) can mute or even swamp the impact of policy. There were several disinflationary forces in operation during the past 25 years. Specifically: In the second half of the 1990s, the explosive growth of the internet and accompanying boom in technology spending led to a marked pickup in productivity growth. The entry of China into the World Trade Organization at the end of 2001 unleashed a wave of offshoring and downward pressure on traded goods prices. A series of deflationary shocks hit the US and global economy including the 1998 financial crisis in South-East Asia and Russia, the bursting of the tech bubble after 2000, and of course the global financial meltdown in 2007-09. Unstable economic conditions undermined labor’s bargaining power, keeping a tight lid on wage growth. This was highlighted by the dramatic decline in labor’s share of income after 2000. Importantly, the above forces are no longer in place and in some cases are reversing. The key technological advances of the past decade have not been particularly good for productivity. Indeed, one could argue that the activities of most so-called FANG stocks – especially those involved in social media - have had a negative impact on productivity. Time spent on FaceBook, Twitter and Netflix do not have obvious benefits for increased economic efficiency. Chart II-7Globalization In Retreat
Globalization in Retreat
Globalization in Retreat
Even before the pandemic’s impact on supply chains, there were signs that globalization had peaked (Chart II-7). Indeed, BCA first suggested in 2014 that globalization was running out of steam. More recently, the interruption to supply chains has highlighted the downside of relying excessively on overseas production for key goods such as semi-conductors and pharmaceuticals. Onshoring rather than offshoring will become more common with higher prices being the cost for greater control over supply. Globalization is not dead, but, at the margin, it no longer is a powerful source of disinflation. US import prices from China are back to their highest level in a decade after falling steadily during the eight years to 2020. The inflationary impact of the pandemic and the war in Ukraine via supply-side disruptions are more than offsetting any disinflationary effects of softer economic growth. In other words, they have represented stagflationary rather than deflationary shocks. Finally, with regard to income shares, the pendulum has swung more in favor of labor. Demographic trends (e.g. slow growth in the working-age population) suggest that the labor market will remain relatively tight in the years ahead, notwithstanding short-term weakness as the economy slows. Profit margins are likely to weaken and labor’s share of income will rise. The bottom line is that easy money policies will no longer be offset by a number of powerful external forces that served to keep consumer price inflation under wraps in the pre-pandemic period. And this raises another important point. If monetary policy is too easy, then it will show up somewhere, even if consumer price inflation is under control. There Is More Than One Kind Of Inflation Inflation most commonly refers to the change in the prices of consumer goods and services. That is understandable because consumer spending accounts for more than half of GDP in the major developed economies (and almost 70% in the US). And because consumers are the ones who vote, it is the inflation rate that politicians care most about. However, there are other kinds of inflation. If there are structural impediments to increased consumer prices, then excessively easy monetary policy most likely will show up in higher asset prices. This is a very different kind of inflation because it is welcomed by the owners of assets and by politicians. Nobody is happy to face higher prices for the goods and services they buy, but asset owners love the wealth-boosting effect of higher prices for homes and shares. Consumer inflation may have been subdued in the pre-pandemic decade, but the same is not true for asset prices. During the period that the Fed ran accommodative policies, there were several periods of rampant asset inflation such as the tech stock bubble of the late 1990s, the housing bubble of the 2000s, and the bond bubble of 2016-2020. And both equity and home prices surged in response to monetary stimulus triggered by the pandemic. Central banks may fret about the potential financial stability implications of surging asset prices, but in practice they do not act to curb them. Policymakers argue that it is hard to determine when an asset bubble exists and even when one is obvious, monetary policy is a crude tool to deal with it. If rising asset prices occur alongside an economy that is characterized by stable growth and moderate inflation, then acting to burst a bubble could inflict unnecessary economic damage. That is an understandable position, but it means ignoring the longer-term problems that occur when bubbles inevitably burst. This was highlighted by the economic and financial chaos after the US housing bubble burst in 2007. The reality is that central banks have been forced to rely more heavily on asset inflation as a source of monetary stimulus. An easing in monetary policy affects economic conditions in three primary ways: boosting credit demand and supply, raising asset prices, and lowering the exchange rate.9 Historically, the credit channel was by far the most important. BCA has written extensively about the Debt Supercycle and the role of monetary policy in fueling ever-rising levels of private sector indebtedness (see the Appendix for a brief description of the Debt Supercycle). Chart II-8No Releveraging Cycle In Household Debt
No Releveraging Cycle in Household Debt
No Releveraging Cycle in Household Debt
The environment changed dramatically after the 2007-09 financial meltdown. The collapse of the credit-fueled housing bubble drove a stake through the heart of the household sector’s love affair with debt. The ratio of household debt to income peaked in early 2009 and ten years later it was back to the levels of 2001 (Chart II-8). Even an extended period of record low interest rates has failed to trigger a new leveraging cycle. If the Fed can’t persuade consumers and businesses to fall back in love with debt, then it must rely on the other two transmission channels for monetary policy – asset prices and the exchange rate. And the Fed really has limited control over the latter channel given that it also depends on the actions of other central banks. The deleveraging of the household sector in the post-2009 period could have been very bearish for the economy, but the Fed’s easy money policies underpinned the stock market, allowing household net worth to revive. There was an explosive rise in household net worth in 2020-21 as surging house prices added to stock market gains. Between end-2019 and end-2021, the household sector’s direct holdings of equities plus owner’s equity in real estate increased in value by around $20 trillion, equal to more than one year’s personal disposable income. The recent decline in equity prices has reversed some of the gains, but net worth remains elevated by historical standards. The bottom line is that it was wrong to suggest that the Fed’s accommodative stance did not create inflation. Consumer price inflation was tame in the pre-pandemic period, but there was lots of asset inflation and that gathered pace in 2020 and 2021. There was always going to be some leakage of this into more generalized inflation but this was accelerated by the double whammy of the supply disruptions caused by the pandemic and the Ukraine war. The Strange Case Of Japan If higher inflation in the US has seemed inevitable, how can one explain the situation in Japan? In contrast to other developed countries, Japan’s annual core inflation rate was only 0.2% in May. While this was an increase from the average -1.3% rate in the prior six months, it is impressive given the country’s continued highly stimulative monetary policy and the same exposure to supply disruptions as elsewhere. Most importantly, Japan has suffered structural deflation for so long that inflation expectations are totally dormant for both consumers and businesses. In other words, raising prices is seen as a desperate measure and something to be avoided. Japan’s poor demographics may also have played a role. A sharply declining labor force and rapidly aging population are disinflationary rather than inflationary influences and help reinforce the corporate sector’s reluctance to raise prices. While Japan seems an outlier, it is worth noting that core inflation also has remained relatively subdued in many European countries. For the overall Euro area, the latest core inflation rate is 3.8%, well below that of the US and UK. Two common features of the higher inflation countries are that they tended to have more aggressively-easy fiscal policies in recent years and greater asset inflation – especially in real estate. Unfortunately, inflation expectations and business pricing behavior in the US and other Anglo-Saxon economies have not followed Japan’s example. Employees have become more aggressive in demanding higher wages, and most companies have no problem in passing on higher costs to their customers. The UK is facing a wave of public sector strikes over pay the likes of which have not been seen for decades. The Outlook Chart II-9A Peaking In Supply Problems?
A Peaking in Supply Problems?
A Peaking in Supply Problems?
Inflation may prove sticky over the next few months, but as noted earlier, it should move significantly lower over the coming year. Crude oil prices have risen by around 75% in the past year and that pace of rise cannot be sustained. Meanwhile, while shipping rates remain historically high, they are down sharply from earlier peaks (Chart II-9). Together with a revival in Chinese exports, this suggests some easing in supply chain problems. And as mentioned above, the pace of economic activity is set to slow sharply. But a return to pre-pandemic inflation levels is not in the cards. The Fed currently is talking tough and further rate hikes are on the way. But the tightening will end as soon as it becomes clear that the economy is heading south. A deep recession is not likely because there are not the worrying imbalances such as excessive consumer debt or inventories that typically precede serious downturns. However, policymakers will not take any risks and policy will return quickly to an accommodative stance, even though inflation is unlikely to return to the desired 2% level. On a positive note, inflation may be the highest in 40 years in many countries, but we are not facing a return to the destructive high-inflation environment of the 1970s. Inflation back then was institutionalized and a self-feeding cycle of higher wages and rising prices was deeply embedded. I was working as an economist for BP in London in the 1970s and remember receiving large quarterly pay rises just to compensate for inflation. In the absence of inflation-accounting practices, companies seriously underestimated the destruction that inflation was creating to balance sheets and profitability, making them complacent about the problem. Moreover, there were not the same global competitive pressures that exist today. Inflation in the US likely will form a new base of 3% to 4% over the medium term, with occasional fluctuations to 5% or above. An environment of stagflation is in prospect: growth will not be weak enough to suppress inflation and not strong enough to allow the Fed to maintain a restrictive stance. This puts the Fed in a difficult spot as it will be reluctant to admit defeat by raising the inflation target from its current 2%, even though that level will be out of reach in practical terms. A counter view is that I am too pessimistic by underestimating the disinflationary effects of technological advances. A sustained improvement in productivity would certainly help lower inflation but how likely is this? Technological advances are occurring all the time, but in recent years they largely have been incremental in nature and it is hard to think of any new breakthrough productivity-enhancing technologies. There is a difference between new technologies that simply represent better ways to do existing tasks (3D printing would fall into that category) and general purpose technologies that completely change the way economies operate (e.g. electricity and the internet). While businesses are still exploiting the benefits of the digital world, we await innovations that will trigger a new sustained upsurge in productivity. A game changer would be the development of unlimited cheap energy (cold fusion?) but that does not seem likely any time soon. Nevertheless, I will keep an open mind about the potential for productivity to surprise on the upside, despite my current skepticism. Chart II-10Inflation Expectations Spike Higher
Inflation Expectations Spike Higher
Inflation Expectations Spike Higher
What does all this mean for the markets? Not surprisingly, shifts in market expectations for future inflation are highly correlated with the current rate and have thus spiked higher in recent months, hurting both bonds and stocks (Chart II-10). Obvious inflation hedges would be inflation-protected bonds and resources, but neither group currently is attractively priced. The good news is that the current panic about inflation is setting the scene for a buying opportunity in both stocks and bonds. The exact timing is tricky to predict but both stocks and bonds will rally strongly later this year when inflation expectations retreat as it becomes clear that the economy is weakening and the Fed softens its hawkish tones. The bad news is that this bullish phase will not last much more than a year because a re-emergence of inflationary pressures will bring things back to earth. The long-run outlook is one of stagflation and that will be a tough environment for financial assets. Martin H. Barnes Former Chief Economist, BCA Research mhbarnes15@gmail.com Appendix: A Primer On The Debt Supercycle The Debt Supercycle is a description of the long-term decline in U.S. balance-sheet liquidity and rise in indebtedness during the post-WWII period. Economic expansions have always been associated with a buildup of leverage. However, prior to the introduction of automatic stabilizers such as the welfare state and deposit insurance, balance-sheet excesses tended to be fully unwound during economic downturns, albeit at the cost of severe declines in activity. The pain of the Great Depression led governments to intervene to smooth out the business cycle, and their actions were given legitimacy by the economic theories of John Maynard Keynes. Fiscal and monetary reflation, together with the introduction of automatic stabilizers such as unemployment insurance, were successful in preventing the frequent depressions that plagued the pre-WWII economy, but the downside was that balance-sheet imbalances and financial excesses built up during each expansion phase were never fully unwound. Periodic "cyclical" corrections to the buildup of debt and illiquidity occurred during recessions, but these were never enough to reverse the long-run trend. Although liquidity was rebuilt during a recession, it did not return to its previous cyclical high. Meanwhile, the liquidity rundown during the next expansion phase established new lows. These trends led to growing illiquidity, and vulnerability in the financial markets. The greater the degree of illiquidity in the economy, the greater is the threat of deflation. Thus, the bigger that balance-sheet excesses become, the more painful the corrective process would be. So, the stakes became higher in each cycle, putting ever-increasing pressure on the authorities to reflate demand, by whatever means were available. The Supercycle process was driven over time by the building tension between rising underlying deflationary risks in the economy, and the ability of policymakers to create inflation. The Supercycle reached an important inflection point in the recent economic and financial meltdown, with the authorities reaching the limit of their ability to get consumers to take on more leverage. This forced the government to leverage itself up instead, representing the Debt Supercycle's final inning. III. Indicators And Reference Charts BCA’s equity indicators paint a bearish picture for stock prices. Our monetary indicator is now at its weakest in almost three decades and our valuation indicator highlights that stocks are still overvalued, albeit less so than they were last year. Meanwhile, both our sentiment and technical indicators have now broken down very significantly, and are not yet providing a contrarian buy signal. The odds of a US recession over the next 12 months have recently risen, and we now recommend a neutral stance for stocks versus bonds over the coming year. Forward earnings are no longer being significantly revised up, but bottom-up analysts’ expectations for earnings are still too rosy. Although earnings growth is still likely to be positive over the coming year if a US recession is avoided, it will be in the mid-to-low single-digits. Within a global equity portfolio, we recommend a neutral stance on cyclicals versus defensives, small caps versus large, and a neutral stance on regional equity allocation. Within a fixed-income portfolio, investors should stay modestly short duration. The increase in commodity prices that followed Russia’s invasion of Ukraine has cooled, and prices are now rolling over significantly on the back of global growth concerns. Our composite technical indicator has dropped meaningfully, indicating that commodities are now no longer overbought. Our base-case view is that oil prices have peaked, but there some risk to that view given the current geopolitical situation. In addition, the recent rise in European natural gas prices suggests that global food inflation could remain elevated, given that natural gas is used in the production of fertilizer. We remain structurally bullish on industrial metals, but metals prices are likely to decline further until recessionary concerns abate. US and global LEIs have rolled over significantly and are now edging towards negative territory. The Conference Board’s LEI has now decreased for three consecutive months, and four consecutive month-over-month declines have historically been associated with a recession. Our global LEI diffusion index has bottomed, but we are not convinced that this heralds a major upturn in the LEI itself. EQUITIES: Chart III-1US Equity Indicators
US Equity Indicators
US Equity Indicators
Chart III-2Willingness To Pay For Risk
Willingness To Pay For Risk
Willingness To Pay For Risk
Chart III-3US Equity Sentiment Indicators
US Equity Sentiment Indicators
US Equity Sentiment Indicators
Chart III-4US Stock Market Breadth
US Stock Market Breadth
US Stock Market Breadth
Chart III-5US Stock Market Valuation
US Stock Market Valuation
US Stock Market Valuation
Chart III-6US Earnings
US Earnings
US Earnings
Chart III-7Global Stock Market And Earnings: Relative Performance
Global Stock Market And Earnings: Relative Performance
Global Stock Market And Earnings: Relative Performance
Chart III-8Global Stock Market And Earnings: Relative Performance
Global Stock Market And Earnings: Relative Performance
Global Stock Market And Earnings: Relative Performance
FIXED INCOME: Chart III-9US Treasurys And Valuations
US Treasurys And Valuations
US Treasurys And Valuations
Chart III-10Yield Curve Slopes
Yield Curve Slopes
Yield Curve Slopes
Chart III-11Selected US Bond Yields
Selected US Bond Yields
Selected US Bond Yields
Chart III-1210-Year Treasury Yield Components
10-Year Treasury Yield Components
10-Year Treasury Yield Components
Chart III-13US Corporate Bonds And Health Monitor
US Corporate Bonds And Health Monitor
US Corporate Bonds And Health Monitor
Chart III-14Global Bonds: Developed Markets
Global Bonds: Developed Markets
Global Bonds: Developed Markets
Content Chart III-15Global Bonds: Emerging Markets
Global Bonds: Emerging Markets
Global Bonds: Emerging Markets
CURRENCIES: Chart III-16US Dollar And PPP
US Dollar And PPP
US Dollar And PPP
Chart III-17US Dollar And Indicator
US Dollar And Indicator
US Dollar And Indicator
Chart III-18US Dollar Fundamentals
US Dollar Fundamentals
US Dollar Fundamentals
Chart III-19Japanese Yen Technicals
Japanese Yen Technicals
Japanese Yen Technicals
Chart III-20Euro Technicals
Euro Technicals
Euro Technicals
Chart III-21Euro/Yen Technicals
Euro/Yen Technicals
Euro/Yen Technicals
Chart III-22Euro/Pound Technicals
Euro/Pound Technicals
Euro/Pound Technicals
COMMODITIES: Chart III-23Broad Commodity Indicators
Broad Commodity Indicators
Broad Commodity Indicators
Chart III-24Commodity Prices
Commodity Prices
Commodity Prices
Chart III-25Commodity Prices
Commodity Prices
Commodity Prices
Chart III-26Commodity Sentiment
Commodity Sentiment
Commodity Sentiment
Chart III-27Speculative Positioning
Speculative Positioning
Speculative Positioning
Chart III-28US And Global Macro Backdrop
US And Global Macro Backdrop
US And Global Macro Backdrop
ECONOMY: Chart III-29US Macro Snapshot
US Macro Snapshot
US Macro Snapshot
Chart III-30US Growth Outlook
US Growth Outlook
US Growth Outlook
Chart III-31US Cyclical Spending
US Cyclical Spending
US Cyclical Spending
Chart III-32US Labor Market
US Labor Market
US Labor Market
Chart III-33US Consumption
US Consumption
US Consumption
Chart III-34US Housing
US Housing
US Housing
Chart III-35US Debt And Deleveraging
US Debt And Deleveraging
US Debt And Deleveraging
Chart III-36US Financial Conditions
US Financial Conditions
US Financial Conditions
Chart III-37Global Economic Snapshot: Europe
Global Economic Snapshot: Europe
Global Economic Snapshot: Europe
Chart III-38Global Economic Snapshot: China
Global Economic Snapshot: China
Global Economic Snapshot: China
Jonathan LaBerge, CFA Vice President The Bank Credit Analyst Gabriel Di Lullo Research Associate Footnotes 1 Please see Global Investment Strategy Special Alert "Hard Or Soft Landing? BCA Strategists Debate The Question," dated June 21, 2022, available at gis.bcaresearch.com 2 Please see The Bank Credit Analyst "April 2022," dated March 31, 2022, available at bca.bcaresearch.com 3 Please see Global Investment Strategy "Revisiting The Neutral Rate Of Interest: A Contrarian View In A Time Of Crisis," dated March 20, 2020, available at gis.bcaresearch.com; The Bank Credit Analyst "R-star, And The Structural Risk To Stocks," dated March 31, 2021, available at bca.bcaresearch.com; The Bank Credit Analyst "Do Excess Savings Explain Low US Interest Rates?" dated March 31, 2022, available at bca.bcaresearch.com 4 Please see The Bank Credit Analyst "Is The US Housing Market Signaling An Imminent Recession?" dated May 26, 2022, available at bca.bcaresearch.com 5 Please see Emerging Markets Strategy "A Conversation With Ms. Mea: Navigating An Inflation Storm," dated June 16, 2022, available at ems.bcaresearch.com 6 Please see The Bank Credit Analyst "The Modern-Day Phillips Curve, Future Inflation, And What To Do About It," dated December 18, 2020, available at bca.bcaresearch.com 7 This trimmed mean measure excludes the top 8% of CPI components with the largest monthly price gains and the bottom 8% with the smallest monthly gains. 8 Rent.com, https://www.rent.com/research/average-rent-price-report/, June 2022. 9 A fourth channel can be via a psychological boost to business and consumer confidence, but this can cut both ways if an easing in policy is interpreted as a sign of worsening economic conditions rather than as a reason for optimism.
Executive Summary There has never been a modern era recession or sharp slowdown in which the oil price did not collapse. In a recession, the massive destruction of oil demand always overwhelms a tight supply. Across the last six recessions, the median collapse in the oil price was -60 percent, with the best case being -30 percent, and the worst case being -75 percent. Hence, in the coming recession, the oil price is likely headed to $55, with the best case being $85, and the worst case being $30. Investors should short oil, or short oil versus copper. Equity investors should underweight the oil sector versus basic resources and/or industrials and/or banks, and underweight oil-heavy equity markets such as Norway. Fractal trading watchlist: Oil versus industrials, and oil versus banks. Oil Didn’t Get The ‘Everything Sell-Off’ Memo
Oil Didn't Get The 'Everything Sell-Off' Memo
Oil Didn't Get The 'Everything Sell-Off' Memo
Bottom Line: There has never been a modern era recession or sharp slowdown in which the oil price did not collapse, and this time will be no different. Feature We have just witnessed a rare star-alignment. The near-perfect line up of Mercury, Venus, Mars, Jupiter and Saturn in the heavens is a spectacular sight for the early birds who can star gaze through clear skies. And it is a rare event, which last happened in 2004. But investors have just witnessed an even rarer star-alignment. The ‘everything sell-off’ in stocks, bonds, inflation-protected bonds, industrial metals, and gold during the second quarter has happened in only one other calendar quarter out of almost 200. Making it a ‘1 in a 100’ event, which last happened way back in 1981 (Chart I-1 and Chart I-2). Chart I-1The ‘Everything Sell-Off’ In 2022…
Oil Didn't Get The 'Everything Sell-Off' Memo
Oil Didn't Get The 'Everything Sell-Off' Memo
Chart I-2...Last Happened In 1981
...Last Happened In 1981
...Last Happened In 1981
As we detailed in our previous reports Markets Echo 1981 When Stagflation Morphed Into Recession and More On 2022-23 = 1981-82 And The Danger Ahead, a once-in-a-generation conjugation connects the ‘1 in a 100’ everything sell-offs in 1981 and 2022. The conjugation is inflation fears, exacerbated by a major war between commodity producing neighbours, and countered by aggressive rate hikes, morph into recession fears. The 1981-82 episode is an excellent blueprint for market action through 2022-23. This makes the 1981-82 episode an excellent blueprint for market action through 2022-23, and we refer readers to the previous reports for the implications for stocks, bonds, equity sectors, and currencies. Oil Didn’t Get The ‘Everything Sell-Off’ Memo But one major investment didn’t get the ‘everything sell-off’ memo. That major investment is crude oil. Even within the commodity space, oil is the outlier. In the second quarter, industrial commodity prices have collapsed: copper, -20 percent; iron ore -25 percent; tin, -40 percent; and lumber, -40 percent. Yet the crude oil price is up, +7 percent, and the obvious explanation is the Russia/Ukraine war (Chart I-3). Chart I-3Oil Didn't Get The 'Everything Sell-Off' Memo
Oil Didn't Get The 'Everything Sell-Off' Memo
Oil Didn't Get The 'Everything Sell-Off' Memo
The Russia/Ukraine war is an important part of the 2022/1981 once-in-a-generation conjugation. In 1981, just as now, the full-scale invasion-led war between two major commodity producing neighbours – Iraq and Iran – disrupted commodity supplies, and thereby added fuel to an already red-hot inflationary fire. When Russia invaded Ukraine earlier this year, the oil price surged by 25 percent. Remarkably, when Iraq invaded Iran in late 1980, the oil price also surged by 25 percent. But by mid-1981, with the global economy slowing, the oil price had given back those gains. Then, as the economy entered recession in early 1982, the oil price slumped to 15 percent below its pre-war level. If 2022-23 follows this blueprint, it would imply the oil price falling to $85/barrel (Chart I-4). Chart I-4If Oil Follows The 1981-82 Blueprint, It Will Tumble To $85
If Oil Follows The 1981-82 Blueprint, It Will Tumble To $85
If Oil Follows The 1981-82 Blueprint, It Will Tumble To $85
There Has Never Been A Recession In Which The Oil Price Did Not Collapse Everybody knows the narrative for the oil price surge this year. In what is putatively a very tight market, the embargo of Russian oil has removed enough supply to put significant upward pressure on the price. The trouble with this story is that Russian oil will find a buyer, even if it requires a discount. Moreover, with the major buyers being China and India, it will be politically and physically impossible to police secondary sanctions. The bottom line is that Russian oil will find its way into the market. There has never been a modern era recession or sharp slowdown in which the oil price did not collapse. But the bigger problem will come from the demand side of the equation when the global economy enters, or even just flirts with, a recession. Put simply, because of massive demand destruction, there has never been a modern era recession or sharp slowdown in which the oil price did not collapse (Chart I-5 - Chart I-10). Chart I-5In The Early 80s Recession, Oil Collapsed By -30 Percent
In The Early 80s Recession, Oil Collapsed By -30 Percent
In The Early 80s Recession, Oil Collapsed By -30 Percent
Chart I-6In The Early 90s Recession, Oil Collapsed By -60 Percent
In The Early 90s Recession, Oil Collapsed By -60 Percent
In The Early 90s Recession, Oil Collapsed By -60 Percent
Chart I-7In The 2000 Dot Com Bust, Oil Collapsed By ##br##-55 Percent
In The 2000 Dot Com Bust, Oil Collapsed By -55 Percent
In The 2000 Dot Com Bust, Oil Collapsed By -55 Percent
Chart I-8In The 2008 Global Financial Crisis, Oil Collapsed By -75 Percent
In The 2008 Global Financial Crisis, Oil Collapsed By -75 Percent
In The 2008 Global Financial Crisis, Oil Collapsed By -75 Percent
Chart I-9In The 2015 EM Recession, Oil Collapsed By ##br##-60 Percent
In The 2015 EM Recession, Oil Collapsed By -60 Percent
In The 2015 EM Recession, Oil Collapsed By -60 Percent
Chart I-10In The 2020 Pandemic, Oil Collapsed By ##br##-75 Percent
In The 2020 Pandemic, Oil Collapsed By -75 Percent
In The 2020 Pandemic, Oil Collapsed By -75 Percent
Furthermore, as we explained in Oil Is The Accessory To The Murder, a preceding surge in the oil price is a remarkably consistent ‘straw that breaks the camel’s back’, tipping an already fragile economy over the brink into recession. Meaning that the oil price ends up in a symmetrical undershoot to its preceding overshoot. The result being a massive drawdown in the oil price in every modern era recession or sharp slowdown. Specifically: Early 80s recession: -30 percent Early 90s recession: -60 percent 2000 dot com bust: -55 percent 2008 global financial crisis: -75 percent 2015 EM recession: -60 percent 2020 pandemic: -75 percent What about the 1970s episode – isn’t this the counterexample in which the oil price remained stubbornly high despite a recession? No, even in the 1974 recession, the oil price fell by -25 percent. Moreover, the commonly cited explanation for the elevated nominal price of oil through the 70s is a misreading of history. The popular narrative blames OPEC supply cutbacks related to geopolitical events – especially the US support for Israel in the Arab-Israel war of October 1973. As neat and popular as this narrative is, it ignores the real culprit: the collapse in August 1971 of the Bretton Woods ‘pseudo gold standard’, which severed the fixed link between the US dollar and quantities of commodities. To maintain the real value of oil, OPEC countries were raising the price of crude oil just to play catch up. Meaning that while geopolitical events may have influenced the precise timing and magnitude of price hikes, OPEC countries were just ‘staying even’ with the collapsing real value of the US dollar, in which oil was priced. In terms of gold, in which oil was effectively priced before 1971, the oil price was no higher in 1980 than in 1971! (Chart I-11) Chart I-11Priced In Gold, The Oil Price Was No Higher In 1980 Than in 1971!
Priced In Gold, The Oil Price Was No Higher In 1980 Than in 1971!
Priced In Gold, The Oil Price Was No Higher In 1980 Than in 1971!
Shorting Oil And Oil Plays Will Be Very Rewarding For Patient Investors The four most dangerous words in investment are ‘this time is different’. Today, the oil bulls insist that this time really is different because of an unprecedented structural underinvestment in fossil fuel extraction. Leaving the precariously tight oil market vulnerable to the slightest uptick in demand, or downtick in supply. Maybe. But to reiterate, in a recession, the massive destruction of oil demand always overwhelms a tight supply. In this important regard, this time will not be different. Taking the median drawdown of the last six recessions of 60 percent, and applying it to the post-invasion peak of $130, it implies that, in the coming recession, oil will plunge to $55. In a recession, the massive destruction of oil demand always overwhelms a tight supply. Of course, this is the average of a range of recession outcomes, with the best case being $85 and the worst case being $30. Still, this means that patient investors who short oil can look forward to substantial gains. Alternatively, those who want a hedged position should short oil versus copper – especially as oil versus copper is now at the top of its 25-year trading channel (Chart I-12). Chart I-12Oil Versus Copper Is At The Top Of Its 25-Year Trading Channel
Oil Versus Copper Is At The Top Of Its 25-Year Trading Channel
Oil Versus Copper Is At The Top Of Its 25-Year Trading Channel
Equity investors should underweight the oil sector versus basic resources (Chart I-13) and/or versus industrials and/or versus banks, and underweight oil-heavy stock markets such as Norway (Chart I-14). Chart I-13Underweight Oil Versus Basic Resources
Underweight Oil Versus Basic Resources
Underweight Oil Versus Basic Resources
Chart I-14Underweight Oil-Heavy Stock Markets Such As Norway
Underweight Oil-Heavy Stock Markets Such As Norway
Underweight Oil-Heavy Stock Markets Such As Norway
Suffice to say, these are all correlated trades. They will all work, or they will all not work. But to repeat, this time is never different. Fractal Trading Watchlist Confirming the fundamental arguments to underweight oil plays, the spectacular recent outperformance of oil equities versus both industrials and banks has reached the point of fragility on its 260-day fractal structures that has reliably signalled previous turning points (Chart I-15). Chart I-15The Outperformance Of Oil Versus Industrials Is Exhausted
The Outperformance Of Oil Versus Industrials Is Exhausted
The Outperformance Of Oil Versus Industrials Is Exhausted
We are adding oil versus banks to our watchlist, with this week’s recommendation being to underweight oil versus industrials, setting a profit target and symmetrical stop-loss of 10 percent, with a maximum holding period of 6 months. Fractal Trading Watchlist: New Additions The Outperformance Of Oil Versus Banks Is Exhausted
The Outperformance Of Oil Versus Banks Is Exhausted
The Outperformance Of Oil Versus Banks Is Exhausted
Chart 1BRL/NZD At A Resistance Point
BRL/NZD At A Resistance Point
BRL/NZD At A Resistance Point
Chart 2Homebuilders Versus Healthcare Services Has Turned
Homebuilders Versus Healthcare Services Has Turned
Homebuilders Versus Healthcare Services Has Turned
Chart 3CNY/USD At A Potential Turning Point
CNY/USD Has Reversed
CNY/USD Has Reversed
Chart 4US REITS Are Oversold Versus Utilities
US REITS Are Oversold Versus Utilities
US REITS Are Oversold Versus Utilities
Chart 5CAD/SEK Is Vulnerable To Reversal
CAD/SEK Reversal Has Started
CAD/SEK Reversal Has Started
Chart 6Financials Versus Industrials Has Reversed
Financials Versus Industrials To Reverse
Financials Versus Industrials To Reverse
Chart 7The Outperformance Of Resources Versus Biotech Has Ended
The Outperformance Of Resources Versus Biotech Has Started To Reverse
The Outperformance Of Resources Versus Biotech Has Started To Reverse
Chart 8The Outperformance Of Resources Versus Healthcare Has Ended
The Outperformance Of Resources Versus Healthcare Is Vulnerable To Reversal
The Outperformance Of Resources Versus Healthcare Is Vulnerable To Reversal
Chart 9FTSE100 Outperformance Vs. Euro Stoxx 50 Is Vulnerable To Reversal
FTSE100 Outperformance Vs. Euro Stoxx 50 Is Reversing
FTSE100 Outperformance Vs. Euro Stoxx 50 Is Reversing
Chart 10Netherlands' Underperformance Vs. Switzerland Is Ending
Netherlands Underperformance Vs. Switzerland Has Been Exhausted
Netherlands Underperformance Vs. Switzerland Has Been Exhausted
Chart 11The Sell-Off In The 30-Year T-Bond At Fractal Fragility
The Sell-Off In The 30-Year T-Bond Is Approaching Fractal Fragility
The Sell-Off In The 30-Year T-Bond Is Approaching Fractal Fragility
Chart 12The Sell-Off In The NASDAQ Is Approaching Fractal Fragility
The Sell-Off In The NASDAQ Is Approaching Fractal Fragility
The Sell-Off In The NASDAQ Is Approaching Fractal Fragility
Chart 13Food And Beverage Outperformance Is Exhausted
Food And Beverage Outperformance Has Been Exhausted
Food And Beverage Outperformance Has Been Exhausted
Chart 14German Telecom Outperformance Vulnerable To Reversal
AT REVERSAL
AT REVERSAL
Chart 15Japanese Telecom Outperformance Vulnerable To Reversal
AT REVERSAL
AT REVERSAL
Chart 16The Strong Downtrend In The 18-Month-Out US Interest Rate Future Has Ended
The Strong Trend In The 18-Month-Out US Interest Rate Future Is Fragile
The Strong Trend In The 18-Month-Out US Interest Rate Future Is Fragile
Chart 17The Strong Downtrend In The 3 Year T-Bond Is Fragile
The Strong Trend In The 3 Year T-Bond Is Fragile
The Strong Trend In The 3 Year T-Bond Is Fragile
Chart 18A Potential Switching Point From Tobacco Into Cannabis
A Potential Switching Point From Tobacco Into Cannabis
A Potential Switching Point From Tobacco Into Cannabis
Chart 19Biotech Is A Major Buy
Biotech Is A Major Buy
Biotech Is A Major Buy
Chart 20Norway's Outperformance Has Ended
Norway's Outperformance Could End
Norway's Outperformance Could End
Chart 21Cotton Versus Platinum Has Reversed
Cotton's Outperformance Is Vulnerable To Reversal
Cotton's Outperformance Is Vulnerable To Reversal
Chart 22Switzerland's Outperformance Vs. Germany Has Ended
Fractal Trading Watch List
Fractal Trading Watch List
Chart 23USD/EUR Is Vulnerable To Reversal
The Rally In USD/EUR Could End
The Rally In USD/EUR Could End
Chart 24The Outperformance Of MSCI Hong Kong Versus China Has Ended
The Outperformance Of MSCI Hong Kong Versus China Is Vulnerable To Reversal
The Outperformance Of MSCI Hong Kong Versus China Is Vulnerable To Reversal
Chart 25A Potential New Entry Point Into Petcare
A Potential New Entry Point Into Petcare
A Potential New Entry Point Into Petcare
Chart 26GBP/USD At A Potential Turning Point
GBP/USD At A Turning Point
GBP/USD At A Turning Point
Chart 27US Utilities Outperformance Vulnerable To Reversal
Fractal Trading Watch List
Fractal Trading Watch List
Chart 28The Outperformance Of Oil Versus Banks Is Exhausted
Fractal Trading Watch List
Fractal Trading Watch List
Dhaval Joshi Chief Strategist dhaval@bcaresearch.com Fractal Trading System Fractal Trades
Why Oil Is Headed To $55
Why Oil Is Headed To $55
Why Oil Is Headed To $55
Why Oil Is Headed To $55
6-Month Recommendations Structural Recommendations Closed Fractal Trades Indicators To Watch - Bond Yields Chart II-1Indicators To Watch - Bond Yields - Euro Area
Indicators To Watch - Bond Yields - Euro Area
Indicators To Watch - Bond Yields - Euro Area
Chart II-2Indicators To Watch - Bond Yields - Europe Ex Euro Area
Indicators To Watch - Bond Yields - Europe Ex Euro Area
Indicators To Watch - Bond Yields - Europe Ex Euro Area
Chart II-3Indicators To Watch - Bond Yields - Asia
Indicators To Watch - Bond Yields - Asia
Indicators To Watch - Bond Yields - Asia
Chart II-4Indicators To Watch - Bond Yields - Other Developed
Indicators To Watch - Bond Yields - Other Developed
Indicators To Watch - Bond Yields - Other Developed
Indicators To Watch - Interest Rate Expectations Chart II-5Indicators To Watch - Interest Rate Expectations
Indicators To Watch - Interest Rate Expectations
Indicators To Watch - Interest Rate Expectations
Chart II-6Indicators To Watch - Interest Rate Expectations
Indicators To Watch - Interest Rate Expectations
Indicators To Watch - Interest Rate Expectations
Chart II-7Indicators To Watch - Interest Rate Expectations
Indicators To Watch - Interest Rate Expectations
Indicators To Watch - Interest Rate Expectations
Chart II-8Indicators To Watch - Interest Rate Expectations
Indicators To Watch - Interest Rate Expectations
Indicators To Watch - Interest Rate Expectations
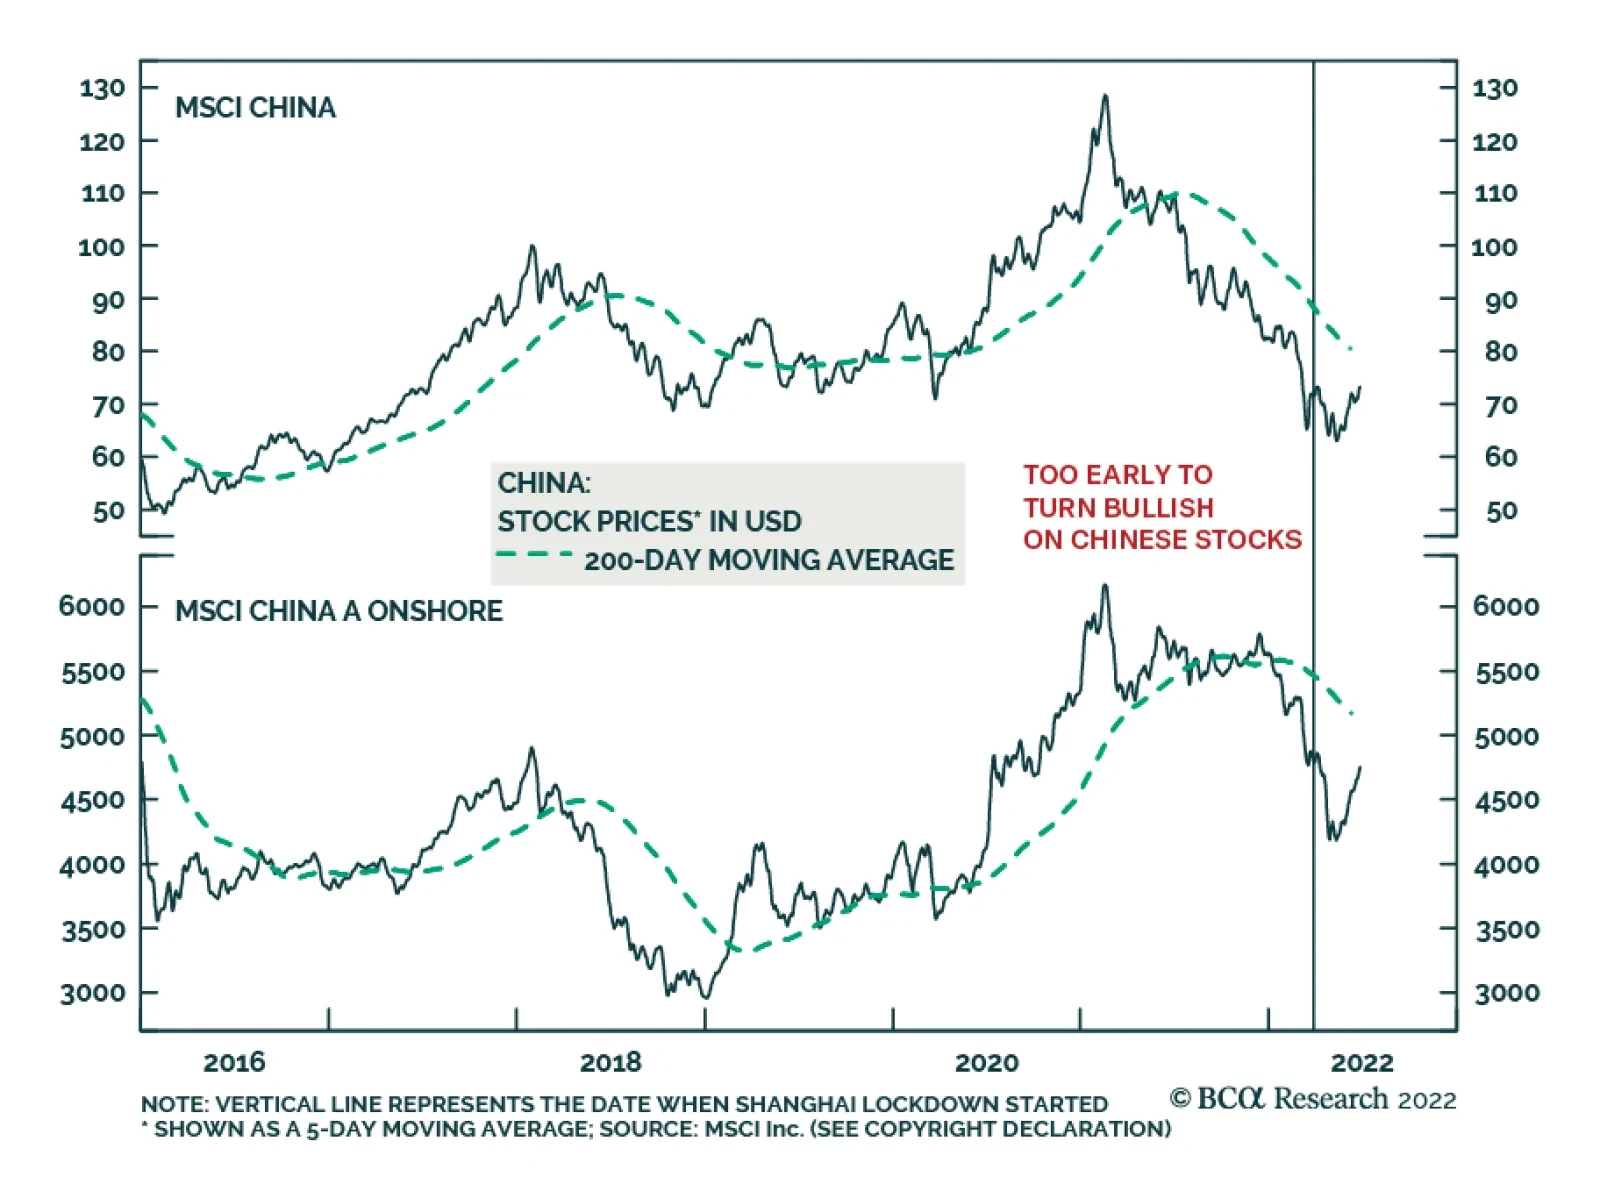
BCA Research’s China Investment Strategy service continues to recommend a neutral stance in Chinese equities within a global portfolio. China’s economic data moved up slightly in May from an extremely depressed level in April. A normalization of the supply…
Executive Summary Depressing Housing Market And Service Sector Activity
Depressing Housing Market And Service Sector Activity
Depressing Housing Market And Service Sector Activity
May’s economic data ticked up from extremely depressed levels in April, driven by a normalization in the supply chain and a resumption in production. The service sector and housing market continued to shrink on a year-on-year (YOY) basis and sentiment among households and corporates remains lackluster. The rebound in exports growth in May will likely be unsustainable. Chinese exports are set to contract from 2021 as external demand for goods weakens. The rapidly worsening labor market dynamics reinforce households’ unwillingness to consume and hence, will hinder the recovery in household consumption. Although industrial production showed a decent rebound in May, the manufacturing production recovery might be derailed by rolling lockdowns and prolonged logistic bottlenecks. Barring major lockdowns, China’s economy will likely improve in 2H 2022 from the very low base in Q2. That said, the country’s economic recovery faces several challenges and the magnitude of the rebound will be subdued. Bottom Line: The elements for a robust and sustainable recovery in the Chinese economy are not yet in place. The recent rally in the A-share market reflects a mean-reversal to the pre-March lockdown price level, rather than the beginning of a cyclical bull market. Investors should remain cautious on Chinese equities in the next several months. Feature China’s economic data moved up slightly in May from an extremely depressed level in April. A normalization of the supply chain and a resumption of production post-lockdown in Shanghai and other cities led to a modest recovery in business activities. However, indicators from the service sector and housing market continued to shrink on a YOY basis, highlighting persistent weaknesses on the demand side. Chart 1Import Dynamics Reflect Weak Domestic Demand
Import Dynamics Reflect Weak Domestic Demand
Import Dynamics Reflect Weak Domestic Demand
May’s import data also reflects sluggish domestic demand. The increase in imports value from a year ago was largely driven by the elevated prices in energy and agriculture products. China’s imports in May, in volume terms, continued to contract on a YOY basis, albeit improved from its historical low in April (Chart 1). Barring major lockdowns, China’s economy will likely improve in the second half of this year. However, the economic recovery in 2H 2022 will be very subdued due to the following challenges: Downbeat sentiment among households and enterprises; Continued real estate woes; A contraction in exports; Deteriorating labor market conditions; and Risk of rolling lockdowns and persistent logistic bottlenecks. The recent rebound in the A-share market reflects an improvement in investors’ sentiment buttressed by the easing of lockdowns and a resumption of production. In other words, the rebound in Chinese stock prices is probably a mean-reversal to pre-lockdown levels, rather than a sustainable rally (Chart 2). Our cautious view on Chinese equities is also corroborated by the divergence between falling raw industrial prices, which reflect weak China’s growth, and rising Chinese equity prices (Chart 3). Overall, we continue to recommend a neutral stance in Chinese equities within a global portfolio. Chart 2Too Early To Turn Bullish On Chinese Stocks
Too Early To Turn Bullish On Chinese Stocks
Too Early To Turn Bullish On Chinese Stocks
Chart 3Falling Prices In Raw Materials Do Not Signal An Imminent Round In Demand
Falling Prices In Raw Materials Do Not Signal An Imminent Round In Demand
Falling Prices In Raw Materials Do Not Signal An Imminent Round In Demand
Qingyun Xu, CFA Associate Editor qingyunx@bcaresearch.com Downbeat Household And Corporate Sentiment Chart 4Subdued Bank Loan Growth Has Been A Drag On Credit Expansion
Subdued Bank Loan Growth Has Been A Drag On Credit Expansion
Subdued Bank Loan Growth Has Been A Drag On Credit Expansion
Although China’s credit growth improved sequentially in May after a very weak reading in April, the magnitude of May’s credit rebound is much more subdued compared with the months following the first lockdowns in early 2020 (Chart 4). In addition, May’s rebound in credit growth was mainly driven by an acceleration in local government bond issuance. The modest pickup in the credit impulse - calculated as a 12-month change in total social financing (TSF) as a percentage of nominal GDP - is much more muted when excluding local government bond issuance (Chart 5). Furthermore, as noted in our previous report, given that most of the planned local government special purpose bonds (SPBs) will be issued by the end of June, barring any increase in this year’s SPBs quota, the support from local government bond issuance to TSF growth will likely wane significantly in the second half of 2022. Meanwhile, confidence among consumers and businesses remained downbeat through May (Chart 6). The poor private-sector sentiment will continue to dampen credit demand and thus, limit the effectiveness of monetary stimulus. Chart 5The Rebound In Credit Impulse Is Much More Muted When Excluding Local Government Bond Issuance
The Rebound In Credit Impulse Is Much More Muted When Excluding Local Government Bond Issuance
The Rebound In Credit Impulse Is Much More Muted When Excluding Local Government Bond Issuance
Chart 6Gloomy Sentiment Among Chinese Households And Enterprises
Gloomy Sentiment Among Chinese Households And Enterprises
Gloomy Sentiment Among Chinese Households And Enterprises
Private-sector credit demand remains very frail. Household medium- to long-term loans are still contracting from previous month, while bank loans to corporate peers were also weak in May (Chart 7 & 8). Chart 7Depressed Household Loan Demand
Depressed Household Loan Demand
Depressed Household Loan Demand
Chart 8Corporate Demand For Credit Remains Weak Despite Accommodative Monetary Conditions
Corporate Demand For Credit Remains Weak Despite Accommodative Monetary Conditions
Corporate Demand For Credit Remains Weak Despite Accommodative Monetary Conditions
Chart 9Deterioration In Corporate Sentiment Is Also Reflected In Surveys of Business Conditions
Deterioration In Corporate Sentiment Is Also Reflected In Surveys of Business Conditions
Deterioration In Corporate Sentiment Is Also Reflected In Surveys of Business Conditions
On the other hand, corporate bill financing as a portion of new bank loans, although rolled over from April’s record high, remained very elevated through May (Chart 8, bottom panel). Moreover, enterprises’ financing and investment expectations deteriorated further in May (Chart 9). Persisting Real Estate Woes The near-term outlook for China’s property market remains uninspiring. So far, easing measures in the housing sector have not been successful in reviving home sales and homebuyers’ sentiment. Residential property sales and real estate investment growth ticked up slightly in May after plummeting by 43% and 10% in April, respectively (Chart 10). However, the modest improvement in May does not mark the start of a full-fledged cyclical recovery. High-frequency data show a renewed weakening in floor space sales, particularly in tier-one and tier-two cities, during the first two weeks of June (Chart 11). Chart 10The Slight Improvement In Housing Market Indicators Does Not Signal A Cyclical Recovery
The Slight Improvement In Housing Market Indicators Does Not Signal A Cyclical Recovery
The Slight Improvement In Housing Market Indicators Does Not Signal A Cyclical Recovery
Chart 11Renewed Deterioration In Home Sales In June
Renewed Deterioration In Home Sales In June
Renewed Deterioration In Home Sales In June
Chart 12Real Estate Developers' Decreased Funding Will Further Dampen Housing Construction Activities
Real Estate Developers' Decreased Funding Will Further Dampen Housing Construction Activities
Real Estate Developers' Decreased Funding Will Further Dampen Housing Construction Activities
Funds to real estate developers have been contracting at the fastest rate since data collection began in 1998. The lack of funding for real estate developers will further depress housing construction activities in the near term (Chart 12). Moreover, new home prices, which tend to lead housing starts, started to decrease on a YOY basis in May. This was the first price contraction since 2016. Our housing price diffusion index suggests that home price growth will continue to shrink in the next six to nine months (Chart 13). Many local cities reduced mortgage rates, by anywhere from 15 to more than 100 basis points, after the PBoC lowered mortgage rate floor and the benchmark rate (5-year LPR) in May. However, the average cost of mortgage loans remains higher than households’ income growth, making mortgage borrowing less attractive to ordinary households (Chart 14). Chart 13Housing Prices Are Set To Decline Further In 2H 2022
Housing Prices Are Set To Decline Further In 2H 2022
Housing Prices Are Set To Decline Further In 2H 2022
Chart 14Mortgage Rates Have Dropped, But Still Higher Than Income And Home Price Growth
Mortgage Rates Have Dropped, But Still Higher Than Income And Home Price Growth
Mortgage Rates Have Dropped, But Still Higher Than Income And Home Price Growth
In addition, the widening gap between the average mortgage rate and the pace of housing price appreciation implies that housing has become much less appealing to residents who purchase homes as investment (Chart 14, bottom panel). In short, property purchases will remain weak given neither “to live in” nor investment demand for properties is likely to recover fast. China's Exports Are Set To Contract In 2H 2022 China’s exports rebounded in May from the April low as supply chain interruptions subsided and logistic disruptions began to ease. However, as US and European consumer spending on goods (excluding autos) declines, Chinese shipments will shrink in the months ahead. May’s improvement in suppliers’ delivery times and product inventory subindexes of China’s official Purchasing Managers’ Index (PMI) suggests that logistics were less of a drag on economic activity than in April (Chart 15). In addition, Shanghai and China’s exports freight indexes recovered significantly on a month-over-month basis (Chart 16) with the lifting of lockdown measures. Chart 15Chinese Logistics Pressures Have Eased Slightly In May...
Chinese Logistics Pressures Have Eased Slightly In May...
Chinese Logistics Pressures Have Eased Slightly In May...
Chart 16...And Export Freight Indices Have Rebounded
...And Export Freight Indices Have Rebounded
...And Export Freight Indices Have Rebounded
Chart 17Global Demand Is Dwindling
Global Demand Is Dwindling
Global Demand Is Dwindling
Meanwhile, global demand for goods has been weakening. Korean exports volume growth, a bellwether for global trade, has been trending down since late 2021 (Chart 17). Moreover, the US and Euro Area manufacturing PMIs have been falling (Chart 17, bottom panel). Spending in developed economies is shifting from manufactured goods to services. Retail inventories in the US are well above their pre-pandemic trend, suggesting that the demand growth for Chinese goods will dwindle when US retailers start to destock their inventories (Chart 18). Falling US and Euro Area real household disposable income will also reinforce the downward trend in external demand (Chart 19). Therefore, China's exports are set to shrink in the second half of this year. Chart 18Well-Stocked Shelves In The US Bode Poorly For Chinese Export Demand
Well-Stocked Shelves In The US Bode Poorly For Chinese Export Demand
Well-Stocked Shelves In The US Bode Poorly For Chinese Export Demand
Chart 19A Contraction in US and Euro Area Household Real Disposable Income
A Contraction in US and Euro Area Household Real Disposable Income
A Contraction in US and Euro Area Household Real Disposable Income
Deteriorating Labor Market Conditions Will Curb Household Consumption Recovery Although improved from April’s extreme low, Chinese retail sales and service activity remained in contractionary territory in May, highlighting sluggish household demand (Chart 20). In addition, the cinema audience, which is used to gauge the impact of the pandemic on the service sector, indicates a further deterioration in the sector’s activity in June (Chart 20, bottom panel). The lackluster consumer demand is also evidenced by soft core and service consumer prices (CPI) in May (Chart 21). Chart 20Chinese Retail Sales And Service Activity Continued To Contract In May
Chinese Retail Sales And Service Activity Continued To Contract In May
Chinese Retail Sales And Service Activity Continued To Contract In May
Chart 21Soft Core And Service CPIs Also Reflect Lackluster Household Demand
Soft Core And Service CPIs Also Reflect Lackluster Household Demand
Soft Core And Service CPIs Also Reflect Lackluster Household Demand
Labor market conditions have also worsened. Although the nationwide urban survey-based unemployment rate fell moderately in May, the 31-large city surveyed unemployment rate climbed to an all-time high in the 10-year history of this survey. Moreover, employment in the service sector deteriorated to the worst level since mid-2020 (Chart 22). Furthermore, urban new job creation fell into deep shrinkage on a YOY basis, while the unemployment rate among younger workers rose to the highest point since data collection began in 2018 (Chart 23). Chart 22Labor Market Situation Is Worsening Rapidly...
Labor Market Situation Is Worsening Rapidly...
Labor Market Situation Is Worsening Rapidly...
Chart 23...Particularly Among Younger Workers
...Particularly Among Younger Workers
...Particularly Among Younger Workers
Chart 24Weak Sentiment On Future Income Contributes To Households' Unwillingness To Consume
Weak Sentiment On Future Income Contributes To Households' Unwillingness To Consume
Weak Sentiment On Future Income Contributes To Households' Unwillingness To Consume
The rapidly worsening labor market dynamics and income prospects reinforce households’ downbeat sentiment (Chart 24). The latter will impede household consumption recovery in the second half of this year. Production Recovery Faces Risks Of Persistent Logistic Bottlenecks The uptick in industrial activity in May was due to a lifting of Covid-related lockdown restrictions. Although industrial production showed a decent rebound, underlying data suggest that economic fundamentals remained subdued. Chart 25Industrial Activity Improved Only Slightly In May
Industrial Activity Improved Only Slightly In May
Industrial Activity Improved Only Slightly In May
Chart 26Construction Material Production Continues To Shrink On A YOY Basis
Construction Material Production Continues To Shrink On A YOY Basis
Construction Material Production Continues To Shrink On A YOY Basis
Electricity output remained in contractionary territory through May (Chart 25). Cement and steel output continued shrinking from the same period last year (Chart 26). Moreover, their prices have been falling even though production growth has been waning, which indicates that demand in the construction sector is depressed (Chart 3, bottom panel). Consumer durable goods production also remains well below their levels from a year ago (Chart 27 & 28). Chart 27Auto And Smartphone Production Keeps Decreasing From A Year Ago...
Auto And Smartphone Production Keeps Decreasing From A Year Ago...
Auto And Smartphone Production Keeps Decreasing From A Year Ago...
Chart 28… As Well As Production Of Home Appliances
...As Well As Production Of Home Appliances
...As Well As Production Of Home Appliances
Chart 29Prolonged Logistic Bottlenecks
Prolonged Logistic Bottlenecks
Prolonged Logistic Bottlenecks
Chinese manufacturing investment rebounded in May. However, since exports will likely shrink in the second half of this year, it will create a major headwind for manufacturing investment and output. Moreover, China’s manufacturing production will likely be challenged by persistent logistic bottlenecks in 2H 2022. Chinese road freight was still declining in the first three weeks in June from the same period last year as shown in Chart 29. The risk of renewed Covid-induced lockdowns or mobility restrictions are nontrivial since China will maintain its zero-Covid policy at least through the end of this year. Table 1China Macro Data Summary
A Muted Post-Lockdown Recovery Ahead
A Muted Post-Lockdown Recovery Ahead
Table 2China Financial Market Performance Summary
A Muted Post-Lockdown Recovery Ahead
A Muted Post-Lockdown Recovery Ahead
Footnotes Strategic Themes Cyclical Recommendations
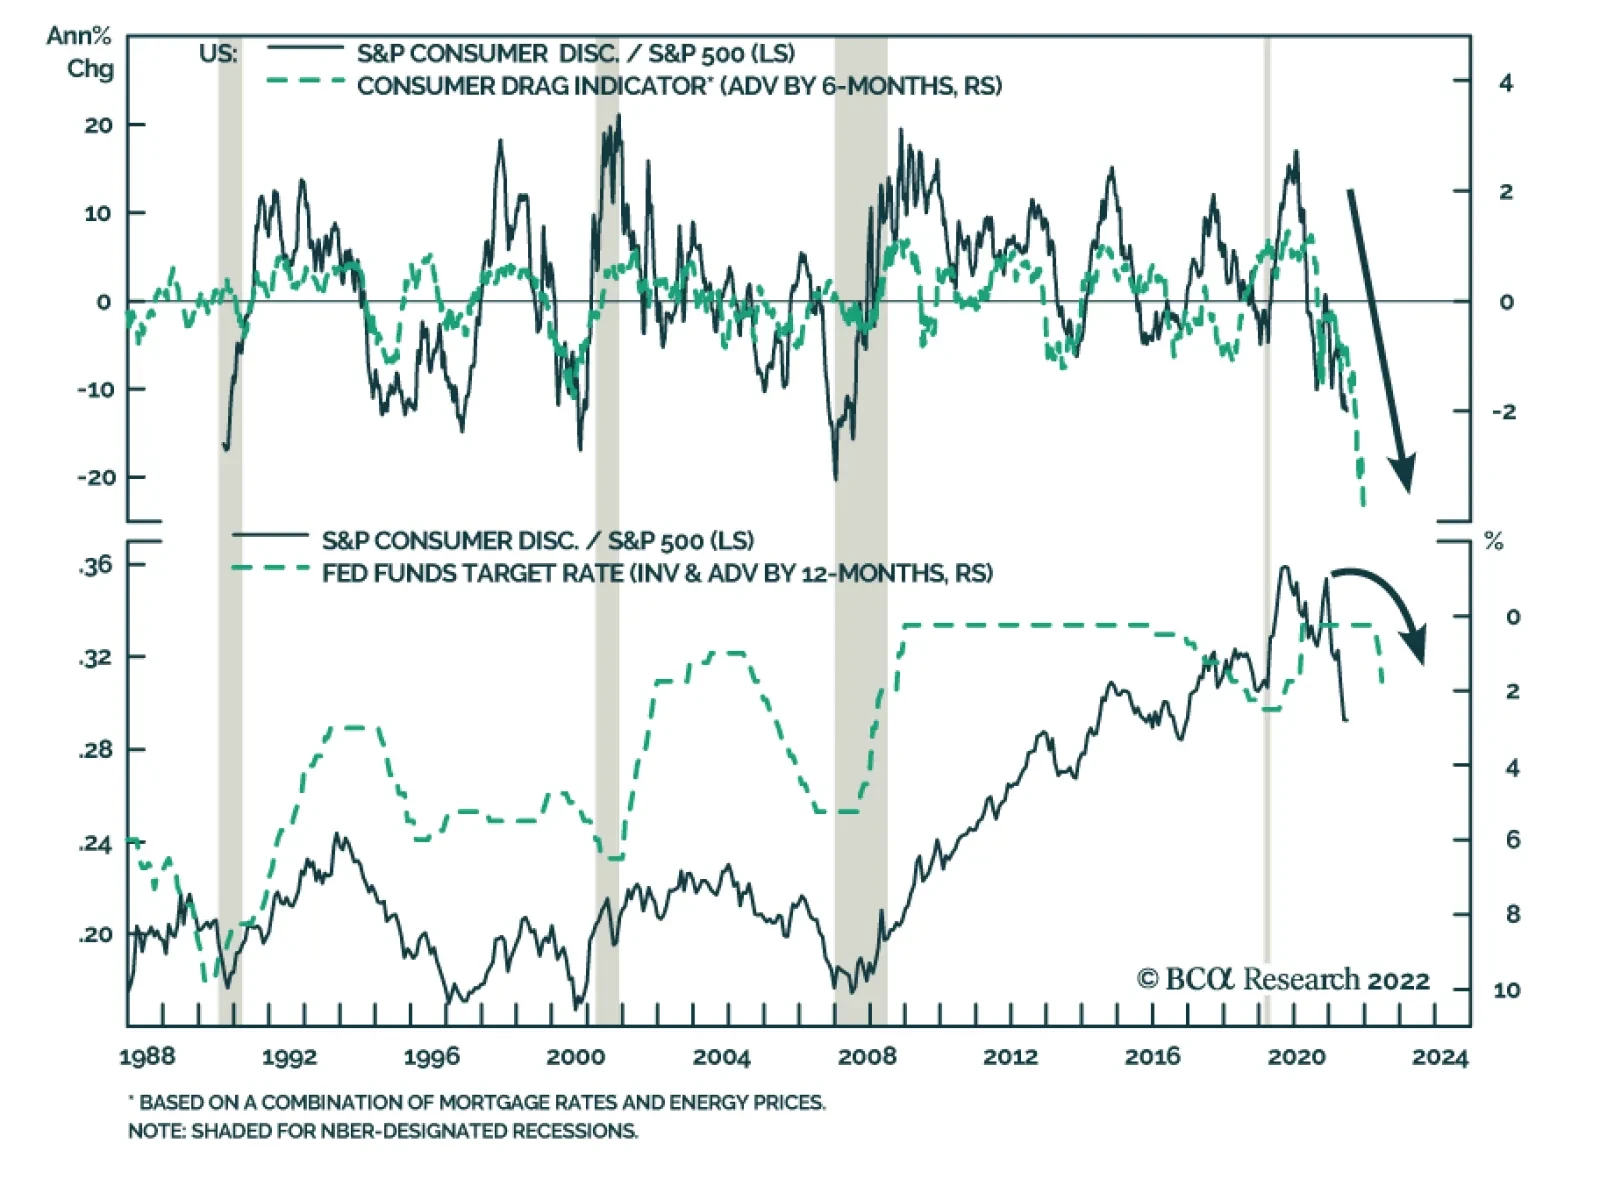
Our US equity team has been among the more cautious within BCA Research. They recently highlighted that they expect persistent inflationary pressures, aggressive monetary tightening, and the withdrawal of liquidity to weigh down on US stocks. Cyclical sectors…