Equities

Executive Summary Small Do Poorly During The Slowdown Phase
Will Small Get Even Smaller?
Will Small Get Even Smaller?
Small Caps are a more cyclical and high-octane version of Large Caps. Small underperforms Large during the slowdown stage of the business cycle. The yield curve is flattening and is close to inversion – a signal that does not bode well for the outperformance of Small vs. Large either. Rising high-yield spreads are a bad omen for the outperformance of small caps. Small caps are incredibly cheap both in real and absolute terms. They are also oversold. The profitability of both small and large companies is under pressure, but small companies have fewer resources and are less resilient. Earnings growth estimates for both Large and Small are unrealistically high and misleading. We expect an earnings recession, and negative earnings growth is likely for both asset classes. Bottom Line: Small caps are a more cyclical, lower quality, high-octane asset class than Large caps and face significant macroeconomic headwinds from slowing economic growth. We recommend underweighting Small relative to Large, despite attractive valuations, until macroeconomic uncertainty dissipates, inflation turns, and earnings deceleration gets priced in. Feature In the front section of our June 6, Style Chart Pack, we upgraded Growth and downgraded Value both to equal weight, making the case that Growth vs Value divergence in performance has likely run its course – with economic growth slowing, companies with strong fundamentals and stable earnings are much more valuable. We also stated that once macroeconomic uncertainty dissipates, we will be able to pounce and shift Growth to overweight, and Value to underweight. In this week’s report, we will revisit our overweight Small/underweight Large allocation – a position that has been bleeding red ink since November. The question on our mind is what to do with an underperforming position – be patient or have losses? We ground this report in an analysis we conducted a year ago in the “Is It A Small World After All” report. Sneak Preview: The macroeconomic backdrop for Small is unfavorable, and its earnings growth is about to decelerate – yet much of the bad news is already priced in. However, Small is unlikely to outperform in a sustainable way until inflation turns, and economic uncertainty dissipates. We shift Small to underweight and Large to overweight. Premise For Our Call Last Fall We will start this report by reviewing the history of the call. We upgraded the allocation of Small vs. Large to overweight, making a case based on valuations, strong earnings growth, and demonstrated ability to outperform under duress. We also relied on the empirical analysis that showed that Small held its own in the environment of rising rates. In the “2022 Outlook” report, we highlighted risks to our call. We quote: ”If economic growth disappoints, and the yield curve continues its relentless flattening, signifying a Fed policy mistake or the onset of another COVID Greek, Small is bound to underperform. Margins are narrow and continued cost pressures, especially surging labor costs, have the potential to dent small caps’ profitability. Yet, on a balance of probabilities of such an outcome vs. attractive valuations and fundamentals, this is a risk we are willing to take.” Unfortunately, most of the risks we highlighted have come to pass. Since October 4, the S&P 600 has underperformed the S&P 500 by 5.5%, with most losses accumulating between December and February (Chart 1). Small is down 26% off its peak in November, 2021. However, recently its relative performance has stabilized (Table 1). What’s next? Chart 1Small Outperformed On The Back of Post-Covid Recovery, But Has Been Lagging Ever Since
Small Outperformed On The Back of Post-Covid Recovery, But Has Been Lagging Ever Since
Small Outperformed On The Back of Post-Covid Recovery, But Has Been Lagging Ever Since
Table 1Performance Summary
Will Small Get Even Smaller?
Will Small Get Even Smaller?
Small Vs. Large Sector Composition The differences in sector composition of the S&P 500 vs. the S&P 600 have profound implications for relative performance during different stages of the business cycle and various macroeconomic regimes. On a sector level, Small has a higher allocation to Financials, Industrials, and Real Estate, while Large has more weight in Technology and Healthcare (Chart 2). Chart 2Small Vs. Large Sector Breakdown
Will Small Get Even Smaller?
Will Small Get Even Smaller?
By grouping sectors into the cyclical vs. defensive categories, we observe that Small has a lower allocation to Defensives, and a higher allocation to Cyclicals: The Cyclical/Defensive gap between the asset classes is roughly 18%. This also indicates that Small has higher operating leverage than Large. Small is also overweight early cyclical sectors by 8% (Chart 3), which explains the underperformance of small-capitalization stocks at times of strain (corrections, economic contraction, a risk-off environment), as well as the “out-of-the-gate” behavior during recoveries and bear market rallies. Small’s higher weight in Financials increases its sensitivity to the slope of the yield curve. Chart 3Small Vs. Large Style Breakdown
Will Small Get Even Smaller?
Will Small Get Even Smaller?
Bottom Line: Small is a more cyclical and high-octane version of Large. Macroeconomic Backdrop Nothing matters more for the relative performance of Small vs. Large than a macroeconomic backdrop that highlights differences in sector composition, credit quality, and intrinsic profitability of these asset classes. Large Caps Reign During The Slowdown Stage Of The Business Cycle The May inflation surprise has solidified the Fed’s resolve to fight inflation, which it executes by aggressive tightening of monetary conditions. A tighter monetary policy is designed to slow economic growth and curtail demand (Chart 4). As we have written over the past several months, US economic growth is already slowing and is surprising on the downside (Chart 5). Bloomberg consensus expects the economy to grow at 2.5% over the next 12 months, which is a sharp slowdown from 2021. Chart 4Financial Conditions Are Tight...
Financial Conditions Are Tight...
Financial Conditions Are Tight...
Chart 5...And Economic Growth Is Slowing
...And Economic Growth Is Slowing...
...And Economic Growth Is Slowing...
Small caps tend to underperform larger companies during the slowdown stage of the business cycle (Chart 6) due to their overweight in Early Cyclicals and shortage of Defensive Growth. In addition, slower economic growth hits smaller and less profitable companies much harder than their larger brethren. Bottom Line: Small underperforms Large during the slowdown stage of the business cycle. Chart 6Small Do Poorly During The Slowdown Phase
Will Small Get Even Smaller?
Will Small Get Even Smaller?
Yield Curve Flattening Is Unfavorable For The Outperformance Of Small Small caps thrive in an environment of accelerating growth, which is a necessary tailwind for smaller, younger, and less profitable companies. A flatter yield curve signals upcoming growth deceleration, which is a drop of poison in the outlook for Small (Chart 7). In addition, small caps have a higher allocation to regional banks, which are extremely sensitive to the shape of the yield curve. The spread between the borrowing rate (the short-term rate on deposits) and the lending rate (on long-term loans) is the source of profitability and determines the bank’s net income margins. Prior empirical analysis validates this: During periods of a flattening yield curve, Small underperformed Large over the following three months (Chart 8). Chart 7Flattening Yield Curve Drags Down Relative Performance Of Small Vs Large
Flattening Yield Curve Drags Down Relative Performance Of Small Vs Large
Flattening Yield Curve Drags Down Relative Performance Of Small Vs Large
Chart 8Small Underperforms When Yield Curve Is Flattening
Will Small Get Even Smaller?
Will Small Get Even Smaller?
Recently the Treasury 10-2Y curve has flattened, coming down from 0.9% in January to 0.1% by the end of June, and is dangerously close to inversion, which is a classical predictor of a looming recession. Bottom Line: The yield curve is flattening and is close to inversion – a signal that does not bode well for the outperformance of Small vs. Large. HY Spreads Also Signal Underperformance Another important signal for Small vs. Large is the direction of change in HY spreads. Small caps are riskier and more leveraged than their large-cap peers (Chart 9). Not surprisingly, they also tend to have lower credit ratings: Indeed, the median rating for a small-cap stock is B+, which falls straight into the high-yield territory. As a result, the fate of small caps is closely tied to that of HY debt and is linked to both its spreads and its default trends. Higher yields and higher defaults would be a sign of distress for the small-cap universe. Therefore, the relative performance of small caps is inversely correlated to HY spreads (Chart 10A). Chart 9Small Caps Are More Leveraged Than Large Caps
Small Caps Are More Leveraged Than Large Caps
Small Caps Are More Leveraged Than Large Caps
Over the past several months, HY spreads have blown out from 2.8% to 5.2% and will continue widening in the near future: As the US economy is edging towards a recession, historically low default rates are likely to rise. Spreads widening off an already high level of 500 bps historically have been followed by relative underperformance of Small over the next three months 60% of the time (Chart 10B). Bottom Line: Rising high yield spreads are a bad omen for the outperformance of small caps. Chart 10ASmall Caps Performance...
Small Caps Performance...
Small Caps Performance...
Chart 10B...Is Inversely Correlated With HY Spreads
Will Small Get Even Smaller?
Will Small Get Even Smaller?
Inflation Regimes Having razor-thin margins, smaller companies hate inflation. Not only do they have difficulty budgeting and planning ahead but also they are often not able to convert sales growth into earnings growth, i.e., their costs may grow faster than their revenues. According to the most recent NFIB survey, 28% of small businesses consider inflation their biggest problem compared to 1-2% in 2019 (Chart 11). The second largest problem is labor quality concerns at 23%. Of course, these two problems are inherently interlinked, igniting a wage-price spiral. Empirical analysis of the relative performance of Small vs. Large in different inflation regimes since 1984 suggests that unless inflation rolls over, Small is likely to continue to underperform (Chart 12). Bottom Line: Small will outperform once inflation turns the corner. Until then, it will lead bear market rallies that will be spurred by hopes of falling inflation and a less hawkish Fed. Chart 11No Comments Needed
No Comments Needed
No Comments Needed
Chart 12Inflation Is A Major Headwind
Will Small Get Even Smaller?
Will Small Get Even Smaller?
Valuations And Fundamentals Small Caps’ Valuations Are At The Lowest Level In A Decade Small caps were very cheap back in October, but they have gotten even cheaper since then. Yet another example of valuation being a poor timing tool: All too often, cheap assets just keep getting cheaper, and expensive assets get more expensive. Currently, small caps trade with a nearly 30% discount to Large both on a forward and on a trailing earnings basis, while historically, a small-cap premium was more of the norm (Table 2). The small caps’ valuations have hit the lowest level in 10 years, both on an absolute and relative basis. The BCA valuations indicator is trading more than two standard deviations below its historical average (Chart 13, top panel). The BCA technical indicator signals oversold conditions (Chart 13, bottom panel). Chart 13Cheap For A Reason
Cheap For A Reason
Cheap For A Reason
Table 2Valuations Summary
Will Small Get Even Smaller?
Will Small Get Even Smaller?
Bottom Line: Small caps are incredibly cheap both in real and absolute terms. They are also oversold. Small-Cap Margins Are Under Pressure Small companies are always less profitable than their large-cap brethren as they lack economies of scale, and many of these companies are either younger or less successful than bigger companies. As a result, the margins of smaller companies are usually about 500 bps lower than those of their larger peers (Chart 14). Having thin margins, small caps don’t have much room for error in dealing with the same challenges larger companies are facing, i.e., rising costs of transportation, raw materials, and energy. Yet, it is the cost of labor, which is stickier than other components and is the largest component of cost structure, that has the potential to dent the profitability of small caps. The NFIB survey shows that 25% of small businesses intend to raise employee wages, which are growing at over 5.5%. It is not surprising, that on a net basis, nearly 25% of small companies reported declining profitability (Chart 15). Therefore, it is unsurprising that margins of Small have also started to contract. Chart 14Margins To Contract
Margins To Contract
Margins To Contract
Chart 15Profits Are Collapsing
Profits Are Collapsing
Profits Are Collapsing
Bottom Line: The profitability of both small and large companies is under pressure, but small companies have fewer resources and are less resilient. Earnings Expectations For Small Have Turned Down, Albeit From High Levels The market expects the S&P 500 and the S&P 600 to grow earnings by 10% and 13% respectively over the next 12 months (Table 3). Small is getting more analyst upgrades than Large (Chart 16). Table 3The Street's Forecasts
Will Small Get Even Smaller?
Will Small Get Even Smaller?
We concluded in the “Is Earnings Recession Likely?” report that earnings expectations are unreasonably high and don’t reconcile with the underlying economic conditions. Slowing economic growth is bound to weigh on earnings growth (Chart 17). We believe that an earnings recession is likely and estimates just do not reflect the reality on the ground and need to come down. Chart 16But Sell-side Analysts Are Optimistic
But Sell-side Analysts Are Optimistic
But Sell-side Analysts Are Optimistic
Chart 17Earnings Have Turned
Earnings Have Turned
Earnings Have Turned
Arguably, small-cap earnings growth will contract more than that of large caps, as Small is a high-octane, high-beta asset class with high exposure to cyclicals and a higher degree of operating leverage. Bottom Line: Earnings growth estimates for both Large and Small are unrealistically high and are misleading. We expect an earnings recession and negative earnings growth is likely for both asset classes. Investment Implications To sum up the analysis, we have put together a Small/Large scorecard (Table 4). Table 4Scorecard
Will Small Get Even Smaller?
Will Small Get Even Smaller?
We conclude that the macroeconomic backdrop is extremely unfavorable for Small compared to Large. Small caps tend to underperform in the environment of slowing growth as lower levels of profitability make this asset class vulnerable in a downturn. Rising high yield spreads and the increasing probability of defaults don’t bode well for Small as it is a lower-quality asset class. Inflation is also a headwind. And last, earnings expectations for both Small and Large are too high and do not reflect the reality on the ground – earnings growth will decelerate, and earnings of Small will contract further than Large. On the positive side, Small is incredibly cheap both in relative and absolute terms. It is also oversold relative to Large. It is fair to conclude that much of the adversity is already priced in, and Small is unlikely to fall much further. On the first whiff of lower inflation, Small will bounce and will outperform Large and other asset classes. However, sustainable outperformance is unlikely until inflation rolls over and monetary conditions stabilize. We believe that for patient investors with a long investment horizon, buying Small at this level is attractive. However, on a tactical basis, we will underweight Small relative to Large until macroeconomic headwinds clear. Bottom Line Small caps are a more cyclical, lower quality, high-octane asset class than Large caps and face significant macroeconomic headwinds from slowing economic growth. Their profitability is also under pressure from rising costs of raw materials and spiraling labor costs. We recommend underweighting Small relative to Large, despite attractive valuations, until macroeconomic uncertainty dissipates, inflation turns, and earnings deceleration gets priced in. We also want to highlight that Small will be a certain leader in the bear market rallies. Irene Tunkel Chief Strategist, US Equity Strategy irene.tunkel@bcaresearch.com Recommended Allocation Recommended Allocation: Addendum
Will Small Get Even Smaller?
Will Small Get Even Smaller?
Executive Summary Russia Squeezes EU Natural Gas
Russia Squeezes EU Natural Gas
Russia Squeezes EU Natural Gas
Major geopolitical shocks tend to coincide with bear markets, so the market is getting closer to pricing this year’s bad news. But investors are not out of the woods yet. Russia is cutting off Europe’s natural gas supply ahead of this winter in retaliation to Europe’s oil embargo. Europe is sliding toward recession. China is reverting to autocratic rule and suffering a cyclical and structural downshift in growth rates. Only after Xi Jinping consolidates power will the ruling party focus exclusively on economic stabilization. The US can afford to take risks with Russia, opening up the possibility of a direct confrontation between the two giants before the US midterm election. A new strategic equilibrium is not yet at hand. Tactical Recommendation Inception Date Return LONG GLOBAL DEFENSIVES / CYCLICALS EQUITIES 2022-01-20 18.3% Bottom Line: Maintain a defensive posture in the third quarter but look for opportunities to buy oversold assets with long-term macro and policy tailwinds. Feature 2022 is a year of geopolitics and supply shocks. Global investors should remain defensive at least until the Chinese national party congress and US midterm election have passed. More fundamentally, an equilibrium must be established between Russia and NATO and between the US and Iran. Until then supply shocks will destroy demand. Checking Up On Our Three Key Views For 2022 Our three key views for the year are broadly on track: 1. China’s Reversion To Autocracy: For ten years now, the fall in Chinese potential economic growth has coincided with a rise in neo-Maoist autocracy and foreign policy assertiveness, leading to capital flight, international tensions, and depressed animal spirits (Chart 1). Related Report Geopolitical StrategyWill China Let 100 Flowers Bloom? Only Briefly. Rising incomes provided legitimacy for the Communist Party over the past four decades. Less rapidly rising incomes – and extreme disparities in standards of living – undermine the party and force it to find other sources of public support. Fighting pollution and expanding the social safety net are positives for political stability and potentially for economic productivity. But converting the political system from single-party rule to single-person rule is negative for productivity. Mercantilist trade policy and nationalist security policy are also negative. China’s political crackdown, struggle with Covid-19, waning exports, and deflating property market have led to an abrupt slowdown this year. The government is responding by easing monetary, fiscal, and regulatory policy, though so far with limited effect (Chart 2). Economic policy will not be decisive in the third quarter unless a crash forces the administration to stimulate aggressively. Chart 1China's Slowdown Leads To Maoism, Nationalism
China's Slowdown Leads To Maoism, Nationalism
China's Slowdown Leads To Maoism, Nationalism
Chart 2Chinese Policy Easing: Limited Effect So Far
Chinese Policy Easing: Limited Effect So Far
Chinese Policy Easing: Limited Effect So Far
Chart 3Nascent Rally In Chinese Shares Will Be Dashed
Nascent Rally In Chinese Shares Will Be Dashed
Nascent Rally In Chinese Shares Will Be Dashed
Once General Secretary Xi Jinping secures another five-to-ten years in power at the twentieth national party congress this fall, he will be able to “let 100 flowers bloom,” i.e. ease policy further and focus exclusively on securing the economic recovery in 2023. But policy uncertainty will remain high until then. The party may have to crack down anew to ensure Xi’s power consolidation goes according to plan. China is highly vulnerable to social unrest for both structural and cyclical reasons. The US would jump to slap sanctions on China for human rights abuses. Hence the nascent recovery in Chinese domestic and offshore equities can easily be interrupted until the political reshuffle is over (Chart 3). If China’s economy stabilizes and a recession is avoided, investors will pile into the rally, but over the long run they will still be vulnerable to stranded capital due to Chinese autocracy and US-China cold war. If the Politburo and Politburo Standing Committee are stacked with members of Xi’s faction, as one should expect, then the reduction in policy uncertainty will only be temporary. Autocracy will lead to unpredictable and draconian policy measures – and it cannot solve the problem of a shrinking and overly indebted population. If the Communist Party changes course and stacks the Politburo with Xi’s factional rivals, to prevent China from going down the Maoist, Stalinist, and Putinist route, then global financial markets will cheer. But that outcome is unlikely. Hawkish foreign policy means that China will continue to increase its military threats against Taiwan, while not yet invading outright. Beijing has tightened its grip over Tibet, Xinjiang, and Hong Kong since 2008; Taiwan and the South China Sea are the only critical buffer areas that remain to be subjugated. Taiwan’s midterm elections, US midterms, and China’s party congress will keep uncertainty elevated. Taiwan has underperformed global and emerging market equities as the semiconductor boom and shortage has declined (Chart 4). Hong Kong is vulnerable to another outbreak of social unrest and government repression. Quality of life has deteriorated for the native population. Democracy activists are disaffected and prone to radicalization. Singapore will continue to benefit at Hong Kong’s expense (Chart 5). Chart 4Taiwan Equity Relative Performance Peaked
Taiwan Equity Relative Performance Peaked
Taiwan Equity Relative Performance Peaked
Chart 5Hong Kong Faces More Troubles
Hong Kong Faces More Troubles
Hong Kong Faces More Troubles
Chart 6Japan Undercuts China
Japan Undercuts China
Japan Undercuts China
China and Japan are likely to engage in clashes in the East China Sea. Beijing’s military modernization, nuclear weapons expansion, and technological development pose a threat to Japanese security. The gradual encirclement of Taiwan jeopardizes Japan’s vital sea lines of communication. Prime Minister Fumio Kishida is well positioned to lead the Liberal Democratic Party into the upper house election on July 10 – he does not need to trigger a diplomatic showdown but he would not suffer from it. Meanwhile China is hungry for foreign distractions and unhappy that Japan is reviving its military and depreciating its currency (Chart 6). A Sino-Japanese crisis cannot be ruled out, especially if the Biden administration looks as if it will lose its nerve in containing China. Financial markets would react negatively, depending on the magnitude of the crisis. North Korea is going back to testing ballistic missiles and likely nuclear weapons. It is expanding its doctrine for the use of such weapons. It could take advantage of China’s and America’s domestic politics to stage aggressive provocations. South Korea, which has a hawkish new president who lacks parliamentary support, is strengthening its deterrence with the United States. These efforts could provoke a negative response from the North. Financial markets will only temporarily react to North Korean provocations unless they are serious enough to elicit military threats from Japan or the United States. China would be happy to offer negotiations to distract the Biden administration from Xi’s power grab. South Korean equities will benefit on a relative basis as China adds more stimulus. 2. America’s Policy Insularity: President Biden’s net approval rating, at -15%, is now worse than President Trump’s in 2018, when the Republicans suffered a beating in midterm elections (Chart 7). Biden is now fighting inflation to try to salvage the elections for his party. That means US foreign policy will be domestically focused and erratic in the third quarter. Aside from “letting” the Federal Reserve hike rates, Biden’s executive options are limited. Pausing the federal gasoline tax requires congressional approval, and yet if he unilaterally orders tax collectors to stand down, the result will be a $10 billion tax cut – a drop in the bucket. Biden is considering waiving some of former President Trump’s tariffs on China, which he can do on his own. But doing so will hurt his standing in Rust Belt swing states without reducing inflation enough to get a payoff at the voting booth – after all, import prices are growing slower from China than elsewhere (Chart 8). He would also give Xi Jinping a last-minute victory over America that would silence Xi’s critics and cement his dictatorship at the critical hour. Chart 7Democrats Face Shellacking In Midterm Elections
Third Quarter Geopolitical Outlook: Thunder And Lightning
Third Quarter Geopolitical Outlook: Thunder And Lightning
Chart 8Paring Trump Tariffs Won't Reduce Inflation Much
Paring Trump Tariffs Won't Reduce Inflation Much
Paring Trump Tariffs Won't Reduce Inflation Much
Chart 9Only OPEC Can Help Biden - And Help May Come Late
Only OPEC Can Help Biden - And Help May Come Late
Only OPEC Can Help Biden - And Help May Come Late
Biden is offering to lift sanctions on Iran, which would free up 1.3 million barrels of oil per day. But Iran is not being forced to freeze its nuclear program by weak oil prices or Russian and Chinese pressure – quite the opposite. If Biden eases sanctions anyway, prices at the pump may not fall enough to win votes. Hence Biden is traveling to Saudi Arabia to make amends with Crown Prince Mohammed bin Salman. OPEC’s interest lies in producing enough oil to prevent a global recession, not in flooding the market on Biden’s whims to rescue the Democratic Party. Saudi and Emirati production may come but it may not come early in the third quarter. Lifting sanctions on Venezuela is a joke and Libya recently collapsed again (Chart 9). Even in dealing with Russia the Biden administration will exhibit an insular perspective. The US is not immediately threatened, like Europe, so it can afford to take risks, such as selling Ukraine advanced and long-range weapons and providing intelligence used to sink Russian ships. If Russia reacts negatively, a direct US-Russia confrontation will generate a rally around the flag that would help the Democrats, as it did under President John F. Kennedy in 1962 – one of the rare years in which the ruling party minimized its midterm election losses (Chart 10). The Cuban Missile Crisis counted more with voters than the earlier stock market slide. 3. Petro-States’ Geopolitical Leverage: Oil-producing states have immense geopolitical leverage this year thanks to the commodity cycle. Russia will not be forced to conclude its assault on Ukraine until global energy prices collapse, as occurred in 2014. In fact Russia’s leverage over Europe will be greatly reduced in the coming years since Europe is diversifying away from Russian energy exports. Hence Moscow is cutting natural gas flows to Europe today while it still can (Chart 11). Chart 10Biden Can Afford To Take Risks With Russia
Third Quarter Geopolitical Outlook: Thunder And Lightning
Third Quarter Geopolitical Outlook: Thunder And Lightning
Chart 11Russia Squeezes EU's Natural Gas
Russia Squeezes EU's Natural Gas
Russia Squeezes EU's Natural Gas
Chart 12EU/China Slowdown Will Weigh On World
Third Quarter Geopolitical Outlook: Thunder And Lightning
Third Quarter Geopolitical Outlook: Thunder And Lightning
Russia’s objective is to inflict a recession and cause changes in either policy or government in Europe. This will make it easier to conclude a favorable ceasefire in Ukraine. More importantly it will increase the odds that the EU’s 27 members, having suffered the cost of their coal and oil embargo, will fail to agree to a natural gas embargo by 2027 as they intend. Italy, for example, faces an election by June 2023, which could come earlier. The national unity coalition was formed to distribute the EU’s pandemic recovery funds. Now those funds are drying up, the economy is sliding toward recession, and the coalition is cracking. The most popular party is an anti-establishment right-wing party, the Brothers of Italy, which is waiting in the wings and can ally with the populist League, which has some sympathies with Russia. A recession could very easily produce a change in government and a more pragmatic approach to Moscow. The Italian economy is getting squeezed by energy prices and rising interest rates at the same time and cannot withstand the combination very long. A European recession or near-recession will cause further downgrades to global growth, especially when considering the knock-on effects in China, where the slowdown is more pronounced than is likely reported. The US economy is more robust but it will have to be very robust indeed to withstand a recession in Europe and growth recession in China (Chart 12). Russia does not have to retaliate against Finland and Sweden joining NATO until Turkey clears the path for them to join, which may not be until just before the Turkish general election due in June 2023. But imposing a recession on Europe is already retaliation – maybe a government change will produce a new veto against NATO enlargement. Russian retaliation against Lithuania for blocking 50% of its shipments to the Kaliningrad exclave is also forthcoming – unless Lithuania effectively stops enforcing the EU’s sanctions on Russian resources. Russia cannot wage a full-scale attack on the Baltic states without triggering direct hostilities with NATO since they are members of NATO. But it can retaliate in other ways. In a negative scenario Moscow could stage a small “accidental” attack against Lithuania to test NATO. But that would force Biden to uphold his pledge to defend “every inch” of NATO territory. Biden would probably do so by staging a proportionate military response or coordinating with an ally to do it. The target would be the Russian origin of attack or comparable assets in the Baltic Sea, the Black Sea, Ukraine, Belarus, or elsewhere. The result would be a dangerous escalation. Russia could also opt for cyber-attacks or economic warfare – such as squeezing Europe’s natural gas supply further. Ultimately Russia can afford to take greater risks than the US over Kaliningrad, other territories, and its periphery more broadly. That is the difference between Kennedy and Biden – the confrontation is not over Cuba. Russia is also likely to take a page out of Josef Stalin’s playbook and open a new front – not so much in Nicaragua as in the Middle East and North Africa. The US betrayal of the 2015 nuclear deal with Iran opens the opportunity for Russia to strengthen cooperation with Iran, stir up the Iranians’ courage, sell them weapons, and generate a security crisis in the Middle East. The US military would be distracted keeping peace in the Persian Gulf while the Europeans would lose their long-term energy alternative to Russia – and energy prices would rise. The Iranians – who also have leverage during a time of high oil prices – are not inclined to freeze their nuclear program. That would be to trade their long-term regime survival for economic benefits that the next American president can revoke unilaterally. Bottom Line: Xi Jinping is converting China back into an autocracy, the Biden administration lacks options and is willing to have a showdown with Russia, and the Putin administration is trying to inflict a European recession and political upheaval. Stay defensive. Checking Up On Our Strategic Themes For The 2020s As for our long-term themes, the following points are relevant after what we have learned in the second quarter: 1. Great Power Rivalry: The war in Ukraine has reminded investors of the primacy of national security. In an anarchic international system, if a single great nation pursues power to the neglect of its neighbors’ interests, then its neighbors need to pursue power to defend themselves. Before long every nation is out for itself. At least until a new equilibrium is established. For example, Russia’s decision to neutralize Ukraine by force is driving Germany to abandon its formerly liberal policy of energy cooperation in order to reduce Russia’s energy revenues and avoid feeding its military ambitions. Russia in turn is reducing natural gas exports to weaken Europe’s economy this winter. Germany will re-arm, Finland and Sweden will eventually join NATO, and Russia will underscore its red line against NATO bases or forces in Finland and Sweden. If this red line is violated then a larger war could ensue. Chart 13China Will Shift To Russian Energy
China Will Shift To Russian Energy
China Will Shift To Russian Energy
Until Russia and NATO come to a new understanding, neither Europe nor Russia can be secure. Meanwhile China cannot reject Russia’s turn to the east. China believes it may need to use force to prevent Taiwan independence at some point, so it must prepare for the US and its allies to treat it the same way that they have treated Russia. It must secure energy supply from Russia, Central Asia, and the Middle East via land routes that the US navy cannot blockade (Chart 13). Beijing must also diversify away from the US dollar, lest the Treasury Department freeze its foreign exchange reserves like it did Russia’s. Global investors will see diversification as a sign of China’s exit from the international order and preparation for conflict, which is negative for its economic future. However, the Russo-Chinese alliance presents a historic threat to the US’s security, coming close to the geopolitical nightmare of a unified Eurasia. The US is bound to oppose this development, whether coherently or not, and whether alone or in concert with its allies. After all, the US cannot offer credible security guarantees to negotiate a détente with China or Iran because its domestic divisions are so extreme that its foreign policy can change overnight. Other powers cannot be sure that the US will not suffer a radical domestic policy change or revolution that leads to belligerent foreign policy. Insecurity will drive the US and China apart rather than bringing them together. For example, Russia’s difficulties in Ukraine will encourage Chinese strategists to go back to the drawing board to adjust their plans for military contingencies in Taiwan. But the American lesson from Ukraine is to increase deterrence in Taiwan. That will provoke China and encourage the belief that China cannot wait forever to resolve the Taiwan problem. Until there is a strategic understanding between Russia and NATO, and the US and China, the world will remain in a painful and dangerous transitional phase – a multipolar disequilibrium. Chart 14Hypo-Globalization: Globalizing Less Than Potential
Third Quarter Geopolitical Outlook: Thunder And Lightning
Third Quarter Geopolitical Outlook: Thunder And Lightning
2. Hypo-Globalization: If national security rises to the fore, then economics becomes a tool of state power. Mercantilism becomes the basis of globalization rather than free market liberalism. Hypo-globalization is the result. The term is fitting because the trade intensity of global growth is not yet in a total free fall (i.e. de-globalization) but merely dropping off from its peaks during the phase of “hyper-globalization” in the 1990s and early 2000s (Chart 14). Hypo-globalization is probably a structural rather than cyclical phenomenon. The EU cannot re-engage with Russia and ease sanctions without rehabilitating Russia’s economy and hence its military capacity – which could enable Russia to attack Europe again. The US and China can try to re-engage but they will fail. Russo-Chinese alliance ensures that the US would be enriching not one but both of its greatest strategic rivals if it reopened its doors to Chinese technology acquisition and intellectual property theft. Iran will see its security in alliance with Russia and China. China has an incentive to develop Iran’s economy so as not to depend solely on Russia and Central Asia. Russia has an incentive to develop Iran’s military capacity so as to deprive Europe of an energy alternative. Both Russia and China wish to deprive the US of strategic hegemony in the Middle East. By contrast the US and EU cannot offer ironclad security guarantees to Iran because of its nuclear ambitions and America’s occasional belligerence. Thus the world can see expanding Russian and Chinese economic integration with Eurasia, and expanding American and European integration with various regions, but it cannot see further European integration with Russia or American integration with China. And ultimately Europe and China will be forced to sever links (Chart 15). Globalization will not cease – it is a multi-millennial trend – but it will slow down. It will be subordinated to national security and mercantilist economic theory. 3. Populism/Nationalism: In theory, domestic instability can cause introversion or extroversion. But in practice we are seeing extroversion, which is dangerous for global stability (Chart 16). Chart 15Global Economic Disintegration
Global Economic Disintegration
Global Economic Disintegration
Chart 16Internal Sources Of Nationalism
Internal Sources Of Nationalism
Internal Sources Of Nationalism
Russia’s invasion of Ukraine derived from domestic Russian instability – and instability across the former Soviet space, including Belarus, which the Kremlin feared could suffer a color revolution after the rigged election and mass protests of 2020-21. The reason the northern European countries are rapidly revising their national defense and foreign policies to counter Russia is because they perceive that the threat to their security is driven by factors within the former Soviet sphere that they cannot easily remove. These factors will get worse as a result of the Ukraine war. Russian aggression still poses the risk of spilling out of Ukraine’s borders. China’s Maoist nostalgia and return to autocratic government is also about nationalism. The end of the rapid growth phase of industrialization is giving way to the Asian scourge: debt-deflation. The Communist Party is trying to orchestrate a great leap forward into the next phase of development. But in case that leap fails like the last one, Beijing is promoting “the great rejuvenation of the Chinese nation” and blaming the rest of the world for excluding and containing China. Taiwan, unfortunately, is the last relic of China’s past humiliation at the hands of western imperialists. China will also seek to control the strategic approach to Taiwan, i.e. the South China Sea. China’s claim that the Taiwan Strait is sovereign sea, not international waters, will force the American navy to assert freedom of passage. American efforts to upgrade Taiwan relations and increase deterrence will be perceived as neo-imperialism. The United States, for its part, could also see nationalism convert into international aggression. The US is veering on the brink of a miniature civil war as nationalist forces in the interior of the country struggle with the political establishment in the coastal states. Polarization has abated since 2020, as stagflation has discredited the Democrats. But it is now likely to rebound, making congressional gridlock all but inevitable. A Republican-controlled House will find a reason to impeach President Biden in 2023-24, in hopes of undermining his party and reclaiming the presidency. Another hotly contested election is possible, or worse, a full-blown constitutional crisis. American institutions proved impervious to the attempt of former President Trump and his followers to disrupt the certification of the Electoral College vote. However, security forces will be much more aggressive against rebellions of whatever stripe in future, which could lead to episodes in which social unrest is aggravated by police repression. If the GOP retakes the White House – especially if it is a second-term Trump presidency with a vendetta against political enemies and nothing to lose – then the US will return to aggressive foreign policy, whether directed at China or Iran or both. In short, polarization has contaminated foreign policy such that the most powerful country in the world cannot lead with a steady hand. Over the long run polarization will decline in the face of common foreign enemies but for now the trend vitiates global stability. Chart 17Germany And Japan Rearming
Third Quarter Geopolitical Outlook: Thunder And Lightning
Third Quarter Geopolitical Outlook: Thunder And Lightning
It goes without saying that nationalism is also an active force in Iran, where 83-year-old Supreme Leader Ayatollah Khamenei is attempting to ensure the survival of his regime in the face of youthful social unrest and an unclear succession process. If Khamenei takes advantage of the commodity cycle, and American and Israeli disarray, he can make a mad dash for the bomb and try to achieve regime security. But if he does so then nationalism will betray him, since Israel and/or the US are willing to conduct air strikes to uphold the red line against nuclear weaponization. If any more proof of global nationalism is needed, look no further than Germany and Japan, the principal aggressors of World War II. Their pacifist foreign policies have served as the linchpins of the post-war international order. Now they are both pursuing rearmament and a more proactive foreign policy (Chart 17). Nationalism may be very nascent in Germany but it has clearly made a comeback in Japan, which exacerbates China’s fears of containment. The rise of nationalism in India is widely known and reinforces the trend. Bottom Line: Great power rivalry is intensifying because of Russia’s conflict with the West and China’s inability to reject Russia. Hypo-globalization is the result since EU-Russia and US-China economic integration cannot easily be mended in the context of great power struggle. Domestic instability in Russia, China, and the US is leading to nationalism and aggressive foreign policy, as leaders find themselves unwilling or unable to stabilize domestic politics through productive economic pursuits. Investment Takeaways BCA has shifted its House View to a neutral asset allocation stance on equities relative to bonds (Chart 18). Chart 18BCA House View: Neutral Stocks Versus Bonds
BCA House View: Neutral Stocks Versus Bonds
BCA House View: Neutral Stocks Versus Bonds
Geopolitical Strategy remains defensively positioned, favoring defensive markets and sectors, albeit with some exceptions that reflect our long-term views. Tactically stay long US 10-year Treasuries, large caps versus small caps, and defensives versus cyclicals. Stay long Mexico and short the UAE (Chart 19). Strategically stay long gold, US equities relative to global, and aerospace/defense sectors (Chart 20). Among currencies favor the USD, EUR, JPY, and GBP. Chart 19Stay Defensive In Q3 2022
Stay Defensive In Q3 2022
Stay Defensive In Q3 2022
Chart 20Stick To Long-Term Geopolitical Trades
Stick To Long-Term Geopolitical Trades
Stick To Long-Term Geopolitical Trades
Chart 21Favor Semiconductors But Not Taiwan
Favor Semiconductors But Not Taiwan
Favor Semiconductors But Not Taiwan
Chart 22Indian Tech Will Rebound Amid China's Geopolitical Risks
Indian Tech Will Rebound Amid China's Geopolitical Risks
Indian Tech Will Rebound Amid China's Geopolitical Risks
Chart 23Overweight ASEAN
Overweight ASEAN
Overweight ASEAN
Go long US semiconductors and semi equipment versus Taiwan broad market (Chart 21). While we correctly called the peak in Taiwanese stocks relative to global and EM equities, our long Korea / short Taiwan trade was the wrong way to articulate this view and remains deeply in the red. Similarly our attempt to double down on Indian tech versus Chinese tech was ill-timed. China eased tech regulations sooner than we expected. However, the long-term profile of the trade is still attractive and Chinese tech will still suffer from excessive government and foreign interference (Chart 22). Go long Singapore over Hong Kong, as Asian financial leadership continues to rotate (see Chart 5 above). Stay long ASEAN among emerging markets. We will also put Malaysia on upgrade watch, given recent Malaysian equity outperformance on the back of Chinese stimulus and growing western interest in alternatives to China (Chart 23). Matt Gertken Chief Geopolitical Strategist mattg@bcaresearch.com Strategic Themes Open Tactical Positions (0-6 Months) Open Cyclical Recommendations (6-18 Months) Regional Geopolitical Risk Matrix
Executive Summary Biden Can Take Risks With Russia
Third Quarter US Political Outlook: Last Ditch Effort
Third Quarter US Political Outlook: Last Ditch Effort
President Biden will make a last-ditch effort to mitigate Democratic losses in the midterm elections and the effect will be still-high policy uncertainty and erratic US behavior. Biden can take several executive actions against inflation but we do not expect them to resolve the global supply shock or to save the Democrats from a Republican takeover of Congress this fall. There is substantial risk of a direct US-Russia crisis ahead of the election that would sustain bearish sentiment. US policy remains a headwind for equities in 2022 but possibly a tailwind in 2023. A rally after the midterm is fairly likely. Recommendation (Tactical) Initiation Date Return Long DXY (Dollar Index) 23-FEB-22 8.8% Bottom Line: Maintain a defensive posture in the third quarter but look for opportunities to buy oversold assets with long-term macro and policy tailwinds. Feature President Biden and the Democratic Party will make a last-ditch effort in the third quarter to mitigate their large expected losses in the midterm elections. The president will concentrate on fighting inflation, which is weighing on wages, incomes, and consumer and business sentiment (Chart 1). Related Report US Political StrategyBiden Opens The Border Biden’s frantic efforts will induce additional market volatility. The president has a few limited tools to address global energy and supply shocks that probably will not work. Inflation will remain problematic even if it slows down over the next three months as our bond strategists expect. The odds of recession have risen sharply. Our Chief Global Strategist Peter Berezin suggests that the odds are 40% – a point underscored by inversion of some parts of the yield curve and a falling leading economic indicator (Chart 2). President Biden recently met with outside economic adviser Larry Summers and concluded that a recession is “not inevitable.” Not very comforting. Chart 1Inflation's Toll
Inflation's Toll
Inflation's Toll
Chart 2Odds Of Recession Rising
Odds Of Recession Rising
Odds Of Recession Rising
Summers, who warned Biden and the Democrats not to add $1.9 trillion in spending at the beginning of 2021, has put forward research showing recession odds at 60%-70% over the next 12-24 months.1 However, BCA’s own recession checklist is still ambivalent (Table 1). BCA’s House View is now neutral on equities. Table 1BCA Recession Checklist
Third Quarter US Political Outlook: Last Ditch Effort
Third Quarter US Political Outlook: Last Ditch Effort
What could change the US policy outlook? Not much. Avoiding recession, reducing inflation, mobilizing women voters, and clashing directly with Russia could mitigate some of the Democrats’ expected losses this fall, but the outcome would probably be the same. Betting markets give a 72%probability to Democrats losing control of both the House of Representatives and the Senate. Our own election models show Democrats losing 22 seats in the House and two seats in the Senate (see Appendix), reinforcing our February forecast. The implication is congressional gridlock in 2023-24. Gridlock is marginally positive for the broad US equity market beginning in Q4 2022 … but marginally negative before then. Checking Up On Our Three Key Views For 2022 Our three key views for 2022 remain intact at the halfway point of the year. : 1. From Single-Party Rule To Gridlock: The Democrats are highly likely to lose control of the House of Representatives this fall, meaning that unified government will end with the lame duck legislative session in November and December. The Democrats’ fiscal 2022 budget reconciliation bill is less likely to pass now that midterm campaigning has begun. A fiscally expansive bill would add to inflation. A deficit-reducing bill – i.e. one with substantial tax hikes – would increase the odds of recession. Biden no longer has an interest in pushing the bill until he is reasonably sure a recession can be avoided. It is very hard to garner 218 votes in the House and 51 votes in the Senate now that Biden’s and Democrats’ popular support is melting down. Democrats are polling comparably to Republicans who lost 41 House seats in the 2018 midterms (Chart 3). Thus while it is still possible for Democrats to pass an energy security and climate change bill under Biden’s presidency, we have no conviction that they can do it before the midterm. More likely it would have to pass during the lame-duck session in the fourth quarter – or as a compromise law with a Republican Congress in 2023-24. Until 2025, at earliest, US government will be divided, which means that the post-election drop in policy uncertainty will be short-lived, as fears will emerge of breaching the debt ceiling in early 2023. Chart 3Democratic Party Troubles
Third Quarter US Political Outlook: Last Ditch Effort
Third Quarter US Political Outlook: Last Ditch Effort
2. From Legislative To Executive Power: With the legislature stymied, Biden will resort to executive power to keep his presidency afloat. So what will he do? Fight inflation. Biden’s anti-inflation plan consists of three prongs. The first is “letting” the Fed raise interest rates, which is well under way. The Fed hiked rates by 75 basis points on June 15 and plans to raise the Fed funds rate to 3.25% or 3.5% by end of year. The second prong is passing his Build Back Better plan and the third is consolidating the fiscal deficit. But these two options are bogged down in Congress – no new belt-tightening will occur until 2023 at earliest. So Biden’s remaining options consist of administrative maneuvers and executive orders. Biden could stop collecting the federal gas tax, although the tax has not risen since 1993 and its removal will have a marginal impact (Chart 4). He has already tapped the strategic petroleum reserve, to an unprecedented degree, without preventing the surge in prices at the pump (Chart 5). Chart 4Biden To Defer Federal Gas Tax
Biden To Defer Federal Gas Tax
Biden To Defer Federal Gas Tax
Chart 5Strategic Petroleum Reserve Already Tapped
Strategic Petroleum Reserve Already Tapped
Strategic Petroleum Reserve Already Tapped
3. From Domestic To Foreign Policy: Part of Biden’s turn toward executive power will be a turn toward foreign policy orientation. However, before the midterm, Biden’s foreign policy will be defensive or reactive. That is, with the exception of Russia, he will attempt to placate foreign threats and mitigate the energy shock. On China, Biden is considering pulling back on some of President Trump’s extraordinary tariffs, though probably not the Section 301 tariffs related to technology theft. He has the authority to do so unilaterally just as Trump had the authority to put them on. The problem is that easing the China tariffs will have little effect on inflation, and only after the midterm, while it would weaken Biden’s political standing in the Rust Belt and undermine the US’s strategic competition with China. Tariff relief would only temporarily benefit the renminbi, if at all, given China’s need for a weak currency amid its economic slowdown (Chart 6). Hence Biden may reduce some tariffs but it will be underwhelming. Not a reliable way to bring down inflation. Chart 6Biden Can Ease China Tariffs (But Don't Bet On It)
Biden Can Ease China Tariffs (But Don't Bet On It)
Biden Can Ease China Tariffs (But Don't Bet On It)
Second, Biden has proposed to ease sanctions on Iran if it will freeze its nuclear program and come back into compliance with the 2015 nuclear deal that the Trump administration rejected. But the Iranians can export oil anyway at today’s prices, they have customers in China and India, and they have immense military leverage over Iraqi production, which means they are not forced to capitulate (Chart 7). Not a reliable way to bring down inflation. Third, Biden is courting the Gulf Arab states and tinkering with easing sanctions on Venezuela and others. OPEC support is a better option than Iran/Venezuela. However, OPEC will decide when and how much support to give. The Arab states will act to prolong the global business cycle but will not base their strategy on helping Democrats win an election. Hence they may not come to the rescue as early as the third quarter (Chart 8). Chart 7Biden Can Ease Iran Sanctions (But Don't Bet On It)
Biden Can Ease Iran Sanctions (But Don't Bet On It)
Biden Can Ease Iran Sanctions (But Don't Bet On It)
Chart 8Biden Casting About For Oil Providers
Biden Casting About For Oil Providers
Biden Casting About For Oil Providers
Moreover if the Biden administration makes amends with Saudi Arabia, then Iran’s nuclear progress will steam ahead and ignite tensions in the Middle East within the year. That would vitiate the impact of increased OPEC production. Not a reliable way to bring down inflation. Biden has even sought to exempt Russia from some sanctions for the sake of reducing inflation, such as with grain exports. However, these arrangements may not last. Given Biden’s weak domestic support and given the way that the Cuban Missile Crisis helped President Kennedy to mitigate his party’s losses in 1962, Biden can afford to be confrontational and even provocative toward Russia (Chart 9). After all, Russia is already pulling levers to add to inflation. The problem is that a direct US-Russia showdown would increase inflation while heightening global risk aversion. Bottom Line: Gridlock is coming, which is marginally negative for US equities in Q3 2022 but marginally positive as early as Q4 2022 and in 2023. It is not good for equities in 2022 because of elevated uncertainty – uncertainty not so much about the election results as about the volatile and unpredictable impacts of the president’s last-ditch efforts to fight inflation. Chart 9Biden Can Take Risks With Russia
Third Quarter US Political Outlook: Last Ditch Effort
Third Quarter US Political Outlook: Last Ditch Effort
Checking Up On Our Strategic Themes For The 2020s Looking beyond the short term, this year’s inflation outbreak and geopolitical events will largely reinforce our three long-term US political themes, in the following ways: 1. Millennials/GenZ Rising: In the coming 12 months, a fall in job openings due to the economic slowdown, combined with a recovering labor participation rate, could reduce wage pressures and inflation, in accordance with the Federal Reserve’s plan for a “soft landing” (Chart 10). Of course, that is not happening yet. And conversely labor participation will fall again if recession risks materialize. So there will be a lot of noise in the short run. Over the long run, a rising dependency ratio, in the context of a growing population, has inflationary implications. It decreases the pool of savings, increases the need for public investment, and increases the cost of each prime-age worker. Today the headline labor participation rate has mostly recovered but workers over the age of 55 are failing to return to pre-pandemic levels of participation, as are young people, which will keep wage pressures up (Chart 11). Chart 10The Fed's Idea Of A Soft Landing
The Fed's Idea Of A Soft Landing
The Fed's Idea Of A Soft Landing
Chart 11Generational Shift In Labor Market
Generational Shift In Labor Market
Generational Shift In Labor Market
Thus generational change will be marginally inflationary and will have powerful political effects. An increasingly multi-ethnic and educated population will hold different opinions from previous generations. Political parties will evolve to capture these voters. Underlying the shift will be the fact that government support will be necessary for the rising share of dependents, yet fiscal discipline will be necessary to restrict inflation. The current quarrel between older and younger generations will intensify before it subsides. The Silent Generation, along with the conservative Baby Boomers, will remain the decisive voting bloc in the 2022 midterm and will seek to freeze fiscal policy. That brings us to our next theme … 2. Peak Polarization: Political polarization has declined since the 2020 election, as we predicted. All voters dislike high inflation (Chart 12). However, polarization will remain at historically high levels at least over the short and medium term. Chart 12Everyone Loathes Inflation
Everyone Loathes Inflation
Everyone Loathes Inflation
Chart 13Women’s Turnout Will Matter
Third Quarter US Political Outlook: Last Ditch Effort
Third Quarter US Political Outlook: Last Ditch Effort
Polarization will remain high in part because of the generational divide, which is still very wide and underpins stark ideological divides. For example, a short-term driver of polarization will be abortion. The Supreme Court is likely, though not certain, to overturn the 1972 Roe v. Wade decision that guarantees nationwide access to abortion. If it does, protests and civil unrest will occur. Women turned out in droves against President Trump’s Republicans in the 2018 midterms and will do so again in 2022 (Chart 13), helping Democrats to mitigate some of their losses. Polarization will also remain high due to the electoral system and intra-party dynamics. While Democrats ensconce themselves in formal institutions, Republicans continue to transform into a populist party. So far in the Republican primary elections, candidates endorsed by former President Trump are winning the nomination at a 94% rate. Table 2 shows the outcomes in the GOP primary elections for the House of Representatives so far. A GOP House majority is likely to impeach President Biden for one or another reason, even though they will not be able to remove him from office. Table 2Polarization Will Stay Near Historic Peaks Over 2022-24 Cycle
Third Quarter US Political Outlook: Last Ditch Effort
Third Quarter US Political Outlook: Last Ditch Effort
Today’s extreme polarization entails that congressional gridlock will return and that the US remains at high risk of social unrest, political violence, and domestic terrorism (Chart 14). A terrorist attack that affects critical infrastructure, high-level personnel, or the electoral system would lead to greater sociopolitical instability. Especially if violence tips the narrow political balance of one of the branches of government and has a concrete impact on national policy.2 Social unrest alone will hardly move markets but unrest that fundamentally damages US political stability is possible and would engender risk-aversion. Over the long run, however, the US will avoid a second civil war since Washington possesses the world’s most powerful military and intelligence apparatus, which is highly unlikely to be coopted or defeated by an extremist movement. The military swears allegiance to the constitution. For example, neither the military nor the political institutions (as opposed to individuals) showed any serious sign of breaking down during the January 6, 2021 insurrection. The vast majority of voters will recoil from any major incidents of terrorism or militancy. While opinion polls show non-negligible support for political violence, such polls need to be interpreted carefully (Chart 15). A recent study shows that these polls overstate public support for violence.3 Chart 14Major Risk Of Domestic Terrorism, Political Violence
Third Quarter US Political Outlook: Last Ditch Effort
Third Quarter US Political Outlook: Last Ditch Effort
Chart 15Opinion Growing More Militant … Until Militancy Happens
Third Quarter US Political Outlook: Last Ditch Effort
Third Quarter US Political Outlook: Last Ditch Effort
The emerging Russo-Chinese strategic challenge, combined with generational change, will force political elites to cooperate to prevent domestic insurrections, regime fracture, and foreign humiliation. Polarization will give way to a new American consensus which is largely directed at domestic stabilization and fighting the Second Cold War. 3. Limited Big Government: The inflation outbreak has dealt a blow to arguments in favor of unlimited government, including Modern Monetary Theory. While the US rediscovered the need for “Big Government” during the deflationary 2010s, it is already starting to rediscover the need for limited government via the inflationary 2020s (Chart 16). The next Congress will reimpose some fiscal discipline – and future governments will face some checks and balances on spending due to their fear of an inflationary surge and negative consequences at the voting booth. Unless Democrats somehow retain control of Congress this fall, they will reinforce the precedent set by the Carter administration that high inflation is politically undesirable. Chart 16Inflation Outbreak Will Limit Big Government
Third Quarter US Political Outlook: Last Ditch Effort
Third Quarter US Political Outlook: Last Ditch Effort
Fiscal policy will be more expansive in the coming decade than in recent decades due to structural factors. But it will still face limitations from democratic politics, i.e. gridlock. As long as polarization does not spiral out of control, the US government will not become authoritarian or autocratic and fiscal policy will not result in Big Government Socialism or No Government Anarchism. A new compromise will be found which will be Limited Big Government. Bottom Line: Generational tensions will rise and then fall – and so will political polarization. The US faces a high risk of sociopolitical instability in the short term. The 2022 midterm will become a source of uncertainty, volatility, and a still-elevated equity risk premium. After the midterm, uncertainty and risk premiums will dissipate temporarily. But avoiding a recession will become the critical factor in maintaining policy continuity and national stability through the 2024 election cycle. Investment Takeaways BCA has shifted its House View to a neutral asset allocation stance on equities relative to bonds, as noted. US Political Strategy remains defensively positioned, as midterm elections typically provide a tailwind to defensive sectors for the first three quarters of the election year. This is also true when unified governments shift to divided governments – and in that case bond yields tend to be higher than usual (Chart 17). While the inflation outbreak makes this year different from many recent midterm years, these trends have persisted. For this reason, and our Geopolitical Strategy views, we will maintain our defensive bias in the third quarter. Chart 17Stocks Flat, Bond Yields High, Until After Midterm Elections
Stocks Flat, Bond Yields High, Until After Midterm Elections
Stocks Flat, Bond Yields High, Until After Midterm Elections
We remain overweigh health care relative to the broad market and overweight nominal Treasuries relative to inflation-protected securities. Having said that, we are putting our long US dollar (DXY) trade on downgrade watch. We do not doubt that the dollar can go higher this year but our bearish views have come to fruition both within the US and in the geopolitical space and they are now largely priced. It may soon be time to step back and reassess, especially because interest rate differentials are turning against the dollar (Chart 18). In addition China’s government will take a pro-growth turn to try to secure the economic recovery over the next 12 months. In the energy space, we expect volatility. The Biden administration is focused on fighting inflation and could pull various levers to affect the oil market, outlined above. If Biden succeeds against expectations, then the oil price would suffer a substantial setback. Moreover OPEC has an independent interest in prolonging the business cycle now that global prices have become punitive. Hence we are neutral on oil prices and booked gains on our long energy trades for the time (Chart 19). Chart 18Put US Dollar On Downgrade Watch
Put US Dollar On Downgrade Watch
Put US Dollar On Downgrade Watch
If inflation subsides and bond yields moderate, then growth stocks should rebound against value stocks. However, we implemented this idea prematurely earlier this year and suffered for it. Therefore we remain neutral on the question of portfolio styles for now. Our cyclical plays remain the same: long cyber security stocks, defense stocks, and infrastructure stocks. We also remain long renewable energy, although for now we only recommend it as a tactical trade (Chart 20). Chart 19Energy Prices Will Be Volatile
Energy Prices Will Be Volatile
Energy Prices Will Be Volatile
Chart 20Stick With Cyber Security, Defense, And Renewables
Stick With Cyber Security, Defense, And Renewables
Stick With Cyber Security, Defense, And Renewables
Matt Gertken Senior Vice President Chief US Political Strategist mattg@bcaresearch.com Footnotes 1 See Lawrence H. Summers and Alex Domash, “History Suggests a High Chance of Recession over the Next 24 Months,” Harvard Kennedy School, March 15, 2022, www.hks.harvard.edu. 2 Consider the January 6 insurrection, the recent plot against Supreme Court Justice Brett Kavanaugh’s life, the gun attack on Republican Senators in 2017, and the risk of assassinations or other extremist incidents. 3 See Sean J. Westwood et al, “Current research overstates American support for political violence,” Proceedings of the National Academy of Sciences, 119:12 (2022), pnas.org. Strategic View Open Tactical Positions (0-6 Months) Open Cyclical Recommendations (6-18 Months) Table A2Political Risk Matrix
Third Quarter US Political Outlook: Last Ditch Effort
Third Quarter US Political Outlook: Last Ditch Effort
Table A3US Political Capital Index
Third Quarter US Political Outlook: Last Ditch Effort
Third Quarter US Political Outlook: Last Ditch Effort
Chart A1Presidential Election Model
Third Quarter US Political Outlook: Last Ditch Effort
Third Quarter US Political Outlook: Last Ditch Effort
Chart A2Senate Election Model
Third Quarter US Political Outlook: Last Ditch Effort
Third Quarter US Political Outlook: Last Ditch Effort
Table A4House Election Model
Third Quarter US Political Outlook: Last Ditch Effort
Third Quarter US Political Outlook: Last Ditch Effort
Table A5APolitical Capital: White House And Congress
Third Quarter US Political Outlook: Last Ditch Effort
Third Quarter US Political Outlook: Last Ditch Effort
Table A5BPolitical Capital: Household And Business Sentiment
Third Quarter US Political Outlook: Last Ditch Effort
Third Quarter US Political Outlook: Last Ditch Effort
Table A5CPolitical Capital: The Economy And Markets
Third Quarter US Political Outlook: Last Ditch Effort
Third Quarter US Political Outlook: Last Ditch Effort
Executive Summary At our monthly view meeting on Monday, BCA strategists voted to change the House View to a neutral asset allocation stance on equities, with a slight plurality favoring an outright underweight. The view of the Global Investment Strategy service is somewhat more constructive, as I think it is still more likely than not that the US will avoid a recession; and that if a recession does occur, it will be a fairly mild one. Nevertheless, the risks to my view have increased. I now estimate 40% odds of a recession during the next 12 months, up from 20% a month ago. In The Past, When Unemployment Has Started Rising In The US, It Has Kept On Rising
In The Past, When Unemployment Has Started Rising In The US, It Has Kept On Rising
In The Past, When Unemployment Has Started Rising In The US, It Has Kept On Rising
Bottom Line: With the S&P 500 down 27% in real terms from its highs at the time of the meeting, the view of the Global Investment Strategy service is that a modest overweight is appropriate. However, investors should refrain from adding to equity positions until more clarity emerges about the path for inflation and growth. Heading For Recession? Every month, BCA strategists hold a view meeting to discuss the most important issues driving the macroeconomy and financial markets. This month’s meeting, which was held yesterday, was especially pertinent as it comes on the heels of a substantial decline in global equities. The key issue that we grappled with was whether the Fed could achieve a proverbial soft landing or whether the US and the rest of the global economy were spiraling towards recession (if it wasn’t already there). I began the meeting by showing one of my favorite charts, a deceptively simple chart of the US unemployment rate (Chart 1). The chart makes three things clear: 1) The US unemployment rate is rarely stable; It is almost always either rising or falling; 2) Once it starts rising, it keeps rising. In fact, the US has never averted a recession when the 3-month average of the unemployment rate has risen by more than a third of a percentage point; and 3) As a mean-reverting series, the unemployment rate is most likely to start rising when it is very low. Chart 1In The Past, When Unemployment Has Started Rising In The US, It Has Kept On Rising
In The Past, When Unemployment Has Started Rising In The US, It Has Kept On Rising
In The Past, When Unemployment Has Started Rising In The US, It Has Kept On Rising
Taken at face value, the chart paints a damning picture about the economic outlook. The US unemployment rate is near a record low, which means that it has nowhere to go but up. And once the unemployment rate starts going up, history suggests that a recession is inevitable. Five Caveats Despite this ominous implication, I did highlight five caveats. First, the observation that even a modest increase in the unemployment rate invariably heralds a recession is based on a limited sample of business cycles from the US. Across the G10, soft landings have occurred, Canada being one example (Chart 2). Second, unlike the unemployment rate, the employment-to-population ratio is still 1.1 percentage points below its pre-pandemic level, and 4.6 percentage points below where it was in April 2000. A similar, though less pronounced, pattern holds if one focuses only on the 25-to-54 age cohort (Chart 3). Chart 2G10 Economies Sometimes Manage To Avoid A Recession Amid Rising Unemployment
G10 Economies Sometimes Manage To Avoid A Recession Amid Rising Unemployment
G10 Economies Sometimes Manage To Avoid A Recession Amid Rising Unemployment
Chart 3The Employment-To-Population Ratio Remains Below Pre-Pandemic Levels
The Employment-To-Population Ratio Remains Below Pre-Pandemic Levels
The Employment-To-Population Ratio Remains Below Pre-Pandemic Levels
While the number of people not working either because they are worried about the pandemic, or because they are still burning through their stimulus checks, has been trending lower, it is still fairly high in absolute terms (Chart 4). As my colleague Doug Peta discussed in his latest report, one can envision a scenario where job growth remains positive, but the unemployment rate nonetheless edges higher as more workers rejoin the labor force. Chart 4ALabor Supply Should Increase As Covid Fears Continue To Abate And More Workers Burn Through Their Stimulus Savings (I)
Labor Supply Should Increase As Covid Fears Continue To Abate And More Workers Burn Through Their Stimulus Savings (I)
Labor Supply Should Increase As Covid Fears Continue To Abate And More Workers Burn Through Their Stimulus Savings (I)
Chart 4BLabor Supply Should Increase As Covid Fears Continue To Abate And More Workers Burn Through Their Stimulus Savings (II)
Labor Supply Should Increase As Covid Fears Continue To Abate And More Workers Burn Through Their Stimulus Savings (II)
Labor Supply Should Increase As Covid Fears Continue To Abate And More Workers Burn Through Their Stimulus Savings (II)
Third, the job vacancy rate is extremely high today – much higher than a pre-pandemic “Beveridge Curve” would have predicted (Chart 5). This provides the labor market with a wide moat against an increase in firings. As Fed governor Christopher Waller has emphasized, the main effect of the Federal Reserve’s efforts to cool labor demand could be to push down vacancies rather than to push up unemployment. Fourth, as we have highlighted in past research, the Phillips curve is kinked at very low levels of unemployment (Chart 6). This means that a decline in unemployment from high to moderate levels may do little to spur inflation, but once the unemployment rate falls below its full employment level, then watch out! Chart 5The Fed Hopes That Its Tightening Policy Will Bring Down Job Openings More Than It Pushes Up The Unemployment Rate
The Fed Hopes That Its Tightening Policy Will Bring Down Job Openings More Than It Pushes Up The Unemployment Rate
The Fed Hopes That Its Tightening Policy Will Bring Down Job Openings More Than It Pushes Up The Unemployment Rate
Chart 6The Phillips Curve Is Kinked At Very Low Levels Of Unemployment
Hard Or Soft Landing? BCA Strategists Debate The Question
Hard Or Soft Landing? BCA Strategists Debate The Question
The converse is also true, however. If a small decrease in unemployment can trigger a large increase in inflation, then a small increase in unemployment can trigger a large decrease in inflation, provided that long-term inflation expectations remain reasonably well anchored in the meantime. In other words, it is possible that the so-called “sacrifice ratio” — the amount of output that has to be sacrificed to reduce inflation — may be quite low. Fifth, and perhaps most importantly, there is a lot of variation from one recession to the next in how much unemployment rises. In general, the greater the financial and economic imbalances going into a recession, the deeper it tends to be. US household balance sheets are in reasonably good shape these days. Households are sitting on $2.2 trillion in excess savings (Chart 7). Yes, most of those savings belong to relatively well-off households. But as Chart 8 illustrates, even rich people spend well over half of their income. Chart 7Households Have Only Just Begun To Draw Down Their Accumulated Savings
Households Have Only Just Begun To Draw Down Their Accumulated Savings
Households Have Only Just Begun To Draw Down Their Accumulated Savings
Chart 8Even The Rich Spend The Majority Of Their Income
Hard Or Soft Landing? BCA Strategists Debate The Question
Hard Or Soft Landing? BCA Strategists Debate The Question
The ratio of household debt-to-disposable income in the US is down by a third since its peak in 2008. Despite falling equity prices, the ratio of household net worth-to-disposable income is still up nearly 50 percentage points since the end of 2019, mainly because home prices have risen (Chart 9). As is likely to be the case in many other countries, home prices in the US will level off and quite possibly decline over the next few years. In and of itself, that may not be such a bad outcome for equity markets since lower real estate prices will cool aggregate demand, thus lowering inflation without the need for much higher interest rates. The danger, of course, is that we could see a replay of the GFC. This risk cannot be ignored but is probably quite small. The quality of mortgage lending has been very strong over the past 15 years. Moreover, unlike in 2007, when there was a large glut of homes, the homeowner vacancy rate today is at a record low. Tepid homebuilding has pushed the average age of the US residential capital stock to 31 years, the highest since 1948 (Chart 10). Chart 9The US Household Debt Burden Has Come Down Significantly Since 2008, While Net Worth Is Still Higher Than Before The Pandemic
The US Household Debt Burden Has Come Down Significantly Since 2008, While Net Worth Is Still Higher Than Before The Pandemic
The US Household Debt Burden Has Come Down Significantly Since 2008, While Net Worth Is Still Higher Than Before The Pandemic
Chart 10Tight Supply Conditions In The Housing Market Argue Against A Repeat Of The GFC
Tight Supply Conditions In The Housing Market Argue Against A Repeat Of The GFC
Tight Supply Conditions In The Housing Market Argue Against A Repeat Of The GFC
A Bleaker Picture Outside The US The situation is admittedly dicier outside the US. Putin’s despotic regime continues to wage war on Ukraine. While European natural gas prices are still well below their March peak, they have recently surged as Russia has begun to throttle natural gas exports (Chart 11). The euro area manufacturing PMI clocked in a respectable 54.6 in May but is likely to drop over the coming months as higher energy prices restrain production. The only saving grace is that fiscal policy in Europe has turned more expansionary. The IMF’s April projection foresaw the structural primary budget balance easing from a surplus of 1.2% of GDP between 2014 and 2019 to a deficit of 1.2% of GDP between 2022 and 2027, the biggest swing among the major economies (Chart 12). Even the IMF’s numbers probably underestimate the fiscal easing that will transpire considering the need for Europe to invest more in energy independence and defense. Chart 11The European Economy Is Threatened By Rising Gas Prices
The European Economy Is Threatened By Rising Gas Prices
The European Economy Is Threatened By Rising Gas Prices
Chart 12Euro Area Fiscal Policy Is Expected To Be More Expansionary In The Years To Come Than Before The Pandemic
Hard Or Soft Landing? BCA Strategists Debate The Question
Hard Or Soft Landing? BCA Strategists Debate The Question
The Chinese economy continues to suffer from the “triple threat” of renewed Covid lockdowns, a shift of global demand away from manufactured goods towards services, and a floundering property market. We expect the Chinese property market to ultimately succumb to the same fate that befell Japan 30 years ago. Chart 13Chinese Stocks Are Cheap
Chinese Stocks Are Cheap
Chinese Stocks Are Cheap
Unlike Japanese stocks in the early 1990s, however, Chinese stocks are trading at fairly beaten down valuations – 10.9-times earnings and 1.4-times book for the investable index (Chart 13). With the Twentieth Party Congress slated for later this year and the population jaded by lockdowns, the political incentive to shower the economy with cash and loosen the reins on regulation will intensify. A Scenario Analysis For The S&P 500 Corralling all these moving parts is no easy matter. We would put the odds of a US recession over the next 12 months at 40%. This is double what we would have said a month ago when we tactically upgraded stocks after the S&P 500 fell below the 4,000 mark. The May CPI report was clearly a shocker, both to the Fed and the markets. The median dot in the June Summary of Economic Projections sees the Fed funds rate rising to 3.8% next year, smack dab in the middle of our once highly out-of-consensus estimate of 3.5%-to-4% for the neutral rate of interest. With interest rates potentially moving into restrictive territory next year, equity investors are right to be concerned. Yet, as noted above, if a recession does occur, it is likely to be a fairly mild one. At the time of the BCA monthly view meeting, the S&P 500 was already down 23% in nominal terms and 27% in real terms from its peak in early January. We assume that the S&P 500 will fall a further 10% in real terms over the next 12 months in a “mild recession” scenario (30% odds) and by 25% in a “deep recession” scenario (10% odds). Conversely, we assume that the S&P 500 will be 20% higher in 12 months’ time in a “no recession” scenario (60% odds). Note that even in a “no recession” scenario, the real value of the S&P 500 would still be down 12% in June 2023 from its all-time high. On a probability-weighted basis, the expected 12-month real return across all three scenarios works out to 6.5%, or 8% with dividends (Table 1). That is enough to justify a modest overweight in my view – but given the risks, just barely. Investors focused on capital preservation should consider a more conservative stance. Table 1S&P 500 Drawdowns Depending On Whether The US Will Enter A Recession And How Severe It Will Be
Hard Or Soft Landing? BCA Strategists Debate The Question
Hard Or Soft Landing? BCA Strategists Debate The Question
Most of my colleagues were more cautious than me, as they generally thought that the odds of a recession were greater than 50%. They voted to shift the BCA house view to a neutral asset allocation stance on equities, with a slight plurality favoring an outright underweight (10 for underweight; 9 for neutral; and 6 for overweight). Peter Berezin Chief Global Strategist peterb@bcaresearch.com Global Investment Strategy View Matrix
Hard Or Soft Landing? BCA Strategists Debate The Question
Hard Or Soft Landing? BCA Strategists Debate The Question
Special Trade Recommendations Current MacroQuant Model Scores
Hard Or Soft Landing? BCA Strategists Debate The Question
Hard Or Soft Landing? BCA Strategists Debate The Question
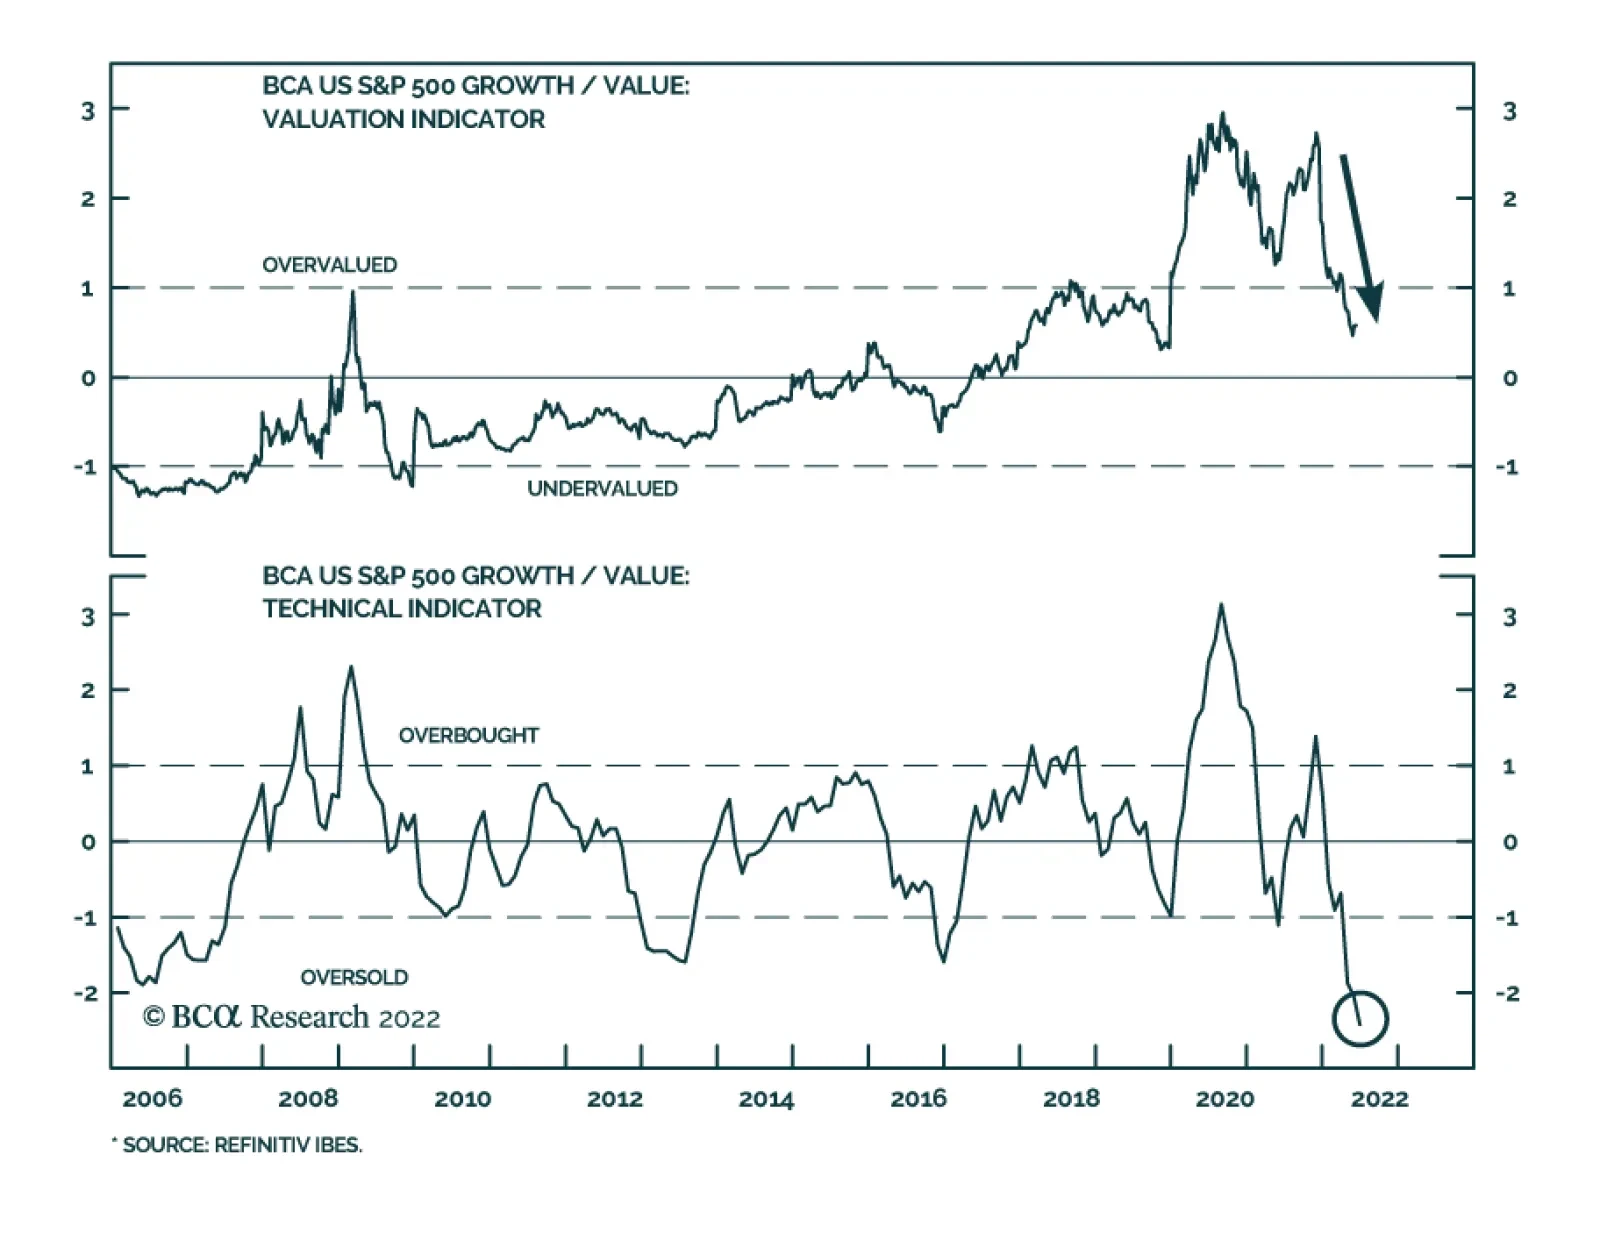
The year-to-date equity selloff has been particularly painful for Growth stocks. The S&P 500 Growth index’s 30% drawdown dwarfs the Value index’s 15% decline. The sharp increase in bond yields has weighed more heavily on the performance of Growth stocks,…
Executive Summary Surge In Yields Tanked Equities
Surge In Yields Tanked Equities
Surge In Yields Tanked Equities
In this week’s report, we conduct a post-mortem analysis of the past week’s market panic and probe the effect of the new developments on US equities. Inflation is embedded. US equities won’t find a bottom until inflation turns decisively. The Fed will continue to tighten monetary policy, and rates will rise until inflation rolls over. The Fed “put” is also no longer at play as the Fed has signaled that it cares far more about combating inflation than about the performance of the stock market. Economic growth is decelerating and is already surprising on the downside. Watch rates. With rates stable, the S&P 500 performance will be a function of earnings growth. With rates rising, the multiple will contract and will exacerbate the damage done by the earnings recession. Bottom Line: The S&P 500 is unlikely to find a bottom until inflation turns and monetary conditions stabilize. In addition, economic growth is slowing and an earnings recession is likely. We believe US equities will follow a “fat and down” trajectory in light of the recent developments. We recommend that investors “not be heroes” and keep sector allocation close to the benchmark. Overweight defensives vs. cyclicals. Feature The May CPI reading showed that despite the Fed’s “heroic actions,” inflation has not yet peaked—a data point that has shocked both the market and Fed officials. In an unprecedented move, the Fed, which prides itself on its transparent communication style and its ability to move the market by guiding its expectations, leaked its intention to raise rates by 75 bps to the WSJ despite the communications blackout period. Since last Friday, equity markets around the globe have been in turmoil, with the S&P 500 falling 8%. The NASDAQ is down 7%. Is this just a leg down of the “Fat and Flat” market we have called for with a rebound waiting in the wings, or is there a structural change in the inflationary backdrop and a relentless bear market set to continue? To answer these questions, we will revisit our macroeconomic calls to better understand what expectations need to be adapted to the new reality and what we should expect for US equities over the next three to six months. Sneak Preview: US equities are likely to fall further as monetary conditions continue to tighten and earnings growth is set to contract. We believe that equities will trade in a wide “channel” with multiple rallies and pullbacks, but the general direction is down until inflation turns decisively, and fears of recession dissipate. Why Did Equities Tank? The last few days in the markets were simply brutal. What were investors (and the Fed) panicking about? Here is our hunch: Inflation is not abating, while growth is slowing. Are we in the early innings of stagflation? We believe that stagflation is certainly a high risk. The Fed’s aggressive tightening of monetary conditions is bound to further slow economic growth and taper demand. However, the Fed has no means of controlling the supply side of the equation such as prices of food or energy, which surge because of constrained supply. Will monetary tightening be even more aggressive than expected? Will 75-bps rate rises become the Fed’s new normal? During the press conference, Chairman Powell reassured the market that a 75-bps rate hike is an extraordinary measure. However, both 50-bps and 75-bps rate hikes will be on the table in July. Are the markets on the cusp of a new monetary regime, and is the easy money of the past 12 years a thing of the past? The Fed’s balance sheet has increased from $2 trillion in 2009 to an unprecedented $9 trillion in 2022. This ultra-easy monetary policy has lifted asset values both in private and public markets. The new monetary regime of liquidity being drained from the financial markets to combat inflation is bound to be a major headwind for most asset classes. We believe that it will take a while to bring inflation back to the 2% target, and easy money in the near future is no longer in the cards. It is also unlikely that such a major Fed balance sheet expansion will ever be repeated. The Fed’s tightening via both rising rates and QT will result in a dearth of liquidity in the fixed income space— a credit/counterparty “black swan” may materialize, with MBS most exposed to this risk yet again. Withdrawal of liquidity is a hit to many asset classes, from private markets to unprofitable small-cap growth companies to fixed income markets. This is a serious concern that should be monitored. Incorporating New Data Into Macro And Market Calls We have been writing about these calls for a few months—let’s revisit them here to consider what may have changed recently. Peak Inflation Is Elusive We have never quite bought the argument of transitory inflation. To us, inflation is a product of excessive demand fueled by ultra-easy fiscal and monetary policy and supply chains hobbled by the pandemic. Recently, the situation has been exacerbated by shortages of food and energy. Inflation has spread from pandemic-related goods to “stickier” service items and is broad-based (Chart 1). The wage/price spiral is relentless (Chart 2), as consumer inflation expectations are on the rise, and the job market is on fire. Chart 1Inflation Is Entrenched And Broad-based
Inflation Is Entrenched And Broad-based
Inflation Is Entrenched And Broad-based
While we always believed that it would take inflation a long time to reach the coveted 2% level, we assumed that peak inflation was behind us. Our view that inflation was going to roll over was more down to a base effect rather than the Fed’s actions. In addition, we observed that demand for goods pulled forward by the pandemic had started fading, suppressed by rising prices and negative real wage growth. The Citigroup Inflation Surprise Index had also turned (Chart 3). Chart 2Wage-Price Spiral Is Relentless
Wage-Price Spiral Is Relentless
Wage-Price Spiral Is Relentless
Chart 3Inflation Was Surprising On The Downside
Inflation Was Surprising On The Downside
Inflation Was Surprising On The Downside
It is little consolation that we were in good company when rattled by the May headline inflation reading, which came in at 8.5% year on year, and 1% higher than in April. Headline inflation was certainly affected by the price of food and energy, while core inflation was down to a higher price of shelter and goods (Chart 4). While energy is excluded from core inflation, it permeates all aspects of the economy, increasing costs of raw materials, manufacturing, and transportation, which eventually get passed through to the prices of goods and services. The same is the case with the rising wage bill. Chart 4Inflation Picked Up Because Of Prices Of Shelter And Core Goods
Adaptive Expectations: Revisiting Our Views
Adaptive Expectations: Revisiting Our Views
Importantly, what is next? It would help if US shale producers ramped up production, and the Saudis opened their oil spigots, bringing the price of energy down. Short of that, the price of oil should become a function of a slowing economy and fading demand for goods as interest rates rise (Chart 5). While the Fed has little control over food and energy prices, wage-price dynamics fall squarely in its court. The key channel through which the Fed controls inflation is by cooling the economy and reducing the demand for labor. Rising unemployment is the only way to extinguish inflation in a decisive way. Chart 5Rates Surged
Rates Surged
Rates Surged
Eventually, inflation will turn but it may be in fits and starts, and each data point will have a heavy effect on the pace of monetary tightening and the direction of equity markets, with lower inflation readings igniting rallies and higher readings triggering sell-offs. Inflation is embedded. Of course, sooner or later, it will abate but until then we expect a much more aggressive monetary policy. Monetary Conditions Have Tightened Dramatically As we summarized in our “Market Capitulation Scorecard,” one of the key conditions of an equity market bottom, and potentially, even a sustainable rebound, is stabilization in monetary conditions. We hypothesized that this could happen as the Fed tightens monetary conditions and growth slows and inflation turns, pulling down long rates. We also believed that the market focus is going to start shifting away from concerns about inflation to concerns about economic growth. Friday’s inflation reading has changed that – now investors worry about inflation and growth. Rates have initially skyrocketed, with the 10-year Treasury yield moving by 30bps points over the course of three days from 3.18 to 3.48. Real rates increased from 0.38% to 0.63%. US financial conditions have tightened sharply (Chart 6), moving to the neutral level. What’s next is the most difficult question of this report. It is likely this fast and furious move in rates has accomplished in five days what usually takes weeks. Tighter monetary policy, as it stands now, until more data comes in, is priced in. These moves capture changes in dot-plot expectations revised by the Fed, with the peak rate moving from around 3% to 4%. And, of course, that move got priced into the equity space with the S&P 500 pulling back sharply (Chart 7). Chart 6Financial Conditions Are Moving Into Restrictive Territory
Financial Conditions Are Moving Into Restrictive Territory
Financial Conditions Are Moving Into Restrictive Territory
Chart 7Surge In Yields Tanked Equities
Surge In Yields Tanked Equities
Surge In Yields Tanked Equities
The Fed will continue to tighten monetary policy and rates will rise until inflation rolls over. However, once inflation abates, long rates are likely to stabilize, signaling slower growth ahead. The Fed Won’t Come To The Rescue The Fed “put” is no longer at play as the Fed has signaled that it cares far more about combating inflation than the performance of the stock market. In fact, falling equities will play into Powell’s hand as a negative wealth effect is likely to put a lid on inflationary pressures, with wealthier Americans paying the toll. Kansas City Fed President Esther George, the only member of the FOMC that voted against a 75bps rate hike in the June meeting (she was in favor of 50 bps) said in May: “The Federal Reserve is not targeting equity markets in its battle against inflation, but that is "one of the avenues" where the impact of tighter monetary policy will be felt".1 Further, the Fed is very concerned about a recent pick-up in the long-term consumer inflation expectations (Chart 8) and will likely err on the side of caution to manage these expectations and avoid a self-fulfilling prophecy. Chart 8The Fed Is Worried About Inflation Expectations
The Fed Is Worried About Inflation Expectations
The Fed Is Worried About Inflation Expectations
Economic Growth Is Slowing Fast, Both At Home And Abroad A tighter monetary policy is designed to slow economic growth. The World Bank has downgraded global GDP growth expectations from 4.1% to 2.9%, and import volumes are declining. The Atlanta GDPNow forecast is hovering around zero (Chart 9). The Philly Fed survey has just crossed into negative territory (Chart 10). Retail sales are contracting both in nominal and real terms. According to the Citi Economic Surprise Index, economic growth is surprising on the downside (Chart 11). While the probability of a recession has picked up over the past few weeks, it is earnings growth disappointment that will have an adverse effect on equities in the near term. Chart 9Consensus Expectation Are Still Too High
Consensus Expectation Are Still Too High
Consensus Expectation Are Still Too High
Chart 10Many Signs That Economy Is Slowing Sharply
Many Signs That Economy Is Slowing Sharply
Many Signs That Economy Is Slowing Sharply
Chart 11Economic Growth Disappoints
Economic Growth Disappoints
Economic Growth Disappoints
We maintain our view that economic growth is decelerating and is already surprising on the downside. Earnings Growth Will Contract And Take The Market With It We stated in last week’s “Is An Earnings Recession In The Cards?” report that this year’s sell-off has been triggered by fears of an aggressive Fed, tighter monetary policy, and rising rates. However, the decom- position of the total return demonstrates that the pullback was all about multiple contraction, while strong earnings growth helped absorb the blow. We hypothesized that the multiple contraction phase is complete and that the next leg of the bear market will be all about growth, and earnings growth in particular (Chart 12). Hence if rates stabilize, then multiples will stay at the current level, and returns will be a function of earnings growth. However, the 10-year Treasury rate increasing from 3.18 has resulted in the S&P 500 multiple contracting from 16.7 to 15.6 over the course of just three days, while earnings growth expectations have remained mostly intact. Currently, according to our very simple model (Chart 13), a 3.5% 10-year Treasury yield corresponds to the S&P 500 forward multiple of 16.8x, which is close to where the S&P 500 stands today. If rates rise further, the forward multiple will fall. Chart 12Multiple Contraction Will Be Followed By Earnings Growth Deceleration
Multiple Contraction Will Be Followed By Earnings Growth Deceleration
Multiple Contraction Will Be Followed By Earnings Growth Deceleration
Chart 13Higher Rates Translate Into Lower Equity Multiples
Adaptive Expectations: Revisiting Our Views
Adaptive Expectations: Revisiting Our Views
Our earnings growth model predicts that earnings growth will trend towards zero over the next three months (Chart 14). Chart 14Earnings Growth Will Trend To Zero And Then Contract
Adaptive Expectations: Revisiting Our Views
Adaptive Expectations: Revisiting Our Views
Our scenario analysis matrix shows that if multiples stay stable around 17x forward earnings, while earnings contract by zero to five percent next quarter, the index will be flat to slightly down (Table 1). Broadly speaking, with a stable multiple, the market will move in line with earnings growth. If rates continue to rise and the multiple falls to 16x, going another 11% down is likely. Table 1The S&P 500 Target Scenario Analysis
Adaptive Expectations: Revisiting Our Views
Adaptive Expectations: Revisiting Our Views
Watch rates. With rates stable, the S&P 500 performance will be a function of earnings growth, and the market is likely to be range-bound. With rates rising, a multiple will contract further, and equities will fall. Investment Implications: “Fat And Down” The SPX has discounted plenty of negative news now that it is officially in bear market territory. However, we believe that the S&P 500 is not yet close to the bottom. The market is again pricing in tighter monetary policy and rising rates, which is accompanied by multiple contraction. It is hard to see equities bottoming without inflation peaking. In addition, we are predicting that the next leg of the bear market will be driven by earnings growth, which is likely to contract due to an economic slowdown both at home and abroad. As such, “fat and down” may be a more likely outcome than just “fat and flat.” Bottom Line Equities will move in a wide range over the next three to six months. However, if rates are to rise further and earnings growth is to contract, they may be trading in a downward sloping “channel,” or “fat and down.” We recommend that investors “not be heroes” and keep sector allocation close to the benchmark. Overweight defensives vs. cyclicals. Irene Tunkel Chief Strategist, US Equity Strategy irene.tunkel@bcaresearch.com Footnotes 1 https://www.reuters.com/business/feds-george-policy-not-aimed-equity-markets-though-it-will-be-felt-there-cnbc-2022-05-19/#:~:text=WASHINGTON%2C%20May%2019%20(Reuters),Esther%20George%20said%20on%20Thursday. Recommended Allocation Recommended Allocation: Addendum
Is Earnings Recession In The Cards?
Is Earnings Recession In The Cards?
Executive Summary Structural Tailwinds For The Franc
Structural Tailwinds For The Franc
Structural Tailwinds For The Franc
Volatility in FX markets is likely to remain elevated, as witnessed by the reaction of a full circle of central bank meetings this week.Policy convergence remains a good bet for interest rate curves and currency pairs. The SNB surprised markets by raising interest rates by 50 bps, to -0.25%, the first hike since 2007.Higher volatility will continue to buoy the Swiss franc in the short run.Structural appreciation in the franc is also likely over the coming decades (Feature Chart). Swiss stocks often perform well during economic downturns, but they are not particularly cheap, and are vulnerable to higher interest rates. Investors should only overweight Swiss stocks if they expect more significant downside to global stocks.Valuation favors the franc versus the dollar. However, EUR/CHF and GBP/CHF are closer to fair value. CHF/JPY is expensive; hence, the yen is a better hedge for downside economic surprises. Go short CHF/JPY as a trade.BCA’s Foreign Exchange Strategy was short CHF/SEK at 10.2 with stop loss at 10.5. That stop was hit overnight, triggering a loss of -3.3%. Stand aside for now.Bottom Line: Favor the franc over the short term against other pro-cyclical currencies, with a view to downgrade CHF when it becomes evident that economic growth is bottoming. Any further bout of Swiss equity outperformance, prompted by global risk aversion, offers an attractive selling opportunity versus Eurozone stocks.Feature Chart 1The SNB Has Capitulated To Rising Inflation
The SNB Has Capitulated To Rising Inflation
The SNB Has Capitulated To Rising Inflation
Volatility in FX markets is likely to remain elevated. This week, the Fed delivered its first 75 bps interest rate hike since 1994. It also increased its expected year-end level for the Fed Funds rate to 3.4% from 1.9%, and to 3.8% from 3.4% at the end of 2023. The FX market had been warming up to a hawkish surprise, but the dollar surged on the news, hitting a fresh two-decade high of 105.5, before later reversing gains.Meanwhile, the European Central Bank (ECB) held an emergency meeting on Wednesday, to try to mitigate the rise in Italian yields, which hit as high as 4.2% on Tuesday, or 243 bps over German 10-year yields. The subsequent statement released by the Governing Council offered no concrete details. Yes, the reinvestments of the proceeds from maturing debt in the Pandemic Emergency Purchase Program (PEPP) will flow mostly to peripheral markets, but investors want clarity on the nature of the long-awaited policy plan to tackle fragmentation risk in the Euro Area. As a result, peripheral bond markets will remain fragile until a bold program comes to fruition.To cement currency volatility this week, SNB Governor Thomas Jordan surprised markets by raising interest rates by 50 bps in Switzerland, to -0.25%, the first hike since the Global Financial Crisis (Chart 1). The negative interest rate threshold for sight deposits was also lowered, a move encouraging banks to pack reserves at the SNB. The Bank of England also raised interest rates in line with market expectations. The move initially disappointed GBP bulls, but sterling is holding above our 1.20 floor.An environment of monetary policy uncertainty, rising recession risks in response to high inflation, and the potential for central bank policy mistakes bodes well for safe-haven assets. In Europe, the market with the strongest defensive profile is Switzerland. In this report, we address whether investors should bet on continued appreciation of the franc and an outperformance of Swiss stocks, especially now that the SNB has turned hawkish.Switzerland Versus The WorldGlobal economic growth is slowing and a small/open economy like Switzerland’s has not been spared. The KOF economic barometer, a key leading indicator for Swiss GDP growth, has collapsed over the past twelve months from 144 to 97 as global industrial activity decelerated (Chart 2). Despite softening growth, global inflation refuses to decline, forcing central banks worldwide to lean into the slowdown. This threatens to cut the post-pandemic business cycle expansion short. Chart 2The SNB Is Tightening Into A Slowing Economy
The SNB Is Tightening Into A Slowing Economy
The SNB Is Tightening Into A Slowing Economy
Surprisingly, the Swiss economy is generally performing better than the rest of Europe. Historically, Swiss economic performance is procyclical due to the large share of exports within its GDP. Hence, a slowdown in global manufacturing often creates a large threat to Swiss growth. Going forward, can the Swiss economy diverge from that of the rest of the world (Chart 3)? Such a divergence is not probable, but a few factors will protect the Swiss economy:Switzerland still has one of the lowest policy rates in the G10, even after today’s 50bps interest rate increase. This has tremendously helped ease monetary conditions. Our monetary gauge is at its most accommodative level in over two decades (Chart 4). Chart 3The Swiss Economy Is Procyclical
The Swiss Economy Is Procyclical
The Swiss Economy Is Procyclical
Chart 4Swiss Monetary Conditions Are Still Accommodative
Swiss Monetary Conditions Are Still Accommodative
Swiss Monetary Conditions Are Still Accommodative
Swiss inflation remains the lowest in the G10 outside Japan. In Switzerland, the main driver of price increases has been goods, while services inflation remains subdued. Consequently, the SNB has been tolerating an appreciating franc to temper imported inflation (Chart 5), while keeping domestic borrowing costs at very accommodative levels. In its updated forecasts, the SNB now expects a -0.25% interest rate to allow Swiss inflation to moderate to 1.9% in 2023 and 1.6% in 2024. Chart 5Swiss Inflation Is Surprising To The Upside
Swiss Inflation Is Surprising To The Upside
Swiss Inflation Is Surprising To The Upside
Part of the reason Switzerland has low inflation has been the tremendous productivity gains, especially relative to its trading partners (Chart 6). Swiss income-per-capita is elevated, but wage growth has lagged output gains, which limits the risk of a wage-inflation spiral. It is notable that part-time employment continues to dominate job gains, implying that the need for precautionary savings will remain high in Switzerland. Chart 6A Productivity Profile For Switzerland
A Productivity Profile For Switzerland
A Productivity Profile For Switzerland
Higher productivity growth and the elevated national savings leave their footprint on the trade data. The Swiss trade balance is hitting fresh highs, unlike Europe or Japan (Chart 7). This could potentially create a problem for the Swiss economy as it puts upward pressure on the CHF at a time when global manufacturing output is slowing. However, Switzerland specializes in high value-added exports with an elevated degree of complexity, that stand early in global supply chains. These type of goods are likely to remain in high demand in a global environment marked by supply-chain bottlenecks and high-capacity utilization. Chart 7Structural Tailwinds For The Franc
Structural Tailwinds For The Franc
Structural Tailwinds For The Franc
Finally, Switzerland does not import energy to fulfill its electricity production. Hydropower accounts for roughly 61.4% of electricity generation, followed by nuclear power at 28.5%. This has partially insulated Switzerland from the energy shock hurting economic activity and trade balances in the EU. For example, German electricity generation is 28.8% coal and 14.7% natural gas.Bottom Line: The Swiss economy is reopening and is relatively insulated from the Russia-Ukraine conflict. This limits to some degree how closely Switzerland will track the global and European economic slowdown. It creates a departure from the traditional pro-cyclicality of the Swiss economy.The SNB, The SARON Curve, And The Swiss FrancIf the Swiss economy surprises to the upside, the case for the SNB to tolerate a rising franc becomes even stronger. The pace of foreign exchange reserve accumulation is already decelerating (Chart 8). Governor Thomas Jordan has been very clear: as global prices rise, the fair value of the franc is also rising, which implies a willingness to tolerate currency strength. In a purchasing power parity framework, higher external inflation makes Swiss goods relatively cheaper. This allows foreigners to bid up the currency.Even with today’s updated pricing, the SNB is still expected to remain among the most dovish central banks in the G10 (Chart 9). If inflationary pressures prove sticky, the SNB will step up its hawkish rhetoric. If inflationary fears subside, then global rates will fall as well, which has usually been a boon for the franc. More specifically, this would be negative for the EUR/CHF cross (Chart 10). Chart 8Less Intervention By The SNB
Less Intervention By The SNB
Less Intervention By The SNB
Chart 9The SARON Curve Has Adjusted Higher
The SARON Curve Has Adjusted Higher
The SARON Curve Has Adjusted Higher
Chart 10EUR/CHF And Bund Yields Can Continue To Diverge
EUR/CHF And Bund Yields Can Continue To Diverge
EUR/CHF And Bund Yields Can Continue To Diverge
The Swiss economy can tolerate an appreciating CHF, but can it withstand higher interest rates? We believe so. Switzerland is a net creditor nation, but its domestic non-financial debt is also extremely elevated. Thus, the Swiss economy is vulnerable to higher rates, especially the housing market (Chart 11). Nonetheless, internal adjustments will soften the blow and increase affordability. Of note, property speculation in Switzerland has decreased in response to macroprudential measures. Growth in rental housing prices, which usually constitute the bulk of investment homes, has collapsed, but the price of owner-occupied homes has proven more robust (Chart 12). A cap on the percentage of secondary homes in any Canton as well as tighter lending standards have also helped. In a renewed update to its Financial Stability Report, Fritz Zurbrügg, Vice Chairman of the Governing Board, suggests that Swiss banks are well capitalized, especially given the recent reactivation of the countercyclical capital buffer. Chart 11Higher Rates Are A Risk For Swiss Real Estate
Higher Rates Are A Risk For Swiss Real Estate
Higher Rates Are A Risk For Swiss Real Estate
Chart 12Some Adjustment Already In Investment Home Prices
Some Adjustment Already In Investment Home Prices
Some Adjustment Already In Investment Home Prices
In the very near term, demographics might also be a tailwind. The pandemic limited immigration to Switzerland, but the working-age population is rebounding anew (Chart 13), which will create a cushion under housing and support domestic demand. Chart 13A Small Demographic Tailwind For Home Prices
A Small Demographic Tailwind For Home Prices
A Small Demographic Tailwind For Home Prices
Stronger aggregate demand in an inflationary world will justify the need for less monetary accommodation. In a nutshell, the SNB is likely to continue walking the path of “least regrets” like most central banks, by tightening monetary policy to meet its 2% inflation mandate, but pausing if economic conditions warrant.The currency has historically been used as a key tool for calibrating financial conditions. From a fundamental perspective, our PPP models suggest the franc is quite cheap versus the dollar but at fair value versus the euro and sterling. This is echoed by Governor Jordan, who no longer views the franc as expensive. Our models adjusts the consumption basket in Switzerland for an apples-to-apples comparison across both the UK and the eurozone (Chart 14). Chart 14AA CHF Is At Fair Value Versus The EUR And GBP
A CHF Is At Fair Value Versus The EUR And GBP
A CHF Is At Fair Value Versus The EUR And GBP
Chart 14BA CHF Is At Fair Value Versus The EUR And GBP
A CHF Is At Fair Value Versus The EUR And GBP
A CHF Is At Fair Value Versus The EUR And GBP
Finally, hedging costs for shorting the franc against the dollar have risen substantially (Chart 15). As such, any short bets on the franc are likely being placed naked. If the Fed ends up tempering its pace of rate hikes next year in response to weaker US activity, short-covering activity is likely to accentuate any pre-existing strength in the CHF. Chart 15Hedging Costs For USD/CHF Carry Trades Have Risen Hedging Costs Are Prohibitive
Hedging Costs For USD/CHF Carry Trades Have Risen Hedging Costs Are Prohibitive
Hedging Costs For USD/CHF Carry Trades Have Risen Hedging Costs Are Prohibitive
Bottom Line: The franc is undervalued against the dollar, and a good hedge against a rise in volatility versus other procyclical currencies. This places the franc in a good “heads I win, tails I don’t loose too much” bet. Swiss interest rates are also likely to climb higher. However, because the franc will do the bulk of the monetary tightening, the SNB is likely to lag the expectations now embedded in the SARON curve.What About Swiss Equities?Despite the cyclical nature of the Swiss economy, Swiss equities are extremely defensive. Swiss stocks have little to do with the domestic economy and are mostly a collection of large multinationals, dominated by the healthcare and consumer staples sectors, which together account for roughly 60% of the Swiss MSCI benchmark.This defensive attribute has created its own problem for Swiss equities. Relative to the Eurozone, the Swiss market has moved massively ahead of profitability, and it is now more expensive than at the apex of the European debt crisis in 2012 (Chart 16). Moreover, the jump in German yields is becoming increasingly problematic for Swiss stocks that historically perform poorly when global interest rates are rising (Chart 17). Chart 16Swiss Stocks Are Expensive
Swiss Stocks Are Expensive
Swiss Stocks Are Expensive
Chart 17A Lost Tailwind
A Lost Tailwind
A Lost Tailwind
In the near term, Swiss equities will only be able to defy the gravitational pull created by demanding valuations and higher yields if global risk aversion remains elevated. However, once global stocks find a floor and Italian spreads begin to narrow, Swiss stocks are likely to underperform massively (Chart 18). It could take a few more weeks before the BTP/Bund spreads narrow as the recent ECB announcement was rather tepid. However, the ECB holding an emergency meeting and issuing a formal statement addressing the problem facing peripheral bond markets suggests that a formal program designed to manage fragmentation risk will emerge before the end of the summer.Beyond their defensive attributes, Swiss stocks also correlate to the Quality Factor. The robust performance of this factor since the turn of the millennium, in Europe and globally, has allowed the Swiss market to greatly outperform Eurozone equities (Chart 19). However, the Quality Factor has begun to underperform, which indicates that the Swiss market is losing another of its underpinnings. Chart 18Near-term, Follow Risk Aversion
Near-term, Follow Risk Aversion
Near-term, Follow Risk Aversion
Chart 19Swiss Stocks Are About Quality
Swiss Stocks Are About Quality
Swiss Stocks Are About Quality
These observations imply that over the next 12 to 18 months, Swiss equities will underperform their Euro Area counterparts. Materials and consumer staples stand out as the two sectors with the most extended valuations relative to their Euro Area competitors, especially since their relative performances have become dissociated from relative profits (Chart 20). They should carry maximum underweights relative to their European counterparts. The healthcare sector is Switzerland’s largest market weight. It is not as expensive relative to the Eurozone as the materials and consumer staples sectors, but it carries enough of a premium that investors should still underweight this sector relative to its eurozone competitor (Chart 21). Chart 20Dangerous Setup For Swiss Materials and Staples
Dangerous Setup For Swiss Materials and Staples
Dangerous Setup For Swiss Materials and Staples
Chart 21The Swiss Heavyweight Is Becoming Pricey
The Swiss Heavyweight Is Becoming Pricey
The Swiss Heavyweight Is Becoming Pricey
Bottom Line: The defensive nature of the Swiss market has allowed for a large outperformance over European equities. However, the Swiss market is now very expensive on a relative basis, and it is vulnerable to higher interest rates. While global risk aversion can still buoy the Swiss market in the near term, conditions are falling into place for Swiss stocks to underperform their Eurozone counterpart over a 12-to-18 month window. Materials and consumer staples are the sectors mostly likely to experience a large underperformance relative to their Euro Area competitors, followed by the healthcare sector. Investment ConclusionsVolatility in FX markets is likely to remain elevated, as witnessed by the reaction of a full circle of central bank meetings this week.Policy convergence remains a good bet for interest rate curves and currency pairs. The SNB surprised markets by raising interest rates by 50 bps, to -0.25%, the first hike since 2007 (Chart 1).Higher volatility will continue to buoy the Swiss franc in the short run.Structural appreciation in the franc is also likely over the coming decades.Swiss stocks often perform well during economic downturns, but they are not particularly cheap, and vulnerable to higher interest rates. Investors should only overweight Swiss stocks if they expect more significant downside to global stocks.Valuation favors the franc versus the dollar. However, EUR/CHF and GBP/CHF are closer to fair value. CHF/JPY is expensive; hence the yen is a better hedge for downside economic surprises. Go short CHF/JPY as a trade.BCA’s Foreign Exchange Strategy was short CHF/SEK at 10.2 with stop loss at 10.5. That stop was hit overnight, triggering a loss of -3.3%. Stand aside for now. Chester NtoniforForeign Exchange Strategistchestern@bcaresearch.comMathieu Savary Chief European StrategistMathieu@bcaresearch.com
Listen to a short summary of this report. Executive Summary Higher Real Yields Have Weighed On Equity Valuations
Higher Real Yields Have Weighed On Equity Valuations
Higher Real Yields Have Weighed On Equity Valuations
I had the pleasure of visiting clients in Saudi Arabia, Bahrain, and Abu Dhabi last week. In contrast to the rest of the world, the mood in the Middle East was very positive. While high oil prices are helping, there is also a lot of optimism about ongoing structural reforms. Petrodollar flows are increasingly being steered towards private and public equities. EM assets stand to benefit the most. Producers in the region are trying to offset lost Russian output, but realistically, they will not be able to completely fill the gap in the near term. Today’s high energy prices have largely baked in this reality, as reflected in strongly backwardated futures curves. There was no consensus about how high oil prices would need to rise to trigger a global recession, although the number $150 per barrel got bandied about a lot. Given that most Middle Eastern currencies are pegged to the dollar, there was a heavy focus on Fed policy. Market estimates of the neutral rate in the US have increased rapidly towards our highly out-of-consensus view. Nevertheless, we continue to see modest upside for bond yields over a multi-year horizon. Over a shorter-term 6-to-12-month horizon, the direction of bond yields will be guided by the evolution of inflation. While US CPI inflation rose much more than expected in May, the details of the report were somewhat less worrying, as they continue to show significant supply-side distortions. Bottom Line: Inflation should come down during the remainder of the year, allowing the Fed to breathe a sigh of relief and stocks to recover some of their losses. A further spike in oil prices is a major risk to this view. Dear Client, Instead of our regular report next week, we will be sending you a Special Report written by Chester Ntonifor, BCA Research’s Chief Foreign Exchange Strategist, discussing the outlook for gold. We will be back the following week with the GIS Quarterly Strategy Outlook, where we will explore the major trends that are set to drive financial markets in the rest of 2022 and beyond. As always, I will hold a webcast discussing the outlook the following week, on Thursday, July 7th. Best regards, Peter Berezin Chief Global Strategist Peter in Arabia I had the pleasure of visiting clients in Saudi Arabia, Bahrain, and Abu Dhabi last week. This note summarizes my impressions and provides some commentary about recent market turmoil. The Mood in the Region is Very Positive In contrast to the rest of the world, the mood in the Middle East was upbeat. Obviously, high oil prices are a major contributor (Chart 1). Across the region, stock markets are still up for the year (Chart 2). Chart 1Oil Prices Have Shot Up
Oil Prices Have Shot Up
Oil Prices Have Shot Up
Chart 2Middle Eastern Stock Markets Are Doing Relatively Well This Year
Middle Eastern Stock Markets Are Doing Relatively Well This Year
Middle Eastern Stock Markets Are Doing Relatively Well This Year
That said, I also felt that investors were encouraged by ongoing structural reforms, especially in Saudi Arabia where the Vision 2030 program is being rolled out. The program seeks to diversify the Saudi economy away from its historic reliance on petroleum exports. A number of people I spoke with cited the Saudi sovereign wealth fund’s acquisition of a majority stake in Lucid, a California-based EV startup, as the sort of bold move that would have been unthinkable a few years ago. I first visited Riyadh in May 2011 where I controversially delivered a speech entitled “The Coming Commodity Bust” (oil was $120/bbl then and copper prices were near an all-time high). The city has changed immensely since then. The number of restaurants and entertainment venues has increased exponentially. The ban on women drivers was lifted only four years ago. In that short time, it has become a common-day occurrence. Capital Flows Into and Out of the Region are Reflecting a New Geopolitical Reality In addition to high oil prices and structural reforms, geopolitical considerations are propelling significant capital inflows into the region. The freezing of Russia’s foreign exchange reserves sent a shockwave across much of the world, with a number of other EM countries wondering if “they are next.” Ironically, the Middle East has emerged as a neutral player of sorts in this multipolar world, and hence a safer destination for capital flows. On the flipside, the region’s oil exporters appear to be acting more strategically in how they allocate their petrodollar earnings. Rather than simply parking the proceeds of oil sales in overseas US dollar bank accounts, they are investing them in ways that further their economic and political goals. One clear trend is that equity allocations to both overseas public and private markets are rising. Other emerging markets stand to benefit the most from this development, especially EMs who have assets that Middle Eastern countries deem important – assets tied to food security being a prime example. Assuming that the current level of oil prices is maintained, we estimate that non-US oil exports will rise to $2.5 trillion in 2022, up from $1.5 trillion in 2021 (Chart 3). About 40% of this windfall will flow to the Middle East. That is a big slug of cash, enough to influence the direction of equity markets. Chart 3Oil Exporters Reaping The Benefits Of High Oil Prices
An Oasis Of Optimism: Notes From The Middle East
An Oasis Of Optimism: Notes From The Middle East
Middle Eastern Energy Producers Will Boost Output, But Don’t Expect Any Miracles in the Short Term Russian oil production will likely fall by about 2 million bpd relative to pre-war levels over the next 12 months. To help offset the impact, OPEC has already raised production by 200,000 barrels and will almost certainly bump it up again following President Biden’s visit to the region in July (Chart 4). The decision to raise production to stave off a super spike in oil prices is not entirely altruistic. The region’s oil exporters know that excessively high oil prices could tip the global economy into recession, an outcome that would surely lead to much lower oil prices down the road. There was not much clarity on what that tipping point is, but the number $150 per barrel got bandied around a lot. Politics is also a factor. A further rise in oil prices could compel the US to make a deal with Iran, something the Saudis do not want to see happen. Still, there is a practical limit to how much more oil the Saudis and other Middle Eastern producers can bring to market in the near term. Today’s high energy prices have largely baked in this reality, as reflected in strongly backwardated futures curves (Chart 5). Chart 4Output Trends In The Major Oil Producers
Output Trends In The Major Oil Producers
Output Trends In The Major Oil Producers
Chart 5Energy Prices On Both Sides Of The Atlantic
An Oasis Of Optimism: Notes From The Middle East
An Oasis Of Optimism: Notes From The Middle East
Data on Saudi’s excess capacity is notoriously opaque, but I got the feeling that an extra 1-to-1.5 million bpd was the most that the Kingdom could deliver. The same constraints apply to natural gas. Qatar is investing nearly $30 billion to expand its giant North Field, which should allow gas production to rise by as much as 60%. However, it will take four years to complete the project. The share of Qatari liquefied natural gas (LNG) going to Europe has actually declined this year. About 80% of Qatar’s LNG is sold to Asian buyers under long-term contracts that cannot be easily adjusted. And even if those contracts could be rewritten, this would only bring limited benefits to Europe. For example, Germany has no terminals to accept LNG imports, although it is planning to build two. While there was plenty of sympathy to Europe’s plight in the region, there was also a sense that European governments had been cruising for a bruising by doubling down on strident anti-fossil fuel rhetoric over the past decade without doing much to end their dependence on Russian oil and gas. In that context, few in the region seemed willing to bend over backwards to help Europe. In the meantime, the US remains Europe’s best hope. US LNG shipments to Europe have tripled since last year. The US is now sending nearly three quarters of its liquefied gas to Europe. This has pushed up US natural gas prices, although they still remain a fraction of what they are in Europe. Huge Focus on the Fed Chart 6Most Of The Increase In Bond Yields Has Been In The Real Component
Most Of The Increase In Bond Yields Has Been In The Real Component
Most Of The Increase In Bond Yields Has Been In The Real Component
Most Middle Eastern currencies are pegged to the dollar, and hence the region effectively imports its monetary policy from the US. Not surprisingly, clients were very focused on the Federal Reserve. Many expressed concern about the abrupt pace of rate hikes. One of our high-conviction views is that the neutral rate of interest in the US has risen as the household deleveraging cycle has ended, fiscal policy has become structurally looser, and a growing number of baby boomers have transitioned from working (and saving) to retirement (and dissaving). The markets have rapidly priced in this view over the course of 2022. The 5-year/5-year forward Treasury yield – a proxy for the neutral rate – has increased from 1.90% at the start of the year to 3.21% at present. Most of this increase in the market’s estimate of the neutral rate has occurred in the real component. The 5-year/5-year forward TIPS yield has climbed from -0.49% to 0.84%; in contrast, the implied TIPS breakeven inflation rate has risen from only 2.24% to 2.37% (Chart 6). Implications of Higher Bond Yields on Equity Prices and the Economy Chart 7Higher Real Yields Have Weighed On Equity Valuations
Higher Real Yields Have Weighed On Equity Valuations
Higher Real Yields Have Weighed On Equity Valuations
As both theory and practice suggest, there is a strong negative correlation between real bond yields and equity valuations. Chart 7 shows that the S&P 500 forward P/E ratio has been moving broadly in line with the 5-year/5-year forward TIPS yield. The bad news is that there is still scope for bond yields to rise over the long haul. Our fair value estimate of 3.5%-to-4% for the neutral rate is about 25-to-75 basis points above current pricing. The good news is that a high neutral rate helps insulate the economy from a near-term recession. Recessions typically occur only when monetary policy turns restrictive. A few clients cited the negative Q1 GDP reading and the near-zero Q2 growth estimate in the Atlanta Fed GDPNow model as evidence that a US recession is either close at hand or has already begun (Chart 8). Chart 8Underlying US Growth Is Expected To Be Solid In Q2
An Oasis Of Optimism: Notes From The Middle East
An Oasis Of Optimism: Notes From The Middle East
We would push back against such an interpretation. In contrast to the -1.5% real GDP print, real Gross Domestic Income (GDI) rose by 2.1% in Q1. Conceptually, GDP and GDI should be equal, but since the two numbers are compiled in different ways, there can often be major statistical discrepancies. A simple average of the two suggests the US economy still grew in the first quarter. More importantly, real final sales to private domestic purchasers rose by 3.9% in Q1. This measure of economic activity – which strips out the often-noisy contributions from inventories, government expenditures, and net exports – is the best predictor of future GDP growth of any item in the national accounts (Table 1). Table 1A Good Sign: Real Final Sales To Private Domestic Purchasers Rose By 3.9% In Q1
An Oasis Of Optimism: Notes From The Middle East
An Oasis Of Optimism: Notes From The Middle East
As far as Q2 is concerned, real final sales to private domestic purchasers are tracking at 2.0% according to the Atlanta Fed model – a clear deceleration from earlier this year, but still consistent with a generally healthy economy. Growth will probably slow in the third quarter, reflecting the impact of higher gasoline prices, rising interest rates, and lower asset prices. Nevertheless, the fundamental underpinnings for the economy – low household debt, $2.2 trillion in excess savings, a dire need to boost corporate capex and homebuilding, and a strong labor market – remain in place. The odds of a recession in the next 12 months are quite low. Gauging Near-Term Inflation Dynamics A higher-than-expected neutral rate of interest implies that bond yields will probably rise from current levels over the long run. Over a shorter-term 6-to-12-month horizon, however, the direction of yields will be guided by the evolution of inflation. While the core CPI surprised on the upside in May, the details of the report were somewhat less worrying, as they continue to show significant supply-side distortions. Excluding vehicles, core goods prices rose 0.3% in May, down from a Q1 average of 0.7% (Chart 9). Recent commentary from companies such as Target suggest that goods inflation will ease further. Chart 9Goods Inflation Is Moderating, While Service Price Growth Is Elevated
An Oasis Of Optimism: Notes From The Middle East
An Oasis Of Optimism: Notes From The Middle East
Stripping out energy-related services, services inflation slowed slightly to 0.6% in May from 0.7% in April. A deceleration in wage growth should help keep a lid on services inflation over the coming months (Chart 10). Chart 10A Deceleration In Wage Growth Should Help Keep Services Inflation Contained
An Oasis Of Optimism: Notes From The Middle East
An Oasis Of Optimism: Notes From The Middle East
During his press conference, Fed Chair Powell described the rise in inflation expectations in the University of Michigan survey as “quite eye-catching.” Although long-term inflation expectations remain a fraction of what they were in the early 1980s, they did rise to the highest level in 14 years in June (Chart 11). Powell also noted that the Fed’s Index of Common Inflation Expectations has been edging higher. The Fed’s focus on ensuring that inflation expectations remain well anchored is understandable. That said, there is a strong correlation between the level of gasoline prices and inflation expectations (Chart 12). If gasoline prices come down from record high levels over the coming months, inflation expectations should drop. Chart 11Consumer Long-Term Inflation Expectations Keep Rising, But Are Still Not At Historically High Levels
Consumer Long-Term Inflation Expectations Keep Rising, But Are Still Not At Historically High Levels
Consumer Long-Term Inflation Expectations Keep Rising, But Are Still Not At Historically High Levels
Chart 12Lower Gasoline Prices Would Help Soothe Consumer Fears Over Inflation
Lower Gasoline Prices Would Help Soothe Consumer Fears Over Inflation
Lower Gasoline Prices Would Help Soothe Consumer Fears Over Inflation
The Fed expects core PCE inflation to fall to 4.3% on a year-over-year basis by the end of 2022. This would require month-over-month readings of about 0.35 percentage points, which is slightly above the average of the past three months (Chart 13). Our guess is that the Fed may be highballing its near-term inflation projections in order to give itself room to “underpromise and overdeliver” on the inflation front. If so, we could see inflation estimates trimmed later this year, which would provide a more soothing backdrop for risk assets. Chart 13AUS Inflation Will Fall By More Than The Fed Expects If The Monthly Change In Core PCE Is Less Than 0.35% (I)
US Inflation Will Fall By More Than The Fed Expects If The Monthly Change In Core PCE Is Less Than 0.35% (I)
US Inflation Will Fall By More Than The Fed Expects If The Monthly Change In Core PCE Is Less Than 0.35% (I)
Chart 13BUS Inflation Will Fall By More Than The Fed Expects If The Monthly Change In Core PCE Is Less Than 0.35% (II)
US Inflation Will Fall By More Than The Fed Expects If The Monthly Change In Core PCE Is Less Than 0.35% (II)
US Inflation Will Fall By More Than The Fed Expects If The Monthly Change In Core PCE Is Less Than 0.35% (II)
Concluding Thoughts on Investment Strategy According to Bank of America, fund managers cut their equity exposure to the lowest since May 2020. Optimism on global growth fell to a record low. Meanwhile, bears outnumbered bulls by 39 percentage points in this week’s AAII poll (Chart 14). If the stock market is about to crash, it will be the most anticipated crash in history. In my experience, markets rarely do what most people expect them to do. Chart 14Sentiment Towards Equities Is Pessimistic
Sentiment Towards Equities Is Pessimistic
Sentiment Towards Equities Is Pessimistic
Chart 15Global Equities Are More Attractively Valued After The Recent Sell-Off
Global Equities Are More Attractively Valued After The Recent Sell-Off
Global Equities Are More Attractively Valued After The Recent Sell-Off
Chart 16US And European EPS Estimates Have Been Trending Higher This Year
US And European EPS Estimates Have Been Trending Higher This Year
US And European EPS Estimates Have Been Trending Higher This Year
US equities are trading at 16.3-times forward earnings, with non-US stocks sporting a forward P/E ratio of 12.1 (Chart 15). Despite the decline in share prices, earnings estimates in both the US and Europe have increased since the start of the year (Chart 16). The consensus is that those estimates will fall. However, if our expectation that a recession will be averted over the next 12 months pans out, that may not happen. A sensible strategy right now is to maintain a modest overweight to stocks while being prepared to significantly raise equity exposure once clear evidence emerges that inflation has peaked. Peter Berezin Chief Global Strategist peterb@bcaresearch.com Follow me on LinkedIn Twitter View Matrix
An Oasis Of Optimism: Notes From The Middle East
An Oasis Of Optimism: Notes From The Middle East
Special Trade Recommendations Current MacroQuant Model Scores
An Oasis Of Optimism: Notes From The Middle East
An Oasis Of Optimism: Notes From The Middle East
Executive Summary Structural Tailwinds For The Franc
Structural Tailwinds For The Franc
Structural Tailwinds For The Franc
Volatility in FX markets is likely to remain elevated, as witnessed by the reaction of a full circle of central bank meetings this week. Policy convergence remains a good bet for interest rate curves and currency pairs. The SNB surprised markets by raising interest rates by 50 bps, to -0.25%, the first hike since 2007. Higher volatility will continue to buoy the Swiss franc in the short run. Structural appreciation in the franc is also likely over the coming decades (Feature Chart). Swiss stocks often perform well during economic downturns, but they are not particularly cheap, and are vulnerable to higher interest rates. Investors should only overweight Swiss stocks if they expect more significant downside to global stocks. Valuation favors the franc versus the dollar. However, EUR/CHF and GBP/CHF are closer to fair value. CHF/JPY is expensive; hence, the yen is a better hedge for downside economic surprises. Go short CHF/JPY as a trade. BCA’s Foreign Exchange Strategy was short CHF/SEK at 10.2 with stop loss at 10.5. That stop was hit overnight, triggering a loss of -3.3%. Stand aside for now. Bottom Line: Favor the franc over the short term against other pro-cyclical currencies, with a view to downgrade CHF when it becomes evident that economic growth is bottoming. Any further bout of Swiss equity outperformance, prompted by global risk aversion, offers an attractive selling opportunity versus Eurozone stocks. Feature Chart 1The SNB Has Capitulated To Rising Inflation
The SNB Has Capitulated To Rising Inflation
The SNB Has Capitulated To Rising Inflation
Volatility in FX markets is likely to remain elevated. This week, the Fed delivered its first 75 bps interest rate hike since 1994. It also increased its expected year-end level for the Fed Funds rate to 3.4% from 1.9%, and to 3.8% from 3.4% at the end of 2023. The FX market had been warming up to a hawkish surprise, but the dollar surged on the news, hitting a fresh two-decade high of 105.5, before later reversing gains. Meanwhile, the European Central Bank (ECB) held an emergency meeting on Wednesday, to try to mitigate the rise in Italian yields, which hit as high as 4.2% on Tuesday, or 243 bps over German 10-year yields. The subsequent statement released by the Governing Council offered no concrete details. Yes, the reinvestments of the proceeds from maturing debt in the Pandemic Emergency Purchase Program (PEPP) will flow mostly to peripheral markets, but investors want clarity on the nature of the long-awaited policy plan to tackle fragmentation risk in the Euro Area. As a result, peripheral bond markets will remain fragile until a bold program comes to fruition. To cement currency volatility this week, SNB Governor Thomas Jordan surprised markets by raising interest rates by 50 bps in Switzerland, to -0.25%, the first hike since the Global Financial Crisis (Chart 1). The negative interest rate threshold for sight deposits was also lowered, a move encouraging banks to pack reserves at the SNB. The Bank of England also raised interest rates in line with market expectations. The move initially disappointed GBP bulls, but sterling is holding above our 1.20 floor. An environment of monetary policy uncertainty, rising recession risks in response to high inflation, and the potential for central bank policy mistakes bodes well for safe-haven assets. In Europe, the market with the strongest defensive profile is Switzerland. In this report, we address whether investors should bet on continued appreciation of the franc and an outperformance of Swiss stocks, especially now that the SNB has turned hawkish. Switzerland Versus The World Global economic growth is slowing and a small/open economy like Switzerland’s has not been spared. The KOF economic barometer, a key leading indicator for Swiss GDP growth, has collapsed over the past twelve months from 144 to 97 as global industrial activity decelerated (Chart 2). Despite softening growth, global inflation refuses to decline, forcing central banks worldwide to lean into the slowdown. This threatens to cut the post-pandemic business cycle expansion short. Chart 2The SNB Is Tightening Into A Slowing Economy
The SNB Is Tightening Into A Slowing Economy
The SNB Is Tightening Into A Slowing Economy
Surprisingly, the Swiss economy is generally performing better than the rest of Europe. Historically, Swiss economic performance is procyclical due to the large share of exports within its GDP. Hence, a slowdown in global manufacturing often creates a large threat to Swiss growth. Going forward, can the Swiss economy diverge from that of the rest of the world (Chart 3)? Such a divergence is not probable, but a few factors will protect the Swiss economy: Switzerland still has one of the lowest policy rates in the G10, even after today’s 50bps interest rate increase. This has tremendously helped ease monetary conditions. Our monetary gauge is at its most accommodative level in over two decades (Chart 4). Chart 3The Swiss Economy Is Procyclical
The Swiss Economy Is Procyclical
The Swiss Economy Is Procyclical
Chart 4Swiss Monetary Conditions Are Still Accommodative
Swiss Monetary Conditions Are Still Accommodative
Swiss Monetary Conditions Are Still Accommodative
Swiss inflation remains the lowest in the G10 outside Japan. In Switzerland, the main driver of price increases has been goods, while services inflation remains subdued. Consequently, the SNB has been tolerating an appreciating franc to temper imported inflation (Chart 5), while keeping domestic borrowing costs at very accommodative levels. In its updated forecasts, the SNB now expects a -0.25% interest rate to allow Swiss inflation to moderate to 1.9% in 2023 and 1.6% in 2024. Chart 5Swiss Inflation Is Surprising To The Upside
Swiss Inflation Is Surprising To The Upside
Swiss Inflation Is Surprising To The Upside
Part of the reason Switzerland has low inflation has been the tremendous productivity gains, especially relative to its trading partners (Chart 6). Swiss income-per-capita is elevated, but wage growth has lagged output gains, which limits the risk of a wage-inflation spiral. It is notable that part-time employment continues to dominate job gains, implying that the need for precautionary savings will remain high in Switzerland. Chart 6A Productivity Profile For Switzerland
A Productivity Profile For Switzerland
A Productivity Profile For Switzerland
Higher productivity growth and the elevated national savings leave their footprint on the trade data. The Swiss trade balance is hitting fresh highs, unlike Europe or Japan (Chart 7). This could potentially create a problem for the Swiss economy as it puts upward pressure on the CHF at a time when global manufacturing output is slowing. However, Switzerland specializes in high value-added exports with an elevated degree of complexity, that stand early in global supply chains. These type of goods are likely to remain in high demand in a global environment marked by supply-chain bottlenecks and high-capacity utilization. Chart 7Structural Tailwinds For The Franc
Structural Tailwinds For The Franc
Structural Tailwinds For The Franc
Finally, Switzerland does not import energy to fulfill its electricity production. Hydropower accounts for roughly 61.4% of electricity generation, followed by nuclear power at 28.5%. This has partially insulated Switzerland from the energy shock hurting economic activity and trade balances in the EU. For example, German electricity generation is 28.8% coal and 14.7% natural gas. Bottom Line: The Swiss economy is reopening and is relatively insulated from the Russia-Ukraine conflict. This limits to some degree how closely Switzerland will track the global and European economic slowdown. It creates a departure from the traditional pro-cyclicality of the Swiss economy. The SNB, The SARON Curve, And The Swiss Franc If the Swiss economy surprises to the upside, the case for the SNB to tolerate a rising franc becomes even stronger. The pace of foreign exchange reserve accumulation is already decelerating (Chart 8). Governor Thomas Jordan has been very clear: as global prices rise, the fair value of the franc is also rising, which implies a willingness to tolerate currency strength. In a purchasing power parity framework, higher external inflation makes Swiss goods relatively cheaper. This allows foreigners to bid up the currency. Even with today’s updated pricing, the SNB is still expected to remain among the most dovish central banks in the G10 (Chart 9). If inflationary pressures prove sticky, the SNB will step up its hawkish rhetoric. If inflationary fears subside, then global rates will fall as well, which has usually been a boon for the franc. More specifically, this would be negative for the EUR/CHF cross (Chart 10). Chart 8Less Intervention By The SNB
Less Intervention By The SNB
Less Intervention By The SNB
Chart 9The SARON Curve Has Adjusted Higher
The SARON Curve Has Adjusted Higher
The SARON Curve Has Adjusted Higher
Chart 10EUR/CHF And Bund Yields Can Continue To Diverge
EUR/CHF And Bund Yields Can Continue To Diverge
EUR/CHF And Bund Yields Can Continue To Diverge
The Swiss economy can tolerate an appreciating CHF, but can it withstand higher interest rates? We believe so. Switzerland is a net creditor nation, but its domestic non-financial debt is also extremely elevated. Thus, the Swiss economy is vulnerable to higher rates, especially the housing market (Chart 11). Nonetheless, internal adjustments will soften the blow and increase affordability. Of note, property speculation in Switzerland has decreased in response to macroprudential measures. Growth in rental housing prices, which usually constitute the bulk of investment homes, has collapsed, but the price of owner-occupied homes has proven more robust (Chart 12). A cap on the percentage of secondary homes in any Canton as well as tighter lending standards have also helped. In a renewed update to its Financial Stability Report, Fritz Zurbrügg, Vice Chairman of the Governing Board, suggests that Swiss banks are well capitalized, especially given the recent reactivation of the countercyclical capital buffer. Chart 11Higher Rates Are A Risk For Swiss Real Estate
Higher Rates Are A Risk For Swiss Real Estate
Higher Rates Are A Risk For Swiss Real Estate
Chart 12Some Adjustment Already In Investment Home Prices
Some Adjustment Already In Investment Home Prices
Some Adjustment Already In Investment Home Prices
In the very near term, demographics might also be a tailwind. The pandemic limited immigration to Switzerland, but the working-age population is rebounding anew (Chart 13), which will create a cushion under housing and support domestic demand. Chart 13A Small Demographic Tailwind For Home Prices
A Small Demographic Tailwind For Home Prices
A Small Demographic Tailwind For Home Prices
Stronger aggregate demand in an inflationary world will justify the need for less monetary accommodation. In a nutshell, the SNB is likely to continue walking the path of “least regrets” like most central banks, by tightening monetary policy to meet its 2% inflation mandate, but pausing if economic conditions warrant. The currency has historically been used as a key tool for calibrating financial conditions. From a fundamental perspective, our PPP models suggest the franc is quite cheap versus the dollar but at fair value versus the euro and sterling. This is echoed by Governor Jordan, who no longer views the franc as expensive. Our models adjusts the consumption basket in Switzerland for an apples-to-apples comparison across both the UK and the eurozone (Chart 14). Chart 14AA CHF Is At Fair Value Versus The EUR And GBP
A CHF Is At Fair Value Versus The EUR And GBP
A CHF Is At Fair Value Versus The EUR And GBP
Chart 14BA CHF Is At Fair Value Versus The EUR And GBP
A CHF Is At Fair Value Versus The EUR And GBP
A CHF Is At Fair Value Versus The EUR And GBP
Finally, hedging costs for shorting the franc against the dollar have risen substantially (Chart 15). As such, any short bets on the franc are likely being placed naked. If the Fed ends up tempering its pace of rate hikes next year in response to weaker US activity, short-covering activity is likely to accentuate any pre-existing strength in the CHF. Chart 15Hedging Costs For USD/CHF Carry Trades Have Risen Hedging Costs Are Prohibitive
Hedging Costs For USD/CHF Carry Trades Have Risen Hedging Costs Are Prohibitive
Hedging Costs For USD/CHF Carry Trades Have Risen Hedging Costs Are Prohibitive
Bottom Line: The franc is undervalued against the dollar, and a good hedge against a rise in volatility versus other procyclical currencies. This places the franc in a good “heads I win, tails I don’t loose too much” bet. Swiss interest rates are also likely to climb higher. However, because the franc will do the bulk of the monetary tightening, the SNB is likely to lag the expectations now embedded in the SARON curve. What About Swiss Equities? Despite the cyclical nature of the Swiss economy, Swiss equities are extremely defensive. Swiss stocks have little to do with the domestic economy and are mostly a collection of large multinationals, dominated by the healthcare and consumer staples sectors, which together account for roughly 60% of the Swiss MSCI benchmark. This defensive attribute has created its own problem for Swiss equities. Relative to the Eurozone, the Swiss market has moved massively ahead of profitability, and it is now more expensive than at the apex of the European debt crisis in 2012 (Chart 16). Moreover, the jump in German yields is becoming increasingly problematic for Swiss stocks that historically perform poorly when global interest rates are rising (Chart 17). Chart 16Swiss Stocks Are Expensive
Swiss Stocks Are Expensive
Swiss Stocks Are Expensive
Chart 17A Lost Tailwind
A Lost Tailwind
A Lost Tailwind
In the near term, Swiss equities will only be able to defy the gravitational pull created by demanding valuations and higher yields if global risk aversion remains elevated. However, once global stocks find a floor and Italian spreads begin to narrow, Swiss stocks are likely to underperform massively (Chart 18). It could take a few more weeks before the BTP/Bund spreads narrow as the recent ECB announcement was rather tepid. However, the ECB holding an emergency meeting and issuing a formal statement addressing the problem facing peripheral bond markets suggests that a formal program designed to manage fragmentation risk will emerge before the end of the summer. Beyond their defensive attributes, Swiss stocks also correlate to the Quality Factor. The robust performance of this factor since the turn of the millennium, in Europe and globally, has allowed the Swiss market to greatly outperform Eurozone equities (Chart 19). However, the Quality Factor has begun to underperform, which indicates that the Swiss market is losing another of its underpinnings. Chart 18Near-term, Follow Risk Aversion
Near-term, Follow Risk Aversion
Near-term, Follow Risk Aversion
Chart 19Swiss Stocks Are About Quality
Swiss Stocks Are About Quality
Swiss Stocks Are About Quality
These observations imply that over the next 12 to 18 months, Swiss equities will underperform their Euro Area counterparts. Materials and consumer staples stand out as the two sectors with the most extended valuations relative to their Euro Area competitors, especially since their relative performances have become dissociated from relative profits (Chart 20). They should carry maximum underweights relative to their European counterparts. The healthcare sector is Switzerland’s largest market weight. It is not as expensive relative to the Eurozone as the materials and consumer staples sectors, but it carries enough of a premium that investors should still underweight this sector relative to its eurozone competitor (Chart 21). Chart 20Dangerous Setup For Swiss Materials and Staples
Dangerous Setup For Swiss Materials and Staples
Dangerous Setup For Swiss Materials and Staples
Chart 21The Swiss Heavyweight Is Becoming Pricey
The Swiss Heavyweight Is Becoming Pricey
The Swiss Heavyweight Is Becoming Pricey
Bottom Line: The defensive nature of the Swiss market has allowed for a large outperformance over European equities. However, the Swiss market is now very expensive on a relative basis, and it is vulnerable to higher interest rates. While global risk aversion can still buoy the Swiss market in the near term, conditions are falling into place for Swiss stocks to underperform their Eurozone counterpart over a 12-to-18 month window. Materials and consumer staples are the sectors mostly likely to experience a large underperformance relative to their Euro Area competitors, followed by the healthcare sector. Investment Conclusions Volatility in FX markets is likely to remain elevated, as witnessed by the reaction of a full circle of central bank meetings this week. Policy convergence remains a good bet for interest rate curves and currency pairs. The SNB surprised markets by raising interest rates by 50 bps, to -0.25%, the first hike since 2007 (Chart 1). Higher volatility will continue to buoy the Swiss franc in the short run. Structural appreciation in the franc is also likely over the coming decades. Swiss stocks often perform well during economic downturns, but they are not particularly cheap, and vulnerable to higher interest rates. Investors should only overweight Swiss stocks if they expect more significant downside to global stocks. Valuation favors the franc versus the dollar. However, EUR/CHF and GBP/CHF are closer to fair value. CHF/JPY is expensive; hence the yen is a better hedge for downside economic surprises. Go short CHF/JPY as a trade. BCA’s Foreign Exchange Strategy was short CHF/SEK at 10.2 with stop loss at 10.5. That stop was hit overnight, triggering a loss of -3.3%. Stand aside for now. Chester Ntonifor Foreign Exchange Strategist chestern@bcaresearch.com Mathieu Savary Chief European Strategist Mathieu@bcaresearch.com Trades & Forecasts Strategic View Cyclical Holdings (6-18 months) Tactical Holdings (0-6 months) Forecast Summary
Executive Summary Was FAANGM A Bubble?
Was FAANGM A Bubble?
Was FAANGM A Bubble?
US inflation has become broad-based, and the labor market is very tight. Wages are a lagging variable, and they will be rising rapidly in the coming months, even as the economy slows. Although US growth will be slowing and global trade will be contracting, the Fed will remain hawkish over the coming months. This is an unprecedented environment and is negative for global and EM risk assets. The US trade-weighted dollar will continue to appreciate as long as the Fed sounds and acts in a hawkish manner and global trade contracts. Consistent with a US dollar overshoot, EM financial markets will undershoot. Even though EM equity and local bond valuations have become attractive, their fundamentals are still negative. A buying opportunity in EM will occur when the Fed makes a dovish pivot and China stimulates more aggressively. We reckon that these conditions will fall into place sometime in H2 this year. Bottom Line: For now, we recommend that investors stay defensive in absolute terms and underweight EM within global equity and credit portfolios. The dollar has more upside in the near term but a major buying opportunity in EM local currency bonds is approaching. Feature Last week, after a two and a half year hiatus, I travelled to Europe to visit clients. I also took the opportunity catch up with Ms. Mea, a global portfolio manager and a long-standing client. Prior to the pandemic, we met regularly to discuss global macro and financial markets. She was happy to resume our in-person meetings, and we met in Amsterdam over dinner last Friday. This report provides the key points of our conversation for the benefit of all clients. Ms. Mea: I am very happy that we are again able to meet in person. Video meetings are good, but in-person meetings are better. One’s body language often gives away their level of confidence regarding investment recommendations. Answer: Agreed. My meetings with clients this week have reminded me of the value of in-person meetings. Chart 1Our Calls On Various EM Asset Classes
Our Calls On Various EM Asset Classes
Our Calls On Various EM Asset Classes
Ms. Mea: Before our meeting I reviewed the evolution of your investment views since the pandemic erupted. Let me try to summarize them, and correct me if I miss something. Even though you upgraded your medium-term view on Chinese growth in May 2020 due to the stimulus, you remained skeptical of the rally in global risk assets. In Q2 2020, you upgraded your stance on EM bonds and in July 2020 you lifted the recommended allocation to EM equities and currencies from underweight to neutral (Chart 1). In the summer and fall of 2020, you were still wary of a deflationary relapse in developed economies. However, since January 2021, your outlook for the US shifted drastically to overheating and inflation. Since then, you have been very vocal about inflation risks in the US. At the same time, you have been warning about a major slowdown in Chinese growth. Regarding financial markets, in March 2021, you downgraded EM stocks and bonds to underweight and recommended shorting select EM currencies versus the US dollar (Chart 1). I should say that your call on US inflation and China’s slowdown have played out very well over the past 18 months. Let’s zero in on US inflation. It was just last year that many investors and analysts claimed that inflation is good for stocks because it helps their top line growth. Why then have global markets panicked? Chart 2Record Wealth Destruction In US Stocks And Bonds
Record Wealth Destruction In US Stocks And Bonds
Record Wealth Destruction In US Stocks And Bonds
Answer: Not many people have a deep understanding of inflation and its impact on financial markets because most investors lack experience in navigating financial markets during an inflation era. In fact, the US equity and bond market selloffs of the past 12 months have wiped out about $12 trillion and $3.5 trillion off their respective market value. This adds up to a combined $15.5 trillion or about 60% of US GDP and already exceeds the wipeouts during the March 2020 crash and all other bear markets (Chart 2). The way we think about macro and markets must change in an inflation regime. In our seminal February 25, 2021 Special Report titled A Paradigm Shift In The Stock-Bond Relationship, we made the case that the US economy and its financial markets were about to enter a new paradigm of higher inflation. We argued that US core CPI would spike well above 2% and US share prices and US government bond yields would become negatively correlated. A similar paradigm shift occurred in 1966 (Chart 3). In short, we argued that the era of low US inflation was over, and as a result, equities and bonds would selloff simultaneously. This will remain the roadmap for investors as long as core inflation is high. Chart 3A Paradigm Shift: US Stock Prices And Bond Yields Correlation Over Decades
A Paradigm Shift: US Stock Prices And Bond Yields Correlation Over Decades
A Paradigm Shift: US Stock Prices And Bond Yields Correlation Over Decades
Ms. Mea: Do you think the Fed is behind the curve? Answer: Yes, the Fed has fallen behind the curve, and, as we have repeatedly argued over the past 12 months, the US inflation genie is out of the bottle. There is a lot of confusion in the global investment community about how we should think about inflation, and about how and when the various measures of inflation matter. As consumers, we care about headline inflation because it affects our purchasing power. So, changes in all goods and service prices, including energy and food, matter to consumers. However, this does not mean that central banks should target and set policy based on headline inflation. Rather, central banks should target genuine broad-based inflation in the economy before it becomes entrenched. Ms. Mea: Can you explain why in certain cases a surge in energy, food and other prices leads to entrenched inflation but in other cases it does not? Answer: Let me give you an example. When consumers experience rapidly rising food and energy prices, they will likely demand faster wage growth from their employers. If businesses are enjoying strong demand for their goods/services and facing a tight labor market, they might have little choice but to agree to pay raises to sustain their business. Companies will then attempt to protect their profit margins by hiking their selling prices. Households may accept higher prices given their incomes are rising. This dynamic could cause inflation to become broad-based and entrenched. In this case, central banks should lift rates to slow the economy materially and cool off the labor market to end the wage-price spiral. If employees fail to negotiate hefty pay raises, odds are that inflation will not become broad-based. The more households spend on energy and food, the less income they will have to spend on other items, causing their discretionary spending to contract. In this case, there is no rush for central banks to tighten policy. If monetary authorities tighten materially, the economy will experience a full-fledged recession. In short, wage dynamics will determine whether inflation becomes broad-based. Labor market conditions will ultimately dictate this outcome. Ms. Mea: But why are wages more important than the price of fuel or food in determining whether inflation becomes broad-based? Answer: To be technically correct, unit labor costs, not wages, are key to inflation dynamics. Unit labor cost = (wage per hour) / (productivity). Productivity is output per hour. Given that labor is the largest cost component of US businesses, unit labor costs will swell and profit margins will shrink when salaries rise faster than productivity. CEOs and business owners always do their best to protect the their profit margins. Thus, accelerating unit labor costs will lead them to raise their selling prices. In the wake of wage gains, consumers might accept higher goods and service prices. If they do and go on to demand even higher wages, the economy will enter a wage-price spiral. This is why wage costs, more specifically unit labor costs, are the most important variable to monitor. If high energy and food prices lead employees to demand faster wage growth from their employers, and if they are granted wage increases above and beyond their productivity advances, inflation will become more broad-based and genuine. If consumers push back against higher prices, i.e., reduce their spending, corporate profits will plunge, and companies will freeze investment and lay off employees. Wages will slow and inflation will wane. Ms. Mea: Are all economies currently experiencing a wage-price spiral? Answer: The US and some other countries have been experiencing a wage-price spiral over the past 12 months. In other countries, including many developing economies, a wage-price spiral is currently absent. In the US, labor demand exceeds supply by the widest margin since 1950 (Chart 4). The upshot is that wages will continue to rise in response to persistently high inflation (Chart 5). Chart 4US Labor Demand Is Exceeding Labor Supply By The Widest Margin Since 1950
US Labor Demand Is Exceeding Labor Supply By The Widest Margin Since 1950
US Labor Demand Is Exceeding Labor Supply By The Widest Margin Since 1950
Chart 5US Wage Growth Is Already Very High
US Wage Growth Is Already Very High
US Wage Growth Is Already Very High
Wages in the US are currently rising at a rate of 6-6.5% or so. US productivity growth is around 1.5%. As a result, unit labor costs are rising at a 4.5-5% annual rate, the fastest rate for corporate America in the past 40 years (Chart 6). As Chart 6 demonstrates, unit labor costs have been instrumental in defining core CPI fluctuations over the past 70 years in the US. Chart 6US Unit Labor Costs Are Rising At The Fastest Rate Since 1982
US Unit Labor Costs Are Rising At The Fastest Rate Since 1982
US Unit Labor Costs Are Rising At The Fastest Rate Since 1982
Chart 7US Core Of Core Inflation Is High And Not Falling
US Core Of Core Inflation Is High And Not Falling
US Core Of Core Inflation Is High And Not Falling
In short, both surging unit labor costs and the acceleration of super core CPI measures like trimmed-mean CPI and median CPI suggest that US inflation has become broad-based and a wage-inflation spiral has taken hold in the US (Chart 7). Critically, wages are a lagging variable and are not reset all at once for all employees. American employees will continue to demand substantial wage hikes both to offset the last 12 months of lost purchasing power and to protect their purchasing power for the next 12 months. Hence, we will be witnessing faster wage growth in the coming months even as the economy slows. For many continental European economies and for several EM economies, wage growth is still weak. Chart 8 illustrates that nominal wage growth in India, Indonesia, China and Mexico are very subdued. Sluggish wage gains in emerging economies are consistent with the profile of their domestic demand. Domestic demand in these large developing economies remains extremely weak. In many cases, the level of domestic demand in real terms is still below its pre-pandemic level (Chart 9). Chart 8EM Wages Are Very Tame
EM Wages Are Very Tame
EM Wages Are Very Tame
Chart 9EM Domestic Demand Is Depressed
EM Domestic Demand Is Depressed
EM Domestic Demand Is Depressed
In China, deflation, rather than inflation, is the main economic threat. Headline and core inflation are within a 1-2% range (Chart 10), domestic demand is very weak, and the unemployment rate has risen in the past 12 months. Chart 10China's Inflation Is Subdued
China's Inflation Is Subdued
China's Inflation Is Subdued
Ms. Mea: Do you expect the US economy to contract? Answer: US growth will decelerate substantially, and certain segments of the economy could shrink for a couple of quarters. My expectation is that US corporate profits will contract materially. Slowing top line growth, narrowing profit margins, shrinking global trade and a strong dollar are all major headwinds for the S&P 500 EPS. EM EPS are also heading towards a major contraction. This is why I view EM fundamentals as negative even though EM valuations have become attractive. Ms. Mea: You have recently written that global trade volumes are about to contract. What is your rationale and is there any evidence that this is already happening? Answer: US and EU demand for consumer goods ex-autos has been booming over the past two years. Households have overspent on goods ex-autos (Chart 11). Given that their disposable income is contracting in real terms and a preference to spend on services, households will markedly curtail their purchases of consumer goods in the coming months. This will hurt global manufacturing in general, and emerging Asia in particular. Some forward-looking indicators are already signaling a contraction in global trade: US retail inventories (in real terms) have swelled (Chart 12, top panel). US retailers will dramatically reduce their orders. Chart 11Global Trade Volumes Will Shrink In H2 2022
Global Trade Volumes Will Shrink In H2 2022
Global Trade Volumes Will Shrink In H2 2022
Chart 12US Import Volumes Are Set To Contract
US Import Volumes Are Set To Contract
US Import Volumes Are Set To Contract
Besides, US railroad carload is already shrinking, signaling reduced goods shipments (Chart 12, bottom panel). Taiwanese shipments to China lead global trade and they point to an impending slump (Chart 13, top panel). Also, the Taiwanese manufacturing shipments-to-inventory ratio has dropped below 1 (Chart 13, bottom panel). Finally, industrial metal prices are breaking down despite easing lockdowns in China and continued sanctions on Russia (Chart 14). This is a sign of downshifting global manufacturing. Chart 13A Red Flag For Global Trade
A Red Flag For Global Trade
A Red Flag For Global Trade
Chart 14Industrial Metal Prices Are Breaking Down
Industrial Metal Prices Are Breaking Down
Industrial Metal Prices Are Breaking Down
Ms. Mea: Won’t a global trade contraction push down goods prices and help US inflation? Answer: Correct, it will bring down US goods inflation but not services inflation. Importantly, as we discussed above, US inflation has already spilled into wages and has become broad-based. Plus, it is hovering well above the Fed’s target. Hence, the Fed cannot dial down its hawkishness now, even if goods price inflation drops significantly. In brief, even though US growth will be slowing and global trade will be contracting over the coming months, the Fed is likely to remain hawkish. This is an unprecedented environment and is negative for global and EM risk assets. Ms. Mea: What are the financial market implications of entrenched inflation in the US and the lack of genuine inflationary pressures in many emerging economies? Answer: As long as the Fed sounds and acts in a hawkish manner and/or global trade contracts, the US trade-weighted dollar will continue to appreciate. The greenback is a countercyclical currency and rallies when global trade slumps. On the whole, the USD will likely overshoot in the near run. Consistent with a US dollar overshoot, EM financial markets will undershoot. Even though investor sentiment on EM equities and USD bonds is very low (Chart 15), a final capitulation selloff is still likely. In short, EM valuation and positioning are positive for future potential returns yet their fundamentals (business cycle, profits, return on capital, etc.) are still negative. A buying opportunity in EM will emerge when the Fed makes a dovish pivot, China stimulates more aggressively, and EM equity and bond valuations improve further. We reckon that these conditions will fall into place sometime in H2 this year. If the Fed turns dovish early without taming US inflation, it will fall behind the inflation curve and the US dollar will begin its bear market. Investors will respond by embracing EM financial assets. EM local currency bonds in particular offer value (Chart 16). Prudent macro policies and the lack of wage pressures entail a good medium-to-long term opportunity in EM local currency bonds. Chart 15Investor Sentiment On EM Stocks And USD Bonds Is Low
Investor Sentiment On EM Stocks And USD Bonds Is Low
Investor Sentiment On EM Stocks And USD Bonds Is Low
Chart 16US TIPS Yields Should Roll Over For EM Local Bond Yields To Decline
US TIPS Yields Should Roll Over For EM Local Bond Yields To Decline
US TIPS Yields Should Roll Over For EM Local Bond Yields To Decline
As EM currencies put in a bottom, local yields will come down. This will help their equity markets. Ms. Mea: Speaking of a capitulation selloff, how far can it go? Both for EM stocks as well as the S&P 500? Chart 17S&P500: Where Is Technical Support Line?
S&P500: Where Is Technical Support Line?
S&P500: Where Is Technical Support Line?
Answer: As long as US bond yields and oil prices do not start falling on a consistent basis, the S&P 500 will remain under selling pressure. Technicals can help us gauge the likely magnitude of the move. The S&P 500 has dropped to a major technical support, but it will likely be broken. The next support is around 3100-3200 (Chart 17). The EM equity index is sitting on a technical support now (Chart 18). The next support level is 15-17% below the current one. Chart 18EM Stocks in USD Terms Could Drop Another 15%
EM Stocks in USD Terms Could Drop Another 15%
EM Stocks in USD Terms Could Drop Another 15%
Critically, US equity investors should also consider whether the US equity bull market that has been in place since 2009 is over. If it is, then the S&P 500 bear market could last long, and prices could drop significantly. Chart 19Was FAANGM A Bubble?
Was FAANGM A Bubble?
Was FAANGM A Bubble?
A few observations that investors should keep in mind: First, over the past 12 years, FAANGM stocks have followed the profile of the Nasdaq 100 (Chart 19). In short, FAANGM stocks have risen as much as the Nasdaq 100 index did in the 1990s. Second, when retail investors rush into an asset class, it often signals the final phase of the bull market. Once the bull market ends, the ensuing bear market is vicious. The behavior of tech/internet stocks and the broader S&P 500 fits this profile extremely well. For several years after the Lehman crash, individual investors were hesitant to buy US stocks. However, the resilience of US equities led to a buy the dip mentality in 2019-20. Retail investors joined the equity party en masse in early 2020. The post retail frenzy hangover is usually very painful and prolonged. Based on this roadmap, it seems that the 2020-21 retail-driven rally was the final upleg in the S&P 500 bull market. By extension, we have entered a bear market that could be vicious and extended. All the excesses of the 10-year FAANGM and S&P500 bull markets will need to be worked out before a new bull market emerges. Finally, a high inflation regime raises the bar for the Fed to rescue the stock market. This also entails lower equity multiples than we have in the S&P500 now. Ms. Mea: What do you make of EM’s recent outperformance versus DM stocks? When will you upgrade EM versus DM? Answer: Indeed, EM stocks have recently outperformed DM stocks. We might be witnessing a major transition in global equity market leadership. We have held for some time that an equity leadership change from the US to the rest of the world and from TMT stocks to other segments of the global equity market would likely take place during or following a major market selloff. The ongoing equity bear market seems to be exactly that catalyst. Chart 20For EM Equities To Outperform, USD Needs To Weaken
For EM Equities To Outperform, USD Needs To Weaken
For EM Equities To Outperform, USD Needs To Weaken
If the S&P 500 bull market is over, the global equity leadership will also change away from US and TMT stocks to other stock markets and sectors. That said, to upgrade EM stocks, we need to change our view on the USD because EM relative equity performance versus DM closely tracks the inverted trade-weighted US dollar (Chart 20). In the near term, we believe the greenback has more upside potential. In particular, Asian currencies and equity markets cannot outperform when the Fed is hawkish and global trade is contracting. Latin American currencies have benefited since early this year from the spike in commodity prices. However, worries about a US recession, a strong dollar and a lack of strong recovery in the Chinese economy will push industrial metal prices lower. As shown in Chart 14 above, industrial metal prices are breaking down. This is a bad omen for Latin American markets. On the whole, we will likely be upgrading EM versus DM later this year. For now, we recommend that investors stay defensive and underweight EM within global equity and credit portfolios. We also continue to short the following currencies versus the USD: ZAR, COP, PEN, PLN, PHP and IDR; as well as HUF vs. CZK, and KRW vs. JPY. A major buying opportunity in local currency bonds is approaching. Arthur Budaghyan Chief Emerging Markets Strategist arthurb@bcaresearch.com