Equities
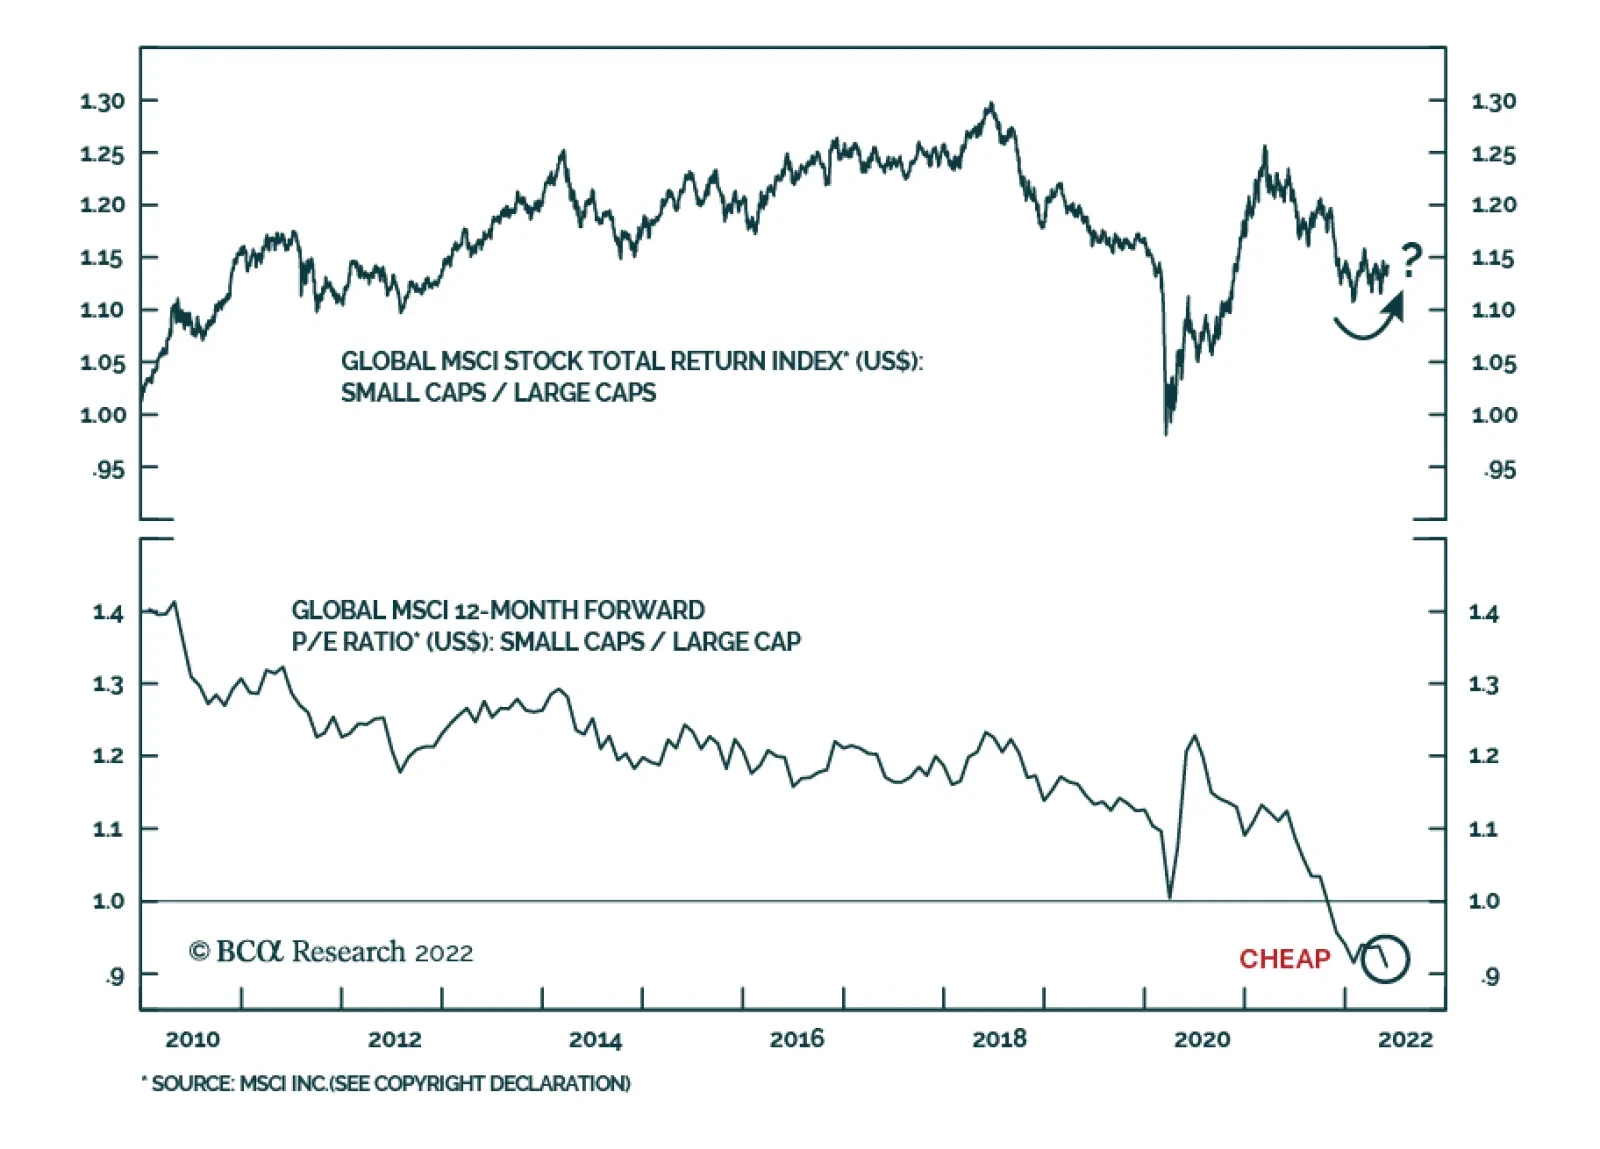
The relative performance of global small cap stocks vis-à-vis their large cap peers has recently stabilized. Both the small cap and large cap MSCI ACWI total return indices are down roughly 12% year-to-date in USD terms. Does this stabilization – which…
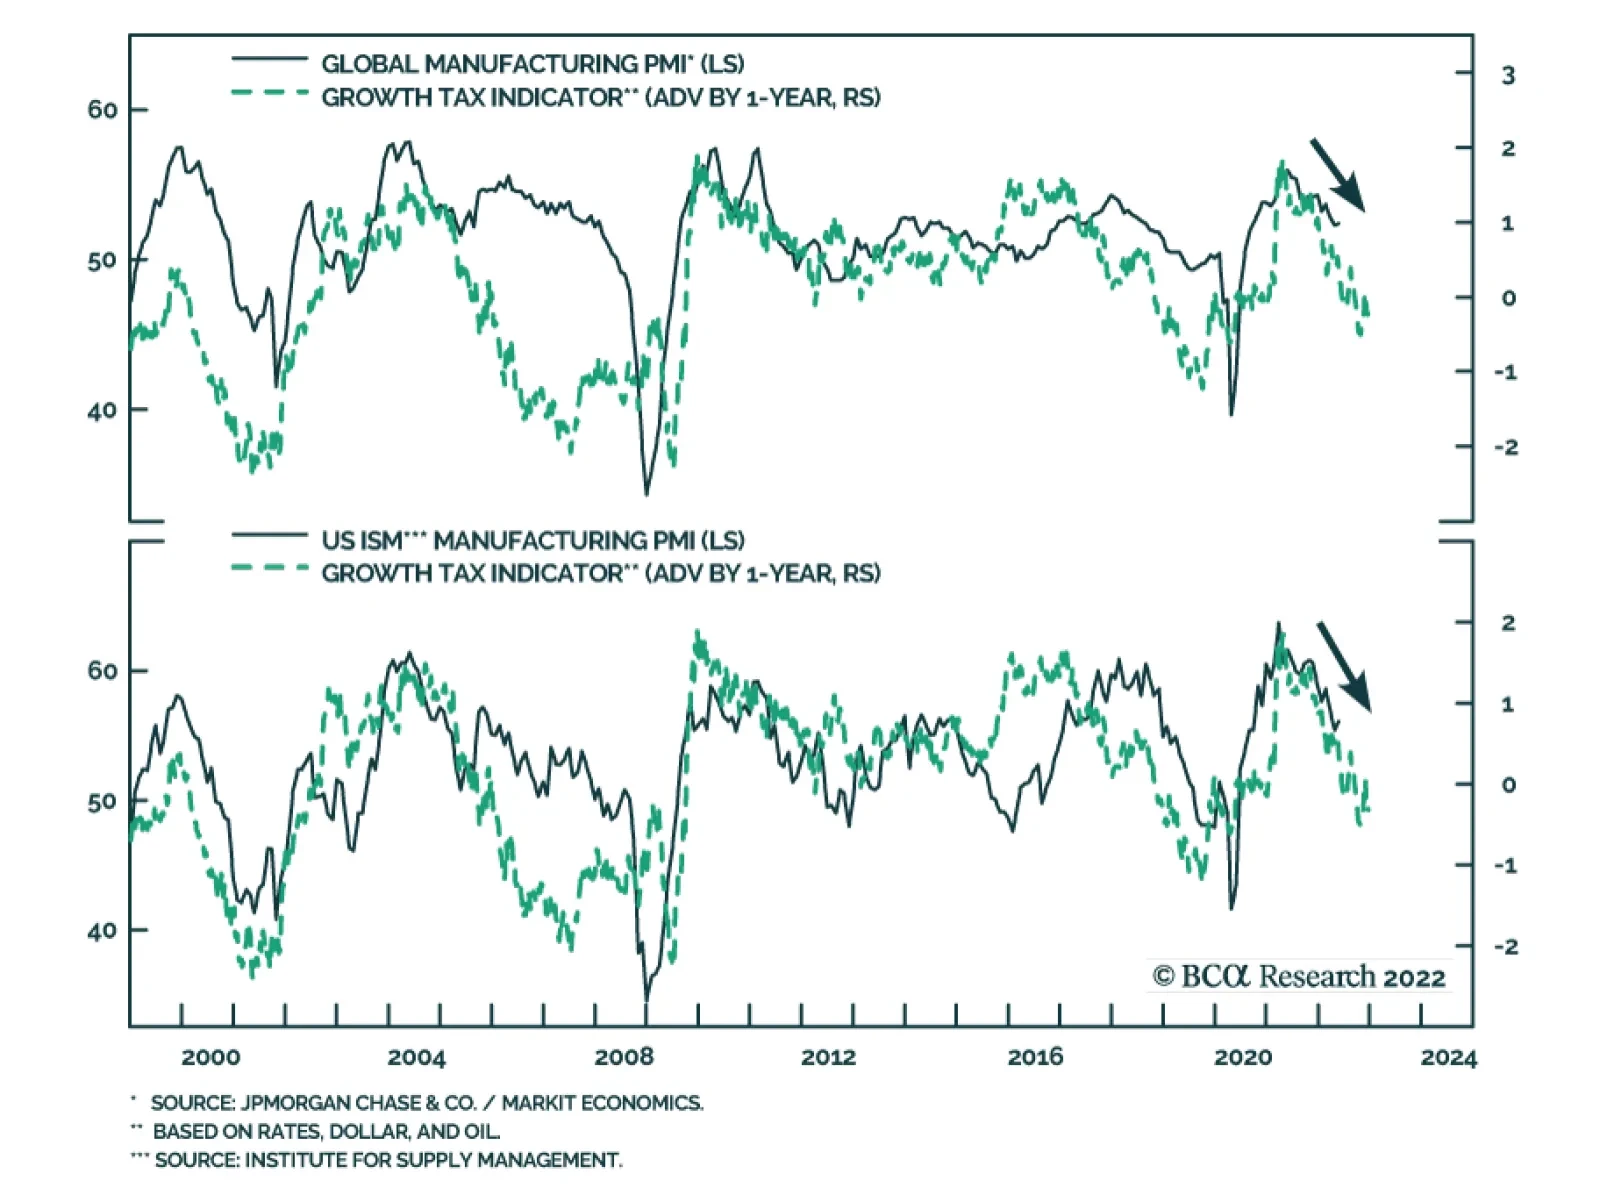
BCA Research’s Growth Tax Indicator continues to send a negative signal for the economic growth outlook. The indicator is constructed to reflect that rising Treasury yields, a flattening yield curve, elevated and increasing oil prices and a strong dollar are…
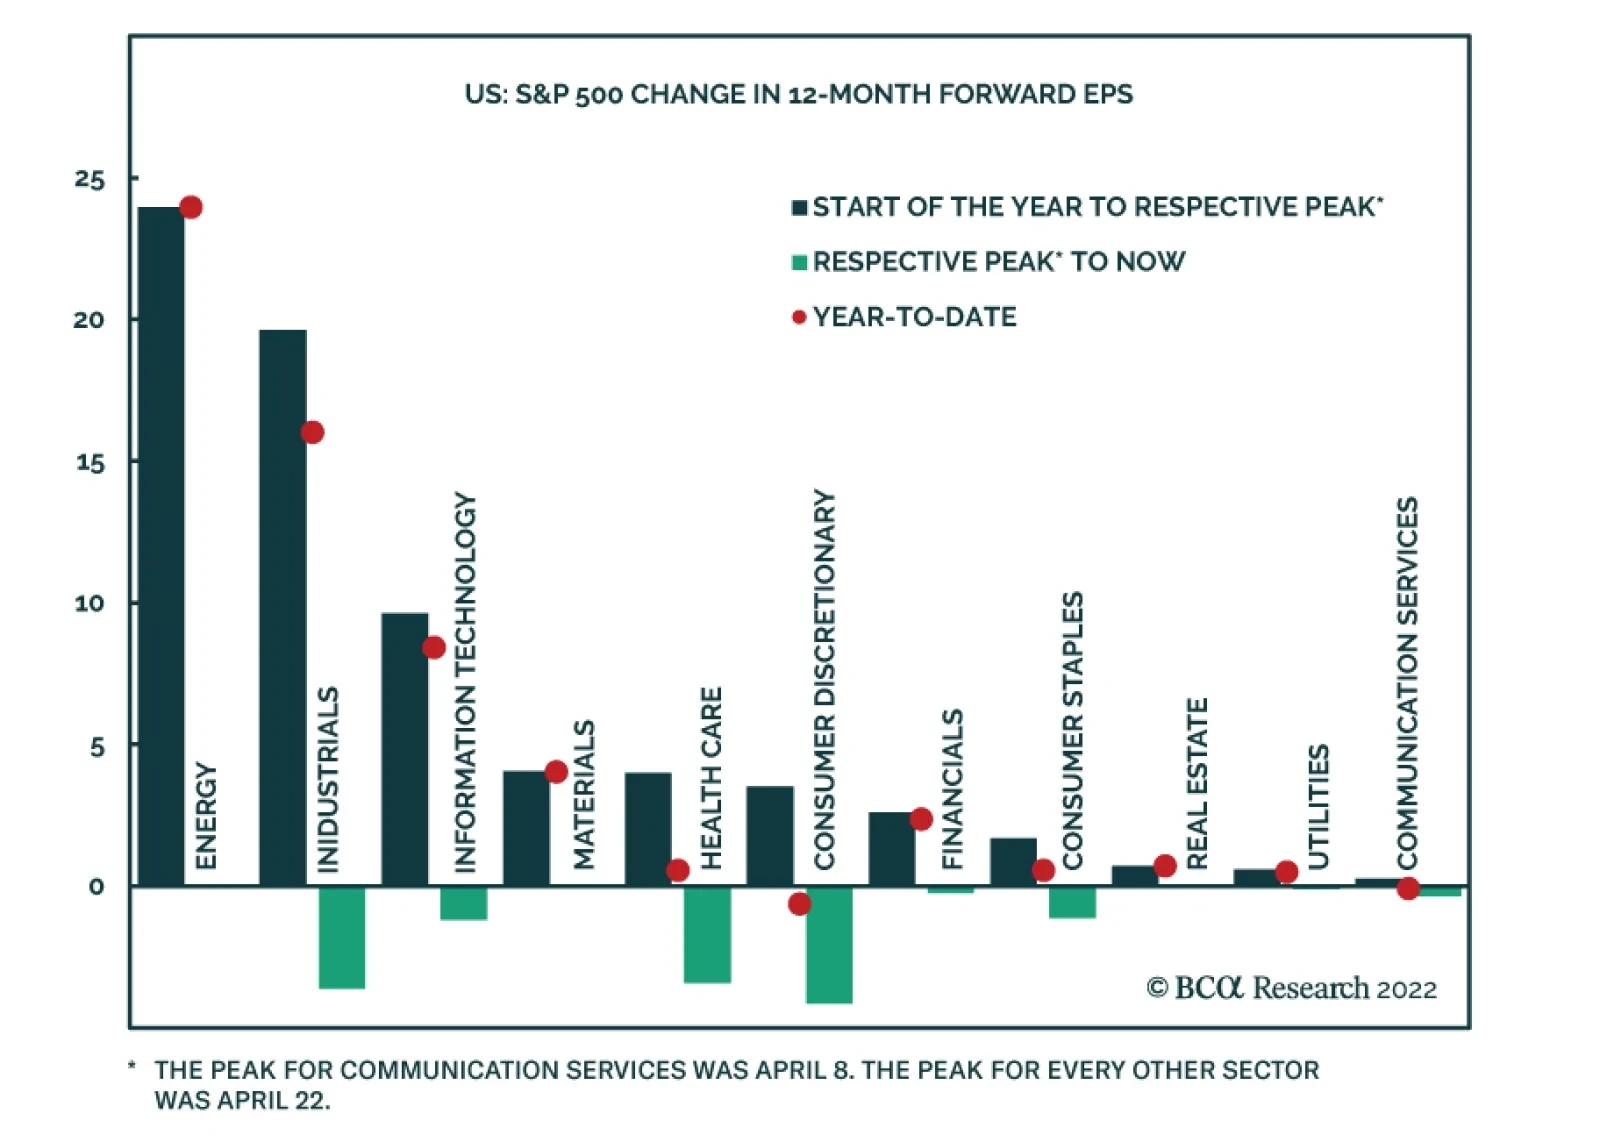
On S&P 500 EPS Downgrades
On…
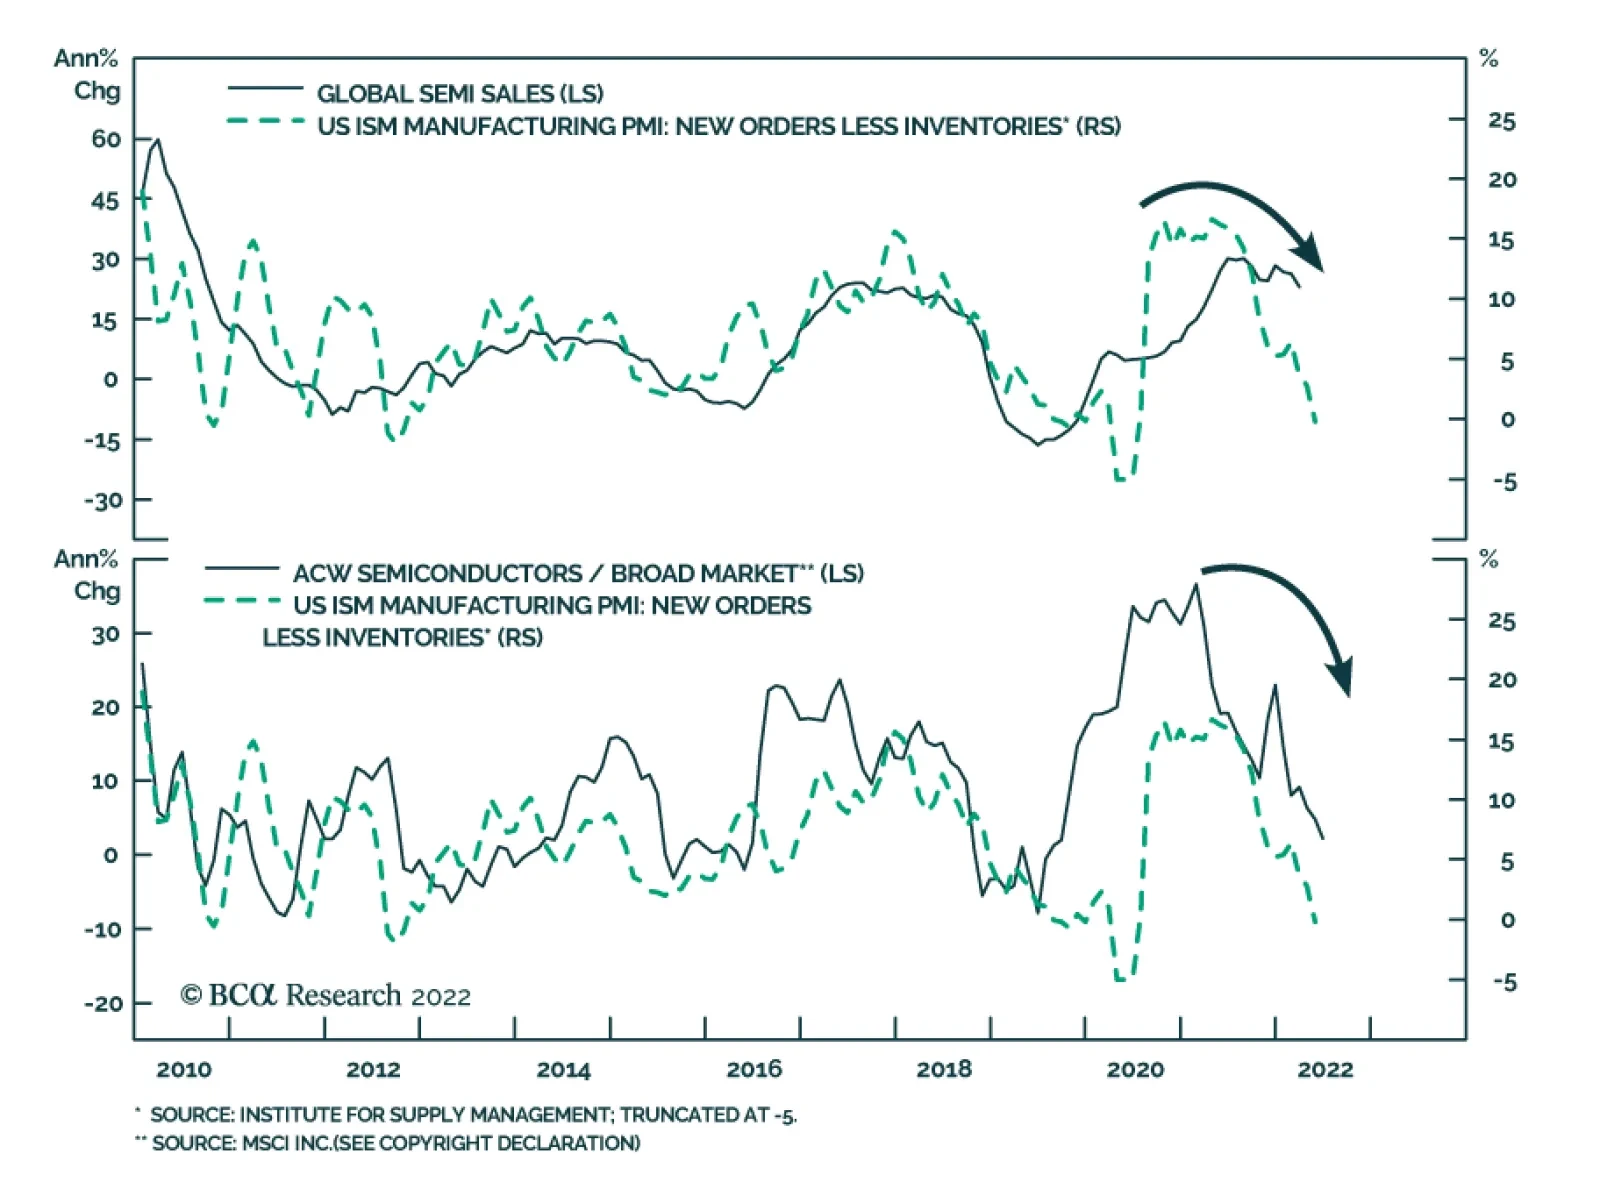
Global semiconductor stocks underperformed the broad market in the year-to-date equity selloff. However, over the past month they are up on both an absolute and relative basis. Have semiconductor stocks bottomed? The rollout of 5G networks, demand for…

Executive Summary Lower Rates Are A Tailwind For Growth Stocks
Lower Rates Are A Tailwind For Growth Stocks
Lower Rates Are A Tailwind For Growth Stocks
We remain in the bearish camp. While the market bottom is getting closer, there are still hurdles to overcome such as elevated economic and earnings growth expectations, which need to come down to prevent new disappointments. Notably, the market focus has shifted away from inflation and has turned towards worries about growth as is evident in the falling 10-year Treasury yield. The environment of slowing growth and falling rates is a tailwind for growth stocks, warranting an upgrade of Growth to at least a benchmark weight. Technicals also signal that Growth is oversold relative to Value. The valuation differential has also moderated. However, we are wary of upgrading Growth to an outright overweight and downgrading Value to underweight as there is still plenty of economic uncertainty. We also posit that in the next several months the markets will be “fat and flat”, i.e., a bear market punctuated by rallies and pullbacks. In this environment, a balanced allocation between Growth and Value will reduce portfolio volatility and result in higher compound returns. Bottom Line: In a commentary to our chart pack report, we upgrade the Growth/Value style preference to benchmark allocation. Feature This week we provide you with a style chart pack. In this accompanying note, we will make a case for upgrading Growth and downgrading Value, bringing these style allocations to equal weight. We are booking a profit of 13% since we established the position in January 2022. We are getting closer to upgrading Growth to overweight. Performance May started as another tough month for equities, but, as they say, all’s well that ends well. After pulling back 10% since the beginning of May, and briefly touching bear market territory of -20%, the S&P 500 rebounded in the last 10 days of the month bringing the index to where it ended April. As a result, the S&P 500 was flat, and the NASDAQ was down 2.4% in May. As expected, the rally brought about a change in leadership (Chart I-1), with Consumer Discretionary and Technology leading the pack. Energy and Utilities are the only sectors that avoided rotation. Since May 20, Growth has outperformed Value by 3%. Chart I-1Recent Performance
Chartbook: Style Chart Pack
Chartbook: Style Chart Pack
Bear Market Rally Or The Real Thing? Since the start of the May rally, investors have been debating whether it has legs. Bulls argue that we are in the early innings of a sustainable rebound in equities – after all, much of the bad news is already priced in, 45% of NYSE and 70% of NASDAQ have recently hit new 12-month lows, screaming oversold conditions, and making bottom fishing tempting (Chart I-2). Bears consider this surge in performance a garden-variety bear market rally: Growth is slowing and none of the problems that have been haunting the markets over the past five months, such as inflation, war, China, and a hawkish Fed, have yet been resolved. Our views are closer to the bearish camp: We believe that, even if the market bottom is getting closer, there are still hurdles to overcome, such as elevated economic and earnings growth expectations, which need to come down to prevent new disappointments. As we discussed in the recent “What Is Next For Equities: They Will Be Fat And Flat” report, we believe that equities are likely to be range-bound over the next several months: A turn in inflation and a downshift in growth may ignite rallies on hopes of a gentler, data-driven Fed, and a shallower trajectory for the rate-hiking cycle (Chart I-3). However, we argue that the Fed “put” is no longer in play and the Fed will stay focused on inflation, inadvertently puncturing any budding rallies. In addition to a hawkish Fed, investors will have to process what may become a sharp economic growth slowdown and an earnings recession in the US on the back of rising costs, a stronger dollar, and slowing global demand for US goods. Chart I-2Is Much Of The Bad News Already Priced In?
Is Much Of The Bad News Already Priced In?
Is Much Of The Bad News Already Priced In?
Chart I-3Many Hope For A Shallower Hiking Cycle
Many Hope For A Shallower Hiking Cycle
Many Hope For A Shallower Hiking Cycle
Growth Vs. Value: Shifting Positioning To Equal Weight When Growth Is Harder To Find, Growth Stocks Shine As we argued in the “Fat and Flat” report, there are multiple signs that economic growth is slowing, and that earnings growth will disappoint. Our Business Cycle Indicator, which is a compilation of soft and hard data across production, consumer, and credit dimensions, is also signaling a slowdown (Chart I-4). Here we would like to emphasize our view: As of now, US economic growth is strong, and it is only its second derivative, i.e. a deceleration of growth, that is the root of our concerns. In a world where growth is becoming scarcer, companies that can deliver growth will shine. These are “growth” companies, i.e. large, stable companies with strong balance sheets that are able to generate positive cash flow and churn out strong earnings even under economic duress (Chart I-5). Quality growth outperforms during slowdowns (Chart I-6). This reasoning does not apply to speculative, barely profitable, growth companies which will fight for survival in a slow-growth world. Chart I-4We Are In A Slowdown Stage Of The Business Cycle
We Are In A Slowdown Stage Of The Business Cycle
We Are In A Slowdown Stage Of The Business Cycle
Chart I-5Large Cap Growth Is Synonymous With Quality
Large Cap Growth Is Synonymous With Quality
Large Cap Growth Is Synonymous With Quality
Chart I-6Growth Outperforms During Economic Slowdowns
Chartbook: Style Chart Pack
Chartbook: Style Chart Pack
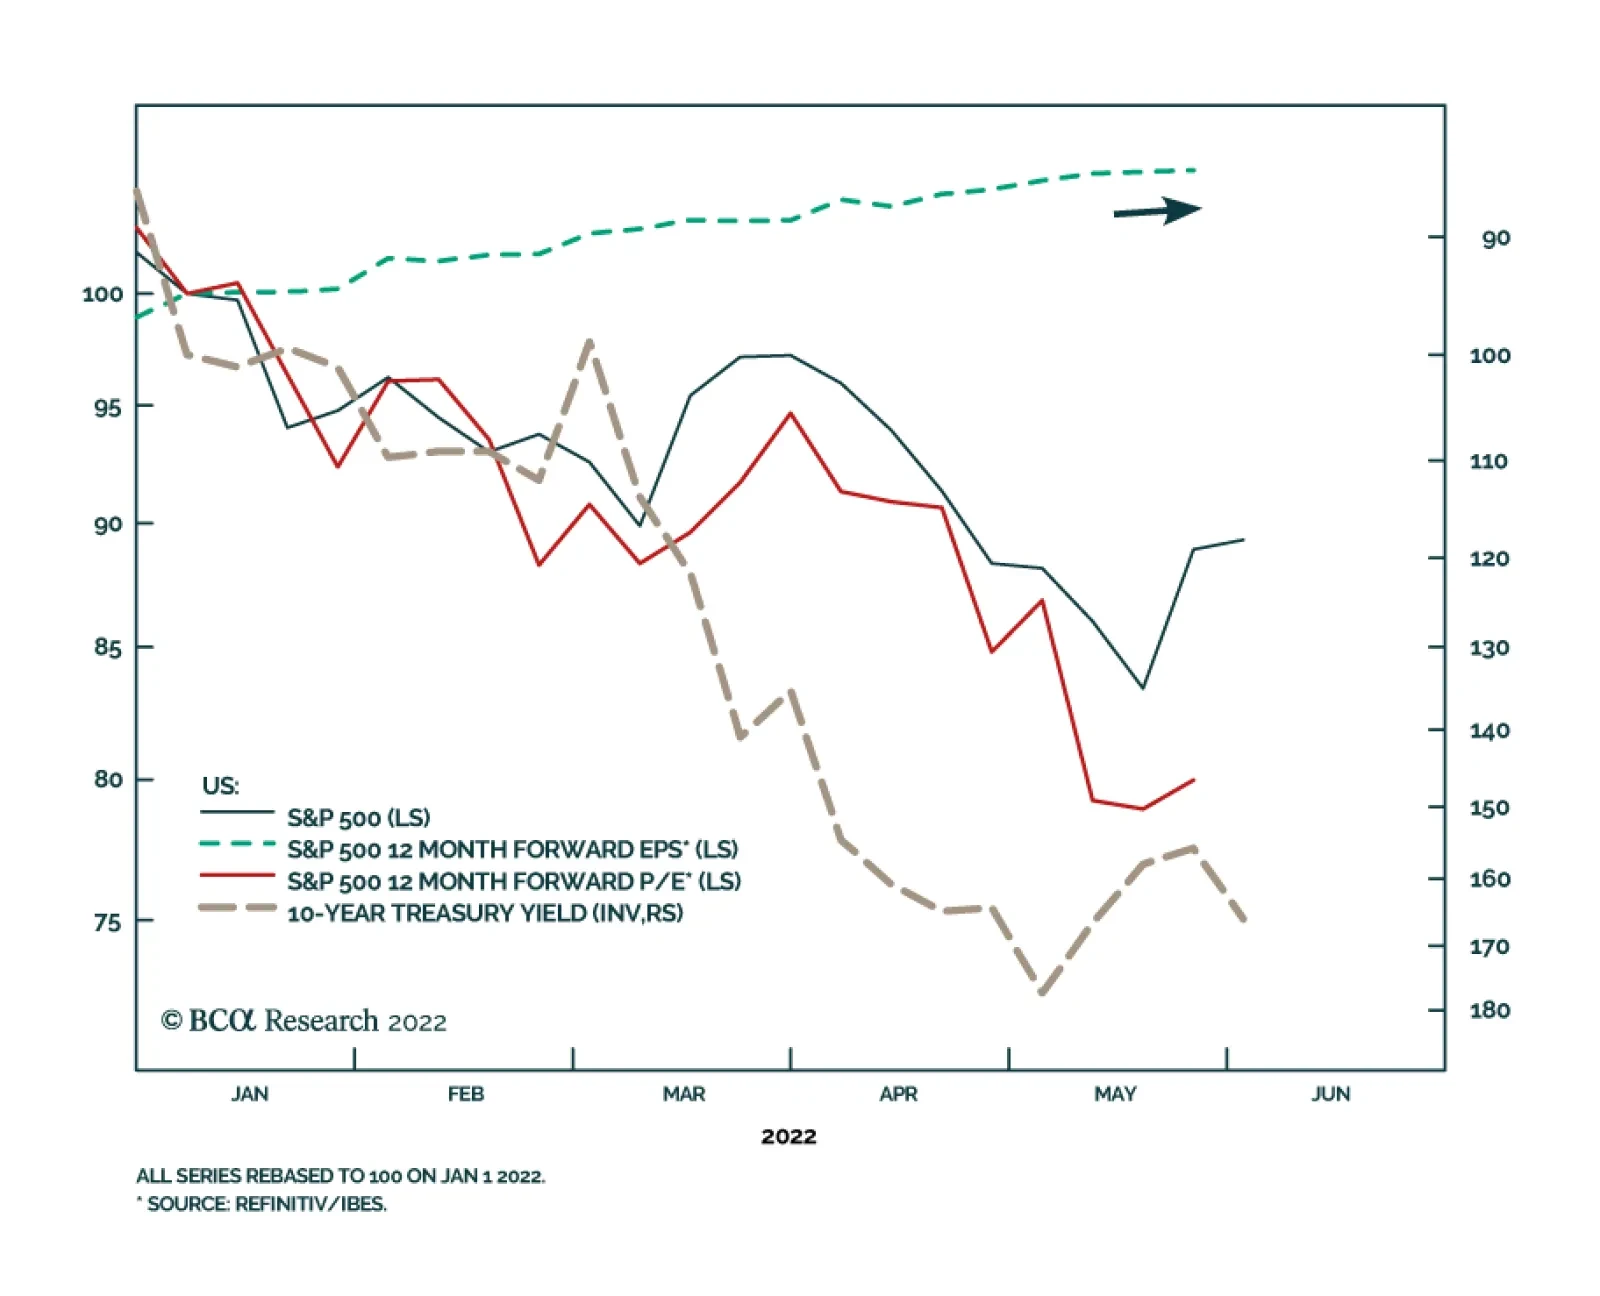
Of course, one might argue that economic growth has been slowing for about a year, initially by returning towards the pre-pandemic trend and, lately, as a result of monetary tightening. Yet, over the past six months, Growth has underperformed Value by nearly 11%. What is different now? First, inflation, and the monetary tightening that inevitably follows it, are the mortal enemies of growth stocks: Higher discount rates deflate the present value of future cash flows. Rising inflation and sharply rising Treasury yields are behind the recent sell-off in Growth stocks. However, recently, the market focus has shifted away from inflation, and seems to finally be turning towards worries about growth. As a result, the 10-year Treasury yield decreased from 3.12% to 2.75%, and its relentless climb may now be behind us (Chart I-7). Lower rates are a tailwind for Growth stocks which rebounded at the first whiff of rate stabilization (Chart I-8). Chart I-7Investors Concerns Have Shifted From Inflation To Growth
Investors Concerns Have Shifted From Inflation To Growth
Investors Concerns Have Shifted From Inflation To Growth
Further, our research on macroeconomic regimes suggests that a turn in inflation heralds a change in market leadership from Value to Quality and Growth (Chart I-9). Chart I-8Lower Rates Are A Tailwind For Growth Stocks
Lower Rates Are A Tailwind For Growth Stocks
Lower Rates Are A Tailwind For Growth Stocks
Chart I-9Growth And Quality Will Lead Markets When Inflation Abates
Chartbook: Style Chart Pack
Chartbook: Style Chart Pack
Growth Not Yet Cheap But Oversold This year’s sell-off is characterized by a multiple contraction. Growth is a poster child of this trend: Its forward multiple has decreased by 8 points, with the style currently trading at just under 20x forward earnings, which is the 61st percentile relative to its 10-year history (compare that to 28x and the 94th percentile back in January). As for Value, it also became cheaper, contracting from 16.8x in January to 14.9x (Table I-1). Table I-1Valuations And EPS Growth Expectations
Chartbook: Style Chart Pack
Chartbook: Style Chart Pack
According to the BCA Valuations Indicator (Chart I-10), the Growth/Value valuations spread has moderated but by itself, is not an impetus for a switch. However, looking at technicals, Growth is extremely oversold relative to Value and is at levels last seen in 2006. Why Neutral, Not Overweight? We hope we made a compelling case for shifting allocation from Value to Growth. Then why not go overweight, but just neutral? Mostly because many of the macroeconomic developments we have described are tentative and are just conjecture at this point – there is still plenty of uncertainty about inflation, rates, and the Fed monetary response. Second, while Growth stocks are supposed to grow faster than Value stocks, at the moment analysts expect them to grow at 8% and 11% respectively. We expect earnings growth expectations for Value stocks to be downgraded since they are dominated by cyclicals. However, until the new numbers are in for both styles, we need to be careful. Chart I-10Growth Is Getting Cheaper Relative To Value... It Also Appears Oversold
Growth Is Getting Cheaper Relative To Value... It Also Appears Oversold
Growth Is Getting Cheaper Relative To Value... It Also Appears Oversold
Last, if we are right, and US equities are to test their bottom this summer in a “fat and flat” manner, there will be a frequent change in leadership, with Growth and Small outperforming during the rallies, and Value outperforming during pullbacks. Portfolios need exposure to both styles to achieve the highest compound returns as diversification reduces portfolio volatility. Once macroeconomic uncertainty dissipates, we will be able to pounce and shift Growth to overweight, and Value to underweight. For now, we are going to stay neutral out of an abundance of caution. Bottom Line Macroeconomic conditions are becoming more favorable for Growth as Treasury yields stabilize and economic growth slows, making the strong fundamentals and stable earnings of large-cap growth stocks more valuable. Growth is oversold relative to Value, and the relative performance differential of Growth vs. Value over the past six months has been staggering – it is time to book profits and prepare for the next chapter. Irene Tunkel Chief Strategist, US Equity Strategy irene.tunkel@bcaresearch.com S&P 500 Chart II-1Macroeconomic Backdrop
Macroeconomic Backdrop
Macroeconomic Backdrop
Chart II-2Profitability
Profitability
Profitability
Chart II-3Valuations And Technicals
Valuations And Technicals
Valuations And Technicals
Chart II-4Uses Of Cash
Uses Of Cash
Uses Of Cash
Cyclicals Vs Defensives Chart II-5Macroeconomic Backdrop
Macroeconomic Backdrop
Macroeconomic Backdrop
Chart II-6Profitability
Profitability
Profitability
Chart II-7Valuation And Technicals
Valuation And Technicals
Valuation And Technicals
Chart II-8Uses Of Cash
Uses Of Cash
Uses Of Cash
Growth Vs Value Chart II-9Macroeconomic Backdrop
Macroeconomic Backdrop
Macroeconomic Backdrop
Chart II-10Profitability
Profitability
Profitability
Chart II-11Valuations And Technicals
Valuations And Technicals
Valuations And Technicals
Chart II-12Uses Of Cash
Uses Of Cash
Uses Of Cash
Small Vs Large Chart II-13Macroeconomic Backdrop
Macroeconomic Backdrop
Macroeconomic Backdrop
Chart II-14Profitability
Profitability
Profitability
Chart II-15Valuations and Technicals
Valuations and Technicals
Valuations and Technicals
Chart II-16Uses Of Cash
Uses Of Cash
Uses Of Cash
Table A1Performance
Chartbook: Style Chart Pack
Chartbook: Style Chart Pack
Table A2Valuations And Forward Earnings Growth
Chartbook: Style Chart Pack
Chartbook: Style Chart Pack
Footnotes Recommended Allocation Recommended Allocation: Addendum
Chartbook: Style Chart Pack
Chartbook: Style Chart Pack
The S&P 500 has shed 13.8% since the beginning of the year on worries of a Fed-induced US recession, accelerating commodity prices and global growth slowdown. The selloff has been entirely valuation-driven. To the extent that Treasury yields provide…
BCA Research’s Global Investment Strategy service concludes that China faces a number of economic woes, but these are fully discounted by the market. What has not been discounted is a broad-based stimulus program focused on income-support measures. China…
Listen to a short summary of this report. Executive Summary Chinese Stocks Are Relatively Cheap
Chinese Stocks Are Relatively Cheap
Chinese Stocks Are Relatively Cheap
The Chinese economy faces a trifecta of economic woes: 1) The threat of renewed Covid lockdowns; 2) Cooling export demand; 3) A floundering housing market. Trying to reflate the Chinese housing bubble would only damage the long-term prospects of China’s economy. A much better option would be to adopt measures that boost disposable income. Not only would this help offset the drag from slowing export growth and a negative housing wealth effect, but it would also take some of the sting out of China’s zero-Covid policy. With the Twentieth Party Congress slated for later this year, the political incentive to shower the economy with cash will only intensify. Chinese equities are trading at only 10-times forward earnings and about 1-times sales. A significant upward rating for equity valuations is likely if the government adopts broad-based income-support measures. Go long the iShares MSCI China ETF ($MCHI) as a tactical trade. Bottom Line: China faces a number of economic woes, but these are fully discounted by the market. What has not been discounted is a broad-based stimulus program focused on income-support measures. Dear Client, I will be visiting clients in Saudi Arabia, Bahrain, and Abu Dhabi next week. No doubt, the outlook for oil prices will feature heavily in my discussions. I will brief you on any insights I learn in my report on June 17. In the meantime, I am pleased to announce that Matt Gertken, BCA’s Chief Geopolitical Strategist, will be the guest author of next week’s Global Investment Strategy report. Best regards, Peter Berezin Chief Global Strategist Triple Threat The Chinese economy faces a trifecta of economic woes: 1) The threat of renewed Covid lockdowns; 2) Cooling export demand; 3) A floundering housing market. Let us discuss each problem in turn. Problem #1: China’s Zero-Covid Policy in the Age of Omicron Chart 1China’s Lockdown Index Remains Elevated
China: A Trifecta Of Economic Woes
China: A Trifecta Of Economic Woes
China was able to successfully suppress the virus in the first two years of the pandemic. However, the emergence of the Omicron strain is challenging the government’s commitment to its zero-Covid policy. The BA.2 subvariant of Omicron is 50% more contagious than the original Omicron strain and about 4-times more contagious than the Delta strain. While 89% of China’s population has been fully vaccinated, the number drops off to 82% for those above the age of 60. And those who are vaccinated have been inoculated with vaccines that appear to be largely ineffective against Omicron. Keeping a virus as contagious as measles at bay in a population with little natural or artificial immunity is exceedingly difficult. While the authorities are starting to relax restrictions in Shanghai, China’s Effective Lockdown Index remains at elevated levels (Chart 1). A number of domestically designed mRNA vaccines are in phase 3 trials. However, it is not clear how effective they will be. Shanghai-based Fosun Pharma has inked a deal to distribute 100 million doses of Pfizer’s vaccine, but so far neither it nor Moderna’s vaccine have been approved for use. Our working assumption is that China will authorize the distribution of western-made mRNA vaccines later this year if its own offerings prove ineffectual. The Chinese government has already signed a deal to manufacture a generic version of Pfizer’s Paxlovid, which has been shown to cut the risk of hospitalization by 90% if taken within five days of the onset of symptoms. In the meantime, the authorities will continue to play whack-a-mole with Covid. Investors should expect more lockdowns during the remainder of the year. Problem #2: Weaker Export Growth China’s export growth slowed sharply in April, with manufacturing production contracting at the fastest rate since data collection began. Activity appears to have rebounded somewhat in May, but the new export orders components of both the official and private-sector manufacturing PMIs still remain below 50 (Chart 2). Part of the export slowdown is attributable to lockdown restrictions. However, weaker external demand is also a culprit, as evidenced by the fact that Korean export growth — a bellwether for global trade — has decelerated (Chart 3). Chart 2China’s Export Growth Has Rolled Over
China's Export Growth Has Rolled Over
China's Export Growth Has Rolled Over
Chart 3Softer Export Growth Is Not A China-Specific Phenomenon
Softer Export Growth Is Not A China-Specific Phenomenon
Softer Export Growth Is Not A China-Specific Phenomenon
Spending in developed economies is shifting from manufactured goods to services. Retail inventories in the US are now well above their pre-pandemic trend, suggesting that the demand for Chinese-made goods will remain subdued over the coming months (Chart 4). The surge in commodity prices is only adding to Chinese manufacturer woes. Input prices rose 10% faster than manufacturing output prices over the past 12 months. This is squeezing profit margins (Chart 5). Chart 4Well-Stocked Shelves In The US Bode Poorly For Chinese Export Demand
Well-Stocked Shelves In The US Bode Poorly For Chinese Export Demand
Well-Stocked Shelves In The US Bode Poorly For Chinese Export Demand
Chart 5Surging Input Costs Are Weighing On The Profits Of Chinese Commodity Users
Surging Input Costs Are Weighing On The Profits Of Chinese Commodity Users
Surging Input Costs Are Weighing On The Profits Of Chinese Commodity Users
A modest depreciation in the currency would help the Chinese export sector. However, after weakening from 6.37 in April to 6.79 in mid-May, USD/CNY has moved back to 6.66 on the back of the recent selloff in the US dollar. Chart 6The RMB Tends To Weaken When EUR/USD Is Rising
The RMB Tends To Weaken When EUR/USD Is Rising
The RMB Tends To Weaken When EUR/USD Is Rising
We expect the dollar to weaken further over the next 12 months as the Fed tempers its hawkish rhetoric in response to falling inflation. Chart 6 shows that the trade-weighted RMB typically strengthens when EUR/USD is rising. Chester Ntonifor, BCA’s Chief Currency Strategist, expects EUR/USD to reach 1.16 by the end of the year. Problem #3: Flagging Property Market Chinese housing sales, starts, and completions all contracted in April (Chart 7). New home prices dipped 0.2% on a month-over-month basis, and are up just 0.7% from a year earlier, the smallest gain since 2015. The percentage of households planning to buy a home is near record lows (Chart 8). Chart 7The Chinese Property Market Has Been Cooling
The Chinese Property Market Has Been Cooling
The Chinese Property Market Has Been Cooling
Chart 8Intentions To Buy A House Have Declined
Intentions To Buy A House Have Declined
Intentions To Buy A House Have Declined
China’s property developers are in dire straits. Corporate bonds for the sector are, on average, trading at 48 cents on the dollar (Chart 9). Goldman Sachs estimates that the default rate for property developers will reach 32% in 2022, up from their earlier estimate of 19%. The government is trying to prop up housing demand. The PBoC lowered the 5-year loan prime rate by 15 bps on May 20th, the largest such cut since 2019. The authorities have dropped the floor mortgage rate to a 14-year low of 4.25%. They have also taken steps to make it easier for property developers to issue domestic bonds. BCA’s China strategists believe these measures will foster a modest rebound in the property market in the second half of this year. However, they do not anticipate a robust recovery – of the sort experienced following the initial wave of the pandemic – due to the government’s continued adherence to the “three red lines” policy.1 China is building too many homes. While residential investment as a share GDP has been trending lower, it is still very high in relation to other countries. China’s working-age population is now shrinking, which suggests that housing demand will contract over the coming years (Chart 10). Chart 9Chinese Property Developer Bonds Are Trading At Distressed Levels
Chinese Property Developer Bonds Are Trading At Distressed Levels
Chinese Property Developer Bonds Are Trading At Distressed Levels
Chart 10Shrinking Working-Age Population Implies Less Demand For Housing
Shrinking Working-Age Population Implies Less Demand For Housing
Shrinking Working-Age Population Implies Less Demand For Housing
Chinese real estate prices are amongst the highest anywhere. The five biggest cities in the world with the lowest rental yields are all in China (Chart 11). The entire Chinese housing stock is worth nearly $100 trillion, making it the largest asset class in the world. As such, a decline in Chinese home prices would generate a sizable negative wealth effect. Chart 11Chinese Real Estate Is Expensive
China: A Trifecta Of Economic Woes
China: A Trifecta Of Economic Woes
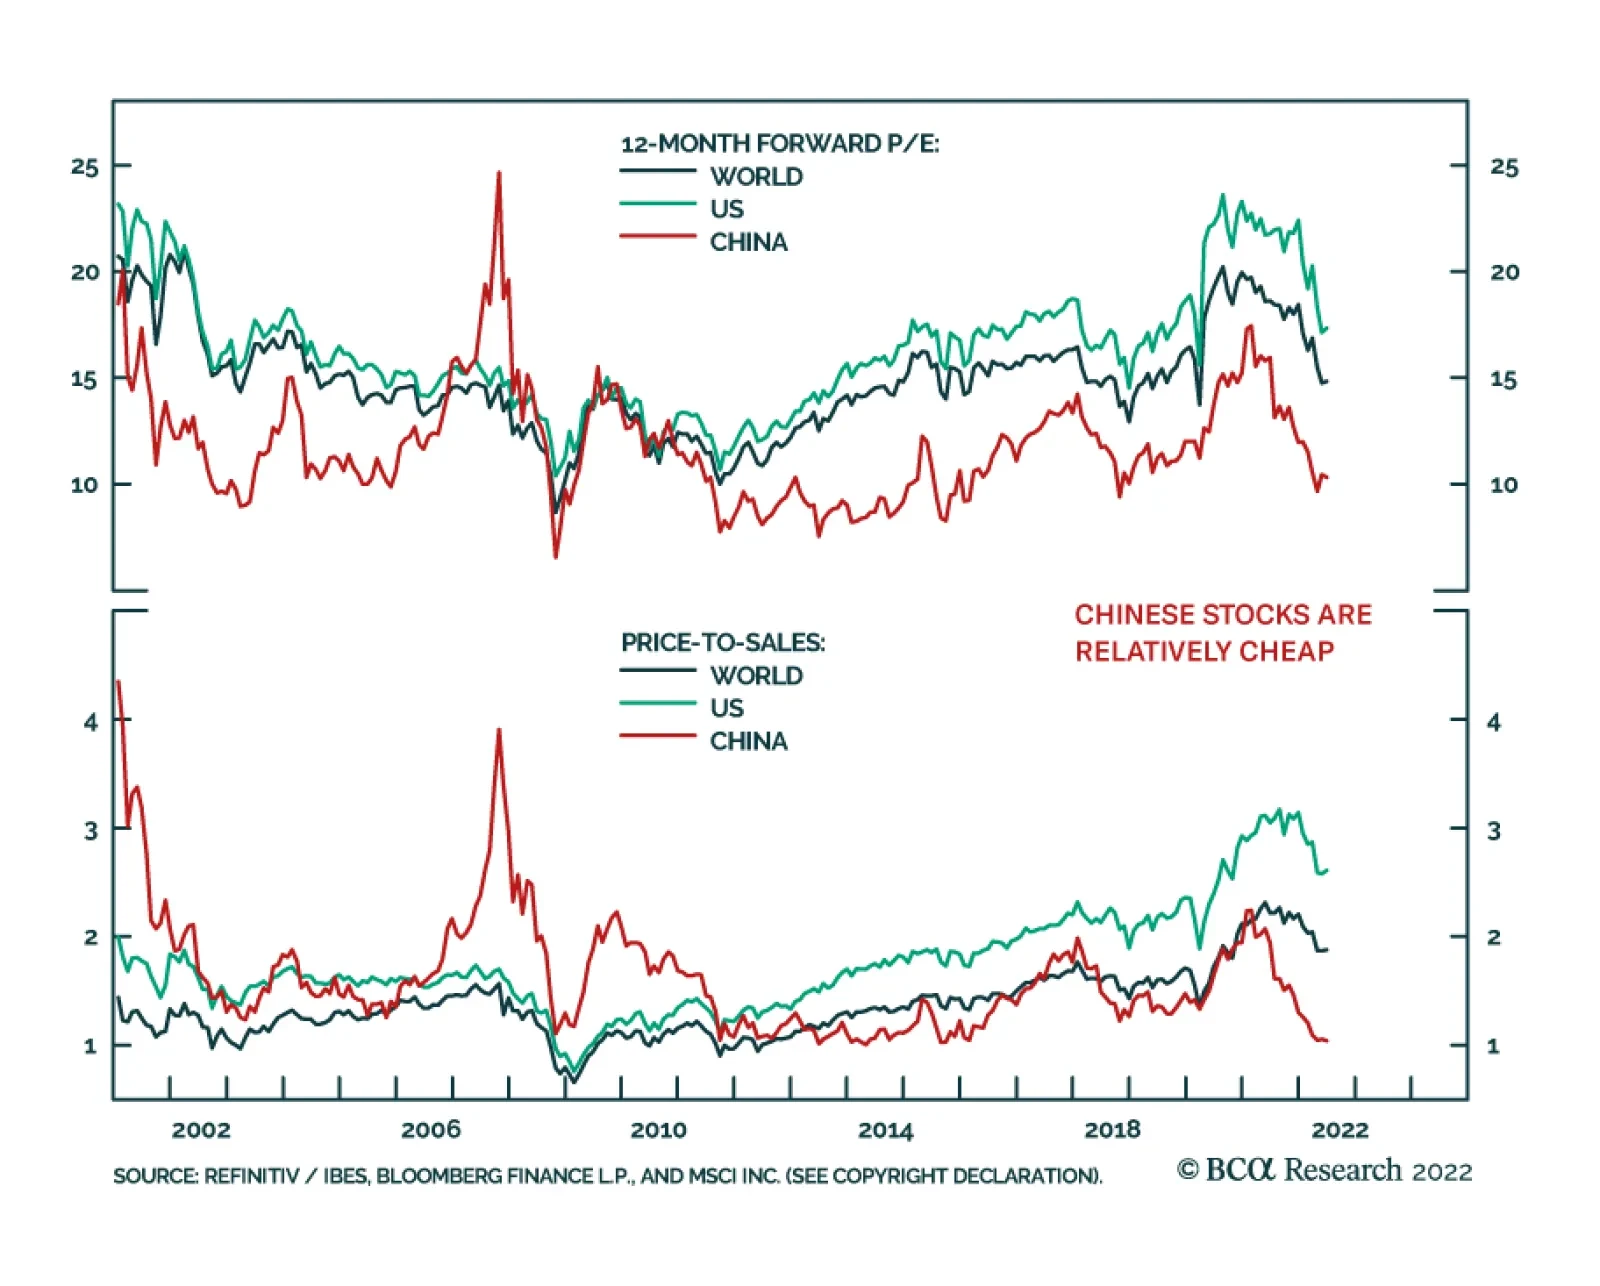
A Silver Bullet? Trying to reflate the Chinese housing bubble would only damage the long-term prospects of China’s economy. Luckily, one does not need to fill a leaky bucket through the same hole the water escaped. As long as there is enough demand throughout the economy, workers who lose their jobs in declining sectors will eventually find new jobs in other sectors. China needs to reorient its economy away from its historic reliance on investment and exports towards consumption. The easiest way to do that is to adopt measures that boost disposable income, which has slowed of late (Chart 12). Not only would this help offset the drag from slowing export growth and a negative housing wealth effect, but it would also take some of the sting out of China’s zero-Covid policy. The authorities have not talked much about pursuing large-scale income-support measures of the kind adopted by many developed economies during the pandemic. As a result, market participants have largely dismissed this possibility. Yet, with the Twentieth Party Congress slated for later this year, the political incentive to shower the economy with cash will only intensify. Chinese equities are trading at only 10-times forward earnings and about 1-times sales (Chart 13). A significant upward rating for equity valuations is likely if the government adopts broad-based income-support measures. As we saw in the US and elsewhere, stimulus cash has a habit of flowing into the stock market; and with real estate in the doldrums, equities may become the asset class of choice for many Chinese investors. With that in mind, we are going long the iShares MSCI China ETF ($MCHI) as a tactical trade. Chart 12Disposable Income Growth Has Been Trending Lower
Disposable Income Growth Has Been Trending Lower
Disposable Income Growth Has Been Trending Lower
Chart 13Chinese Stocks Are Relatively Cheap
Chinese Stocks Are Relatively Cheap
Chinese Stocks Are Relatively Cheap
At a global level, a floundering Chinese property market would have been a cause for grave concern in the past, as it would have represented a major deflationary shock. Times have changed, however. The problem now is too much inflation, rather than too little. To the extent that reduced Chinese investment injects more savings into the global economy and knocks down commodity prices, this would be welcomed by most investors. China’s economy may be heading for a “beautiful slowdown.” Peter Berezin Chief Global Strategist peterb@bcaresearch.com Follow me on LinkedIn Twitter Footnotes 1 The People’s Bank of China and the housing ministry issued a deleveraging framework for property developers in August 2020, consisting of a 70% ceiling on liabilities-to-assets, a net debt-to-equity ratio capped at 100%, and a limit on short-term borrowing that cannot exceed cash reserves. Developers breaching these “red lines” run the risk of being cut off from access to new loans from banks, while those who respect them can only increase their interest-bearing borrowing by 15% at most. View Matrix
China: A Trifecta Of Economic Woes
China: A Trifecta Of Economic Woes
Special Trade Recommendations Current MacroQuant Model Scores
China: A Trifecta Of Economic Woes
China: A Trifecta Of Economic Woes
Executive Summary Return Of The 'Pocketbook Voter'
Biden's Anti-Inflation Campaign
Biden's Anti-Inflation Campaign
President Biden’s pledge to fight inflation ahead of the midterm elections got a boost with the Gulf Arab states pledging to increase oil production in July and August. Yet OPEC’s action should not be overrated. The Saudis are not clearly bailing out Biden … at least not yet. Biden’s other inflation-fighting tools are also limited. The Fed will hike rates, which will weigh on inflation, at least in the short run. A short-term moderation in inflation will cause big shifts in financial markets. It will not save the midterms for Democrats, but gridlock is disinflationary so the effect is the same. Inflation risks will persist over the long run. Recommendation (Cyclical) Inception Level Inception Date Return Small Vs. Large Cap Energy 0.6485 26-JAN-22 14.2% Oil And Gas Transportation And Storage Vs. S&P 500 0.0527 30-MAR-22 16.5% Bottom Line: Expect inflation to moderate in the short run. Oil prices will be volatile. Book a 14% profit on small cap versus large cap energy stocks and a 16.5% profit on the oil and gas transportation sub-sector relative to the broad market. Feature President Biden kicked off the summer – and the midterm election campaign – by defending his record thus far and pledging a three-pronged strategy to fight inflation. His options are limited but he received a boost from OPEC right off the bat. The bottom line is that disinflationary pressures are emerging. These include congressional gridlock, which is likely to return in January 2023. Biden’s policies will not save his party from a defeat in the midterms but moderating inflation will have huge investment consequences. Biden’s Three-Pronged Plan Consumer confidence is hurting while inflation eats away at real wage growth for Americans (Chart 1). Confidence is 14% higher than when Biden took office but 17.5% lower than when it peaked in June 2021. The latest survey from the Conference Board showed another decrease in May. This is foul weather for a ruling party that already stands to suffer a major check on its power when voters go to the polls in the fall. Biden’s approval rating is likely to stabilize but only at the current low level of 41.4%. Voters are focusing on the economy more than other issues like health care, the environment, or foreign affairs (Chart 2). Chart 1Consumer Confidence And Real Wages Tumble
Biden's Anti-Inflation Campaign
Biden's Anti-Inflation Campaign
Chart 2Return Of The 'Pocketbook Voter'
Biden's Anti-Inflation Campaign
Biden's Anti-Inflation Campaign
In the Wall Street Journal Biden laid out his party’s election pitch.1 First, he argued that the US economy is transitioning from rapid recovery to stable growth – i.e. that it is not going into recession. That would be good, but a recession is possible and the slowdown is politically deadly: Household Savings: Aggregate household savings have risen from $1Tn in 2019 to $3.9Tn today, which Biden cited as evidence of improving financial security. The problem is that inequality skews the picture and the average American is unlikely to feel secure. Low and middle income earners have depleted their savings or seen only a small increase (Chart 3). The Biden administration failed to improve inequality as promised while the uneven economic recovery means that lower-paid Americans do not have as much ability to buffer spending as the aggregate savings imply. They will be unhappy in November. Chart 3Normal Households No Longer Flush With Savings
Biden's Anti-Inflation Campaign
Biden's Anti-Inflation Campaign
Jobs And Wages: Biden highlighted the role of his economic stimulus in lowering unemployment and argued that Americans have better paying jobs. But inflation has eroded real wages and incomes, as highlighted in Chart 1 above. Business Investment: Biden argued that business investment is brisk. But sentiment is turning. New orders of core capital goods have rolled over and capex intentions are falling (Chart 4). Manufacturing Comeback: Biden also touted the US manufacturing comeback, claiming that factory jobs are growing at fastest rate in 30 years. But again the tide is shifting against him, with the employment component of manufacturing purchasing manager indexes now signaling contraction (Chart 5). Biden, like Presidents Trump and Obama, has invested heavily in the “Buy America” re-industrialization narrative, so this trend is threatening. Chart 4Business Investment Setback
Biden's Anti-Inflation Campaign
Biden's Anti-Inflation Campaign
Chart 5Manufacturing Employment Weakening
Biden's Anti-Inflation Campaign
Biden's Anti-Inflation Campaign
A recession may indeed be avoided but the risk will not go away in time for the election. A recent study showed that at today’s extremely high level of inflation and extremely low level of unemployment, the odds of recession range from 60%-70% over the next 12-24 months.2 Second, Biden promised voters that he will fight inflation with all the powers of the White House. He laid out a three-pronged approach. However, his options are fairly limited and voters will not change their minds easily over the next five months: The Fed will hike rates: Biden argued that it is the Fed’s job to fight inflation and he will not interfere with rate hikes. While Biden offered admirable verbal support for an independent and non-partisan central bank, the truth is that real interest rates have not been this low since the highly politicized Fed chairmanship of Arthur Burns (Chart 6). While Biden has no reason to discourage rate hikes at the moment, he may change his tune as rates rise, growth slows, and the presidential election approaches. So may Powell, but by then it may be too late. In short, the Fed will hike, which will weigh on inflation, but it will not help Biden win voters this fall or avoid a recession by 2024. Congress will expand capacity: Biden argued that the bipartisan infrastructure bill that he signed into law and his other legislative proposals will boost the supply side of the economy. We are moderately optimistic about Congress’s ability to pass a party-line reconciliation bill that provides subsidies for the energy sector. This could pass under the consensus-building rubric of fighting Russia and climate change at the same time. But this measure, along with Biden’s Housing Supply Action Plan, child care and elderly care subsidies, and other proposals often look more like demand-side stimulus than supply-side reforms. They would fan inflation by increasing government spending and budget deficits. Moreover the administration cannot fix broken supply chains while China remains subject to strict Covid-19 lockdowns (Chart 7). In short, Congress may pass a reconciliation bill but it would be mildly stimulating for the economy (i.e. inflationary) and none of the supply-side improvements would reduce inflation in time for the midterms. Chart 6Biden Doesn't Need To Interfere With The Fed
Biden's Anti-Inflation Campaign
Biden's Anti-Inflation Campaign
Chart 7Supply Snarls Will Continue While China Struggles With Covid
Biden's Anti-Inflation Campaign
Biden's Anti-Inflation Campaign
The budget deficit will fall: Biden argued that budget consolidation will reduce inflation, pointing to this year’s estimated $1.7 trillion drop in the budget deficit and arguing that the deficit is falling lower than pre-pandemic levels. He also argued that robust tax revenues from the economic recovery justified his previous fiscal stimulus (the American Rescue Plan Act). However, the budget is merely normalizing from extreme pandemic heights – there have obviously not been any long-term fiscal reforms (Chart 8). If Congress passes a reconciliation bill then Biden may succeed at passing a minimum corporate tax, which would mark an important success. But while the fiscal drag is negative for inflation, it is also negative for the economy this year and for Biden’s party in the midterms, and long-term budget trends are inflationary. Chart 8No Sign Of Budget Control Over Long Run – Budget Deficits Are Inflationary
Biden's Anti-Inflation Campaign
Biden's Anti-Inflation Campaign
The takeaway is that the Fed’s actions are disinflationary. Congress may or may not pass a climate bill before the election, but if it does, the budget deficit will be the same or larger and the economy will be the same or slightly stimulated. In brief Biden’s anti-inflation plan is to avoid interfering at the Fed. Extremely low unemployment will not save Biden and the Democrats this election season, any more than it saved Trump and the Republicans in 2018 (Chart 9). The Fed will rein in inflation at least in the short run. The election will lead to gridlock, which will freeze fiscal policy. Bottom Line: Inflation expectations will moderate but not because of any supply-side reform or fiscal consolidation coming from the Biden administration this year. Chart 9Low Unemployment Will Not Save Democrats
Biden's Anti-Inflation Campaign
Biden's Anti-Inflation Campaign
Will Biden Ease Russian Energy Tensions? No. Biden’s other avenues for reducing inflation – not addressed in his editorial – lie in the foreign policy realm. The Biden administration is turning toward foreign policy as gridlock settles over Capitol Hill. Biden’s foreign policy will be insular, reactive, and focused on the midterm elections. Could Biden facilitate ceasefire talks in Ukraine so as to ease energy pressures stemming from Russia? The short answer is no. Biden imposed an oil embargo on Russia and ultimately agreed to the EU’s embargo. Biden can afford to run large risks with Russia this year because a larger confrontation or crisis with Russia would not hurt the Democrats in the midterm elections. Indeed the best hope for the Democrats is to recreate the 1962 congressional election, when John F. Kennedy stared down Soviet leader Nikita Krushchev in the Cuban Missile Crisis in October just before the election. Kennedy’s Democrats lost four seats in the House, gained four in the Senate, and kept control of both. Biden’s approval rating is nowhere near Kennedy’s but his party’s outlook is bad enough that he may be willing to run the risk of a crisis that could lead to a favorable rally-around-the-flag effect in the fall (Chart 10). Biden’s clearance this week of the highly mobile artillery rocket system for Ukraine – despite the risk that Ukrainians would launch attacks into Russian territory – underscores this point. Bottom Line: Biden will not ease tensions with Russia ahead of the midterm to try to reduce energy prices. Chart 10Biden Can Risk A Bigger Russia Crisis
Biden's Anti-Inflation Campaign
Biden's Anti-Inflation Campaign
Will Biden Lower China Tariffs? No. What about China – will Biden ease the Trump administration’s tariffs on China to reduce inflation before the midterm election? Treasury Secretary Janet Yellen has repeatedly signaled support for this idea. The Trump administration marked a historic increase in US tariffs and the Biden administration has so far offered relief only for US allies (Chart 11). Again the short answer is no. Protectionist sentiment will prevail during midterm election season and US voters have turned decisively unfavorable toward China in recent years (Chart 12). The China tariffs have not been the driver for US inflation so tariff relief would bring minimal price relief while exacting a high political cost of making Biden look weak, wishy-washy on his pro-democracy values, and (according to Republicans) corrupt. Biden would be offering unilateral benefits to China without gaining Chinese trade concessions. Chart 11Biden Keeps Trump's Tariffs On China
Biden's Anti-Inflation Campaign
Biden's Anti-Inflation Campaign
Chart 12Protectionist Sentiment To Prevail Amid Midterms
Biden's Anti-Inflation Campaign
Biden's Anti-Inflation Campaign
Recently the Biden administration gave some indications of where it stands on China policy. Biden visited US allies in Asia Pacific and provoked China over the Taiwan Strait. Secretary of State Antony Blinken unveiled the administration’s comprehensive China policy and declared that the US would remain focused on China as the “most serious long-term challenge” despite Russia’s open belligerence in Europe.3 On paper, US-China trade relations do not look that bad. While China is falling short of its Phase One trade deal import promises, the truth is that a global recession intervened – and those promises were made under duress when the US slapped sweeping sanctions on Chinese exports. The commodity trade is booming, as is to be expected amid global energy shortages (Chart 13). The problem is that neither the US nor China has the domestic political capital to offer structural concessions in the short run, while both sides are girding for a century-long power struggle over the long run. Supply insecurity will result in the commodity trade suffering as a vast global substitution effect takes place. This is due to Russia’s energy breakup with Europe, growing Russia-China trade linkages, and ongoing US-China tensions. Global trade and US-China trade are set to slow, while China’s surge in energy imports from the US will abate for reasons of state security. Chart 13US-China Trade Faces Strategic Limits
Biden's Anti-Inflation Campaign
Biden's Anti-Inflation Campaign
Bottom Line: No reduction in US tariffs on China is likely. Any reduction will have minimal macroeconomic effects and will be replaced by other punitive measures, given the underlying strategic competition and protectionist election politics. Meanwhile China’s “Zero Covid” policy will weigh on trade ties and sustain price pressures in the short run, as mentioned. Will Biden Lift Iran Sanctions? Probably Not. What about the Middle East? Can Biden convince the core OPEC states to pump more oil in lieu of Russian production? Or can Biden lift sanctions on Iran to undercut soaring gasoline prices? On this front Biden received welcome news on June 2 when Gulf Arab states promised to increase production by 638,000 barrels per day in July and August, up from an expected 430,000. At the same time news broke that Biden will visit Saudi Arabia, including potentially Crown Prince Mohammed bin Salman (MBS), and other Gulf partners sometime in June. There is not yet a clear understanding between Biden and MBS but it is possible that one will develop. The trigger for OPEC’s declaration is the EU oil embargo on Russia. EU is finalizing an embargo on 90% of oil imports – everything except the oil flowing through the Southern Druzhba pipeline to land-locked eastern European states. The embargo will impair Russian energy production: it could fall by as much as 2-3 million barrels per day, distribution interruptions will occur as Russia transitions to Asian buyers, and Russia’s long-term production capacity could be damaged. The result could be a destabilizing price spike. While the core OPEC states have just enough spare capacity to cover that gap in theory (Chart 14), they will not want to commit all spare capacity at once. Chart 14OPEC Spare Capacity
Biden's Anti-Inflation Campaign
Biden's Anti-Inflation Campaign
There is still a lot of uncertainty about how rapidly the embargo will be enforced, how much Russian production will suffer, whether the OPEC states will meet these new production increases (all except Saudi have been falling short), and what will be the OPEC policy beyond August. But for now it is clear that the Gulf Arab states are helping the US and EU by signaling some extra supplies at a critical time. The Gulf Arabs benefit from high oil prices and have previously ignored the G7’s pleas to increase production. But they also need to prolong the business cycle – a cycle-killing price shock from Russia is not in their interest. They are interested in keeping up revenues, maintaining domestic stability, and maintaining their position as the gatekeepers of the global oil supply and price. Secondarily, they are interested in maintaining close relations with the US, which guarantees their national security. OPEC supply easing at this juncture is obviously beneficial to Biden ahead of the US midterm election in November. But there is not yet an understanding on this front because the US is also negotiating to rejoin the 2015 nuclear agreement with Iran, which Saudi Arabia and the Gulf states oppose. Biden’s trip to the Gulf suggests that nothing is settled yet. The OPEC production increase is not proof alone that the US is breaking off talks with Iran. If the Gulf states thought the US were going to strike a deal with Iran, they might produce more oil to preempt the deal and grab more market share, which is what they did in 2014 in advance of the original 2015 US-Iran nuclear deal. The Saudis do not want US shale producers and Iranian exporters to form an unholy alliance that steals market share and compromises Saudi security. Still, we expect the US-Iran deal to fall apart. The Biden administration does not have a unified international coalition to enforce sanctions on Iran. Nor does it have the political capital or longevity to give Iran credible security guarantees that would convince it to freeze its nuclear program. Recent events support our view. The UN atomic watchdog says that Iran’s stockpile of highly enriched uranium has risen by 30% in three months. Meanwhile the US seized an Iranian tanker off Greece, Iran seized two Greek tankers, and Greece warned about dangers to shipping in the Persian Gulf. To develop a better understanding between Biden and MBS, the US needs to assure the Saudis that it will not renew the deal with Iran. The Saudis will not provide oil at Biden’s whim but they may provide if they have satisfaction that the US will scrap the deal, or otherwise compensate them, such as through increased defense assistance (which Biden threatened to cut off when he entered office). Investors should expect OPEC to fall short of its current promises – and yet to try to provide the minimum production increases necessary to prevent a destabilizing oil spike. OPEC’s interest is to make a windfall for as long as possible, which means not killing the cycle out of greed. This policy could be positive for oil prices after the immediate downward price adjustment. But for now investors should merely expect oil volatility as the EU’s embargo enforcement, Russian retaliation, Russian oil production, OPEC implementation, and US sanctions on Iran are all up in the air. A successful US-Iran deal would deepen the drop in oil prices. But odds are 60/40 that that deal will fail, leading to an escalation of tensions in the Middle East. Biden will have to underscore the US’s red line against Iranian nuclear weaponization. Oil supply disruptions will increase in frequency across the region. Bottom Line: OPEC has given Biden’s anti-inflation campaign a boost but it is too soon to declare that oil prices will substantially abate. The US-Iran deal will likely fail, increasing Middle Eastern instability and supply risks. Investment Takeaways Given that we expect continued volatility in the oil space, we are booking a 14% gain on our long small cap energy versus large cap energy trade. We are also booking a 16.5% gain on our overweight position in the oil and gas transportation and storage sub-sector. We will revisit these trades in future reports. Overall we maintain a defensive portfolio strategy. Biden’s anti-inflation campaign is meeting with some success in the Middle East but the US confrontation with Russia and the likely failure of US-Iran talks suggests that price spikes can still kill more demand and lead to further growth upsets. Matt Gertken Senior Vice President Chief US Political Strategist mattg@bcaresearch.com Footnotes 1 See Joseph R. Biden, Jr, “Joe Biden: My Plan for Fighting Inflation,” Wall Street Journal, May 30, 2022, wsj.com. 2 See Lawrence H. Summers and Alex Domash, “History Suggests a High Chance of Recession over the Next 24 Months,” Harvard Kennedy School, March 15, 2022, www.hks.harvard.edu. 3 See Antony J. Blinken, “The Administration’s Approach to the People’s Republic of China,” US Department of State, May 26, 2022, state.gov. Strategic View Open Tactical Positions (0-6 Months) Open Cyclical Recommendations (6-18 Months) Table A2Political Risk Matrix
Biden's Anti-Inflation Campaign
Biden's Anti-Inflation Campaign
Table A3US Political Capital Index
Biden's Anti-Inflation Campaign
Biden's Anti-Inflation Campaign
Chart A1Presidential Election Model
Biden's Anti-Inflation Campaign
Biden's Anti-Inflation Campaign
Chart A2Senate Election Model
Biden's Anti-Inflation Campaign
Biden's Anti-Inflation Campaign
Table A4House Election Model
Biden's Anti-Inflation Campaign
Biden's Anti-Inflation Campaign
Table A5APolitical Capital: White House And Congress
Biden's Anti-Inflation Campaign
Biden's Anti-Inflation Campaign
Table A5BPolitical Capital: Household And Business Sentiment
Biden's Anti-Inflation Campaign
Biden's Anti-Inflation Campaign
Table A5CPolitical Capital: The Economy And Markets
Biden's Anti-Inflation Campaign
Biden's Anti-Inflation Campaign
Executive Summary What Will Be The Implications Of China’s Common Prosperity Policies?
What Will Be The Implications Of China's Common Prosperity Policies?
What Will Be The Implications Of China's Common Prosperity Policies?
On the one hand, Chinese stocks are oversold, equity valuations are attractive and investor sentiment is downbeat. This means that a lot of bad news has already been priced into Chinese share prices, which is positive from a contrarian perspective. On the other hand, the government remains committed to its dynamic zero-COVID policy and will resort to lockdowns whenever there is an outbreak. The Omicron variants have extremely high transmission rates, which means that the probability of new lockdowns is non trivial. Hence, the biggest risk to Chinese share prices is renewed outbreaks and lockdowns – developments which are impossible to forecast. That is why, in our opinion, Chinese stocks are facing fat tails risks. Infrastructure spending will recover modestly in H2 2022. The property sector rebound will be very muted. Chinese exports will contract. The structural outlook is unfriendly for shareholders of platform companies. The known unknowns are: Will the dynamic zero-COVID policy be successful in containing the virus? Will “animal spirits” among consumers and businesses be revived? Will western investors come back to Chinese stocks? The RMB is facing near-term risks as its interest rate differential versus the US dollar dips deeper into negative territory. Bottom Line: For absolute return investors, one way to play such a bifurcated market outlook is to buy out-of-money call options and out-of-money put options simultaneously while maintaining a core / benchmark allocation in Chinese stocks. We maintain our long A-shares / short investable Chinese stocks strategy. Feature As strict lockdowns in key cities are lifted, the Chinese economy is bound for a snap back. Consumer spending will improve, and the government’s infrastructure push will revive capital spending modestly. What does this mean for Chinese stocks? Numerous crosscurrents make the current outlook for Chinese stocks hard to navigate. This report elaborates on variables that we can forecast and those we cannot. Odds of a material rally are not insignificant, but the probability of another relapse is not trivial either. That is why Chinese stocks presently have fat tails. For absolute return investors, one way to play such a bifurcated market outlook is to buy out-of-money call options and out-of-money put options simultaneously while maintaining a core/ benchmark allocation in Chinese stocks. The rationale for maintaining a neutral position is that Chinese share prices could also be range-bound in the coming months. In other words, positives could offset negatives, and the fat tails outcomes might not transpire. In regard to relative performance and regional allocation, we continue to recommend that emerging market portfolios overweight Chinese A-shares and maintain a neutral stance on investable stocks. Meanwhile, global equity portfolios should remain neutral on A-shares while underweighting investable ones. This positioning is consistent with our overall EM allocation – we continue to recommend underweighting EM within a global equity portfolio. What We Know Equity Valuations And Investor Sentiment Are Depressed To begin with, there are a number of indicators that point to low equity valuations and depressed investor sentiment towards Chinese stocks: Analysts’ net EPS revisions for both Chinese A-shares and investable stocks have plunged deep into negative territory (Chart 1). Chinese net EPS revisions are also low relative to EM and global stocks (Chart 2). Chart 1Sentiment On Chinese Stocks Is Downbeat
Sentiment On Chinese Stocks Is Downbeat
Sentiment On Chinese Stocks Is Downbeat
Chart 2Net EPS Revisions: China vs. EM And China vs. Global Stocks
Net EPS Revisions: China vs. EM And China vs. Global Stocks
Net EPS Revisions: China vs. EM And China vs. Global Stocks
The average of the NBS manufacturing PMI new orders and backlog of orders suggests that A-shares EPS will shrink considerably (Chart 3). A-share valuations have become attractive. Our composite valuation indicator points to below average valuations (Chart 4, top panel). This indicator is based on three variables: (1) median multiples; (2) 20% trimmed-mean multiples; and (3) equal-weighted multiples. The latter uses equal weights rather than market cap weights for sub-sectors in the calculation. Chart 3China: Corporate Profits Are Contracting
China: Corporate Profits Are Contracting
China: Corporate Profits Are Contracting
Chart 4Chinese A-Shares Are Attractive
Chinese A-Shares Are Attractive
Chinese A-Shares Are Attractive
In turn, each component is constructed using the averages of the trailing P/E, forward P/E, price-to-cash earnings, price-to-book value (PBV) and price-to-dividend ratios. The 20%-trimmed mean excludes the top 10% and the bottom 10% of sub-sectors, i.e., it removes outliers. Our cyclically adjusted P/E ratio for A-shares currently stands at close to one standard deviation below its mean (Chart 4, bottom panel). The trailing and forward P/E ratios for the equal-weighted A-share index are 18 and 12, respectively. As to the investable universe, any valuation measure for the index is not useful because banks and SOEs continue to be “cheap” for a reason. In turn, internet stocks are fallen angels and their past valuations are not a good roadmap for the future. We discuss the structural outlook for their profitability below. Chart 5Chinese Investable Stocks Have Reached Technical Support Lines
Chinese Investable Stocks Have Reached Technical Support Lines
Chinese Investable Stocks Have Reached Technical Support Lines
Finally, Chinese equities have become oversold. Investable non-TMT share prices are back to their lows of the past 12 years while TMT/growth stocks are at their long-term moving average (Chart 5). In sum, a lot of bad news has already been priced into Chinese share prices, which is positive from a contrarian perspective. Dynamic Zero-COVID Policy We have a very high conviction level that the government will remain committed to its dynamic zero-COVID policy for now. COVID cases in Shanghai and Beijing have declined following the lockdowns. This will only embolden authorities to pursue their dynamic zero-COVID policy and resort to lockdowns whenever outbreaks occur. Consistent with the dynamic zero-COVID policy, the government will inject more stimulus into the economy to offset the negative impact of past and potential future lockdowns. With inflation very subdued, the central government will not shy away from stimulating demand. In fact, the PBoC is allegedly resorting to “window guidance”, i.e., instructing banks to increase their loan origination. However, we do not have a high conviction view on: (1) whether lockdowns could prevent the virus from spreading and (2) whether stimulus will lift household and business confidence and their willingness to consume and invest. See more on this below. Infrastructure Investment Will Recover Modestly So far, the data does not suggest that a recovery in infrastructure investment is underway. Chart 6 illustrates that the number of investment projects approved by National Development and Reform Commission and the length of newly installed electricity transmission lines are not yet rising (Chart 6). Also, steel bar and cement prices are falling despite low output of these materials (Chart 7). This signifies very weak demand. Chart 6Few Signs of Recovery In Infrastructure Investment
Few Signs of Recovery In Infrastructure Investment
Few Signs of Recovery In Infrastructure Investment
Chart 7Falling Prices of Raw Materials = Weak Demand
Falling Prices of Raw Materials = Weak Demand
Falling Prices of Raw Materials = Weak Demand
Furthermore, land sales make up 40% of local government revenue and the value of land sales is down substantially from a year ago. Lower land sales weighing on local government finances and their ability to spend. Nevertheless, odds are that the central government will force local governments to boost infrastructure investment modestly by providing more funding and increasing their special bond issuance quota. For example, Beijing ordered state-owned policy banks to set up an 800 billion yuan ($120 billion) line of credit for infrastructure projects. Chart 8A Snapback in Home Sales Is Possible
A Snapback in Home Sales Is Possible
A Snapback in Home Sales Is Possible
That said, a revival in traditional infrastructure investment will be more muted than it has been in past cycles. Beijing has been very clear in recent years that local governments should not pursue inefficient debt-fueled infrastructure spending, to the point that local officials have been warned that they will be held responsible for debt-financed spending during their lifetime, i.e., even after they retire from their positions. This risk – and the lack of funding due to the shortfall in land sales – will structurally limit local governments’ capacity and drive to invest in traditional infrastructure. The Property Sector Rebound Will Be Muted Residential property sales will likely tick up after having crashed by 30% in the past 12 months (Chart 8). Yet, this will be a mean-reversion rebound rather a full-fledged cyclical recovery. Even though authorities have been easing restrictions for property buyers, any rebound in home sales and construction activity will be modest for the following reasons: The economic slump of the past 12 months and recent lockdowns have weighed on household incomes, which will hinder demand. Housing remains unaffordable for many households who live in poor conditions. Meanwhile, many affluent households already own multiple properties. A lack of confidence in the outlook for house prices will reduce high-income household’s willingness to invest in new properties. Even though restrictions have eased, property developers – which have experienced a major crackdown, are still overleveraged, and face uncertain housing demand – will be reluctant to increase their debt and start new projects. Rather, the lack of funding for property developers points to a major drop in completions in the near term (Chart 9). As we argued in the report titled China: Is The Property Carry Trade Over?, the real estate market is experiencing a structural breakdown, rather than a cyclical one. The performance of property developers stocks supports this hypothesis (Chart 10, top panel). As such, any recovery will be tame and fragile. Chart 9Shrinking Property Developer Funding = Less Housing Completion
Shrinking Property Developer Funding = Less Housing Completion
Shrinking Property Developer Funding = Less Housing Completion
Chart 10Structural Breakdowns in Stocks And Bonds Of Property Developers
Structural Breakdowns in Stocks And Bonds Of Property Developers
Structural Breakdowns in Stocks And Bonds Of Property Developers
In addition, the prices of property developers offshore bonds remain in a clear downtrend (Chart 10, bottom panel). Exports Are Set To Contract Chinese exports will contract in H2 2022 due to reduced spending on goods in the US and Europe as well as in the developing world. Specifically, in the US and euro area, consumption of goods ex-autos boomed during the pandemic and will revert to their means as households spend more on services and less on goods (Chart 11). Declining real household disposable income will also reinforce this trend (Chart 12). Chart 11US and Euro Area ex-Auto Goods Consumption Will Shrink
US and Euro Area ex-Auto Goods Consumption Will Shrink
US and Euro Area ex-Auto Goods Consumption Will Shrink
Chart 12US And Euro Area Household Real Disposable Income Is Contracting
US and Euro Area Household Real Disposable Income Is Contracting
US and Euro Area Household Real Disposable Income Is Contracting
In fact, US retail inventory of goods ex-autos has already surged (Chart 13). As retailers cut back on their new orders, Chinese exports will contract materially. Chart 13US Retail Goods ex-Auto Inventories Have Swelled
US Retail Goods ex-Auto Inventories Have Swelled
US Retail Goods ex-Auto Inventories Have Swelled
In addition, domestic demand in developing economies will also disappoint. EM household spending on consumer goods will underwhelm as more of their income is spent on food and energy. Also, high and rising local interest rates will curb credit origination in mainstream emerging economies. Consequently, their capital spending, employment and income growth will remain subdued. In China, exports as a share of GDP has increased to 19% from 17.5% in 2019. Hence, a contraction in exports will be painful for the overall economy. The Structural Outlook Is Unfriendly For Shareholders Of Platform Companies The government has toned down its rhetoric and its actions related to platform/internet companies. However, we view this development as a tactical rather than a structural change. The key economic policymaker Liu He made market friendly statements towards platform companies on March 16 and May 17 when their share prices were plunging. We believe that the aim of his comments was solely to calm the market and restore investor confidence. We maintain that the structural outlook for shareholders of platform companies remains negative for the following reasons: Higher uncertainty about their business model = higher equity risk premium = lower equity multiples. The government will be regulating their profitability like those of monopolies and oligopolies, which justifies lower multiples. These companies will be performing social duties – i.e. redistributing profits from shareholders to the Chinese people. Beijing’s involvement in their management and the prioritization of national and geopolitical objectives over shareholder interests. Risks of delisting from US stock exchanges are significant. Common prosperity policies pose a risk to the broader corporate sector. These policies will redistribute national income from corporates to households. Chart 14 illustrates that the share of employee compensation has been rising and the share of corporate profits in national income has been falling since 2011-12. These trends will be reinforced by common prosperity policies in the coming years. This is an negative development for shareholders of Chinese companies. Chart 14What Will Be The Implications Of China's Common Prosperity Policies?
What Will Be The Implications Of China's Common Prosperity Policies?
What Will Be The Implications Of China's Common Prosperity Policies?
The Known Unknowns Will The Dynamic Zero-COVID Policy Be Successful? The biggest risk to Chinese share prices is renewed virus outbreaks and lockdowns. It is impossible to forecast these risks. That is why, in our opinion, Chinese stocks are facing fat tail risks. On the one hand, Omicron variants have extremely high transmission rates, making the virus very hard to contain. On the other hand, the government has shown that its dynamic zero-COVID policy has for now succeeded in containing the virus in both Shanghai and Beijing. It is certain, however, that the Chinese economy will incur considerable costs to prevent Omicron from spreading. In addition to the financial costs of ongoing widespread testing, there are also logistical impediments and inefficiencies that these testing and verification policies introduce, even in the absence of lockdowns. Will “Animal Spirits” Among Consumers And Businesses Revive? Another major unknown is whether confidence among consumers and businesses will recover so that they resume spending. If private sector sentiment remains weak, then stimulus measures will have a low multiplier. In other words, the ongoing stimulus will likely fail to boost economic activity. Our proxies for marginal propensity to spend by households and enterprises have been very depressed (Chart 15). Other sentiment/confidence surveys convey the same message. Further, credit demand is non-existent. Banks have lately been buying corporate acceptance bills to fulfill their loan quota (Chart 16). Chart 15Chinese Households And Enterprises Are Reluctant To Spend More
Chinese Households And Enterprises Are Reluctant To Spend More
Chinese Households And Enterprises Are Reluctant To Spend More
Chart 16China: Banks Bought Refinancing Bills in April To Make Their Loan Quota
China: Banks Bought Refinancing Bills in April To Make Their Loan Quota
China: Banks Bought Refinancing Bills in April To Make Their Loan Quota
Critically, the property market has always been a key determinant of overall consumer and business sentiment. Since 2008, there has been no recovery in the Chinese economy without a recovery of property sales, prices and construction (Chart 17). We are doubtful that property sales and construction will stage a strong recovery in the next six to nine months. Thus, our bias is that the multiplier effect of Chinese stimulus will underwhelm in the coming months. Will Western Investors Come Back To Chinese Stocks? Geopolitical tensions between the US and China and the events around the US-Russia clash reduce the likelihood that western investors will come back to Chinese markets, even as growth prospects improve. Chart 18 demonstrates that foreign investors have only marginally reduced their holdings of Chinese onshore stocks (A-shares) and bonds. These data encompass not only western investors, but also investors from other emerging Asian countries. Chart 17China: Housing Cycle = Business Cycle
China: Housing Cycle = Business Cycle
China: Housing Cycle = Business Cycle
Chart 18Foreigners Sold A Small Portion Of Their Onshore Equity and Bond Holdings
Foreigners Sold A Small Portion Of Their Onshore Equity and Bond Holdings
Foreigners Sold A Small Portion Of Their Onshore Equity and Bond Holdings
The risk is that western investors will use any rebound in Chinese shares to reduce their exposure. This will weigh on investable stocks and preclude any significant and durable rally. A Word On The Exchange Rate The RMB will remain volatile in the coming months and will likely depreciate further against the US dollar: Shrinking exports will weigh on foreign exchange availability from exporters. With Asian currencies depreciating against the US, Beijing will be willing to tolerate moderate and gradual yuan depreciation against the greenback to maintain its export competitiveness. The one-year interest rate differential between China and the US has recently turned negative which has probably triggered a shift of deposits from RMB into the USD (Chart 19). In Hong Kong, deposits have recently begun shifting from yuan to HKD, i.e., USD (Chart 20). This development has coincided with the China-US, and hence, China-HK, interest rate differential turning negative. Chart 19China-US: The Interest Rate Differential Has Turned Negative
China-US: The Interest Rate Differential Has Turned Negative
China-US: The Interest Rate Differential Has Turned Negative
Chart 20A Shift From RMB To HKD or USD Deposits
A Shift From RMB To HKD or USD Deposits
A Shift From RMB To HKD or USD Deposits
Finally, there will be more foreign capital outflows if either (1) COVID outbreaks and, hence, lockdowns persist, or (2) US-China tensions escalate. As Chart 18 above illustrates, foreign portfolio capital outflows have so far been modest. Bottom Line: The near-term outlook for the US dollar remains positive as the Fed maintains its hawkish stance. Consistently, the RMB will struggle in the near term but its multi-year outlook is positive. Investment Recommendations The outlook for Chinese stocks is characterized by fat tails. Odds of a material rally are not insignificant but also the probability of another relapse is not trivial either. For absolute return investors, one way to play such a bifurcated market outlook is to buy out-of-money call options and out-of-money put options simultaneously while maintaining a core / benchmark allocation in Chinese stocks. In regard to relative performance /regional allocation, we continue to recommend that emerging market portfolios overweight Chinese A-shares and maintain a neutral stance towards investable stocks. Meanwhile, global equity portfolios should remain neutral on A-shares while underweighting investable ones. This positioning is in-line with our overall EM allocation – we continue to recommend underweighting EM within a global equity portfolio. Consistently, we maintain our long A-shares / short investable Chinese stocks strategy. Onshore government bond yields will continue sliding as the main problem in China is deflation and weak growth, not inflation. The RMB is facing near term risks as its interest rate differential versus the US dollar dips deeper into negative territory. Arthur Budaghyan Chief Emerging Markets Strategist arthurb@bcaresearch.com