Equities

Executive Summary The Fed will continue to hike rates at a time when global trade is contracting. Earlier this week, Fed Chairman Jerome Powell reiterated that the Fed will not hesitate to hike rates until core consumer price inflation gets closer to 2%. Given that US core consumer price inflation is currently at around 5-6%, a mere rollover in core inflation from current levels will not be enough for the Fed to tone down its hawkishness. Besides, according to Powell, US financial conditions are not yet at a level that is consistent with inflation coming down substantially. China will stick to its dynamic zero-COVID policy this year. The economy will continue to underwhelm as the magnitude and nature of stimulus measures announced thus far are not adequate to produce a recovery. Industrial metal prices and global material stocks are at risk of gapping down. Play these markets on the short side. Commodity Currencies Are Signaling Lower Commodity Prices
Commodity Currencies Are Signaling Lower Commodity Prices
Commodity Currencies Are Signaling Lower Commodity Prices
Bottom Line: It is still dangerous to bottom fish in global equities and risk assets in general. The US dollar has more upside. Continue underweighting EM stocks and credit within global equity and credit portfolios, respectively. Feature The risks to global and EM risk assets are still skewed to the downside. Although investor sentiment on global equities has soured of late, we do not think global or EM equities have made a bottom, and the US dollar has not yet reached an apex. Consequently, absolute-return investors should stay defensive, and global equity portfolios should continue to underweight EM stocks. The Fed and Equities Are Still On A Collision Course Earlier this week, Fed Chairman Jerome Powell reiterated the Fed’s commitment to hiking interest rates until core consumer price inflation gets closer to 2%. Notably, in his speech at a WSJ event on May 17, Powell noted: “This is not a time for tremendously nuanced readings of inflation”… “We need to see inflation coming down in a convincing way. Until we do, we’ll keep going.” Given that US core consumer price inflation is currently at around 5-6%, a mere rollover in core inflation from current levels will not be enough for the Fed to tone down its hawkishness. Chart 1US Core Inflation Will Roll Over But Stay Above 3.5-4% For Now
US Core Inflation Will Roll Over But Stay Above 3.5-4% For Now
US Core Inflation Will Roll Over But Stay Above 3.5-4% For Now
Chart 1 shows the average of core median CPI, core trimmed-mean CPI and core sticky CPI, which are better indicators of genuine inflationary pressures because they are less affected by outliers. Even though core CPI inflation ticked down in April, other core measures such as core median CPI, core trimmed-mean CPI and core sticky CPI continued to rise. These core inflation measures are not likely to ease back to 2% unless economic growth falls below its potential. In his same speech, Chairman Powell also asserted: “We will go until we feel like we are at a place where we can say, ‘Yes, financial conditions are at an appropriate place. We see inflation coming down.’ We will go to that point, and there will not be any hesitation about that.” This means that US financial conditions have not yet tightened enough for the Fed to back down on its hawkishness. Finally, we have been arguing that a wage-price spiral has developed in the US as the labor market has become very tight (Chart 2, top panel). Wages and unit labor costs have been surging. Unit labor costs are the most important driver of US core CPI (Chart 2, bottom panel). Therefore, it will be impossible for the Fed to bring down core inflation toward 2% without a retrenchment in the labor market, i.e., layoffs. Rising unemployment will in turn weigh on household income growth and consumption. Chart 2The US Labor Market Is Very Tight And Wage Growth Is Accelerating
The US Labor Market Is Very Tight And Wage Growth Is Accelerating
The US Labor Market Is Very Tight And Wage Growth Is Accelerating
The cost of borrowing for companies is rising globally, and these periods often coincide with equity selloffs. Notably, surging US high-yield ex-energy corporate bond yields herald lower US share prices ahead (Chart 3, top panel). Similarly, rising EM corporate bond yields foreshadow a further decline in EM ex-TMT share prices (Chart 3, bottom panel). Chart 3Rising Corporate Bond Yields Are Bearish For Stocks
Rising Corporate Bond Yields Are Bearish For Stocks
Rising Corporate Bond Yields Are Bearish For Stocks
On the whole, the Fed and many other central banks will be hiking interest rates at a time when global trade volumes are contracting in H2 2022. As discussed in our report A Whiff Of Stagflation? US and EU imports of consumer goods are set to shrink following the pandemic boom. Chart 4Global Export/Manufacturing Are Heading Into Contraction
Global Export/Manufacturing Are Heading Into Contraction
Global Export/Manufacturing Are Heading Into Contraction
Meantime, rolling lockdowns and extremely weak income growth are depressing domestic demand in China. High food and energy prices as well as rising interest rates are weighing on EM ex-China consumption. The sharp underperformance of global cyclicals equities versus global defensive sectors corroborates our expectation that global manufacturing activity will contract (Chart 4). The trade-weighted US dollar typically benefits from both Fed hikes and a global trade slump. As long as the Fed is hawkish and global exports are contracting, the greenback will continue to appreciate. For now, the US dollar remains in a strong position for further appreciation, especially versus EM currencies (Chart 5). Consistently, the selloff in broad EM risk assets is not yet over. Chart 5EM Currencies: More Downside
EM Currencies: More Downside
EM Currencies: More Downside
A major reversal in the trade-weighted dollar will be a signal that the global macro backdrop is improving and that global share prices and EM risk assets are bottoming. Bottom Line: Although equities have become oversold and investor sentiment is depressed, any rebound will prove to be short lived. The Fed will continue to hike rates at a time when global trade is about to shrink. The global/EM equity selloff has further to run. China: Ordinary Stimulus Despite Extraordinary Conditions Only one thing is currently certain in China: authorities are committed to the dynamic zero-COVID policy. However, most experts outside China believe that it will be very difficult to wholly limit the spread of the easily transmissible Omicron variants, even with such stringent mainland containment policies. As a result, rolling lockdowns are the most likely scenario for China’s regions and cities in 2022. These lockdowns will depress household income, confidence and consumption. Private business investment and hiring will also tank. Have authorities provided enough stimulus to support a recovery in H2 2022? We do not think so. Chinese stimulus has so far been ordinary in nature and in magnitude. Policy easing will likely prove to be insufficient to lift the economy out of the current extraordinary slump. First, Chinese exports are set to shrink in H2 as US and EU consumption of consumer goods revert to their pre-pandemic trend. Demand from EM will remain weak. Second, rising unemployment and under-employment is hindering household income. Generous cash transfers are needed to offset this hit to income. Not only did aggregate retail sales collapse in April, but online sales of goods and service also plunged (Chart 6). It is hard to imagine that private businesses will be investing when consumer spending and exports are weak. Our proxies for the marginal propensity to spend for households and enterprises continue to fall (Chart 7). Chart 6China: Even Online Retail Sales Are Shrinking
China: Even Online Retail Sales Are Shrinking
China: Even Online Retail Sales Are Shrinking
Chart 7China: Household And Enterprise Propensity To Spend Have Been Declining
China: Household And Enterprise Propensity To Spend Have Been Declining
China: Household And Enterprise Propensity To Spend Have Been Declining
Critically, China’s credit impulse, excluding government bond issuance, remains in negative territory (Chart 8). Third, China’s property market is frail. Despite modest policy easing for the real estate market, sentiment among home buyers and developers remains downbeat. Given that the housing sector faces structural headwinds, odds are that buyers and developers might not react to the modest property market easing that authorities have so far provided. It is worth noting that Chinese property stocks seem to have had a structural breakdown, and offshore corporate bonds of real estate developers remain in a bear market (Chart 9). These market patterns corroborate that China's housing market has experienced a structural breakdown. Chart 8Chinese Stimulus Has So Far Been Tame
Chinese Stimulus Has So Far Been Tame
Chinese Stimulus Has So Far Been Tame
Chart 9Chinese Property Market Has Experienced A Structural Breakdown
Chinese Property Market Has Experienced A Structural Breakdown
Chinese Property Market Has Experienced A Structural Breakdown
Finally, even though infrastructure spending is being ramped up, it will prove to be insufficient for the economy to recover from a deep slump. Local governments are facing a major financing shortfall. Land sales – which make up about 40% of local government revenues – have dried up. This will hinder local governments’ ability to finance infrastructure projects. As to Chinese equities, internet/platform stocks have become oversold. However, their long-term outlook remains dismal. As we have been arguing since late 2020, the fundamental case for their de-rating remains intact. This week’s meeting between government officials and technology companies has not produced any positive news. Although the tone from authorities was more balanced, they did not offer any relief from already imposed regulations. Chart 10Implications Of China's Common Prosperity Policies
Implications Of China's Common Prosperity Policies
Implications Of China's Common Prosperity Policies
Looking forward, implementing common prosperity policies will be the primary objective of the Communist Party in the coming years. These policies will assure that labor’s share of income will rise further at the expense of corporate profits. Chart 10 demonstrates that the share of labor in national income has been rising since 2011. Conversely, the share operating profits peaked in 2011 and has dropped to a 30-year low. These dynamics will persist as income will continue to be redistributed from shareholders to labor in the majority of industries/companies in China. This is an unfriendly outlook for shareholders, especially foreign ones. Bottom Line: Chinese policy stimulus has so far been insufficient. The economy is in a deep slump, and share prices remain at risk of further decline. Short Industrial Metals And Material Stocks Chart 11Chinese Imports Of Metals Was Shrinking In 2021
Chinese Imports Of Metals Was Shrinking In 2021
Chinese Imports Of Metals Was Shrinking In 2021
Industrial metals’ resilience last year in the face of shrinking Chinese import volumes was unusual (Chart 11). This resilience was probably due to robust DM demand for goods, supply bottlenecks and investors buying commodities as an inflation hedge. As we elaborated in the April 28 report, risks to industrial metals are skewed to the downside. This is despite the fact that agriculture prices will likely rise further, and energy prices will remain volatile due to the geopolitical situation. We continue to recommend investors underweight/short materials stocks and industrial metals for the following reasons: It is ill-advised to play the US inflation story by being long industrial metals and materials stocks. As shown in Chart 2 above, US unit labor costs are driving core inflation, not industrial metals. China accounts for 50-55% of global industrial metal consumption, and since early 2021 the key risk in China has been decelerating demand/deflation not inflation. In fact, commodities have become a crowded hedge against inflation and a global growth slowdown poses a substantial risk to industrial metals. Chart 12 demonstrates that Chinese materials stocks have plunged. We read this as a warning sign for global materials because China is by far the largest consumer of raw materials (excluding energy). Chart 12Chinese Material Stocks Are Signaling Trouble For Global Materials
Chinese Material Stocks Are Signaling Trouble For Global Materials
Chinese Material Stocks Are Signaling Trouble For Global Materials
When share prices of customers are falling, equity prices of suppliers will likely follow. Chart 13 shows that over the past 200 years raw material prices in real US dollar terms (deflated by US headline CPI) have oscillated around a well-defined downtrend. The pandemic surge in commodity prices has pushed raw material prices to two standard deviations above this long-term trend. Chart 13Raw Material Prices (In Real Terms) Are At The Upper End Of A 200-Year Downtrend
Raw Material Prices (In Real Terms) Are At The Upper End Of A 200-Year Downtrend
Raw Material Prices (In Real Terms) Are At The Upper End Of A 200-Year Downtrend
Historically, commodity rallies (and even their secular bull markets) ended when prices reached this threshold. Hence, odds are that industrial commodities might hit a soft spot. Energy prices remain a wild card due to geopolitics. It is critical to note that the raw materials price index shown in Chart 13 does not include energy, gold and semi-precious metals. Finally, shrinking global trade volumes are also negative for raw materials. The average of AUD, NZD and CAD points to lower industrial metal prices (Chart 14). Chart 14Commodity Currencies Are Signaling Lower Commodity Prices
Commodity Currencies Are Signaling Lower Commodity Prices
Commodity Currencies Are Signaling Lower Commodity Prices
Chart 15Bearish Technical Patterns: BHP Share Price And Copper
Bearish Technical Patterns: BHP Share Price And Copper
Bearish Technical Patterns: BHP Share Price And Copper
The share price of BHP, the world’s largest mining company, has put in a major top and is now gapping down (Chart 15, top panel). Copper prices have broken below their 200-day moving average that served as a support in the past 12 months (Chart 15, bottom panel). These market profiles point to more downside. We continue to recommend that investors play this theme in the following ways: Short copper or short copper / long gold; Short global materials / long global industrials; Short ZAR / long USD. Also, we downgraded Brazil early this week partly due to expectations of lower iron ore prices and souring investor attitude toward commodity plays in general. Investment Conclusions Global and EM equities have entered a capitulation phase. It is still dangerous to bottom fish in global equities and risk assets in general. Continue underweighting EM stocks and credit within global equity and credit portfolios, respectively. The US dollar has more upside. Continue shorting the following EM currencies versus the USD: ZAR, PLN, HUF, COP, PEN, PHP and IDR. As we discussed in a recent report, we are approaching a major buying opportunity in EM local currency bonds. However, the US dollar needs to peak for that to transpire. Arthur Budaghyan Chief Emerging Markets Strategist arthurb@bcaresearch.com Strategic Themes (18 Months And Beyond) Equities Cyclical Recommendations (6-18 Months) Cyclical Recommendations (6-18 Months)
Next Thursday May 26, we will hold the BCA Debate – High Inflation: Here To Stay,Or Soon In The Rear-View Mirror? – a Webcast in which I will debate my colleague, Chief Commodity & Energy Strategist, Bob Ryan on the outlook for inflation, and take the side that inflationary fears will soon recede. I do hope you can join us. As such, the debate will replace the weekly report, though we will renew the fractal trading watchlist on our website. Dhaval Joshi Executive Summary The second quarter’s synchronised sell-off in stocks, bonds, inflation protected bonds, industrial metals and gold is an extremely rare star alignment. The last time that the ‘everything sell-off’ star alignment happened was in early 1981 when the Paul Volcker Fed ‘broke the back’ of inflation and turned stagflation into an outright recession. In 2022, the Jay Powell Fed risks doing the same. If history repeats itself, then the template of 1981-82 could provide a useful guide for 2022-23. In which case, bond prices are now entering a bottoming process. Stocks would bottom next. While the near term outlook is cloudy, we expect stock prices to be higher on a 12-month horizon, especially long-duration stocks that are most sensitive to bond yields. But just as in 1981-82, the biggest casualty will be industrial metals, which are likely to suffer at least double-digit losses over the coming year. Fractal trading watchlist: FTSE 100 versus Stoxx Europe 600, Czech Republic versus Poland, Food and Beverages, US REITS versus Utilities, CNY/USD. 2022-23 Could Be An Echo Of 1981-82
2022-23 Could Be An Echo Of 1981-82
2022-23 Could Be An Echo Of 1981-82
Bottom Line: The 1981-82 template for 2022-23 suggests that bonds will bottom first, followed by stocks. But steer clear of gold and industrial metals. Feature Investors have had a torrid time in the second quarter, with no place to hide.1 Stocks are down -10 percent. Bonds are down -6 percent. Inflation protected bonds are down -6 percent. Industrial metals are down -13 percent. Gold is down -6 percent. To add insult to injury, even cash is down in real terms, because the interest rate is well below the inflation rate! (Chart I-1) Chart I-1The 'Everything Sell-Off' In 2022 Last Happened In 1981, When Stagflation Morphed Into Recession
The 'Everything Sell-Off' In 2022 Last Happened In 1981, When Stagflation Morphed Into Recession
The 'Everything Sell-Off' In 2022 Last Happened In 1981, When Stagflation Morphed Into Recession
Such a star alignment of asset returns, in which stocks, bonds, inflation protected bonds, industrial metals, and gold all sell off together, is unprecedented. In the eighty calendar quarters since the inflation protected bond market data became available in the early 2000s there has never been a quarter with an ‘everything sell-off’. Everything Has Sold Off, But Does That Make Sense? The rarity of an ‘everything sell-off’ is because there are virtually no economic or financial scenarios in which all five asset-classes should fall together (Chart I-2 and Chart I-3). Chart I-2An 'Everything Sell-Off' Is Extremely Rare
An 'Everything Sell-Off' Is Extremely Rare
An 'Everything Sell-Off' Is Extremely Rare
Chart I-3An 'Everything Sell-Off' Is Extremely Rare
An 'Everything Sell-Off' Is Extremely Rare
An 'Everything Sell-Off' Is Extremely Rare
A scenario dominated by rising inflation is bad for bonds, but good for inflation protected bonds, especially relative to conventional bonds. Yet inflation protected bonds have not outperformed either in absolute or relative terms. A scenario of rising inflation should also support the value of stocks, industrial metals and certainly gold, given that all three are, to varying degrees, ‘inflation hedges.’ Yet the prices of stocks, industrial metals, and gold have all plummeted. The rarity of an ‘everything sell-off’ is because there are virtually no economic or financial scenarios in which all asset classes should fall together. Conversely, a scenario dominated by slowing growth is bad for industrial metal prices, but good for conventional bond prices – as bond yields decline on diminished expectations for rate hikes. Yet conventional bonds have sold off. What about a scenario dominated by both rising inflation and slowing growth – which is to say, stagflation? In this case, we would expect inflation protected bonds to perform especially well. Meanwhile, with the economy still growing, the prices of industrial metals should not be collapsing, as they have been recently. In a final scenario of an imminent recession we would expect stocks, industrial metals and even gold to sell off, but conventional bonds to perform especially well. The upshot is there are virtually no economic scenarios in which stocks, bonds, inflation protected bonds, industrial metals, and gold plummet together, as they have recently. So, what’s going on? To answer, we need to take a trip back to the 1980s. 1981 Was The Last Time We Had An ‘Everything Sell-Off’ Inflation protected bonds did not exist before the late 1990s. But considering the other four asset-classes – stocks, bonds, industrial metals, and gold – to find the last time that they all fell together we must travel back to 1981, the time of Margaret Thatcher, Ronald Reagan, and the Paul Volcker Fed. And suddenly, we discover spooky similarities with the current Zeitgeist. Just like today, the world’s central banks were obsessed with ‘breaking the back’ of inflation, which, like a monster in a horror movie, kept appearing to die before coming back with second and third winds (Chart I-4). Chart I-4In 1981, Just As In 2022, Central Banks Would 'Do Whatever It Takes' To Kill Inflation
In 1981, Just As In 2022, Central Banks Would 'Do Whatever It Takes' To Kill Inflation
In 1981, Just As In 2022, Central Banks Would 'Do Whatever It Takes' To Kill Inflation
Just like today, the central banks were desperate to repair their badly damaged credibility in managing the economy. As the biography “Volcker: The Triumph of Persistence” puts it: “He restored credibility to the Federal Reserve at a time it had been greatly diminished.” And just like today, central bankers hoped that they could pilot the economy to a ‘soft landing’, though whether they genuinely believed that is another story. Asked at a press conference if higher interest rates would cause a recession, Volcker replied coyly “Well, you get varying opinions about that.” 2022 has spooky similarities with 1981. In fact, in its single-minded aim ‘to do whatever it takes’ to kill inflation, the Volcker Fed hiked the interest rate to near 20 percent, thereby triggering what was then the deepest economic recession since the Depression of the 1930s (Chart I-5 and Chart I-6). With hindsight, it was a price worth paying because the economy then began a quarter century of low inflation, steady growth, and mild recessions – a halcyon period for which the Volcker Fed’s aggressive tightening in the early 1980s have been lauded. Chart I-5In 1981, The Fed Hiked Rates To Near 20 Percent...
In 1981, The Fed Hiked Rates To Near 20 Percent...
In 1981, The Fed Hiked Rates To Near 20 Percent...
Chart I-6...And Thereby Morphed Stagflation Into Recession
...And Thereby Morphed Stagflation Into Recession
...And Thereby Morphed Stagflation Into Recession
Granted, the problems of 2022 are a much scaled down version of those in 1981, yet there are spooky similarities – a point which will not have gone unnoticed by the current crop of central bankers. It is no secret that Jay Powell is a big fan of Paul Volcker. The Echoes Of 1981-82 In 2022-23 The answer to why everything sold off in early 1981 is that central banks took their economies from stagflation to outright recession, and the risk is that the same happens again in 2022-23 (Chart I-7). Chart I-7The Echoes Of 1981-82: Aggressive Rate Hikes In 2022-23 Will Morph Stagflation Into Recession
The Echoes Of 1981-82: Aggressive Rate Hikes In 2022-23 Will Morph Stagflation Into Recession
The Echoes Of 1981-82: Aggressive Rate Hikes In 2022-23 Will Morph Stagflation Into Recession
In the transition from stagflation fears to recession fears, everything sells off because first the stagflation casualties get hammered, and then the recession plays get hammered. This leaves investors with no place to hide, as no mainstream asset is left unscathed. Just as in 1981, a transition from stagflation fears to recession fears likely explains the recent ‘everything sell-off’ because the sell-off in April was most painful for the stagflation casualties – bonds. Whereas, the sell-off in May has been most painful for the recession casualties – industrial metals and stocks. In a stagflation that morphs to recession, everything sells off. What happens next? The template of 1981-82 could provide a useful guide. Bond prices bottomed first, in the late summer of 1981, as it became clear that the economy was entering a downturn which would exorcise inflation. Of the three other asset classes – all recession casualties – stocks continued to remain under pressure for the next few months but were higher 12 months later. Gold fell another 30 percent, though rebounded sharply in 1982. But the greatest pain was in the industrial metals, which fell another 30 percent and did not recover their highs for several years (Chart I-8). Chart I-82022-23 Could Be An Echo Of 1981-82
2022-23 Could Be An Echo Of 1981-82
2022-23 Could Be An Echo Of 1981-82
2022-23 could be an echo of 1981-82, with bond prices now entering a bottoming process. Stocks would bottom next, with one difference being a quicker recovery than in 1981-82 because of their higher sensitivity to bond yields. While the near term outlook is cloudy, we expect stock prices to be higher on a 12 month horizon, especially long-duration stocks that are most sensitive to bond yields. But just as in 1981-82, the biggest casualty of a stagflation that morphs into a recession will be the overvalued industrial metals, which are likely to suffer at least double-digit losses over the coming year. Fractal Trading Watchlist This week’s new additions are Czech Republic versus Poland, and Food and Beverages versus the market, which appear overbought. And US REITS versus Utilities, and CNY/USD, which appear oversold. Finally, our new trade recommendation is to underweight the FTSE 100 versus the Stoxx Europe 600. The resource heavy FTSE 100 is especially vulnerable to our anticipated sell-off in commodities, and its recent outperformance is at a point of fragility that has marked previous turning points (Chart I-9). Set the profit target and symmetrical stop-loss at 5 percent. Chart I-9FTSE 100 Outperformance Is Near Exhaustion
FTSE 100 Outperformance Is Near Exhaustion
FTSE 100 Outperformance Is Near Exhaustion
Fractal Trading Watchlist: New Additions Chart I-10Czech Outperformance Near Exhaustion
Czech Outperformance Near Exhaustion
Czech Outperformance Near Exhaustion
Chart I-11Food And Beverage Outperformance Near Exhaustion CHART 1
Food And Beverage Outperformance Near Exhaustion CHART 1
Food And Beverage Outperformance Near Exhaustion CHART 1
Chart I-12US REITS Are Oversold Versus Utilities CHART 12
US REITS Are Oversold Versus Utilities CHART 12
US REITS Are Oversold Versus Utilities CHART 12
Chart I-13CNY/USD At A Support Level
CNY/USD At A Support Level
CNY/USD At A Support Level
Chart 1The Strong Trend In The 18-Month-Out US Interest Rate Future Is Fragile
The Strong Trend In The 18-Month-Out US Interest Rate Future Is Fragile
The Strong Trend In The 18-Month-Out US Interest Rate Future Is Fragile
Chart 2The Strong Trend In The 3 Year T-Bond Is Fragile
The Strong Trend In The 3 Year T-Bond Is Fragile
The Strong Trend In The 3 Year T-Bond Is Fragile
Chart 3AUD/KRW Is Vulnerable To Reversal
AUD/KRW Is Vulnerable To Reversal
AUD/KRW Is Vulnerable To Reversal
Chart 4Canada Versus Japan Is Reversing
Canada Versus Japan Is Reversing
Canada Versus Japan Is Reversing
Chart 5Canada's TSX-60's Outperformance Might Be Over
Canada's TSX-60's Outperformance Might Be Over
Canada's TSX-60's Outperformance Might Be Over
Chart 6US Healthcare Providers Vs. Software At Risk of Reversal
US Healthcare Providers Vs. Software At Risk of Reversal
US Healthcare Providers Vs. Software At Risk of Reversal
Chart 7A Potential Switching Point From Tobacco Into Cannabis
A Potential Switching Point From Tobacco Into Cannabis
A Potential Switching Point From Tobacco Into Cannabis
Chart 8Biotech Is A Major Buy
Biotech Is A Major Buy
Biotech Is A Major Buy
Chart 9CAD/SEK Reversal Has Started
CAD/SEK Reversal Has Started
CAD/SEK Reversal Has Started
Chart 10Financials Versus Industrials To Reverse
Financials Versus Industrials To Reverse
Financials Versus Industrials To Reverse
Chart 11Norway's Outperformance Could End
Norway's Outperformance Could End
Norway's Outperformance Could End
Chart 12Greece's Brief Outperformance To End
Greece's Brief Outperformance To End
Greece's Brief Outperformance To End
Chart 13BRL/NZD At A Resistance Point
BRL/NZD At A Resistance Point
BRL/NZD At A Resistance Point
Chart 14The Outperformance Of Resources Versus Healthcare Is Vulnerable To Reversal
The Outperformance Of Resources Versus Healthcare Is Vulnerable To Reversal
The Outperformance Of Resources Versus Healthcare Is Vulnerable To Reversal
Chart 15The Outperformance Of Resources Versus Biotech Has Started To Reverse
The Outperformance Of Resources Versus Biotech Has Started To Reverse
The Outperformance Of Resources Versus Biotech Has Started To Reverse
Chart 16Cotton's Outperformance Is Vulnerable To Reversal
Cotton's Outperformance Is Vulnerable To Reversal
Cotton's Outperformance Is Vulnerable To Reversal
Chart 17Homebuilders Versus Healthcare Services Has Turned
Homebuilders Versus Healthcare Services Has Turned
Homebuilders Versus Healthcare Services Has Turned
Chart 18Switzerland's Outperformance Vs. Germany Has Started To End
Switzerland's Outperformance Vs. Germany Has Started To End
Switzerland's Outperformance Vs. Germany Has Started To End
Chart 19The Rally In USD/EUR Could End
The Rally In USD/EUR Could End
The Rally In USD/EUR Could End
Chart 20The Outperformance Of MSCI Hong Kong Versus China Is Vulnerable To Reversal
The Outperformance Of MSCI Hong Kong Versus China Is Vulnerable To Reversal
The Outperformance Of MSCI Hong Kong Versus China Is Vulnerable To Reversal
Chart 21A Potential New Entry Point Into Petcare
A Potential New Entry Point Into Petcare
A Potential New Entry Point Into Petcare
Chart 22FTSE100 Outperformance Vs. Euro Stoxx 50 Vulnerable To Reversal
FTSE100 Outperformance Vs. Euro Stoxx 50 Vulnerable To Reversal
FTSE100 Outperformance Vs. Euro Stoxx 50 Vulnerable To Reversal
Chart 23Netherlands Underperformance Vs. Switzerland Close To Exhaustion
Netherlands Underperformance Vs. Switzerland Close To Exhaustion
Netherlands Underperformance Vs. Switzerland Close To Exhaustion
Chart 24The Sell-Off In The 30-Year T-Bond Is Approaching Fractal Fragility
The Sell-Off In The 30-Year T-Bond Is Approaching Fractal Fragility
The Sell-Off In The 30-Year T-Bond Is Approaching Fractal Fragility
Chart 25The Sell-Off In The NASDAQ Is Approaching Fractal Fragility
The Sell-Off In The NASDAQ Is Approaching Fractal Fragility
The Sell-Off In The NASDAQ Is Approaching Fractal Fragility
Chart 26Czech Outperformance Near Exhaustion
Czech Outperformance Near Exhaustion
Czech Outperformance Near Exhaustion
Chart 27Food And Beverage Outperformance Near Exhaustion CHART 1
Food And Beverage Outperformance Near Exhaustion CHART 1
Food And Beverage Outperformance Near Exhaustion CHART 1
Chart 28US REITS Are Oversold Versus Utilities CHART 12
US REITS Are Oversold Versus Utilities CHART 12
US REITS Are Oversold Versus Utilities CHART 12
Chart 29CNY/USD At A Support Level
CNY/USD At A Support Level
CNY/USD At A Support Level
Dhaval Joshi Chief Strategist dhaval@bcaresearch.com Footnotes 1 The returns are based on the S&P 500, the 10-year T-bond, the 10-year Treasury Inflation Protected Security (TIPS), the LMEX index, and gold. Fractal Trading System Fractal Trades
Markets Echo 1981, When Stagflation Morphed Into Recession
Markets Echo 1981, When Stagflation Morphed Into Recession
Markets Echo 1981, When Stagflation Morphed Into Recession
Markets Echo 1981, When Stagflation Morphed Into Recession
6-Month Recommendations Structural Recommendations Closed Fractal Trades Indicators To Watch - Bond Yields Chart II-1Indicators To Watch - Bond Yields - Euro Area
Indicators To Watch - Bond Yields - Euro Area
Indicators To Watch - Bond Yields - Euro Area
Chart II-2Indicators To Watch - Bond Yields - Europe Ex Euro Area
Indicators To Watch - Bond Yields - Europe Ex Euro Area
Indicators To Watch - Bond Yields - Europe Ex Euro Area
Chart II-3Indicators To Watch - Bond Yields - Asia
Indicators To Watch - Bond Yields - Asia
Indicators To Watch - Bond Yields - Asia
Chart II-4Indicators To Watch - Bond Yields - Other Developed
Indicators To Watch - Bond Yields - Other Developed
Indicators To Watch - Bond Yields - Other Developed
Indicators To Watch - Interest Rate Expectations Chart II-5Indicators To Watch - Interest Rate Expectations
Indicators To Watch - Interest Rate Expectations
Indicators To Watch - Interest Rate Expectations
Chart II-6Indicators To Watch - Interest Rate Expectations
Indicators To Watch - Interest Rate Expectations
Indicators To Watch - Interest Rate Expectations
Chart II-7Indicators To Watch - Interest Rate Expectations
Indicators To Watch - Interest Rate Expectations
Indicators To Watch - Interest Rate Expectations
Chart II-8Indicators To Watch - Interest Rate Expectations
Indicators To Watch - Interest Rate Expectations
Indicators To Watch - Interest Rate Expectations
BCA Research’s European Investment Strategy service concludes that a temporary pullback in the performance of UK equities relative to Euro Area stocks is likely in the second half of 2022. UK stocks enjoy a structural tailwind relative to Euro Area shares.…
Executive Summary UK Stocks Are Close To A Bottom
UK Stocks Are Close To A Bottom
UK Stocks Are Close To A Bottom
The UK economic outlook has greatly deteriorated. Weak global growth and punishing energy inflation will cause activity to contract over the next 12 months. Cost-push pressures will drag inflation above 10% in 2022. Moreover, demand-pull inflation highlights problems with the supply-side of the economy. UK yields have downside relative to those in the Euro Area. GBP/USD will bottom once global stock prices find a floor. EUR/GBP possesses more upside. UK stocks will enjoy a structural tailwind relative to their Eurozone counterparts as a result of a secular bull market in commodity prices. Nonetheless, UK equities are likely to underperform in the second half of 2022. UK small-cap stocks are massively oversold compared to large-cap shares; however, a peak in energy inflation must take place for small-cap equities to stage a rebound. TACTICAL INCEPTION DATE RETURN SINCE INCEPTION (%) COMMENT Overweight UK Gilts Within European Fixed-Income Portfolios 05/16/2022 Cyclical Buy European Healthcare Equities / Sell UK Healthcare Equities 05/16/2022 Tactical Buy European Financials Equities / Sell UK Financials Equities 05/16/2022 Tactical Bottom Line: British Gilts will outperform because of the weakness in UK economic activity, but the trade-weighted pound will remain under pressure. The performance of UK large-cap names is mostly independent from the state of the British economy. The commodity secular bull market will create a potent tailwind for this market. However, a better entry point lies ahead. The Bank of England’s (BoE) latest policy meeting was a cold shower for market participants and their aggressive interest rate pricing in the SONIA curve. Money markets expected a peak in the Bank Rate of 2.7% in 2023, but the BoE’s new Market Participants Survey is calling for it to peak at 1.75% before easing off to 1.5% in 2024. The UK economy is in trouble. Inflation is high and broad-based, which explains why investors are pricing in such an aggressive path for the Bank Rate. Yet, economic activity is weakening and could even contract in early 2023. The BoE clearly puts more weight on growth than investors do. What are the implications of the inflation, growth, and policy outlook for British assets? BCA has upgraded its view on UK bonds to overweight within global fixed income portfolios. We expect more softness in the pound versus the euro. UK large-cap stocks will continue to trade in line with energy dynamics, which means it is still too early to buy British small-cap equities. In the meantime, UK financial and healthcare names will underperform their Euro Area counterparts. Growth To Weaken Further The -0.1% month-over-month GDP contraction in March underscores that UK economic activity has already decelerated sharply. However, the deterioration is only starting. Most sectors of the economy show ominous signs for the quarters ahead. Consumer Sector The biggest hurdle facing UK consumers, like most of their European neighbors, is the surge in inflation, particularly energy and food prices. Safety nets are looser than on the continent, and UK households’ real disposable income are contracting sharply. The impact of this weakening of activity is already visible. UK consumer confidence is falling in line with the knock to real disposable income (Chart 1, top panel). Moreover, real retail sales have already slowed sharply, and the BRC Like-For-Like Retail Sales measure is contracting on an annual basis (Chart 1, bottom panel). As a result, the outlook for consumption is worsening. Ofgem, the UK gas and electricity market regulator, lifted its energy price cap by 54% on April 1st and plans to increase it again by an expected 40% in October. Consequently, the BoE anticipates the share of households’ disposable income spent on energy to hit 7.7% by the end of the year — its highest level since the early 1980s (Chart 2). Chart 1Falling Real Incomes Hurt
Falling Real Incomes Hurt
Falling Real Incomes Hurt
Chart 2Intensifying Energy Drag
Intensifying Energy Drag
Intensifying Energy Drag
The savings cushion developed during the pandemic will not be enough to prevent weaker retail sales. More than 40% of households plan to dip into their existing savings and curtail their savings rate; however, UK excess savings skew heavily toward the richer households. Poorer households with low savings are the ones who spend the largest share of their income on energy (Chart 3), and they are also the ones with a higher marginal propensity to consume. Thus, the knock to these households portends further weakness in consumption volumes. Chart 3The Poor Are Hit Harder
Is UK Stagflation Priced In?
Is UK Stagflation Priced In?
Chart 4No Salvation From Housing
No Salvation From Housing
No Salvation From Housing
Housing is unlikely to save the day. While house prices and housing transactions are robust (Chart 4, top panel), mortgage approvals are declining rapidly and average sales per chartered surveyors are also softening (Chart 4, bottom panels), which suggests housing activity will slow. Rising mortgage rates are a problem. Since January, the quoted rates on mortgages with 90% LTV and 75% LTV are up 65bps and 70bps, respectively, which is hurting housing marginal demand. Moreover, 20% of the UK’s mortgage stock carries variable rates, which further hurts aggregate demand. Business Sector The business sector is also feeling the crunch from rapidly rising energy and input costs. It also dreads the deterioration in consumer sentiment and its implication for future final demand. Chart 5Dwindling Capex Outlook
Dwindling Capex Outlook
Dwindling Capex Outlook
Business confidence is falling abruptly. The CBI Inquiry Business Optimism measure has fallen to its lowest level since the beginning of the pandemic in 2020, when the UK GDP was contracting at a 21% annualized rate (Chart 5). Unsurprisingly, the collapse in business confidence prompted a rapid slowdown in CAPEX. The BoE’s Agents Survey reports that 40% of UK firms have unsustainably low profit margins because of rising input prices and partial pass-through. As a result of financial stress, further capex weakness is likely in the coming quarters. The impact on overall activity of these expanding worries is evident. UK industrial production has slowed very sharply and is now a meager 0.7% on an annual basis. The situation will degrade. Export growth remains strong, which is helping the business sector; however, the rapid slowdown in global industrial production indicates that UK exports will follow suit (Chart 5, second panel). This will have a knock-on effect on corporate profits (Chart 5, bottom panel), which will depress capex further. Other Considerations Chart 6No Offset From The Government
No Offset From The Government
No Offset From The Government
The problems of the private sector may be encapsulated in one indicator. After a surge that boosted GDP, the UK’s nonfinancial private sector’s credit impulse is rapidly contracting (Chart 6), which confirms that risks to activity are building. The public sector will not provide an offset. According to the IMF Fiscal Monitor’s projections, the UK’s fiscal thrust will equal -3.3% of GDP in 2022 and -1.4% in 2023, even after the small giveaways from Chancellor Rishi Sunak’s Spring Statement (Chart 6, bottom panel). Together, these developments confirm our view that UK GDP may also flirt with a recession in the coming 12 months. Bottom Line: The UK economy is facing potent headwinds and activity is set to contract over the coming quarters. Surging energy costs are hurting household consumption and businesses are cutting investment. This time around, government spending is unlikely to come to the rescue, at least not until further pain is inflicted on the UK’s private sector. The BoE expects output to contract in early 2023, with which we agree. Inflation: The Worst Of Both Worlds UK headline inflation is likely to move into double digits territory before year-end. Worrisomely, it will also be more stubborn than that of the Eurozone, because it goes beyond higher food and energy input costs. Essentially, the UK suffers from both the cost-push inflation plaguing the rest of Europe and the demand-pull inflation witnessed in the US. Chart 7Continued Pass-Through
Is UK Stagflation Priced In?
Is UK Stagflation Priced In?
The UK’s cost-push inflation will worsen in the second half of the year and could lift headline CPI above 10% by Q4 2022. Its main driver will be the Ofgem’s second energy cap increase scheduled for October, which is expected to increase household energy costs by 40%. Companies will also try to pass through a greater proportion of their rising costs to their consumers to protect their depleted margins. So far, the BoE’s Agents Survey reveals that on average, UK firms have passed through 80% of their non-labor input cost increases (Chart 7, top panel). In all the sectors surveyed, expected price increases are set to accelerate compared to the past 12 month and may even reach 14% in the manufacturing sector and 8% in the consumer goods sector (Chart 7, bottom panel). Demand-pull inflation is also present in the UK, unlike the rest of Europe, with core CPI at 5.7%, high service inflation, and rapidly rising wage growth. The key problem is an overheating labor market exacerbated by labor supply problems. By the end of 2021, the UK recorded 600 thousand inactive people more than before the pandemic, or individuals who are of working age but outside of the labor force and not seeking a job. This has compressed the labor participation rate to 63%, or the lowest level since the 2011-2012 period (Chart 8). So far, not even rapid wage gains have incentivized these persons to seek employment. The impact of Brexit further curtails the supply of labor. Since the pandemic began, the size of the working age population has decreased by 100 thousand as EU citizens have moved back home (Chart 8, second panel). Labor demand, however, is not weak. Job vacancies have surged to an all-time high of 1.3 million, or a ratio of one job vacancy per unemployed worker. Moreover, according to the BoE’s Agents Survey, the proportion of firms reporting recruitment difficulties is extremely elevated (Chart 8, third panel). As a result of weak labor supply but strong labor demand, wages are rising rapidly (Chart 8, bottom panel), with the KPMG/REC Indicator of pay higher than 6%. Chart 8Labor Market Tightness
Labor Market Tightness
Labor Market Tightness
Chart 9Poor Productivity Weighs On Trend GDP
Poor Productivity Weighs On Trend GDP
Poor Productivity Weighs On Trend GDP
Rapidly increasing wages and underlying inflation are indicative of a greater malaise. UK GDP is still 3.6% below its pre-COVID trend, while US GDP has already moved past its previous peak. Yet, wages and underlying inflation are just as strong in both economies. This suggests that the UK trend GDP has slowed more than in the US and that aggregate demand is colliding more rapidly with the constraint created by a weaker potential GDP. Labor supply is not the only culprit behind the slowdown in UK’s trend GDP. Since Brexit, UK capex has been particularly weak, which has depressed productivity growth and suppressed trend GDP further (Chart 9). Bottom Line: The BoE expects UK headline CPI inflation to move above 10% before the end of the year. We agree with this assessment. Cost-push inflation will remain strong in response to additional increases in regulated energy prices this fall and greater pass-through from businesses. Meanwhile, the labor market is overheated because of weak labor supply and surging job vacancies. The UK core inflation is likely to be sticky as Brexit weighs on the country’s trend GDP, which causes aggregate demand to surpass aggregate supply easily. Investment Implications The investment implications of the UK’s weak growth and strong inflation outlook are far reaching. Fixed Income Implications BCA’s Global Fixed Income Strategy service upgraded UK government bonds to overweight from underweight in their global fixed income portfolios. We heed this message and move to overweight UK Gilts relative to German Bunds within European fixed income portfolios. Chart 10The BoE's Dovish Justification
The BoE's Dovish Justification
The BoE's Dovish Justification
The BoE’s forecast calls for a deeply negative output gap as well as a rising rate of unemployment in 2023 and 2024. According to the BoE’s model, these dynamics will weigh on headline CPI next year (Chart 10). We take the BoE at its word when it communicated a gentler pace of rate hikes than was anticipated by the SONIA curve. The BoE believes that the weakness in the UK’s trend GDP growth weighs on the country’s neutral rate of interest. Thus, there is a limited scope before higher interest rates hurt economic activity. Since the BoE already foresees a poor growth outcome and weaker inflation next year, this view of the neutral rate logically results in a shallow path of interest rate increases. In other words, the BoE is not the Fed. This view prompts our fixed income colleagues to expect the SONIA curve to move toward the gentler rhythm of interest rate hikes proposed by the BoE. As a corollary, it implies that Gilt yields have more downside. More specifically, BCA sees room for UK-German yields spreads to narrow. Investors have expected the BoE to be significantly more hawkish than the European Central Bank (ECB), and a partial convergence in expected interest rate paths is likely. Moreover, UK yields have a higher beta than German ones. As a result, the current wave of risk aversion driven by global growth fears should cause an outperformance of UK government bonds compared to German ones. Currency Market Implications The outlook for GBP/USD depends on the evolution of overall market conditions. If risk assets remain under pressure, so will Cable. Chart 11Cable And EM Stocks
Cable And EM Stocks
Cable And EM Stocks
A durable bottom in GBP/USD will coincide with a rebound in EM equities (Chart 11). The correlation between these two assets most likely reflects the UK’s current account deficit of 2.8% of GDP in 2021. Large external financing needs render the currency very sensitive to global liquidity conditions and thus, to the dollar’s trend and global risk aversion, as is the case with EM assets. Peter Berezin, BCA Chief Global Strategist, expects global stocks to rebound in the near future, which will lift EM equities in the process. Interestingly, GBP/USD does not correlate with the relative performance of EM shares. Thus, a rebound in Cable does not contradict BCA’s Emerging Market Strategy service’s view that EM stocks are likely to underperform further in the coming months. Chart 12A Big Handicap For the GBP vs the EUR
A Big Handicap For the GBP vs the EUR
A Big Handicap For the GBP vs the EUR
BCA’s Foreign Exchange strategy team sees further upside in EUR/GBP, toward the 0.9 level. 2-year yield differentials between the UK and Germany are likely to narrow in response to the downgrade of the SONIA curve. Importantly, the wide UK current account deficit necessitates higher real interest rates to prop the pound against the euro because the Eurozone current account surplus stands at 2.3% of GDP. However, neither the 2-year nor 10-year real rates are higher in the UK than they are in the Euro Area (Chart 12). Additionally, even the nominal yield premium of UK bonds vanishes once they are hedged into euros. UK hedged 2-year bonds yield 50bps less than their German counterparts, and 10-year Gilts offer 80bps less than Bunds, which limits continental inflows into the UK. Equity Market Implications UK stocks are pro-cyclical, and their absolute performance will bottom in tandem with global equities. The near-term outlook for global equities remains clouded by the confluence of global growth fears, a weaker CNY, and tighter monetary policy around the world. Meanwhile, UK stocks are very cheap, trading at a forward P/E ratio of 11. They are tactically oversold and are lagging forward earnings (Chart 13). Relative to global equities, the performance of UK stocks will continue to track that of global energy firms compared to the broad market. The heavy exposure of UK large-cap indices to oil and gas stocks has been a major asset since energy shares have become market darlings (Chart 14). Chart 13UK Stocks Are Close To A Bottom
UK Stocks Are Close To A Bottom
UK Stocks Are Close To A Bottom
Chart 14UK Large-Caps Are About Oil
UK Large-Caps Are About Oil
UK Large-Caps Are About Oil
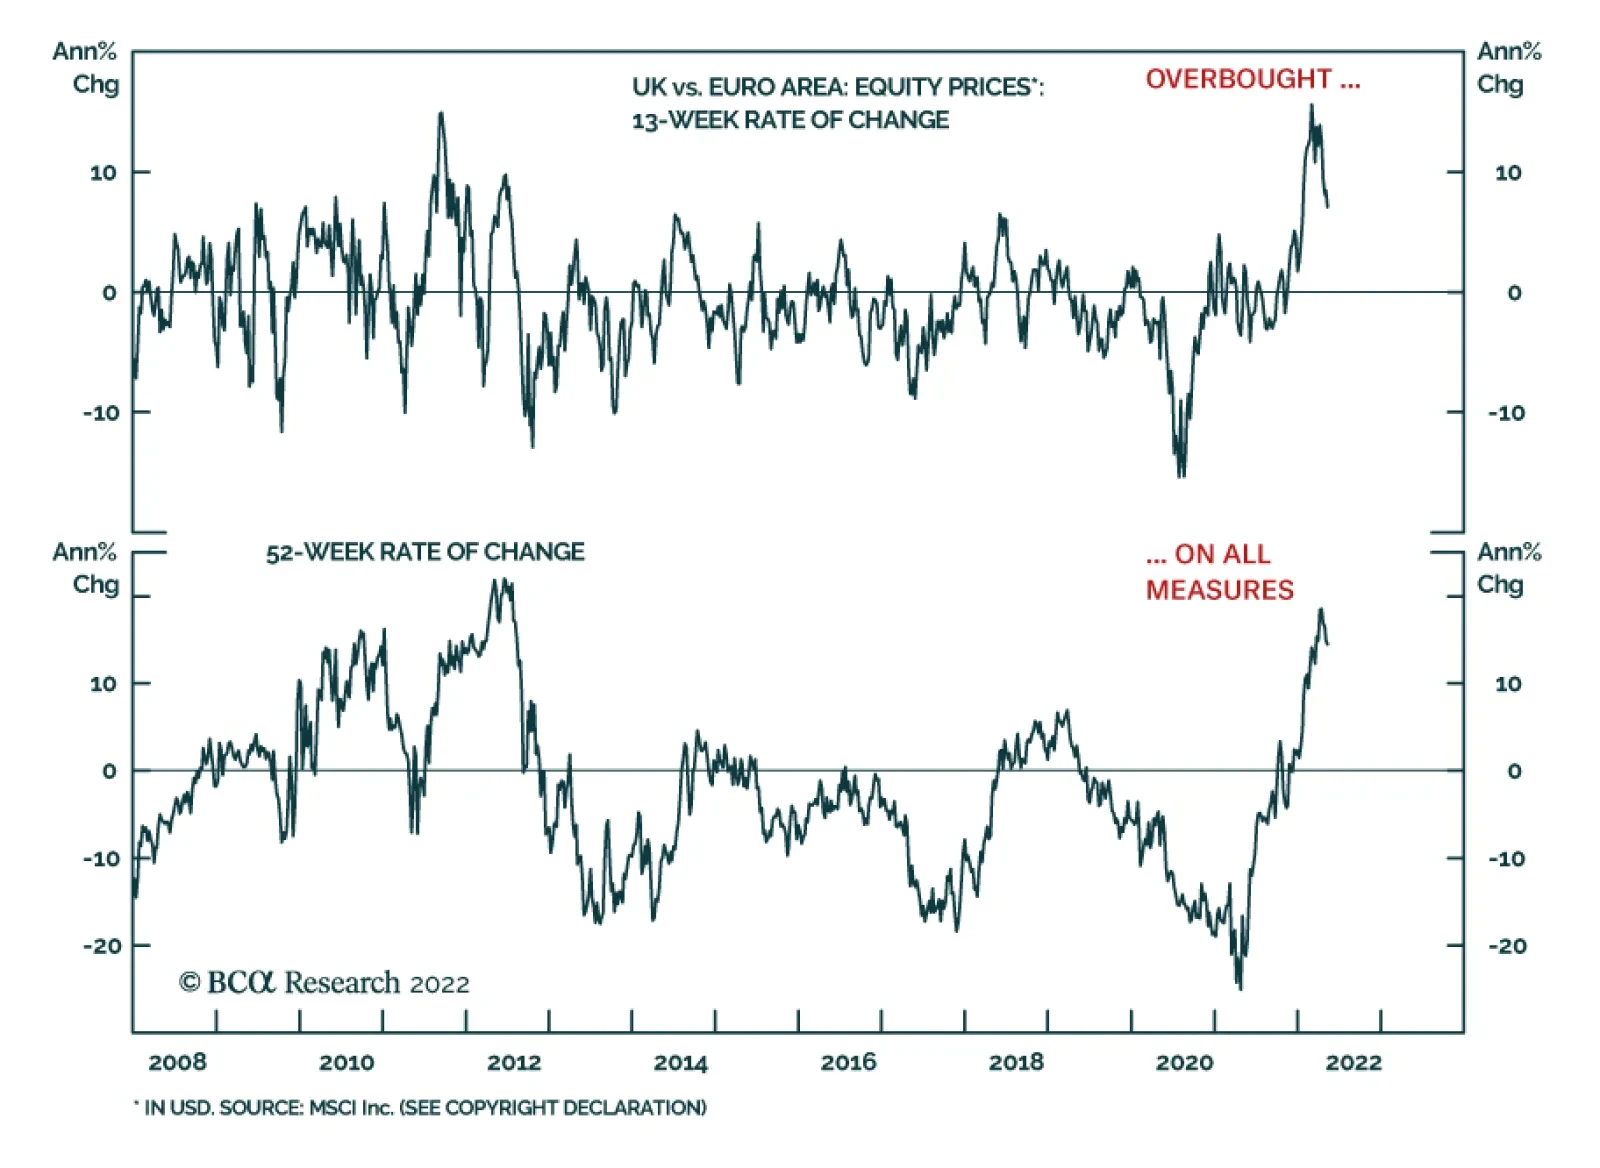
At the time of writing, Sweden and Finland have yet to officialize their membership application to NATO, but BCA’s Geopolitical Strategy team assigns a high probability to this outcome. Russia will not stand idly by, especially as the EU threatens to cut their oil imports. Consequently, a deeper energy embargo is increasingly likely, which should prompt a temporary but violent rally in oil and natural gas prices. This process should sustain a few more weeks of outperformance from UK large-cap shares relative to the rest of the world. Chart 15The UK vs The Eurozone: Cheap But Overbought
The UK vs The Eurozone: Cheap But Overbought
The UK vs The Eurozone: Cheap But Overbought
Structurally, UK equities are likely to remain well supported. A pullback in relative performance later this year is possible once oil prices ease off as BCA’s Commodity and Energy team expects. However, the oil market will stay tight for years to come because of the investment dearth observed since 2014-2015, when OPEC 2.0 started its market-share war. According to Bob Ryan, BCA’s Chief Commodity Strategist, it will take years of high returns in the sector to attract the capital needed to lift energy capex enough to line up supply with demand. Thus, energy remains a structurally favored sector, which will boost the cheap UK market’s appeal. UK stocks enjoy a structural tailwind relative to Euro Area shares. They remain cheap, because they still trade at a significant historical discount (Chart 15). Moreover, relative earnings are moving decisively in favor of UK stocks, something that is unlikely to change, even if the UK economy contracts. Ultimately, UK large-cap names derive the bulk of their profits from overseas and the structural tailwind of a secular commodity bull market will continue to assert itself on relative profits. Nevertheless, UK shares have also become extremely overbought, which raises the risk of a pullback in the second half of the 2022 (Chart 15, third and fourth panel). The recent outperformance of UK stocks relative to those of the Eurozone has been larger than what sectoral biases explain. An equal-sector weights version of the UK MSCI has outperformed a similarly constructed Euro Area index by 9.6% year-to-date. Chart 16Waiting For Catalysts To A Eurozone Rebound
Waiting For Catalysts To A Eurozone Rebound
Waiting For Catalysts To A Eurozone Rebound
A tactical rectification of the overbought conditions in the performance of UK equities relative to those of the Euro Area will require an ebbing of stagflation fears in the Euro Area (Chart 16, top panel). This implies that investors looking to buy Eurozone equities are waiting for a stabilization in the energy market (that is, waiting for clarity about Sweden’s and Finland’s NATO decision as well as Russia’s response). It also means that the Chinese economy must stabilize, since Eurozone equities are more sensitive to the evolution of the Chinese credit impulse than UK ones (Chart 16, second panel). Nonetheless, BCA’s Global Fixed Income Strategy team’s view on UK-German spreads is consistent with an eventual tactical pull back in the relative performance of UK stocks vis-à-vis Euro Area ones (Chart 16, bottom panel). Two pair trades make attractive vehicles to bet on an underperformance of UK stocks relative to those of the Euro Area in the second half of 2022. The first one is to sell UK financials at the expense of Euro Area financials. Historically, a decline in UK Gilt yields relative to their German equivalent strongly correlates with an underperformance of UK financials (Chart 17). The second one is to sell UK healthcare names relative to those in the Eurozone. The relative performance of healthcare shares has greatly outpaced relative earnings and is now hitting a critical resistance level (Chart 18). Moreover, UK healthcare firms are exceptionally overbought relative to their Euro Area competitors. Importantly, those two trades display little correlation to the broad market trend. Chart 17Challenges To UK Financials
Challenges To UK Financials
Challenges To UK Financials
Chart 18UK Healthcare: Running Ahead Of Itself
UK Healthcare: Running Ahead Of Itself
UK Healthcare: Running Ahead Of Itself
Finally, UK small-cap stocks are becoming attractive relative to their large-cap counterparts, although the timing remains risky. Unlike the internationally focused large-cap indices, small-cap shares are a direct bet on the health of the UK domestic economy. Hence, small- and mid-cap names have massively underperformed the FTSE-100 as market participants sniffed out the poor outlook for UK economic activity (Chart 19). They are now extremely oversold relative to large-cap names and their overvaluation has been corrected. The main problem with small-cap shares is the lack of a catalyst to rectify their oversold conditions. The most likely candidate for such a reversal would be a peak in energy inflation, considering it stands at the crux of the headwinds that UK consumption and growth face. However, energy CPI will not peak until later this fall and thus, the pain on UK households will build until then. As a result, wait for a clear sign that energy inflation recedes before entering a long UK small-cap / short UK large-cap contrarian trade (Chart 20). Chart 19Bombed Out Small-Caps...
Bombed Out Small-Caps...
Bombed Out Small-Caps...
Chart 20…Need A Peak In Energy Inflation
...Need A Peak In Energy Inflation
...Need A Peak In Energy Inflation
Bottom Line: In line with our expectations that UK growth will worsen significantly in the quarters ahead, we follow the BCA Global Fixed Income team and move to overweight UK government bonds within European fixed income portfolios. While we expect GBP/USD will bottom once global risk assets find a floor, BCA’s Foreign Exchange Strategy team also anticipates Sterling to depreciate further relative to the euro. Because of their large energy and materials exposure, UK large-cap equities will enjoy a structural outperformance relative to Euro Area large-cap indices on the back of a secular bull market in commodities. However, a temporary pullback in the UK’s relative performance is likely in the second half of 2022. Selling UK financials and UK healthcare stocks relative to their Eurozone counterparts offers a compelling approach to implement this view. Finally, UK small-caps are oversold relative to large-caps, but we recommend investors wait until energy CPI peaks when a relative rebound may emerge. Mathieu Savary, Chief European Strategist Mathieu@bcaresearch.com Tactical Recommendations Cyclical Recommendations Structural Recommendations
Executive Summary Favor ASEAN And The Philippines
Favor ASEAN And The Philippines
Favor ASEAN And The Philippines
Southeast Asia is suffering from fading macro and geopolitical tailwinds but there are still investment opportunities on a relative basis. The peace dividend, globalization dividend, and demographic dividend are all eroding and will continue to erode, though there are relative winners and losers. The Philippines and Thailand are most secure; the Philippines and Indonesia are least dependent on trade; and the Philippines and Vietnam have the highest potential GDP growth. Geopolitical risk premiums have risen for Russia, Eastern Europe, China, and will rise for the Middle East. This leaves ASEAN states as relatively attractive emerging markets. Trade Recommendation Inception Date Return LONG PHILIPPINES / EM EQUITIES 2022-05-12 LONG ASEAN / ACW EQUITIES 2022-05-12 Bottom Line: ASEAN’s geopolitical outlook is less ugly than many other emerging markets. Cyclically, go long ASEAN versus global equities and long Philippine equities versus EM. Feature Chart 1Hypo-Globalization A Headwind For Trading States
Hypo-Globalization A Headwind For Trading States
Hypo-Globalization A Headwind For Trading States
The Philippines elected its second “strongman” leader in a row on May 9, provoking the usual round of editorials about the death of liberalism. Investors know well by now that such political narratives do as much to occlude economic reality as to clarify it. Still, there is a fundamental need to understand the changing global political order since it will ultimately impact the investment landscape. If the global order stabilizes – e.g. US-Russia and US-China relations normalize – then trade and investment may recover from recent shocks. A new era of “Re-Globalization” could ensue. Asia Pacific would be a prime beneficiary as it is full of trading economies (Chart 1). Related Report Geopolitical StrategySecond Quarter Outlook 2022: When It Rains, It Pours By contrast, if Great Power Rivalry escalates further, then trade and investment will suffer, the current paradigm of Hypo-Globalization will continue, and East Asia’s frozen conflicts from 1945-52 will thaw and heat up. Asian states will have to shift focus from trade to security and their economies will suffer relative to previous expectations. How will Southeast Asia fare in this context? Will it fall victim to great power conflict, like Eastern Europe? Or will it keep a balance between the great powers and extract maximum benefits? Three Dividends Three dividends have underpinned Southeast Asia’s growth and prosperity in recent decades: 1. Peace Dividend – A relative lack of war and inter-state conflict. 2. Globalization Dividend – Advantageous maritime geography and access to major economies. 3. Demographic Dividend – Young demographics and strong potential GDP growth. All three of these dividends are eroding, so the macro and geopolitical investment case for ASEAN has weakened relative to twenty years ago. Nevertheless in a world where Russia, China, and the Gulf Arab markets face a higher and persistent geopolitical risk premium, ASEAN still offers attractive investment opportunities, particularly if the most geopolitically insecure countries are avoided. Peace Dividend Favors The Philippines And Thailand Since the end of the US and Chinese wars with Vietnam, military conflicts in Southeast Asia have been low intensity. Lack of inter-state conflict encouraged economic prosperity and security complacency. The five major Southeast Asian nations saw military spending decline since the 1990s and only Vietnam spends more than 2% of GDP (Chart 2). Chart 2Peace Brought Prosperity
Southeast Asia: Favor The Philippines
Southeast Asia: Favor The Philippines
Unfortunately that is about to change. China has large import dependencies, an insufficient tradition of sea power, and feels hemmed in by its geography and the US alliance system. Beijing’s solution is to build and modernize its navy and prepare for potential conflict with the US, particularly over Taiwan. The result is rising tension across East Asia, including in Southeast Asia and the South China Sea. The ASEAN states fear China will walk over them, China fears they will league with the US against China, and the US tries to get them to do exactly that. Hence ASEAN’s defense spending has not kept up with its geopolitical importance and will have to rise going forward. Consider the following: Vietnam risks conflict with China. Vietnam has the most capable and experienced naval force within ASEAN due to its sporadic conflicts with China. Its equipment is supplied mainly by Russia, pitting it squarely against China’s Soviet or Soviet-inspired equipment. But Russia-China ties are tightening, especially after Russia’s divorce with Europe. While Vietnam will not reject Russia, it is increasingly partnering with the United States. The pandemic added to the Vietnamese public’s distrust of China, which is ancient but has ramped up in recent years due to clashes in the South China Sea. While Vietnam officially maintains that it will never host the US military, it is tacitly bonding with the US as a hedge against China. Yet Vietnam does not have a mutual defense treaty with the US, so it is vulnerable to Chinese military aggression over time. Indonesia distances itself from China. Rising security tensions are also forcing Indonesia to change its strategy toward China. Indonesia lacks experience in naval warfare and is not a claimant in the territorial disputes in the South China Sea. It is reluctant to take sides due to its traditionally non-aligned diplomatic status, its military culture of prioritizing internal stability (which is hard to maintain across thousands of islands), and China’s investment in its economy. However, China is encroaching on Indonesia’s exclusive economic zone and Indonesia has signaled its displeasure through diplomatic snubs and high-profile infrastructure contracts. Indonesia is trying to bulk up its naval and air capabilities, including via arms purchases from the West. Malaysia distances itself from China. Malaysia and the Philippines have the weakest naval forces and both face pressure from China’s navy and coast guard due to maritime-territorial disputes. But while the Philippines gets help from the US and its allies and partners, Malaysia has no such allies. Traditionally it was non-aligned. Instead it utilizes economic statecraft, as it has often done against more powerful countries. It recently paused Chinese economic projects in the country to conduct reviews and chose Ericsson over Huawei to build the 5G network. Ongoing maritime and energy disputes will motivate defense spending. The Philippines preserves alliance with United States. Outgoing President Rodrigo Duterte tried but failed to strengthen ties with China and Russia. Beijing continued to swarm the Philippines’ economic zone with ships and threaten its control of neighboring rocks and reefs. Ultimately Duterte renewed his country’s Visiting Forces Agreement with the US in July 2021. The newly elected President “Bong Bong” Marcos is even less likely to try to pivot away from the US. Instead the Philippines will work with the US to try to deter China. Thailand preserves alliance with United States. Thailand is the most insulated from the South China Sea disputes and often acts as mediator between China and other ASEAN states. However, Thailand is also a formal US defense ally and assisted with logistics during the Korean and Vietnamese wars. While US military aid was suspended after the 2014 military coup, non-military aid from the US continued. The State Department certified Thailand’s return to democracy in 2019, relations were normalized, and the annual Cobra Gold exercise resumed in 2020. The US’s hasty normalization shows Thailand’s importance to its regional strategy. On their own, the ASEAN states cannot counter China – they are simply outgunned (Chart 3). Hence their grand strategy of balancing Chinese trade relations with American security relations. Chart 3Outgunned By China
Southeast Asia: Favor The Philippines
Southeast Asia: Favor The Philippines
Chart 4Opinion Shifts Against China
Southeast Asia: Favor The Philippines
Southeast Asia: Favor The Philippines
In recent decades, with the US divided and distracted, they sought to entice China through commercial deals, in hopes that it would reduce its encroachments on the high seas. This strategy failed, as China’s expansion of economic and military influence in the region is driven by China’s own imperatives. Beijing’s lack of transparency about Covid-19 also sowed distrust. As a result, public opinion became more critical of China and defensive of national sovereignty (Chart 4). Southeast Asia will continue trading with China but changing public opinion, the US-China clash, and tensions in the South China Sea will inject greater geopolitical risk into this once peaceful and prosperous region. Military weakness will also lead the ASEAN states to welcome the US, EU, Japan, and Australia into the region as economic and security hedges against China. This trend risks inflaming regional tensions in the short run – and China may not be deterred over the long run, since its encroachments in the region are driven by its own needs and insecurities. Decades of under-investment in defense will result in ASEAN rearmament, which will weigh on fiscal balances and potentially economic competitiveness. Investors should not take the past three decades of peace for granted. Bottom Line: Vietnam (like Taiwan) is in a geopolitical predicament where it could provoke China’s wrath and yet lacks an American security guarantee. The Philippines and Thailand benefit from American security guarantees. Indonesia and Malaysia benefit from distance from China. All of these states will attempt to balance US and China relations – but in the future that means devoting more resources to national security, which will weigh on fiscal budgets and take away funds from human capital development. Waning Globalization Dividend Favors Indonesia And The Philippines All the ASEAN states rely heavily on both the US and China for export markets. This reliance grew as trade recovered in the wake of the global pandemic (Chart 5). Now global trade is slowing down cyclically, while US-China power struggle will weigh on the structural globalization process, penalizing the most trade-dependent ASEAN states relative to their less trade-dependent neighbors. So far US-China economic divorce is redistributing US-China trade in a way that is positive for Southeast Asia. China is rerouting exports through Vietnam, for example, while the US is shifting supply chains to other Asian states (Chart 6). The US will accelerate down this path because it cannot afford substantively to reengage with China’s economy for fear of strengthening the Russo-Chinese bloc. Chart 5Trade Rebounded But Hypo-Globalization Will Force Domestic Reliance
Trade Rebounded But Hypo-Globalization Will Force Domestic Reliance
Trade Rebounded But Hypo-Globalization Will Force Domestic Reliance
Chart 6ASEAN’s Exports To US Surge Ahead Of China’s
ASEAN's Exports To US Surge Ahead Of China's
ASEAN's Exports To US Surge Ahead Of China's
Hence the US will become more reliant on Southeast Asian exporters. Whatever the US stops buying from China will have to be sourced from other countries, so countries that export a similar basket of goods will benefit from the switch. Comparing the types of goods that China and ASEAN export to the US, Thailand is the closest substitute for China, whereas Malaysia is the farthest (Chart 7). That is not to say that Malaysia will suffer from US-China divorce. It is already ahead of China in exporting high-tech goods to the US, which is the very reason its export profile is so different. In 2020, 58% of Malaysia’s exports to the US are high-tech versus 35% for China’s. At the same time, Southeast Asian exports to China may not grow as fast as expected – cyclically China’s economy may accelerate on the back of current stimulus efforts, but structurally China is pursuing self-sufficiency and import substitution via a range of industrial policies (“Made in China 2025,” “dual circulation,” etc). These policies aim to make Chinese industrials competitive with European, US, Japanese, and Korean industrials. But they will also make China more competitive with medium-tech and fledging high-tech exports from Southeast Asia. Thus while China will keep importing low value products and commodities, such as unrefined ores, from Southeast Asia, imports of high-tech products will be limited due to China’s preference for indigenous producers. US export controls will also interfere with ASEAN’s ability to export high-tech goods to China. (In order to retain their US trade, in the face of Chinese import substitution, ASEAN states will have to comply with US export controls at least partially.) Even the low-to-medium tech goods that China currently imports from Southeast Asia may not grow as fast in the coming years as they have in the past. The ten provinces in China with the lowest GDP per capita exported a total of $129 billion to the world in 2020, whereas China’s imports from the top five ASEAN states amounted to $154 billion USD in 2020 (Chart 8). If Beijing insists on creating a domestic market for its poor provinces’ exports, then Southeast Asian exports to China will suffer. China might do this not only for strategic sufficiency but also to avoid US and western sanctions, which could be imposed for labor, environmental, human rights, or strategic reasons. Chart 7The US Sees Thailand And Vietnam As Substitutes For China
Southeast Asia: Favor The Philippines
Southeast Asia: Favor The Philippines
Chart 8China Threatens ASEAN With Import Substitution
Southeast Asia: Favor The Philippines
Southeast Asia: Favor The Philippines
Chart 9Trade Rebound Increased Exposure To US, China
Trade Rebound Increased Exposure To US, China
Trade Rebound Increased Exposure To US, China
China, unlike the US during the 1990s and 2000s, cannot afford to open up its doors and become a ravenous consumer and importer of all Asia’s goods. This would be a way to buy influence in the region, as the US has done in Latin America. But China still has significant domestic development left to do. This development must be done for the sake of jobs and income – otherwise the Communist Party will face sociopolitical upheaval. Malaysia, Vietnam, and Thailand are the most vulnerable to China’s dual circulation strategy because of their sizeable exports to China, which stand at 12%, 15% and 7.6% of GDP respectively (Chart 9). Even though the Southeast Asian states have formed into a common market, and have joined major new trade blocs such as the CPTPP and RCEP, they will not see unfettered liberalization within these agreements – and they will not be drawn exclusively into China’s orbit. Instead they will face a China that wishes to expand export market share while substituting away from imports. The US and India, which are not part of these new trade blocs, will still increase their trade with ASEAN, as they will seek to substitute ASEAN for China, and ASEAN will be forced to substitute them for China. Thus globalization will weaken into regionalization and will not provide as positive of a force for Southeast Asia as it did over the 1980s-2000s. Going forward, the new paradigm of Hypo-Globalization will weigh on trade-dependent countries like Malaysia, Vietnam, and Thailand relative to their neighbors. Within this cohort, Malaysia and the Philippines will benefit from selling high-tech goods to the US, while Thailand and Vietnam will benefit from selling low- and mid-tech goods. China will remain a huge and critical market for ASEAN states but its autarkic policies will drive them to pursue other markets. Those with large and growing domestic markets, like Indonesia and the Philippines, will weather hypo-globalization better than their neighbors. Vietnam, Malaysia, and Thailand are all extremely dependent on foreign trade and hence vulnerable if international trade linkages weaken. Bottom Line: Global trade is likely to slow on a cyclical basis. Structurally, Hypo-Globalization is the new paradigm and will remove a tailwind that super-charged Southeast Asian development over the past several decades. Indonesia and the Philippines stand to suffer least and benefit most. Potential Growth Dividend Favors The Philippines And Vietnam Countries that can generate endogenous growth will perform the best under hypo-globalization. Indonesia, the Philippines, and Vietnam have the largest populations within ASEAN. But we must also take into account population growth, which contributes directly to potential GDP growth. A domestic market grows through population growth and/or income growth. For example, China benefitted from its growing population but now must switch to income generation as its population growth is stagnating. In Southeast Asia, the Philippines, Malaysia, and Indonesia have the highest population growth, while Thailand has the lowest. Thai population growth is even weak compared to China. The total fertility rate reinforces this trend – it is highest in Philippines but lowest in Thailand (Chart 10). A population that is too young or too old needs significant support that diverts resources away from the most productive age group. Philippines and Indonesia have the lowest median age, while Thailand has the highest. The youth of Indonesia and Philippines will come of age in the next decade, augmenting labor force and potential GDP growth. By contrast, Vietnam and especially Thailand, like China, will be weighed down by a shrinking labor force in the coming decade (Chart 11). Chart 10Fertility Rates Robust In ASEAN
Southeast Asia: Favor The Philippines
Southeast Asia: Favor The Philippines
Chart 11Falling Support Ratio Weighs On Thailand, Vietnam
Southeast Asia: Favor The Philippines
Southeast Asia: Favor The Philippines
Hence Indonesia and Philippines will prosper while Thailand, and to some extent Vietnam, lack the ability to diversify away from trade through domestic market growth. Malaysia sits in the middle: it is trade dependent and has the smallest population, but it has a young and growing population, and its labor force is still growing. Yet falling population growth is not a disaster if productivity and income growth are high. Productivity trends often contrast with population trends: Indonesia had the weakest productivity growth despite having a large, young, and growing population, while Vietnam had the strongest growth, despite a population slowdown. In fact Vietnam has the strongest productivity growth in Southeast Asia, at a 5-year, pre-pandemic average of 6.3%, followed by the Philippines (Chart 12A). By comparison China’s productivity growth averaged between 3%-6.6%, depending on the data source. Chart 12AProductivity And Potential GDP
Productivity And Potential GDP
Productivity And Potential GDP
Chart 12BProductivity And Potential GDP
Productivity And Potential GDP
Productivity And Potential GDP
Chart 13Capital Formation Favors Philippines
Capital Formation Favors Philippines
Capital Formation Favors Philippines
Productivity growth adds to labor force growth to form potential GDP. In 2019, Philippines had the highest potential GDP growth at 6.9%, followed by the Vietnam at 6.8%, Indonesia at 5.6%, Malaysia at 3.9% and Thailand at 2.3%. In comparison China’s potential GDP growth was 3.6%-5.9%, again depending on data. Thailand is undoubtedly the weakest from both a population and productivity standpoint, while the Philippines has strength in both (Chart 12B). Countries invest in their economies to increase productivity. In 2019, Vietnam recorded the highest growth in grossed fixed capital formation at around 10.6%, followed by Indonesia at 6.9%, Philippines at 6.3%, and Thailand at 2.2%. Gross fixed capital formation has rebounded from the contractions countries suffered during the pandemic lockdowns in 2020 (Chart 13). Bottom Line: The Philippines has strong potential GDP growth, but Indonesia is not far behind as it invests in its economy. Vietnam has the highest investment and productivity growth, but its demographic dividend is waning. Malaysia is slightly better than Thailand because it has a growing population, but it has stopped investing and it is as trade dependent as Thailand. Thailand is weak on all accounts: it is trade dependent, has a shrinking population, and has a low potential GDP growth. Investment Takeaways Bringing it all together, ASEAN is witnessing the erosion of key dividends (peace, globalization, and demographics). Yet it offers attractive investment opportunities on a relative basis, given the permanent step up in geopolitical risk premiums for other major emerging markets like Russia, eastern Europe, China, and (soon) the Gulf Arab states (Charts 14A & 14B). Indeed the long under-performance of ASEAN stocks as a bloc, relative to global stocks, has recently reversed. As investors recognize China’s historic confluence of internal and external risks, they increasingly turn to ASEAN despite its flaws. Chart 14AASEAN Will Continue To Outperform China
ASEAN Will Continue To Outperform China
ASEAN Will Continue To Outperform China
The US and China will use rewards and punishments to try to win over ASEAN states as strategic and economic partners. Those that have a US security guarantee, or are most distant from potential conflict, will see a lower geopolitical risk premium. Chart 14BASEAN Will Continue To Outperform China
ASEAN Will Continue To Outperform China
ASEAN Will Continue To Outperform China
Chart 15Favor The Philippines
Favor The Philippines
Favor The Philippines
The Philippines is the most attractive Southeast Asian market based on our criteria: it has an American security guarantee, domestic-oriented growth, and high productivity. Populism in the Philippines has come with productivity improvements and yet has not overthrown the US alliance. Philippine equities can outperform their emerging market peers (Chart 15). Indonesia is the second most attractive – it does not have direct territorial disputes with China, maintains defense ties with the West, is not excessively trade reliant, and keeps up decent productivity growth. It is vulnerable to nationalism and populism but its democracy is effective overall and the regime has maintained general political stability after near-dissolution in 1998. Thailand is geopolitically secure but lacking in potential growth. Vietnam has high potential growth but is geopolitically insecure over the long run. Investors should only pursue tactical investments in these markets. We maintain our long-term favorable view of Malaysia, although it is trade dependent and productivity has weakened. In future reports we will examine ASEAN markets in greater depth and with closer consideration of their domestic political risks. Jesse Anak Kuri Associate Editor Jesse.Kuri@bcaresearch.com Matt Gertken Chief Geopolitical Strategist mattg@bcaresearch.com Strategic Themes Open Tactical Positions (0-6 Months) Open Cyclical Recommendations (6-18 Months) Regional Geopolitical Risk Matrix
Executive Summary China’s Property Market: Signs Of Improvement?
China’s Property Market: Moderate Recovery Ahead
China’s Property Market: Moderate Recovery Ahead
The slump in China’s property market is nearing its cyclical end. The accelerated policy easing in the housing sector should lift the sector out of deep contraction and put it on its recovery path in the second half of this year. Policy easing had supported a quick and strong recovery in Chinese property demand during 2H2020, following the first COVID wave to hit China. This time, however, with the “three red lines” policy still in place and depressed household income growth, we expect only a moderate year-on-year growth (4-6%) in property sales during 2H2022. Chinese construction activity will also revive slightly, based on a mild recovery in project completions in 2H2022. Chinese property developers’ stocks could still have some downside in absolute terms before the pandemic situation in China stabilizes. Bottom Line: Chinese real estate market is still facing downside risks in the near term. However, accelerated policy easing from both the central government and local governments may result in a moderate recovery in Chinese property market in 2H2022. Feature Chart 1China Property Sector Woes
China’s Property Market: Moderate Recovery Ahead
China’s Property Market: Moderate Recovery Ahead
China’s aggressive housing-sector deleveraging campaign since late 2020 has triggered turmoil in the country’s property market, while this year’s COVID-induced lockdowns have exacerbated the slump. Property sales, starts, completions as well as home prices are all in deep contraction (Chart 1). Is a demand recovery on the way and how strong will it be? Compared with the 2020 episode, we believe that this time it will take longer to restore homebuyer confidence and the strength of the recovery will be considerably weaker. In 2H2020, to stimulate a pandemic-hit domestic property market, the Chinese authorities announced a set of supportive policies to encourage housing demand as well as to help domestic home developers overcome their extreme funding shortages. This led to an 11% year-on-year (YOY) growth in property sales during 2H2020. Although this year housing-sector policies have loosened more than they did in 1H2020, demand for housing has been sluggish and real estate developers’ propensity to take on more leverage and to invest has fallen to a multi-year low. The “three red lines” policy applied to property developers as well as the lending constraints imposed on banks remain in place. Furthermore, China’s zero-COVID policy will likely lead to rolling lockdowns and frequent disruptions to the economy, depressing household income growth, which has fallen over the past two years. Hence, assuming that the COVID-induced full lockdowns in China’s large cities are lifted before the end of May (COVID cases in China have gradually come down in the past couple of weeks), we expect only a moderate pickup in home sales in the second half of this year – about 4-6% YOY growth –about half of that in 2H2020. In terms of China’s housing-related construction activity, we believe it will only recover slightly in 2H2022, in line with our projection of a modest rebound in home completion. Chart 2China’s Housing Demand: Structural Headwinds
China’s Property Market: Moderate Recovery Ahead
China’s Property Market: Moderate Recovery Ahead
As we discussed in previous reports, China’s housing demand is facing major structural headwinds, as demand for properties in China has already entered a saturation phase and the country’s working-age population (15-64 years of age) is shrinking (Chart 2). Despite short-term measures to stabilize the property market, China’s top leadership will likely stick to their overarching “housing is for living not for speculation” policy mantra and continue to make efforts to reduce the housing sector’s share in the economy. As such, our longer-term view on the Chinese property market remains negative. A Mild Recovery In Home Sales Chart 3The Recovery of Chinese Property Market Relies On Home Sales
China’s Property Market: Moderate Recovery Ahead
China’s Property Market: Moderate Recovery Ahead
Home sales, which contributed to at least 50% of Chinese property developers’ funding, hold the key to the recovery of the Chinese property market (Chart 3). The core of the ongoing crisis in China’s housing market is Chinese property developers’ increasingly constrained financing due to rapidly falling home sales as well as stringent deleveraging policies. We expect a 4-6% annual growth in Chinese property sales (i.e. floor space sold in square meters) in the second half of this year. While this is a significant improvement from the 15% contraction in the past two quarters, the projected rebound will be much more muted than the 11% growth in 2H2020 and the 23% rebound in the 2016 housing-market recovery. In 2020, Chinese property sales tanked 40% YOY during January-February. After a flurry of supportive policiestook effect in March-April, the growth in home sales on a YOY basis turned positive in May 2020 and jumped to 11%YOY for the period of July-December 2020. Chart 4Slowing Household Disposable Income
China’s Property Market: Moderate Recovery Ahead
China’s Property Market: Moderate Recovery Ahead
While we think an acceleration in housing-market stimulus1 may be able to spur some rebound in demand for housing in the second half of this year, notably, economic fundamentals and household sentiment have both turned much less favorable this year than in 2020. COVID-related restrictions have exacerbated matters and have weighed heavily on the demand for housing. The growth rate of national disposable income per capita slowed by more than two percentage points (in nominal terms) in Q1 this year from the pre-pandemic era (Chart 4). Moreover, the PBoC’s quarterly urban depositor survey in Q1 showed subdued confidence in future household income (Chart 5). Household willingness to save also hit a record high and this sentiment is even more elevated than it was in early 2020; on the other hand, the propensity to invest has dropped to a multi-year low (Chart 6). Chart 5Subdued Confidence In Future Household ##br##Income
China’s Property Market: Moderate Recovery Ahead
China’s Property Market: Moderate Recovery Ahead
Chart 6More Chinese Households Intend To Save Rather Than Invest
China’s Property Market: Moderate Recovery Ahead
China’s Property Market: Moderate Recovery Ahead
There are some early signs that demand for housing, including pent-up demand that has been curbed by the ongoing COVID-induced full and partial lockdowns in China’s major cities, may see some modest rebound in 2H2022: Chart 7Banks Can Moderately Loosen Up Their Lending To The Property Sector
China’s Property Market: Moderate Recovery Ahead
China’s Property Market: Moderate Recovery Ahead
First, banks may be slowly increasing their lending to the real estate sector while complying with the real estate loan concentration management regulations (Chart 7). Second, household willingness to buy homes, although still significantly lower than a year ago, is improving somewhat. According to the Survey And Research Center For China Household Finance, the proportion of households planning to buy a house has been increasing, albeit moderately for two consecutive quarters (Chart 8). Third, we expect local governments to roll out more aggressive measures to stimulate housing demand. Land sales account for the lion’s share of the local government’s revenue but the developers’ land purchase has contracted (Chart 9). Against this backdrop, local governments will likely accelerate the implementation of supportive policies. Chart 8More Households Plan To Buy A House
China’s Property Market: Moderate Recovery Ahead
China’s Property Market: Moderate Recovery Ahead
Chart 9Local Governments Will Likely Push For More Supportive Policies To Boost Land Sales
China’s Property Market: Moderate Recovery Ahead
China’s Property Market: Moderate Recovery Ahead
Bottom Line: Property sales are likely to grow by 4-6%YOY during 2H2022. Will Developers’ Funding Conditions Improve? Real estate developers’ funding conditions are likely to improve modestly in the rest of 2022 , mainly due to improved property sales, from what was an extremely dire situation in 2H21 (Chart 3 on page 4). Property development is an asset-heavy and capital-intensive business, and the government-led deleveraging mandate and depressed home sales have massively curtailed cash flows to homebuilders. Chart 10Chinese Real Estate Investment: A Breakdown Of Funding Source
China’s Property Market: Moderate Recovery Ahead
China’s Property Market: Moderate Recovery Ahead
Chinese homebuilders generally have several ways to finance themselves. Chart 10 shows a breakdown of the source of Chinese real estate investment funding, with 12% of the total funding from domestic and foreign loans, 33% from a self-raised fund through bond and equity issuances, or retained earnings, 37% from deposits and advanced payments (e.g., down payments), and 16% from homebuyers’ mortgages in 2021. Other than some modest rebound in home sales, property developers’ alternative cash flows – which account for the other 50% of their funding – will remain under constraint for the following reasons: Regulations on leveraging among property developers have not loosened much. The “three red line" policy, implemented in July 2020, has limited Chinese property developers’ borrowing capacity and has so far remained firmly in place. Under this policy, homebuilders who breach none of the three red lines can only increase their interest-bearing borrowing by 15% at most, while failing to meet all three “red lines” may result in them being cut off from access to new loans from banks. The lending ceilings imposed on banks − the real estate loan concentration management system– which came into effect on 1 January 2021, also remain in place. Due to these stringent rules, Chart 11 shows the year-on-year growth of loans to real estate developers had dropped to zero in Q3 2021 from the 25% growth in Q3 2018. As these rules are critical to containing the high leverage of the Chinese property market from evolving into a systemic risk, the Chinese authorities are unlikely to radically change them (Chart 12). Chart 11More Loans To Property Developers, Albeit Capped By A Lending Ceiling
China’s Property Market: Moderate Recovery Ahead
China’s Property Market: Moderate Recovery Ahead
Chart 12Chinese Homebuilders’ Leverage Is Still High
China’s Property Market: Moderate Recovery Ahead
China’s Property Market: Moderate Recovery Ahead
Chart 13The Increase In Self-raising Funds Will Be Limited This Yea
China’s Property Market: Moderate Recovery Ahead
China’s Property Market: Moderate Recovery Ahead
Self-raised funds through bond and equity issuance also account for a large share of the Chinese real estate investment funding source. The recent riot in China’s stock market and the crisis in the offshore corporate bond market made such methods of raising fund less favorable. Indeed, self-raised funds have been in contraction since last September when the Evergrande default shocked investors (Chart 13). We do not see a sizeable increase in self-raised funds this year. Bottom Line: Developers’ funding conditions are likely to improve only moderately in 2H2022 as property sales see a mild rebound. The other sources of funding will continue to be constrained by the deleveraging policy. What About Housing-Related Construction Activity? China’s housing-related construction activity will revive slightly in 2H2022. Property developers may accelerate completion of their existing projects, while the deep contraction in housing starts will likely narrow in 2H22. Chart 14Homebuilders Need To Deliver Their Unfinished Projects
China’s Property Market: Moderate Recovery Ahead
China’s Property Market: Moderate Recovery Ahead
In recent years, Chinese real estate developers have raised funds by selling more newly started buildings instead of completed properties. This resulted in a divergence between property sales and completions, suggesting that there is a considerable inventory of pre-sold but unfinished projects (Chart 14). With more funding available, mainly from property sales, and to a lesser extent from bank lending, property developers will likely speed up the construction of those pre-sold but unfinished buildings. We expect property completions to grow 2-4% YOY in 2H2022, based on the following observations: The authorities repeatedly emphasized that property developers should meet their obligations by finishing and delivering their pre-sold but unfinished properties on time. They also have fine-tuned policies to support building completions by developers. New policies announced in February 2022 stated that property developers must prioritize those properties from which they have received pre-sale funds such as down payments. Meanwhile, odds are that the growth rate of property starts will stop falling in 2H2022. However, it will remain in contraction. Once property developers have some financing from property sales, they will tend to purchase land and start construction of new properties in order to generate revenue from presold properties. However, with deleveraging polices still in place, homebuilders can only increase their property starts to some extent. Some early signs of bottoming in land sales may be emerging (Chart 15). The uptick in land sales, although very small, may suggest that the deep contraction in the indicator has come to an end. Since late last year, state-owned property developers have been the main land buyers as private property developers were in a severe shortage of financing. This year, improving home sales and increasing bank lending may allow these private developers to return to the land acquisition market. Land sale transactions are highly correlated with housing starts (Chart 16). The improvement in land sales, if sustained into the coming months, suggests housing starts will improve somewhat in 2H2022. Chart 15Land Sales May Be Bottoming
China’s Property Market: Moderate Recovery Ahead
China’s Property Market: Moderate Recovery Ahead
Chart 16Land Sales Are Highly Correlated With Housing Starts
China’s Property Market: Moderate Recovery Ahead
China’s Property Market: Moderate Recovery Ahead
Chart 17Housing-related Construction Activity Will Likely Revive Moderately In 2H2022
China’s Property Market: Moderate Recovery Ahead
China’s Property Market: Moderate Recovery Ahead
Bottom Line: Housing-related construction activity will likely revive moderately on a mild recovery in project completions (Chart 17). Investment Implications Given the negative forces from rolling lockdowns and low homebuyer confidence in the property market, property developers’ stocks (both investable and A-share) could have more downside in the near term (Chart 18). In relative terms, property developers’ stocks (both investable and A-share) have outperformed their respective benchmarks (Chart 19). We are doubtful that this outperformance in property developers’ stocks will develop into a cyclical or structural bull markert since our overall outlook for the real estate sector remains downbeat beyond next 6-9 months. Chart 18Chinese Property Developers’ Stocks: No Bottom Yet Both In Absolute Terms…
China’s Property Market: Moderate Recovery Ahead
China’s Property Market: Moderate Recovery Ahead
Chart 19…And Relative To Benchmarks
China’s Property Market: Moderate Recovery Ahead
China’s Property Market: Moderate Recovery Ahead
Chart 20Neutral On Prices Of Construction-related Commodities For Now
China’s Property Market: Moderate Recovery Ahead
China’s Property Market: Moderate Recovery Ahead
Commodity prices have already been rising significantly across the board. Even though we expect a slight pickup in China’s real estate construction activity in the remainder of this year, the improvement will be only marginally positive for the country’s demand for construction-related commodities. As such, our view on the price of construction-related commodities (steel, cement, and glass) in the rest of 2022 remains neutral (Chart 20). Ellen JingYuan He Associate Vice President ellenj@bcaresearch.com Footnotes 1 By April 29, nearly 100 cities had rolled out favorable policies such as lowering down payment ratio, relaxing curbs on home purchases or offering subsidies or even giving out cash to homebuyers. In addition, banks in more than 100 cities have cut mortgage rates ranging between 20 basis points and 60 basis points. Strategic Themes Cyclical Recommendations
Listen to a short summary of this report. Executive Summary Global Equities Are More Attractively Valued After The Recent Sell-Off
Global Equities Are More Attractively Valued After The Recent Sell-Off
Global Equities Are More Attractively Valued After The Recent Sell-Off
We tactically downgraded global equities in late February but see the current level of stock prices as offering enough upside to warrant an overweight. Global equities are now trading at 15.6-times forward earnings, and only 12.6-times outside the US. More importantly, the forces that pushed down stock prices are starting to abate: The war in Ukraine no longer seems likely to devolve into a broader conflict; the number of new Covid cases in China has fallen by half; and global inflation has peaked. The next 18 months of falling inflation and receding recession fears could see stocks recover much of their losses. The “Last Hurrah” for equities is coming. We continue to think that over a 5-year horizon, bond yields will rise from current levels, value stocks will outperform growth stocks, and crypto prices will fall. However, countertrend rallies are likely. To express this view, we recommend taking partial profits on our short 10-year Treasury trade recommendation (up 9.3% from an initial entry yield of 1.45% on June 30, 2021). We are also halving our long global value/growth position (up 20.1% since inception on December 10, 2020) and our short Bitcoin position (up 98% based on our exponential shorting technique). Bottom Line: Global equities are heading towards a “last Hurrah” starting in the second half of this year. Tactically upgrade stocks to overweight. Feature Dear Client, We published a Special Alert early this afternoon tactically upgrading global equities to overweight. As promised, the enclosed report elaborates on our view change. Best regards, Peter Berezin Restore Tactical Overweight On Global Equities Chart 1Global Equities Are More Attractively Valued After The Recent Sell-Off
Global Equities Are More Attractively Valued After The Recent Sell-Off
Global Equities Are More Attractively Valued After The Recent Sell-Off
We tactically downgraded global equities from overweight to neutral on February 28th. The war in Ukraine, the Covid outbreak in China, and most importantly, the rise in bond yields have kept us on the sidelines ever since. At this point, however, the outlook for stocks has brightened, and thus we are restoring our tactical (3-month) overweight to stocks so that it is consistent with our bullish 12-month cyclical view. First, valuations have discounted much of the bad news. After the recent sell-off, global equities are trading at 15.6-times forward earnings (Chart 1). Outside the US, they trade at only 12.6-times forward earnings. Second, the forces that pushed down stock prices are starting to abate. The war in Ukraine is approaching a stalemate, with Russian troops unable to take much of the country, let alone seriously threaten regional neighbours. A European embargo on Russian oil is likely but will be watered down significantly before it is implemented. European officials have shied away from banning Russian natural gas, an action that would have much more severe economic implications. While still very high in absolute terms, December-2022 European natural gas futures are down 36% from their peak on March 7 (Chart 2). The 7-day average of new Covid cases in China has fallen by more than half since late April (Chart 3). Considering that a significant fraction of China’s elderly population is unvaccinated, the authorities will continue to play whack-a-mole with the virus for the next few months (Chart 4). Fortunately, Chinese domestic production of Pfizer’s Paxlovid anti-Covid drug is starting to ramp up, which should allow for some easing in lockdown measures later this year. Chart 2European Natural Gas Futures Have Come Off The Boil
European Natural Gas Futures Have Come Off The Boil
European Natural Gas Futures Have Come Off The Boil
Chart 3Covid Cases Are Falling In China…
It’s Time To Buy: Tactically Upgrading Global Equities To Overweight
It’s Time To Buy: Tactically Upgrading Global Equities To Overweight
The 20th Chinese National Party Congress is slated for this fall. In the lead-up to the Congress, it is likely that the government will move to diffuse social tensions over its handling of the pandemic by showering the economy with stimulus funds. Of note, the credit impulse has already turned higher, which bodes well for both Chinese growth and growth abroad (Chart 5). Chart 4… But Low Vaccination Rates Among The Elderly Remain A Risk
It’s Time To Buy: Tactically Upgrading Global Equities To Overweight
It’s Time To Buy: Tactically Upgrading Global Equities To Overweight
Chart 5A Rebound In China's Credit Impulse Bodes Well For China And The Rest Of The World
A Rebound In China's Credit Impulse Bodes Well For China And The Rest Of The World
A Rebound In China's Credit Impulse Bodes Well For China And The Rest Of The World
Inflation Is Peaking On the inflation front, the data flow has gone from unambiguously bad to neutral (and perhaps even slightly positive). In the US, core goods inflation fell by 0.4% month-over-month in April, the first outright decline in core goods prices since February 2021. The Manheim Used Vehicle Value Index has crested and is now 6.4% below its January peak (Chart 6). Global shipping rates have moved up a bit recently on the back of Chinese port shutdowns but remain well below their highs earlier this year (Chart 7). Chart 6Used Car Prices Appear To Have Peaked
Used Car Prices Appear To Have Peaked
Used Car Prices Appear To Have Peaked
Chart 7Global Shipping Rates Are Well Off Their Highs
Global Shipping Rates Are Well Off Their Highs
Global Shipping Rates Are Well Off Their Highs
It Is The Composition Of Spending That Is Distorted Despite the often-heard claim that US consumer spending is well above trend, the reality is that spending is more or less in line with its pre-pandemic trend (Chart 8). It is the composition of spending that is out of line: Goods spending is well above trend while services spending is well below. One might think that only the overall level of spending should matter for inflation, and that the composition of spending is irrelevant. However, this ignores the reality that services prices are generally stickier than goods prices. Companies that sold fitness equipment during the pandemic had no qualms about raising prices. In contrast, gyms barely cut prices, figuring that lower membership fees would do little to drive new business through the door (Chart 9). Chart 8Total US Consumer Spending Is Almost Exactly At Its Pre-Pandemic Trend, But The Composition Of Spending Remains Skewed
Total US Consumer Spending Is Almost Exactly At Its Pre-Pandemic Trend, But The Composition Of Spending Remains Skewed
Total US Consumer Spending Is Almost Exactly At Its Pre-Pandemic Trend, But The Composition Of Spending Remains Skewed
Chart 9Asymmetries Matter: Firms Manufacturing Sports Equipment Jacked Up Prices, But Gyms Barely Cut Prices
Asymmetries Matter: Firms Manufacturing Sports Equipment Jacked Up Prices, But Gyms Barely Cut Prices
Asymmetries Matter: Firms Manufacturing Sports Equipment Jacked Up Prices, But Gyms Barely Cut Prices
This asymmetry matters, and it suggests that goods inflation should continue to fall over the coming months as the composition of spending shifts back to services. A Lull In Wage Growth Wages are the most important determinant of services inflation. While it is too early to be certain, the latest data suggest that wage growth has peaked. The 3-month annualized growth rate in average hourly earnings for production and nonsupervisory workers slowed from 7.2% in the second half of 2021 to 3.8% in April (Chart 10). Assuming productivity growth of around 1.5%, this is consistent with inflation of only slightly more than 2%. Nominal wage growth is a function of both labor market slack and expected inflation. Slack should increase modestly during the rest of the year as labor participation recovers. Chart 11 shows that the labor force participation rate is still about 0.9 percentage points below where one would expect it to be, even adjusting for an aging population and increased early retirements. Chart 10Wage Growth Seems To Be Topping Out
Wage Growth Seems To Be Topping Out
Wage Growth Seems To Be Topping Out
Chart 11Labor Participation Has Further Scope To Recover
Labor Participation Has Further Scope To Recover
Labor Participation Has Further Scope To Recover
Employment has been particularly depressed among lower-wage workers (Chart 12). This should change as more low-wage workers exhaust their savings and are forced to seek employment. According to the Fed, the lowest-paid 20% of workers are the only group to have seen their bank deposits dwindle since mid-2021 (Chart 13). Chart 12More Low-Wage Employees Will Return To Work
More Low-Wage Employees Will Return To Work
More Low-Wage Employees Will Return To Work
Chart 13The Savings Of Low-Wage Workers Are Dwindling
The Savings Of Low-Wage Workers Are Dwindling
The Savings Of Low-Wage Workers Are Dwindling
Inflation expectations should come down as goods inflation recedes and oil prices come off their highs (Chart 14). Bob Ryan, BCA’s Chief Commodity Strategist, sees the price of Brent averaging $86/bbl in the second half of this year, down 16% from current levels. Central Banks Will Dial Back The Hawkishness With inflation set to fall over the remainder of the year, and financial markets showing increasing signs of stress, the Fed and other central banks will adopt a softer tone. It is worth noting that the median terminal dot for the Fed funds rate actually declined from 2.5% to 2.4% in the March Summary of Economic Projections (Chart 15). Given that markets expect US interest rates to rise to 3.25% in 2023, the Fed may not want investors to further rachet up rate expectations. Chart 14US Inflation Expectations Should Recede If Oil Prices Drop
US Inflation Expectations Should Recede If Oil Prices Drop
US Inflation Expectations Should Recede If Oil Prices Drop
Chart 15Rate Expectations Have Moved Well Above The Fed's Estimate of Neutral
Rate Expectations Have Moved Well Above The Fed's Estimate of Neutral
Rate Expectations Have Moved Well Above The Fed's Estimate of Neutral
The Bank of England has already veered in a more dovish direction. Its latest forecast, released on May 5, showed real GDP contracting slightly in 2023. Based on market interest rate expectations, the BoE sees headline inflation falling to 1.5% by end-2024, below its target of 2%. Even assuming that interest rates remain at 1%, the BoE believes that inflation will only be slightly above 2% at the end of 2024, implying little need for incremental policy tightening. Not surprisingly, the pound has sold off. We have been tactically short GBP/USD but are using this opportunity to turn tactically neutral. Given favorable valuations, we like the pound over the long run. Chart 16Spending In The Euro Area Is Well Below Its Pre-Pandemic Trend
Spending In The Euro Area Is Well Below Its Pre-Pandemic Trend
Spending In The Euro Area Is Well Below Its Pre-Pandemic Trend
The euro area provides a good example of the dangers of focusing too much on short-term inflation dynamics. Supply-side disruptions stemming from the pandemic and the war in Ukraine have weighed on European growth this year. Yet, those very same factors have also pushed up inflation. Harmonized inflation across the euro area reached 7.5% in April, the highest since the launch of the common currency. The ECB is eager to put some distance between policy rates and the zero bound. However, there is little need for significant tightening. Unlike in the US, spending in the euro area is well below its pre-pandemic trend (Chart 16). If anything, more inflation would be welcome since that would give the ECB scope to bring real rates further into negative territory if economic conditions warrant it. To its credit, the Bank of Japan has stuck with its yield curve control system, even as bond yields have risen elsewhere in the world. Japan’s currency has weakened but given that inflation expectations are too low, and virtually all of its debt is denominated in yen, that is hardly a bad thing. Too Late? Has the surge in bond yields already done enough damage to the global economy to make a recession inevitable? We do not think so. As noted above, much of the recent harm has been caused by various dislocations, namely the war in Ukraine and the ongoing effects of the pandemic. As these dislocations dissipate, inflation will fall and global growth will recover. Despite the hoopla over how the US economy contracted in the first quarter, real private final sales to domestic purchasers (a measure of GDP growth that strips out the effects of changes in government spending, inventories, and net exports) rose by 3.7% at an annualized rate. As Table 1 shows, this measure of economic activity has the highest predictive power for GDP growth one-quarter ahead. Table 1A Good Sign: Real Final Sales To Private Domestic Purchasers Rose By 3.7% In Q1
It’s Time To Buy: Tactically Upgrading Global Equities To Overweight
It’s Time To Buy: Tactically Upgrading Global Equities To Overweight
Meanwhile, and completely overlooked at this point, S&P 500 earnings have come in 7.3% above expectations so far in Q1, with nearly 80% of S&P 500 companies surprising on the upside. Earnings are up 10.4% year-over-year in Q1. Sales are up 13.6%. Looking out to Q4 of 2022, S&P companies are expected to earn $60.93 in EPS, up 4.3% from what analysts expected at the start of the year. It is also worth noting that homebuilder stocks have basically been flat over the past 30 days, even as the S&P 500 has dropped by nearly 10% over this period. Housing is the most interest rate-sensitive sector of the economy. With the homeowner vacancy rate at record low levels, even today’s mortgage rates may not be enough to push the economy into recession (Chart 17). Economic vulnerabilities are greater outside the US. Nevertheless, there is enough pent-up demand on both the consumer and capital spending side to sustain growth. The Last Hurrah How long will the “Goldilocks” period of falling inflation and supply-side driven growth last? Our guess is about 18 months, starting this summer and lasting until the end of 2023. Unfortunately, as is often the case, the benign environment that will emerge in the second half of this year will sow the seeds of its own demise. Real wages are currently falling across the major economies (Chart 18). That has dampened consumer confidence and spending. However, as inflation comes down, real wage growth will turn positive. This will stoke demand, leading to a reacceleration in inflation, most likely in late 2023 or early 2024. Chart 17Tight Supply Makes Housing More Resilient
Tight Supply Makes Housing More Resilient
Tight Supply Makes Housing More Resilient
Chart 18Real Wages Are Falling In Most Countries
Real Wages Are Falling In Most Countries
Real Wages Are Falling In Most Countries
In the end, central banks will discover that the neutral rate of interest is higher than they thought. That is good news for stocks in the short-to-medium run because it means that forthcoming rate hikes will not induce a recession. Down the road, however, a higher neutral rate means that investors will eventually need to value stocks using a higher discount rate. It also means that the disinflation we envision over the next 18 months will not last. All this puts us in the rather lonely “transitory transitory” camp: We think much of today’s high inflation will prove to be transitory, but the transitory nature of that inflation will itself be transitory. Be that as it may, the next 18 months of falling inflation and receding recession fears could see stocks recover much of their losses. For most investors, that is too long a period to sit on the sidelines. The “Last Hurrah” for equities is coming. Taking Partial Profits On Our Short Treasury, Long Value/Growth, And Short Bitcoin Trades We continue to think that over a 5-year horizon, bond yields will rise from current levels, value stocks will outperform growth stocks, and crypto prices will fall. However, with the “Last Hurrah” approaching, countertrend rallies are likely. To express this view, we recommend taking half profits on our short 10-year Treasury trade recommendation (up 9.3% from an initial entry yield of 1.45% on June 30, 2021). We are also halving our long global value/growth position (up 20.1% since inception on December 10, 2020), and our short Bitcoin position (up 98% based on our exponential shorting technique). Peter Berezin Chief Global Strategist peterb@bcaresearch.com Global Investment Strategy View Matrix
It’s Time To Buy: Tactically Upgrading Global Equities To Overweight
It’s Time To Buy: Tactically Upgrading Global Equities To Overweight
Special Trade Recommendations Current MacroQuant Model Scores
It’s Time To Buy: Tactically Upgrading Global Equities To Overweight
It’s Time To Buy: Tactically Upgrading Global Equities To Overweight
Executive Summary Ingredients For A Policy Mistake
Ingredients For A Policy Mistake
Ingredients For A Policy Mistake
The hawks on the European Central Bank Governing Council have become vocal about a July rate hike. Such a move would be a policy mistake because European growth is weak, while inflation is supply-driven and will soften meaningfully. July 2022 hike is not yet certain. A policy mistake suggests that the current interest rate pricing for June 23 is too aggressive. Buy June 2023 Euribor contract. The serious risk of a policy mistake and the uncertainty surrounding Europe’s energy security confirm that investors should maintain a defensive stance in European assets. The pronounced threats to UK growth warrant a negative view on the pound. Recommendation INCEPTION DATE RETURN SINCE INCEPTION (%) COMMENT Buy June 2023 Euribor contract 05/09/2022 Bottom Line: Stay defensive in Europe. The risk of a policy mistake is high. Only when inflation peaks should investors move into cyclical stocks. In recent weeks, a chorus of ECB hawks expressed the need to increase rates as early as July 2022. Inflation data is on their side; HICP stands at 7.5% and core CPI has reached 3.5%, levels never seen since the introduction of the euro. Markets are responding. The ESTR curve is pricing in a positive ECB deposit rate for the October 2022 Governing Council meeting. We need to examine the underlying European economic picture to address two key questions: Will the ECB lift rates as early as July? And will doing so constitute a policy mistake that would hurt European assets? Weaker Growth Let’s start with the growth outlook. European economic activity is rapidly deteriorating. Real GDP growth in the Eurozone has slowed markedly. In Q1, real GDP growth fell to 0.2% quarter-on-quarter or an annualized rate of 0.8%. Worrisomely, Italy’s GDP contracted by -0.2% over that time frame and the very economically sensitive Swedish activity contracted by -0.4%, which suggests that Europe’s deceleration is only starting. Soft data confirm the flagging economic outlook on the continent. Consumer confidence is plunging to levels that are consistent with a recession, led by the collapse in the willingness to make large purchases (Chart 1, top panel). The ZEW as well as the Ifo survey confirm that growth expectations point to a very large decline in output (Chart 1, bottom panel). The weakness is also evident in hard data. High inflation erodes real household income, which squeezes consumer spending. Retail sales across Europe are slowing sharply, only growing at an annual rate of 0.8% while contracting -0.4% on a monthly basis; on a level basis, they are lower today than they were in June 2021. Meanwhile, German retail sales volumes are falling at a -5.4% annual rate. The situation is even worse for new car registrations, which are collapsing at an annual rate of 20.2% (Chart 2). Chart 1Soft Data Point To Soft Growth...
Soft Data Point To Soft Growth...
Soft Data Point To Soft Growth...
Chart 2...So Do Hard Data
...So Do Hard Data
...So Do Hard Data
Industrial production has not been spared. Euro Area IP softened to 2% annually in February and contractions are now visible in Germany and France. Some of this weakness reflects supply difficulties, but the -3.1% annual fall in German factory orders indicates that demand is frail too and that industrial production will shrink further in the months ahead (Chart 2, bottom panel). The deterioration in the global outlook further hurts Europe economic prospects. Our global growth tax indicator, based on energy prices, the dollar, and global bond yields, points toward a further deceleration in the global and US manufacturing PMI, it suggests Euro Area PMIs could fall below 50 (Chart 3). China woes continue to reverberate throughout the global economy. Potential supply constraints will hurt industrial production, but, more importantly, the weakness in China’s marginal propensity to consume (as measured by the gap between the growth rate of M1 relative to M2) predicts a much greater deterioration in European industrial orders, which means that the demand for European capital goods will slow (Chart 3, bottom panel). Chart 3Risks To The Downside
Risks To The Downside
Risks To The Downside
Chart 4Tightening Financial Conditions
Tightening Financial Conditions
Tightening Financial Conditions
European financial conditions are also tightening significantly. The iTraxx Crossover Index is rising swiftly. European high-yield corporate spreads are now above 450bps, levels that coincide with past recessions in the Euro Area (Chart 4). Government bond markets are increasingly under duress too. Italian BTPs now yield close to 200bps above German Bunds (Chart 4, bottom panel), which accentuates the periphery’s pain. Bottom Line: The Eurozone economy is slowing sharply. While Q1 GDP avoided a contraction, soft and hard data indicators suggest that Q2 is likely to record an actual output contraction for the whole Euro bloc. High Inflation, But For How Long? At first glance, European inflation numbers scream for an ECB rate hike, preferably one yesterday. However, the picture is not that clear-cut. Supply factors predominantly drive the Eurozone’s inflation surge. Chart 5 highlights the role of energy, utilities, food, and transportation costs in the HICP and shows that these factors account for more than 80% of the 7.5% HICP rate. Moreover, the fluctuations in energy CPI continue to explain most of the gyration in headline CPI. The close relationship between energy CPI and core CPI highlights an elevated degree of pass-though, the result of higher electricity and transportation costs (Chart 6). Chart 5Energy, Food And Transport Dominate European CPI
An ECB Policy Mistake And Your Portfolio
An ECB Policy Mistake And Your Portfolio
Chart 6All About Energy
All About Energy
All About Energy
Chart 7No Demand Pull-Inflation In Europe
No Demand Pull-Inflation In Europe
No Demand Pull-Inflation In Europe
Unlike those in the US, Euro Area underlying inflation drivers are weak and inconsistent with demand-pull inflation. Wage growth in Europe stands at a paltry 1.6% annual rate, while in the US, the Atlanta Fed Wage Tracker has jumped to 4.5% (Chart 7, top panel). Moreover, Eurozone rent inflation remains stable at 1.2%, while it is a very elevated 4.5% in the US (Chart 7, bottom panel). The bifurcation in demand-driven inflation reflects vastly different output gaps between the two regions. US nominal GDP stands 2.5% above its 2014-2019 trend, while that of the Eurozone is still 5.3% below it. In the consumer durable goods sector, where the US experienced the greatest demand-supply mismatch – and therefore, the greatest inflation pressures – purchases are 25% above their 2014-2019 trend, while in Europe, they are still 9.5% below that trend (Chart 8) Year-on-year inflation prints should roll over this summer, as highlighted by weakening sequential inflation. Even if it remains elevated, the monthly Trimmed Mean CPI peaked last year. Energy inflation, moreover, is already contracting on a month-to-month basis (Chart 9). Chart 8Mind The Output Gap
Mind The Output Gap
Mind The Output Gap
Chart 9Weakening Sequential Inflation
Weakening Sequential Inflation
Weakening Sequential Inflation
Chart 10A Naive Inflation Forecast
A Naive Inflation Forecast
A Naive Inflation Forecast
Simple simulation exercises also confirm that annual inflation will peak this summer (Chart 10). Monthly headline inflation averaged 0.11% from 2010 to 2019, 0.31% in the first half of 2021, and 0.55% from mid-2021 to January 2022. If we assume that monthly inflation prints remain in line with its most recent average, annual inflation will peak by year-end at 9.1%, before falling to 6.8% by April 2023. However, if monthly inflation falls back to an historically elevated monthly average of 0.31%, annual headline inflation will peak in September and fall back to 3.8% by April 2023. Similarly, if monthly core CPI averages 0.28%, annual core CPI will peak in October before declining to 3.4% by April 2023, but it will fall to 2.1% by April 2023, if monthly core CPI averages an historically elevated 0.17%, or the average observed in the first half of 2021 (Chart 10, bottom two panels). Chart 11A Conditional Inflation Forecast
A Conditional Inflation Forecast
A Conditional Inflation Forecast
A more sophisticated exercise based on energy prices and the EUR/USD exchange rate also underlines the downside for Euro Area headline inflation. Energy inflation, which drives headline CPI, closely tracks the evolution of brent prices in euro terms and Deutsch natural gas prices. Assuming that natural gas prices average the historically very high level of €100/MWh over the next twelve months, that Brent averages US$95/bbl over that time frame (consistent with BCA’s commodity and energy team forecasts), and that the euro progressively moves back to EUR/USD1.10 by April 2023 (a weaker expectation than BCA’s Foreign Exchange Strategy team anticipates), then the Eurozone’s energy inflation will collapse to -10% by April 2023 (Chart 11). We can also assume that Russia enacts a full energy embargo on Western Europe if Sweden and Finland apply for NATO membership. In this case, Brent would spike quickly to $140/bbl and natural gas to €250/MWh. In our scenario, prices stay elevated for two months, before they ultimately normalize by early 2023. Under this scenario, energy inflation would experience a spike to 80% (!) in June 2022 before falling back sharply. In all cases, the collapse in energy inflation is consistent with a rapid decline in headline inflation toward 2% in 2023. Bottom Line: European inflation is elevated but remains mainly driven by supply factors, particularly the evolution of energy inflation. Demand-pull inflation is minimal, unlike that in the US. Additionally, both core and headline inflations are set to peak in the coming months based on the evolution of sequential monthly inflation as well as the behavior of the energy market. A July ECB rate hike would constitute a policy mistake for three reasons: (i) the ECB has no control over supply-driven inflation; (ii) Eurozone inflation is set to weaken; and (iii) economic growth will remain poor. Investment Implications Despite the noise made by the hawks, a large amount of uncertainty around the July 2022 meeting’s outcome remains. It is easy to forget that the ECB’s decisions are consensual. Influential members such as Vice-President Luis de Guindos continues to see a July 2022 hike as possible but unlikely. Others, such as Executive Board member Fabio Panetta, are very worried about the Eurozone’s economic slowdown. Moreover, ECB President Christine Lagarde has not endorsed the hawks. In the context of weak growth and a potential top in inflation, achieving consensus about an early summer hike could be difficult. Chart 12Patience Would Be Rewarded
Patience Would Be Rewarded
Patience Would Be Rewarded
The great paradox is that, if the ECB waits before pushing interest rates up, it will have an opportunity to increase rates durably next year. Wage growth is anemic today, but the decline in the Eurozone unemployment rate is consistent with a pickup in salaries in 2023 (Chart 12). Moreover, if energy inflation slows, the relative price-shock that is hurting households and domestic demand will ebb, which will allow consumption to recover. Patience would give Europe strength and the ECB a very strong basis to lift rates sustainably. The hawks will sway the council to their views. Inflation has latency, which means that its inertia may cause HICP to remain elevated beyond this summer. Moreover, the EU’s proposed ban on Russian oil imports along with Sweden’s and Finland’s likely accession-demand to NATO in the upcoming weeks could provoke Russia to strike first by cutting all its energy export to the EU to zero immediately. This would lift inflation for somewhat longer, as we showed in Chart 9. Related Report European Investment StrategyThe Three Forces Hurting European Earnings In response to the significant risk of a rate hike, we continue to recommend investors stay short cyclical stocks relative to defensive ones. Moreover, if the risk of a Russian energy cutoff increases, so does the threat of a severe recession in Europe, as a recent Bundesbank study posits (Chart 13). Capital preservation is paramount in today’s context; thus, we continue to lean on the side of prudence, especially considering Europe’s soft profit outlook. Once risks recede, we will abandon this strategy. This decision, however, would require clarification of Sweden and Finland’s decision about their membership in NATO as well as Russia’s response, a confirmation that the ECB is not hiking rates in July, and a pullback in inflation surprises, which would prove a powerful help for European equities and the cyclicals/defensive split (Chart 14). Chart 13The Russian Embargo Risk
An ECB Policy Mistake And Your Portfolio
An ECB Policy Mistake And Your Portfolio
Chart 14Wait For Inflation To Turn
Wait For Inflation To Turn
Wait For Inflation To Turn
In fact, our view that inflation will peak leads to direct implications for European markets. The periods that followed the previous four peaks in European core inflation were associated with an outperformance of small-cap stocks and cyclical stocks over the subsequent six and twelve months as well as declines in German yields and narrower credit spreads (Table 1A). The sectoral implications were not as clear, but industrials enjoyed an edge, while healthcare stocks suffered marked declines. Our conviction is strongest that energy CPI will fall. Again, this environment is associated with an outperformance of small-caps stocks and cyclicals over the following six months (Table 1B). Sector-wise, energy names suffer in this climate along with defensives, especially communication services equities. Table 1APeaks In Core CPI & Subsequent European Asset Performance
An ECB Policy Mistake And Your Portfolio
An ECB Policy Mistake And Your Portfolio
Table 1BPeaks In Energy CPI & Subsequent European Asset Performance
An ECB Policy Mistake And Your Portfolio
An ECB Policy Mistake And Your Portfolio
Looking at this period of disinflation more broadly rather than just following peaks in inflation, we find similar results. Declining core CPI is associated with an outperformance of cyclicals relative to defensives as well as strength in small-cap equities (Table 2A). This larger sample allows for a clearer view of sectors. Specifically, the performance of industrials and tech relative to the broad market improves markedly, while utilities suffer greatly. We reach roughly similar conclusions when energy CPI is contracting, except that, in this instance, energy stocks also underperform (Table 2B). Interestingly, so do financial companies. This is a surprising result, but previous instances of weaker energy CPI in the sample reflected weaker demand, not an evolving supply shock. Weaker aggregate demand always hurts financials. Table 2ADisinflation & Subsequent European Asset Performance
An ECB Policy Mistake And Your Portfolio
An ECB Policy Mistake And Your Portfolio
Table 2BEnergy Deflation & Subsequent European Asset Performance
An ECB Policy Mistake And Your Portfolio
An ECB Policy Mistake And Your Portfolio
Bottom Line: The risk of a policy mistake at the July ECB meeting is elevated. A policy mistake suggests that the current interest rate pricing for June 23 is too aggressive. Buy June 2023 Euribor contract. Moreover, Russian energy exports are still under threat. Accordingly, we continue to emphasize capital preservation and favor defensives over cyclicals. However, a buying opportunity will emerge rapidly once inflation peaks, especially if the ECB follows our base case. At this point, investors should buy small-cap and cyclical stocks. Industrials will beat energy, while all the defensive sectors will suffer. The BoE’s Tough Choice The Bank of England is stuck between a rock and a hard place. UK inflation shares characteristics of that of both the Eurozone and the US. On the one hand, energy inflation is increasing and could push headline CPI into double-digit territory around October 2022, once fuel subsidies fully expire. On the other hand, wage growth is strong as labor supply elasticity declined after Brexit. Demand-pull inflation is also rampant, which has pushed core CPI to a 5.7% annual rate. The UK’s cost push inflation, along with the growth slowdown in Europe and increasing tax rates are likely to cause a recession in the UK over the coming twelve months. The demand-pull inflation, however, will force the BoE to hike interest rates. This accentuates the downside risk to UK economic activity. Chart 15BoE's First Victim: The Pound
BoE's First Victim: The Pound
BoE's First Victim: The Pound
The obvious victim of this configuration is the pound. Weak growth will prevent the BoE from matching the pace of rate hikes of the Fed and poor economic growth will detract from investments in the UK. As a result, we see further downside in GBP/USD (Chart 15). BCA’s FX strategy team is also selling the pound versus the euro. This position is likely to generate further gains as investors will revise down their views for UK economic activity relative to the Euro Area, since they already hold much more dire expectations for the latter than the former. Bottom Line: EUR/GBP possesses more upside. The growth outlook for the Eurozone is poor, but investors currently overestimate the growth path of the UK relative to that of its southern neighbor. Mathieu Savary, Chief European Strategist Mathieu@bcaresearch.com Tactical Recommendations Cyclical Recommendations Structural Recommendations
Executive SummaryIn this report, we look at recent macroeconomic developments through the lens of the business cycle, inflation, and Treasury yield regimes to select winning sectors and styles.The US economy is currently in the slowdown stage of the business cycle, with all of its hallmark attributes, such as slowing growth, elevated inflation, and rising rates.We find that, despite being a real asset, equity performance deteriorates when inflation is on the rise. However, once inflation goes past its apex, the equity rebound is swift.During periods when both inflation and rates are rising, the Energy and Materials sectors tend to outperform, while the Financials and Consumer Discretionary sectors lag.The market is currently in a “high inflation and rising rates” regime but is about to transition to the “inflation is high but falling” regime, and today’s winners may turn into tomorrow’s losers. The new winners are likely to be the Financials, Consumer Discretionary, and Technology sectors.Bottom Line: As inflationary regimes shift, investors can tilt the odds of positive returns in their favor by taking a granular approach to sector selection.
We Are In High Inflation / Rising Rates Regime
We Are In High Inflation / Rising Rates Regime
So far, 2022 has not been a welcoming year for investors. All at once, slowing growth, surging inflation, impending monetary tightening, soaring energy prices, lockdowns in China, and a war in the heart of Europe have been thrown at them.With so much happening, it is difficult to separate signal from noise in the cross-currents of economic data. To make sense of the markets, we will look at recent developments through the lens of macroeconomic regimes, focusing on the stages of the business cycle, level and change in inflation, and the direction of Treasury yields.The Business Cycle Is In A Slowdown StageThe business cycle is a cornerstone of any investment decision as it underpins the fundamentals, and preordains the types of assets likely to outperform based on their level of risk and sensitivity to economic growth. The stage of the business cycle is a succinct way to summarize a wide range of economic data, such as capacity utilization, growth, policy, credit conditions, and valuation (Table 1). Table 1Business Cycle Is In A Slowdown Stage
Macroeconomic Regimes And Their Implications For US Equities
Macroeconomic Regimes And Their Implications For US Equities
While we are barraged with somewhat contradictory economic data, it is still fair to say that we are currently in the middle of the slowdown stage of the business cycle. Our proprietary business cycle indicator, constructed from a mix of soft and hard data across multiple economic dimensions, is trending down, consistent with that position (Chart 1). Furthermore:Growth is slowing, albeit off high levels, and the most recent disappointing ISM PMI is just another case in point. More concerning is that the new orders-to-inventories ratio has plunged (Chart 2);Unemployment is at a 2-year low of 3.6%, and there are currently two job openings per job seeker;Capacity utilization is high;Inflation is elevated;The Fed has commenced a monetary tightening cycle. Chart 1Economic Growth Is Slowing
Business Cycle Is In A Slowdown Stage
Business Cycle Is In A Slowdown Stage
Chart 2ISM PMI Disappointed
ISM PMI Disappointed
ISM PMI Disappointed
As such, during slowdown stage of a business cycle, returns tend to be lower than during recovery and expansion, while volatility is elevated (Chart 3).Chart 3During A Slowdown, Equity Returns Are Paltry, While Volatility Is Elevated
Macroeconomic Regimes And Their Implications For US Equities
Macroeconomic Regimes And Their Implications For US Equities
If equities are set to deliver pedestrian returns, we need to be more discerning in our sector and style selection. In an environment of slowing growth, growth stocks, large caps, and defensives tend to outperform (Chart 4). However, we have all observed that Growth has not fared that well due to rapidly rising interest rates and soaring inflation. In order to better understand the implication of the macroeconomic backdrop for equities, we need to drill further down into the inflation and interest-rate regimes.Chart 4During A Slowdown, Quality, Growth, And Defensives Outperform
Macroeconomic Regimes And Their Implications For US Equities
Macroeconomic Regimes And Their Implications For US Equities
Inflation And Rates RegimesHigh Inflation: Then And NowThe recent spike in inflation came as a shock to most money managers – the last time inflation hit this level was in the 1980s, which predated their investment careers.In the wake of major oil shocks, oil prices quadrupled in 1973-74 and doubled in 1979-80. The combination of high inflation with weak economic growth, fueled by repeated supply shocks, gave rise to the phenomenon of “stagflation”, i.e., soaring inflation accompanied by stagnating economic growth and high unemployment.The high inflation we are living through now was brought about by the pandemic, which ushered in unprecedented fiscal and monetary easing, soaring demand for consumer goods, and a disrupted global supply chain. More recently, inflation has been further exacerbated by the indirect effects of the war in Ukraine, such as skyrocketing energy, food, and materials prices. Despite the challenges of the current period, economic growth is still robust, and unemployment is at historically low levels. Energy and materials prices have soared, but not to the same extent as in the 1970s. And while economic growth is slowing, and stagflation is a risk, it is hardly inevitable.To ensure a more precise study of the sector and style analysis, we will separate the 1970-1984 period and look at it as a template for the performance of equities during a stagflation regime. We will use the 1984 to 2022 period to analyze sector performance during more ordinary inflation regimes.Equities Hate ItEquities are a real asset and, theoretically, should not be affected by inflation – sales and earnings growth are reported in nominal terms, and underlying economic growth is, by far, more important than inflation.Of course, reality is often different from theory, and businesses hate inflation: Not only do they have difficulty budgeting and planning ahead, but they are also often not able to convert sales growth into earnings growth, i.e., their costs may grow faster than their revenues. According to the most recent NFIB survey, 31% of small businesses consider inflation their biggest problem compared to 1-2% in 2019.In addition, high inflation is a harbinger of a hawkish Fed and rising interest rates. Hence, on balance, high inflation is bad news for equities (Chart 5). As inflation climbs, equity returns decline, as multiples contract in anticipation of lower earnings and higher discount rates (Chart 6). Chart 5Equities Underperform In A High-Inflation Environment
Macroeconomic Regimes And Their Implications For US Equities
Macroeconomic Regimes And Their Implications For US Equities
Chart 6High Inflation Leads To Multiple Contraction
Macroeconomic Regimes And Their Implications For US Equities
Macroeconomic Regimes And Their Implications For US Equities
Investing In Periods Of High-Inflation And Rising RatesHigh inflation is often accompanied by rising rates both because of strong economic growth and imminent monetary tightening which aims to arrest growth to combat inflation. As a result, high inflation comes hand in hand with elevated risk aversion and the repricing of more economically sensitive areas of the market.Indeed, when inflation is high (>3.5%) and rates are rising, median three-month equity returns are outright negative, and positive three-months returns occur less than 50% of the time (Chart 7). To beat the market, we need to tilt the return distribution in our favor.Chart 7We Are In High Inflation / Rising Rates Regime
We Are In High Inflation / Rising Rates Regime
We Are In High Inflation / Rising Rates Regime
When inflation is elevated (above 3.5%) and Treasury yields are climbing, the most appropriate portfolio stance is a tilt toward all-weather defensive sectors like Consumer Staples and Health Care, which hold their own in an environment of slowing growth, as well as sectors that command significant pricing power (Chart 8). The following is a brief summary of the winners and losers. Chart 8Sector Performance In High Inflation / Rising Rates Regime
Macroeconomic Regimes And Their Implications For US Equities
Macroeconomic Regimes And Their Implications For US Equities
High Inflation/Rising Rate WinnersEnergy: High oil prices are often one of the culprits behind runaway inflation, with the exception of the mid-1980s episode when Saudi Arabia drowned the world in oil, causing a collapse in oil prices, while inflation was on the rise. The energy sector has significant pricing power as it is upstream of the supply chain and can pass on costs to customers (Chart 9). This sector also benefits from high operating leverage. Outperformance usually peaks when inflation turns.Health Care: Health Care stocks tend to outperform when overall consumer prices advance. The non-cyclical nature of health care services reflects their resilience against economic volatility, irrespective of the direction of pricing pressures (Chart 10). Over the past few years, health care companies have struggled, mostly because of the pressure exerted on pharma by hospitals, insurers, and the government. However, recently, the sector’s pricing power has turned because of pent-up demand for medical procedures. Chart 9The Energy Sector Wields Significant Pricing Power
The Energy Sector Wields Significant Pricing Power
The Energy Sector Wields Significant Pricing Power
Chart 10Pricing Power Of The Health Care Sector Has Picked Up Thanks To Pent-up Demand
Pricing Power Of The Health Care Sector Has Picked Up Thanks To Pent-up Demand
Pricing Power Of The Health Care Sector Has Picked Up Thanks To Pent-up Demand
Consumer Staples: Historically, Consumer Staples have outperformed during periods of high inflation (Chart 11). Just like Health Care, this is a non-cyclical sector, because the demand for necessities is inelastic. While this sector is experiencing challenges because of the rising prices of raw materials, it is able to pass on its costs to customers, who have to allocate an increasing share of their budget to necessities. It has also helped multinationals in the S&P 500 index, as they invest in brand building, which now aids them to differentiate their offerings even when consumers are under duress.Utilities: Utilities is another quintessential defensive sector, with a stable revenue stream, significant pricing power, and profitability controlled by the regulators. Of course, one might argue that this is a highly leveraged sector which may be hurt by rising borrowing costs. However, it fares well, as regulators have a target return-on-investment for utilities companies, thus allowing them to raise prices to offset rising costs. Furthermore, with high inflation, long-term debt is smaller in real terms. Chart 11Consumer Staples Companies Have Invested In Brand-building
Consumer Staples Companies Have Invested In Brand-building
Consumer Staples Companies Have Invested In Brand-building
High Inflation/Rising Rates LosersConsumer Discretionary companies underperform in an environment of high and rising inflation as inflation reduces consumers’ purchasing power and forces them to shift spending away from discretionary goods and services, and toward necessities. The high negative correlation of the sector with the Consumer Drag Indicator is a case in point (Chart 12). Further, rising interest rates often follow high inflation, and weigh on demand for durable goods that require financing.Financials: High inflation is a headwind for the sector because monetary tightening which follows on the heels of high inflation tends to flatten the yield curve, affecting banks’ Net Income Margins (NIM), or the spread between loans and deposits. Inflation also hurts S&P Financials due to the mismatch between bank assets and liabilities. A typical bank has longer maturity for its assets (loans) than for its liabilities (deposits). Consequently, as inflation rises, this reduces the future net inflow because creditors demand higher interest rates, while the returns earned by the bank on its current loan book are mostly fixed by existing contracts. Chart 12Raging Inflation Cuts Into Consumers' Discretionary Spending
Raging Inflation Cuts Into Consumers' Discretionary Spending
Raging Inflation Cuts Into Consumers' Discretionary Spending
Inflation Will Turn Soon (Hopefully), And So Will Sector PerformanceInflation is likely to fade somewhat over the coming quarters, as supply chains normalize, and consumer demand wanes because of saturation and elevated prices. Arithmetic will also help, i.e., the base effect will kick in. Also, aggressive monetary policy is likely to slow economic growth and demand for labor further. With all of that, inflation will trend down but will reach the elusive 2% only years from now.However, when it comes to inflation, it is both the level of inflation and the direction of change that matter. While, overall, high inflation is bad for equities, it is necessary to differentiate between “inflation high and rising” and “inflation high and falling” regimes (Chart 13). As such, it is likely that we are about to shift into the “inflation is above 3.5% but falling” regime, where the median three-month return is 3.0% and returns are positive 69% of the time. We do anticipate a rebound in equities once the tighter monetary regime is priced in, and inflation shows signs of abating.Chart 13When Inflation Turns, Equities Will Rebound
Macroeconomic Regimes And Their Implications For US Equities
Macroeconomic Regimes And Their Implications For US Equities
With the Fed assuming an active role, we believe that going forward, equity returns will be more of a function of the monetary tightening cycle than of inflation. However, falling inflation readings may slow the pace of monetary tightening, or even put the Fed on hold.According to our analysis of sector performance in the “inflation is above 3.5% and is falling” regime, Energy and Materials will be the first sectors to reverse recent gains. The Consumer Discretionary sector is likely to rebound as pressure on consumer purses eases. Financials will also be among sectors that outperform in this regime, since fading inflation will help with asset/liability management. Consumer Staples and Health Care are likely to keep their outperformance going as inflation will continue to be an issue.Last, while empirical analysis does not show that the Technology sector outperforms when inflation is falling, we believe this will be the case based on the simple assumption that falling inflation will imply a lower discount rate (Chart 14). In this regime, we also anticipate a rotation from Value to Growth, and from Large to Small (Chart 15). Chart 14New Inflation Regime Will Usher In New Winners
Macroeconomic Regimes And Their Implications For US Equities
Macroeconomic Regimes And Their Implications For US Equities
Chart 15Changes In Inflation Regimes Brought About Market Rotations
Macroeconomic Regimes And Their Implications For US Equities
Macroeconomic Regimes And Their Implications For US Equities
Stagflation: Magnifying Glass On The 1970sStagflation, along with a recession, is now on investors’ minds – concern about the Fed making a policy mistake. After all, the Fed is already behind the curve, and it is hard to put the inflation genie back into the bottle. What would happen then?In this case, just as in the 1970s, we will see continued growth slowdown accompanied by raging inflation (Chart 16). Back then, equities pulled back every time inflation was on the rise (Chart 17), with Energy, Materials, and Health Care outperforming.The market rebounded at the first signs of inflation abating, reversing sector performance, and turning losers into winners, i.e., Consumer Discretionary and Real Estate started outperforming (Chart 18).Chart 16In The 1970s’ Stagflation Crushed Equities
Macroeconomic Regimes And Their Implications For US Equities
Macroeconomic Regimes And Their Implications For US Equities
Chart 17Energy And Materials Were Biggest Winners In the "Inflation High And Rising" Regime...
Macroeconomic Regimes And Their Implications For US Equities
Macroeconomic Regimes And Their Implications For US Equities
Chart 18...But They Gave Back Their Gains In "Inflation High But Falling" Regime
Macroeconomic Regimes And Their Implications For US Equities
Macroeconomic Regimes And Their Implications For US Equities
Bottom LineWe are in a slowdown stage of the business cycle, and Quality, Defensives, and Growth are expected to outperform. However, high inflation has mixed up all the cards and sent Growth into a tailspin. High inflation is unfavorable, not only for Growth but also for equities in general, even though they are a real asset. However, investors can shift the odds of positive returns in their favor by taking a granular approach to sector selection suitable for different inflation regimes.The market is currently in a “high inflation and rising rates” regime, with Energy and Materials outperforming. However, we are about to transition into the “inflation is high but falling” regime, and today’s winners may turn into losers. Defensives is the only group which holds up across all high inflation regimes, thanks to its earnings resilience even in the face of slowing growth. Irene TunkelChief Strategist, US Equity Strategyirene.tunkel@bcaresearch.com
Chart 1
PMIs Surprise To The Downside
PMIs Surprise To The Downside
Both the US and Global PMIs surprised to the downside this week with the US ISM Manufacturing PMI printing 55.4 vs 57.6 expected. The ISM PMI fell by 1.7 points from 57.1 while its employment sub-component fell by impressive 5 points (from 56 to 50.9). Worse still, the new orders-to-inventories ratio (NOI) remains in the free fall, foreshadowing further weakness in manufacturing activity (see chart). The disappointing NOI ratio is unlikely to be a one-off anomalous print considering a backdrop of the slowing demand for durable goods, falling consumer purchasing power, and surging oil prices. The NOI ratio contraction is also reminiscent of the 2004 episode – one of the few instances when the Fed tightened monetary policy into a slowing economy. Notably, 2004 marked the peak in cyclical/defensive equities for the entire pre-GFC cycle. When it comes to portfolio positioning, weak manufacturing data validates our recent rotation away from cyclical sectors and towards defensives (please see our most recent Strategy Report for a more detailed discussion). Bottom Line: We continue to recommend investors remain cautious and add defensive exposure to reduce portfolio volatility as the global manufacturing cycle slows down.