Equities

In lieu of next week’s report, I will be presenting a webcast titled ‘The 5 Big Mispricings In The Markets Right Now, And How To Profit From Them’. I do hope you can join. Executive Summary Just as the railway timetables set in train the First World War, central bank timetables for aggressive rate hikes are setting in train a global recession. Demand is already cool, so aggressive rate hikes will take it to outright cold. The risk is elevated because central banks are desperate to repair their damaged credibility on fighting inflation, and it may be their last chance. Inflationary fears and hawkishness from central banks are weighing on bonds and stocks, and it may take some weeks, or months, for inflation fears to recede. But we could be approaching a turning point. By the summer, core inflation should be receding. Furthermore, the fractal structures of the sell-offs in both the 30-year T-bond and the tech-heavy NASDAQ index are approaching points of extreme fragility that have signalled inflection points. Fractal trading watchlist: 30-year T-bond, NASDAQ, FTSE 100 versus Euro Stoxx 50, Netherlands versus Switzerland, and Petcare (PAWZ). US Inflation Is Hot, But Demand Is Not
US Inflation Is Hot, But Demand Is Not
US Inflation Is Hot, But Demand Is Not
Bottom Line: Tactically cautious, but long-term investors who do not need to time the market bottom should overweight bonds and overweight long-duration defensive equities versus short-duration cyclical equities – for example, overweight US versus non-US equities. Feature The First World War, the historian AJP Taylor famously argued, was “imposed on the statesmen of Europe by railway timetables.” Taylor proposed that the railways and their timetables were so central to troop mobilisation – and specifically, the German Schlieffen Plan – that a plan once set in motion could not be stopped. “Once started the wagons and carriages must roll remorselessly and inevitably to their predestined goal.” Otherwise, the whole process would unravel, and an opportunity to demonstrate military credibility would be lost that might never come again. Today, could a global recession be imposed upon us by central bank timetables for aggressive rate hikes? Just as it was difficult to unwind the troop mobilisation that led to the Great War, it will be difficult to back down from the aggressive rate hikes that the central banks have timetabled, at least in the near term. Otherwise, an opportunity to demonstrate inflation fighting credibility would be lost that might never come again. Just as the railway timetables set in train the First World War, central bank timetables for aggressive rate hikes may set in train another global recession. Unfortunately, central banks do not have precision weapons. Quite the contrary, monetary tightening is a blunt instrument which works by cooling overall demand. But demand is already cool, as evidenced by the contraction of the US economy in the first quarter. In their zeal to repair their damaged credibility on fighting inflation, the danger is that central banks take the economy from cool to outright cold. Granted, the US economy was dragged down by a drop in inventories and net exports. But even US domestic demand – which strips out inventories and net exports – is barely on its pre-pandemic trend (Chart I-1). Meanwhile, the euro area economy is still 5 percent below its pre-pandemic trend (Chart I-2). To reiterate, by hiking rates aggressively into economies that are at best lukewarm, central banks are risking an outright recession. Chart I-1US Inflation Is Hot, But Demand Is Not
US Inflation Is Hot, But Demand Is Not
US Inflation Is Hot, But Demand Is Not
Chart I-2Euro Area Inflation Is Hot, But Demand Is Not
Euro Area Inflation Is Hot, But Demand Is Not
Euro Area Inflation Is Hot, But Demand Is Not
Our Three-Point Checklist For A Recession Has Three Ticks My colleague Peter Berezin has created a three-point checklist for a recession: The build-up of an imbalance makes the economy vulnerable to downturn. A catalyst exposes this imbalance. Amplifiers exacerbate the downturn. Is there a major imbalance? You bet there is. The post-pandemic 26 percent overspend on durable goods in the US constitutes one of the greatest imbalances in economic history. Other advanced economies also experienced unprecedented binges on durable goods. The catalyst that is exposing this major imbalance is the realisation that durable goods are, well, durable. So, if you overspent on durables in 2020/21, then the risk is that you symmetrically underspend in 2022/23 (Chart I-3). The post-pandemic 26 percent overspend on durable goods in the US constitutes one of the greatest imbalances in economic history. Meanwhile, a future underspend on goods cannot be countered by an overspend on services because the consumption of services is constrained by time, opportunity, and biology. There is a limit to how often you can eat out, go to the movies, or go to the doctor (Chart I-4). Indeed, for certain services, an underspend will persist, because we have made some permanent post-pandemic changes to our lifestyles: for example, hybrid office/home working and more online shopping and online medical care. Chart I-3An Overspend On Goods Can Be Corrected By A Subsequent Underspend...
An Overspend On Goods Can Be Corrected By A Subsequent Underspend...
An Overspend On Goods Can Be Corrected By A Subsequent Underspend...
Chart I-4...But An Underspend On Services Cannot Be Corrected By A Subsequent Overspend
...But An Underspend On Services Cannot Be Corrected By A Subsequent Overspend
...But An Underspend On Services Cannot Be Corrected By A Subsequent Overspend
Finally, the amplifier that will exacerbate the downturn is monetary tightening. If central banks follow their railway timetables for aggressive rate hikes, a goods downturn will magnify into an outright recession. So, in Peter’s three-point checklist, we now have tick, tick, and tick. Inflation Is Hot, But Demand Is Not If economic demand is at best lukewarm, then what caused the post-pandemic inflation that central banks are now fighting? The simple answer is massive fiscal stimulus combined with the equally massive shift in spending to durable goods. Locked at home and flush with government supplied cash, we couldn’t spend it on services, so we spent it on goods. This created a massive shock in the distribution of demand, out of services whose supply could easily adjust downwards, and into goods whose supply could not easily adjust upwards. For example, airlines could cut back their flights, but auto manufacturers couldn’t make more cars. So, airfares didn’t collapse but used car prices went vertical! The causality from stimulus payments to durable goods spending to core inflation is irrefutable. The causality from stimulus payments to durable goods spending to core inflation is irrefutable. The biggest surges in US durable goods spending all coincided with the government’s stimulus checks (Chart I-5). And the three separate surges in month-on-month core inflation all occurred after surges in durable goods demand (Chart I-6). As further proof, core inflation is highest in those economies where the stimulus checks and furlough schemes were the most generous – like the US and the UK. Chart I-5Stimulus Checks Caused The Surges in Durable Goods Spending
Stimulus Checks Caused The Surges in Durable Goods Spending
Stimulus Checks Caused The Surges in Durable Goods Spending
Chart I-6The Surges In Durable Goods Spending Caused The Surges In Core Inflation
The Surges In Durable Goods Spending Caused The Surges In Core Inflation
The Surges In Durable Goods Spending Caused The Surges In Core Inflation
What Does All This Mean For Investment Strategy? Our high conviction view is that the pandemic’s inflationary impulse combined with the Ukraine war will turn out to be demand-destructive, and thereby ultimately morph into a deflationary impulse. Yet central banks are all pumped up to demonstrate their inflation fighting credibility. Given that this credibility is badly damaged, it may be their last opportunity to repair it before it is shattered forever. To repeat, just as the railway timetables set in train the First World War, central bank timetables for aggressive rate hikes may set in train another global recession. That said, a recession is not inevitable. The interest rate that matters most for the economy and the markets is not the policy rate that central banks want to hike aggressively, it is the long-duration bond yield. A lower bond yield can underpin both the economy and the financial markets, just as it did during the pandemic in 2020. But to the extent that the bond market is following the real economic data, we are in a dangerous phase. Because, as is typical at an inflection point, the real data will be noisy and ambiguous. Meaning it may take some weeks, or months, for inflation fears to be trumped by growth fears. On March 10th, in Are We In A Slow-Motion Crash? we predicted: “On a tactical (3-month) horizon, the inflationary impulse from soaring energy and food prices combined with the choke on growth from sanctions will weigh on both the global economy and the global stock market. As such, bond yields could nudge higher, the global stock market has yet to reach its crisis bottom, and the US dollar will rally” That prediction proved to be spot on! Recession, or no recession, we are still in a difficult period for markets because inflationary fears and hawkishness from central banks are weighing on bonds and stocks, while buoying the US dollar. As such, tactical caution is still warranted. Fractal structures of the sell-offs in both the 30-year T-bond and the tech-heavy NASDAQ index are approaching points of extreme fragility. But we could be approaching a turning point. By the summer, core inflation should be receding. Furthermore, the fractal structures of the sell-offs in both the 30-year T-bond and the tech-heavy NASDAQ index are approaching points of extreme fragility that have reliably signalled previous inflection points (Chart I-7 and Chart I-8). Chart I-7The Sell-Off In The 30-Year T-Bond Is Approaching Fractal Fragility
The Sell-Off In The 30-Year T-Bond Is Approaching Fractal Fragility
The Sell-Off In The 30-Year T-Bond Is Approaching Fractal Fragility
Chart I-8The Sell-Off In The NASDAQ Is Approaching Fractal Fragility
The Sell-Off In The NASDAQ Is Approaching Fractal Fragility
The Sell-Off In The NASDAQ Is Approaching Fractal Fragility
The advice for long-term investors who do not need to time the market bottom is: Bonds will ultimately rally. Overweight the 30-year T-bond and the 30-year Chinese bond. Equities will be conflicted between slowing growth which will weigh on cyclical profits, and falling bond yields which will buoy long-duration valuations. Therefore, overweight long-duration defensive sectors and markets versus short-duration cyclical sectors and markets. For example, overweight US versus non-US equities. Fractal Trading Watchlist As just discussed, the sell-offs in the 30-year T-bond and the NASDAQ are approaching points of fractal fragility that have signalled previous turning points. Hence, we are adding both investments to our watchlist. Also added to our watchlist is the outperformance of the FTSE100 versus Euro Stoxx 50, and the underperformance of Netherlands versus Switzerland, both of which are approaching potential reversals. Our final addition is Petcare (PAWZ). After a stellar 2020, Petcare gave back most of its gains in 2021. But this underperformance is now approaching a point of fragility which might provide a new entry point. There are no new trades this week, but the full watchlist of investments at, or approaching, turning points is available on our website: cpt.bcaresearch.com Fractal Trading Watchlist: New Additions A Potential New Entry Point Into Petcare
A Potential New Entry Point Into Petcare
A Potential New Entry Point Into Petcare
FTSE100 Outperformance Vs. Euro Stoxx 50 Vulnerable To Reversal
FTSE100 Outperformance Vs. Euro Stoxx 50 Vulnerable To Reversal
FTSE100 Outperformance Vs. Euro Stoxx 50 Vulnerable To Reversal
Netherlands Underperformance Vs. Switzerland Close To Exhaustion
Netherlands Underperformance Vs. Switzerland Close To Exhaustion
Netherlands Underperformance Vs. Switzerland Close To Exhaustion
Chart 1The Strong Trend In The 18-Month-Out US Interest Rate Future Is Fragile
The Strong Trend In The 18-Month-Out US Interest Rate Future Is Fragile
The Strong Trend In The 18-Month-Out US Interest Rate Future Is Fragile
Chart 2The Strong Trend In The 3 Year T-Bond Is Fragile
The Strong Trend In The 3 Year T-Bond Is Fragile
The Strong Trend In The 3 Year T-Bond Is Fragile
Chart 3AUD/KRW Is Vulnerable To Reversal
AUD/KRW Is Vulnerable To Reversal
AUD/KRW Is Vulnerable To Reversal
Chart 4Canada Versus Japan Is Reversing
Canada Versus Japan Is Reversing
Canada Versus Japan Is Reversing
Chart 5Canada's TSX-60's Outperformance Might Be Over
Canada's TSX-60's Outperformance Might Be Over
Canada's TSX-60's Outperformance Might Be Over
Chart 6US Healthcare Providers Vs. Software At Risk of Reversal
US Healthcare Providers Vs. Software At Risk of Reversal
US Healthcare Providers Vs. Software At Risk of Reversal
Chart 7A Potential Switching Point From Tobacco Into Cannabis
A Potential Switching Point From Tobacco Into Cannabis
A Potential Switching Point From Tobacco Into Cannabis
Chart 8Biotech Is A Major Buy
Biotech Is A Major Buy
Biotech Is A Major Buy
Chart 9CAD/SEK Reversal Has Started
CAD/SEK Reversal Has Started
CAD/SEK Reversal Has Started
Chart 10Financials Versus Industrials To Reverse
Financials Versus Industrials To Reverse
Financials Versus Industrials To Reverse
Chart 11Norway's Outperformance Could End
Norway's Outperformance Could End
Norway's Outperformance Could End
Chart 12Greece's Brief Outperformance To End
Greece's Brief Outperformance To End
Greece's Brief Outperformance To End
Chart 13BRL/NZD At A Resistance Point
BRL/NZD At A Resistance Point
BRL/NZD At A Resistance Point
Chart 14The Outperformance Of Resources Versus Healthcare Is Vulnerable To Reversal
The Outperformance Of Resources Versus Healthcare Is Vulnerable To Reversal
The Outperformance Of Resources Versus Healthcare Is Vulnerable To Reversal
Chart 15The Outperformance Of Resources Versus Biotech Has Started To Reverse
The Outperformance Of Resources Versus Biotech Has Started To Reverse
The Outperformance Of Resources Versus Biotech Has Started To Reverse
Chart 16Cotton's Outperformance Is Vulnerable To Reversal
Cotton's Outperformance Is Vulnerable To Reversal
Cotton's Outperformance Is Vulnerable To Reversal
Chart 17US Homebuilders' Underperformance Has Reached A Potential Turning Point
US Homebuilders' Underperformance Has Reached A Potential Turning Point
US Homebuilders' Underperformance Has Reached A Potential Turning Point
Chart 18Switzerland's Outperformance Vs. Germany Has Started To End
Switzerland's Outperformance Vs. Germany Has Started To End
Switzerland's Outperformance Vs. Germany Has Started To End
Chart 19The Rally In USD/EUR Could End
The Rally In USD/EUR Could End
The Rally In USD/EUR Could End
Chart 20The Outperformance Of MSCI Hong Kong Versus China Is Vulnerable To Reversal
The Outperformance Of MSCI Hong Kong Versus China Is Vulnerable To Reversal
The Outperformance Of MSCI Hong Kong Versus China Is Vulnerable To Reversal
Chart 21A Potential New Entry Point Into Petcare
A Potential New Entry Point Into Petcare
A Potential New Entry Point Into Petcare
Chart 22FTSE100 Outperformance Vs. Euro Stoxx 50 Vulnerable To Reversal
FTSE100 Outperformance Vs. Euro Stoxx 50 Vulnerable To Reversal
FTSE100 Outperformance Vs. Euro Stoxx 50 Vulnerable To Reversal
Chart 23Netherlands Underperformance Vs. Switzerland Close To Exhaustion
Netherlands Underperformance Vs. Switzerland Close To Exhaustion
Netherlands Underperformance Vs. Switzerland Close To Exhaustion
Dhaval Joshi Chief Strategist dhaval@bcaresearch.com Fractal Trading System Fractal Trades
Central Bank ‘Railway Timetables’ Are Dragging Us Into Recession
Central Bank ‘Railway Timetables’ Are Dragging Us Into Recession
Central Bank ‘Railway Timetables’ Are Dragging Us Into Recession
Central Bank ‘Railway Timetables’ Are Dragging Us Into Recession
6-Month Recommendations Structural Recommendations Closed Fractal Trades Indicators To Watch - Bond Yields Chart II-1Indicators To Watch - Bond Yields - Euro Area
Indicators To Watch - Bond Yields - Euro Area
Indicators To Watch - Bond Yields - Euro Area
Chart II-2Indicators To Watch - Bond Yields - Europe Ex Euro Area
Indicators To Watch - Bond Yields - Europe Ex Euro Area
Indicators To Watch - Bond Yields - Europe Ex Euro Area
Chart II-3Indicators To Watch - Bond Yields - Asia
Indicators To Watch - Bond Yields - Asia
Indicators To Watch - Bond Yields - Asia
Chart II-4Indicators To Watch - Bond Yields - Other Developed
Indicators To Watch - Bond Yields - Other Developed
Indicators To Watch - Bond Yields - Other Developed
Indicators To Watch - Interest Rate Expectations Chart II-5Indicators To Watch - Interest Rate Expectations
Indicators To Watch - Interest Rate Expectations
Indicators To Watch - Interest Rate Expectations
Chart II-6Indicators To Watch - Interest Rate Expectations
Indicators To Watch - Interest Rate Expectations
Indicators To Watch - Interest Rate Expectations
Chart II-7Indicators To Watch - Interest Rate Expectations
Indicators To Watch - Interest Rate Expectations
Indicators To Watch - Interest Rate Expectations
Chart II-8Indicators To Watch - Interest Rate Expectations
Indicators To Watch - Interest Rate Expectations
Indicators To Watch - Interest Rate Expectations
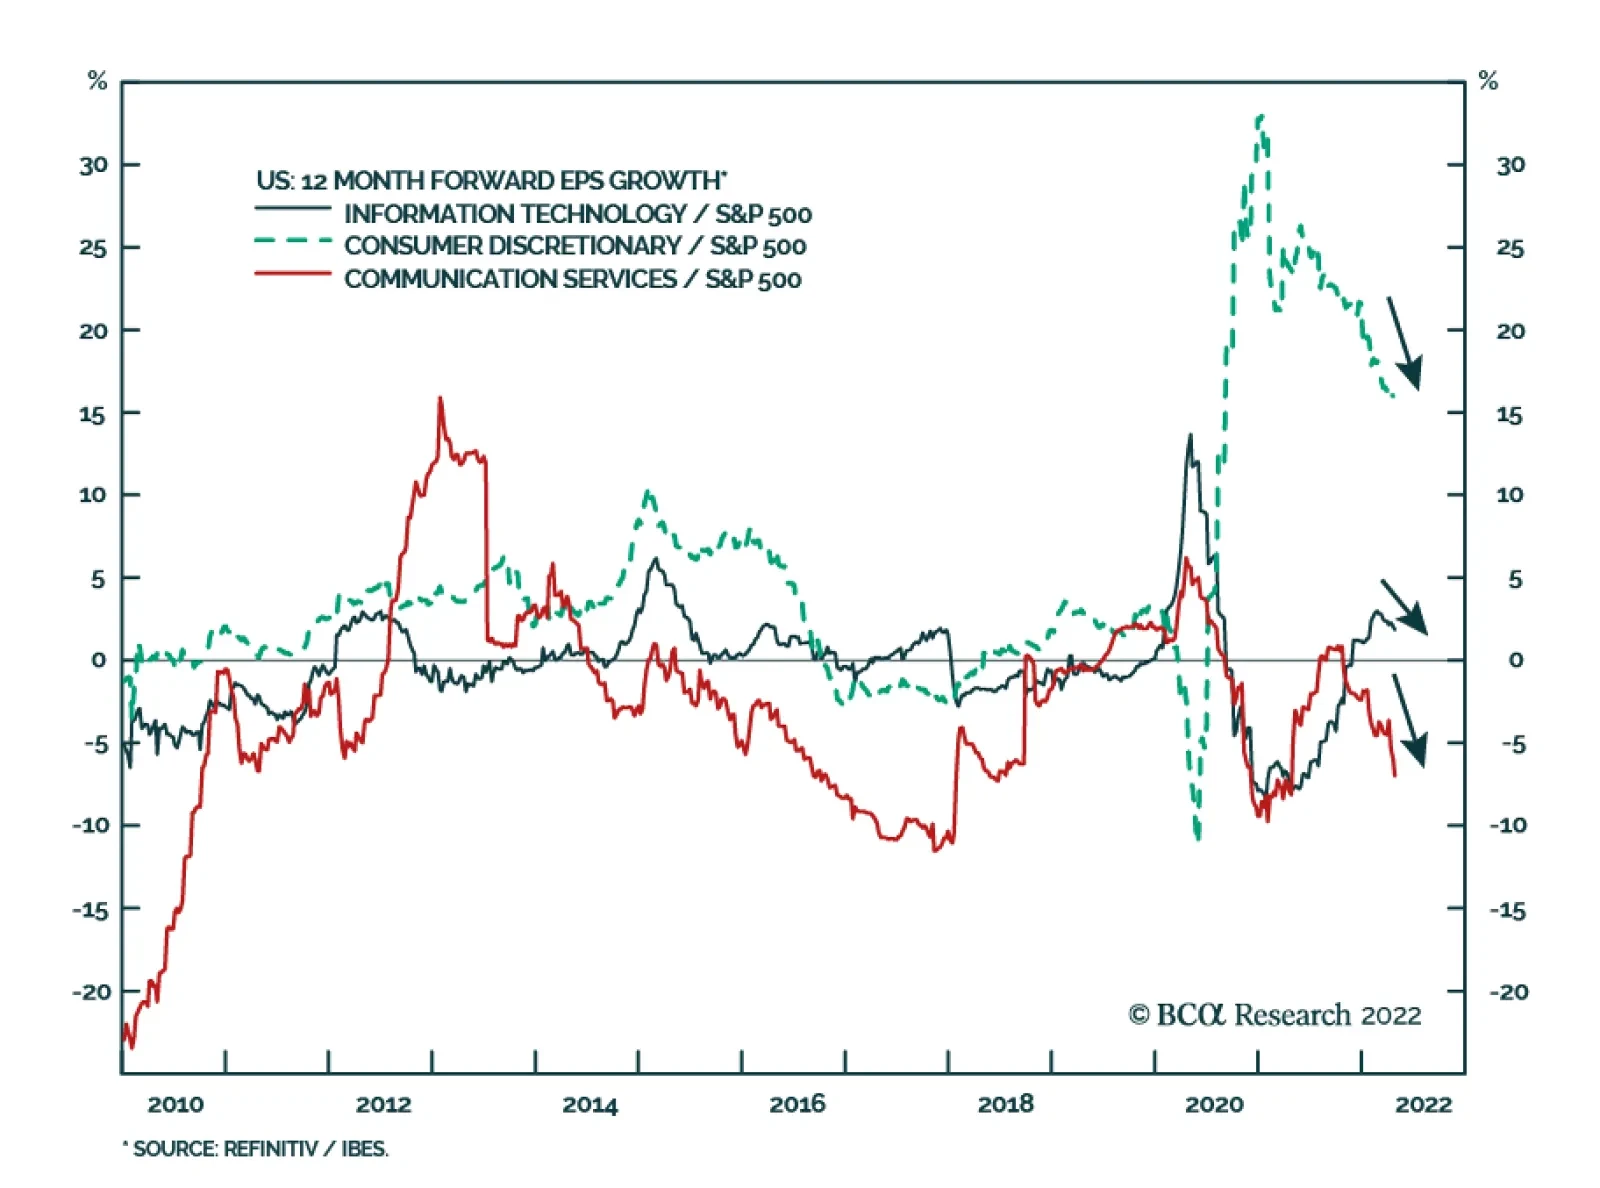
Broadly-defined US technology stocks have been consistently underperforming the S&P 500 since the beginning of the year. Communication Services, Consumer Discretionary, and IT have shed 24%, 20%, and 18% of their value, respectively. Two main headwinds…
Executive Summary Stocks Not Linked To Presidential Approval
Stocks Not Linked To Presidential Approval
Stocks Not Linked To Presidential Approval
President Kennedy’s performance in 1962 would be ideal for the Biden administration in this year’s midterm elections – but today the Russian conflict is less likely to help the Democrats. A threat to the homeland could lift President Biden’s job approval. But most likely inflation and foreign crises will weigh on his approval. A contrarian stock rally would not help Biden’s approval but Biden’s attempts to boost his rating could deliver negative surprises for stocks. US “peak polarization” and Democratic Party policies are negative for the stock market and investor risk appetite over the next zero-to-six months. Our quantitative election models suggest Republicans will win the Senate, though uncertainty will rise as a result of the controversy over the Supreme Court and abortion. Democratic odds of keeping the White House in 2024 are 54.6% but eroding. CLOSE Recommendation (Cyclical) CLOSING Level CLOSING Date RETURN Long Municipal Bonds Vs. Duration Matched Treasuries 93.53 2-MAY-22 -1.50% Bottom Line: Overall Biden policies plus global events are neutral or bullish for US Treasuries while neutral or bearish for US stocks over a tactical time horizon (zero-to-six months). Feature President Biden is doubling down on his support for Ukraine and thus adopting the John F. Kennedy foreign policy playbook of confronting Russia ahead of the US’s midterm elections. Related Report US Political StrategyWar Not Helping Biden So Far Biden’s position today is weaker than Kennedy’s in 1962, so his reaction to Russian aggression will create more market hurdles than it removes. Bad news will come before good news, compounding bearish investor sentiment in the near term. Policy uncertainty should decline after the midterm election on November 8, which is positive for equities in 2023. Democrats Scramble Amid Recession Fear The US economy contracted unexpectedly in the first quarter at an annualized 1.4% rate. The underlying data contained some silver lining – personal consumption grew at 2.7%. But the contraction is bad news for the economy and the ruling Democratic Party. Public approval of Biden’s handling of the economy has fallen to -16.2%. The global economy continues to sputter. Risks to growth are high in Europe and China as well (Chart 1). The US policy response will take shape on the monetary and fiscal level but also on the foreign policy level. First, global risks will not dissuade the Federal Reserve from normalizing interest rates. Chairman Jerome Powell signaled on April 21 that he is willing to hike interest rates 50 basis points at a time to combat core PCE inflation at 5.2%. The market currently expects core inflation to peak at 5.2% while the Fed funds rate will hit 3.3% in 2023 before falling in 2024. The implication is that monetary policy will tighten quickly, even as the economy stutters, which is negative for the US equity market and investor sentiment. However, Fed hawkishness is largely priced. US long-duration treasuries are at or near fair value at 3%, according to our US Bond Strategy. Our US Investment Strategy believes that with the S&P500 already down by 13% so far this year, stocks can begin to grind upward, barring other negative surprises. Chart 1US Slows Amid Global Growth Risks
US Slows Amid Global Growth Risks
US Slows Amid Global Growth Risks
Second, the White House will scramble to try to limit the damage to the Democratic Party in the midterms – with the unintentional result that negative surprises could arise from fiscal policy and especially foreign policy. On the fiscal front, congressional Democrats will redesign their budget reconciliation bill to try to gain a legislative victory. They will need to make it as close to deficit-neutral as possible to avoid fanning inflation. The odds of passage are higher than consensus expectations (26% on PredictIt). But the stock market does not want more government spending or higher taxes in a stagflationary environment. Fiscal policy is still a significant source of uncertainty in 2022, if not in 2023. On the foreign policy front, the greatest trouble looms. Russian aggression has prompted the US and its NATO allies to double down on their support for Ukraine, providing additional arms and aid. Biden’s Secretary of Defense Lloyd Austin said that the US wants to see Ukraine “a democratic country able to protect its sovereign territory … [and] Russia weakened to the point where it can't do things like invade Ukraine.”1 Finland and Sweden are increasingly likely to join NATO, which will antagonize Russia. Russia’s response is not yet known but it has issued aggressive warnings. By cutting off natural gas to Poland and Bulgaria, Moscow is warning that it may cut off natural gas to all Europe. Meanwhile Germany is embracing an oil embargo. A larger energy shock is increasingly likely. Chart 2More Bad News Before Good News
More Bad News Before Good News
More Bad News Before Good News
Bottom Line: Monetary policy hawkishness is largely priced whereas additional fiscal uncertainty and America’s reactive foreign policy are not fully priced. This news is neutral or bullish for US Treasuries while neutral or bearish for US stocks over a tactical time horizon (zero-to-six months) (Chart 2). Biden Can Hurt Stocks, Stocks Cannot Help Biden Before addressing how Biden will try to boost his job approval, we should ask whether approval ratings have any direct impact on financial markets. The answer is largely no – or fleeting at best. During the Trump administration it was easy to get the impression that the president’s approval rating had a substantive impact on the stock market, or at least benefited stocks relative to bonds. After the first year, a correlation developed between presidential approval and the stock-to-bond ratio (Chart 3A, top panel). The passage of tax cuts juiced corporate profits but also suggested that President Trump could get things done, boosting his approval rating. Oddly, however, the relationship continued even after Republicans lost Congress in 2018. Spurious or not, the correlation persisted until Covid-19 erupted. At that point Trump’s approval tanked while the stock market roared on the back of gargantuan monetary and fiscal stimulus. President Biden’s administration started off the same way, with presidential approval falling (the usual honeymoon ended) while stocks rallied relative to bonds (Chart 3A, bottom panel). But Biden’s passage of the American Rescue Plan Act and the bipartisan Infrastructure Investment and Jobs Act in 2021 did not boost his approval rating. Going forward, Biden’s approval rating will probably stabilize at a low level in an inflationary or stagflationary context. Stocks may continue to underperform bonds over a tactical time frame but will not underperform bonds over the cyclical time frame as long as the US avoids a recession. Thus there is not likely to be close correlation between Biden’s approval and the stock-to-bond ratio. From the sector and style perspective, there is also no clear relationship with presidential approval. There may be some basis for seeing Trump’s tax cuts as positive for cyclicals relative to defensives. His term coincided with the second half of a business cycle when growth expanded. But ultimately cyclicals vacillated and went sideways. Moreover growth stocks outperformed value stocks, in accordance with President Obama’s term in office. Yet there was no correlation between Trump’s approval and growth stocks relative to value (Chart 3B, top two panels). In Biden’s case, presidential job approval has no clear correlation with cyclicals relative to defensives. There may be some relationship with value relative to growth stocks but it is far from convincing. Most likely the underlying macroeconomic dynamics that favored value stocks (i.e. recovery, inflation) coincided with Biden’s honeymoon period and then outlasted it. However, if Biden passes a reconciliation bill with tax hikes, the implication should be positive both for value versus growth stocks and for his approval rating (Chart 3B, bottom two panels). Chart 3AStocks Not Linked To Presidential Approval
Stocks Not Linked To Presidential Approval
Stocks Not Linked To Presidential Approval
Chart 3BStocks Not Linked To Presidential Approval
Stocks Not Linked To Presidential Approval
Stocks Not Linked To Presidential Approval
From the above data we can draw a few conclusions. On one hand, the stock-to-bond ratio and cyclicals-versus-defensives could rally again on the back of a resilient global economy and yet Biden’s approval rating could fail to recover. The distribution of wealth means that inflation and rising mortgage rates hit low-to-middle income groups who comprise the bulk of voters. Cyclical assets will rise if the global economy improves relative to the US economy, whereas presidential approval may not. Inflation could subside incrementally with limited benefit to the president. On the other hand, if stocks and cyclical sectors continue to underperform, it will probably be due to even worse economic outcomes that will simultaneously prevent Biden’s approval from recovering. If the economy slows further and inflation remains persistent, disapproval will rise. The problem for investors is that the latter is the likeliest scenario based on the energy supply risks in Europe and China’s difficulties stabilizing growth. The US economy cannot entirely avoid the knock-on effects of slower global growth over the next six months. Bottom Line: There is no stable relationship between presidential approval and the stock market, whether regarding bonds, sectors, or styles. There are occasional correlations that reflect coincidences of macro, market, and political cycles or major policy changes. In today’s context a rebound in cyclical assets may not help the president while a further downturn would hurt him. But the president’s attempts to boost his approval rating could hurt stocks. Inflation And Foreign Wars Tend To Hurt Presidents What can Biden do to boost his approval rating and his party’s odds in the midterm election? Not much. Foreign policy is his best option, though he is limited to a defensive or reactive foreign policy and even then the underlying economy will drive voters the most. Looking at presidential approval over time, upswings occur during periods of economic prosperity and peaks occur amid foreign belligerence that threatens the homeland. Presidential approval has slumped since the subprime mortgage crisis and today it is even lower than under President Obama (Chart 4A). Chart 4APresidential Approval Follows Peace And Prosperity, Not War And Poverty
Biden's Cold War And Culture War
Biden's Cold War And Culture War
Similarly presidential disapproval rises during recessionary and inflationary periods as well as wars and scandals (Chart 4B). The Obama/Trump era saw a rise in disapproval that could resume due to inflation. Foreign wars that do not present a threat to the homeland can increase disapproval. Chart 4BPresidential Approval Follows Peace And Prosperity, Not War And Poverty
Biden's Cold War And Culture War
Biden's Cold War And Culture War
The takeaway is that a homeland threat from abroad could temporarily lift the president’s approval but it will not last for long unless the underlying economic malaise is cured. The problem for Biden is that the most immediate foreign policy challenges emanate from oil producers whose reactions exacerbate the inflation problem (Russia, Iran). Biden may or may not keep relations steady with China, where disputes could drive up import prices. Bottom Line: A reactive foreign policy could provoke a threat to the homeland that boosts the president’s job approval. But more likely the weakening economy, high inflation, and foreign crises that add to inflation will hurt the president. Biden And The Kennedy Playbook President Kennedy’s experience in 1962 presents the best case for Democrats but the underlying economic and political context are different and damaging for Biden. Comparing today’s situation to comparable midterm election years, the negative outlook for Biden and the Democrats becomes clear. Comparable midterm elections feature high international tensions, high inflation, or low presidential approval on a net basis. Today the “Misery Index” (unemployment plus inflation) is comparable to the minimum levels in midterm years in the 1970s – and higher than the maximum levels in other midterm years (Table 1). The House and Senate losses during periods of high misery and low presidential approval are substantial. Table 1Misery And Midterms
Biden's Cold War And Culture War
Biden's Cold War And Culture War
The 1962 midterm election is a notable exception. The Cuban Missile Crisis and Kennedy’s handling of it minimized the Democratic Party’s losses that year, with only four seats lost in the House, plus a gain of three seats in the Senate. Compare this to the typical midterm election, with an average of 27 lost seats in the House (31 for Democrats) and four seats lost in the Senate (five for Democrats) (Table 2). Table 2Kennedy’s Cuban Missile Crisis Midterm, 1962
Biden's Cold War And Culture War
Biden's Cold War And Culture War
Kennedy’s net approval averaged 55% that year, whereas Biden’s today stands at -11%. A threat to the homeland could boost Biden’s approval but today’s likeliest conflicts would worsen inflation if they occurred. The Misery Index stands at 11% this year compared to 6% in 1962. Most importantly, in the Cuban Missile Crisis, the Russians recognized that America would always care about Cuba’s status more than Russia because it posed a proximate strategic threat. Americans had more at stake and could take greater risks to prevent Cuba from hosting nuclear arms. Today, while the US is not trying to supply Ukraine or Finland with nuclear weapons, NATO membership would expand the US nuclear umbrella. Americans do not seem prepared to recognize that Russia will always care more about Ukraine’s and Finland’s status than Americans will. Russians have more at stake and can take greater risks. Thus while Biden’s foreign policy could easily provoke a crisis with Russia, Biden may not get the better end of the crisis like Kennedy did. Meanwhile financial markets will suffer from the spike in tensions. Bottom Line: Biden’s doubling down on support for Ukraine and NATO enlargement suggest that he does not have an interest in reducing tensions with Russia ahead of the midterm election. Yet Biden is unlikely to get the better of any reactive foreign policy that escalates tensions – at least not in time for the midterms. This dynamic is negative for US and global stocks and risk assets. Election Quant Model Updates The Philadelphia Federal Reserve released a second update to its state-level coincident indicators in April, enabling us to update our quant models for the Senate election in 2022 and presidential election in 2024. The model still predicts that Democrats will lose two Senate seats, producing a Republican majority of 52-48 (Chart 5). Arizona and Georgia are the two states in which Democrats won Senate seats in 2022 but are expected to flip to the Republican side. Arizona and Pennsylvania remain toss-up states (odds of Democratic victory range from 45%-55%) but are inching downward toward likely Republican victories. Chart 5GOP Tipped To Take The Senate (Quant Election Model, April 2022)
Biden's Cold War And Culture War
Biden's Cold War And Culture War
Democrats shed probability in all states once again. Odds fell the most in Arizona (-1.08 percentage point since the last update in early April) followed by North Carolina (-1.03ppt) and Pennsylvania (-0.98ppt). In seven states the Democratic odds of victory fell by more than 0.5ppts, including Arizona and Nevada (Chart 6). Overall the probability for Democrats retaining control of the Senate now stands at 48.2% (down 0.2ppt). These odds are higher than consensus even though they agree with the consensus on expecting Republican victory. Online betting markets like PredictIt are pricing in Republican control at around 79%, up 3ppt from our last update. This is overstated and the new controversy over the Supreme Court and abortion will fire up Democratic voters, making the Senate race closer to what our model suggests. Chart 6Democrats Falter Across Senate Races: AZ, PA, NC
Biden's Cold War And Culture War
Biden's Cold War And Culture War
Looking ahead to 2024, our presidential election model still predicts 308 Electoral College votes for the Democratic Party, a number that has not changed since the 2020 election (Chart 7). Democrats have a 54.6% chance overall of retaining the White House. Chart 7Biden Still Tipped For 2024 (Quant Election Model, April 2022)
Biden's Cold War And Culture War
Biden's Cold War And Culture War
The trend is negative for the incumbent party. North Carolina slipped out of the toss-up category and into Republican category – i.e. Democrats now have only a 44% chance of winning it. Democrats’ odds of winning Florida moved lower – it is now in toss-up territory at 54%, which comes closer to our subjective judgment that Republicans are favored there. The toss-up states have remained well anchored in the range of 40%-60% since 2020 and will play a pivotal role in future predictions. Generally the trend is for falling odds that Democrats will win these states (PA, FL, NC, AZ, and GA). Both Pennsylvania and Florida account for a combined 49 electoral votes and Florida is probably more Republican-leaning than the model says. If the three critical Rust Belt states (Pennsylvania, Wisconsin, Michigan) slip into toss-up territory then the model will be flagging serious trouble for Democrats. But a lot can happen between now and 2024. In the latest update Democrats are shedding probability of winning in all states, although to a lesser degree than the past two updates. Economic data, while still negative for the incumbent party, may be deteriorating less rapidly. Biden’s approval rating improved marginally since our last update and we expect it to stabilize, albeit at a low level. Michigan recorded the largest decline in Democratic odds of victory (-1.07ppt) followed by Minnesota (-0.79ppt) and New Hampshire (-0.78ppt). Democrats shed more than 0.5ppts from their odds of victory in twelve states, nine of which they won in 2022 (Chart 8). Chart 8Democrats Shedding Odds Of Winning States In 2024
Biden's Cold War And Culture War
Biden's Cold War And Culture War
Bottom Line: Republicans are favored to take the Senate (as well as the House) in 2022. Democrats are slightly favored to retain the White House in 2024, though the model is optimistic by granting Florida to the Democrats and the election odds look to be razor-thin yet again. Investment Takeaways As we go to press, the unusual leak of a draft opinion of Supreme Court Justice Samuel Alito has roiled US politics. The draft argues that the landmark court case of Roe Versus Wade should be overturned. This incident reflects our “Peak Polarization” theme – that polarization will remain very disruptive in the short term yet subside over the long term. It also suggests an activist effort to escalate the culture wars ahead of the midterm election, which we have argued would be the case and implies that more unrest will follow from this event. Whether the Supreme Court overturns the landmark Roe versus Wade ruling of 1973, the battle for women voters will help sustain election-year policy uncertainty, as women’s approval for Democrats will start to recover (Chart 9). Investor sentiment will remain bearish in the very near term. A series of hurdles need to be cleared before we close our tactical long DXY trade and defensive sector tilt. We are closing our long municipal bond relative to Treasury trade for a loss of 1.5% (Chart 10). Chart 9Women Are Key Constituencies In The Midterm
Biden's Cold War And Culture War
Biden's Cold War And Culture War
Chart 10Municipal Trade Fizzled Out Despite Strong Local Government Finance
Municipal Trade Fizzled Out Despite Strong Local Government Finance
Municipal Trade Fizzled Out Despite Strong Local Government Finance
The overall analysis of US politics is neutral or bullish for US Treasuries while neutral or bearish for US stocks over a tactical time horizon (zero-to-six months). If recession is avoided at the critical juncture this year, then 2023 will see a rising stock market as the economy expands and political risks fall. Matt Gertken Senior Vice President Chief US Political Strategist mattg@bcaresearch.com Footnotes 1 Peter Weber, “Defense Secretary Lloyd Austin says U.S. believes Ukraine can win, wants to 'see Russia weakened,'” The Week, April 25, 2022, theweek.com. Strategic View Open Tactical Positions (0-6 Months) Open Cyclical Recommendations (6-18 Months) Table A2Political Risk Matrix
Biden's Cold War And Culture War
Biden's Cold War And Culture War
Table A3US Political Capital Index
Biden's Cold War And Culture War
Biden's Cold War And Culture War
Chart A1Presidential Election Model
Biden's Cold War And Culture War
Biden's Cold War And Culture War
Chart A2Senate Election Model
Biden's Cold War And Culture War
Biden's Cold War And Culture War
Table A4APolitical Capital: White House And Congress
Biden's Cold War And Culture War
Biden's Cold War And Culture War
Table A4BPolitical Capital: Household And Business Sentiment
Biden's Cold War And Culture War
Biden's Cold War And Culture War
Table A4CPolitical Capital: The Economy And Markets
Biden's Cold War And Culture War
Biden's Cold War And Culture War
Executive Summary More Chinese Households Intend To Save Than To Invest
More Households Intend To Save Than To Invest
More Households Intend To Save Than To Invest
The Politburo meeting last Friday signaled that China is determined to achieve the 5.5% annual growth target set earlier this year. Policymakers vowed to accelerate the implementation of existing pro-growth measures and hinted that they may scale up stimulus due to domestic challenges and external uncertainties. However, Chinese policymakers are facing an “impossible trinity” of eliminating domestic COVID cases and avoiding an overshoot as they stimulate the economy, while trying to achieve a high rate of economic expansion. The Politburo did not mention any plans to boost income and consumption via direct fiscal transfers to households, a sector that has been a weak link in China’s economy in the past two years. China’s consumption growth and demand for housing will not recover any time soon without meaningful aids to shore up household income. Bottom Line: Policy stimulus measures announced so far fall short of what is required to lift the economy. Given constraints on household consumption and the property market, China’s economic growth is set to underwhelm and Chinese stock prices will underperform their global counterparts. China’s top leaders have pledged to provide more support to the economy. The Politburo meeting last week indicated that the 5.5% growth target set for 2022 will be maintained and stimulus measures will be accelerated. Chinese stocks in both on- and offshore markets rebounded sharply following the positive rhetoric. Related Report Emerging Markets StrategyA Whiff Of Stagflation? In our view, however, Chinese authorities are facing an “impossible trinity” as they simultaneously attempt to achieve three goals: (1) pursuing a dynamic zero-Covid policy, (2) delivering decent economic growth, and (3) not resorting to “irrigation-style” massive stimulus. The pro-growth measures announced last week by the government lack the needed elements to generate a quick and strong rebound in the economy, particularly in the household and property sectors. Hence, the rebound in Chinese stock prices will unlikely progress into a cyclical rally (over a 6- to 12-month time span). We maintain our neutral allocation in Chinese onshore stocks and an underweight stance on the MSCI China Index, within a global portfolio. An “Impossible Trinity” The messages from the Politburo meeting highlight policymakers’ determination to shore up the economy. However, the authorities are not backing away from the zero-COVID policy, which is taking a heavy toll as cities are forced into lockdown to contain outbreaks. In addition, the Politburo reiterated the housing policy principle that “housing is for living, not for speculation” and did not mention concrete measures to boost household consumption. Thus, the biggest challenge for China to achieve its growth target this year is how to normalize economic activity without resorting to another round of “irrigation-style” stimulus while keeping domestic COVID cases at bay. In an environment of frequent lockdowns, monetary and fiscal easing have limited effect as the private and household sectors are averse to taking risks. China’s zero-COVID policy comes with hefty economic costs. April’s PMI showed sharp declines in a wide range of business activities due to the prolonged lockdown in Shanghai and several other cities (Chart 1). The new orders, new export orders, and imports subindexes in the manufacturing PMI and services PMI, all fell to their lowest levels since Q1 2020 when COVID first hit China (Chart 2). Chart 1April PMIs Show Widespread Declines In Business Activities
April PMIs Show Widespread Declines In Business Activities
April PMIs Show Widespread Declines In Business Activities
Chart 2PMI Subindexes Fell To Lowest Levels Since Q1 2020
PMI Subindexes Fell To Lowest Levels Since Q1 2020
PMI Subindexes Fell To Lowest Levels Since Q1 2020
Going forward, even if China manages to avoid a Shanghai-style month-long lockdown, the dynamic zero-COVID policy will have devastating ramifications on the economy. Notably, March economic data from the city of Shenzhen, China’s technology center, suggests that even a week-long lockdown has had large impact on the local economic activity. Chart 3Severe Economic Disruptions In Shenzhen Due To A Week-Long City Lockdown
Severe Economic Disruptions In Shenzhen Due To A Week-Long City Lockdown
Severe Economic Disruptions In Shenzhen Due To A Week-Long City Lockdown
In contrast with the extensive outbreak in Shanghai, Shenzhen was able to contain its COVID cases at an early stage and endured a citywide lockdown for only one week in mid-March. However, Shenzhen’s export growth contracted by 12.8% year-on-year (YoY) in March, a stark contrast from the 14.7%YoY increase in exports on a national level. The city’s imports fell by 11.9%YoY, also significantly lower than China’s total import growth, which was flat (Chart 3). Retail sales of consumer goods in Shenzhen shrank by 1.6%YoY in March and home sales plummeted by a stunning 90%YoY during the week of March 13-20. On the national level, the Politburo has called for an acceleration in infrastructure investment through frontloading local government special purpose bonds (SPB) and fast-tracking infrastructure project approvals. However, the lack of details has created questions regarding the magnitude of incremental stimulus, or whether the stepped-up policy effort will involve an increase in SPB or a general bond quota for local governments. Chart 4Construction Activity Started Softening In March, Before Shanghai Lockdown
Construction Activity Started Softening In March, Before Shanghai Lockdown
Construction Activity Started Softening In March, Before Shanghai Lockdown
The stringent COVID containment methods will also undermine the effectiveness of China’s pro-growth measures. As expected, China’s construction activity PMI tumbled in April amid the lockdowns, but the new orders and business expectations components in the construction PMI had already started to slide in March (Chart 4, top and middle panels). Moreover, employment in the labor-intensive construction sector also declined substantially in March and April (Chart 4, bottom panel). The deterioration in these indicators is consistent with our view that even short and less draconian lockdowns spark considerable disruptions in business activities. Bottom Line: There is a low likelihood that China will deviate from its existing zero-COVID policy for the rest of this year. As such, boosting the economy via stimulus will be challenging due to frequent interruptions to economic activities. No Bazooka For Consumers China’s household consumption, which accounts for about 40% of the country’s aggregate demand, has been a weak link in the economy during the past two years. Last week’s Politburo meeting pledged to stabilize employment, create new jobs and encourage hiring from small and medium enterprises (SMEs). However, there was no mention of any large-scale fiscal transfer to households via cash or subsidy payments, which suggests that pro-consumer measures are not in the stimulus package. Chart 5Retail Sales In China Have Been The Weak Link In The Economy In The Current Cycle
Retail Sales In China Have Been The Weak Link In The Economy In The Current Cycle
Retail Sales In China Have Been The Weak Link In The Economy In The Current Cycle
China’s retail sales growth has been muted in the current business cycle, a deviation from past economic recoveries when a revival in the general economy and moderate pro-consumption stimulus helped to lift household spending growth substantially above the rate of nominal GDP expansion (Chart 5). Since the pandemic, however, government stimulus to the household sector has been insufficient to revive consumption, due to the negative impact lockdowns have on both labor market demand and the service sector activities. Compared with the US and Europe, China’s fiscal transfer to the household sector has been very limited since the first wave of COVID in early 2020 (Chart 6). Local governments handed out vouchers in Q2 2020 aimed at boosting consumption, but the amounts were dismal and have had a minimal effect on the sector. Chart 6IMF Fiscal Monitor Database: Fiscal Response To The COVID-19 Pandemic
China’s Trilemma
China’s Trilemma
Presently the RMB value in direct payments to the household sector is even smaller: some cities including Shenzhen distributed consumption vouchers ahead of the May holiday week. Nonetheless, the total value of consumption vouchers this year is estimated at around RMB 2billion. The amount, even with a multiplier effect of 3 on consumption, will be less than 0.1% of China’s monthly retail sales in nominal value. Hence, the coupons are unlikely to make any significant difference to the aggregate household spending. Bottom Line: Household consumption will be severely curtailed as lockdowns wreak havoc on the economy and household income, and the government so far has not provided meaningful direct transfers to the public. Rebound In Housing Demand Doubtful The Politburo encouraged local governments to further relax local housing policies, such as lowering mortgage rates and down payment ratios, and easing restrictions on home sales and purchases. However, we do not expect that these policies alone will restore homebuyers’ confidence amid short-term factors such as COVID outbreaks/lockdowns, and longer-term factors like slowing household income growth, high household debt and poor demographics (Chart 7A and 7B). Chart 7AProperty Market Is Challenged By Slower Household Income Growth, High Household Income Debt And Poor Demographics
Property Market Is Challenged By Slower Household Income Growth, High Household Income Debt And Poor Demographics
Property Market Is Challenged By Slower Household Income Growth, High Household Income Debt And Poor Demographics
Chart 7BProperty Market Is Challenged By Slower Household Income Growth, High Household Income Debt And Poor Demographics
Property Market Is Challenged By Slower Household Income Growth, High Household Income Debt And Poor Demographics
Property Market Is Challenged By Slower Household Income Growth, High Household Income Debt And Poor Demographics
China’s household sector was struggling prior to recent lockdowns. The growth rate of national disposable income per capita slowed by more than two percentage points (in nominal terms) in Q1 this year compared with Q4 2019 (Chart 7A, top panel). In addition, the PBoC’s quarterly urban depositor survey (released before the Shanghai lockdown) in Q1 showed subdued confidence in future household income (Chart 8). Households’ willingness to save hit a record high and is even more elevated than in early 2020; on the other hand, the propensity to invest has dropped to a multi-year low (Chart 9). Chart 8Chinese Households' Subdued Confidence In Future Income
Chinese Households' Subdued Confidence In Future Income
Chinese Households' Subdued Confidence In Future Income
Chart 9More Households Intend To Save Than To Invest
More Households Intend To Save Than To Invest
More Households Intend To Save Than To Invest
Chart 10Chinese Households' Declining Appetite For Purchasing Real Estate Assets
Chinese Households' Declining Appetite For Purchasing Real Estate Assets
Chinese Households' Declining Appetite For Purchasing Real Estate Assets
Despite lower interest rates and easier monetary conditions, Chinese consumers’ medium- to long-term loans continued to trend down in Q1, which indicates a declining appetite for purchasing real estate assets and durable goods (Chart 10). COVID-related restrictions have exacerbated matters and weighed heavily on the demand for housing. Home sales from 30 Chinese cities were down by 56% in April from a year ago (Chart 11). House prices have started to deflate in tier-3 cities. Deflation will likely spread to tier-1 and -2 cities due to a pandemic-driven decline in income and confidence. Furthermore, the unemployment rate has picked up, especially among younger workers (Chart 12). Job and income dynamics normally improve after the overall economic cycle bottoms. Therefore, without any measures to boost household income, the demand for housing will remain a drag on the economy in the near term. Chart 11Home Sales Worsened In April Amid COVID Flareups In Major Cities
Home Sales Worsened In April Amid COVID Flareups In Major Cities
Home Sales Worsened In April Amid COVID Flareups In Major Cities
Chart 12Labor Market Dynamics Deteriorated Rapidly
Labor Market Dynamics Deteriorated Rapidly
Labor Market Dynamics Deteriorated Rapidly
Bottom Line: The real estate market has been vital to business cycle recoveries in China since 2009. However, the property market will not recover anytime soon without a substantial boost to household income and a normalization in social and economic activities. Investment Conclusions The policy rhetoric from the Politburo meeting helped to shore up market confidence last Friday. Nevertheless, we do not think that the stimulus measures will be sufficient to produce a rapid business cycle recovery or a sustainable stock market rally (Chart 13A and 13B). Chart 13AIt Is Too Early To Call A Bottoming In Chinese Stocks
It Is Too Early To Call A Bottoming In Chinese Stocks
It Is Too Early To Call A Bottoming In Chinese Stocks
Chart 13BIt Is Too Early To Call A Bottoming In Chinese Stocks
It Is Too Early To Call A Bottoming In Chinese Stocks
It Is Too Early To Call A Bottoming In Chinese Stocks
Given the negative forces from rolling lockdowns and shrinking demand, China’s economy requires a massive government stimulus via direct transfers to households and SMEs. Yet, Beijing is neither ready to abandon its dynamic zero-Covid policy nor provide “irrigation-type” stimulus, especially for households and the property market. The policy stimulus measures announced so far still fall short of what is required to lift the economy. In light of the constraints on household consumption and the property market, economic growth in China is set to underwhelm and stock prices will likely underperform their global counterparts. Jing Sima China Strategist jings@bcaresearch.com Strategic Themes Cyclical Recommendations
Executive Summary Three Problems For European EPS
Three Problems For European EPS
Three Problems For European EPS
The Chinese economic slowdown in response to COVID lockdowns represents a major headwind for European profits in 2022. Weaker global growth creates another hurdle. The energy crisis is the third major problem for European profit growth this year. European profits must be revised downward for 2022, but the impact on 2023 EPS will be small. Cyclical sectors are particularly exposed to these three headwinds, which will hurt profitability this year. The recent relative strength in industrials and materials earnings is likely to buckle in response to weaker global growth, while the defensive characteristics of healthcare and communication services will shine. Within defensive sectors, favor healthcare and communication services versus utilities and consumer staples. Bottom Line: A downward revision of European profits will constrain the ability of European equities to rally in the coming quarters; however, it does not portend another major down leg in European stocks. Nonetheless, the downward revision still points to further underperformance of cyclical equities. Within the defensive sectors, healthcare and communication services are more appealing than utilities and consumer staples shares. The earnings season has begun. According to the MSCI index, Eurozone profit margins are at a 14-year high following a sharp rebound in profits after the pandemic-induced collapse of 2020. Faced with a war in Ukraine and surging inflation, investors worry that this robust profit picture will not last. We share these worries. The near-term outlook for European profits has deteriorated significantly. While the inflation surge amplified by the Ukrainian crisis is an important problem for European firms, it is not the only one. European businesses must also cope with the effect of a growth slowdown in the US goods sector. Moreover, Chinese growth is likely to plunge in response to the tightening lockdowns across the country. As a result, we fear that current earnings estimates for 2022 are too optimistic. Nonetheless, European stocks are unlikely to collapse further. The valuation cushion amassed during the first quarter market shake-out already embeds some downside for 2022 earnings. Additionally, 2023 earnings have much more limited downside than this year’s EPS. Three Problems For European EPS Chart 1European Earnings Profile
European Earnings Profile
European Earnings Profile
Three major problems indicate that the current European earnings estimates for 2022 are too optimistic: namely, China’s economic slowdown, a global economic deterioration, and the consequences of the Ukrainian war on the European economy (Chart 1). China’s Slowdown This publication has regularly highlighted that, even if the Chinese credit impulse is already trying to bottom, the lagged effect of the previous slowdown in credit flows would continue to hurt European growth in the first half of 2022. China’s COVID outbreak and Beijing’s severe policy response only accentuate this headwind. European profits are even more sensitive to Chinese economic fluctuation than European economic activity, which points to a meaningful drag on profitability. Many relationships highlight our concerns: So far, the weakness in the Chinese credit impulse is still consistent with a rapid deterioration of forward earnings growth and could lead to a contraction in forward EPS (Chart 2, top panel). The Chinese new orders index is falling rapidly. The elevated likelihood that China endures even more lockdowns in the coming months implies a sharper drop in orders and further weakness in European EPS (Chart 2, second panel). The CNY is depreciating again, which often coincides with a deflationary shock in global industrial goods that Europe produces. Unsurprisingly, a weaker RMB correlates well with narrowing operating profit margins in the Eurozone (Chart 2, bottom panel). Korean business conditions are deteriorating in response to the softening of the Chinese economy. A weaker RMB will further hurt business sentiment in the peninsula, especially if Chinese lockdowns broaden. The Korean economy is a key barometer of global business conditions because of its high cyclicality. BCA’s EM strategy team anticipates an additional softening in Korea, which portends weaker European profits and margins (Chart 3). Chart 2China's Troubles Trouble Europe Profits
China's Troubles Trouble Europe Profits
China's Troubles Trouble Europe Profits
Chart 3Listen to Korea
Listen to Korea
Listen to Korea
Global Economic Weakness The global growth weakness goes beyond China’s troubles. US economic activity is slowing down in response to higher yields, higher inflation, and the disappearance of pent-up demand following a splurge on goods by consumers during the pandemic. As a result, Q1 GDP growth fell to -1.4% from a quarterly annualized rate of 5.5% in Q4 2021. The weakness in the ISM New Orders-to-Inventory ratio points to continued softness through Q2. EM are not immune to these vulnerabilities either. EM consumers are suffering greatly from surging food and fuel costs. Moreover, EM interest rates continue to rise briskly and the ensuing liquidity removal points to fainter growth ahead. Chart 4The Weaker ISM NOI Is Worrisome
The Weaker ISM NOI Is Worrisome
The Weaker ISM NOI Is Worrisome
The impact of weaker global economic activity on European earnings is straightforward: A falling US ISM New Orders-To-Inventories ratio is a prelude both to slower earnings growth and to narrower profit margins in the Eurozone (Chart 4). Global exports growth has collapsed to 5.5% from more than 20% prior year and is likely to deteriorate further. Historically, weaker global shipments are associated with a slowdown in European forward earnings growth (Chart 4, third panel). Global economic surprises have rebounded this year, but, as we showed two weeks ago, they are likely to move back below zero in the near future. This is a noisy series, but negative surprises often prompt downward revisions to earnings estimates. The Energy Shock Europe is facing an exceptional energy shock that is hurting the region’s growth prospects. Now that Russia is curtailing gas shipments to Poland and Bulgaria, more energy disruptions are likely, which will further hamper domestic growth prospects across the region, while simultaneously elevating the cost of goods sold for firms. However, not all countries will be hit equally by a Russian energy embargo among the major economies. Germany and Italy have the most to lose, while France and the UK are the least at risk (Chart 5). The impact of an oil supply shock on European earnings is negative. When oil prices rise because of strong global aggregate demand, European earnings handle rising energy prices well because the increasing sales volume creates a powerful offset. However, our simple model that accounts for the evolution of oil demand and global policy uncertainty highlights that we do not face a demand shock, but rather a supply shock (Chart 6), which implies that most sectors will suffer from higher energy prices. Chart 5Varying Vulnerabilities To Russia’s Energy Showdown
The Three Forces Hurting European Earnings
The Three Forces Hurting European Earnings
Chart 6Oil's Rally Is Supply-Driven
Oil's Rally Is Supply-Driven
Oil's Rally Is Supply-Driven
Chart 7European Margins Under Pressure
European Margins Under Pressure
European Margins Under Pressure
The inflation passthrough from energy to everything else is not strong enough to protect profit margins. Yes, HICP is elevated, but European PPIs are rising much more rapidly. Historically, such an inability to pass on higher production costs results in slower European profits growth and contracting operating profit margins (Chart 7). The current weakness in consumer confidence and the expected drag on business confidence underscore that pricing power will likely deteriorate from here, which will accentuate the negative impact on profits from the current energy shock. Wage Costs: Not A Problem For Now Wage costs are the one bright spot for European profit margins. European negotiated wages are expanding at a very low rate of 1.6%. Unit labor costs are only expanding at 2.4%, a rate similar to last decade when European core inflation averaged 1%. Chart 8Wages Do Not Hurt Margins
Wages Do Not Hurt Margins
Wages Do Not Hurt Margins
Historically, rising wage rates correlate with rising profitability, not declining margins (Chart 8). This relationship seems paradoxical, but European wages only increase when global aggregate demand is very strong. Due to the degree of operating leverage of European equities, the impact of robust aggregate demand on revenues swamps the impact of accelerating wage growth on production costs. Hence, it will probably take a wage growth rate much higher than the experience of the past 20 years for salaries to start hurting margins. While this is possible, we are many quarters away from this risk becoming reality. Bottom Line: European forward earnings estimates for 2022 are far too elevated in view of the headwinds European businesses are currently facing. The combination of weaker Chinese economic activity, slowing global growth, and a supply-driven energy shock will force significant downward revisions to this year’s EPS. Related Report European Investment StrategyPlenty Of Risks For Cyclical Stocks 2023 EPS should fare better. Chinese authorities are increasingly supporting their economy and this stimulus will impact activity when the lockdowns end. This process will prompt a boom later this year. Global growth will recover once the energy shock recedes. Decelerating European PPI will also help profit margins recover. Following their severe decline in the first quarter, European equities have already embedded a significant valuation cushion to compensate for the transitory shock to earnings. European stocks will not be able to advance meaningfully while 2022 earnings estimates weaken, but they are unlikely to make new lows either. Three Problems For Cyclicals vs Defensives The same three factors that hurt the outlook for European profits for 2022 also confirm that cyclical equities should underperform defensives in the near term. China’s Slowdown Cyclicals are extremely sensitive to a Chinese economic slowdown: The past weakness in the Chinese credit impulse is consistent with a further downgrade of the profit expectations for European cyclicals stocks compared to that of their defensive peers (Chart 9). A deterioration in China’s PMI New Orders heralds a period of weakness in the earnings of cyclical equities. A weak Chinese yuan leads to poor relative earnings (Chart 9). The deterioration in Korean business confidence and the poor performance of Korean equities also leads to weakness in both the earnings and profit margins of cyclical equities relative to those of defensive stocks (Chart 9). Global Growth Weakness The earnings outlook for cyclical sectors relative to defensives is negatively affected by slowing global economic activity: A deterioration in global economic surprises often results in a period of anemic cyclicals’ earnings (Chart 10). The rapidly declining ISM New Orders-to-Inventories ratio is synonymous with underperforming cyclicals’ earnings as well as a contraction in their relative profit margins because of their heightened degree of operating leverage (Chart 10). Weaker global exports confirm the continued risks to cyclicals’ earnings. Chart 9China Is A Threat To Cyclical Equities
China Is A Threat To Cyclical Equities
China Is A Threat To Cyclical Equities
Chart 10Global Growth Threatens Cyclical Stocks
Global Growth Threatens Cyclical Stocks
Global Growth Threatens Cyclical Stocks
The Energy Shock There is no clear relationship between energy prices and the outlook for the profits of cyclical equities relative to those of defensive stocks. Nonetheless, we may deduce that, if elevated energy prices hurt aggregate profits, they will also hurt cyclical profits, since the latter exacerbate the fluctuation of the former. Moreover, Europe’s elevated stagflation risk is consistent with sagging profits for cyclicals relative to those of defensives, because cyclicals experience greater pain from deteriorating economic activity than the benefit they enjoy from higher inflation. Bottom Line: The problems faced by the Chinese economy as well as the risks to global growth are consistent with an underperformance of the profits of cyclical stocks compared to those of defensive equities. Moreover, while higher energy prices are not necessarily a problem for cyclical equities, the elevated perceived stagflation risk is consistent with downward revisions for the relative earnings of cyclicals. This picture indicates that cyclical equities are still vulnerable to some downside relative to the broad market in the near term. A Look at Individual Sectors Chart 11Sectoral Degrees Of Operating Leverage
The Three Forces Hurting European Earnings
The Three Forces Hurting European Earnings
We may distill the impact of China’s problems, the global economic slowdown, and the energy shock on sectoral earnings. A simple starting point is to look at their degree of operating leverage. Based on this observation, financials and consumer discretionary stocks are the sectors most at risk from weaker revenue growth, while utilities are the least exposed (Chart 11). A more complete picture may be gleaned from each sector’s pricing power. Energy Chart 12Improving Energy Margins
Improving Energy Margins
Improving Energy Margins
The energy sector enjoys a significant margin tailwind from the oil supply shock (Chart 12). Nonetheless, this boost is long in the tooth and a pullback is likely if Brent falls toward the $94/bbl level expected by BCA’s Commodity & Energy team in the second half of 2022, and $88/bbl level in 2023. Hence, it is likely that the near-term benefits for the energy sector’s profits are already fully discounted and that the sector could suffer a significant setback in the coming quarters. Industrials The pricing power of industrials (as approximated by the gap between CPI and PPI) is still strong, which creates a tailwind for relative earnings (Chart 13). However, this robustness is under threat in the current environment in which global industrial production, global trade, and global capital goods orders are decelerating (Chart 14). Hence, a period of downgrade for the earnings of industrials relative to the broad market is likely in the coming months. Chart 13Robust Pricing Power For Industrials...
Robust Pricing Power For Industrials...
Robust Pricing Power For Industrials...
Chart 14...But For How Long?
...But For How Long?
...But For How Long?
Financials Chart 15Financials Are Under Siege
Financials Are Under Siege
Financials Are Under Siege
The relative pricing power1 of financials is rapidly deteriorating, despite the recent increase in German yields (Chart 15). Moreover, it is likely to remain weak in a context in which core CPI has yet to decrease. Finally, the potential for a European recession in 2022, or at least, a severe growth slowdown, should lift non-performing loans. As a result, this sector’s earnings could experience a significant downgrade in the near term. Tech The sector’s pricing power was in an uptrend, but it has started to deteriorate in recent quarters (Chart 16). This evolution indicates that that tech earnings and profit margins are likely to suffer relative to the broad market, especially in light of the sector’s high degree of operating leverage. Consumer Discretionary Stocks This sector is suffering from a complete collapse of its pricing power (Chart 17). Additionally, tumbling consumer confidence in Europe and around the world is a significant drag on near-term sales. Consequently, earnings growth as well as profit margins are likely to lag the overall market. Chart 16Crucial Tech Tailwind Dwindling
Crucial Tech Tailwind Dwindling
Crucial Tech Tailwind Dwindling
Chart 17A Problem For Consumer Discretionary Stocks
A Problem For Consumer Discretionary Stocks
A Problem For Consumer Discretionary Stocks
Materials European materials sector’s profit margins stand at a 19-year high compared to that of the broad market. However, relative profit growth has collapsed. The bad news for the sector is that its pricing power is rapidly deteriorating because of surging input costs. It suggests that relative profit growth will become negative as relative profit margins contract (Chart 18). Utilities The pricing power of utilities is plunging because retail electricity prices are not rising as fast as input costs. The negative impact of this adverse pricing on profit margins is consequential (Chart 19). Governments around Europe are likely to continue to pressure this sector to limit the increase in electricity prices to households, which means that utilities are likely to lag other defensive sectors. Chart 18Materials' Outlook Deteriorating Materially
Materials' Outlook Deteriorating Materially
Materials' Outlook Deteriorating Materially
Chart 19Crunch Time For Utilities
Crunch Time For Utilities
Crunch Time For Utilities
Consumer Staples Chart 20Staples Under Duress
Staples Under Duress
Staples Under Duress
The consumer staples sector is facing a similar pricing power problem to that of consumer discretionary stocks: input costs are rising rapidly relative to selling prices (Chart 20). Nonetheless, the earnings of staples will prove more resilient than that of their discretionary counterparts because the staples’ sales volumes are less sensitive to both deteriorating global consumer confidence and falling household real incomes. However, consumer staples equities have already greatly outperformed consumer discretionary stocks. Thus, much of the good news in terms of relative earnings is well discounted and the additional outperformance will be limited. Healthcare Chart 21Healthcare Stocks Still Have Pricing Power
Healthcare Stocks Still Have Pricing Power
Healthcare Stocks Still Have Pricing Power
The pricing power of the healthcare sector remains positive, but it is not as strong as it was ten years ago. Hence, profits growth has scope to improve further compared to the rest of the market (Chart 21). Beyond favorable pricing power dynamics, the industry is insulated from weaker global growth relative to the rest of the broad market. Importantly, the healthcare sector sports one of the lowest degrees of operating leverage in Europe, which will also boost its relative profitability in the current environment. Healthcare is our top defensive sector right now, despite its valuation premium. Communication Services Chart 22Telecom Will Prove Resilient
Telecom Will Prove Resilient
Telecom Will Prove Resilient
The profit growth and profit margins of the European communication services sectors are already under duress because pricing power remains negative. Nonetheless, the contraction in relative growth rates of earnings is extended (Chart 22). Telecom revenues did not benefit from a boost when the economy rebounded after the economic contraction in 2020. This stability is now an asset because the sector will not struggle from slowing global economic activity. In this context, the cheap communication services sector remains an attractive defensive play in Europe. Bottom Line: Looking at sectors individually confirms that the outlook for profit growth is worse for cyclicals than it is for defensive stocks. The recent relative strength in industrials and materials earnings is likely to buckle in response to weaker global growth, while the defensive characteristics of healthcare and communication services will shine. Utilities are under stress, as they stand at the confluence of higher energy prices and the explicit desire of politicians to limit the impact of these higher energy costs on households. Favor healthcare and communication services versus utilities and consumer staples. Mathieu Savary, Chief European Strategist Mathieu@bcaresearch.com Footnotes 1 In the case of financials, we use core CPI as a proxy for the sector’s costs. Eurostat does not publish a PPI for the sector and the main costs are related to labor costs. Tactical Recommendations Cyclical Recommendations Structural Recommendations
Listen to a short summary of this report. Executive Summary Second Fastest Hiking Cycle Ever?
Monthly Portfolio Update: Can The Fed Achieve A Soft Landing? Hint: It Doesn’t Have A Good Track Record
Monthly Portfolio Update: Can The Fed Achieve A Soft Landing? Hint: It Doesn’t Have A Good Track Record
Can the Fed achieve a soft landing, bringing inflation back to its 2% target without causing growth to slow significantly below trend? It has managed this only once in the past (in 2004). Every other cycle triggered a recession or, at best, a fall in the PMI to below 50. Recession is not a certainty. A higher neutral rate than in the past – partly due to the build-up of household savings – means the economy may be unusually robust this time. But the risk is high. We recommend a neutral weighting in equities, with a tilt to more defensive positioning: Overweight the US, and a focus on quality and defensive growth sectors. China’s slowdown is particularly worrying. We expect the RMB to fall, which will put downward pressure on other Emerging Markets.
Monthly Portfolio Update: Can The Fed Achieve A Soft Landing? Hint: It Doesn’t Have A Good Track Record
Monthly Portfolio Update: Can The Fed Achieve A Soft Landing? Hint: It Doesn’t Have A Good Track Record
Bottom Line: Investors should maintain low-risk portfolio positioning until the outcome of the sharp tightening of financial conditions is clearer. Recommended Allocation
Monthly Portfolio Update: Can The Fed Achieve A Soft Landing? Hint: It Doesn’t Have A Good Track Record
Monthly Portfolio Update: Can The Fed Achieve A Soft Landing? Hint: It Doesn’t Have A Good Track Record
The key to the performance of financial markets over the next year is whether the Fed and other central banks can kill inflation without killing economic growth. This is not impossible. But the risk that aggressive tightening of monetary policy triggers a recession – or at best a sharp slowdown – is high. Investors should maintain relatively low-risk portfolio positioning. If the Fed raises rates in line with what the futures market is projecting – by 286 basis points over the next 12 months – it will be the second fastest tightening on record, after only the “full Volcker” of 1980-1981 (Chart 1). Other central banks, even in countries and regions with much weaker growth than the US, are predicted to tighten almost as aggressively (Table 1). At the same time, the Fed will start to run down its balance-sheet rapidly; we estimate its holdings of US Treasurys will fall by more than $1 trillion by end-2023 (Chart 2). What was the impact on the economy of previous Fed hiking cycles? It varied, but on only one occasion in the past 50 years (2004) was there neither a recession nor a fall of the Manufacturing ISM to below 50 in the two years or so following the first hike (Table 2).1 The ISM (and other global PMIs) falling to below 50 is important because that is typically the dividing line between equities outperforming bonds and vice versa (Chart 3). Chart 1Second Fastest Hiking Cycle Ever?
Monthly Portfolio Update: Can The Fed Achieve A Soft Landing? Hint: It Doesn’t Have A Good Track Record
Monthly Portfolio Update: Can The Fed Achieve A Soft Landing? Hint: It Doesn’t Have A Good Track Record
Table 1Futures Projected Interest Rate Hikes
Monthly Portfolio Update: Can The Fed Achieve A Soft Landing? Hint: It Doesn’t Have A Good Track Record
Monthly Portfolio Update: Can The Fed Achieve A Soft Landing? Hint: It Doesn’t Have A Good Track Record
Chart 2Fed Balance-Sheet Will Shrink Rapidly Too
Fed Balance-Sheet Will Shrink Rapidly Too
Fed Balance-Sheet Will Shrink Rapidly Too
Table 2What Happened To The Economy In Fed Hiking Cycles
Monthly Portfolio Update: Can The Fed Achieve A Soft Landing? Hint: It Doesn’t Have A Good Track Record
Monthly Portfolio Update: Can The Fed Achieve A Soft Landing? Hint: It Doesn’t Have A Good Track Record
Chart 3Will PMIs Fall Below 50?
Will PMIs Fall Below 50?
Will PMIs Fall Below 50?
A recent paper by Alex Domash and Larry Summers showed that, since 1955, when US inflation was above 4% and unemployment below 5%, there was a 73% probability of recession over the next four quarters, and 100% over the next eight quarters (Table 3). On each of the three occasions when inflation was above 5% and unemployment below 4% (as is the case now), recession followed within a year. How could the Fed avoid a hard landing? Inflation could come down quickly, which would allow the Fed to ease back on tightening. As consumption switches back to services from durables, and the supply side succeeds in increasing production, the price of manufactured goods could fall (Chart 4). There were signs of this happening already in March, when US durables prices fell by 0.9% month-on-month. The problem, however, is that because of rising energy costs and lockdowns in China, the supply-side response has been delayed. The fall in semiconductor and shipping costs, which we previously argued would happen this year, is not yet clearly coming through (Chart 5). There are also signs of a price-wage spiral, with US wages rising (with a lag) in line with prices (Chart 6). Table 3This Level of Inflation And Unemployment Usually Leads To Recession
Monthly Portfolio Update: Can The Fed Achieve A Soft Landing? Hint: It Doesn’t Have A Good Track Record
Monthly Portfolio Update: Can The Fed Achieve A Soft Landing? Hint: It Doesn’t Have A Good Track Record
Chart 4Can The Price Of Durables Now Fall?
Can The Price Of Durables Now Fall?
Can The Price Of Durables Now Fall?
Chart 5Supply-Side Recovery Delayed?
Supply-Side Recovery Delayed?
Supply-Side Recovery Delayed?
The economy could be more robust than in the past, leaving it unscathed by higher rates. Our model of the equilibrium level of short-term rates is 3.2%, well above the Fed’s estimate of 2.4% (Chart 7). Our colleague Peter Berezin has argued that the neutral rate could be as high as 4%.2 In particular, the $2 trillion-plus of excess US household savings (equal to 10% of GDP) could support consumption for some years even if real wage growth is negative (Chart 8). However, there are already signs that higher rates are hurting the housing market, the most interest-rate sensitive part of the economy. The average US 30-year fixed-rate mortgage rate has risen to 5.1% from 3.2% since the start of the year. This is negatively impacting home sales and mortgage applications (Chart 9). Moreover, even if the Fed can succeed in raising rates without killing the expansion, the markets – for a while – will worry that it cannot. Chart 6A Price-Wage Spiral?
A Price-Wage Spiral?
A Price-Wage Spiral?
Chart 7Rates Are Still A Long Way Below Neutral
Rates Are Still A Long Way Below Neutral
Rates Are Still A Long Way Below Neutral
Chart 8Excess Savings Could Support The Economy
Excess Savings Could Support The Economy
Excess Savings Could Support The Economy
Chart 9Higher Rates Already Impacting Home Sales
Higher Rates Already Impacting Home Sales
Higher Rates Already Impacting Home Sales
There are clear signs of a slowdown in the global economy. Europe may already be in recession, with sentiment indicators collapsing to recessionary levels (Chart 10). More esoteric indicators, which have historically signaled slowing growth ahead, such as the Swedish new orders/inventories ratio, are also flashing a warning signal (Chart 11). Global financial conditions have tightened at the fastest pace since 2008 (Chart 12). Corporate earnings forecasts have started to be revised down for the first time in this cycle (Chart 13). Chart 10Is Europe Already In Recession?
Is Europe Already In Recession?
Is Europe Already In Recession?
Chart 1111. Signs Of Trouble Ahead
11. Signs Of Trouble Ahead
11. Signs Of Trouble Ahead
Chart 12Financial Conditions Have Tightened Significantly
Financial Conditions Have Tightened Significantly
Financial Conditions Have Tightened Significantly
Chart 13Corporate Earnings Forecasts Being Revised Down
Corporate Earnings Forecasts Being Revised Down
Corporate Earnings Forecasts Being Revised Down
But what of the argument that investors have already turned ultra-pessimistic and that all the bad news is in the price? Global equities are down only 14% from their historic peak, barely in correction territory. It is true that sentiment (historically a contrarian indicator) is very poor, with twice as many respondents to the American Association of Individual Investors’ weekly survey expecting the stock market to fall over the next six months as expect it to rise (Chart 14). But, despite investor pessimism, there are few signs that investors have made their portfolios more defensive. The same AAII survey shows little decline in equity weightings, and no big shift into cash (Chart 15). Chart 14Investors Are Very Pessimistic...
Investors Are Very Pessimistic...
Investors Are Very Pessimistic...
Chart 15...But Haven't Moved More Defensive
...But Haven't Moved More Defensive
...But Haven't Moved More Defensive
Equities: The US is the best house on a tough street. Growth is likely to remain more robust than in the euro area or Japan. The US stock market has a lower beta (Chart 16). And, while the US is more expensive, valuations do not drive the 12-month relative performance of stocks and, anyway, the US premium valuation can be justified by higher ROE and the lower volatility of profits (Chart 17). Emerging markets continue to look vulnerable to the slowdown in China and tighter US financial conditions (Chart 18). We remain underweight. Chart 16US Stocks Are Lower Risk
US Stocks Are Lower Risk
US Stocks Are Lower Risk
Chart 17US Premium Valuation Is Justified
Monthly Portfolio Update: Can The Fed Achieve A Soft Landing? Hint: It Doesn’t Have A Good Track Record
Monthly Portfolio Update: Can The Fed Achieve A Soft Landing? Hint: It Doesn’t Have A Good Track Record
Chart 18Tightening Financial Conditions Are Bad For EM
Tightening Financial Conditions Are Bad For EM
Tightening Financial Conditions Are Bad For EM
Chart 19Consumer Staples Are Defensive
Consumer Staples Are Defensive
Consumer Staples Are Defensive
Chart 20IT Earnings Will Continue To Grow Strongly
IT Earnings Will Continue To Grow Strongly
IT Earnings Will Continue To Grow Strongly
Within sectors, our preference remains for quality and defensive growth. Consumer staples tend to outperform when PMIs are falling (Chart 19) and are supported by attractive dividend yields. Information Technology is a more controversial overweight, given that it is expensive and sensitive to rising rates. Nevertheless, investment in tech hardware and software is likely to continue, giving the sector strong structural earnings growth in coming years (Chart 20). Currencies: The dollar has risen by 7.3% year-to-date driven by interest-rate differentials and the Fed being expected to be more aggressive than other central banks. But we are only neutral, since the Fed will probably not raise rates by as much as the market is pricing in, and because the dollar looks very overvalued (Chart 21). We lower our recommendation on the Chinese yuan to underweight. Interest-rate differentials with the US clearly point to it falling further – also the outcome desired by the authorities to help bolster growth (Chart 22). The likely CNY weakness will put further downward pressure on other EM currencies, particularly in Asia, given their high correlation to the Chinese currency (Chart 23). Chart 21The Dollar Is Very Overvalued
The Dollar Is Very Overvalued
The Dollar Is Very Overvalued
Chart 22Rate Differentials Point To A Weaker RMB...
Rate Differentials Point To A Weaker RMB...
Rate Differentials Point To A Weaker RMB...
Chart 23...Which Is Bad News For Other EM Currencies
...Which Is Bad News For Other EM Currencies
...Which Is Bad News For Other EM Currencies
Fixed Income: With the 10-year US Treasury yield at 2.9% and that in Germany at 0.9%, there is a stronger argument for marginally raising weightings in government bonds. We are neutral on government bonds within the (underweight) fixed-income category. Remember, though, that real yields are still negative: -0.1% in the US and -2.1% in Germany. We do not expect long-term rates to rise much over the next 6-9 months, and so remain neutral on duration. The “golden rule of bond investing” says that government bond returns are driven by whether the central bank is more or less hawkish than expected over the next 12 months (Chart 24). We would expect the Fed to be slightly less hawkish than currently forecast. US high-yield bonds offer an attractive yield pick-up – as long as US growth does not collapse. In a way, HY bonds are like defensive equities, given their high correlation with equities but beta only one-third that of equities (Chart 25). Chart 24Will The Fed Be More Or Less Hawkish Than Expected?
Will The Fed Be More Or Less Hawkish Than Expected?
Will The Fed Be More Or Less Hawkish Than Expected?
Chart 25High Yield Bonds Are Like MinVol Equities
High Yield Bonds Are Like MinVol Equities
High Yield Bonds Are Like MinVol Equities
Chart 26Russian Oil Is Going Cheap
Russian Oil Is Going Cheap
Russian Oil Is Going Cheap
Commodities: Oil prices are likely to fall back to around $90 a barrel by year-end, as demand softens and increased supply (from Saudi Arabia, UAE, and North American shale, and maybe from Venezuela and Iran) enters the market. But the risk is to the upside if this extra supply does not emerge. In particular, possible bans on Russian oil and gas into the European Union (or Russia blocking sales) could disturb the market. It will take time for Russia’s 11 million b/d of oil production, which used to go mainly to Europe, to be rerouted to Asia. This is why the Urals benchmark is at a 30% discount to Brent (Chart 26). The long-term story for industrial commodities remains good, but there is downside risk – especially for iron ore and steel – from China’s slowdown (Chart 27). Gold is an obvious hedge against geopolitical risks and high inflation. But over the past 20 years, it has been negatively correlated to real interest rates and the US dollar, suggesting upside is capped. There is a chance, however, that the relationship between rates and gold breaks down, as it did in the 1970s and 1980s (Chart 28). We, therefore, remain neutral on gold, believing that a moderate holding is a good diversifier for portfolios. Chart 27Chinese Slowdown Is Negative For Commodities
Chinese Slowdown Is Negative For Commodities
Chinese Slowdown Is Negative For Commodities
Chart 28Will Gold Start To Behave As It Did Before 1990?
Will Gold Start To Behave As It Did Before 1990?
Will Gold Start To Behave As It Did Before 1990?
Garry Evans, Senior Vice President Global Asset Allocation garry@bcaresearch.com Footnotes 1 In 2015, the ISM was already below 50 when the Fed hiked in December. 2 Please see Global Investment Strategy Report, “Is A Higher Neutral Rate Good Or Bad For Stocks?” dated March 18, 2022. Recommended Asset Allocation Model Portfolio (USD Terms)
Listen to a short summary of this report. Executive Summary The Number Of Babies Born In China Has Fallen By Close To 30% Since 2019
The Number Of Babies Born In China Has Fallen By Close To 30% Since 2019
The Number Of Babies Born In China Has Fallen By Close To 30% Since 2019
The number of births collapsed during the pandemic. While the preliminary evidence suggests that fertility rates are starting to recover in most developed economies, they remain well below the level necessary to maintain a stable population. Aging populations are putting strain on pension and health care systems. They are also threatening to undermine geopolitical influence. The conventional wisdom is that there is not much that can be done to lift fertility rates. While it is true that government subsidies to encourage parents to have more children are not especially effective, other policies, such as cheaper child care, are more promising. Rather than discouraging property investment, China is likely to increase housing supply in order to make family formation more affordable. This could boost commodity demand. More contentiously, the use of IVF technologies to select for certain traits such as higher intelligence in children could open up a new front on the geopolitical battlefield that few analysts are expecting. Regardless of government policy, birth rates will eventually rise of their own accord because both cultural and genetic evolution will select for families that wish to have more children. In the long run, faster population growth will lead to stronger corporate sales, which is a plus for equities. Over a shorter-term horizon, however, the global dependency ratio could end up increasing, as the number of retirees rises while the number of children that parents need to support goes up. This could put upward pressure on interest rates and bond yields. Bottom Line: Contrary to popular opinion, global fertility rates may be bottoming and could rise significantly over the long run. While this trend will eventually benefit stocks, it is likely to come at the expense of higher bond yields. Dear Client, We tactically downgraded global equities from overweight to neutral on February 28th. As we discussed last week in our report entitled “Here Comes Goldilocks,” we see a more fortuitous environment emerging in the second half of the year, which suggests that stocks will likely be higher over a 12-month horizon. This week, we step back from recent market action to focus on a long-term investment theme of great importance: demographic change. Contrary to the conventional wisdom that sees birth rates continuing to fall over the next few decades, we argue that developed economies may be on the cusp of a strong and sustained baby boom. I will be visiting clients in the San Francisco Bay Area next week. Instead of our regular report, we will be sending you a Special Report written by Irene Tunkel, BCA’s Chief US Equity Strategist. Irene will discuss inflation regimes and their implications for US equities. Best regards, Peter Berezin, Chief Global Strategist Baby Bust At the start of the pandemic, some speculated that with little else to do, couples would spend more time in bed, leading to a mini baby boom. As it turned out, the exact opposite happened: Birth rates plunged around the world. In the US, the number of babies born in January 2021 was about 10% lower than one would have expected based on the pre-pandemic trend. Similar shortfalls were observed in the UK, France, Italy, Spain, and Japan (Chart 1). In China, the number of births fell by almost 30% between 2019 and 2021 to the lowest level since 1949 (Chart 2). Chart 1The Birth Rate Has Recovered Since The Start Of The Pandemic But Remains Below Levels Consistent With A Stable Population
The Coming Stork Wars
The Coming Stork Wars
Chart 2The Number Of Babies Born In China Has Fallen By Close To 30% Since 2019
The Number Of Babies Born In China Has Fallen By Close To 30% Since 2019
The Number Of Babies Born In China Has Fallen By Close To 30% Since 2019
While the pandemic continues to restrain fertility in China, the latest data from developed economies suggest births have rebounded. Nevertheless, birth rates remain far below the level necessary to maintain stable populations. A recent study in The Lancet estimated that more than three-quarters of countries would have below-replacement fertility rates by the end of the century. The study estimated that the global population would peak at 9.7 billion in 2064 and decline to 8.8 billion by 2100. Alarm Over Low Birth Rates Low birth rates have become a major cause of concern for policymakers. Aging populations are putting strain on pension and health care systems. The OECD expects the old-age dependency ratio to double from 30% to 60% by 2075 (Chart 3). Pension spending in the OECD is projected to rise by 1.4% of GDP over the next 40 years. Chart 3Conventional Forecasts Expect The Population To Grey Over The Coming Decade
The Coming Stork Wars
The Coming Stork Wars
Chart 4The UN Projects China's Working-Age Population Will Shrink By 400 Million Over The Remainder Of The Century
The UN Projects China's Working-Age Population Will Shrink By 400 Million Over The Remainder Of The Century
The UN Projects China's Working-Age Population Will Shrink By 400 Million Over The Remainder Of The Century
Health care spending is likely to grow at an even faster pace. In the US, the Congressional Budget Office sees federal government-financed health care spending rising from 5.7% of GDP to 9.4% of GDP by 2050. As has been the case in Japan and Russia, and could be the case in China, a shrinking population threatens to undermine geopolitical influence. The UN estimates that China’s working-age population will decline from about 1 billion to less than 600 million by the end of the century. By 2100, Nigeria’s working-age population is projected to approach China’s (Chart 4). It is difficult to be an economic and military superpower if you do not have enough workers and soldiers. Pro-Natal Subsidies: Little Bang for the Buck Governments are responding by adopting increasingly aggressive pro-natal policies. According to the UN, more than 50 countries have officially declared their intention to increase fertility rates (Chart 5). Chart 5Governments Are Actively Trying To Raise Fertility Rates
The Coming Stork Wars
The Coming Stork Wars
Chart 6Fertility Rates Keep Dropping In OECD Countries Amid Rising Government Incentives
Fertility Rates Keep Dropping In OECD Countries Amid Rising Government Incentives
Fertility Rates Keep Dropping In OECD Countries Amid Rising Government Incentives
Various European countries, ranging from Estonia, Germany, Greece, Finland, France, Italy, and Lithuania to the UK offer varying bonus payments to new parents. Japan and Singapore both have baby bonus schemes. South Korea, which has the lowest fertility rate in the world, recently increased the reward it pays to mothers from US$500 to US$1,700. The most significant pro-natal shift has come from China. After having officially abandoned its one-child policy in 2016, China announced last year that it will allow couples to have up to three children. We expect China to introduce generous subsidies to encourage childbirth over the next few years. Will such policies arrest the decline in birth rates? There are certainly reasons to be skeptical. Chart 6 shows that spending on family benefits in OECD economies rose from 1.5% to 2.1% of GDP over the past 40 years. Yet, the fertility rate fell from 2.25 to 1.66 over this period. Can Anything Turn the Tide? A number of structural forces have contributed to lower fertility rates. These include increased female labor market participation, readily available birth control, falling child mortality, and rising housing and educational costs. The availability of government-provided income support and health care has also arguably reduced the historic role that children have played in supporting their parents in old age. The conventional wisdom is that these forces will only strengthen in the future, ensuring that fertility rates keep dropping. I am not so sure. Are Children Inferior, Normal, or Veblen goods? While it is rather awkward to think of the decision to have children in economic terms, there is some logic to this approach. Economists tend to distinguish between substitution and income effects. The substitution effect for children is negative: As wages rise, the opportunity cost of having children goes up. In contrast, a number of studies have documented that the income effect is positive: Give a couple an extra $1 million, no strings attached, and that could push them over the line in deciding to have an additional child (in economic parlance, children are “normal” rather than “inferior”). Economists have long known that labor supply curves tend to be “backward bending” (Charts 7A & B). The classic example is that of leisure. As wages initially rise from low levels, people may seek to work more (and hence, consume less leisure). Eventually, however, if wages rise enough, people will cut back on work in order to enjoy the fruits of their labor. Chart 7ABackward-Bending Demand Curves May Also Apply To Children
The Coming Stork Wars
The Coming Stork Wars
Chart 7BLower Child-Rearing Costs Would Improve The Demographic Problem
The Coming Stork Wars
The Coming Stork Wars
The same sort of backward-bending demand curve may apply to children. As wages rise above a certain threshold, parents may decide that they can afford to have more children. Chart 8 shows that the correlation between per capita income and realized fertility has turned positive in developed economies. Chart 8Correlation Between Incomes And Realized Fertility Has Turned Positive In Developed Countries
The Coming Stork Wars
The Coming Stork Wars
Looking out, it is possible that children will become “Veblen” goods, named after nineteenth-century economist Thorstein Veblen, who coined the term “conspicuous consumption.” With many luxury goods now available to the masses, what better way to signal that one has made it to the top than to have five kids in Manhattan or Beverly Hills? How Expensive Are Children, Really? Across most developed economies, women tend to end up having fewer children than they would like (Chart 9). While difficulty in finding a suitable spouse is sometimes cited as a reason, the financial hardship associated with parenting usually ranks higher. Chart 9Most Women Are Having Fewer Children Than They Desire
The Coming Stork Wars
The Coming Stork Wars
Chart 10Depression Rates Among Children And Teenagers Have Been Increasing Over The Past Decade
The Coming Stork Wars
The Coming Stork Wars
According to one recent estimate, it costs nearly $300,000, excluding college tuition, to raise a child in the US. This number, however, is conditional on what society currently deems appropriate for rearing children. If the incremental cost of a child were to decline, the slope of the budget constraint in Chart 7B would become flatter, implying that both the income and substitution effects would reinforce each other in the direction of having more children. Could society eventually conclude that the cost of having a child is not as large as widely perceived? The idea is not as far-fetched as it sounds. Having turned 50 this week, I find it interesting to look back at how much cultural norms towards kids have changed over the past few decades. Growing up in Hamilton Ontario, I remember taking the public bus alone at the age of 10 to school, the pool, or anywhere else I wanted to go. Are kids even allowed to leave the house unattended anymore? As Derek Thompson points out in a recent article in The Atlantic, American parents have nearly doubled the amount of time spent raising their kids. And what has the advent of helicopter parenting achieved? It is difficult to point to any concrete benefits. Depression rates among children and teenagers have soared (Chart 10). While the proliferation of social media has exacerbated childhood angst, the tendency for parents to try to shield their children from hardship and failure has probably only made things worse. Does Schooling Matter Much? Sticking with the issue of schooling, to what extent does the modern parental preoccupation with education actually benefit children? Probably a lot less than parents realize. IQ is highly correlated with educational achievement and many other favorable life outcomes (Chart 11). IQ scores are by far the best predictors of job performance, much better than fashionable concepts such as “emotional intelligence” (Chart 12). Chart 11IQ Tests Don’t Just Measure How Well You Can Do On An IQ Test
The Coming Stork Wars
The Coming Stork Wars
Chart 12Cognitive Ability Matters A Lot For Job Performance
The Coming Stork Wars
The Coming Stork Wars
In healthy, well-nourished populations, genetics explains about 50% of IQ variation at age ten and 80% in adulthood (Chart 13). In fact, IQ is almost as heritable as height (Chart 14). Chart 13The Heritability Of IQ Reaches 80% By Adulthood
The Coming Stork Wars
The Coming Stork Wars
Chart 14IQ Is Almost As Heritable As Height
The Coming Stork Wars
The Coming Stork Wars
When a child suffers from economic or social deprivation, improvements to their environment can have a large positive impact on their cognitive performance. However, beyond a certain environmental threshold, there is not much that parents can do. A recent study concluded that “there is only a marginal and inconsistent influence of parenting on offspring IQ in adolescence and young adulthood.” Table 1A Poisoned Chalice? Genetic Screening Can Raise IQ
The Coming Stork Wars
The Coming Stork Wars
Even musical training, which parents often spend a fortune on, does not appear to generate any knock-on benefits for math or language skills. As much as I hate to say it, the evidence suggests that the most reliable way to enhance a child’s educational prospects is to endow them with high IQ genes. I will not speak to the questionable ethics of doing so, but as I discussed in my report on the rise and fall of human intelligence a few years ago, the technology is coming. Carl Shulman and Nick Bostrom estimate that genetic screening could boost average IQs by up to 65 points in five generations (Table 1). The Stork Wars The ability to engineer high-IQ children through IVF technologies could open up a front on the geopolitical battlefield that few analysts are expecting. Such a battlefield for geopolitical supremacy will take place at a time when China and Russia, on the one side, and much of the West, on the other side, are moving in polar opposite directions on a variety of cultural issues. The empirical evidence suggests that there is a U-shaped relationship between gender equality and fertility rates. Both patriarchal societies, such as those in parts of the Middle East, and egalitarian societies, such as those in Scandinavia, have been able to maintain relatively high fertility levels. Between these two extremes, fertility rates are typically well below replacement. Whereas most Western nationals have sought to promote gender equality in recent years, China and Russia have shifted in a more traditionalist direction. Last April, China’s government shut down a number of feminist social media groups. This followed a statement by China's Education Ministry that the government would seek to “cultivate masculinity.” Boys were becoming “delicate, timid and effeminate,” a key government advisor declared. Ironically, both the traditionalist and egalitarian approaches could lift fertility rates, but at the cost of an ever-wider cleavage in the global culture wars. The Long-Term Outlook for Fertility Rates: Up, Up, and Away? In a world of abundant material resources, a steady or declining population is not an evolutionary stable equilibrium. As long as there are some selection pressures towards having more offspring, in the absence of offsetting forces, evolution will push up fertility rates. In the pre-industrial era, parents with many children often struggled to keep enough food on the table. The correlation between parent and child fertility was close to zero, meaning that children who came from big families did not have more surviving offspring than children from small families. After the Industrial Revolution, the correlation turned positive, and by most indications, has been rising over the past few decades. Were it not for the positive correlation between parent and child fertility, global population levels would be even lower today. How high could birth rates climb if the cultural forces, which have suppressed fertility over the past century, abate? The natural tendency is to think that evolution works too slowly to matter. However, this represents a misreading of the evidence. When there are evolutionary disequilibria – that is, when the environment changes in ways that renders existing reproductivity strategies suboptimal – natural selection can work surprisingly fast. Contrary to the widespread notion that human evolution stopped before the Agricultural Revolution, a recent study in Nature found that 88% of physiological traits have undergone polygenic change during the past 2,000 to 3,000 years. Using plausible estimates of intergenerational fertility correlations, Jason Collins and Lionel Page calibrate a model of global population growth. In contrast to more conventional demographic models, they conclude that global population growth, rather than turning negative later this century, will accelerate. In their baseline model without any heritability effects, the global total fertility rate falls to 1.82 by the end of the century. Once heritability effects are included, the projected total fertility rate rises to 2.21 (Chart 15). The largest effects are for Europe and North America, the first two regions to undertake a demographic transition to (temporarily) low birth rates. The authors see the European median total fertility rate rising to 2.46 by the end of the century, with the North American rate increasing to 2.67. Chart 15Natural Selection Could End Up Boosting Fertility Rates Over The Long Run
The Coming Stork Wars
The Coming Stork Wars
Notably, the support ratio – the ratio of workers-to-consumers – continues to fall in their model over the remainder of the century. They conclude: “Once the increase in number of children is taken into consideration, the higher number of children in the heritability model merely shifts the nature of the burden rather than ameliorating it.” Investment Conclusions The world is at a demographic inflection point. After rising steadily for four decades, the global support ratio has peaked (Chart 16). Baby boomers are beginning to leave the labor market en masse. While they were working, they accumulated a lot of assets. In the US, baby boomers hold more than half of all household wealth (Chart 17). Chart 16Less Workers And More Consumers Over The Next Decades
Less Workers And More Consumers Over The Next Decades
Less Workers And More Consumers Over The Next Decades
Chart 17Baby Boomers Hold More Than Half Of Wealth In The US
The Coming Stork Wars
The Coming Stork Wars
Going forward, rather than working and saving, baby boomers will spend down their wealth. The global pool of savings will shrink, putting upward pressure on equilibrium real interest rates and bond yields. Faced with the prospect of shrinking work forces, strained social security systems, and declining geopolitical influence, countries with low or negative population growth will offer increasingly generous subsidies to encourage couples to have more children. The resulting bigger budget deficits will further drain national savings. In and of themselves, government subsides are unlikely to significantly boost birth rates. More holistic policies will be needed, including steps to reduce the cost of child care and housing. Rather than discouraging property investment, China is likely to increase housing supply in order to make family formation more affordable. This could help support commodity demand. Governments will try to influence the social and cultural narrative on family matters.In some cases, the impact could be quite innocuous, such as China’s decision to ban for-profit tutoring companies in order to ease pressure on students and parents. In other cases, the impact could be very contentious, leading to an escalation in the so-called culture wars. Regardless of the policy measures that governments adopt, birth rates will eventually rise of their own accord because both cultural and genetic evolution will select for families that wish to have more children. In the long run, faster population growth will lead to stronger corporate sales, which is a plus for equities. Over a shorter-term horizon, however, the global dependency ratio could end up increasing, as the number of retirees rises while the number of children that parents need to support goes up. On balance, therefore, we see demographic trends as being somewhat negative for stocks over the next one-or-two decades. Peter Berezin Chief Global Strategist peterb@bcaresearch.com Follow me on LinkedIn Twitter View Matrix
The Coming Stork Wars
The Coming Stork Wars
Special Trade Recommendations Current MacroQuant Model Scores
The Coming Stork Wars
The Coming Stork Wars
Executive Summary German GeoRisk Indicator
German GeoRisk Indicator
German GeoRisk Indicator
Russia and Germany have begun cutting off each other’s energy in a major escalation of strategic tensions. The odds of Finland and Sweden joining NATO have shot up. A halt to NATO enlargement, particularly on Russia’s borders, is Russia’s chief demand. Tensions will skyrocket. China’s reversion to autocracy and de facto alliance with Russia are reinforcing the historic confluence of internal and external risk, weighing on Chinese assets. Geopolitical risk is rising in South Korea and Hong Kong, rising in Spain and Italy, and flat in South Africa. France’s election will lower domestic political risk but the EU as a whole faces a higher risk premium. The Biden administration is doubling down on its defense of Ukraine, calling for $33 billion in additional aid and telling Russia that it will not dominate its neighbor. However, the Putin regime cannot afford to lose in Ukraine and will threaten to widen the conflict to intimidate and divide the West. Trade Recommendation Inception Date Return LONG GLOBAL DEFENSIVES / CYCLICALS EQUITIES 2022-01-20 14.2% Bottom Line: Stay long global defensives over cyclicals. Feature Chart 1Geopolitical Risk And Policy Uncertainty Drive Up Dollar
Geopolitical Risk And Policy Uncertainty Drive Up Dollar
Geopolitical Risk And Policy Uncertainty Drive Up Dollar
The dollar (DXY) is breaking above the psychological threshold of 100 on the back of monetary tightening and safe-haven demand. Geopolitical risk does not always drive up the dollar – other macroeconomic factors may prevail. But in today’s situation macro and geopolitics are converging to boost the greenback (Chart 1). Global economic policy uncertainty is also rising sharply. It is highly correlated with the broader trade-weighted dollar. The latter is nowhere near 2020 peaks but could rise to that level if current trends hold. A strong dollar reflects slowing global growth and also tightens global financial conditions, with negative implications for cyclical and emerging market equities. Bottom Line: Tactically favor US equities and the US dollar to guard against greater energy shock, policy uncertainty, and risk-aversion. Energy Cutoff Points To European Recession Chart 2Escalation With Russia Weighs Further On EU Assets
Escalation With Russia Weighs Further On EU Assets
Escalation With Russia Weighs Further On EU Assets
Russia is reducing natural gas flows to Poland and Bulgaria and threatening other countries, Germany is now embracing an oil embargo against Russia, while Finland and Sweden are considering joining NATO. These three factors are leading to a major escalation of strategic tensions on the continent that will get worse before they get better, driving up our European GeoRisk indicators and weighing on European assets (Chart 2). Russia’s ultimatum in December 2021 stressed that NATO enlargement should cease and that NATO forces and weapons should not be positioned east of the May 1997 status quo. Russia invaded Ukraine to ensure its military neutrality over the long run.1 Finland and Sweden, seeing Ukraine’s isolation amid Russian invasion, are now reviewing whether to change their historic neutrality and join NATO. Public opinion polls now show Finnish support for joining at 61% and Swedish support at 57%. The scheduling of a joint conference between the country’s leaders on May 13 looks like it could be a joint declaration of their intention to join. The US and other NATO members will have to provide mutual defense guarantees for the interim period if that is the case, lest Russia attack. The odds that Finland and Sweden remain neutral are higher than the consensus holds (given the 97% odds that they join NATO on Predictit.org). But the latest developments suggest they are moving toward applying for membership. They fear being left in the cold like Ukraine in the event of an attack. Russia’s response will be critical. If Russia deploys nuclear weapons to Kaliningrad, as former President Dmitri Medvedev warned, then Moscow will be making a menacing show but not necessarily changing the reality of Russia’s nuclear strike capabilities. That is equivalent to a pass and could mark the peak of the entire crisis. The geopolitical risk premium would begin to subside after that. Related Report Geopolitical StrategyLe Pen And Other Hurdles (GeoRisk Update) However, Russia has also threatened “military-political repercussions” if the Nordics join NATO. Russia’s capabilities are manifestly limited, judging by Ukraine today and the Winter War of 1939, but a broader war cannot entirely be ruled out. Global financial markets will still need to adjust for a larger tail risk of a war in Finland/Sweden in the very near term. Most likely Russia will retaliate by cutting off Europe’s natural gas. Clearly this is the threat on the table, after the cutoff to Poland and Bulgaria and the warnings to other countries. In the near term, several companies are gratifying Russia and paying for gas in rubles. But these payments violate EU sanctions against Russia and the intention is to wean off Russian imports as soon as possible. Germany says it can reduce gas imports starting next year after inking a deal with Qatar. Hence Russia might take the initiative and start reducing the flow earlier. Bottom Line: If Europe plunges into recession as a result of an immediate natural gas cutoff, then strategic stability between Russia and the West will become less certain. The tail risk of a broader war goes up. Stay cyclically long US equities over global equities and tactically long US treasuries. Stay long defense stocks and gold. Stay Short CNY At the end of last year we argued that Beijing would double down on “Zero Covid” policy in 2022, at least until the twentieth national party congress this fall. Social restrictions serve a dual purpose of disease suppression and dissent repression. Now that the state is doubling down, what will happen next? The economy will deteriorate: imports are already contracting at a rate of 0.1% YoY. The manufacturing PMI has fallen to 48.1 and the service sector PMI to 42.0, indicating contraction. Furthermore, social unrest could emerge, as lockdowns serve as a catalyst to ignite underlying socioeconomic disparities. Hence the national party congress is less likely to go smoothly, implying that investors will catch a glimpse of political instability under the surface in China as the year progresses. The political risk premium will remain high (Chart 3). Chart 3China's Confluence Of Domestic And Foreign Risk Weighs On Stocks And Currency
China's Confluence Of Domestic And Foreign Risk Weighs On Stocks And Currency
China's Confluence Of Domestic And Foreign Risk Weighs On Stocks And Currency
While Chairman Xi Jinping is still likely to clinch another ten years in power, it will not be auspicious amid an economic crash and any social unrest. Xi could be forced into some compromises on either Politburo personnel or policy adjustments. A notable indicator of compromise would be if he nominated a successor, though this would not provide any real long-term assurance to investors given the lack of formal mechanisms for power transfer. After the party congress we expect Xi to “let 100 flowers bloom,” meaning that he will ease fiscal, regulatory, and social policy so that today’s monetary and fiscal stimulus can work effectively. Right now monetary and fiscal easing has limited impact because private sector actors are averse to taking risk. Easing policy to boost the economy could also entail a diplomatic charm offensive to try to convince the US and EU to avoid imposing any significant sanctions on trade and investment flows, whether due to Russia or human rights violations. Such a diplomatic initiative would only succeed, if at all, in the short run. The US cannot allow a deep re-engagement with China since that would serve to strengthen the de facto Russo-Chinese strategic alliance. In other words, an eruption of instability threatens to weaken Xi’s hand and jeopardize his power retention. While it is extremely unlikely that Xi will fall from power, he could have his image of supremacy besmirched. It is likely that China will be forced to ease a range of policies, including lockdowns and regulations of key sectors, that will be marginally positive for economic growth. There may also be schemes to attract foreign investment. Bottom Line: If China expands the range of its policy easing the result could be received positively by global investors in 2023. But the short-term outlook is still negative and deteriorating due to China’s reversion to autocracy and confluence of political and geopolitical risk. Stay short CNY and neutral Chinese stocks. Stay Short KRW South Koreans went to the polls on March 9 to elect their new president for a five-year term. The two top candidates for the job were Yoon Suk-yeol and Lee Jae-myung. Yoon, a former public prosecutor, was the candidate for the People Power Party, a conservative party that can be traced back to the Saenuri and the Grand National Party, which was in power from 2007 to 2017 under President Lee Myung-bak and President Park Geun-hye. Lee, the governor of the largest province in Korea, was the candidate for the Democratic Party, the party of the incumbent President Moon Jae-in. Yoon won by a whisker, garnering 48.6% of the votes versus 47.8% for Lee. The margin of victory for Yoon is the lowest since Korea started directly electing its presidents. President-elect Yoon will be inaugurated in May. He will not have control of the National Assembly, as his party only holds 34% of the seats. The Democratic Party holds the majority, with 172 out of 300 seats. The next legislative election will be in 2024, which means that President Yoon will have to work with the opposition for a good two years before his party has a chance to pass laws on its own. President-elect Yoon was the more pro-business and fiscally restrained candidate. His nomination of Han Duck-soo as his prime minister suggests that, insofar as any domestic policy change is possible, he will be pragmatic, as Han served under two liberal administrations. Yoon’s lack of a majority and nomination of a left-leaning prime minister suggest that domestic policy will not be a source of uncertainty for investors through 2024. Foreign policy, by contrast, will be the biggest source of risk for investors. Yoon rejects the dovish “Moonshine” policy of his predecessor and favors a strong hand in dealing with North Korea. “War can be avoided only when we acquire an ability to launch pre-emptive strikes and show our willingness to use them,” he has argued. North Korea responded by expanding its nuclear doctrine and resuming tests of intercontinental ballistic missiles with the launch of the Hwasong-17 on March 24 – the first ICBM launch since 2017. In a significant upgrade of North Korea’s deterrence strategy, Kim Yo Jong, the sister of Kim Jong Un, warned on April 4 that North Korea would use nuclear weapons to “eliminate” South Korea if attacked (implying an overwhelming nuclear retaliation to any attack whatsoever). Kim Jong Un himself claimed on April 26 that North Korea’s nuclear weapons are no longer merely about deterrence but would be deployed if the country is attacked. President-elect Yoon welcomes the possibility of deploying of US strategic assets to strengthen deterrence against the North. The hawkish turn is not surprising considering that North-South relations failed to make any substantive improvements during President Moon’s five-year tenure as a pro-engagement president. South Koreans, especially Yoon’s supporters, are split on whether inter-Korean dialogue should be continued. They are becoming more interested in developing their own nuclear weapons or at the very least deploying US nuclear weapons in South Korea. Half of South Korean voters support security through alliance with the US, while a third support security through the development of independent nuclear weapons. The nuclear debate will raise tensions on the peninsula. An even bigger change in South Korea’s foreign policy is its policy towards China. President-elect Yoon has accused President Moon of succumbing to China’s economic extortion. Moon had established a policy of “three No’s,” meaning no to additional THAAD missiles in South Korea, no to hosting other US missile defense systems, and no to joining an alliance with Japan and the United States. By contrast, Yoon’s electoral promises include deploying more THAAD and joining the Quadrilateral Dialogue (US, Japan, Australia, India). Polls show that South Koreans hold a low opinion of all of their neighbors but that China has slipped slightly beneath Japan and North Korea in favorability. Even Democratic Party voters feel more negative towards China. While negative attitudes towards China are not unique to Korea, there is an important difference from other countries: the Korean youth dislike China the most, not the older generations. Negative sentiment is less tied to old wounds from the Korean war and more related to ideology and today’s grievances. Younger Koreans, growing up in a liberal democracy and proud of their economic and cultural success, have been involved in campus clashes against Chinese students over Korean support for Hong Kong democrats. Negative attitudes towards China among the youth should alarm investors, as young people provide the voting base for elections to come, and China is the largest trading partner for Korea. Korea’s foreign policy will hew to the American side, at risk to its economy (Chart 4). Chart 4South Korean Geopolitical Risk Rising Under The Radar
South Korean Geopolitical Risk Rising Under The Radar
South Korean Geopolitical Risk Rising Under The Radar
President-elect Yoon’s policies towards North Korea and China will increase geopolitical risk in East Asia. The biggest beneficiary will be India. Both Korea and Japan need to find a substitute to Chinese markets and labor, which have become less reliable in recent years. South Korea’s newly elected president is aligned with the US and West and less friendly toward China and Russia. He faces a rampant North Korea that feels emboldened by its position of an arsenal of 40-50 deliverable nuclear weapons. The North Koreans now claim that they will respond to any military attack with nuclear force and are testing intercontinental ballistic missiles and possibly a nuclear weapon. The US currently has three aircraft carriers around Korea, despite its urgent foreign policy challenges in Europe and the Middle East. Bottom Line: Stay long JPY-KRW. South Korea’s geopolitical risk premium will remain high. But favor Korean stocks over Taiwanese stocks. Stay Neutral On Hong Kong Stocks Hong Kong’s leadership change will trigger a new bout of unrest (Chart 5). Chart 5Hong Kong: More Turbulence Ahead
Hong Kong: More Turbulence Ahead
Hong Kong: More Turbulence Ahead
On April 4, Hong Kong’s incumbent Chief Executive, Carrie Lam, confirmed that she would not seek a second term but would step down on June 30. John Lee, the current chief secretary of Hong Kong, became the only candidate approved to run for election, which is scheduled to be held on May 8. With the backing of the pro-Beijing members in the Election Committee, Lee is expected to secure enough nominations to win the race. Lee served as security secretary from when Carrie Lam took office in 2017 until June 2021. He firmly supported the Hong Kong extradition bill in 2019 and National Security Law in 2020, which provoked historic social unrest in those years. He insisted on taking a tough security stance towards pro-democracy protests. With Lee in power, Hong Kong will face more unrest and tougher crackdowns in the coming years, which will likely bring more social instability. Lee will provoke pro-democracy activists with his policy stances and adherence to Beijing’s party line. For example, his various statements to the news media suggest a dogmatic approach to censorship and political dissent. With the adoption of the National Security Law, Hong Kong’s pro-democracy faction is already deeply disaffected. Carrie Lam was originally elected as a popular leader, with notable support from women, but her popularity fell sharply after the passage of the extradition bill and National Security Law, as well as her mishandling of the Covid-19 outbreak. Her failure to handle the clashes between the Hong Kong people and Beijing damaged public trust in government. Trust never fully recovered when it took another hit recently from the latest wave of the pandemic. Putting another pro-Beijing hardliner in power will exacerbate the trend. Hong Kong equities are vulnerable not merely because of social unrest. During the era of US-China engagement, Hong Kong benefited as the middleman and the symbol that the Communist Party could cooperate within a liberal, democratic, capitalist global order. Hence US-China power struggle removes this special status and causes Hong Kong financial assets to contract mainland Chinese geopolitical risk. As a result of the 2019-2020 crackdown, John Lee and Carrie Lam were among a list of Hong Kong officials sanctioned by the US Treasury Department and State Department in 2020. Now, after the Ukraine war, the US will be on the lookout for any Hong Kong role in helping Russia circumvent sanctions, as well as any other ways in which China might further its strategic aims by means of Hong Kong. Bottom Line: Stay neutral on Hong Kong equities. Favor France Within European Equities French political risk will fall after the presidential election, which recommits the country to geopolitical unity with the US and NATO and potentially pro-productivity structural reforms (Chart 6). France is already a geopolitically secure country so the reduction of domestic political risk should be doubly positive for French assets, though they have already outperformed. And the Russia-West conflict is fueling a risk premium regardless of France’s positive developments. Chart 6France's Domestic Political Risk Will Subside But Russian War Will Keep Geopolitical Risk Elevated
France's Domestic Political Risk Will Subside But Russian War Will Keep Geopolitical Risk Elevated
France's Domestic Political Risk Will Subside But Russian War Will Keep Geopolitical Risk Elevated
The French election ended with a solid victory for the political establishment as we expected. President Emmanuel Macron gaining 58% of the vote to Marine Le Pen’s 42%. Macron beat his opinion polling by 4.5pp while Le Pen underperformed her polls by 4.5pp. A large number of voters abstained, at 28%, compared to 25.5% in 2017. The regional results showed a stark divergence between overseas or peripheral France (where Marine Le Pen even managed to get over half of the vote in several cases) and the core cities of France (where Macron won handily). Macron had won an outright majority in every region in 2017. Macron did best among the young and the old, while Le Pen did best among middle-aged voters. But Macron won every age group except the 50 year-olds, who want to retire early. Macron did well among business executives, managers, and retired people, but Le Pen won among the working classes, as expected. Le Pen won the lowest paid income group, while Macron’s margin of victory rises with each step up the income ladder. Macron’s performance was strong, especially considering the global context. The pandemic knocked several incumbent parties out of power (US, Germany) and required leadership changes in others (Japan, Italy). The subsequent inflation shock now threatens to cause another major political rotation in rapid succession, leaving various political leaders and parties vulnerable in the coming months and years (Australia, the UK, Spain). Only Canada and now France marked exceptions, where post-pandemic elections confirmed the country’s leader. The Ukraine war constitutes yet another shock but it helped Macron, as Le Pen had objective links and sympathies with Russian President Vladimir Putin. Macron’s timing was lucky but his message of structural reform for the sake of economic efficiency still resonates in contemporary France, where change is long overdue – at least compared with Le Pen’s proposal of doubling down on statism, protectionism, and fiscal largesse. The French middle class was never as susceptible to populism as the US, UK, and Italy because it had been better protected from the ravages of globalization. Populism is still a force to be reckoned with, especially if left-wing populists do well in the National Assembly, or if right-wing populists find a fresher face than the Le Pen dynasty. But the failure of populism in the context of pandemic, inflation, and war suggests that France’s political establishment remains well fortified by the economic structure and the electoral system. Whether Macron can sustain his structural reforms depends on legislative elections to be held on June 12-19. Early projections are positive for his party, which should keep a majority. Macron’s new mandate will help. Le Pen’s National Rally and its predecessors may perform better than in the past but that is not saying much as their presence in the National Assembly has been weak. Bottom Line: France is geopolitically secure and has seen a resounding public vote for structural reform that could improve productivity depending on legislative elections. French equities can continue to outperform their European peers over the long run. Our European Investment Strategy recommends French equities ex-consumer stocks, French small caps over large caps, and French aerospace and defense. Favor Spanish Over Italian Stocks Chart 7Italian And Spanish Political Risk Will Rise But Favor Spanish Stocks
Italian And Spanish Political Risk Will Rise But Favor Spanish Stocks
Italian And Spanish Political Risk Will Rise But Favor Spanish Stocks
What about Spain? It is still a “divided nation” susceptible to a rise in political risk ahead of the general election due by December 10, 2023 (Chart 7). In the past few months, a series of strategic mistakes and internal power struggles have led to a significant decline in the popularity of Spain’s largest opposition party, the People’s Party. Due to public infighting and power struggle, Pablo Casado was forced to step down as the leader of the People’s Party on February 23, as requested by 16 of the party’s 17 regional leaders. It is yet to be seen if the new party leader, Alberto Nunez Feijoo, can reboot People’s Party. The far-right VOX party will benefit from the People Party’s setback. The latter’s misstep in a regional election (Castile & Leon) gave VOX a chance to participate in a regional government for the very first time. Hence VOX’s influence will spread and it will receive greater recognition as an important political force. Meanwhile the ruling Socialist Worker’s Party (PSOE) faces anger from the public amid inflation and high energy prices. However, Spanish Prime Minister Pedro Sanchez’s decision to send offensive military weapons to Ukraine is widely supported among major parties, including even his reluctant coalition partner, Unidas Podemos. The People’s Party’s recent infighting gives temporary relief to the ruling party. The Russia-Ukraine issue caused some minor divisions within the government but they are not yet leading to any major political crisis, as nationwide pro-Ukraine sentiment is largely unified. The Andalusia regional election, which is expected this November, will be a check point for Feijoo and a pre-test for next year’s general election. Andalusia is the most populous autonomous community in Spain, consisting about 17% of the seats in the congress (the lower house). The problem for Sanchez and the Socialists is that the stagflationary backdrop will weigh on their support over time. Bottom Line: Spanish political risk is likely to spike sooner rather than later, though Spanish domestic risk it is limited in nature. Madrid faces low geopolitical risk, low energy vulnerability, and is not susceptible to trying to leave the EU or Euro Area. Favor Spanish over Italian stocks. Stay Constructive On South Africa The political and economic status quo is largely unchanged in South Africa and will remain so going into the 2024 national elections. Fiscal discipline will weaken ahead of the election, which should be negative for the rand, but the global commodity shortage and geopolitical risks in Russia and China will probably overwhelm any negative effects from South Africa’s domestic policies. Rising commodity prices have propped up the local equity market and will bring in much-needed revenue into the local economy and government coffers. But structural issues persist. Low growth outcomes amid weak productivity and high unemployment levels will remain the norm. The median voter is increasingly constrained with fewer economic opportunities on the horizon. Pressure will mount on the ruling African National Congress (ANC), fueling civil unrest and adding to overall political risk (Chart 8). Chart 8South Africa's Political Status Quo Is Tactically Positive For Equities And Currency
South Africa's Political Status Quo Is Tactically Positive For Equities And Currency
South Africa's Political Status Quo Is Tactically Positive For Equities And Currency
Almost a year has passed since the civil unrest episode of 2021. Covid-19 lockdowns have lifted and the national state of disaster has ended, reducing social tensions. This is evident in the decline of our South Africa GeoRisk indicator from 2021 highs. While we recently argued that fiscal austerity is under way in South Africa, we also noted that fiscal policy will reverse course in time for the 2024 election. In this year’s fiscal budget, the budget deficit is projected to narrow from -6% to -4.2% over the next two years. Government has increased tax revenue collection through structural reforms that are rooting out corruption and wasteful expenditure. But the ANC will have to tap into government spending to shore up lost support come 2024. Already, the ANC have committed to maintaining a special Covid-19 social-grant payment, first introduced in 2020, for another year. This grant, along with other government support, will feature in 2024 and possibly beyond. Unemployment is at 34.3%, its highest level ever recorded. The ANC cannot leave it unchecked. The most prevalent and immediate recourse is to increase social payments and transfers. Given the increasing number of social dependents that higher unemployment creates, government spending will have to increase to address rising unemployment. President Cyril Ramaphosa is still a positive figurehead for the ANC, but the 2021 local elections showed that the ANC cannot rely on the Ramaphosa effect alone. The ANC is also dealing with intra-party fighting. Ramaphosa has yet to assert total control over the party elites, distracting the ANC from achieving its policy objectives. To correct course, Ramaphosa will have to relax fiscal discipline. To this outcome, investors should expect our GeoRisk indicator to register steady increases in political risk moving into 2024. The only reason to be mildly optimistic is that South Africa is distant from geopolitical risk and can continue to benefit from the global bull market in metals. Bottom Line: Maintain a cyclically constructive outlook on South African currency and assets. Tight global commodity markets will support this emerging market, which stands to benefit from developments in Russia and China. Investment Takeaways Stay strategically long gold on geopolitical and inflation risk, despite the dollar rally. Stay long US equities relative to global and UK equities relative to DM-ex-US. Favor global defensives over cyclicals and large caps over small caps. Stay short CNY, TWD, and KRW-JPY. Stay short CZK-GBP. Favor Mexico within emerging markets. Stay long defense and cyber security stocks. We are booking a 5% stop loss on our long Canada / short Saudi Arabia equity trade. We still expect Middle Eastern tensions to escalate and trigger a Saudi selloff. Matt Gertken Chief Geopolitical Strategist mattg@bcaresearch.com Jesse Anak Kuri Associate Editor Jesse.Kuri@bcaresearch.com Yushu Ma Research Analyst yushu.ma@bcaresearch.com Guy Russell Senior Analyst GuyR@bcaresearch.com Footnotes 1 The campaign in the south suggests that Ukraine will be partitioned, landlocked, and susceptible to blockade in the coming years. If Russia achieves its military objectives, then Ukraine will accept neutrality in a ceasefire to avoid losing more territory. If Russia fails, then it faces humiliation and its attempts to save face will become unpredictable and aggressive. Strategic Themes Open Tactical Positions (0-6 Months) Open Cyclical Recommendations (6-18 Months) Regional Geopolitical Risk Matrix Geopolitical Calendar
Executive Summary China's Demand Was Very Weak before Lockdowns
China's Demand Was Very Weak Before Lockdowns
China's Demand Was Very Weak Before Lockdowns
The selloff in risk assets is not over. Stay defensive. Stagflation fears will continue gripping financial markets. Global trade volumes are set to contract, but the Fed has little maneuvering room as US core inflation is well above its target. Commodity prices are at an important juncture. The plunge in Chinese material stock prices is a warning sign for global materials because China is by far the largest consumer of raw materials (excluding oil), accounting for about 50-55% of global industrial metal demand. The rally in EM commodity plays like Latin America and South Africa is at risk of a major reversal. Bottom Line: Global equity and credit portfolios should underweight EM equities and credit, respectively. The rally in the US dollar might be the final upleg before a major downtrend sets in. However, this final rally will be considerable, and the greenback will likely overshoot. A buying opportunity in EM local currency bonds will present itself after EM currencies hit a bottom versus the US dollar. Feature Global and EM risk assets will remain under selling pressure. This Charts That Matter report contains charts that will help investors navigate treacherous financial markets by shedding light on the following key issues: How much more downside in stocks? Chart 1 displays EM share prices in USD terms alongside their long-term moving averages. If EM equities break below the current technical support line, the next one implies that there is 20-25% further downside in EM stocks. For the S&P500, the next technical support is at 3650-3750. Our Equity Capitulation Indicators for both the S&P500 and EM stocks remain above their previous (2010-2020) lows (Charts 5 and 6 below). In addition, equity market breadth is deteriorating. Fundamental problems with financial markets are linked to mounting stagflation fears. Global trade volumes are set to contract in H2 due to a decline in US and European household spending on goods ex-autos and a delayed recovery in China as we discussed in last week’s report. In turn, US wage growth is accelerating, which will push up unit labor costs. US core inflation will likely drop due to base effects, but will remain above 3.5-4%, which far exceeds the Fed’s 2-2.25% target. Chart 1EM Share Prices: Their Long-Term Moving Averages Served As A Support In Bear Markets
EM Share Prices: Their Long-Term Moving Averages Served As A Support In Bear Markets
EM Share Prices: Their Long-Term Moving Averages Served As A Support In Bear Markets
Chart 2 illustrates that stagflation fears have already gripped financial markets. Global defensive equity sectors have recently been outperforming global non-TMT stocks despite rising US and global bond yields (Chart 2). This is a major departure from the historical relationship between the two and likely foreshadows a period of continuous Fed tightening despite slower global growth. Global equity managers should favor defensive stocks as they will continue to outperform under the two most likely scenarios: (1) either these stagflation dynamics continue; or (2) a growth scare will dominate, during which US bond yields could drop. Chart 2Does This Divergence From A Historic Correlation Signify Stagflation?
Does This Divergence From A Historic Correlation Signify Stagflation?
Does This Divergence From A Historic Correlation Signify Stagflation?
The US dollar continues to climb, and its strength has recently become very broad-based – extending to commodity currencies and Asian currencies. As we show in Charts 46-48 below, the US dollar has more upside. Commodity prices are at an important juncture. On the one hand, supply shortages and risks to further supply disruptions could continue to support resource prices. On the other hand, demand will disappoint. Shrinking US and European consumer spending on goods ex-autos, contracting Chinese commodity intake and weakness in EM ex-China demand all suggest that global commodity consumption will decline in the months ahead. In our March 10 report, we noted that commodity prices would be volatile and this view has been validated: commodity prices swings have been extreme over the past two months. More recent evidence points to lower resource prices. Chart 3 shows that over the past 200 years raw material prices in real US dollar terms (deflated by US headline CPI) have oscillated around a well-defined downtrend. The pandemic surge in commodity prices has pushed them to two standard deviations above their time-trend. Historically, commodity rallies (and even their secular bull markets) ended when prices reached this threshold. Hence, odds are that industrial commodities might hit a soft spot. Energy prices remain a wild card due to geopolitics. It is critical to note that the raw materials price index shown in Chart 3 does not include energy, gold and semi-precious metals (the footnote of Chart 3 lists commodities included in this aggregate). Chart 3Raw Material Prices (In Real Terms) Are At The Upper End Of A 200-Year Downtrend
Raw Material Prices (In Real Terms) Are At The Upper End Of A 200-Year Downtrend
Raw Material Prices (In Real Terms) Are At The Upper End Of A 200-Year Downtrend
Finally, Chart 4 demonstrates that Chinese materials stocks have plunged. We read this as a warning sign for global materials because China is by far the largest consumer of raw materials (excluding oil), accounting for about 50-55% of global industrial metal demand. Chart 4Chinese Material Stocks Are Signaling Trouble For Global Materials
Chinese Material Stocks Are Signaling Trouble For Global Materials
Chinese Material Stocks Are Signaling Trouble For Global Materials
Investment Recommendations Stay defensive. Global equity and credit portfolios should underweight EM equities and credit, respectively. The rally in the US dollar might be the final upleg before a major downtrend sets in. However, this final rally will likely be considerable, i.e., the greenback will likely overshoot. The CNY has broken down versus the US dollar and our target is 6.70-6.75 for now. A depreciating yuan is bearish for Asian and EM currencies. We continue to recommend short positions in the following EM currencies versus the US dollar: ZAR, COP, PEN, HUF, IDR, PHP and PLN. A buying opportunity in EM local currency bonds will present itself when EM currencies hit a bottom versus the US dollar. Arthur Budaghyan Chief Emerging Markets Strategist arthurb@bcaresearch.com US And EM Equity Capitulation Indicators These indicators have not reached their lows of 2010, 2011, 2018 and 2020. The magnitude of the S&P500 selloffs in 2011 and 2018, were 19.5% and 19.8%, respectively. Hence, our best guess for the size of a S&P500 drawdown in this selloff is about 20%. This puts the potential S&P500 low at 3800-3850. The latter is consistent with the technical support (3-year moving average) that held up in 2011, 2016 and 2018 (Chart 5, top panel). Chart 5
US And EM Equity Capitulation Indicators
US And EM Equity Capitulation Indicators
Chart 6
US And EM Equity Capitulation Indicators
US And EM Equity Capitulation Indicators
Components Of Our US Equity Capitulation Indicator Not all components of our US Equity Capitulation Indicator have reached their previous lows. Odds are that US share prices will drop further. US equity valuations are still expensive, geopolitical risks are elevated, and inflation and inflation expectations are extremely high, which will limit the Fed’s maneuvering room. Chart 7
Components Of Our US Equity Capitulation Indicator
Components Of Our US Equity Capitulation Indicator
Chart 8
Components Of Our US Equity Capitulation Indicator
Components Of Our US Equity Capitulation Indicator
Components Of Our EM Equity Capitulation Indicator Similarly, the components of our EM Equity Capitulation Indicator have not reached their previous lows. The share of industry groups above their 200-day moving average, analysts’ net EPS revisions as well as the momentum and equity sentiment indicators remain above prior troughs. Further downside in EM share prices is likely. Chart 9
Components Of Our EM Equity Capitulation Indicator
Components Of Our EM Equity Capitulation Indicator
Chart 10
Components Of Our EM Equity Capitulation Indicator
Components Of Our EM Equity Capitulation Indicator
S&P500 Overlays With Previous Geopolitical Crises The most recent examples of geopolitical shocks include the Cuban missile crisis in 1962, the oil embargo of 1973 in response to the Yom Kippur War and the Gulf War of 1990. The magnitude of the S&P 500 selloff was 28% in 1962, 23% in 1973 and 20% in 1990. Today, the S&P 500 is down only 12.8% from its peak. Based on the above three profiles, the current selloff in US stocks has further to go. This also means that non-US equities, including EM, will continue to suffer. Chart 11
S&P500 Overlays With Previous Geopolitical Crises
S&P500 Overlays With Previous Geopolitical Crises
Chart 12
S&P500 Overlays With Previous Geopolitical Crises
S&P500 Overlays With Previous Geopolitical Crises
Chart 13
S&P500 Overlays With Previous Geopolitical Crises
S&P500 Overlays With Previous Geopolitical Crises
Table 1
No Relief From Market Blues
No Relief From Market Blues
Various EM Equity Indexes: Deteriorating Breadth Various EM equity indexes have been in a bear market. The deterioration has been broadening as recent leaders such as commodity producers and Taiwanese stocks have been gapping down. Yet, not all bourses are very oversold. We published a Special Report on semiconductors on April 14 arguing that semi stocks face more downside. Share prices of commodity producers have recently corrected, and, as we argue above, odds of a further drop are non-trivial. What are the odds that the overall EM equity index undershoots? See the next section. Chart 14
Various EM Equity Indexes: Deteriorating Breadth
Various EM Equity Indexes: Deteriorating Breadth
Chart 15
Various EM Equity Indexes: Deteriorating Breadth
Various EM Equity Indexes: Deteriorating Breadth
Chart 16
Various EM Equity Indexes: Deteriorating Breadth
Various EM Equity Indexes: Deteriorating Breadth
Chart 17
Various EM Equity Indexes: Deteriorating Breadth
Various EM Equity Indexes: Deteriorating Breadth
EM Undershoot Is Likely Sentiment towards EM equities has fallen significantly, but it is not yet at previous lows. Similarly, there is still room for EM net EPS revisions by bottom-up analysts to fall further. Finally, platinum prices point to more downside in EM non-TMT share prices. Chart 18
EM Undershoot Is Likely
EM Undershoot Is Likely
Chart 19
EM Undershoot Is Likely
EM Undershoot Is Likely
Chart 20
EM Undershoot Is Likely
EM Undershoot Is Likely
EM Bond Yields And Share Prices Historically, rising EM corporate USD bond yields and EM local currency bond yields led to a selloff in EM share prices. Unless EM USD and local currency bond yields start falling on a sustainable basis, EM equities will continue to struggle. Chart 21
EM Bond Yields And Share Prices
EM Bond Yields And Share Prices
Chart 22
EM Bond Yields And Share Prices
EM Bond Yields And Share Prices
Rising US Corporate Bond Yields Are Bearish For US Stocks Rising US corporate borrowing costs point to lower US share prices. Corporate bond yields could increase because of either rising US Treasury yields or widening credit spreads. Furthermore, bearish US equity market technicals are presently reinforcing this downbeat outlook for US stocks. Chart 23
Rising US Corporate Bond Yields Are Bearish For US Stocks
Rising US Corporate Bond Yields Are Bearish For US Stocks
Chart 24
Rising US Corporate Bond Yields Are Bearish For US Stocks
Rising US Corporate Bond Yields Are Bearish For US Stocks
Chart 25
Rising US Corporate Bond Yields Are Bearish For US Stocks
Rising US Corporate Bond Yields Are Bearish For US Stocks
The S&P500 EPS Can Contract Outside Of A Recession Let’s recall what happened in 2000-2001 in the US. Real GDP contracted only slightly, household spending in real terms did not contract at all, and the housing market was booming. Yet, the S&P 500 operating EPS plunged by 30% and the stock index was down by 50%. In 1966, even though real and nominal GDP did not contract, the S&P500 operating EPS shrank by about 5% and share prices fell by 22%. This episode is the best analogy for US economic and financial market dynamics over the near term. Chart 26
The S&P500 EPS Can Contract Outside Of A Recession
The S&P500 EPS Can Contract Outside Of A Recession
Chart 27
The S&P500 EPS Can Contract Outside Of A Recession
The S&P500 EPS Can Contract Outside Of A Recession
US Stagflation Scare US wage growth is accelerating, and unit labor costs are surging. The latter will make inflation sticky and hurt corporate profit margins. Besides, US consumer demand for goods ex-autos will shrink following a two-year period of overspending. This combination will produce a stagflation scare – a period when corporate profits are weak, but the Fed has little maneuvering room as core inflation is well above its target. Chart 28
US Stagflation Scare
US Stagflation Scare
Chart 29
US Stagflation Scare
US Stagflation Scare
Chart 30
US Stagflation Scare
US Stagflation Scare
Chart 31
US Stagflation Scare
US Stagflation Scare
Global Trade Volumes Will Shrink Taiwanese shipments to China – which lead global exports – have started to contract. Korea’s business survey of exporting companies reveals that business conditions deteriorated substantially in April. Global cyclicals have been underperforming global defensives. Finally, early cyclical stocks in the US have sold off and have substantially underperformed domestic defensives. This also points to a slowdown in US growth. Chart 32
Global Trade Volumes Will Shrink
Global Trade Volumes Will Shrink
Chart 33
Global Trade Volumes Will Shrink
Global Trade Volumes Will Shrink
Chart 34
Global Trade Volumes Will Shrink
Global Trade Volumes Will Shrink
Chart 35
Global Trade Volumes Will Shrink
Global Trade Volumes Will Shrink
China’s Economy Requires Much More Aggressive Stimulus In China, monetary and fiscal stimulus have so far been insufficient to produce a major economic recovery given the headwinds from the property sector and the harsh lockdowns. The enacted fiscal stimulus has mainly been for infrastructure spending, and it does not include direct fiscal transfers to households who are losing income due to the lockdown. On the monetary front, the credit impulse – excluding local government bond issuance (which is counted in our fiscal spending impulse) – has barely bottomed. Chart 36
China's Economy Requires Much More Aggressive Stimulus
China's Economy Requires Much More Aggressive Stimulus
Chart 37
China's Economy Requires Much More Aggressive Stimulus
China's Economy Requires Much More Aggressive Stimulus
Chart 38
China's Economy Requires Much More Aggressive Stimulus
China's Economy Requires Much More Aggressive Stimulus
Chart 39
China's Economy Requires Much More Aggressive Stimulus
China's Economy Requires Much More Aggressive Stimulus
China Has Been A Drag On Global Trade Chinese domestic demand was extremely weak even prior to the recent lockdowns in Shanghai. Chinese import volumes of various commodities, machinery, industrials goods and semiconductors were contracting as of March. Lockdowns and associated income/profit losses will further depress domestic demand. Chart 40
China Has Been A Drag On Global Trade
China Has Been A Drag On Global Trade
Chart 41
China Has Been A Drag On Global Trade
China Has Been A Drag On Global Trade
Chinese Property Woes Are Worsening Housing floor space sold in April is down by 50% from a year ago. Households are reluctant to borrow and buy, and property developers’ financing has dried up. All these point to shrinking construction activity. Chart 42
Chinese Property Woes Are Worsening
Chinese Property Woes Are Worsening
Chart 43
Chinese Property Woes Are Worsening
Chinese Property Woes Are Worsening
Chart 44
Chinese Property Woes Are Worsening
Chinese Property Woes Are Worsening
Chart 45
Chinese Property Woes Are Worsening
Chinese Property Woes Are Worsening
The US Dollar Has More Upside Our view on the greenback has played out well, and more upside is likely. The CNY has broken down against the dollar and it will reach at least 6.70-6.75. One exception to a strong US dollar might be the yen, as the trade-weighted yen has fallen to its previous lows. However, a rebound in the yen from current levels requires a stabilization of US bond yields. Chart 46
The US Dollar Has More Upside
The US Dollar Has More Upside
Chart 47
The US Dollar Has More Upside
The US Dollar Has More Upside
Chart 48
The US Dollar Has More Upside
The US Dollar Has More Upside
Chart 49
The US Dollar Has More Upside
The US Dollar Has More Upside
EM Currencies: Do Not Catch A Falling Knife EM currencies remain at risk. They are not cheap, and the recent rebound has faltered with many EM exchange rates unable to break above their technical resistance vis-à-vis the USD. However, we expect the US dollar to top and EM currencies to bottom later this year. Stay tuned. Chart 50
EM Currencies: Do Not Catch A Falling Knife... Yet
EM Currencies: Do Not Catch A Falling Knife... Yet
Chart 51
EM Currencies: Do Not Catch A Falling Knife... Yet
EM Currencies: Do Not Catch A Falling Knife... Yet
EM Credit Markets: More Spread Widening Ahead EM and US credit spreads are not particularly wide and will likely widen further. China’s corporate USD bonds remain in a bear market. The two key drivers of EM credit spreads are the business cycle and exchange rates. EM growth will continue to disappoint, and EM currencies will relapse versus the US dollar. Hence, investors should be patient before buying/overweighting EM credit. Chart 52
EM Credit Markets: More Spread Widening Ahead
EM Credit Markets: More Spread Widening Ahead
Chart 53
EM Credit Markets: More Spread Widening Ahead
EM Credit Markets: More Spread Widening Ahead
Chart 54
EM Credit Markets: More Spread Widening Ahead
EM Credit Markets: More Spread Widening Ahead
Chart 55
EM Credit Markets: More Spread Widening Ahead
EM Credit Markets: More Spread Widening Ahead
EM Domestic Bonds: A Buying Opportunity Down The Road The EM GBI domestic bonds total return index in USD terms has broken down and near-term weakness is likely. Meanwhile, EM local currency bond yields have risen significantly, and they offer good value. That said, a buying opportunity in local currency bonds will transpire only after their currencies bottom. Chart 56
EM Domestic Bonds: A Buying Opportunity Down The Road
EM Domestic Bonds: A Buying Opportunity Down The Road
Chart 57
EM Domestic Bonds: A Buying Opportunity Down The Road
EM Domestic Bonds: A Buying Opportunity Down The Road
No Relief From Market Blues
No Relief From Market Blues
No Relief From Market Blues
No Relief From Market Blues
Footnotes
Highlights All four of our US Equity indicators are currently pointing in a bearish direction. Our Monetary Indicator has fallen to a three decade low, our Technical Indicator has broken into negative territory, our Valuation Indicator still signals extreme equity pricing, and our Speculation Indicator does not yet support a contrarian buy signal. Still, we do not expect a US recession over the coming year, which implies that S&P 500 revenue growth will stay positive. Nonrecessionary earnings contractions are rare, and are almost always associated with a significant contraction in profit margins. Our new profit margin warning indicator currently suggests the odds of falling margins are low, although the risks may rise later this year. Stocks are extremely expensive, but rich valuations are being driven by extremely low real bond yields, rather than investor exuberance. Valuation is unlikely to impact US stock market performance significantly over the coming year unless long-maturity bond yields rise substantially further. Technical analysis of stock prices has a long and successful history at boosting investment performance, which ostensibly suggests that investors should be paying more attention to technical conditions in the current environment. However, technical trading rules have been less helpful in expansionary environments when inflation is above average and when stock prices and bond yields are less likely to be positively correlated (as is currently the case). As such, the recent technical breakdown of the US equity market may simply reflect a reduced signal-to-noise ratio associated with these economic and financial market regimes. For now, we see our indicators as supportive of a cautious, minimally-overweight stance toward stocks within a multi-asset portfolio over the coming 6 to 12 months. Rising odds of a recession, declining profit margins, and a large increase in investor or Fed expectations for the neutral rate of interest are the most significant threats to the equity market, the risks of which should be monitored closely by investors. Feature In Section 1 of our report, we reviewed why a recession in the US is unlikely over the coming 6 to 12 months. However, we also highlighted that the risks to the economic outlook are meaningful and that an aggressively overweight stance toward risky assets is currently unwarranted. During times of significant uncertainty, investors should pay relatively more attention to long-term economic and financial market indicators with a reliable track record. In this report we begin by briefly reviewing the message from our US Equity Indicators, and then turn to a deeper examination of the top-down outlook for earnings, the determinants of rich valuation in the US stock market, and whether investors should rely on technical indicators in the current environment. We conclude that, while an indicator-based approach is providing mixed signals about the US equity market, we generally see our indicators as supportive of a cautious, minimally-overweight stance toward stocks within a multi-asset portfolio. Aside from tracking the risk of a recession, investors should be closely attuned to signs of a contraction in profit margins or shifting neutral rate expectations as a basis to reduce equity exposure to below-benchmark levels. A Brief Review Of Our US Equity Indicators Chart II-1Our Equity Indicators Are Pointing In A Bearish Direction
Our Equity Indicators Are Pointing In A Bearish Direction
Our Equity Indicators Are Pointing In A Bearish Direction
Chart II-1 presents our US Equity Indicators, which we update each month in Section 3 of our report. We highlight our observations below: Chart II-1 shows that our Monetary Indicator has fallen to its lowest level since 1995, when the Fed surprised investors and shifted rapidly in a hawkish direction. The indicator is most acutely impacted by the speed of the rise in 10-year Treasury yields and a massive surge in the BCA Short Rate Indicator to levels that have not prevailed since the late 1970s (Chart II-2). Our Technical Indicator has recently broken into negative territory, which we have traditionally interpreted as a sign to sell stocks. The indicator has been dragged lower by a deterioration in stock market breadth across several tracked measures and by weak sentiment (Chart II-3). The momentum component of the indicator is fractionally positive but is exhibiting clear weakness. Our Valuation Indicator continues to highlight that US equities are extremely overvalued relative to their history, despite the recent sell-off in stock prices. Our Speculation Indicator arguably provides the least negative signal of our four indicators, at least from a contrarian perspective. In Q1 2021, the indicator nearly reached the all-time high set in March 2000, but it has since retreated significantly and has exited extremely speculative territory. While this may eventually provide a positive signal for stocks, equity returns have historically been below average during months when the indicator declines. Thus, the downtrend in the Speculation Indicator still points to weakness in stock prices, at least over the nearer term. Chart II-2Our Monetary Indicator Is Falling In Part Because Of Surging Interest Rate Expectations
Our Monetary Indicator Is Falling In Part Because Of Surging Interest Rate Expectations
Our Monetary Indicator Is Falling In Part Because Of Surging Interest Rate Expectations
Chart II-3All Three Components Of Our Technical Indicator Are Falling
All Three Components Of Our Technical Indicator Are Falling
All Three Components Of Our Technical Indicator Are Falling
In summary, all four of our US Equity indicators are currently pointing in a bearish direction, which clearly argues against an aggressively overweight stance favoring equities within a multi-asset portfolio. At the same time, we reviewed the odds of a US recession over the coming year in Section 1 of our report and argued that a recession is not likely over the coming 12 months. Thus, one key question for investors is whether a nonrecessionary contraction in earnings is likely over the coming year. We address this question in the next section of our report, before turning to a deeper examination of the relative importance of equity valuation and technical indicators. Gauging The Risk Of A Nonrecessionary Earnings Contraction Chart II-4Nonrecessionary Earnings Declines Usually Occur Due To Falling Margins
Nonrecessionary Earnings Declines Usually Occur Due To Falling Margins
Nonrecessionary Earnings Declines Usually Occur Due To Falling Margins
Based on S&P data, there have been five cases since 1960 when 12-month trailing earnings per share fell year-over-year, while the economy continued to expand (Chart II-4). Sales per share growth remained positive in four of these cases (panel 2), underscoring that falling profit margins have been mostly responsible for these nonrecessionary earnings declines. We have noted our concern about how elevated US profit margins have become and have argued that a significant further expansion is not likely to occur over the coming 12-24 months.1 To gauge the risk of a sizeable decline in margins over the coming year, we construct a new indicator based on the seven instances when S&P 500 margins fell outside the context of a recession. This includes two cases when margins fell but earnings did not (because of buoyant revenue growth). We based the indicator on these five factors: Changes in unit labor cost growth to measure the impact of wage costs on firm profitability; Lagging changes in commodity prices as a proxy for material costs; The level of real short-term interest rates as a proxy for borrowing costs; Changes in a sales growth proxy to measure the impact of operating leverage on margins; And changes in the ISM manufacturing index to capture any residual impact on margins from the business cycle. Chart II-5The Odds Of A Nonrecessionary Profit Margin Contraction Are Currently Low
The Odds Of A Nonrecessionary Profit Margin Contraction Are Currently Low
The Odds Of A Nonrecessionary Profit Margin Contraction Are Currently Low
Chart II-5 presents the indicator, which is shaded both for recessionary periods and the seven nonrecessionary margin contraction episodes we identified. While the indicator does not perfectly predict margin contractions outside of recessions, it did signal 50% or greater odds of a margin contraction in four of the seven episodes we examined, and signals high odds of a contraction in margins during recessions. Among the three cases in which the indicator failed to indicate falling margins during an expansion, two of those failures were episodes when earnings growth did not ultimately contract. The inability to explain the 1997-1998 margin contraction is the most relevant failure of the indicator, in addition to two false signals in 1963 and 1988. Still, the approach provides a useful framework to gauge the risk of falling profit margins, and the results provide an interesting and somewhat surprising message about the relative importance of the factors we included. We would have expected that accelerating wages would have been the most significant factor explaining nonrecessionary profit margin declines. Wages were highly significant, but they were the second most important factor behind our sales growth proxy. Lagged commodity prices were the third most significant factor, followed by real short-term interest rates. Changes in the ISM manufacturing index were least significant, underscoring that our sales growth proxy already captures most of the effect of the business cycle on profit margins. This suggests that operating leverage is an important determinant of margins during economic expansions, and that investors should be most concerned about declining profit margins when both revenue growth is slowing significantly and wage growth is accelerating. The indicator currently points to low odds of a nonrecessionary margin contraction, but this is likely to change over the coming year. We expect that all five of the factors will evolve in a fashion that is negative for margins over the coming twelve months: While the pace of its increase is slowing, median wage growth continues to accelerate, even when adjusting for the fact that 1st quartile wage growth is growing at an above-average rate (Chart II-6). Combining the latter with higher odds of at or below-trend growth this year implies that unit labor costs may rise further over the coming twelve months. Analysts expect S&P 500 revenue growth to slow nontrivially over the coming year (Chart II-7). Current expectations point to growth slowing to a level that would still be quite strong relative to what has prevailed over the past decade; however, accelerating wage costs in lockstep with decelerating revenue growth is exactly the type of combination that has historically been associated with falling margins during economic expansions. Chart II-6Wage Growth Is Accelerating...
Wage Growth Is Accelerating...
Wage Growth Is Accelerating...
Chart II-7...And Revenue Growth Is Set To Slow
...And Revenue Growth Is Set To Slow
...And Revenue Growth Is Set To Slow
Although these are less impactful factors, the lagged effect of the recent surge in commodity prices will also weigh on margins over the coming year, as will rising real interest rates and a likely slowdown in manufacturing activity in response to slower goods spending. In addition to our new indicator, we have two other tools at our disposal to track the odds of a decline in profit margins over the coming year. First, Chart II-8 illustrates that an industry operating margin diffusion index does a decent job at leading turning points in S&P 500 profit margins, despite its volatility. And second, Chart II-9 highlights that changes in the sales and profit margin diffusion indexes sourced from the Atlanta Fed’s Business Inflation Expectations Survey have predicted turning points in operating sales per share and margins over the past decade. Chart II-9 does suggest that profit margins may not rise further, but flat margins are not likely to be a threat to earnings growth over the coming year if a recession is avoided (as we expect). Chart II-8Sector Diffusion Indexes Are Not Signaling A Major Warning Sign For Margins...
Sector Diffusion Indexes Are Not Signaling A Major Warning Sign For Margins...
Sector Diffusion Indexes Are Not Signaling A Major Warning Sign For Margins...
Chart II-9...Neither Are The Atlanta Fed Business Sales And Margin Diffusion Indexes
...Neither Are The Atlanta Fed Business Sales And Margin Diffusion Indexes
...Neither Are The Atlanta Fed Business Sales And Margin Diffusion Indexes
The conclusion for investors is that the odds of a decline in profit margins over the coming year are elevated and should be monitored, but are seemingly not yet imminent. In combination with expectations for slowing revenue growth, this implies, for now, that earnings growth over the coming year will be low but positive. Valuation, Interest Rates, And The Equity Risk Premium As noted above, our Valuation Indicator continues to highlight that US Equities are extremely overvalued relative to their history. Our Valuation Indicator is a composite of different valuation measures, and we sometimes receive questions from investors asking about the seemingly different messages provided by these different metrics. For example, Chart II-10 highlights that equity valuation has almost, but not fully, returned to late-1990 conditions based on the Price/Earnings (P/E) ratio, but is seemingly more expensive based on the Price/Book (P/B) and especially Price/Sales (P/S) ratios. In our view, this apparent discrepancy is easily resolved. Relative to the P/E ratio, both the P/B and especially P/S ratios are impacted by changes in aggregate profit margins, which have risen structurally over the past two decades because of the rising share of broadly-defined technology companies in the US equity index (Chart II-11). Barring a major shift in the profitability of US tech companies over the coming year, we do not see discrepancies between the P/E, P/B, or P/S ratios as being particularly informative for investors. As an additional point, we also do not see the Shiller P/E or other cyclically-adjusted P/E measures as providing any extra information about the richness or cheapness of US equities today, as these measures tend to move in line with the 12-month forward P/E ratio (Chart II-12). Chart II-10US Equities Are Extremely Overvalued, Based On Several Valuation Metrics
US Equities Are Extremely Overvalued, Based On Several Valuation Metrics
US Equities Are Extremely Overvalued, Based On Several Valuation Metrics
Chart II-11Tech Margins Have Caused Stocks To Look Especially Expensive On A Price/Sales Basis
Tech Margins Have Caused Stocks To Look Especially Expensive On A Price/Sales Basis
Tech Margins Have Caused Stocks To Look Especially Expensive On A Price/Sales Basis
In our view, rather than focusing on different measures of valuation, it is important for investors to understand the root cause of extreme US equity prices, as well as what factors are likely to drive equity multiples over the coming year. As we have noted in previous reports, the reason that US stocks are extremely overvalued today is very different from the reason for similar overvaluation in the late 1990s. Charts II-13 and II-14 present two different versions of the equity risk premium (ERP), one based on trailing as reported earnings (dating back to 1872), and one based on twelve-month forward earnings (dating back to 1979). Chart II-12The Shiller P/E Ratio Does Not Convey Any 'New' Information About Valuation
The Shiller P/E Ratio Does Not Convey Any 'New' Information About Valuation
The Shiller P/E Ratio Does Not Convey Any 'New' Information About Valuation
Chart II-13The Equity Risk Premium Is In Line With Its Historical Average…
The Equity Risk Premium Is In Line With Its Historical Average
The Equity Risk Premium Is In Line With Its Historical Average
The ERP accounts for the portion of equity market valuation that is unexplained by real interest rates, and the charts highlight that the US ERP is essentially in line with its historical average based on both measures, in sharp contrast to the stock market bubble of the late 1990s. This underscores that historically low interest rates well below the prevailing rate of economic growth are the root cause of extreme equity overvaluation in the US (Chart II-15), meaning that very rich pricing can be thought of as “rational exuberance.” Chart II-14…In Sharp Contrast To The Late 1990s
...In Sharp Contrast To The Late 1990s
...In Sharp Contrast To The Late 1990s
Chart II-15US Equities Are Extremely Expensive Because Bond Yields Are Extremely Low
US Equities Are Extremely Expensive Because Bond Yields Are Extremely Low
US Equities Are Extremely Expensive Because Bond Yields Are Extremely Low
Chart II-16The Equity Risk Premium Is Fairly Well Explained By The Misery Index
The Equity Risk Premium Is Fairly Well Explained By The Misery Index
The Equity Risk Premium Is Fairly Well Explained By The Misery Index
Over the longer term, the risks to US equity valuation are clearly to the downside, as we detailed in our October 2021 report.2 But over the coming 6 to 12 months, US equity multiples are likely to be flat or modestly up in the US. As we noted in Section 1 of our report, a significant further rise in long-maturity bond yields will likely necessitate a major shift in neutral rate expectations on the part of investors and the Fed, which we think is more likely a story for next year than this year. And Chart II-16 highlights that the ERP has historically been well explained by the sum of unemployment and inflation (the Misery Index), which should come down over the coming several months as inflation moderates and the unemployment rate remains low. To conclude, it is absolutely the case that US equities are extremely expensive, but this fact is unlikely to impact US stock market performance significantly unless long-maturity bond yields rise substantially further. Technical Analysis Amid A Shifting Economic Regime Technical analysis of financial markets, and especially stocks, has a long history. It has also provided disciplined investors with significant excess returns over time. A simple stock / bond switching rule based on whether stock prices were above their nine-month moving average at the end of the previous month has significantly outperformed since the 1960s, earning an average excess annual return of 1.3% relative to a 60/40 stock/bond benchmark portfolio (Chart II-17). This outsized performance has come at the cost of only a minor increase in portfolio volatility. Ostensibly, then, investors should be paying more attention to equity technical conditions in the current environment, which we noted above are not positive. Our Technical Indicator has recently broken into negative territory, and the S&P 500 has clearly fallen back below its 200-day moving average. However, Chart II-17 presented generalized results over long periods of time. Over the past two decades, investors have been able to rely on a durably negative correlation between stock prices and bond yields to help boost portfolio returns from technically-driven switching rule strategies. Chart II-18 highlights that this correlation has been much lower over the past two years than has been the case since the early 2000s, raising the question of whether similar switching strategies are viable today. In addition, there is the added question of whether technical analysis is helpful to investors during certain types of economic and financial market regimes, such as high inflation environments. Chart II-17Technically-Driven Trading Rules Have Historically Provided Investors With A Lot Of Alpha
Technically-Driven Trading Rules Have Historically Provided Investors With A Lot Of Alpha
Technically-Driven Trading Rules Have Historically Provided Investors With A Lot Of Alpha
Chart II-18Switching-Rule Strategies May Not Work As Well When Stock Prices And Bond Yields Are Not Positively Correlated
Switching-Rule Strategies May Not Work As Well When Stock Prices And Bond Yields Are Not Positively Correlated
Switching-Rule Strategies May Not Work As Well When Stock Prices And Bond Yields Are Not Positively Correlated
To test whether the message from technical indicators may be relied upon today, we examine the historical returns from a technically-driven portfolio switching strategy during nonrecessionary months under four conditions that reflect the economic and political realities currently facing investors: months when both stock and bond returns are negative; months of above-average inflation; months of above-average geopolitical risk; and the 1970s, when the Misery Index was very elevated. In all the cases we consider, the switching rule is simple: whether the S&P 500 index was above its nine-month moving average at the end of the previous month. If so, the rule overweights equities for the subsequent months; if not, the rule overweights a comparatively risk-free asset. We consider portfolios with either 10-year Treasurys or 3-month Treasury bills as the risk-free asset, as well as a counterfactual scenario in which cash always earns a 1% annual rate of return (to mimic the cash returns currently available to investors). Table II-1 presents the success and whipsaw rate of the trading rule. Table II-2 presents the annualized cumulative returns from the strategy. The tables provide three key observations: As reflected in Chart II-17, both Tables II-1 and II-2 highlight that simple technical trading rules have historically performed well, and that outperformance has occurred in both recessionary and nonrecessionary periods. Relative to nonrecessionary periods overall, technical trading rules have underperformed during the particular nonrecessionary regimes that we examined. It is the case not only that these strategies have performed in inferior ways during these regimes, but also that they were less consistent signals in that they generated significantly more “whipsaws” for investors. Among the four nonrecessionary regimes that we tested, technical indicators underperformed the least during periods of above-average geopolitical risk, and performed abysmally during nonrecessionary (but generally stagflationary) months in the 1970s. Table II-1During Expansions, Technically-Driven Switching Rules Underperform…
May 2022
May 2022
Table II-2…When Inflation Is High And When Stocks And Bonds Lose Money
May 2022
May 2022
The key takeaway for investors is that technical analysis is likely to be helpful for investors to improve portfolio performance as we approach a recession but may be less helpful in an expansionary environment in which inflation is above average and when stock prices and bond yields are less likely to be positively correlated. Investment Conclusions Echoing the murky economic outlook that we detailed in Section 1 of our report, our analysis highlights that an indicator-based approach is providing mixed signals about the US equity market. On the one hand, all four of our main equity indicators are currently providing a bearish signal, and the risk of a nonrecessionary contraction in S&P 500 profit margins over the coming year is elevated – albeit seemingly not imminent. On the other hand, our expectation that the US will not slip into recession over the coming year implies that revenue growth will stay positive, which has historically been associated with expanding earnings. In addition, US equity multiples are likely to be flat or modestly up, and the recent technical breakdown in the S&P 500 may simply reflect a reduced signal-to-noise ratio that appears to exist in expansionary environments in which inflation is high and the stock price / bond yield correlation is near-zero or negative. Netting these signals out, we see our equity indicators as supportive of a cautious, minimally-overweight stance toward stocks within a multi-asset portfolio. The emergence of a recession, declining profit margins, and a significant increase in investor or Fed expectations for the neutral rate of interest are the most significant threats to the equity market. We will continue to monitor these risks and adjust our investment recommendations as needed over the coming several months. Stay tuned! Jonathan LaBerge, CFA Vice President The Bank Credit Analyst Gabriel Di Lullo Research Associate Footnotes 1 Please see The Bank Credit Analyst “OUTLOOK 2022: Peak Inflation – Or Just Getting Started?” dated December 1, 2021, available at bca.bcaresearch.com 2 Please see The Bank Credit Analyst “The “Invincible” US Equity Market: The Longer-Term Outlook For US Stocks In Relative And Absolute Terms,” dated September 30, 2021, available at bca.bcaresearch.com