Equities
Netflix delivered a sobering account of its Q1 performance and outlook at its earnings call on Tuesday. The tech giant lost 200,000 subscribers in the first quarter – the first decline in customers since 2011. Moreover, the company expects to lose another two…

Last week marked the beginning of the 2021 Q1 earnings season, with the largest money center banks reporting. We will publish an in-depth analysis of the bank earnings on Monday, April 25, 2022, together with our colleagues from the US Investment Strategy team. This week, 69 companies are reporting. In terms of market expectations: Quarter-on-Quarter earnings growth is expected to be -5% (Chart 1). Similar to previous quarters, we may expect a high number of earnings and sales beats. However, it is forward guidance that will matter. Chart 1
How High Is The Bar Set?
How High Is The Bar Set?
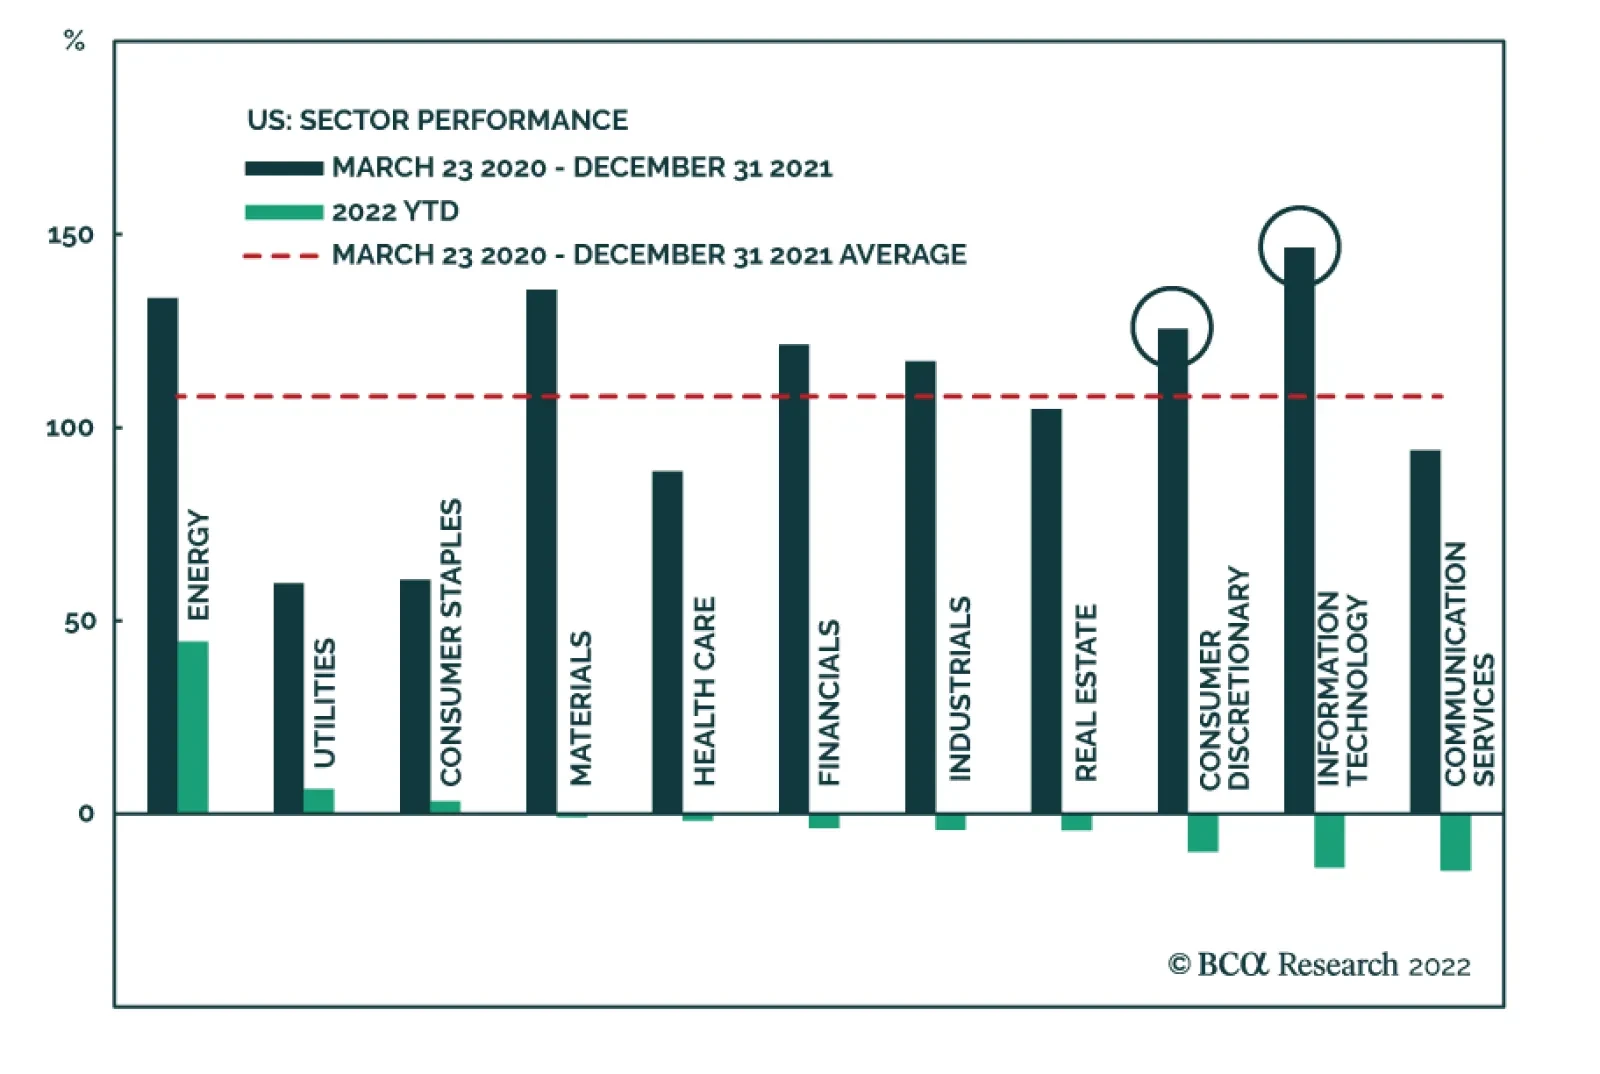
Year-on-year earnings growth is expected to be 6.3% and 0.7% excluding the Energy sector Year-on-year revenue is expected to be 10.9%. Excluding the energy sector, the growth estimate is 8.3%. Clearly, analysts expect increasing cost pressures to take their toll on corporate profitability. There is a wide dispersion in sector-level expectations (Table 1). Commodity sectors, such as Energy and Materials are expected to deliver the highest rates of earnings growth, driven by the shortages, exacerbated by the indirect effects of the war in Ukraine. These are also the best-performing sectors YTD. Technology and Healthcare are expected to deliver strong earnings and sales growth, and so far appear to be immune to slowing growth and inflationary pressures. Earnings of the Consumer Discretionary sector are expected to contract as a result of soaring prices of food and energy, that sap consumer confidence and cut into discretionary spending. In addition, demand for durable goods was pulled forward by the pandemic and is now waning. The Financials sector is expected to experience a sharp drop in earnings. Based on the earnings commentary of the largest banks that have reported so far (JPM, BAC, WFC, C, and MS), there are significant headwinds, which were widely anticipated. A major drought in deal flow and slowing growth decreased demand for loans. On the bright side, banks with sizeable loan books announced that they expect net interest margins to expand. Table 1
How High Is The Bar Set?
How High Is The Bar Set?
Bottom Line: We continue monitoring 2022 Q1 earnings season for any anomalous results to gauge the health of the US corporations.
According to BCA Research’s European Investment Strategy service, European cyclicals remain vulnerable as they have not reached the kind of valuation discount necessary to compensate investors for weaker growth and tighter monetary policy. The global…
Dear Client, Next week, there will not be a written European Investment Strategy report; instead we will host a Webcast on April 26 with Chester Ntonifor, BCA’s Foreign Exchange Strategist. Regards, Mathieu Savary Executive Summary Cyclicals Are Not Cheap Enough
Cyclicals Are Not Cheap Enough
Cyclicals Are Not Cheap Enough
Global growth remains fragile as China’s economy becomes increasingly affected by COVID containment measures. The US economy is likely to slow down significantly in the coming months, while Europe flirts with a recession. This time around, monetary policy is unlikely to provide a relief valve. While European equities may inch higher in the coming months, cyclical stocks do not offer the necessary valuation discount relative to defensive equities to compensate investors against these risks. Heed the rotational patterns to guide near-term country and sector allocation. The French election remains an important source of risk, even though President Emmanuel Macron is still the favorite. Bottom Line: Maintain a modest positive bias toward equities, but overweight defensive stocks at the expense of cyclicals. Focus on short-term capital protection by favoring small-cap over momentum stocks, materials over energy, and UK equities over French ones. Chart 1So Far, Defensives Win
Plenty Of Risks For Cyclical Stocks
Plenty Of Risks For Cyclical Stocks
European equities have experienced a very volatile first quarter, with a maximum drawdown of nearly 23%. Since their March 7th low, they have rebounded 18% but remain 13% below the January 5th high. Apart from the energy sector, defensives have been running the show so far this year (Chart 1). We wrote four weeks ago that the European market is likely to have made its low for the year, but that the volatility of the first quarter of 2022 is likely to continue. We still hold this view. For now, we recommend investors stay long European equities, but defensive sector and country stances are appropriate. Cyclical stocks have corrected, but front-loaded global economic risks create additional downside. Economic Risks Abound The global economic environment remains fragile as headwinds continue to build. Cyclical equities do not seem to have fully discounted this threat. China’s economic outlook constitutes the first hindrance to global growth. COVID cases in Shanghai are surging and many Chinese cities are also witnessing an acceleration in new cases (Chart 2). The Communist Party is still adamant about its zero-tolerance policy, which suggests that these severe lockdowns will become the norm around the country. This situation creates significant downside for Chinese domestic demand, which will prompt a growth slowdown. The service sector is already feeling the pain from the lockdowns. The March import numbers also highlight an abrupt slowdown in the goods sector (Chart 3). In CNY terms, imports contracted 1.7% annually. This is a nominal number. Both global goods and commodity inflation are elevated, and thus, import volumes are weakening sharply. Furthermore, a recent Reuters article indicated that Chinese crude oil imports have already contracted 14% annually. Chart 2China's COVID Problem
China's COVID Problem
China's COVID Problem
Chart 3Slowing Chinese Domestic Demand
Slowing Chinese Domestic Demand
Slowing Chinese Domestic Demand
Chart 4Declining Shipping Costs, But For How Long?
Declining Shipping Costs, But For How Long?
Declining Shipping Costs, But For How Long?
China’s COVID policy also risks adding new supply chain bottlenecks. Freight within the country is grinding to a halt and ships are queuing up outside the port of Shanghai. As lockdowns multiply around China, risks to global supply chains will increase, hence, the recent decline in shipping rates out of China may soon be undone (Chart 4). This represents a major risk for the global economy, as it would tighten constraints to global economic activity. It also threatens European profitability, as PPI inflation would outpace CPI inflation for longer than anticipated (Chart 4, bottom panel). The US also shows signs of weakness. While a US recession is unlikely, a meaningful deceleration is probable. US consumers are feeling the pinch from surging food and energy prices. Consequently, real wages are contracting 1.8% annually and consumer confidence has plunged (Chart 5). Thankfully, US households have accumulated $185 billion in excess savings since the pandemic began and their net worth has increased by $33 trillion, which should prevent a complete meltdown. Nevertheless, a further deterioration in retail sales is still very likely. Businesses are also increasingly worried. The March NFIB survey shows that Small Business Optimism is falling quickly and that few companies believe it is a good time to expand (Chart 5, bottom panel). Adding to these stresses, the most cyclical sector of the US economy is weakening rapidly. The recent rise in US mortgage rates to 5% is causing a collapse in mortgage applications for house purchases and is behind the 30% tumble suffered by homebuilder stocks (Chart 6). Chart 5US Confidence Is Falling
US Confidence Is Falling
US Confidence Is Falling
Chart 6Tarnished US Housing Outlook
Tarnished US Housing Outlook
Tarnished US Housing Outlook
Europe is in a situation worse than the US and is at risk of a recession in the first half of 2022, or, at least, a very severe growth slowdown. As we highlighted six weeks ago, the energy shock in Europe is larger than it is in the US; moreover, Europe does not enjoy the counterweight of a large commodity sector. Recent data confirm that a slowdown is imminent. The ZEW Expectations survey, the German Ifo, and the European Commission’s Consumer Confidence data are all collapsing, which is consistent with a severe shock (Chart 7). To add insult to injury, bond yields continue to rise; therefore, the only relief valve for the region is a weak currency. Global monetary policy is unlikely to come to the rescue of investors anytime soon. The Fed began lifting rates in March and, if the actions of the Bank of Canada and the Reserve Bank of New Zealand are any indication, the FOMC will increase rates by 50bps in May. The OIS curve expects a Fed Funds rate at 2.2% by year-end, which seems appropriate. With a backdrop of weakening growth, a flat yield curve and an additional increase in real rates will feed risk aversion, especially against the cyclical sectors of the market (Chart 8). Chart 7Severe Slowdown In Europe... Or Worse
Severe Slowdown In Europe... Or Worse
Severe Slowdown In Europe... Or Worse
Chart 8Slowing Growth Meets Higher Real Rates
Slowing Growth Meets Higher Real Rates
Slowing Growth Meets Higher Real Rates
The liquidity tightening is not a phenomenon unique to the US. 63% of global central banks have removed monetary accommodation over the past three months (Chart 9). Moreover, our BCA Monetary Index continues to deteriorate. While we cannot characterize global monetary policy as being anywhere close to tight right now, cyclical equities remain vulnerable to the liquidity slowdown. Bottom Line: The global economy is likely to deteriorate in the coming months. The impact of COVID-19 on Chinese growth will only increase, while Europe flirts with a recession in the first half of the year. Meanwhile, US growth faces swelling headwinds. Expect a meaningful deterioration in global economic surprises (Chart 10). In this context, tighter policy will feed risk aversion, which will create a particularly strong headwind for cyclical stocks. Chart 9A Global Tightening
A Global Tightening
A Global Tightening
Chart 10Economic Surprises Will Fall
Economic Surprises Will Fall
Economic Surprises Will Fall
European Cyclicals Remain Vulnerable This backdrop is not equity-friendly and points to meagre returns over the next three to six months. Nonetheless, European stocks will not generate negative returns over this time frame because European benchmarks already discount a significant portion of the negative news, as illustrated by the surge in their earnings yield (Chart 11). Importantly, inflation in Europe should peak over the summer as the commodity impulse is decelerating (Chart 11, bottom panel). Therefore, fears of stagflation will recede, which will help aggregate European shares (Chart 12). Chart 11European Stocks Already Discount A Lot
European Stocks Already Discount A Lot
European Stocks Already Discount A Lot
Chart 12Ebbing Stagflation Fears Will Help European Equities
Ebbing Stagflation Fears Will Help European Equities
Ebbing Stagflation Fears Will Help European Equities
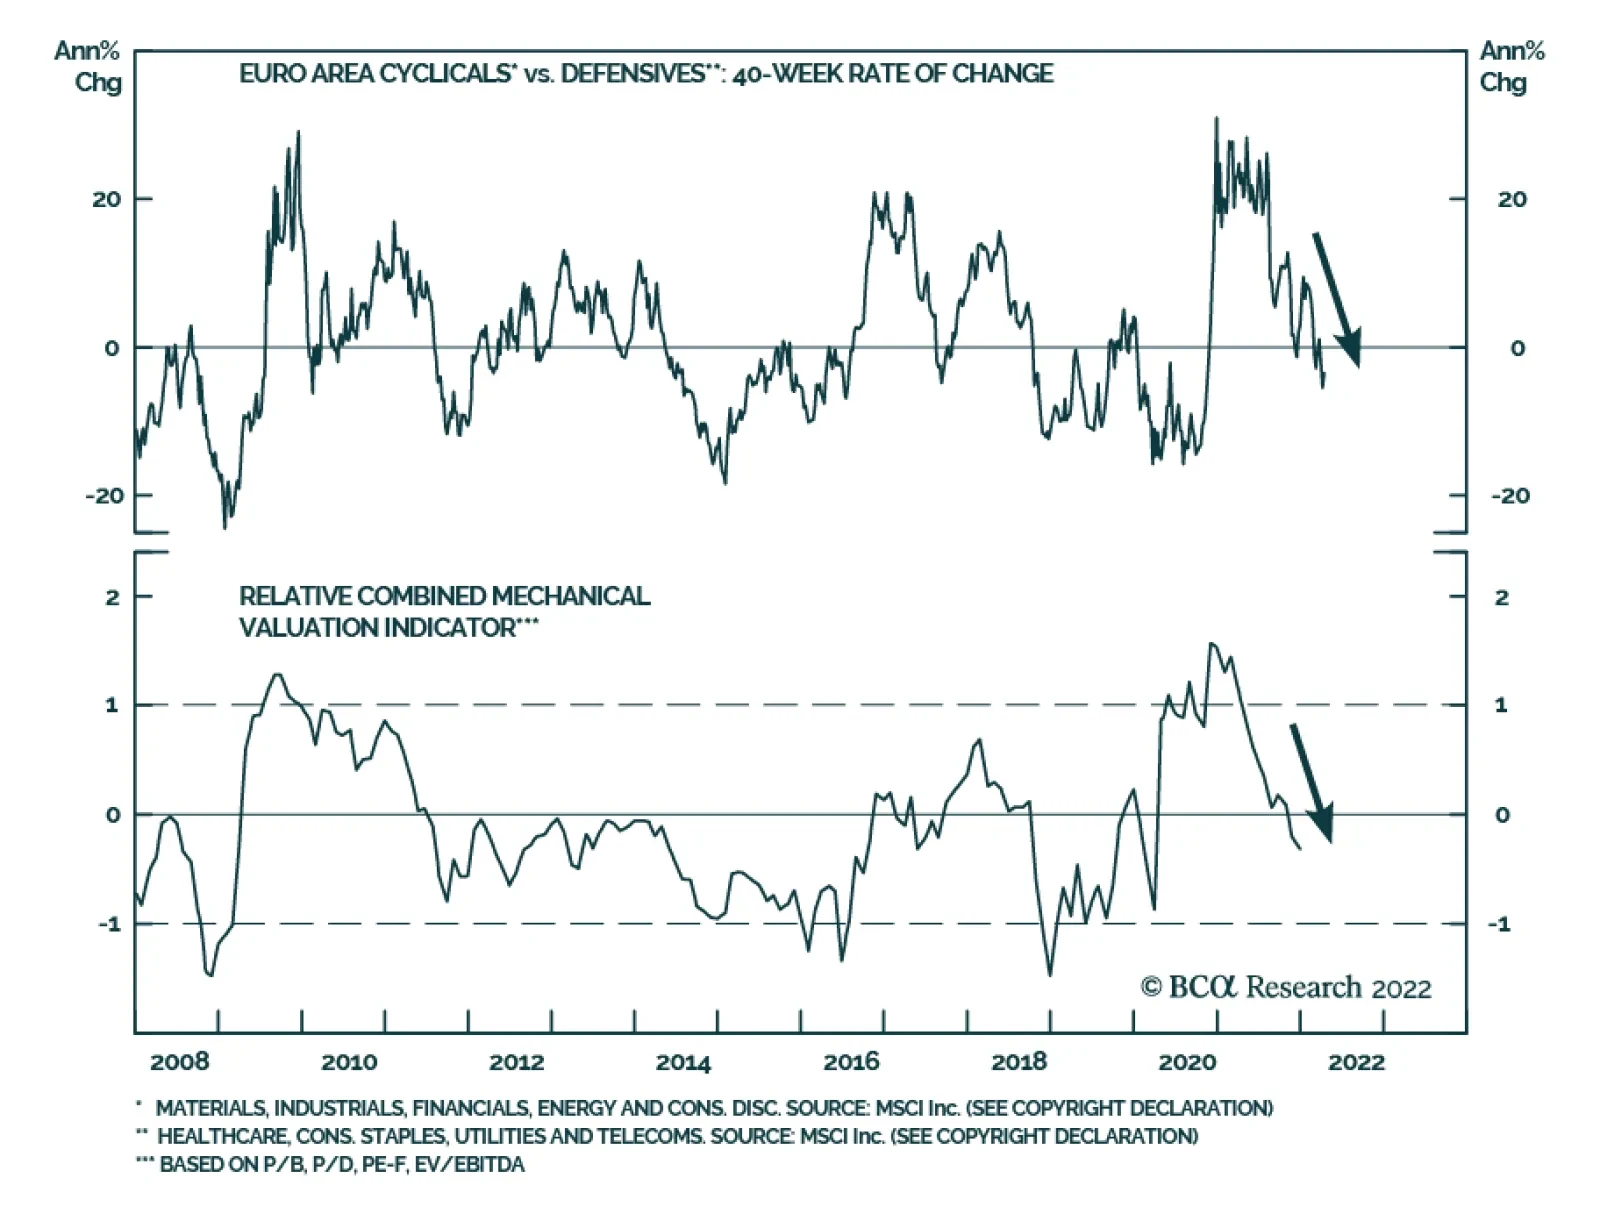
The consequence of the additional slowdown in global growth is likely to be reflected in the relative performance of European cyclical sectors. Already, Swedish economic growth and asset prices have deteriorated (Chart 13). This poor performance does not bode well for cyclical assets, considering the heightened sensitivity of Swedish assets to the global industrial cycle. More signals point to downside for the cyclical/defensive split. While the short-term momentum of the performance of cyclicals relative to defensives is becoming oversold, its 40-week rate of change has yet to reach a paroxysm (Chart 14). Additionally, cyclicals have not experienced the kind of valuation discount associated with a full discounting of the economic and monetary headwinds described in the previous section (Chart 14, bottom panel). Chart 13Heed Sweden's Message
Heed Sweden's Message
Heed Sweden's Message
Chart 14Cyclicals Are Not Cheap Enough
Cyclicals Are Not Cheap Enough Cyclicals Are Not Cheap Enough
Cyclicals Are Not Cheap Enough Cyclicals Are Not Cheap Enough
The commodity sector is also at risk of a pullback. China’s economic slowdown is likely to hurt commodity demand. While this will not end the secular commodity bull market underpinned by a lack of supply capacity, it could easily cause a significant correction in commodity prices. If, as we anticipate, inflation slows this summer, the inflation-hedging demand for commodities will also pause. These dynamics would hurt mining stocks, which have avoided a serious pullback, as well as the energy sector. Thus, a correction in commodities would cause additional weaknesses for the cyclicals-to-defensives ratio (Chart 15). Yields create a supplemental risk. Historically, rising US yields and inflation expectations correlate with an outperformance of cyclical shares. However, in 2022, cyclicals have bifurcated from yields and CPI swaps (Chart 16), because higher yields currently do not signal reflation but stagflation. If yields rise further, it will hurt growth prospects and damage cyclicals. If they fall, it will likely reflect increasing growth fears, which is also negative for cyclicals. Moreover, falling yields will hurt the profit margins of financials, which are a large component of cyclicals. Therefore, cyclicals seem stuck in a lose-lose situation with respect to yields. Chart 15The Commodity Link
The Commodity Link
The Commodity Link
Chart 16Yields and Cyclicals: A Lose-Lose Proposition
Yields and Cyclicals: A Lose-Lose Proposition
Yields and Cyclicals: A Lose-Lose Proposition
The strength in the dollar creates the last major hurdle for cyclicals. A strong dollar both tightens global financials conditions and indicates weak growth ahead. Consequently, it often heralds a period of softness in the cyclicals-to-defensives ratio (Chart 17). How should investors position themselves? We have a long-held preference for telecommunication services stocks over consumer discretionary equities and for healthcare relative to tech shares. These trades have respectively generated hefty gains of 32% and 13% since June 2021, but they are becoming long in the tooth (Chart 18). Chart 17A Strong Dollar Hurts Cyclicals
A Strong Dollar Hurts Cyclicals
A Strong Dollar Hurts Cyclicals
Chart 18Hedges Have Performed Strongly
Hedges Have Performed Strongly
Hedges Have Performed Strongly
Related Report European Investment StrategyThe Great Rotation As an alternative, we recommend investors stay nimble and use our Excess Returns Rotation Approach expanded in a Special Report two months ago. Below, you will find the new trades suggested by this process. Bottom Line: Cyclicals remain vulnerable. They have not reached the kind of valuation discount necessary to compensate investors for weaker growth and tighter monetary policy. To hedge against these risks, we recommended selling consumer discretionary relative to telecom stocks and tech shares relative to healthcare. However, investors should not add to those trades to mitigate against further weaknesses in cyclical stocks. Instead, investors should focus on relative rotational patterns (see next section). Mathieu Savary, Chief European Strategist Mathieu@bcaresearch.com Excess Returns Rotation Maps: An Update1 European Investment Styles The most noteworthy move comes from small-cap stocks, going from the “Lagging” quadrant to the “Leading” one rapidly (Chart 19). This is consistent with our view that European small-cap equities’ outperformance has further to run. The attractiveness of value stocks is thinning relative to growth stocks (Table 1). Chart 19Relative Rotation Graph: European Investment Styles
Plenty Of Risks For Cyclical Stocks
Plenty Of Risks For Cyclical Stocks
Table 1European Investment Styles Positioning
Plenty Of Risks For Cyclical Stocks
Plenty Of Risks For Cyclical Stocks
Trade Recommendations (12-Month Horizon): Volatility stocks relative to momentum (unchanged) Small-cap stocks relative to momentum (new) European Sectors Chart 20 illustrates the wild ride in European equity markets in the wake of the Ukraine/Russia conflict. Most sectors experienced violent swings, moving rapidly across several quadrants. Only consumer discretionary, tech, and utilities stocks have remained in the same quadrant, the former two in “Lagging” and the latter in “Leading.” Interestingly, the European energy sector has moved into the “Weakening” quadrant (Table 2). We are taking profit on our Long Energy / Short Financials recommendation. It delivered 14% returns since mid-February and is getting long in the tooth. Chart 20Relative Rotation Graph: European Sectors
Plenty Of Risks For Cyclical Stocks
Plenty Of Risks For Cyclical Stocks
Table 2European Sectors Positioning
Plenty Of Risks For Cyclical Stocks
Plenty Of Risks For Cyclical Stocks
Trade Recommendations (12-Month Horizon): Materials over energy (unchanged) Energy over financials (unchanged) Tech over communication services (unchanged) Utilities over healthcare (new) Communication services over healthcare (new) Consumer discretionary over healthcare (new) European National Markets Sectoral biases dictate the rotational patterns exhibited by European national bourses (Chart 21). The cyclicality of the German, French, and Italian markets caused them to lag behind their European counterparts. Meanwhile, the Dutch market remains solidly in the Lagging quadrant, mirroring tech equities. Only Spain and Sweden have shown signs of improvement over the past twelve weeks and should outperform the European benchmark over the short term (Table 3). Chart 21Relative Rotation Graph: European National Markets
Plenty Of Risks For Cyclical Stocks
Plenty Of Risks For Cyclical Stocks
Table 3European National Markets Positioning
Plenty Of Risks For Cyclical Stocks
Plenty Of Risks For Cyclical Stocks
Trade Recommendations (12-Month Horizon): UK stocks over Dutch ones (new) UK stocks over French ones (new) Italian stocks over Swedish ones (new) UK stocks over Swedish ones (new) French Elections: Preparing For The Second Round The first round of the French presidential elections did not surprise. As in 2017, incumbent President Emmanuel Macron will face Marine Le Pen in the second round. Beyond this expected outcome, two important takeaways will be crucial in the second round: The collapse of traditional right-wing (Les Républicains) and left-wing (Parti Socialiste) parties. Far-left candidate Jean-Luc Mélenchon surprised to the upside with 22% of votes, right behind Marine Le Pen. The key implication is that the vote transfer has become more favorable to Macron (Diagram 1). In 2017, Marine Le Pen created the surprise and bested center-right candidate François Fillon by the narrowest of margins. As a result, Le Pen’s attempt to appeal to Fillon’s voters was a real threat. Today, the third largest pool of voters belongs to far-left candidate Mélenchon, who has already called upon his voters “not to give a single vote to Marine Le Pen.” Diagram 1Extrapolating France’s First-Round Election To The Second Round
Plenty Of Risks For Cyclical Stocks
Plenty Of Risks For Cyclical Stocks
How does it translate into voting intentions for the second round? Assuming a full transfer of votes from the defeated candidates based on the support they made public, Macron will crush Marine Le Pen as he did in 2017. However, this is unlikely, since many voters feel stuck between a rock and a hard place, and may decide not to vote. Related Report European Investment StrategyFrance: Macron And Macro Assuming Macron obtains only half of the voting intentions from other parties, while Marine Le Pen retains the full support from other far-right candidates’ voters, acquires half of the center-right votes, and secures a quarter of Mélenchon’s votes, the outcome will be much narrower at 53.4% vs. 46.6% in favor of Macron. This is in line with national polls. Two weeks ago, we presented the investment implications of a second Macron mandate. Since then, we have received many questions about the market consequences should Marine Le Pen enjoy a surprise victory. While this is not our base-case, we cannot rule out the possibility of a negative shock to the markets. Chart 22A Le Pen Surprise Victory Would Hurt The Euro
A Le Pen Surprise Victory Would Hurt The Euro
A Le Pen Surprise Victory Would Hurt The Euro
The only certainty within this very uncertain outcome is that Marine Le Pen would be constrained by a strong opposition in the Assemblée Nationale. Although she has changed her stance on “Frexit,” her presidency would undoubtfully carry an increased geopolitical risk within the European Union (EU) and hurt European unity and integration efforts. Thus, the resulting French isolationism would be synonymous with a weaker euro (Chart 22). French assets would be de-rated because her presidency would reverse previous reform efforts, which would hurt trend GDP growth, productivity, and the role of France within the EU. These trends are not only negative for stocks, but they would also put long-term upward pressure on OATs yields as French public finances would deteriorate meaningfully under a populist Le Pen presidency. In this context, underweighting both French equities and government bonds would be warranted. Jeremie Peloso, Associate Editor JeremieP@bcaresearch.com Footnotes Tactical Recommendations Cyclical Recommendations Structural Recommendations
Executive Summary The unemployment rate in the US stands at 3.6%, 0.4 percentage points below the FOMC’s estimate of full employment. Historically, the Fed’s efforts to nudge up the unemployment rate have failed: The US has never averted a recession when the 3-month average of the unemployment rate has increased by more than a third of a percentage point. Despite this somber fact, there are reasons to think it will take longer for a recession to arrive than widely believed. Unlike in the lead-up to many past recessions, the US private sector is currently running a financial surplus. If anything, there are indications that both households and businesses are set to expand – rather than retrench – spending over the coming quarters. Investors should pay close attention to the housing market. As the most interest-rate sensitive sector of the economy, it will dictate the degree to which the Fed can raise rates. The US housing market has cooled, but remains in reasonably good shape, supported by rising incomes and low home inventories. Stocks will likely rise modestly over the next 12 months as inflation temporarily dips and the pandemic recedes from view. However, equities will falter towards the end of 2023. Stocks Tend To Fare Well When There Is No Recession On The Horizon
Stocks Tend To Fare Well When There Is No Recession On The Horizon
Stocks Tend To Fare Well When There Is No Recession On The Horizon
Bottom Line: The US may not be able to avoid a recession, but an economic downturn is unlikely until 2024. Stay modestly overweight stocks over a 12-month horizon. Jobs Aplenty The US unemployment rate fell from 3.8% in February to 3.6% in March, bringing it close to its pre-pandemic low of 3.5%. Adding job openings to employment and comparing the resulting sum with the size of the labor force, the excess of labor demand over labor supply is now the highest since July 1969 (Chart 1). Chart 1Labor Demand Is Outstripping Labor Supply By The Largest Margin Since 1969
Is A Recession Inevitable?
Is A Recession Inevitable?
Granted, the labor force participation rate is still one full percentage point below where it was prior to the pandemic. If the participation rate were to rise, the gap between labor demand and supply would shrink. Some of the decline in the participation rate is permanent in nature, reflecting ongoing population aging, which has been compounded by an increase in early retirements during the pandemic (Chart 2). Some workers who dropped out will probably re-enter the workforce. Chart 3 shows that employment among low-wage workers has been slower to recover than for other groups. With expanded unemployment benefits no longer available, the motivation to find gainful employment will escalate. Chart 2Not All Of The Decline In Labor Participation During The Pandemic Was Due To Increased Early Retirements
Not All Of The Decline In Labor Participation During The Pandemic Was Due To Increased Early Retirements
Not All Of The Decline In Labor Participation During The Pandemic Was Due To Increased Early Retirements
Chart 3Low-Wage Workers Have Not Returned In Full Force
Low-Wage Workers Have Not Returned In Full Force
Low-Wage Workers Have Not Returned In Full Force
Nevertheless, it is doubtful that the entry of low-wage workers into the labor force will do much to reduce the gap between labor demand and supply. Low-wage workers tend to spend all of their incomes (Chart 4). Thus, while an increase in the number of low-wage workers will allow the supply of goods and services to rise, this will be counterbalanced by an increase in the demand for goods and services. Chart 4Richer Households Tend To Save More Than Poorer Ones
Is A Recession Inevitable?
Is A Recession Inevitable?
To cool the labor market, the Fed will need to curb spending, and that can only be achieved by raising interest rates. Trying to achieve a soft landing in this manner is always easier said than done. The US has never averted a recession when the 3-month average of the unemployment rate has increased by more than a third of a percentage point. Rising unemployment tends to produce a negative feedback loop: A weaker labor market depresses spending. This, in turn, leads to less hiring and more firing, resulting in even higher unemployment. Where is the Choke Point? How high will interest rates need to rise to trigger such a feedback loop? Markets currently expect the Fed to raise rates to 3% by mid-2023 but then cut rates by at least 25 basis points over the subsequent months (Chart 5). So, the market thinks the neutral rate of interest – the interest rate consistent with a stable unemployment rate – is around 2.5%. The Fed broadly shares the market’s view. The median dot for the terminal Fed funds rate stood at 2.4% in the March Summary of Economic Projections (Chart 6). When the Fed first started publishing its dot plot in 2012, it thought the terminal rate was 4.25%. Chart 5The Markets See The Fed Funds Rate Reaching 3% Next Year
Is A Recession Inevitable?
Is A Recession Inevitable?
Chart 6The Fed's Estimate Of The Terminal Rate Has Fallen Over The Years
The Fed's Estimate Of The Terminal Rate Has FalLen Over The Years
The Fed's Estimate Of The Terminal Rate Has FalLen Over The Years
Low Imbalances Imply a Higher Neutral Rate We have discussed the concept of the neutral rate extensively in the past, so we will not regurgitate the issues here (interested readers should consult the Feature Section of our latest Strategy Outlook). Instead, it would be worthwhile to dwell on the relationship between the neutral rate and economic imbalances. Simply put, when an economy is suffering from major imbalances, it does not take much monetary tightening to push it over the edge. The private-sector financial balance measures the difference between what households and firms earn and spend. A recession is more likely to occur when the private-sector financial balance is negative — that is, when spending exceeds income — since households and firms are more prone to cut spending when they are living beyond their means. In the lead-up to the Great Recession, the private-sector financial balance hit a deficit of 3.9% of GDP in the US. Leading up to the 2001 recession, it reached a deficit of 5.4% of GDP. Today, the US private-sector financial balance, while down from its peak during the pandemic, still stands at a comfortable surplus of 3% of GDP. Rather than looking to retrench, households and businesses are poised to increase spending over the coming quarters (Chart 7). Private-sector financial balances are also positive in Japan, China, and most of Europe (Chart 8). Chart 7Consumers And Businesses Are Set To Spend More
Consumers And Businesses Are Set To Spend More
Consumers And Businesses Are Set To Spend More
Chart 8Private-Sector Financial Balances Are Positive In Most Major Economies
Is A Recession Inevitable?
Is A Recession Inevitable?
Watch Housing Chart 9Rising Interest Rates In The Early 1980s Had Much More Of A Negative Effect On Housing Than Business Investment
Rising Interest Rates In The Early 1980s Had Much More Of A Negative Effect On Housing Than Business Investment
Rising Interest Rates In The Early 1980s Had Much More Of A Negative Effect On Housing Than Business Investment
At the 2007 Jackson Hole conference, Ed Leamer presented what turned out to be a very prescient paper. Titled “Housing is the Business Cycle,” Leamer concluded that “Of the components of GDP, residential investment offers by far the best early warning sign of an oncoming recession.” Housing is a long-lived asset, and one that is usually financed with debt. To a much greater extent than nonresidential investment, the housing sector is very sensitive to changes in interest rates. When the Fed hiked rates in the early 1980s, residential investment collapsed but business investment barely contracted (Chart 9). The jump in mortgage yields has started to weigh on housing (Chart 10). Mortgage applications for home purchases have fallen by 25% from their highs. Pending home sales have dropped. Homebuilder confidence has dipped. Homebuilder stocks are down 29% year-to-date. Housing is likely to slow further in the months ahead, even if mortgage yields stabilize. Chart 11 shows that changes in mortgage yields lead home sales and housing starts by about six months. Chart 10The Jump In Mortgage Rates Has Weighed On The Housing Market
The Jump In Mortgage Rates Has Weighed On The Housing Market
The Jump In Mortgage Rates Has Weighed On The Housing Market
Chart 11Swings In Mortgage Rates Explain Short-Term Fluctuations In Housing Activity
Swings In Mortgage Rates Explain Short-Term Fluctuations In Housing Activity
Swings In Mortgage Rates Explain Short-Term Fluctuations In Housing Activity
The key question for investors is whether the housing market will enter a deep freeze or merely cool down. We think the latter is more likely. The 30-year fixed mortgage rate has increased nearly two percentage points since last August, but at around 5%, it is still below the average of 6% that prevailed during the 2000-2006 housing boom (Chart 12).
Image
Moreover, unlike during the housing boom, when homebuilders flooded the market with houses, the supply of new homes remains contained. The nationwide homeowner vacancy rate stands at record lows. Building permits are near cycle highs (Chart 13). Granted, real home prices are close to record highs. However, relative to incomes, US home prices have not broken out of their historic range (Chart 14). Chart 13The Homeowner Vacancy Rate Is Near Record Lows
The Homeowner Vacancy Rate Is Near Record Lows
The Homeowner Vacancy Rate Is Near Record Lows
Chart 14Homes In The US Are Relatively Cheap
Homes In The US Are Relatively Cheap
Homes In The US Are Relatively Cheap
Home affordability is much more stretched outside of the United States. The Bank of Canada, for example, has less scope to raise rates than the Fed. Chart 15Some Signs Of Easing In Supply-Side Pressures
Some Signs Of Easing In Supply-Side Pressures
Some Signs Of Easing In Supply-Side Pressures
Investment Conclusions As investors, we need to be forward looking. The widespread availability of Paxlovid later this year — which, in contrast to the vaccines, is effective against all Covid strains — will help boost global growth while relieving supply-chain bottlenecks. Shipping costs, used car prices, and ISM supplier delivery times have already come down from their highs (Chart 15). Central banks have either started to raise rates or are gearing up to do so. However, monetary policy is unlikely to turn restrictive in any major economy over the next 12 months. Stocks usually go up outside of recessionary environments (Chart 16). Global equities are trading at 17-times forward earnings. The corresponding earnings yield is about 630 basis points higher than the real global bond yield – a very wide gap by historic standards (Chart 17). Chart 16Stocks Tend To Fare Well When There Is No Recession On The Horizon
Stocks Tend To Fare Well When There Is No Recession On The Horizon
Stocks Tend To Fare Well When There Is No Recession On The Horizon
Chart 17AThe Equity Risk Premium Remains Elevated (I)
The Equity Risk Premium Remains Elevated (I)
The Equity Risk Premium Remains Elevated (I)
Chart 17BThe Equity Risk Premium Remains Elevated (II)
The Equity Risk Premium Remains Elevated (II)
The Equity Risk Premium Remains Elevated (II)
Investors should remain modestly overweight equities over a 12-month horizon and look to increase exposure to non-US stock markets, small caps, and value stocks over the coming months. Government bond yields are unlikely to rise much over the next 12 months but will increase further over the long haul. The dollar should peak during this summer, and then weaken over the subsequent 12 months. A complete discussion of our market views is contained in our recently published Second Quarter Strategy Outlook. Peter Berezin Chief Global Strategist peterb@bcaresearch.com Global Investment Strategy View Matrix
Is A Recession Inevitable?
Is A Recession Inevitable?
Special Trade Recommendations Current MacroQuant Model Scores
Is A Recession Inevitable?
Is A Recession Inevitable?
BCA Research’s Emerging Markets Strategy service expects Taiwanese and Korean semi stock prices to continue falling in absolute terms. Interestingly, since early 2021 TSMC and Samsung share prices have exhibited different price…
Executive Summary Semi Shipments-To-Inventory Ratios Are Falling In Korea And Taiwan
Semi Shipments-To-Inventory Ratios Are Falling In Korea And Taiwan
Semi Shipments-To-Inventory Ratios Are Falling In Korea And Taiwan
Global semiconductor stock prices are vulnerable to the downside over the next three to six months. The global semiconductor industry has entered a cyclical slump. Demand for semis faces headwinds this year. The pandemic boom in goods (ex-auto) consumption in developed economies is likely over. Plus, households’ disposable income in these economies is contracting in real terms. In China, ongoing lockdowns are depressing household income, which will limit their discretionary spending. Nevertheless, the structural outlook for global semiconductor demand remains constructive. We are waiting for a better entry point. Bottom Line: There is more downside in global semiconductor share prices as well as Taiwanese and Korean tech stocks. We will be looking to recommend buying semiconductor stocks when a more material deceleration in semi companies’ revenue and profits are priced in. Feature Chart 1Semi Stocks Have Been Selling off Despite Strong Revenues
Semi Stocks Have Been Selling off Despite Strong Revenues
Semi Stocks Have Been Selling off Despite Strong Revenues
A small divergence between global semiconductor sales and semi stock prices has opened up (Chart 1). Although global semiconductor sales have been super strong, global semiconductor stock prices peaked in late December and have since declined by 23%. We believe the global semiconductor industry is entering into a cyclical slump. The demand for PCs/tablets/game consoles/electronic gadgets as well as commercial computers and servers – and with them semiconductor sales/shipments – had surged in the last two years. Behind this boom was the significant increase in online activities stemming from pandemic-related lockdowns. However, these one-off factors have largely run their course. Global semiconductor demand growth currently faces headwinds and is set to slow meaningfully in H2 this year. We expect more downside in global semiconductor stock prices over the next three to six months. The five previous cyclical downturns in the global semiconductor sector resulted in share price declines that were greater than the current 23% drawdown (Table 1). Also, in four of these five cycles, the duration of the peak-to-trough period exceeded the current 3.5 months of decline from the December peak. Nevertheless, the structural outlook for global semiconductor demand remains constructive due to the increasing adoption of the 5G network, electric vehicles, data centers and IoTs. We are waiting for a better entry point later this year. Table 1Key Statistics Of Five Cyclical Downturns In Global Semiconductor Market
Global Semi Stocks: More Downside
Global Semi Stocks: More Downside
Near-Term Demand Headwinds Chart 2Global Semis Sales Have Diverged From Global Manufacturing Cycle
Global Semis Sales Have Diverged From Global Manufacturing Cycle
Global Semis Sales Have Diverged From Global Manufacturing Cycle
There has been a remarkable divergence between world semi sales and the global business cycle (Chart 2). The US ISM manufacturing new order-to-inventory ratio, a barometer of the global business cycle, dropped below 1, signaling a slowdown in US manufacturing in the coming months (Chart 2, top panel). Critically, the volume of China’s semiconductor imports started to contract recently and the growth of Chinese imports from Taiwan also plunged (Chart 3). China is the world’s largest semiconductor consumer, accounting for 35% of global semiconductor demand. The slowdown in the country’s chip demand does not bode well for the global semiconductor market. We expect the growth of semiconductor sales in all regions to decelerate considerably this year (Chart 4). Chart 3China's Semis Import Volumes Are Contracting
China's Semis Import Volumes Are Contracting
China's Semis Import Volumes Are Contracting
Chart 4Semiconductor Sales Value Growth Across Regions
Semiconductor Sales Value Growth Across Regions
Semiconductor Sales Value Growth Across Regions
First, the one-off boost to demand for goods in general, and electronic devices in particular, due to global pandemic lockdowns has largely run its course. Chart 5The Pandemic Boom In PC Sales Is Largely Over
The Pandemic Boom In PC Sales Is Largely Over
The Pandemic Boom In PC Sales Is Largely Over
Traditional PCs and tablets: Demand for traditional PCs1 and tablets surged in the past two years. This was due to the significant increase in online activities, such as working from home, business, education, e-commerce, gaming and entertainment. According to the International Data Corporation (IDC), after two consecutive years of strong growth, global traditional PC and tablet shipments experienced a 5% contraction in volume terms in 1Q2022. In addition, computer production in China – the world’s largest computer producer and exporter – also showed a significant growth deceleration (Chart 5). These data indicate that the pandemic boom in PC sales is largely over. Server demand: Another major contributor to the boom in semi demand was from the server sector. The surge in online activities resulted in greater demand for cloud services and remote work applications, both of which require computer servers to run on. However, demand growth for the server sector is also set to decelerate slightly. According to TrendForce Research, global server shipment growth will slow from over 5% year-on-year in 2021 to 4-5% this year. The global server sector and the traditional PC/tablet sectors together account for about 22% of global chip demand, based on the data from the IDC. Second, automobiles and consumer electronic goods (e.g., smartphones and home appliances), – which together account for about 42% of global semiconductor demand – will weaken this year. Both ongoing lockdowns in China and the surge in commodity prices due to the Russia-Ukraine war will exacerbate inflationary pressures and create major headwinds to household disposable income in real terms and discretionary spending around the world. Hence, global consumers will remain cautious in their spending on discretionary goods. For example, China’s household marginal propensity to consume proxy dropped to a 15-year low (Chart 6, top panel). This will translate to constrained household spending this year, leading to weaker sales in consumer electronic goods and automobiles (Chart 6, middle and bottom panel). Similarly, US real household consumption of goods ex-autos is likely to experience a mean reversion this year (Chart 7, top panel). After having bought the sheer number of goods (ex-autos) in the last two years, US consumers are likely to shift their spending towards services. Chart 6China: Consumer Spending Will Continue Disappointing
China: Consumer Spending Will Continue Disappointing
China: Consumer Spending Will Continue Disappointing
Chart 7Beware of A Mean-Reversion In US Real Household Consumption Of Goods ex-Autos
Beware of A Mean-Reversion In US Real Household Consumption Of Goods ex-Autos
Beware of A Mean-Reversion In US Real Household Consumption Of Goods ex-Autos
Plus, very high headline inflation is eroding US consumers' purchasing power (Chart 7, bottom panel). The relapse in DM goods demand will hinder the global semiconductor industry. There are already some signs of a slowdown in consumer demand. Apple was reported to have reduced its orders for its recently released iPhone SE by 20% and cut orders for AirPods by about 10 million units due to weaker-than-expected demand.2 Notably, global smartphone sales have been – and will remain – stagnant due to their longer replacement cycle.3 Chart 8Semi Shipments-To-Inventory Ratios Are Falling In Korea And Taiwan
Semi Shipments-To-Inventory Ratios Are Falling In Korea And Taiwan
Semi Shipments-To-Inventory Ratios Are Falling In Korea And Taiwan
Third, inventory stockpiling also contributed to last year’s strong semiconductor sales. The length and intensity of the chip shortage which started in H2 2020 caused a broad range of customers – including the manufacturers of smartphones and other consumer electronics – to order more than they need. This inventory stockpiling caused forward inventory days for customers of semi producers to increase by 28% from last quarter to 50 days, which is near peak inventory levels experienced in the last cycle. Businesses will likely start drawing down their stockpiles, rather than increasing their semiconductors orders this year. This will also reduce semiconductor demand on the margin. The semiconductor shipments-to-inventory ratios from Korea and Taiwan have been falling, corroborating the cyclical downturn in the Asian semi industry (Chart 8). Bottom Line: We believe the global semiconductor sector has entered a cyclical slump. The sector’s sales are facing plenty of headwinds, and its growth will decelerate considerably this year. What About The Supply Shortage? The semiconductor industry has been known for its cyclicality. Periods of shortage have been followed by periods of oversupply. The latter led to declining prices, revenues, and profits for semi producers. Hence, massive expansion plans announced by the major players have indeed raised fears that the supply shortage will turn into a supply glut down the road. The global semiconductor shortage in place since late 2020 has been eased to some extent and is set to diminish considerably later this year and next year. Both a moderation in demand growth and an increase in new capacity will likely mitigate the supply tightness meaningfully. It takes about 18-24 months on average to build a new semiconductor fabrication plan. According to estimates from the Semiconductor Industry Association (SIA), the global semiconductor industry added 4 million wafers per month of manufacturing capacity between January 2020 and January 2022. 75% of this new manufacturing capacity had already come on-line as of October 2021. IC Insights also reported global installed wafer capacity increased 6.7% in 2020 and 8.6% in 2021. It also projected the capacity expansion to be 8.7% in 2022. In comparison, the annual growth rate in global installed wafer capacity was only 3.2% in 2019. Last June, industry organization SEMI estimated that construction on close to 30 new fabs will start by the end of 2022.4 Mainland China and Taiwan added the greatest number of new fabrication plants, followed by the Americas. In addition the world’s top three chip makers (TSMC, Intel and Samsung) all raised their capex plans significantly for this year (Box 1). On the whole, according to IC Insights, worldwide semiconductor capex will likely jump by 24% in 2022 to a new all-time high of $190.4 billion, up 86% from just three years earlier in 2019. BOX 1 Top 3 Chip Makers: Massive Capex Expansion Ahead TSMC doubled capex from nearly US$15bn in 2019 to US$30bn in 2021 and set aside US$40-44bn for 2022, a 33%-47% boost year-on-year. In mid-2021, Samsung’s chip manufacturing unit increased its capex plans until 2030 from US$115bn (about US$12.8 bn annually) to US$151bn (about US$16.8 bn annually), a 31% increase year-on-year. Intel increased its capex from US$14.5 billion in 2020 to $18-19 billion in 2021. This number jumped to US$25-28 billion for 2022, a 39-47% lift year-on-year. In general, massive capex at a collective level will be negative for share prices of semi producers. Announcements of capex expansion, which increase an individual company’s production capacity, could be perceived as a positive for that company. Yet, rapid capacity expansion is typically negative for the overall sector as it often leads to lower prices and profitability down the road. Chart 9Aggressive Collective Capex Ultimately Hurts Semis Stocks
Aggressive Collective Capex Ultimately Hurts Semis Stocks
Aggressive Collective Capex Ultimately Hurts Semis Stocks
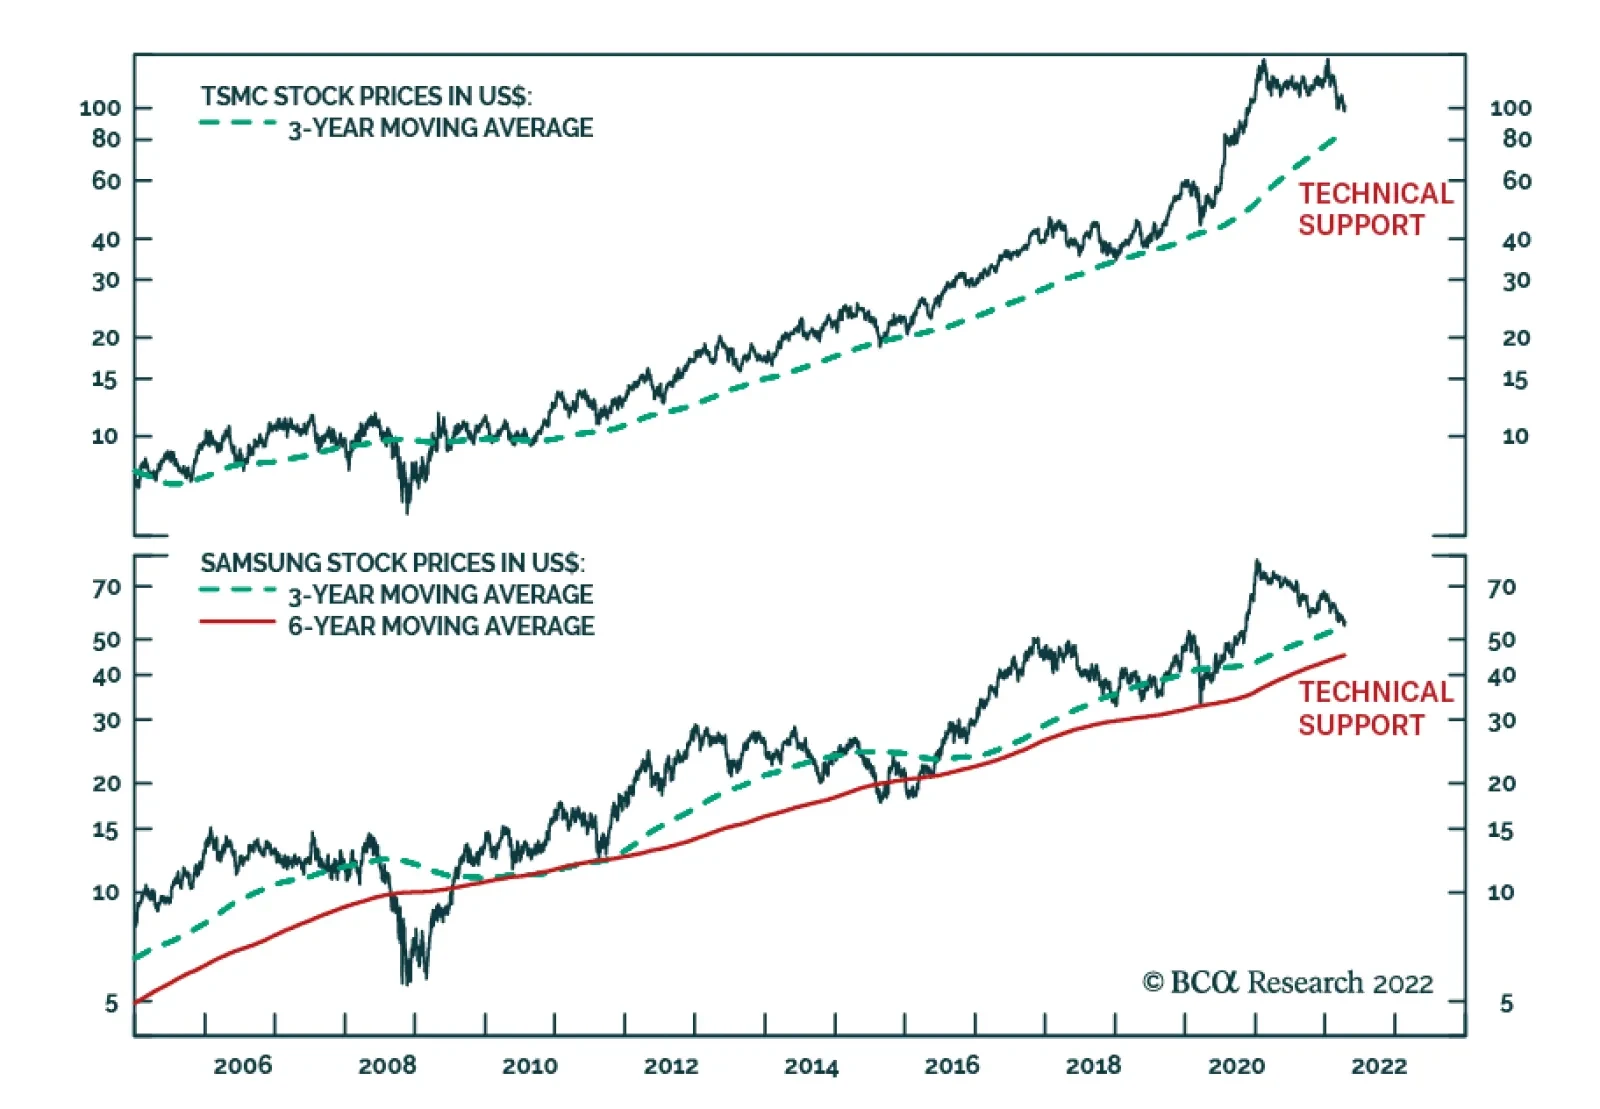
Given that the collective capex for the global semiconductor sector has expanded substantially, the odds of an oversupplied semiconductor market have increased. This shift will likely weigh on semiconductor stock prices (Chart 9). Bottom Line: The global semiconductor supply-demand balance is likely improving (demand is slowing and supply is rising). Massive capital spending plans will inevitably raise concerns about an eventual supply glut in the global semiconductor industry. This will weigh on global semiconductor share prices in the coming months. Taiwanese And Korean Semi Stocks Odds are that Taiwanese and Korean semi stock prices will continue falling in absolute terms. Interestingly, since early 2021 TSMC and Samsung share prices have exhibited different price patterns vis-a-vis the global semiconductor stock indexes (Chart 10). TSMC had double tops in the past 15 months and has dropped 30% in USD terms from its January peak despite posting substantial revenue growth (Chart 11, top panel). Chart 10TSMC And Samsung Stock Prices: Do Not Catch A Falling Knife
TSMC And Samsung Stock Prices: Do Not Catch A Falling Knife
TSMC And Samsung Stock Prices: Do Not Catch A Falling Knife
Chart 11Semi Stocks in Asia: Share Prices Lead Corporate Revenues
Semi Stocks in Asia: Share Prices Lead Corporate Revenues
Semi Stocks in Asia: Share Prices Lead Corporate Revenues
Share prices of Korean DRAM producers (Samsung and Hynix) are down over 30% in USD terms from their early 2021 peak, frontrunning the decline in our DRAM revenue proxy (Chart 11, bottom panel). In addition, even though Samsung released better-than-expected business performance for the first quarter last Thursday, it still failed to attract buyers. Both cases –TSMC and Samsung –signal that robust revenue/earnings are no longer enough to trigger a rally in semiconductor share prices. This suggests that the market is forward-looking and foresees a poor outlook. Chart 12Taiwan's New Orders-To-Client Inventories Ratio Suggests The Downturn Is Not Yet Over
Taiwan's New Orders-To-Client Inventories Ratio Suggests The Downturn Is Not Yet Over
Taiwan's New Orders-To-Client Inventories Ratio Suggests The Downturn Is Not Yet Over
A slowdown in demand will lead to a deceleration in both companies’ revenue growth and profits. For TSMC, the smartphone sector still accounts for 44% of the company’s revenue. Hence, a risk is that global smartphone sales contract this year due to longer replacement cycles5 and constrained household spending as inflation curbs their purchasing power. In such a case, TSMC’s sales growth will disappoint, and the stock will likely drop toward $80 (Chart 10 on page 9). Taiwan’s new orders-to-client inventories ratio for semiconductors points to lower semi stocks in this bourse (Chart 12). For Samsung, signs of a slowdown in demand are already emerging in memory chips, reflecting slower sales, primarily of PCs. Moreover, TrendForce expects average overall DRAM pricing to drop by approximately 0-5% in 2Q22 due to marginally higher inventories and weakening demand. Equity Valuations And Investment Conclusions Chart 13Multiples Of Global Semis Stocks Are Still Elevated
Multiples Of Global Semis Stocks Are Still Elevated
Multiples Of Global Semis Stocks Are Still Elevated
The global semiconductor stock index in USD terms has declined by 23% from its recent peak. The still-elevated multiples of semiconductor stocks suggest that there is more downside ahead in absolute terms (Chart 13). One of the reasons that semi stocks have fallen could be their de-rating amid rising US bond yields. Having rallied tremendously in the past 10 years, global semis had become one of the most expensive industry groups worldwide. As a result, higher US bond yields are causing multiple compression for global semis (Chart 14). The closest comparison for the current episode is probably the 2016-2018 boom-bust cycle (Chart 15). During this period, the massive stimulus in China and the adoption of 4G smartphones/tablets had pushed up semiconductor share prices. In 2018, after the one-off adoption/replacement cycle ran out of steam, semi stocks dropped by nearly 30% amid slowing demand and rising global bond yields. By comparison, the one-off surge in global semi demand in 2020-2021 was much larger than the one in 2016-2018. Also, global semi stocks have rallied by much more and have become more expensive now compared with the 2016-18 episode. We expect a mean reversion in demand to lead to a slightly larger decline in global semi stocks than in 2018. This means that there is still about 15-20% more downside from the current level. As to allocation to semi stocks within an EM equity portfolio, we recommend maintaining a neutral allocation to Taiwan and reiterate an overweight stance on the KOSPI. These are relative calls, i.e., against the EM benchmark. We remain negative on their absolute performance. Chart 14Higher US Bond Yields = Multiple Compression For Global Semis Stocks
Higher US Bond Yields = Multiple Compression For Global Semis Stocks
Higher US Bond Yields = Multiple Compression For Global Semis Stocks
Chart 15A Comparison With The 2016-2018 Semi Rally And Selloff
A Comparison With The 2016-2018 Semi Rally And Selloff
A Comparison With The 2016-2018 Semi Rally And Selloff
Given that Korean stocks in general, and Samsung in particular, have already underperformed, further downside in their relative performance will be limited. As to the Taiwanese overall equity index and TSMC, share prices remain elevated relative to the EM benchmark. Finally, the structural outlook for global semiconductor demand remains constructive. We are waiting for a better entry point. We will be looking to recommend buying semiconductor stocks after a more material deceleration in semi companies’ revenue and profits gets priced in. Ellen JingYuan He Associate Vice President ellenj@bcaresearch.com Arthur Budaghyan Chief Emerging Markets Strategist arthurb@bcaresearch.com Footnotes 1 Traditional PCs are comprised of desktops, notebooks and workstations. 2 https://asia.nikkei.com/Spotlight/Supply-Chain/TSMC-says-demand-for-sma… 3 https://www.wsj.com/articles/good-chip-results-wont-be-good-enough-1164… 4 https://asia.nikkei.com/Spotlight/Supply-Chain/Chipmakers-nightmare-Wil… 5 https://www.cnet.com/tech/mobile/getting-a-new-iphone-every-2-years-is-…
Executive Summary Macron Still Favored, But Le Pen Cannot Be Ruled Out
Le Pen And Other Hurdles (GeoRisk Update)
Le Pen And Other Hurdles (GeoRisk Update)
Macron is still favored to win the French election but Le Pen’s odds are 45%. Le Pen would halt France’s neoliberal structural reforms, paralyze EU policymaking, and help Russia’s leverage in Ukraine. But she would lack legislative support and would not fatally wound the EU or NATO. European political risk will remain high in Germany, Italy, and Spain. Favor UK equities on a relative basis. Financial markets are complacent about Russian geopolitical risk again. Steer clear of eastern European assets. Do not bottom feed in Chinese stocks. China faces social unrest. North Korean geopolitical risk is back. Australia’s election is an opportunity, not a risk. Stay bullish on Latin America. Prefer Brazil over India. Stay negative on Turkey and Pakistan. Trade Recommendation Inception Date Return TACTICALLY LONG US 10-YEAR TREASURY 2022-04-14 Bottom Line: Go long the US 10-year Treasury on geopolitical risk and near-term peak in inflation. Feature Last year we declared that European political risk had reached a bottom and had nowhere to go but up. Great power rivalry with Russia primarily drove this view but we also argued that our structural theme of populism and nationalism would feed into it. Related Report Geopolitical StrategyThe Geopolitical Consequences Of The Ukraine War In other words, the triumph of the center-left political establishment in the aftermath of Covid-19 would be temporary. The narrow French presidential race highlights this trend. President Emmanuel Macron is still favored but Marine Le Pen, his far-right, anti-establishment opponent, could pull off an upset victory on April 24. The one thing investors can be sure of is that France’s ability to pursue neoliberal structural reforms will be limited even if Macron wins, since he will lack the mandate he received in 2017. Our GeoRisk Indicators this month suggest that global political trends are feeding into today’s stagflationary macroeconomic context. Market Complacent About Russia Again Global financial markets are becoming complacent about European security once again. Markets have begun to price a slightly lower geopolitical risk for Russia after it withdrew military forces from around Kyiv in an open admission that it failed to overthrow the government. However, western sanctions are rising, not falling, and Russia’s retreat from Kyiv means it will need to be more aggressive in the south and east (Chart 1). Chart 1Russia: GeoRisk Indicator
Russia: GeoRisk Indicator
Russia: GeoRisk Indicator
Russia has not achieved its core aim of a militarily neutral Ukraine – so it will escalate the military effort to achieve its aim. Any military failure in the east and south would humiliate the Putin regime and make it more unpredictable and dangerous. The West has doubled down on providing Ukraine with arms and hitting Russia with sanctions (e.g. imposing a ban on Russian coal). Germany prevented an overnight ban on Russian oil and natural gas imports but the EU is diversifying away from Russian energy rapidly. Sanctions that eat away at Russia’s export revenues will force it to take a more aggressive posture now, to achieve a favorable ceasefire before funding runs out. Sweden and Finland are reviewing whether to join NATO, with recommendations due by June. Russia will rattle sabers to underscore its red line against NATO enlargement and will continue to threaten “serious military-political repercussions” if these states try to join. We would guess they would remain neutral as a decision to join NATO could lead to a larger war. Bottom Line: Global equities will remain volatile due to a second phase of the war and potential Russian threats against Ukraine’s backers. European equities and currency, especially in emerging Europe, will suffer a persistent risk premium until a ceasefire is concluded. What If Le Pen Wins In France? By contrast with the war in Ukraine, the French election is a short-term source of political risk. A surprise Le Pen victory would shake up the European political establishment but investors should bear in mind that it would not revolutionize the continent or the world, as Le Pen’s powers would be limited. Unlike President Trump in 2017, she would not take office with her party gaining full control of the legislature. Le Pen rallied into the first round of the election on April 10, garnering 23% of the vote, up from 21% in 2017. This is not a huge increase in support but her odds of winning this time are much better than in 2017 because the country has suffered a series of material shocks to its stability. Voters are less enthusiastic about President Macron and his centrist political platform. Macron, the favorite of the political establishment, received 28% of the first-round vote, up from 24% in 2017. Thus he cannot be said to have disappointed expectations, though he is vulnerable. The euro remains weak against the dollar and unlikely to rally until Russian geopolitical risk and French political risk are decided. The market is not fully pricing French risk as things stand (Chart 2). Chart 2France: GeoRisk Indicator
France: GeoRisk Indicator
France: GeoRisk Indicator
The first-round election results show mixed trends. The political establishment suffered but so did the right-wing parties (Table 1). The main explanation is that left-wing, anti-establishment candidate Jean-Luc Mélenchon beat expectations while the center-right Republicans collapsed. Macron is leading Le Pen by only five percentage points in the second-round opinion polling as we go to press (Chart 3). Macron has maintained this gap throughout the race so far and both candidates are very well known to voters. But Le Pen demonstrated significant momentum in the first round and momentum should never be underestimated. Table 1Results Of France’s First-Round Election
Le Pen And Other Hurdles (GeoRisk Update)
Le Pen And Other Hurdles (GeoRisk Update)
Chart 3French Election: Macron Maintains Lead
French Election: Macron Maintains Lead
French Election: Macron Maintains Lead
Are the polls accurate? Anti-establishment candidates outperformed their polling by 7 percentage points in the first round. Macron, the right-wing candidates, and the pro-establishment candidates all underperformed their March and April polls (Chart 4). Hence investors should expect polls to underrate Le Pen in the second round. Chart 4French Polls Fairly Accurate Versus First-Round Results
Le Pen And Other Hurdles (GeoRisk Update)
Le Pen And Other Hurdles (GeoRisk Update)
Given the above points, it is critical to determine which candidate will gather the most support from voters whose first preference got knocked out in the first round. The strength of anti-establishment feeling means that the incumbent is vulnerable while ideological camps may not be as predictable as usual. Mélenchon has asked his voters not to give a single vote to Le Pen but he has not endorsed Macron. About 21% of his supporters say they will vote for Le Pen. Only a little more of them said they would vote for Macron, at 27% (Chart 5). Chart 5To Whom Will Voters Drift?
Le Pen And Other Hurdles (GeoRisk Update)
Le Pen And Other Hurdles (GeoRisk Update)
Diagram 1, courtesy of our European Investment Strategy, illustrates that Macron is favored in both scenarios but Le Pen comes within striking distance under certain conservative assumptions about vote switching. Diagram 1Extrapolating France’s First-Round Election To The Second Round
Le Pen And Other Hurdles (GeoRisk Update)
Le Pen And Other Hurdles (GeoRisk Update)
Macron’s approval rating has improved since the pandemic. This is unlike the situation in other liberal democracies (Chart 6). Chart 6Macron Handled Pandemic Reasonably Well
Le Pen And Other Hurdles (GeoRisk Update)
Le Pen And Other Hurdles (GeoRisk Update)
The pandemic is fading and the economy reviving. Unemployment has fallen from 8.9% to 7.4% over the course of the pandemic. Real wage growth, at 5.8%, is higher than the 3.3% that prevailed when Macron took office in 2017 (Chart 7). Chart 7Real Wages A Boon For Macron
Le Pen And Other Hurdles (GeoRisk Update)
Le Pen And Other Hurdles (GeoRisk Update)
But these positives do not rule out a Le Pen surprise. The nation has suffered not one but a series of historic shocks – the pandemic, inflation, and the war in Ukraine. Inflation is rising at 5.1%, pushing the “Misery Index” (inflation plus unemployment) to 12%, higher than when Macron took office, even if lower than the EU average (Chart 8). Chart 8Misery Index The Key Threat To Macron
Misery Index The Key Threat To Macron
Misery Index The Key Threat To Macron
Le Pen has moderated her populist message and rebranded her party in recent years to better align with the median French voter. She claims that she will not pursue a withdrawal from the European Union or the Euro Area currency union. This puts her on the right side of the one issue that disqualified her from the presidency in the past. Yet French trust in the EU is declining markedly, which suggests that Le Pen is in step with the median voter on wanting greater French autonomy (Chart 9). Le Pen’s well-known sympathy toward Vladimir Putin and Russia is a liability in the context of Russian aggression in Ukraine. Only 35% of French people had a positive opinion of Russia back in 2019, whereas 50% had a favorable view of NATO, and the gap has likely grown as a result of the invasion (Chart 10). However, the historic bout of inflation suggests that economic policy could be the most salient issue for voters rather than foreign policy. Chart 9Le Pen Only Electable Because She Accepted Europe
Le Pen And Other Hurdles (GeoRisk Update)
Le Pen And Other Hurdles (GeoRisk Update)
Chart 10Le Pen’s NATO Stance Not Disqualifying
Le Pen And Other Hurdles (GeoRisk Update)
Le Pen And Other Hurdles (GeoRisk Update)
Le Pen’s economic platform is fiscally liberal and protectionist, which will appeal to voters upset over the rising cost of living and pressures of globalization. She wants to cut the income tax and value-added tax, while reversing Macron’s attempt at raising the retirement age and reforming the pension system. France’s tax rates on income, and on gasoline and diesel, are higher than the OECD average. In other words, Macron is running on painful structural reform while Le Pen is running on fiscal largesse. This is another reason to take seriously the risk of a Le Pen victory. What should investors expect if Le Pen pulls off an upset? France’s attempt at neoliberal structural reforms would grind to a halt. While Le Pen may not be able to pass domestic legislation, she would be able to halt the implementation of Macron’s reforms. Productivity and the fiscal outlook would suffer. Le Pen’s ability to change domestic policy will be limited by the National Assembly, which is due for elections from June 12-19. Her party, the National Rally (formerly the Front National), has never won more than 20% of local elections and performed poorly in the 2017 legislative vote. Investors should wait to see the results of the legislative election before drawing any conclusions about Le Pen’s ability to change domestic policy. France’s foreign policy would diverge from Europe’s. If Le Pen takes the presidency, she will put France at odds with Brussels, Berlin, and Washington, in much the same way that President Trump did. She would paralyze European policymaking. Yet Le Pen alone cannot take France out of the EU. The French public’s negative view of the EU is not the same as a majority desire to leave the bloc – and support for the euro currency stands at 69%. Le Pen does not have the support for “Frexit,” French exit from the EU. Moreover European states face immense pressures to work together in the context of global Great Power Rivalry. Independently they are small compared to the US, Russia, and China. Hence the EU will continue to consolidate as a geopolitical entity over the long run. Russia, however, would benefit from Le Pen’s presidency in the context of Ukraine ceasefire talks. EU sanctions efforts would freeze in place. Le Pen could try to take France out of NATO, though she would face extreme opposition from the military and political establishment. If she succeeded on her own executive authority, the result would be a division among NATO’s ranks in the face of Russia. This cannot be ruled out: if the US and Russia are fighting a new Cold War, then it is not unfathomable that France would revert to its Cold War posture of strategic independence. However, while France withdrew from NATO’s integrated military command from 1966-2009, it never withdrew fully from the alliance and was always still implicated in mutual defense. In today’s context, NATO’s deterrent capability would not be much diminished but Le Pen’s administration would be isolated. Russia would be unable to give any material support to France’s economy or national defense. Bottom Line: Macron is still favored for re-election but investors should upgrade Le Pen’s chances to a subjective 45%. If she wins, the euro will suffer a temporary pullback and French government bond spreads will widen over German bunds. The medium-term view on French equities and bonds will depend on her political capability, which depends on the outcome of the legislative election from June 12-19. She will likely be stymied at home and only capable of tinkering with foreign policy. But if she has legislative support, her agenda is fiscally stimulative and would produce a short-term sugar high for French corporate earnings. However, it would be negative for long-term productivity. UK, Italy, Spain: Who Else Faces Populism? Chart 11Rest Of Europe: GeoRisk Indicators
Rest Of Europe: GeoRisk Indicators
Rest Of Europe: GeoRisk Indicators
Between Russian geopolitical risk and French political risk, other European countries are likely to see their own geopolitical risk premium rise (Chart 11). But these countries have their own domestic political dynamics that contribute to the reemergence of European political risk. Germany’s domestic political risk is relatively low but it faces continued geopolitical risk in the form of Russia tensions, China’s faltering economy, and potentially French populism (Chart 11, top panel). In Italy, the national unity coalition that took shape under Prime Minister Mario Draghi was an expedient undertaken in the face of the pandemic. As the pandemic fades, a backlash will take shape among the large group of voters who oppose the EU and Italian political establishment. The Italian establishment has distributed the EU recovery funds and secured the Italian presidency as a check on future populist governments. But it may not be able to do more than that before the next general election in June 2023, which means that populism will reemerge and increase the political risk premium in Italian assets going forward (Chart 11, second panel). Spain is still a “divided nation” susceptible to a rise in political risk ahead of the general election due by December 10, 2023. However, the conservative People’s Party, the chief opposition party, has suffered from renewed infighting, which gives temporary relief to the ruling Socialist Worker’s Party of Prime Minister Pedro Sanchez. The Russia-Ukraine issue caused some minor divisions within the government but they are not yet leading to any major political crisis, as nationwide pro-Ukraine sentiment is largely unified. The Andalusia regional election, which is expected this November, will be a check point for the People’s Party’s new leadership and a test run for next year’s general election. Andalusia is the most populous autonomous community in Spain, consisting about 17% of the seats in the congress (the lower house). The risk for Sanchez and the Socialists is that the opposition has a strong popular base and this fact combined with the stagflationary backdrop will keep political polarization high and undermine the government’s staying power (Chart 11, third panel). While Prime Minister Boris Johnson has survived the scandal over attending social events during Covid lockdowns, as we expected, nevertheless the Labour Party is starting to make a comeback that will gain momentum ahead of the 2024 general election. Labour is unlikely to embrace fiscal austerity or attempt to reverse Brexit anytime soon. Hence the UK’s inflationary backdrop will persist (Chart 11, fourth panel). Bottom Line: European political risk has bottomed and will rise in the coming months and years, although the EU and Eurozone will survive. We still favor UK equities over developed market equities (excluding the US) because they are heavily tilted toward consumer staples and energy sectors. Stay long GBP-CZK. Favor European defense stocks over tech. Prefer Spanish stocks over Italian. China: Social Unrest More Likely China’s historic confluence of internal and external risks continues – and hence it is too soon for global investors to try to bottom-feed on Chinese investable equities (Chart 12). A tactical opportunity might emerge for non-US investors in 2023 but now is not the right time to buy. Chart 12China: GeoRisk Indicator
China: GeoRisk Indicator
China: GeoRisk Indicator
In domestic politics, the reversion to autocracy under Xi is exacerbating the economic slowdown. True, Beijing is stimulating the economy by means of its traditional monetary and fiscal tools. The latest data show that the total social financing impulse is reviving, primarily on the back of local government bonds (Chart 13). Yet overall social financing is weaker because private sector sentiment remains downbeat. The government is pursuing excessively stringent social restrictions in the face of the pandemic. Beijing is doubling down on “Covid Zero” policy by locking down massive cities such as Shanghai. The restrictions will fail to prevent the virus from spreading. They are likely to engender social unrest, which we flagged as our top “Black Swan” risk this year and is looking more likely. Lockdowns will also obstruct production and global supply chains, pushing up global goods inflation. Meanwhile the property sector continues to slump on the back of weak domestic demand, large debt levels, excess capacity, regulatory scrutiny, and negative sentiment. Consumer borrowing appetite and general animal spirits are weak in the face of the pandemic and repressive political environment (Chart 14). Chart 13China's Stimulus Has Clearly Arrived
China's Stimulus Has Clearly Arrived
China's Stimulus Has Clearly Arrived
Chart 14Yet Chinese Animal Spirits Still Suffering
Yet Chinese Animal Spirits Still Suffering
Yet Chinese Animal Spirits Still Suffering
Hence China will be exporting slow growth and inflation – stagflation – to the rest of the world until after the party congress. At that point President Xi will feel politically secure enough to “let 100 flowers bloom” and try to improve economic sentiment at home and abroad. This will be a temporary phenomenon (as were the original 100 flowers under Chairman Mao) but it will be notable for 2023. In foreign politics, Russia’s attack on Ukraine has accelerated the process of Russo-Chinese alliance formation. This partnership will hasten US containment strategy toward China and impose a much faster economic transition on China as it pursues self-sufficiency. The result will be a revival of US-China tensions. The implications are negative for the rest of Asia Pacific: Taiwanese geopolitical risk will continue rising for reasons we have outlined in previous reports. In addition, Taiwanese equities are finally starting to fall off from the pandemic-induced semiconductor rally (Chart 15). The US and others are also pursuing semiconductor supply security, which will reduce Taiwan’s comparative advantage. Chart 15Taiwan: GeoRisk Indicator
Taiwan: GeoRisk Indicator
Taiwan: GeoRisk Indicator
South Korea faces paralysis and rising tensions with North Korea. The presidential election on May 9 brought the conservatives back into the Blue House. The conservative People Power Party’s candidate, Yoon Suk-yeol, eked out a narrow victory that leaves him without much political capital. His hands are also tied by the National Assembly, at least for the next two years. He will attempt to reorient South Korean foreign policy toward the US alliance and away from China. He will walk away from the “Moonshine” policy of engagement with North Korea, which yielded no fruit over the past five years. North Korea has responded by threatening a nuclear missile test, restarting intercontinental ballistic missile tests for the first time since 2017, and adopting a more aggressive nuclear deterrence policy in which any South Korean attack will ostensibly be punished by a massive nuclear strike. Tensions on the peninsula are set to rise (Chart 16). Three US aircraft carrier groups are around Japan today, despite the war in Europe (where two are placed), suggesting high threat levels. Chart 16South Korea: GeoRisk Indicator
South Korea: GeoRisk Indicator
South Korea: GeoRisk Indicator
Australia’s elections present opportunity rather than risk. Prime Minister Scott Morrison formally scheduled them for May 21. The Australian Labor Party is leading in public opinion and will perform well. The election threatens a change of parties but not a drastic change in national policy – populist parties are weak. No major improvement in China relations should be expected. Any temporary improvement, as with the Biden administration, will be subject to reversal due to China’s long-term challenge to the liberal international order. Cyclically the Australian dollar and equities stand to benefit from the global commodity upcycle as well as relative geopolitical security due to American security guarantees (Chart 17). Chart 17Australia: GeoRisk Indicator
Australia: GeoRisk Indicator
Australia: GeoRisk Indicator
Bottom Line: China’s reversion to autocracy will keep global sentiment negative on Chinese equities until 2023 at earliest. Stay short the renminbi and Taiwanese dollar. Favor the Japanese yen over the Korean won. Favor South Korean over Taiwanese equities. Look favorably on the Australian dollar. Turkey, South Africa, And … Canada Turkish geopolitical risk will remain elevated in the context of a rampant Russia, NATO’s revival and tensions with Russia, the threat of commerce destruction and accidents in the Black Sea region, domestic economic mismanagement, foreign military adventures, and the threat posed to the aging Erdogan regime by the political opposition in the wake of the pandemic and the lead-up to the 2023 elections (Chart 18). Chart 18Turkey: GeoRisk Indicator
Turkey: GeoRisk Indicator
Turkey: GeoRisk Indicator
While we are tactically bullish on South African equities and currency, we expect South African political risk to rise steadily into the 2024 general election. Almost a year has passed since the civil unrest episode of 2021. Covid-19 lockdowns have been lifted and the national state of disaster has ended, which has helped quell social tensions. This is evident in the decline of our South Africa GeoRisk indicator from 2021 highs (Chart 19). While fiscal austerity is under way in South Africa, we have argued that fiscal policy will reverse course in time for the 2024 election. In this year’s fiscal budget, the budget deficit is projected to narrow from -6% to -4.2% over the next two years. Government has increased tax revenue collection through structural reforms that are rooting out corruption and wasteful expenditure. But the ANC will have to tap into government spending to shore up lost support come 2024. Thus South Africa benefits tactically from commodity prices but cyclically the currency is vulnerable. Chart 19South Africa: GeoRisk Indicator
South Africa: GeoRisk Indicator
South Africa: GeoRisk Indicator
Canadian political risk will rise but that should not deter investors from favoring Canadian assets that are not exposed to the property bubble. Prime Minister Justin Trudeau has had a net negative approval rating since early 2021 and his government is losing political capital due to inflation, social unrest, and rising difficulties with housing affordability (Chart 20). While he does not face an election until 2025, the Conservative Party is developing more effective messaging. Chart 20Canada: GeoRisk Indicator
Canada: GeoRisk Indicator
Canada: GeoRisk Indicator
India Will Stay Neutral But Lean Toward The West Chart 21Sino-Pak Alliance’s Geopolitical Power Is Thrice That Of India
Le Pen And Other Hurdles (GeoRisk Update)
Le Pen And Other Hurdles (GeoRisk Update)
US President Joe Biden has openly expressed his administration’s displeasure regarding India’s response to Russia’s invasion of Ukraine. This has led many to question the strength of Indo-US relations and the direction of India’s geopolitical alignments. To complicate matters, China’s overtures towards India have turned positive lately, leading clients to ask if a realignment in Indo-China relations is nigh. To accurately assess India’s long-term geopolitical propensities, it is important to draw a distinction between ‘cyclical’ and ‘structural’ dynamics that are at play today. Such a distinction yields crystal-clear answers about India’s strategic geopolitical leanings. In specific: Indo-US Relations Will Strengthen On A Strategic Horizon: As the US’s and China’s grand strategies collide, minor and major geopolitical earthquakes are bound to take place in South Asia and the Indo-Pacific. Against this backdrop, India will strategically align with the US to strengthen its hand in the region (Chart 21). While the Russo-Ukrainian war is a major global geopolitical event, for India this is a side-show at best. True, India will retain aspects of its historic good relations with Russia. Yet countering China’s encirclement of India is a far more fundamental concern for India. Since Russia has broken with Europe, and China cannot reject Russia’s alliance, India will gradually align with the US and its allies. India And China Will End Up As A Conflicting Dyad: Strategic conflict between the two Asian powers is likely because China’s naval development and its Eurasian strategy threaten India’s national security and geopolitical imperatives, while India’s alliances are adding to China’s distrust of India. Thus any improvement in Sino-Indian diplomatic relations will be short-lived. The US will constantly provide leeway for India in its attempts to court India as a key player in the containment strategy against China. The US and its allies are the premier maritime powers and upholders of the liberal world order – India serves its national interest better by joining them rather than joining China in a risky attempt to confront the US navy and revolutionize the world order. Indo-Russian Relations Are Bound To Fade In The Long Run: India will lean towards the US over the next few years for reasons of security and economics. But India’s movement into America’s sphere of influence will be slow – and that is by design. India is testing waters with America through networks like the Quadrilateral Dialogue. It sees its historic relationship with Russia as a matter of necessity in the short run and a useful diversification strategy in the long run. True, India will maintain a trading relationship with Russia for defense goods and cheap oil. But this trade will be transactional and is not reason enough for India to join Russia and China in opposing US global leadership. While these factors will mean that Indo-Russian relations are amicable over a cyclical horizon, this relationship is bound to fade over a strategic horizon as China and Russia grow closer and the US pursues its grand strategy of countering China and Russia. Bottom Line: India may appear to be neutral about the Russo-Ukrainian war but India will shed its historical stance of neutrality and veer towards America’s sphere of influence on a strategic timeframe. India is fully aware of its strategic importance to both the American camp and the Russo-Chinese camp. It thus has the luxury of making its leanings explicit after extracting most from both sides. Long Brazil / Short India Brazil’s equity markets have been on a tear. MSCI Brazil has outperformed MSCI EM by 49% in 2022 YTD. Brazil’s markets have done well because Brazil is a commodity exporter and the war in Ukraine has little bearing on faraway Latin America. This rally will have legs although Brazil’s political risks will likely pick back up in advance of the election (Chart 22). The reduction in Brazil’s geopolitical risk so far this year has been driven mainly by the fact that the currency has bounced on the surge in commodity prices. In addition, former President Lula da Silva is the current favorite to win the 2022 presidential elections – Lula is a known quantity and not repugnant to global financial institutions (Chart 23). Chart 22Brazil's Markets Have Benefitted From Rising Commodity Prices
Brazil's Markets Have Benefitted From Rising Commodity Prices
Brazil's Markets Have Benefitted From Rising Commodity Prices
Chart 23Brazil: Watch Out For Political Impact Of Commodity Prices
Brazil: Watch Out For Political Impact Of Commodity Prices
Brazil: Watch Out For Political Impact Of Commodity Prices
Whilst there is no denying that the first-round effects of the Ukraine war have been positive for Brazil, there is a need to watch out for the second-round effects of the war as Latin America’s largest economy heads towards elections. Surging prices will affect two key constituencies in Brazil: consumers and farmers. Consumer price inflation in Brazil has been ascendant and adding to Brazil’s median voter’s economic miseries. Rising inflation will thus undermine President Jair Bolsonaro’s re-election prospects further. The fact that energy prices are a potent polling issue is evinced by the fact that Bolsonaro recently sacked the chief executive of Petrobras (i.e. Brazil’s largest listed company) over rising fuel costs. Furthermore, Brazil is a leading exporter of farm produce and hence also a large importer of fertilizers. Fertilizer prices have surged since the war broke out. This is problematic for Brazil since Russia and Belarus account for a lion’s share of Brazil’s fertilizer imports. Much like inflation in general, the surge in fertilizer prices will affect the elections because some of the regions that support Bolsonaro also happen to be regions whose reliance on agriculture is meaningful (Map 1). They will suffer from higher input prices. Map 1States That Supported Bolso, Could Be Affected By Fertilizer Price Surge
Le Pen And Other Hurdles (GeoRisk Update)
Le Pen And Other Hurdles (GeoRisk Update)
Chart 24Long Brazil Financials / Short India
Long Brazil Financials / Short India
Long Brazil Financials / Short India
Given that Bolsonaro continues to lag Lula on popularity ratings – and given the adverse effect that higher commodity prices will have on Brazil’s voters – we expect Bolsonaro to resort to fiscal populism or attacks on Brazil’s institutions in a last-ditch effort to cling to power. He could even be emboldened by the fact that Sérgio Moro, the former judge and corruption fighter, decided to pull out of the presidential race. This could provide a fillip to Bolso’s popularity. Bottom Line: Brazil currently offers a buying opportunity owing to attractive valuations and high commodity prices. But investors should stay wary of latent political risks in Brazil, which could manifest themselves as presidential elections draw closer. We urge investors to take-on only selective tactical exposure in Brazil for now. Equities appear cheap but political and macro risks abound. To play the rally yet stave off political risk, we suggest a tactical pair trade: Long Brazil Financials / Short India (Chart 24). Whilst we remain constructive on India on a strategic horizon, for the next 12 months we worry about near-term macro and geopolitical headwinds as well as India’s rich valuations. Don’t Buy Into Pakistan’s Government Change Chart 25Pakistan’s Military Is Unusually Influential
Le Pen And Other Hurdles (GeoRisk Update)
Le Pen And Other Hurdles (GeoRisk Update)
The newest phase in Pakistan’s endless cycle of political instability has begun. Prime Minister Imran Khan has been ousted. A new coalition government and a new prime minister, Shehbaz Sharif, have assumed power. Prime Minister Sharif’s appointment may make it appear like risks imposed by Pakistan have abated. After all, Sharif is seen as a good administrator and has signaled an interest in mending ties with India. But despite the appearance of a regime change, geopolitical risks imposed by Pakistan remain intact for three sets of reasons: Military Is Still In Charge: Pakistan’s military has been and remains the primary power center in the country (Chart 25). Former Prime Minister Khan’s rise to power was possible owing to the military’s support and he fell for the same reason. Since the military influences the civil administration as well as foreign policy, a lasting improvement in Indo-Pak relations is highly unlikely. Risk Of “Rally Round The Flag” Diversion: General elections are due in Pakistan by October 2023. Sharif is acutely aware of the stiff competition he will face at these elections. His competitors exist outside as well as inside his government. One such contender is Bilawal Bhutto-Zardari of the Pakistan People’s Party (PPP), which is a key coalition partner of the new government that assumed power. Imran Khan himself is still popular and will plot to return to power. Against such a backdrop the newly elected PM is highly unlikely to pursue an improvement in Indo-Pak relations. Such a strategy will adversely affect his popularity and may also upset the military. Hence we highlight the risk of the February 2021 Indo-Pak ceasefire being violated in the run up to Pakistan’s general elections. India’s government has no reason to prevent tensions, given its own political calculations and the benefits of nationalism. Internal Social Instability Poor: Pakistan is young but the country can be likened to a social tinderbox. Many poor youths, a weak economy, and inadequate political valves to release social tensions make for an explosive combination. Pakistan remains a source of geopolitical risk for the South Asian region. Some clients have inquired as to whether the change of government in Pakistan implies closer relations with the United States. The US has less need for Pakistan now that it has withdrawn from Afghanistan. It is focused on countering Russia and China. As such the US has great need of courting India and less need of courting Pakistan. Pakistan will remain China’s ally and will struggle to retain significant US assistance. Bottom Line: We remain strategic sellers of Pakistani equities. Pakistan must contend with high internal social instability, a weak democracy, a weak economy and an unusually influential military. As long as the military remains excessively influential in Pakistan, its foreign policy stance towards India will stay hostile. Yet the military will remain influential because Pakistan exists in a permanent geopolitical competition with India. And until Pakistan’s economy improves structurally and endemically, its alliance with China will stay strong. Investment Takeaways Cyclically go long US 10-year Treasuries. Geopolitical risks are historically high and rising but complacency is returning to markets. Meanwhile inflation is nearing a cyclical peak. Favor US stocks over global. It is too soon to go long euro or European assets, especially emerging Europe. Favor UK equities over developed markets (excluding the US). Stay long GBP-CZK. Favor European defense stocks over European tech. Stay short the Chinese renminbi and Taiwanese dollar. Favor the Japanese yen over the Korean won. Favor South Korean over Taiwanese equities. Matt Gertken Chief Geopolitical Strategist mattg@bcaresearch.com Ritika Mankar, CFA Editor/Strategist ritika.mankar@bcaresearch.com Jesse Anak Kuri Associate Editor Jesse.Kuri@bcaresearch.com Yushu Ma Research Analyst yushu.ma@bcaresearch.com Guy Russell Senior Analyst GuyR@bcaresearch.com Alice Brocheux Research Associate alice.brocheux@bcaresearch.com Strategic Themes Open Tactical Positions (0-6 Months) Open Cyclical Recommendations (6-18 Months) Regional Geopolitical Risk Matrix Section III: Geopolitical Calendar
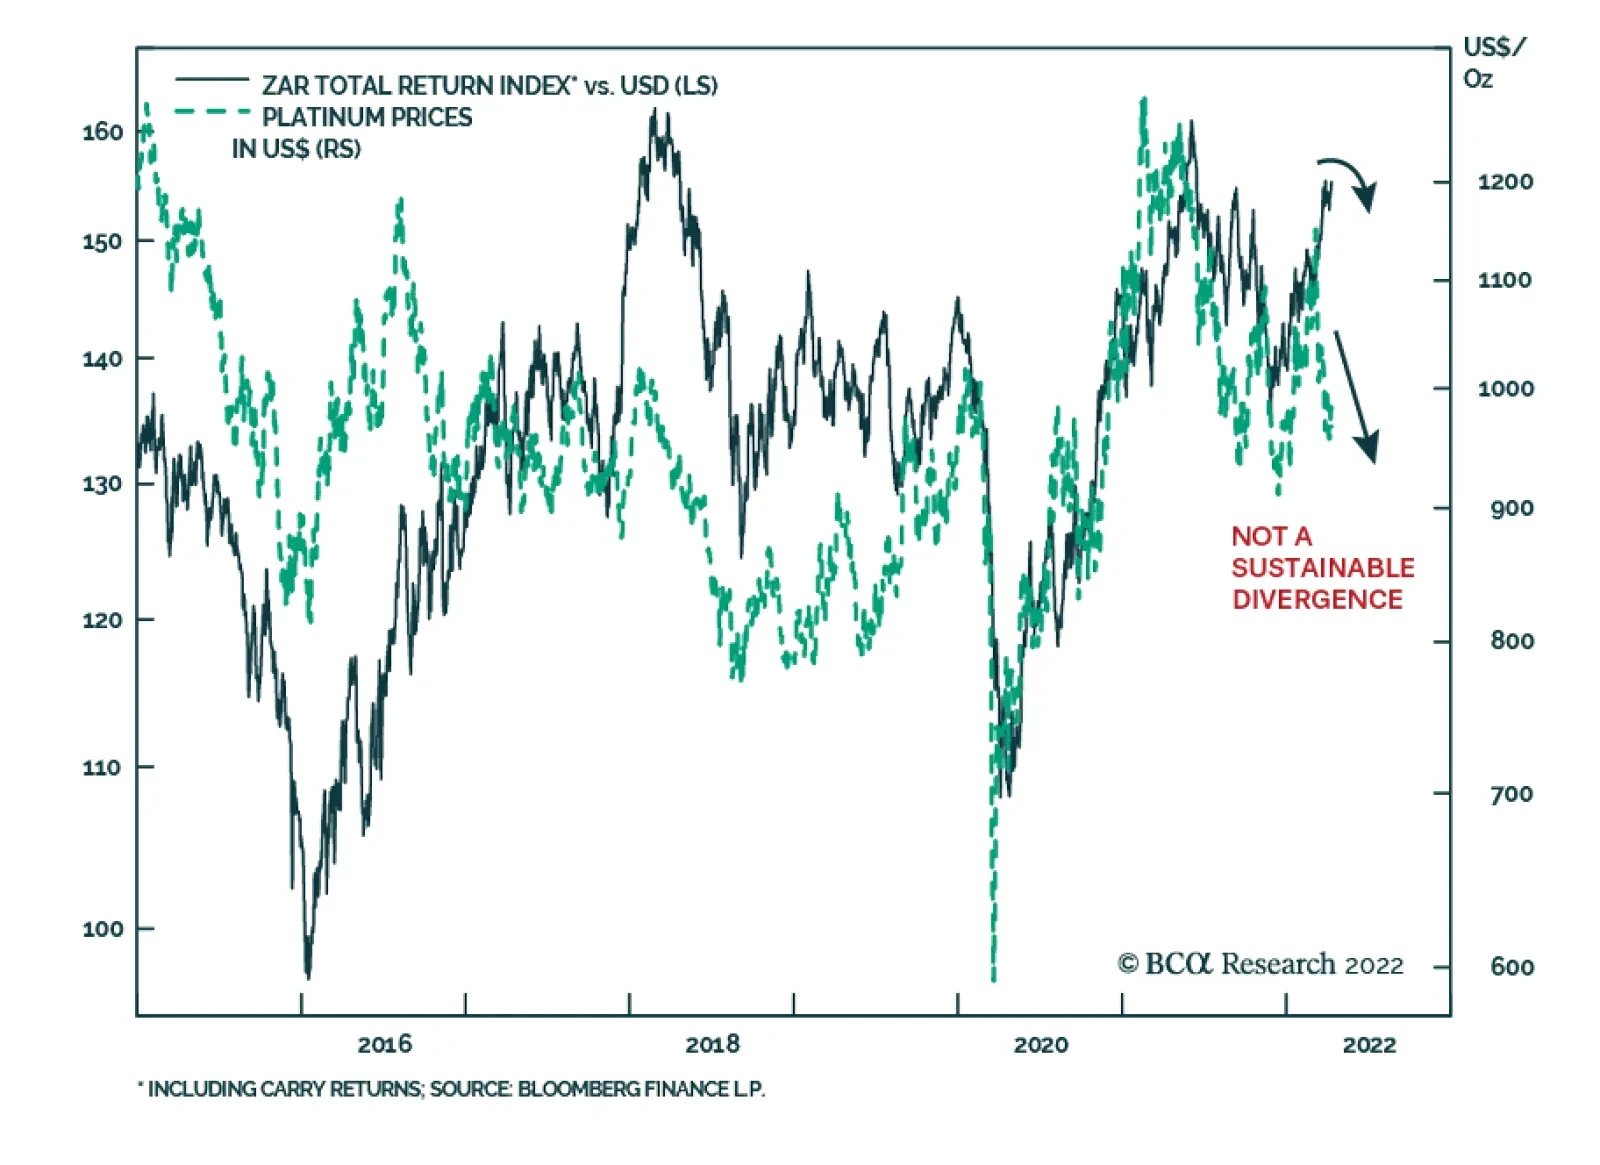
South African financial markets have shot up and have dramatically outperformed their EM peers. The rotation into commodities following Russia’s invasion of Ukraine has greatly benefited commodity plays like South Africa. That said, in absolute terms,…
Executive Summary Onshore Equity Market Outflow Pressures Remain, At Least In The Near Term
Onshore Equity Market Outflow Pressures Remain, At Least In The Near Term
Onshore Equity Market Outflow Pressures Remain, At Least In The Near Term
China’s foreign exchange (FX) reserves fell in the first three months of 2022. The reduction was the largest quarterly fall since 2016, but it is minor in absolute terms given China’s massive FX reserves. However, the underlying drivers of the decline in the FX reserves are cause for concern. The current drawdown in FX reserves reflects losses in China’s official FX asset portfolio and increased capital outflows, which differs from in 2H20 when Chinese banks increased their FX purchases to slow the pace of the RMB appreciation. Onshore equity market net outflows will likely continue in the near term. Even though Beijing has stepped up stimulus measures, private sector sentiment and domestic demand remain subdued. The country’s zero-tolerance COVID policy will also continue to weigh down the effectiveness of the stimulus. Pressure on the bond market’s outflow will be sustained in the next 6 to 12 months as policy cycles between the US and China continue to diverge. The RMB will modestly devalue relative to the USD in the next few month. In the longer term, the RMB should be underpinned by fundamentals such as a current account surplus, positive real interest rates and a valuation cushion. Bottom Line: The drop in the first quarter FX reserves reflects losses in China’s official FX asset portfolio and increased capital outflows. Feature Chart 1The Quarterly Drop In China's FX Reserves This Year Was Largest Since 2016
The Quarterly Drop In China's FX Reserves This Year Was Largest Since 2016
The Quarterly Drop In China's FX Reserves This Year Was Largest Since 2016
Newly released data shows that China’s FX reserves dropped by US$25.8 billion to US$3.188 trillion in March. This represented a US$62 billion decrease from December 2021 and it was the largest quarterly drop since 2016 (Chart 1). The RMB also weakened slightly in March from February. The reduction in China’s FX reserves in Q1 is due to several factors, including fluctuations in the dollar versus other major currencies and the drop in market prices of foreign asset holdings. The country’s current account surplus also narrowed in the first three months of the year compared with Q4 last year. Notably, foreign holdings of Chinese local currency bonds posted a record decline in Q1 and onshore equity market outflows also accelerated. The illicit movement of capital via import over-invoicing has also picked up. We expect that the bond market outflow pressure will continue for the year and perhaps beyond as economic, inflation and monetary policy cycles in China and the US continue to diverge. Equity outflow pressures will also be sustained, at least through the next few months, while China’s COVID-induced lockdown measures in major cities significantly weaken the economic outlook. Furthermore, the country’s zero-tolerance toward COVID will continue restraining mobility in 2H22. Anticipated lockdowns will severely disrupt the local economy and weigh down the effectiveness of Chinese stimulus, which policymakers had pledged to boost. As such, we maintain our neutral position on Chinese onshore stocks and an underweight stance on Chinese investable stocks in a global portfolio. A Drawdown In FX Reserves Chart 2The Size Of Capital Outflows In Q1 Is Comparable To That In 2H20
The Size Of Capital Outflows In Q1 Is Comparable To That In 2H20
The Size Of Capital Outflows In Q1 Is Comparable To That In 2H20
Capital outflows intensified in Q1, with the magnitude similar to 2H20 (Chart 2). However, the underlying drivers of the depletion have changed. In 2H20, China’s state-owned banks strategically accumulated FX assets to slow the pace of a rising RMB, whereas the Q1 loss this year was mainly driven by fluctuations in global financial markets and weak domestic economic fundamentals. The reduction in China’s official FX reserves in the past three months was partly due to a stronger dollar versus other major currencies and price declines in China’s holdings of foreign currency assets. China's official FX reserves are marked-to-market and converted into US dollars. The value of China’s official reserves has been significantly impacted by two factors: the dollar’s increase of more than 4% in trade-weighted terms since its trough in May last year and the simultaneous decline in prices of both global stocks and bonds in Q1 2022 (Chart 3). In addition, China’s trade surplus narrowed in the first two months of the year from Q4 2021 and has likely dipped further in March (data has not yet been released) (Chart 4). Slower growth in China’s exports, coupled with rising global commodity prices that boosted China’s commodity import costs, has probably contributed to a smaller current account surplus, which was insufficient to offset the increased capital outflows. Chart 3The Dollar Exchange Rate And The Value Of China's Official FX Reserves
The Dollar Exchange Rate And The Value Of China's Official FX Reserves
The Dollar Exchange Rate And The Value Of China's Official FX Reserves
Chart 4China's Trade Surplus Narrowed In Q1 This Year
China's Trade Surplus Narrowed In Q1 This Year
China's Trade Surplus Narrowed In Q1 This Year
Meanwhile, the acceleration in capital outflows does not seem to be driven by an increase in China’s domestic banks and companies’ foreign currency holdings. It does not appear that banks have been buying foreign currencies to slow down the pace of the RMB appreciation against other currencies. As noted in a previous report since 2018 net FX purchases by China’s banks have been more tightly correlated with the spread between the CNY/USD exchange rate and the CFETS index (Chart 5, top panel). When the RMB falls relative to the USD, but not by enough to slow its increase against other trading partners, China’s banks would ramp up their FX purchases to push down the CNY/USD exchange rate and/or raise the value of other currencies in the CFETS basket (Chart 5, bottom panel). This occurred in 2H20 but does not seem to be the case this year. Chart 5No Sign Of Chinese Banks' Ramping Up FX Purchases This Year
No Sign Of Chinese Banks' Ramping Up FX Purchases This Year
No Sign Of Chinese Banks' Ramping Up FX Purchases This Year
Chart 6FX Settlement Has Been Net Positive...
FX Settlement Has Been Net Positive...
FX Settlement Has Been Net Positive...
Chinese companies have not increased their demands for USD either. Chart 6 shows a positive net FX settlement rate by banks on behalf of clients. This means more non-financial enterprises (such as exporters and investors) sold their foreign exchange holdings to banks than bought foreign exchange from banks. Moreover, Chart 7 highlights that the level of Chinese firms’ short-term foreign obligations (outstanding foreign currency loans, trade credit and liquid deposits) has remained steady. This implies that domestic firms have not been rushing to buy FX to pay back their dollar-denominated debts. Chart 7…And Chinese Firms Are Not Rushing To Pay Off External Debt
A Fall In China’s FX Reserves: Cause For Concern?
A Fall In China’s FX Reserves: Cause For Concern?
Bottom Line: Q1’s capital outflows were not driven by Chinese banks’ strategic accumulation of FX reserves to slow the pace of the RMB’s appreciation, nor by the demand for USD by Chinese companies. Accelerated Portfolio Outflows China's recent capital drain may be grouped into two categories: reduced foreign portfolio inflows (and accelerated outflows) and the illicit seepage of capital. China’s bond market contributed largely to the acceleration in Q1’s portfolio outflows. Foreign holding of Chinese bonds posted a record depletion of US$30 billion in February and March this year and the trend likely continued through April (Chart 8). As the Fed enters its hiking cycle following the March lift-off, the US-China nominal interest rate has narrowed meaningfully (Chart 9). Despite a widening inflation gap between the US and China, China’s bond market has become less attractive to global investors compared with last year (Chart 9, bottom panel). Chart 8A Record Bond Market Outflow In Q1 This Year
A Record Bond Market Outflow In Q1 This Year
A Record Bond Market Outflow In Q1 This Year
Chart 9Rate Differentials Between China and The US Have Narrowed Substantially, In Both Nominal And Real Terms
Rate Differentials Between China and The US Have Narrowed Substantially, In Both Nominal And Real Terms
Rate Differentials Between China and The US Have Narrowed Substantially, In Both Nominal And Real Terms
Outflows from onshore equity market also accelerated in Q1, in part because of China’s disappointing domestic economic data, rising geopolitical tensions and risk-off sentiment among global investors. Losses of Northbound net flows reached US$7.6 billion in March, comparable to the amount in early 2020 when China was hit hard by the pandemic (Chart 10). Importantly, while service trade deficits from outbound tourism continued to narrow due to international travel restrictions, our estimate of the illicit capital seepage through import over-invoicing has gathered speed since 2H21 (Chart 11). The sharp rise in our illicit capital outflow indicator suggests that the private sector and Chinese residents may be moving capitals offshore. Chart 10Chinese Onshore Equity Market Also Saw Substantial Investment Outflows In Q1
Chinese Onshore Equity Market Also Saw Substantial Investment Outflows In Q1
Chinese Onshore Equity Market Also Saw Substantial Investment Outflows In Q1
Chart 11Illicit Capital Outflows Picked Up
Illicit Capital Outflows Picked Up
Illicit Capital Outflows Picked Up
Bottom Line: The drain of capital escalated in Q1 through accelerated foreign portfolio outflows and perhaps illicit capital streaming out of the country. Investment Conclusions Chart 12Onshore Equity Market Outflow Pressures Remain, At Least In The Near Term
Onshore Equity Market Outflow Pressures Remain, At Least In The Near Term
Onshore Equity Market Outflow Pressures Remain, At Least In The Near Term
Equity market net outflows will likely continue, at least for the next couple months while China struggles to contain the ongoing COVID flareups in major cities. We maintain our recommended neutral allocation to Chinese onshore stocks and an underweight stance on Chinese offshore stocks in a global equity portfolio (Chart 12). While China’s stimulus should be able to stabilize the economy over a cyclical time horizon (the next 6 to 12 months), the nation’s zero-tolerance COVID position poses significant downside risks to the effectiveness of policy easing. It will be harder for China to contain infections as the virus mutates and variants become more contagious. There may be more frequent and larger-scale lockdowns affecting the economy than there have been in the past two years. Meanwhile, outflow pressures on China’s bond market may carry on through the next 6 to 12 months while the economic, inflation and monetary policy cycles in the US and China continue to diverge. Although the RMB has not moved into outright expensive territory, reduced foreign portfolio flows into RMB assets and a smaller current account surplus will pose near-term downward stress on the RMB against the USD. A depreciation in the RMB would be a boon to China’s domestic economy since it will help the export sector pricing power. Beyond the near term and in the next 12 to 18 months, however, fundamentals, such as China’s current account surplus, positive real interest rates and a valuation cushion, will underpin strength in the RMB (Chart 13A & 13B). Chart 13AOnshore Equity Market Outflow Pressures Remain, At Least In The Near Term
The RMB Is At Fair Value Based On Productivity Trends...
The RMB Is At Fair Value Based On Productivity Trends...
Chart 13B...But Is Cheap Based On Relative Prices
...But Is Cheap Based On Relative Prices
...But Is Cheap Based On Relative Prices
Jing Sima China Strategist jings@bcaresearch.com Strategic Themes Cyclical Recommendations