Equities
Headwinds to the growth outlook have increased since the beginning of the year. The Russia-Ukraine war has caused commodity prices to surge which raises upside risks to inflation and threatens to weigh down on consumers’ purchasing power. Similarly, lockdowns…
The M&A Boom Is Over
The M&A…

Dear client, In lieu of April 18 publication, I will be hosting our quarterly webcast. Our regular weekly publication will resume Monday, April 25. Kind Regards, Irene Tunkel Chief Strategist, US Equity Strategy Executive Summary R&D Is Paying Off
Is It Time To Invest In "Green And Clean"?
Is It Time To Invest In "Green And Clean"?
What Is Renewable Energy: It consists of new utilities companies that generate electricity using clean technologies including wind, solar, hydro, biomass, geothermal, nuclear and other. Currently, renewables are becoming a dominant source of new power generation as their costs becoming comparable to the ones of traditional fossil fuels. Industry Breakthroughs: Increased renewables adaptation is possible due to several technological advancements including improved battery storage, implementation of smart grid networks, and an increase in carbon capture activities. Renewables And Cleantech Investment Characteristics: The majority of renewable energy and cleantech companies tend to be smaller than established utilities. As a result, they are highly correlated with the small-cap growth indices. Key Macroeconomic Drivers: Just like small caps, renewables are highly sensitive to economic growth and monetary conditions. Currently, rolling over global PMIs as well as tightening liquidity conditions spell trouble for the sensitive green-tech stocks. Fundamentals Overview: The industry is characterized by extremely volatile fundamental data, once again underscoring its small-cap growth-like nature. That said, margins are healthy, capex growth is in the positive territory, while valuations are on the expensive side. The policy backdrop is also favorable, as we will show in a sequel to this report. Bottom Line: On a structural basis, renewable energy and cleantech companies are at the core of the global push to diversify energy sources and mitigate climate change. They enjoy a temporary tailwind from the US administration and a more lasting tailwind from the geopolitical need for energy security. However, over the near term, renewables face headwinds from tighter monetary policy and slowing growth. Feature Introduction Climate change is at the forefront of many investors’ minds. BCA Research has covered some of the key trends and challenges in the Climate Change Special Report, published three years ago, and in its coverage of the Biden administration. But this subject is just as relevant today. For much of the past decade, renewable energy and clean technology companies have flourished, enjoying tailwinds from a secular push towards green and renewable energy (Chart 1). However, in February 2021, the group collapsed with many clean energy stocks down more than 50% off-peak. Recently, renewables have rebounded on the back of the war in Ukraine and the surge in energy prices and diversification (Chart 2). Chart 1The Industry's Performance...
The Industry's Performance...
The Industry's Performance...
Chart 2...Is Very Volatile
Is It Time To Invest In "Green And Clean"?
Is It Time To Invest In "Green And Clean"?
In this report, we conduct a “deep dive” into various types of renewable energy and clean technologies, to gauge their commercial potential and investment attractiveness. We will try to get to the bottom of the question of whether “green and clean” is a lucrative investment theme, and when may be a good entry point. What Is “Green And Clean”? According to International Renewable Energy Agency (IRENA), 90% of all decarbonization in 2050 will involve renewable energy through a direct supply of low-cost power, efficiency, electrification, bioenergy with carbon capture, and green hydrogen. All of these technologies fall into one of the two intertwined tracks: Renewables and Cleantech. Renewable Energy Companies Are The New Utilities Renewable energy is mostly represented by the companies in the Utilities sector that generate power from sustainable sources, such as solar photovoltaic (PV), wind, hydropower, and renewable hydrogen in fuel cells. These companies then sell that electricity at either market or contracted rates. Despite the novel technologies they leverage, from an investment standpoint, these companies are not much different than traditional utilities in terms of their business model. However, a whole ecosystem has developed around solar and wind energy-producing companies: Producers of raw materials, manufacturers of solar batteries, wind turbines, and systems and components, along with companies that offer installation and maintenance services. Many of these companies may be described as Cleantech. Cleantech Is A High Tech Take On Solving Climate Change Cleantech uses nascent technologies to reduce the carbon footprint of mundane human activities, such as heating homes, driving, and growing food supplies. Technologies being developed are energy storage batteries, smart grid implementation, carbon capture, energy efficiency, and many others. In addition, the Cleantech sector includes renewable energy equipment manufacturers that produce such components as wind turbines, solar panels and cells, and solar inverters. Clearly, Cleantech has a broad reach and spans a wide range of sectors, such as Technology, Material, and Industrials (Table 1). Cleantech offers more tech-like higher-risk, higher-reward potential payoffs than renewable energy production. Let’s take a close look at these technologies. Table 1Renewables Performance Statistics Versus S&P Sectors
Is It Time To Invest In "Green And Clean"?
Is It Time To Invest In "Green And Clean"?
Renewable Energy Renewable Energy Sources Are Replacing Fossil Fuels Over the past 20 years, this country has made significant strides in shifting its energy generation toward renewable sources away from fossil fuels, increasing the share of clean energy from 3.7% in 2000, to 10% in 2020 (Chart 3). Non-hydro renewable generation, which includes wind, solar, geothermal, and biomass sources of power, accounted for 65% of US renewable electricity production in 2020. Chart 3A Structural Trend
Is It Time To Invest In "Green And Clean"?
Is It Time To Invest In "Green And Clean"?
New Installations Are Dominated By Renewables Chart 4Share Of New Electricity Capacity
Is It Time To Invest In "Green And Clean"?
Is It Time To Invest In "Green And Clean"?
Renewables are becoming a dominant source of new power generation. In terms of new electricity capacity installations, over 80% in the US and 72% globally are renewables, and their share is growing steadily over time (Chart 4). In terms of growth, wind and solar dominate the category, with production increasing nearly exponentially over the past decade (Chart 5). Chart 5USA Renewable Energy Sources Breakdown
Is It Time To Invest In "Green And Clean"?
Is It Time To Invest In "Green And Clean"?
Power Generated By Renewables Is Cheaper Than Power Generated By Fossil Fuels The key reason for the proliferation of green energy generation is that renewable electricity is becoming cheaper than electricity produced by fossil fuels – according to IRENA, 62% of the added renewable power generation capacity had lower electricity costs than the cheapest source of new fossil fuel-fired capacity. Costs for renewable technologies continued to fall significantly over the past year:1 Concentrating solar power (CSP) fell by 85 percent Onshore wind by 56 percent Solar PV by 85 percent Offshore wind by 48 percent This trend is bolstering the economic case for transitioning to cleaner energy resources (Chart 6). Chart 6R&D Is Paying Off
Is It Time To Invest In "Green And Clean"?
Is It Time To Invest In "Green And Clean"?
Higher Production Translates Into Lower Prices Why are the prices of renewable alternatives falling so fast? Like traditional utilities, renewables require a massive upfront investment and, as a result, enjoy substantial operating leverage. However, with such high upfront costs, to achieve profitability, these companies need high production volumes. In addition, high production levels help these relatively young industries move up the experiential learning curve towards operational efficiencies. From 2010 to 2020, capacity increased nearly 4x for wind, 17.5x for solar PV,2 and 22x for lithium-ion batteries. With the rapid scaling of these technologies, cost declines range between 65-and 90%.3 Solar PV cumulative capacity vs price dynamic is a perfect illustration (Chart 7). Chart 7Solar PV Module Prices Versus Cumulative Capacity
Is It Time To Invest In "Green And Clean"?
Is It Time To Invest In "Green And Clean"?
Key Challenges Of Solar And Wind While solar and wind are the fastest growing and most promising renewable technologies, they are also facing some significant challenges, which imperil their wider adoption. There are limitations in grid connection and flexibility, fluctuations in amounts of energy these sources generate, and a dire need for technological innovation in battery storage and digital tools for demand-side management. Outlook For The Renewables Industry IRENA expects renewables to scale up from 14% of total energy today to around 40% in 2030. Global annual additions of renewable power would triple by 2030 as recommended by the Intergovernmental Panel on Climate Change (IPCC). Solar and wind power will attract a lion’s share of investments (Chart 8). Chart 8Renewable Energy Investment Breakdown
Is It Time To Invest In "Green And Clean"?
Is It Time To Invest In "Green And Clean"?
Breakthroughs In Cleantech Over the past few years, we have seen broad-based commercialization of novel climate-friendly technologies for fueling—no, charging our cars; warming our homes; and cleaning up greenhouse gases resulting from human activities. The following are just a few of the most prominent ones. Battery Storage Renewables like wind and solar are considered variable energy sources as the amount of energy they generate fluctuates over time. Energy supplies could be stabilized if excess supplies of energy could be stored quite literally for a rainy day. Utility-scale lithium-ion battery storage, which has gotten cheaper over time with battery prices decreasing on average by 18% annually from 2010 to 2019, is emerging as a viable option for storing excess energy for future use. Pairing lithium-ion batteries with nearby solar plants is known as “solar plus storage.” The dollar value of the US energy storage market is expected to grow more than twentyfold to nearly $11.5 billion by 2026, from an estimated $513 million in 2018, according to Wood Mackenzie, a global research and consultancy firm. Hydrogen Fuel Hydrogen is a clean fuel that, when consumed in a fuel cell, produces only water. Hydrogen can be produced from a variety of domestic resources, such as natural gas, nuclear power, biomass, and renewable power such as solar and wind. These qualities make it an attractive fuel option for transportation and electricity generation applications. It can be used in cars, in houses, for portable power, and in many more applications. Hydrogen is an energy carrier that can be used to store, move, and deliver energy produced from other sources.4 Today, hydrogen fuel can be produced through several methods. The most common methods are natural gas reforming (a thermal process), and electrolysis. Other methods include solar-driven and biological processes. A hydrogen fuel cell combines hydrogen and oxygen to produce electricity, heat, and water. As hydrogen is high in energy and produces almost no pollution, it can be used as fuel. Fuel cells are similar to batteries in that they produce electricity without combustion or emissions. Unlike batteries, fuel cells do not run down or need to recharge—as long as there’s a constant source of fuel and oxygen. Carbon Capture And Storage Carbon capture and storage (CCS) is the process of capturing carbon dioxide (CO2) before it enters the atmosphere, transporting it, and storing it (carbon sequestration) for centuries. Usually, the CO2 is captured from large point sources, such as a coal-fired power plant, a chemical plant, or a biomass power plant, and then stored in an underground geological formation. The aim is to prevent the release of CO2 from heavy industry with the intent of mitigating the effects of climate change.5 CCS efforts are targeted to neutralize emissions from manufacturing and power generation industries, which together account for about 70% of the world’s emissions.6 Companies like ExxonMobil are exploring direct air capture technology to scrub emissions out of the air and carbonate fuel cells to capture industrial emissions from flue gas streams of power plants or manufacturing facilities. Once considered fringe climate change mitigation methods, these processes are seeing wider acceptance as effective complements to conventional interventions. Smart Grid The smart grid is a planned nationwide network that uses information technology to deliver electricity efficiently, reliably, and securely. It's been called "electricity with a brain," "the energy internet," and "the electronet." Unlike today's grid, which primarily delivers electricity in a one-way flow from generator to outlet, the smart grid will permit the two-way flow of both electricity and information.7 Smart grid development will require investment across a wide range of technologies (Chart 9). Chart 9Smart Grid Investments Breakdown
Is It Time To Invest In "Green And Clean"?
Is It Time To Invest In "Green And Clean"?
Renewables And Cleantech Investment Characteristics The majority of renewable energy and cleantech companies tend to be smaller market cap-wise than established utilities or industrial companies and tend to inhabit small-cap and mid-cap indices. Life span-wise, these are younger companies, many of which are commercializing novel technologies and have high growth potential. It is not surprising that they are highly correlated with the small-cap growth indices (Chart 10). As quintessential growth companies, they reinvest aggressively into their business: Capex growth, while volatile, is high (Chart 11). As a result, many of these companies are highly indebted, although recently many of them have cleaned up their balance sheets (Chart 12). Chart 10Renewables Often Behave Like Small-cap Growth Stocks
Renewables Often Behave Like Small-cap Growth Stocks
Renewables Often Behave Like Small-cap Growth Stocks
Chart 11Volatile Capex
Volatile Capex
Volatile Capex
Chart 12Improving Balance Sheets
Improving Balance Sheets
Improving Balance Sheets
And it is worthwhile to point out that while many renewable energy companies fit squarely into the “utilities” category, don’t expect them to be boring, i.e., be a low volatility investment, or to pay dividends. Sales And Profitability Renewable energy generation and cleantech are good businesses with companies in the Wind index enjoying double-digit margins (Chart 13). Their earnings are also expected to grow at more than 30% per annum, which is consistent with IRENA’s high growth rate forecasts for the industry. Chart 13Steady Margins
Steady Margins
Steady Margins
Valuations Chart 14Cheaper, Yet Still Pricey
Cheaper, Yet Still Pricey
Cheaper, Yet Still Pricey
Valuations have come down substantially from the peak (Chart 14) but remain elevated. Trailing PEs for all renewable ETFs look rich (Table 2). High expected earnings growth and elevated valuations are highly consistent with the small-cap growth profile of these stocks.Table 2Cheaper, Yet Still Pricey
Is It Time To Invest In "Green And Clean"?
Is It Time To Invest In "Green And Clean"?
Therefore, we believe that fundamentals are unlikely to be a driver of the performance of these stocks, while macroeconomic and political backdrops are truly important. Key Macroeconomic Drivers As we have established, renewable energy and cleantech stocks are small-cap growth and, like the rest of their brethren, must be highly sensitive to economic growth and monetary conditions. As providers of alternative energy, they are also highly sensitive to the price of oil. Economic growth The pursuit of new technologies requires deep pockets. Without a benefactor, such as the government, renewables need strong economic growth that translates into strong sales and earnings growth to pursue lucrative new projects and develop their business (Chart 15). However, lately, global PMIs have turned down, signaling growth deceleration, which does not bode well for the industry. Chart 15Global Growth Headwinds Coupled With...
Global Growth Headwinds Coupled With...
Global Growth Headwinds Coupled With...
Monetary Conditions The survival and prosperity of renewable energy stocks are also tied to their ability to access cheap capital. As a result, their market performance is closely linked to liquidity (Chart 16). The industry is still in the early stages of its innovation cycle and requires significant Capex outlays to develop its offerings. As financial conditions tighten and liquidity shrinks, renewable companies can no longer access cheap funding and may have to postpone projects. Many of these companies are heavily indebted and may struggle to meet their financial obligations without cheap funding. As a result, these companies’ growth prospects and immediate bottom line may take a hit. Withdrawal of liquidity will also hurt highly inflated multiples of the group. Since the US is in the early innings of a steep tightening cycle, we consider monetary conditions a major headwind for renewables. Chart 16...A Liquidity Drought Spells Trouble
...A Liquidity Drought Spells Trouble
...A Liquidity Drought Spells Trouble
Cost of Oil And Alternative Energy Sources Oil and other fossil fuels are substitute goods from a renewable energy standpoint, providing customers with alternatives (Chart 17). Since resulting electricity is highly commoditized, customers are inclined to choose a cheaper option. Also, at times of shortages, either type of energy provider may be able to step in and pick up the slack. A recent spike in the performance of alternative energy stocks on the back of an energy crisis triggered by the war is a case in point. As long as supply disruptions in the energy space continue, renewables will outperform. However, the price of oil is a geopolitical gamble, and the probability of a downside move is higher than the probability of an upside move. Especially if geopolitical tensions are reduced or resolved faster than the market expects. Chart 17Keep An Eye On Energy When Investing In Renewables
Keep An Eye On Energy When Investing In Renewables
Keep An Eye On Energy When Investing In Renewables
How To Invest In Cleantech? There is a host of ETFs that offer investors a wide range of choices for access to renewable energy and cleantech themes (Table 3). These ETFs differ in geographic span, industry focus, liquidity, and cost, but all are viable investment options. Table 3Clean Tech ETFs
Is It Time To Invest In "Green And Clean"?
Is It Time To Invest In "Green And Clean"?
Investment Implications Renewable energy and cleantech companies are at the core of the global push to increase energy security and contain climate change. They enjoy a substantial tailwind from China and the EU, as well as a temporary tailwind from the Biden administration, which has put its weight behind a goal of swift transition of the economy to clean sources of energy. However, stocks of these companies fall squarely into the small-cap growth style bucket, and the macroeconomic backdrop characterized by slowing growth and tightening monetary conditions is highly unfavorable for the group. The surging price of oil is the only pillar supporting the recent outperformance of the group – however, a change in a geopolitical backdrop may send the price of oil spinning, taking renewables with it. While we believe that on a structural basis, renewables and cleantech present a tremendous opportunity to partake in a monumental energy transition, we also believe that over the short investment horizon, the probability of downside risk in performance is elevated. Bottom Line: “Green and Clean” are at the forefront of the global transition to renewable energy and clean technology and expected growth rates are unparalleled. However, over the near term, the group faces headwinds from tighter monetary policy and slowing growth, while the price of energy is a hostage to geopolitics and presents a downside risk if geopolitical tensions are reduced faster than expected. Irene Tunkel Chief Strategist, US Equity Strategy irene.tunkel@bcaresearch.com Appendix: Types Of Renewable Energy Solar Energy Photovoltaics (PV), also called solar cells, are electronic devices made of semiconducting material that convert sunlight directly into electricity. Solar panels were invented in the US in 1954 at Bell Labs. Today, PV is one of the fastest-growing renewable energy technologies. Solar PV installations can be combined to provide electricity on a commercial scale or arranged in smaller configurations for mini-grids or personal use. The cost of manufacturing solar panels has plummeted dramatically in the last decade, making them not only affordable but often the cheapest form of electricity. Concentrated solar power (CSP) uses mirrors to concentrate solar rays, which heat fluid into steam to drive a turbine and generate electricity. One of the main advantages of a CSP power plant over a solar PV power plant is that it can be equipped with molten salts in which heat can be stored, allowing electricity to be generated after the sun has set. Looking at solar power, the installed capacity of solar energy sources increased by 17.6x (1,763%) between 2010 and 2020 and is expected to increase sevenfold by 2030. The lifetime costs of solar modules are continuing to fall as innovations in PV cells continue to improve efficiency, which has improved by about 200% since the 1950s to around 15-16% today for commercially available panels. Lab results show cells can achieve efficiencies of over 40%. Wind energy is when the wind is harnessed to produce electricity using the kinetic energy created by air in motion. This is transformed into electrical energy using wind turbines or wind energy conversion systems. The output is proportional to the dimensions of the rotor and to the cube of the wind speed. Wind turbine capacity has increased over time. According to IRENA, global installed onshore and offshore wind generation capacity has tripled in the past decades. In 2016, wind energy accounted for 16% of the electricity generated by renewables. The wind will be one of the largest generation sources by 2030, supplying 24% of total electricity needs.8 Much of this recent growth can be attributed to innovation and the rapidly decreasing costs of underlying technologies. In 2019, 75% of the new onshore wind projects commissioned had a Levelized Cost Of Electricity (LCOE)9 lower than the cheapest new source of fossil fuel-fired power generation as, over the past 10 years, the LCOE of wind power decreased by 55%. Growth of wind power generation is expected to continue as economies of scale, greater investment, supportive policies, and market forces further reduce the cost of components, installation, and operation of wind energy sources. Hydropower The basic principle of hydropower is using water to drive turbines. Hydroelectric sources like dams and run-of-the-river power generators represented the lion’s share of renewable power generation. Hydroelectric power represented 82% of all renewable power generation in 2010; however, this share has contracted in recent years. The installed capacity of hydro has remained flat over the past decade, largely because energy sources are restricted by location and an already-prominent reliance on hydroelectric power limits its growth. This is the slowest growing renewable energy segment. Other Renewables Over the longer-term, bioenergy, geothermal, and ocean energy may also be important sources of renewable energy. Yet, at present these technologies account for no more than 5% of the renewables market; strong R&D efforts will be needed in the coming decades to bring their costs down and expand their share. IRENA expects these technologies to grow sixfold by 2030. Footnotes 1 IRENA, “World Energy Transitions Outlook 2022” 2 IRENA, “Installed Capacity Trends” 3 European Commission, “Lithium-ion batteries for mobility and stationary storage applications,” 2018. 4 Hydrogen Fuel Basics | Department of Energy 5 Carbon capture and storage - Wikipedia 6 Helping decarbonize industry with carbon capture and storage – Energy Factor (exxonmobil.com) 7 Smart Grid: A Beginner's Guide | NIST 8 Ibid 9 LCOE refers to the revenue required to build and operate a power source over a specified cost recovery period Recommended Allocation Recommended Allocation: Addendum
Sector Chart Pack Commentary
Sector Chart Pack Commentary
Executive Summary The Ukraine war reinforces our key view that commodity producers will use their geopolitical leverage this year. The market is growing complacent again about Russian risks. Iran is part of the same dynamic. If US-Iran talks fail, as we expect, the Middle East will destabilize and add another energy supply risk on top of the Russian risk. The Ukraine war also interacts with our other two key views for 2022: China’s reversion to autocracy and the US’s policy insularity. Both add policy uncertainty and weigh on risk sentiment. The war also reinforces our strategic themes for the 2020s: Great Power Rivalry, Hypo-Globalization, and Populism/Nationalism. Stagflation Cometh
Stagflation Cometh
Stagflation Cometh
Trade Recommendation Inception Date Return Cyclically Long Global Defensives Versus Cyclicals 2022-01-20 10.8% Bottom Line: Tactically stay long global defensives and large caps. Cyclically stay long gold, US equities, aerospace/defense, and cyber security. Feature In our annual outlook, “The Gathering Storm,” we argued that the post-pandemic world economy would destabilize due to intensifying rivalry among the leading nations. We argued that China’s reversion to autocracy, US domestic divisions, and Russia’s commodity leverage would produce a toxic brew for global investors in 2022. By January 27 it was clear to us that Russia would invade Ukraine, so the storm was arriving sooner than we thought, and we doubled down on our defensive and risk-averse market positioning. We derived these three key views from new cyclical trends and the way they interact with our underlying strategic themes – Great Power Rivalry, Hypo-Globalization, and Populism/Nationalism (Table 1). These themes are mutually reinforcing, rooted in solid evidence over many years, and will not change easily. Table 1Three Geopolitical Strategic Themes
Second Quarter Outlook 2022: When It Rains, It Pours
Second Quarter Outlook 2022: When It Rains, It Pours
Related Report Geopolitical Strategy2022 Key Views: The Gathering Storm The Ukraine war reinforces them: Russia took military action to increase its security relative to the US and NATO; the West imposed sanctions that reduce globalization with Russia and potentially other states; Russian aggression stemmed from nationalism and caused a spike in global prices that will spur more nationalism and populism going forward. In this report we examine how these trends will develop in the second quarter and beyond. We see stagflation taking shape and recommend investors prepare for it by continuing to favor defensive sectors, commodities, and value plays. Checking Up On Our Russia View For 2022 Our third key view for 2022 – that oil producers like Russia and Iran possessed immense geopolitical leverage and would most likely use it – is clearly the dominant geopolitical trend of the year, as manifested in the Russian invasion of Ukraine.1 Russia first invaded Ukraine in 2014 and curtailed operations after commodity prices crashed. It launched a new and larger invasion in 2022 when a new commodity cycle began (Chart 1). Facing tactical setbacks, Russia has begun withdrawing forces from around the Ukrainian capital Kyiv. But it will redouble its efforts to conquer the eastern Donbas region and the southern coastline. The coast is the most strategic territory at stake (Map 1). Chart 1Russia's Commodity-Enabled Aggression
Russia's Commodity-Enabled Aggression
Russia's Commodity-Enabled Aggression
Map 1Russian Invasion Of Ukraine, 2022
Second Quarter Outlook 2022: When It Rains, It Pours
Second Quarter Outlook 2022: When It Rains, It Pours
The most decisive limitation on Russia’s military effort would come from a collapse of commodity exports or prices, which has not happened yet. Europe continues to buy Russian oil and natural gas, although it is debating a ban on the $4.4 billion worth of coal that it imports. With high energy prices making up for a drop in export volumes, Russian armed forces can still attempt a summer and fall campaign (Chart 2). The aim would be to conquer remaining portions of Donetsk and Luhansk, the “land bridge” to Crimea, and potentially the stretch of land between the Dnieper river and eastern Moldova, where Russian troops are already stationed. Chart 2Russia’s War Financing
Second Quarter Outlook 2022: When It Rains, It Pours
Second Quarter Outlook 2022: When It Rains, It Pours
Ukraine’s military neutrality is the core Russian objective. Ukraine is offering neutrality in exchange for security guarantees in the current ceasefire talks. Hence a durable ceasefire is possible if the details of neutrality are agreed – Ukraine forswears joining NATO and hosting foreign military infrastructure while accepting limitations on military exercises and defense systems. The security guarantees that Ukraine demands are mostly symbolic, as the western powers that would be credible guarantors are already unwilling to use military force against Russia (e.g. the US, UK, NATO members). However, Russia’s withdrawal from Kyiv will embolden the Ukrainians, so we do not expect a durable ceasefire in the second quarter. Global investors will be mistaken if they ignore Ukraine in the second quarter, at least until core problems are resolved. What matters most is whether the war expands beyond Ukraine: The likelihood of a broader war is low but not negligible. So far the Russian regime is behaving somewhat rationally: Moscow attacked a non-NATO member to prevent it from joining NATO; it limited the size of the military commitment; and it is now accepting reality and withdrawing from Kyiv while negotiating on Ukrainian neutrality. But a major problem emerges if Russia’s military fails in the Donbas while Ukraine reneges on offers of neutrality. Any ceasefire could fall apart and the war could re-escalate. Russia could redouble its attacks on the country or conduct a limited attack outside of Ukraine to trigger a crisis in the western alliance. Moreover, if sanctions keep rising until Russia’s economy collapses, Moscow could become less rational. Finland and Sweden have seen a shift of public opinion in favor of joining NATO. Any intention to do so would trigger a belligerent reaction from Russia. These governments are well aware of the precarious balance that must be maintained to prevent war, so war is unlikely. But if their stance changes then Russia will threaten to attack. Russia would threaten to bomb these states since it cannot now credibly threaten invasion by land (Charts 3A & 3B). Chart 3ANordic States Joining NATO Would Trigger Larger War
Second Quarter Outlook 2022: When It Rains, It Pours
Second Quarter Outlook 2022: When It Rains, It Pours
Chart 3BNordic States Joining NATO Would Trigger Larger War
Second Quarter Outlook 2022: When It Rains, It Pours
Second Quarter Outlook 2022: When It Rains, It Pours
The Black Sea is vulnerable to “Black Swan” events or military spillovers. Russia is re-concentrating its military efforts in the Donbas and land bridge to Crimea. Russia could expand its offensive to Odessa and the Moldovan border. Or Russia could attempt to create a new norm of naval dominance in the Black Sea. Or ships from third countries could hit mines or become casualties of war. For these and other reasons, investors should not take on additional risk in their portfolios on the basis that a durable ceasefire will be concluded quickly. Russia’s position is far too vulnerable to encourage risk-taking. Moscow could escalate tensions to try to save face. It is also critical to ensure that Russia and Europe maintain their energy trade: Neither side has an interest in total energy cutoff. Russia needs the revenue to finance its war and needs to discourage Europe from fulfilling its pledges to transition rapidly to other sources and substitutes. Europe needs the energy to avoid recession, maintain some tie with Russia, and enable its energy diversification strategy. So far natural gas flows are continuing (Chart 4). Chart 4Natural Gas Flows Continuing (So Far)
Natural Gas Flows Continuing (So Far)
Natural Gas Flows Continuing (So Far)
Chart 5Global Oil Supply/Demand Balance
Global Oil Supply/Demand Balance
Global Oil Supply/Demand Balance
However, risks to energy trade are rising. Russia is threatening to cut off energy exports if not paid in rubles, while the EU is beginning to entertain sanctions on energy. Russia can reduce oil or gas flows incrementally to keep prices high and prevent Europe from rebuilding stockpiles for fall and winter. Partial energy cutoff is possible. Europe’s diversification makes Russia’s predicament dire. Substantial sanction relief is highly unlikely, as western powers will want to prevent Russia from rebuilding its economy and military. Russia could try to impose significant pain on Europe to try to force a more favorable diplomatic solution. A third factor that matters is whether the US will expand its sanction enforcement to demand strict compliance from other nations, at pain of secondary sanctions: Secondary sanctions are likely in the case of China and other nations that stand at odds with the US and help Russia circumvent sanctions. In China’s case, the US is already interested in imposing sanctions on the financial or technology sector as part of its long-term containment strategy. While the Biden administration’s preference is to control the pace of escalation with China, and thus not to slap sanctions immediately, nevertheless substantial sanctions cannot be ruled out in the second quarter. Secondary sanctions will be limited in the case of US allies and partners, such as EU members, Turkey, and India. Countries that do business with Russia but are critical to US strategy will be given waivers or special treatment. Russia is not the only commodity producer that enjoys outsized geopolitical leverage amid a global commodity squeeze. Iran is the next most critical producer. Iran is also critical for the stability of the Middle East. In particular, the consequential US-Iran talks over whether to rejoin the 2015 nuclear deal are likely to come to a decision in the second quarter. Chart 6Failure Of US-Iran Talks Jeopardizes Middle East Oil Supply
Failure Of US-Iran Talks Jeopardizes Middle East Oil Supply
Failure Of US-Iran Talks Jeopardizes Middle East Oil Supply
If the US and Iran agree to a strategic détente, then regional tensions will briefly subside, reducing global oil disruption risks and supply pressures. Iran could bring 1.3 million barrels per day of oil back online, adding to President Biden’s 1 million per day release of strategic petroleum reserves. The combination would amount to 2.3% of global demand and more than cover the projected quarterly average supply deficit, which ranges from 400k to 900k barrels per day for the rest of 2022 (Chart 5). If the US and Iran fail to agree, then the Middle East will suffer another round of instability, adding a Middle Eastern energy shock on top of the Russian shock. Not only would Iran’s 1.3 million barrels per day be jeopardized but so would Iraq’s 4.4 million, Saudi Arabia’s 10.3 million, the UAE’s 3.0 million, or the Strait of Hormuz’s combined 24 million per day (Chart 6). This gives Iran leverage to pursue nuclear weaponization prior to any change in US government that would strengthen Israel’s ability to stop Iran. We would not bet on an agreement – but we cannot rule it out. The Biden administration can reduce sanctions via executive action to prevent a greater oil shock, while the Iranians can accept sanction relief in exchange for easily reversible moves toward compliance with the 2015 nuclear deal. But this would be a short-term, stop-gap measure, not a long-term strategic détente. Conflict between Iran and its neighbors will revive sooner than expected after the deal is agreed, as Iran’s nuclear ambitions will persist. OPEC states are already producing more oil rapidly, suggesting no quick fix if the US-Iran deal falls apart. While core OPEC states have 3.5 million barrels per day in spare capacity to bring to bear, a serious escalation of tensions with Iran would jeopardize this solution. Finally, if commodity producers have geopolitical leverage, then commodity consumers are lacking in leverage. This is clear from Europe’s inability to prevent Russia’s attack or ban Russian energy. It is clear from the US’s apparent unwillingness to give up on a short-term deal with Iran. It is clear from China’s inability to provide sufficient monetary and fiscal stimulus as it struggles with Covid-19. Turkey, Egypt, and Pakistan are geopolitically significant importers of Russian and Ukrainian grain that are likely to face food insecurity and social unrest. We will address this issue below under our Populism/Nationalism theme. Bottom Line: Investors should not be complacent. Russia’s military standing in Ukraine is weak, but its ability to finance the war has not yet collapsed, which means that it will escalate the conflict to save face. What About Our Other Key Views For 2022? Our other two key views for 2022 are even more relevant in the wake of the Ukraine re-invasion. China’s reversion to autocracy is a factor in China’s domestic and foreign policy: Domestically China needs economic and social stability in the advance of the twentieth national party congress, when President Xi Jinping hopes to clinch 10 more years in power. In pursuit of this goal China is easing monetary and fiscal policy. However, with depressed animal spirits, a weakening property sector, and high debt levels, monetary policy is proving insufficient. Fiscal policy will have to step up. But even here, inflation is likely to impose a limitation on how much stimulus the authorities can utilize (Chart 7). Chart 7China Stimulus Impaired By Inflation
China Stimulus Impaired By Inflation
China Stimulus Impaired By Inflation
Chart 8Chinese Supply Kinks To Persist Due To Covid-19
Chinese Supply Kinks To Persist Due To Covid-19
Chinese Supply Kinks To Persist Due To Covid-19
China is also trying but failing to maintain a “Covid Zero” policy. The more contagious Omicron variant of the virus is breaking out and slipping beyond the authorities’ ability to suppress cases of the virus to zero. Shanghai is on lockdown and other cities will follow suit. China will attempt to redouble its containment efforts before it will accept the reality that the virus cannot be contained. Chinese production and shipping will become delayed and obstructed as a result, putting another round of upward pressure on global prices (Chart 8). Stringent pandemic restrictions could trigger social unrest. China is ripe for social unrest, which is why it launched the “Common Prosperity” program last year to convince citizens that quality of life will improve. But this program is a long-term program that will not bring immediate relief. On the contrary, the economy is still suffering and the virus will spread more widely, as well as draconian social restrictions. The result is that the lead up to the national party congress will not be as smooth as the Xi administration had hoped. Global investors will remain pessimistic toward Chinese stocks. In foreign affairs, China’s reversion to autocracy is reinforced by Russia’s clash with the West and the need to coordinate more closely. Xi hosted Putin in Beijing on February 4, prior to the invasion, and the two declared that their strategic partnership ushers in a “new era” of “multipolarity” and that their cooperation has “no limits,” which really means that military cooperation is not forbidden. China agreed to purchase an additional 10 billion cubic meters of Russian natural gas over 30-years. While this amount would only replace 3% of Russian natural gas exports to Europe, it would mark a 26% increase in Russian exports to China. More importantly it acts as a symbol of Chinese willingness to substitute for Europe over time. There is a long way to go for China to replace Europe as a customer (Chart 9). But China knows it needs to convert its US dollar foreign exchange reserves, vulnerable to US sanctions, into hard investments in supply security within the Eurasian continent. Chart 9Long Way To Go For China NatGas Imports To Replace EU
Second Quarter Outlook 2022: When It Rains, It Pours
Second Quarter Outlook 2022: When It Rains, It Pours
China is helping Russia circumvent sanctions. China’s chief interest is to minimize the shock to its domestic economy. This means keeping Russian energy and commodities flowing. China could also offer military equipment for Russia. The US has expressly warned China against taking such an action. China could mitigate the blowback by stipulating that the assistance cannot be used in Ukraine. This would be unenforceable but would provide diplomatic cover. While China is uncomfortable with the disturbance of the Ukraine war – it does not want foreign affairs to cause even larger supply shocks. At the same time, China does not want Russia to lose the war or Putin’s regime to fall from power. If Russia loses, Taiwan and its western allies would be emboldened, while Russia could pursue a détente with the West, leaving China isolated. Since China faces US containment policy regardless of what happens in Russia, it is better for China to have Putin making an example out of Ukraine and keeping the Americans and Europeans preoccupied. Chart 10China Strives To Preserve EU Trade Ties
China Strives To Preserve EU Trade Ties
China Strives To Preserve EU Trade Ties
China must also preserve ties with Europe. Diplomacy will likely succeed in the short run since Europe has no interest or desire to expand sanctions to China. The Biden administration will defer to Europe on the pace of sanctions – it is not willing or able to force Europe to break with China suddenly. Eventually Europe and China may sever relations but not yet – China has a powerful incentive to preserve them (Chart 10). China will also court India and other powers in an attempt to hedge its bets on Russia while weakening any American containment. Beyond the party congress, China will be focused on securing the economic recovery and implementing the common prosperity agenda. The first step is to maintain easy monetary and fiscal policy. The second step is to “let 100 flowers bloom,” i.e. relaxing social and regulatory controls to try to revive entrepreneurship and animal spirits, which are heavily depressed. Xi will have the ability to do this after re-consolidating power. The third step will be to try to stabilize economic relations with Europe and others (conceivably even the US temporarily, though no serious détente is likely). The remaining key view for 2022 is that the Biden administration’s domestic focus will be defensive and will invite foreign policy challenges. The Ukraine war vindicates this view but the question now is whether Biden has or will change tack: The Biden administration is focused on the midterm elections and the huge risk to the Democratic Party’s standing. Biden has not received a boost in opinion polls from the war. He is polling even worse when it comes to handling of the economy (Chart 11). While he should be able to repackage his budget reconciliation bill as an energy security bill, his thin majorities in both houses make passage difficult. Chart 11Biden And Democrats Face Shellacking In Midterm Election
Second Quarter Outlook 2022: When It Rains, It Pours
Second Quarter Outlook 2022: When It Rains, It Pours
Biden’s weak standing – with or without a midterm shellacking – raises the prospect that Republicans could take back the White House in 2024, which discourages foreign nations from making any significant concessions to the United States in their negotiations. They must assume that partisanship will continue to contaminate foreign policy and lead to abrupt policy reversals. In foreign policy, the US remains reactive in the face of Russian aggression. If Russia signs a ceasefire, the US will not sabotage it to prolong Russian difficulties. Moreover Biden continues to exempt Europe and other allies and partners from enforcing the US’s most severe sanctions for fear of a larger energy shock. Europe’s avoidance of an energy ban is critical and any change in US policy to try to force the EU to cut off Russian energy is unlikely. China will not agree to structural reform or deep concessions in its trade negotiations, knowing that former President Trump could come back. The Biden administration’s own trade policy toward China is limited in scope, as the US Trade Representative Katherine Tai admitted when she said that the US could no longer aim to change China’s behavior via trade talks. Biden’s only proactive foreign policy initiative, Iran, will not bring him public kudos if it is achieved. But American inconstancy is one of the reasons that Iran may walk away from the 2015 nuclear deal. Why should Iran’s hawkish leaders be expected to constrain their nuclear program and expose their economy to future US sanctions if they can circumvent US sanctions anyway, and Republicans have a fair chance of coming back into power as early as January 2025? Biden’s unprecedented release of strategic petroleum reserves will not be able to prevent gasoline prices from staying high given the underlying supply pressures at home and abroad. This is especially true if the Iran talks fail as we expect. Even if inflation abates before the election, it is unlikely to abate enough to save his party from a shellacking. That in turn will weaken the global impression of his administration’s staying power. Hence Biden will focus on maintaining US alliances, which means allowing Europe, India, and others to proceed at a more pragmatic and dovish pace in their relations with Russia and China. Bottom Line: China’s reversion to autocracy and America’s policy insularity suggest that global investors face considerable policy uncertainty this year even aside from the war in Europe. Checking Up On Our Strategic Themes For The 2020s Russia’s invasion strongly confirmed our three strategic themes of Great Power Rivalry, Hypo-Globalization, and Populism/Nationalism. These themes are mutually reinforcing: insecurity among the leading nation-states encourages regionalization rather than globalization, while populism and nationalism encourage nations to pursue economic and security interests at the expense of their neighbors. First, the Ukraine war confirms and exacerbates Great Power Rivalry: Chart 12China And Russia Both Need To Balance Against US Preponderance
Second Quarter Outlook 2022: When It Rains, It Pours
Second Quarter Outlook 2022: When It Rains, It Pours
Russia’s action vindicates the “realist” school of international relations (in which we count ourselves) by forcing the world to wake up to the fact that nations still care primarily about national security defined in material ways, such as armies, resources, and territories. The paradox of realism is that if at least one of the great nations pursues its national self-interest and engages in competition for security, then all other nations will be forced to do the same. If a nation neglects its national security interests in pursuit of global economic engagement and cooperation, then it will suffer, since other nations will take advantage of it to enhance their security. Hence, as a result of Ukraine, nations will give a higher weight to national security relative to economic efficiency. The result will be an acceleration of decisions to use fiscal funds and guide the private economy in pursuit of national interests – i.e. the Return of Big Government. Since actions to increase deterrence will provoke counteractions for the same reason, overall insecurity will rise. For example, the US and China will take extra precautions in case of future sanctions and war. But these precautions will reduce trust and cooperation and increase the probability of war over the long run. For the same reason, China cannot reject Russia’s strategic overture – it cannot afford to alienate and isolate Russia. China and Russia have a shared interest in countering the United States because it is the only nation that could conceivably impose a global empire over all nations (Chart 12). The US could deprive Beijing and Moscow of the regional spheres of influence that they each need to improve their national security. This is true not only in Ukraine and Taiwan but in other peripheral areas such as Belarus, the Caucasus, Central Asia, and Southeast Asia. China has much to gain from Russia. Russia is offering China privileged overland access to Russian, Central Asian, and Middle Eastern resources and markets. This resource base is vital to China’s strategic needs, given its import dependency and vulnerability to US maritime power (Chart 13). Chart 13China’s Maritime Vulnerability Forces Eurasian Strategy, Russian Alliance
Second Quarter Outlook 2022: When It Rains, It Pours
Second Quarter Outlook 2022: When It Rains, It Pours
Investors should understand Great Power Rivalry in a multipolar rather than bipolar sense. As Russia breaks from the West, investors are quick to move rapidly to the bipolar Cold War analogy because that is what they are familiar with. But the world today has multiple poles of political power, as it did for centuries prior to the twentieth. While the US is the preponderant power, it is not hegemonic. It faces not one but two revisionist challengers – Russia and China. Meanwhile Europe and India are independent poles of power that are not exclusively aligned with the US or China. For example, China and the EU need to maintain economic ties with each other for the sake of stability, and neither the US nor Russia can prevent them from doing so. The same goes for India and Russia. China will embrace Russia and Europe at the same time, while hardening its economy against US punitive measures. India will preserve ties with Russia and China, while avoiding conflict with the US and its allies (the maritime powers), whom it needs for its long-term strategic security in the Indian Ocean basin. Ultimately bipolarity may be the end-game – e.g. if China takes aggressive action to revise the global order like Russia has done – but the persistence of Sino-European ties and Russo-Indian ties suggest we are not there yet. Second, the Ukraine war reinforces Hypo-Globalization: Since the pandemic we have argued that trade would revive on the global economic snapback but that globalization – the deepening of trade integration – would ultimately fall short of its pre-2020 and pre-2008 trajectory. Instead we would inhabit a new world of “hypo-globalization,” in which trade flows fell short of potential. So far the data support this view (Chart 14). Chart 14Globalization Falling Short Of Potential
Second Quarter Outlook 2022: When It Rains, It Pours
Second Quarter Outlook 2022: When It Rains, It Pours
The Ukraine war has strengthened this thesis not only by concretely reducing Russia’s trajectory of trade with the West – reversing decades of integration since the fall of the Soviet Union – but also by increasing the need for nations to guard against a future Chinese confrontation with the Western world. Trust between China and the West will further erode. China will need to guard against any future sanctions, and thus diversify away from the US dollar and assets, while the US will need to do a better job of deterring China against aggression in Asia, and will thus have to diversify away from Chinese manufacturing and critical resources like rare earths. While China and Europe need each other now, the US and China are firmly set on a long-term path of security competition in East Asia. Eventually either the US or China will take a more aggressive stance and Europe will be forced to react. Since Europe will still need US support against a decaying and aggressive Russia, it will likely be dragged into assisting the US against China. Third, the Ukraine war reflects and amplifies Populism/Nationalism: Populism and nationalism are not the same thing but they both stem from the slowing trend of global income growth, the rise of inequality, the corruption of the elite political establishments, and now the rise in inflation. Nations have to devote more resources to pacifying an angry populace, or distracting that populace through foreign adventures, or both. The Ukraine war reflects the rise in nationalism. First, the collapse of the Soviet Union ushered in a period in which Moscow lost control of its periphery, while the diverse peoples could pursue national self-determination and statehood. The independence and success of the Baltic states depended on economic and military cooperation with the West, which eroded Russian national security and provoked a nationalist backlash in the form of President Putin’s regime. Ukraine became the epicenter of this conflict. Ukraine’s successful military resistance is likely to provoke a dangerous backlash from Moscow until either policy changes or the regime changes. American nationalism has flared repeatedly since the fall of the Soviet Union, namely in the Iraq war. The American state has suffered economically and politically for that imperial overreach. But American nationalism is still a potent force and could trigger a more aggressive shift in US foreign policy in 2024 or beyond. European states have kept nationalism in check and tried to subsume their various nationalist sentiments into a liberal and internationalist project, the European Union. The wave of nationalist forces in the wake of the European debt crisis has subsided, with the exception of the United Kingdom, where it flowered in Brexit. The French election in the second quarter will likely continue this trend with the re-election of President Emmanuel Macron, but even if he should suffer a surprise upset to nationalist Marine Le Pen, Europe’s centripetal forces will prevent her from taking France out of the EU or euro or NATO (Chart 15). Over the coming decade, nationalist forces will revive and will present a new challenge to Europe’s ruling elites – but global great power competition strongly supports the EU’s continued evolution into a single geopolitical entity, since the independent states are extremely vulnerable to Russia, China, and even the US unless they unite and strengthen their superstructure. Chart 15Macron Favored, Le Pen Would Be Ineffective
Macron Favored, Le Pen Would Be Ineffective
Macron Favored, Le Pen Would Be Ineffective
In fact the true base of global nationalism is migrating to Asia. Chinese and Indian nationalism are very potent forces under President Xi Jinping and Prime Minister Narendra Modi. Xi is on the verge of clinching another ten years in power while Modi is still favored for re-election in 2024, so there is no reason to anticipate a change anytime soon. The effects are various but what is most important for investors is to recognize that as China’s potential GDP has fallen over the past decade, the Communist Party has begun to utilize nationalism as a new source of legitimacy, and this is expressed through a more assertive foreign policy. President Xi is the emblem of this shift and it will not change, even if China pursues a lower profile over certain periods to avoid provoking the US and its allies into a more effective coalition to contain China. Chart 16Food Insecurity Will Promote Global Unrest, Populism
Food Insecurity Will Promote Global Unrest, Populism
Food Insecurity Will Promote Global Unrest, Populism
The surge in global prices will destabilize regimes that lack food security and contribute to new bouts of populism and nationalism. Turkey is the most vulnerable due to a confluence of political, economic, and military risks that will unsettle the state. But Egypt is vulnerable to an Arab Spring 2.0 that would have negative security implications for Israel and add powder to the Middle Eastern powder keg. Pakistan is already witnessing political turmoil. Investors may overlook any Indonesian unrest due to its attractiveness in a world where Russia and China are scaring away western investment (Chart 16). All three of these strategic themes are mutually reinforcing – and they tend to be inflationary over the long run. Great powers that redouble the pursuit of national interest – through defense spending and energy security investments – while simultaneously being forced to expand their social safety nets to appease popular discontent, will drive up budget deficits, consume a lot of natural resources, and purchase a lot of capital equipment. They will also more frequently engage in economic or military conflicts that constrain supply (Chart 17). Chart 17War And Preparation For War Are Inflationary
War And Preparation For War Are Inflationary
War And Preparation For War Are Inflationary
Bottom Line: The Ukraine war is a powerful confirmation of our three strategic themes. It is also a confirmation that these themes have inflationary macroeconomic implications. Investment Takeaways Chart 18Global Investors Still Flee To US For Safety
Global Investors Still Flee To US For Safety
Global Investors Still Flee To US For Safety
Now that great power rivalry is intensifying immediately and rapidly, and yet China’s and Europe’s economies are encountering greater difficulties, we expect stagflation to arrive sooner rather than later. High headline and core inflation, the Ukraine war, tacit Chinese support for Russia, persistent Chinese supply kinks, US and EU sanctions, US midterm elections, and a potential US-Iran diplomatic breakdown will all weigh on risk sentiment in the second quarter. In Ukraine, Russia’s position is too weak to give comfort for investors, who should continue to favor defensive over cyclical equities and US stocks over global stocks. Russia’s break with the West, and the West’s use of sanctions to prevent Russia from accessing its foreign exchange reserves, has raised new questions about the global currency reserve system and the dollar’s status within that system. Over the coming years China will redouble the efforts it began in the wake of the Great Recession to reduce its dependency on US dollar assets within its reserve basket, while also recycling new current account surpluses into non-dollar assets. However, the evidence does not suggest that King Dollar will suffer a structural breakdown. First, the world lacks alternative safe-haven assets to US Treasuries – and net foreign purchases of US bonds rose in the face of the Ukraine war (Chart 18). Second, the return of war to Europe will weaken the perceived long-term security of European currency and government bonds relative to US counterparts. Even if the Ukraine war is contained in the short run, as we expect, Russia is in structural decline and will remain a disruptive player for some time. We are not at all bearish on the euro or European bonds but we do not see the Ukraine war as increasing their value proposition, to put it lightly. The same logic extends to Japanese bonds, since China, like Russia, is an autocratic and revisionist state that threatens to shake up the security order in its neighborhood. Japan is relatively secure as a nation and we are bullish on the yen, but China’s de facto alliance with Russia weakens Japan’s security outlook over the very long run, especially relative to the United States. Thus, on a cyclical basis the dollar can depreciate, but on a structural basis the US dollar will remain the dominant reserve currency. The US is not only the wealthiest and most secure country in the world but also the largest oil producer. Meanwhile Chinese potential growth, domestic political stability, and foreign relations are all worsening. The US-Iran talks are the most critical geopolitical dynamic in the second quarter aside from Russia’s clash with the West. The fate of the 2015 nuclear deal will be decided soon and will determine whether an even bigger energy shock begins to emanate from the Middle East. We would not bet on a new US-Iran deal but we cannot rule it out. Any deal would be a short-term, stop-gap deal but would prevent an immediate destabilization of the Middle East this year. As such it would reduce the risk of stagflation. Since we expect the deal to fail, we expect a new energy shock to emerge. We see stagflation as more likely than the BCA House View. It will be difficult to lift productivity in an environment of geopolitical and political uncertainty combined with slowing global growth, rising interest rates, and a worsening commodity shock (Chart 19). We will gladly revise this stance if Biden clinches an Iran deal, China relaxes its Covid Zero policy and stabilizes domestic demand, Russia and Europe maintain energy trade, and commodity prices fall to more sustainable levels for global demand. Chart 19Stagflation Cometh
Stagflation Cometh
Stagflation Cometh
Strategically we remain long gold, overweight US equities, overweight UK equities, long British pound and Japanese yen, long aerospace/defense stocks and cyber security stocks. We remain short Chinese renminbi and Taiwanese dollar and short emerging European assets. Our short Chinese renminbi trade and our short Taiwanese versus Korean equity trade are our worst-performing recommendations. However, the above analysis should highlight – and the Ukraine war should underscore – that these two economies face a fundamentally negative geopolitical dynamic. Both Chinese and Taiwanese stocks have been underperforming global peers since 2021 and our short TWD-USD trade is in the money. While we do not expect war to break out in Taiwan this year, we do expect various crisis events to occur, particularly in the lead up to the crucial Taiwanese and American 2022 midterms and 2024 presidential election. We also expect China to depreciate the renminbi when inflation peaks and commodity prices subside. Cyclically we remain long North American and Latin American oil producers and short Middle Eastern producers, based on our pessimistic read of the Iran situation. The Americas are fundamentally better protected from geopolitical risks than other regions, although they continue to suffer from domestic political risks on a country-by-country basis. Cyclically we continue to take a defensive positioning, overweighting defensive sectors and large cap equities. Matt Gertken Chief Geopolitical Strategist mattg@bcaresearch.com Footnotes 1 That the Russian threat fell under our third key view for 2022 implies that we did not get our priorities straight. However, consider the timing: shortly after publishing our annual outlook on December 15, the Russians issued an ultimatum to the western powers demanding that NATO stop expanding toward Russia. Diplomats from Russia and the West met on January 12-13 but Russia’s demands were not met. We upgraded the odds that Russia would invade Ukraine from 50% to 75% on January 27. Shuttle diplomacy ensued but failed. Russia invaded on February 24. Strategic Themes Open Tactical Positions (0-6 Months) Open Cyclical Recommendations (6-18 Months) Regional Geopolitical Risk Matrix "Batting Average": Geopolitical Strategy Trades () Section II: Special (EDIT this Header) Section III: Geopolitical Calendar
Executive Summary Long Small Cap Energy Versus Large Cap
Investment Takeaways
Investment Takeaways
President Biden has not received a boost in opinion polls from the Ukraine war. If he has not by now then it is increasingly unlikely that he will do so. Yet Biden performs worse in polls for his handling of economic policy than foreign policy, despite falling unemployment and rising real wages. The economy should help stabilize his approval rating but not in time to prevent Democrats from losing the Senate as well as the House this fall. Biden’s decision to tap the strategic petroleum reserve exemplifies our 2022 trend of executive action. However, the oil outlook still depends on Biden’s Iran talks and OPEC’s reaction. Recommendation Inception Level Inception Date Return Long Small Vs. Large Cap Energy 0.56 26-Jan-22 14.9% Bottom Line: The return of gridlock is bad for stocks in 2022 but good in 2023. Feature Investors need answers to three questions about US policy at the moment: 1. Will President Biden’s reaction to the Ukraine war exacerbate the hit to the global and US economy? 2. Will Biden’s domestic agenda revive? If so, how will it impact corporate earnings expectations? 3. Will Biden’s foreign and domestic policies cause any changes to the midterm election outlook and hence US policy in 2023-24? In recent reports we have answered these questions as follows. Related Report US Political StrategySecond Quarter Outlook: Gridlock Looms First, Biden will continue to pursue a defensive or reactive foreign policy, meaning that he will not force Europe or other allies to adopt Russia sanctions beyond their near-term economic and political capabilities. If Europe wants to boycott Russian energy then that is fine but it is Europe’s decision. In fact, Europe is pursuing gradual rather than immediate diversification. Russia needs the funds. So Europe is unlikely to experience a sharp energy cutoff that plunges its economy into recession. Nevertheless, the risk is substantial enough that we remain long DXY and defensive US sectors on a tactical time frame. Second, Biden’s congressional agenda is getting back on track, with the war providing Democrats with a basis for redesigning and rebranding their budget reconciliation bill. Therefore we did not downgrade our 65% subjective odds that Congress will pass a bill. The bill will be close to deficit neutral and focused especially on energy policy. The Senate version of the bill is not yet available but we will examine the likeliest policy options in a forthcoming special report with our US Equity Strategy. Third – our focus for this report – current political changes do not substantially alter the midterm election odds, which suggest Republicans will retake Congress. Gridlock will return – and is the norm in US policy. In an inflationary context gridlock may well be positive for equities in 2023 since it will curb fiscal spending. However, uncertainty is negative for equities this year. We remain tactically defensive. We recommend renewable energy, cyber stocks, defense stocks, and infrastructure stocks as cyclical plays. Biden’s Approval Stabilizing At Low Level Foreign policy shocks are likely to hurt the ruling party – especially if the nature of the shock exacts a toll on the voter’s pocketbook. We showed evidence to this effect just before Russia re-invaded Ukraine. We concluded that Biden would experience a bounce in opinion polls as the nation rallied around him in the face of the Russian menace but the likely rise in gasoline prices would end up hurting the Democratic Party in the midterm elections. Yet 40 days after Russia’s attack Biden’s general job approval is still at the lowest of his presidency, in the 41-42% range, while his disapproval is still high, in the 52-53% range. So far the war has not given him an appreciable boost, outside of his own party (where the boost has still been small). The results are even worse when it comes to his handling of the economy. Here his approval is 39% and disapproval 54%. In foreign policy, Biden’s approval stands at 40% and disapproval at 52% (Chart 1). Presidential approval has a big influence on the midterm election – as does perception of the two parties. Republicans have taken the lead in the generic congressional ballot, at 43.7% support versus 42.2% for Democrats. The war has blunted the Republican rally but nothing more. The economy is the likeliest source of good news for Biden and the Democrats over the coming six months but even here there is not a basis for optimism among Democrats, as we will see in the next section. Chart 1No ‘War Bounce’ For Biden
War Not Helping Biden So Far
War Not Helping Biden So Far
Jobs And Wages Not Boosting Biden Either Our Political Capital Index shows that the Biden administration now has weak or moderate political capital in every category except economic conditions and financial markets (Appendix). Yet economic conditions are still mixed. While they will likely improve before November, they do not look to improve enough to change the election outlook: Both Republicans and Democrats are viewing the economy more negatively. Republican economic sentiment declined by 16% in March, while Democrat economic sentiment declined by 6%. The partisan gap widened, which means Republicans will remain motivated to vote (Chart 2). Manufacturing activity is slowing down (though not shrinking). The reading slipped lower than its level in November 2020, when Biden took office. This drop is the first sign of the negative effect of inflation and geopolitical risk on the economy. New manufacturing orders declined while inventories increased. The new-orders-to-inventories ratio, which should be a leading indicator of economic activity, fell by 15.7% compared to its February reading. It is now the weakest since May 2020 (Chart 3). Chart 2Economic Sentiment Declines For Both Parties
Economic Sentiment Declines For Both Parties
Economic Sentiment Declines For Both Parties
The budget deficit is “normalizing” and weighing on demand. The fiscal thrust – or change in the budget deficit – turned negative as the stimulus of 2020 waned. The intensity of the drag is now lessening, both on the federal and state level, but it would require a massive new crisis for the US to outdo the stimulus of 2020, so the drag will persist for the foreseeable future (Chart 4). Any last-minute reconciliation bill from congressional Democrats would reduce the drag further, but not generate positive thrust, and not in time to affect the election. To pass the bill, Democrats need to reduce the deficit impact in the face of inflation and paper-thin congressional majorities. Chart 3First Sign Of Inflation, Geopolitics Hitting Manufacturing
First Sign Of Inflation, Geopolitics Hitting Manufacturing
First Sign Of Inflation, Geopolitics Hitting Manufacturing
Chart 4US Fiscal Drag In Wake Of 2020 Stimulus
US Fiscal Drag In Wake Of 2020 Stimulus
US Fiscal Drag In Wake Of 2020 Stimulus
Most worrisome for President Biden, his approval rating has suffered despite a tight labor market and real wage growth. The headline unemployment rate declined to 3.6% in March, down 3.1 percentage points since November 2020. The ISM manufacturing employment index stands at the highest point since March of 2021, and 17% higher than in November 2020 (Chart 5). Inflation is apparently eating away the benefits of low unemployment. Real wages grew by 3.3% on an annual basis in February, up from 2.5% in January. This wage growth is higher than that of November 2020, at 2.2%. Biden’s approval rating is probably in the process of stabilizing, if we assume that unemployment stays low and real wages keep growing. But it is stabilizing at a low level and not perking up as a result of the Russian menace. The likeliest culprit for Biden’s troubles is inflation. Fortunately for the Democrats inflation is likely to fall in the coming months. However, voters are likely to respond to year-on-year rather than month-on-month inflation. And voters make up their minds early in midterm election years. Plus, if inflation does not subside, or if Biden is perceived as making a foreign policy mistake, then his approval rating will not stabilize. Bottom Line: Biden’s approval rating is not perking up despite a foreign threat. His approval on economic policy is even worse than on foreign policy, despite low unemployment and real wage growth higher than when he took office. A drop in inflation would improve his fortunes but taken together the evidence suggests that the war has not helped, and may have hurt, the Democrats’ chances this fall. Chart 5Will Jobs And Real Wages Stabilize Presidential Approval?
Will Jobs And Real Wages Stabilize Presidential Approval?
Will Jobs And Real Wages Stabilize Presidential Approval?
Biden Taps Strategic Oil Reserve But Implications Depend On Iran One of our key views for 2022 (reiterated in our Q2 outlook) is the Biden administration’s transition from congressional to executive action. Biden’s decision to tap the strategic petroleum reserve (SPR) on March 31 exemplifies this trend. Gasoline prices have spiked to $4.20 per gallon, which is more than double the level in November 2020 (Chart 6). Biden’s SPR order aims to mitigate the rise in prices. Biden ordered the release of 1 million barrels per day of crude oil over the next 180 days (six months). This would constitute the largest release since the SPR came into being in 1975 (Chart 7).1 Chart 6Prices At The Pump Trigger Red Alert In White House
Prices At The Pump Trigger Red Alert In White House
Prices At The Pump Trigger Red Alert In White House
Chart 7Biden Taps Strategic Petroleum Reserve
Biden Taps Strategic Petroleum Reserve
Biden Taps Strategic Petroleum Reserve
The Strategic Petroleum Reserve (SPR) originated in the wake of the Arab oil embargo to protect the US from supply shocks. Faced with “severe petroleum supply interruptions” the president can authorize a maximum drawdown of 396 million barrels over 90 days, which begin reaching the market roughly 13 days after the decision. The current inventory is 570 million barrels of sweet and sour crude, which could last 92 days of crude imports and 72 days of crude and petroleum product imports (Chart 8). Unlike during the 1970s, today the US is the world’s largest oil and refined products producer. It is a net exporter as well. However, it is still vulnerable to external shocks. It imports 6.3 million barrels per day and has already cut off 283 thousand barrels per day of imports from Russia (Chart 9). Global price shocks still affect the US prices at the pump, as Chart 6 above shows in the relationship between domestic gasoline prices and Brent crude. Chart 8SPR Can Be Tapped For Six-To-Nine Months Easily
SPR Can Be Tapped For Six-To-Nine Months Easily
SPR Can Be Tapped For Six-To-Nine Months Easily
Chart 9US Energy Independent But Still Vulnerable To Shocks
US Energy Independent But Still Vulnerable To Shocks
US Energy Independent But Still Vulnerable To Shocks
The Ukraine crisis is just the sort of geopolitical crisis that the SPR was invented to address – but the magnitude of Biden’s action is larger than normal. The SPR was tapped for 21 million barrels in 1990-91, during the Iraqi invasion of Kuwait, and for 30 million barrels in 2011, when Libyan production fell to zero amid the revolution. However, because of US net exporter status, Biden has much more room for maneuver. The SPR would be tapped for 180 million barrels if Biden’s current plan is fully implemented. The SPR can be released at a rate of 4.4 million barrels per day for about 90 days, though after that the drawdown rate begins to decline for technical reasons (e.g. contaminants). Biden’s 180 days would end in early October, a month before the midterm election. If the SPR has at least 282 million barrels left (90 days of US net crude imports in 2021), the president can continue to release oil from it. The minimum storage level is 282 million barrels of crude. Thus at the end of Biden’s current order, he would have 390 million barrels left and would still be able to release 1 million barrels per day for 108 days. There are various interpretations of Biden’s decision to tap the SPR today: Currently the Russians and Europeans are in a standoff over energy flows. Russia is demanding payment in rubles and Europe is rejecting Russia’s demands while threatening to ban Russian coal imports. Since crude oil is generally interchangeable, an EU-Russia breakdown in crude trade would not prevent Russian barrels from reaching global markets eventually (Chart 10). In short Biden did not tap the SPR in anticipation of a breakdown. Biden could have tapped the SPR because of difficulties convincing the core OPEC states to increase production. Saudi Arabia, the UAE, and Kuwait are rapidly increasing production already, though their 90-day spare capacity enables them to bring out as much as 3.5 million additional barrels per day. But on March 31 they ruled out any massive near-term adjustments. Their relations with the US under the Biden administration have been strained, namely as Biden is still trying to rejoin the 2015 Iranian nuclear deal. If the US and Iran rejoin the 2015 deal, the US would lift sanctions and Iran could quickly bring about 1.3 million barrels per day back to global markets. Biden’s SPR release is roughly equal to this amount, which means it could be insurance for a failure to do a deal (Chart 11). Chart 10Russian Oil Exports To Europe And World
War Not Helping Biden So Far
War Not Helping Biden So Far
An Iran deal on top of the SPR release would add 2.3 million barrels per day in positive supply surprises, while reducing the short-term risk of a military conflict in the Persian Gulf. This would have a significant short-term negative impact on oil prices this year. Chart 11Biden Struggles For Help From OPEC
Biden Struggles For Help From OPEC
Biden Struggles For Help From OPEC
What is clear is that our Geopolitical Strategy’s base case of a failure of US-Iran talks would imply a significantly higher risk of oil disruptions in the Middle East over the short and long run. In that case the OPEC states would need to change their position and increase production or else a new supply shock would be added on top of the Russian shock. Biden’s SPR release would make up for production bottled up in Iran but regional supply disruptions would intensify and Iran would threaten the Strait of Hormuz. Biden’s executive action to tap the SPR removes one option from the table. The ultimate impact of this move depends on whether Biden also uses executive action to do a deal with Iran. We cannot rule it out, because Biden has the authority to lift sanctions unilaterally, but we would not bet on it. Bottom Line: Market fundamentals suggest that Brent prices will fall from their current $105 per barrel toward their likely average of $93 per barrel this year and in 2023. Quant Model Points To Republican Senate Last week we highlighted that our Senate election model flipped from predicting the status quo to predicting a Republican victory, in line with our subjective view of the situation. The latest model findings, using data from the state coincident economic indicators released on April 5, suggests that Republicans have a 51.6% chance of gaining control of the Senate (Chart 12). Democrats only need to lose a single seat to slip from 50 to 49 seats and thus yield the majority. The model suggests they will lose two seats, in Arizona and Georgia. The result is a Republican majority of 52-48 seats. Chart 12Senate Election Model Flips To Republicans
War Not Helping Biden So Far
War Not Helping Biden So Far
Our presidential election model still shows Democrats holding onto the White House in 2024 with 308 electoral college votes but their chances are declining. Specifically Democrats’ odds of retaining the White House have fallen from 54.9% to 54.7% now that the March data is taken into account (Chart 13). North Carolina is still considered a toss-up state, with a 45% probability that Democrats win it, but that means that a single percentage point drop puts it firmly in the Republican camp, along with Arizona and Georgia. Democrats’ odds are falling in Florida, Pennsylvania, and Nevada especially, although they are improving in Wisconsin and Minnesota. Chart 13Presidential Election Model Still Slightly Favors Democrats
War Not Helping Biden So Far
War Not Helping Biden So Far
Florida presents an interesting difference between the two models: the Senate model gives Florida to the Republicans, while the presidential model gives it to the Democrats. This requires some explanation: The incumbent advantage plays a role. Biden did not win Florida in 2020 but that does not stop the model from ascribing Democrats a good chance of winning Florida given that they are the incumbent party. Incumbency would be punished if Democrats held the White House for eight years due to the variable that accounts for the public sentiment that it is “time for change.” The Senate model works differently. The model only helps the party that controls a state Senate seat by means of the partisan leaning of the state in recent elections. This is helpful for Republicans in the model’s 2022 prediction. Meanwhile the model only punishes an incumbent party if it has held control of the US Senate for three or more terms, which is not the case today. Our sample periods across the two election models are the same (1984-2020), but in this period, Democrats only held Senate seats for three out of nine changes. There have been nine different senators from Florida since 1989, three of which have been Democrats. The last Democratic senator was Bill Nelson but he was beaten by Republican Rick Scott in 2018. The other Senate seat has been held by a Republican since around 2004, most recently Marco Rubio, who is up for re-election in 2022. So the model will “lean” more Republican based on total outcomes and how recently recurring they were. Finally, a caveat: we should be careful about explicitly comparing the two election models. Although they are both Probit models, the variables are not all the same. Some are shared but their interaction with one another and the election outcome (dependent variable) should not be assumed to be exactly the same. There can be little doubt in the model’s outlook for the Florida Senate race. Senator Marco Rubio is a young incumbent, has strong name recognition, and is up for re-election in a favorable year for Republicans. As of February he was leading his top Democratic opponent Val Demings by 12 percentage points in opinion polls. Confirming the state’s Republican leaning, Governor Ron DeSantis was leading his Democratic opponent Charlie Crist by 21 percentage points in February polls, with over 50% favoring DeSantis. (Other than former President Trump, DeSantis is currently the favored Republican nominee for 2024.) Moreover the presidential model is catching up to the Senate model, with the odds of a Democratic win in Florida dropping from 59% to 55% over the past month alone. If the odds fall beneath 50% then the model naturally awards all of Florida’s 29 electoral votes to the Republicans. This would leave Democrats hanging by a thread at 279 votes. What is clear is that the 2024 election is a long way off. Democrats benefit from an incumbent advantage as a political party, aside from whether President Biden runs again. Yet the quantitative model suggests that the US will experience another hotly contested presidential election. Bottom Line: Republicans are now tipped to take the Senate in our quantitative model as well as our subjective judgment. Meanwhile Democrats are still favored to win the 2024 election but only slightly, and their odds are falling. These views support the market consensus but in general US investors will remain risk averse ahead of the midterm election. Investment Takeaways Stay tactically long the US dollar and defensive stocks like in the health care sector. Russia is threatening to cut off energy exports to Europe, which is considering a ban on Russian coal. Until this dispute is resolved, risk appetite will suffer, the euro will be limited, and the dollar will stay strong. Stay long renewable energy, cyber security stocks, infrastructure stocks, defense stocks, oil and gas distribution, and small cap energy stocks (Chart 14). Chart 14Investment Takeaways
Investment Takeaways
Investment Takeaways
Matt Gertken Senior Vice President Chief US Political Strategist mattg@bcaresearch.com Jesse Anak Kuri Associate Editor jesse.kuri@bcaresearch.com Guy Russell Senior Analyst guyr@bcaresearch.com Footnotes 1 See White House, “FACT SHEET: President Biden’s Plan to Respond to Putin’s Price Hike at the Pump,” March 31, 2022, whitehouse.gov; Department of Energy, “Strategic Petroleum Reserve: Providing Energy Security For America,” March 28, 2022, energy.gov; and Heather L. Greenley, “The Strategic Petroleum Reserve: Background, Authorities, and Considerations,” Congressional Research Service, R46355, May 13, 2020, crsreports.congress.gov. Appendix Strategic View Open Tactical Positions (0-6 Months) Open Cyclical Recommendations (6-18 Months) Table A2Political Risk Matrix
War Not Helping Biden So Far
War Not Helping Biden So Far
Table A3US Political Capital Index
War Not Helping Biden So Far
War Not Helping Biden So Far
Chart A1Presidential Election Model
War Not Helping Biden So Far
War Not Helping Biden So Far
Chart A2Senate Election Model
War Not Helping Biden So Far
War Not Helping Biden So Far
Table A4APolitical Capital: White House And Congress
War Not Helping Biden So Far
War Not Helping Biden So Far
Table A4BPolitical Capital: Household And Business Sentiment
War Not Helping Biden So Far
War Not Helping Biden So Far
Table A4CPolitical Capital: The Economy And Markets
War Not Helping Biden So Far
War Not Helping Biden So Far
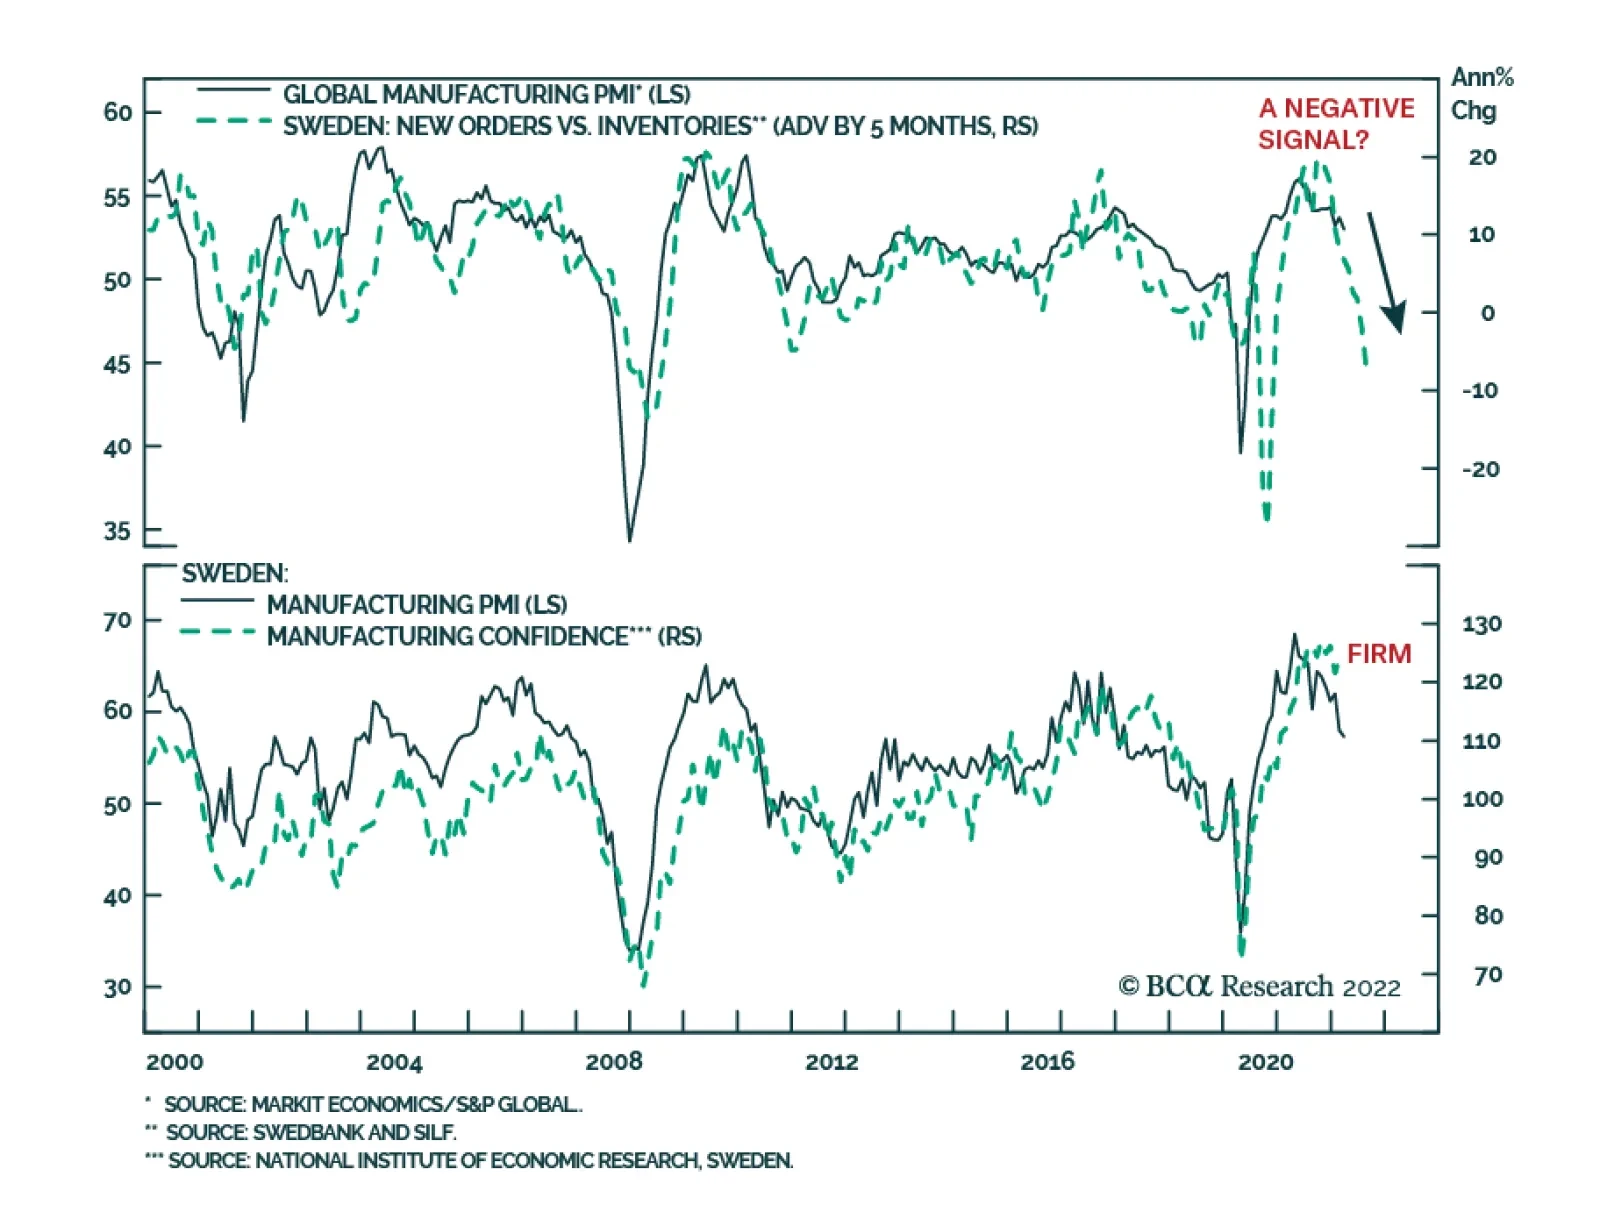
The Swedish PMI’s new orders-to-inventories ratio is sending a warning about the outlook for the global manufacturing cycle. The indicator has collapsed to levels that historically coincided with a global manufacturing PMI that is in contractionary territory.…
Executive Summary Shanghai Is Extending Lockdowns Due To Exponentially Rising COVID Cases
Shanghai Is Extending Lockdowns Due To Exponentially Rising COVID Cases
Shanghai Is Extending Lockdowns Due To Exponentially Rising COVID Cases
The economic impact of China’s struggle with another wave of COVID outbreaks is showing up in March’s PMI and high-frequency data. The highly contagious nature of the Omicron variant suggests that Shanghai’s battle against the virus spread may last longer than the market has priced in. Chinese authorities will continue playing whack-a-mole in efforts to eliminate the country’s COVID cases. The zero-COVID approach and the virus’ mutating to more contagious variants mean that the country may have to impose more frequent mobility restrictions going forward than in the past two years. Although Chinese policymakers are determined to stabilize the economy, the ongoing combat with COVID will weigh down the effectiveness of the stimulus. In relative terms, we maintain a neutral position on Chinese onshore stocks. However, downshifting corporate profits and the economic shock from lockdowns remain significant risks to the absolute performance of Chinese stocks. Bottom Line: China’s combat against the current COVID-19 outbreaks may last longer than the market has priced in. In the near term, the lockdowns will weigh down the effectiveness of the stimulus. In the second half of the year, the more contagious virus mutations and China’s sticking to zero-COVID strategy may lead to more frequent disruptions to business activity. Chart 1China Is Bracing For The Worst COVID Outbreak Since Early 2020
China Is Bracing For The Worst COVID Outbreak Since Early 2020
China Is Bracing For The Worst COVID Outbreak Since Early 2020
China’s efforts to stabilize economic growth are facing new challenges, dampening an already fragile recovery. The current wave of COVID-19 outbreaks — the worst since early 2020 — has infected more than 100,000 (TK) people across the country, and the number of new cases is still rising at an exponential rate (Chart 1). Measures to contain the spread of the virus have led to city lockdowns, halted factory production and have dragged down the tourism and catering industries. In previous reports, we noted that it is challenging for China to reach this year’s 5.5% growth target due to downbeat private-sector sentiment and subdued demand for housing. The outlook for China’s economy is grimmer now. The highly contagious COVID virus mutations, including the emerging Omicron BA.2 variant, will make it more difficult for China to control its domestic outbreaks going forward. We do not expect that China will fundamentally change its zero-COVID policy throughout the rest of this year. Therefore, the country will probably see more frequent regional and city lockdowns this year than in the past two years. The leadership will calibrate its handling of these lockdowns to minimize damage to the economy, and Beijing will continue stepping up its growth support policies. However, the whack-a-mole strategy to eliminate domestic COVID cases will be disruptive to business activity and dampen the effectiveness of policy easing. A One-Two Punch… Related Report China Investment StrategyA Choppy Bottom The downside risks to China’s economy stemming from the ongoing domestic COVID outbreaks are adding to the difficulties the country is already facing due to subdued domestic demand. As we have been highlighting in our previous reports, weak private sector sentiment has been weighing down the effectiveness of authorities’ efforts to stimulate the Chinese economy. The sluggish PMI data released last week in part reflects the impact of restrictions imposed to control the latest wave of COVID-19 infections, but also highlights the bleak domestic demand conditions. Notably, the March PMI survey does not capture the full impact of the Shanghai lockdown as the data collection period ended before the restrictions went into effect on March 28. The official composite PMI fell from 51.2 to 48.8 – below the 50 boom-bust threshold and the lowest reading since February 2020. The drop reflects a slump in the manufacturing and – to a greater extent – the non-manufacturing sectors, which both fell into a contractionary territory. The manufacturing PMI slid 0.7 points to 49.5, while the non-manufacturing PMI dropped 3.2 points to 48.4 (Chart 2). The new orders sub-index of the manufacturing PMI lost nearly two percentage points and deteriorated more sharply than the production index (Chart 3). Moreover, the spread between the new orders component and new export orders – a proxy for domestic demand – ticked down in March (Chart 3, bottom panel). This indicates that weak production does not just stem from COVID-related supply-side issues, but also from poor domestic demand conditions. Chart 2Chinese PMIs Slide Into Contractionary Territory
Chinese PMIs Slide Into Contractionary Territory
Chinese PMIs Slide Into Contractionary Territory
Chart 3Economic Shock From Lockdowns Compounds An Already Weak Domestic Demand
Economic Shock From Lockdowns Compounds An Already Weak Domestic Demand
Economic Shock From Lockdowns Compounds An Already Weak Domestic Demand
Chart 4Auto Inventory Index Jumped To Highest Since Early 2020
Auto Inventory Index Jumped To Highest Since Early 2020
Auto Inventory Index Jumped To Highest Since Early 2020
In addition, high-frequency data from the China Automobile Dealers Association shows that the Vehicle Inventory Alert Index (VIAI) – a survey that measures destocking pressures in the automobile industry – jumped to the highest level since the first wave of COVID-19 hit China in early 2020 (Chart 4). A rising VIAI above the 50-percent threshold indicates that auto inventories are cumulating at a faster pace than demand. Importantly, the cities and regions that have been worst hit by this round of COVID outbreaks are mostly coastal metropolises and business hubs such as Shanghai, Shenzhen and cities in Jiangsu and Zhejiang provinces. These cities and provinces represent more than 20% of China’s aggregate GDP and almost 30% of the country’s total import and export volume. As such, the negative impact on China’s overall economy from the lockdowns will be more substantive than during the previous waves. Measures to contain Shanghai’s worst-ever COVID outbreak are also disrupting operations at the world’s busiest container port, adding strains to the already overstretched global shipping industry (Chart 5). The supplier delivery times subindex of the manufacturing PMI dropped to 46.5 in March, the lowest reading since March 2020 (Chart 6). This suggests that suppliers’ delivery times have lengthened with near-term supply chain pressure, since lower readings reflect longer delivery times. Chart 5Shanghai Lockdowns Will Disrupt The Already Overstretched Global Shipping Industry
Shanghai Lockdowns Will Disrupt The Already Overstretched Global Shipping Industry
Shanghai Lockdowns Will Disrupt The Already Overstretched Global Shipping Industry
Chart 6Chinese Suppliers' Delivery Times Have Lengthened
Chinese Suppliers' Delivery Times Have Lengthened
Chinese Suppliers' Delivery Times Have Lengthened
Bottom Line: The economic shock from the current COVID outbreaks is compounding an already weak domestic demand in China. Since the cities and regions that are affected by this round of lockdowns are some of China’s most developed metropolitan areas, the negative impact will likely be larger than during the past two years. How Long Will The Battle Last? China’s struggle to contain the current round of domestic COVID outbreaks will likely last longer than the market has priced in. There is also a non-trivial risk that during the rest of the year, the country will need to shutter large parts of its economy more frequently to combat the spread of COVID variants, which appear to become more contagious as the mutation continues. The lockdowns in Shanghai have already been extended beyond the originally announced two-phased, eight-day restriction plan (Chart 7). The first phase of the lockdown, for which restrictions were due to be lifted on the morning of April 1, has now been extended to anywhere between 3 to 10 days. It may take Shanghai, a city of 25 million residents, between four to six weeks to bring the number of new cases down to a level that is acceptable to the authorities. Chart 7Shanghai Is Extending Its Two-Phased, Eight-Day Lockdowns
Bracing For More Turbulence
Bracing For More Turbulence
Shenzhen, a dynamic metropolitan city bordering Hong Kong, seems to have successfully contained its COVID outbreaks after only one week of a city-wide lockdown. However, Shenzhen imposed lockdowns at an early stage of the outbreak, when both confirmed and asymptomatic case numbers in the city were in the low double digits. Shanghai, on the other hand, took more stringent measures when the number of asymptomatic cases had already reached nearly a thousand. The Omicron variant is four times more transmissible than the earlier Delta mutation, which means it will generate an explosive rise in cases and make containing the virus spread much more difficult than with Delta. In a fully susceptible (unvaccinated and uninfected) population, one person with Delta would on average infect five other people, while one person with Omicron could transmit the virus to about 20 others. As a result, despite a relatively low number of newly confirmed cases, the surging asymptomatic cases in Shanghai imply that a larger population in the city might have already been infected (Chart 8). China’s struggle with the current wave of COVID outbreaks may be an example of what lies ahead, as continuously mutating variants become more contagious and will pose fresh new challenges to China’s zero-COVID approach. The latest strain of Omicron BA.2 appears to be 40% more contagious than the original Omicron strain and is quickly spreading around the world. The number of cases has spiked across much of Europe, parts of Asia, and has begun to rise in North America (Chart 9). It took only two months from when China reported its first local Omicron BA.1 case in early January to the outbreaks of Omicron BA.2 in March. Chart 8Surging Asymptomatic Patients In Shanghai Imply More Confirmed Cases Still To Come
Surging Asymptomatic Patients In Shanghai Imply More Confirmed Cases Still To Come
Surging Asymptomatic Patients In Shanghai Imply More Confirmed Cases Still To Come
Chart 9Covid Cases Are On The Rise Again Globally
Bracing For More Turbulence
Bracing For More Turbulence
This presents the Chinese authorities with a difficult dilemma: impose severe mobility restrictions when domestic cases pop up, or let the virus run rampant and develop a herd immunity among much of its population. China’s leadership has recently reiterated that the country will stick to its zero-COVID strategy. The success that China has had in suppressing the virus in the past two years has left its population with little natural immunity. Moreover, while China’s overall vaccination rate is high at 85%, less than 50% of people over the age of 80 in the country are fully vaccinated. The authorities have been fine tuning their measures to control the virus spread while sticking to a zero-COVID approach. The recently calibrated measures include allowing residents to take rapid antigen tests at home, quarantining people with asymptomatic COVID cases at dedicated isolation centers rather than hospitals, and monitoring patients for shorter periods than previously required. China has also fast-tracked the approval for the importing and domestic manufacturing of Paxlovid, which is highly effective at preventing hospitalization if taken within five days of the onset of symptoms. In addition, the global production of antiviral drugs is starting to ramp up (Chart 10). Nonetheless, China will probably wait until the antiviral drugs are in sufficient supply before fundamentally relaxing its zero-COVID policy. In the meantime, while the country’s economic growth will rebound when the current wave of COVID cases subsides, disruptive outbreaks and lockdowns may become more frequent as the authorities continue to play whack-a-mole with COVID (Chart 11). As a result, business activity in China will suffer. Chart 10Production Of New COVID Drugs Is Picking Up
Production Of New COVID Drugs Is Picking Up
Production Of New COVID Drugs Is Picking Up
Chart 11China Has The Most Stringent COVID-Control Measures Among Large Economies
China Has The Most Stringent COVID-Control Measures Among Large Economies
China Has The Most Stringent COVID-Control Measures Among Large Economies
Bottom Line: Shanghai’s current battle with COVID outbreaks will likely continue in the coming weeks. Before China can relax its zero-COVID policy, the more contagious COVID virus mutations in the future will see Chinese authorities adopt even harsher quarantine and control measures, which will disrupt economic activity further. Investment Conclusion Chinese stocks in both onshore and offshore markets have recovered some ground from their deeply oversold conditions in mid-March (Chart 12A). While the risk-reward profile for the A-share market warrants a neutral position in a global portfolio, in absolute terms both on- and offshore Chinese stock prices have probably not reached their bottom (Chart 12B). Chart 12AChinese Stocks Will Likely Fall Further In Q2
Chinese Stocks Will Likely Fall Further In Q2
Chinese Stocks Will Likely Fall Further In Q2
Chart 12BIn Relative Terms, Stay Neutral On Chinese Onshore Stocks
In Relative Terms, Stay Neutral On Chinese Onshore Stocks
In Relative Terms, Stay Neutral On Chinese Onshore Stocks
The private sector’s downbeat sentiment, households’ subdued demand for housing, and the ongoing COVID-19 lockdowns pose significant near-term downside risks to China’s economy and corporate profits. February’s credit impulse shows that corporate and household demand for credit has been weakening. Without a major reversal in corporate credit and the property market, a strong business cycle recovery is unlikely in China. Moreover, the March PMI readings suggest that the lockdowns in China’s business and manufacturing hubs will have substantial negative impacts on the economy. As such, we maintain our neutral stance on Chinese onshore stocks and continue to recommend underweight Chinese offshore stocks in a global portfolio. Jing Sima China Strategist jings@bcaresearch.com Strategic Themes Cyclical Recommendations
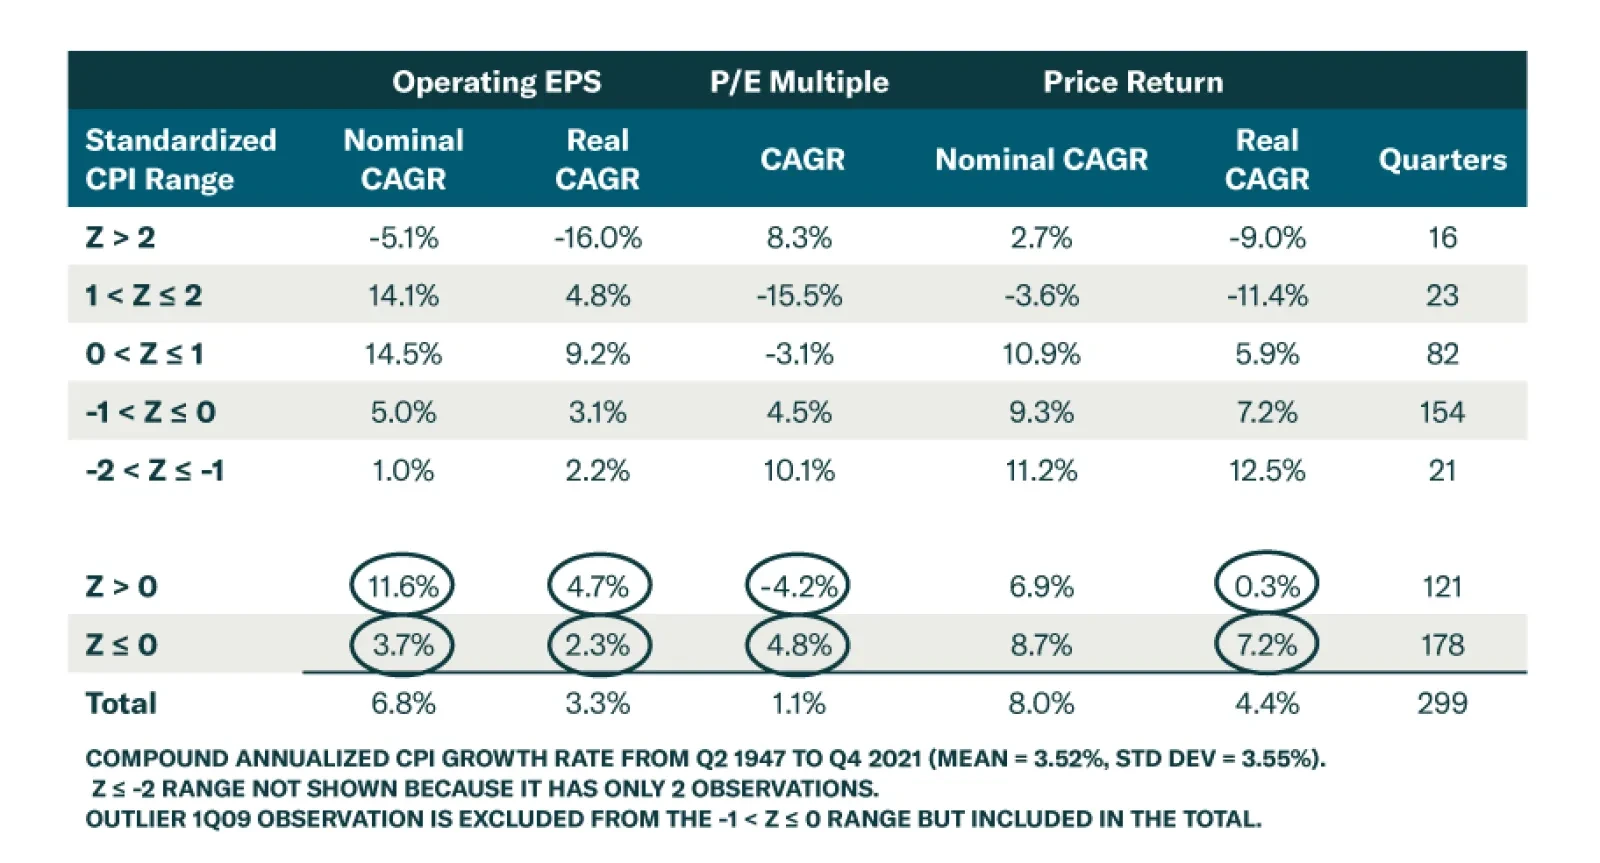
BCA Research’s US Investment Strategy service reviewed the performance of S&P 500 operating earnings, earnings multiples and returns in five inflation regimes to see how equities have responded to inflation over the last 75 years. In the extreme…
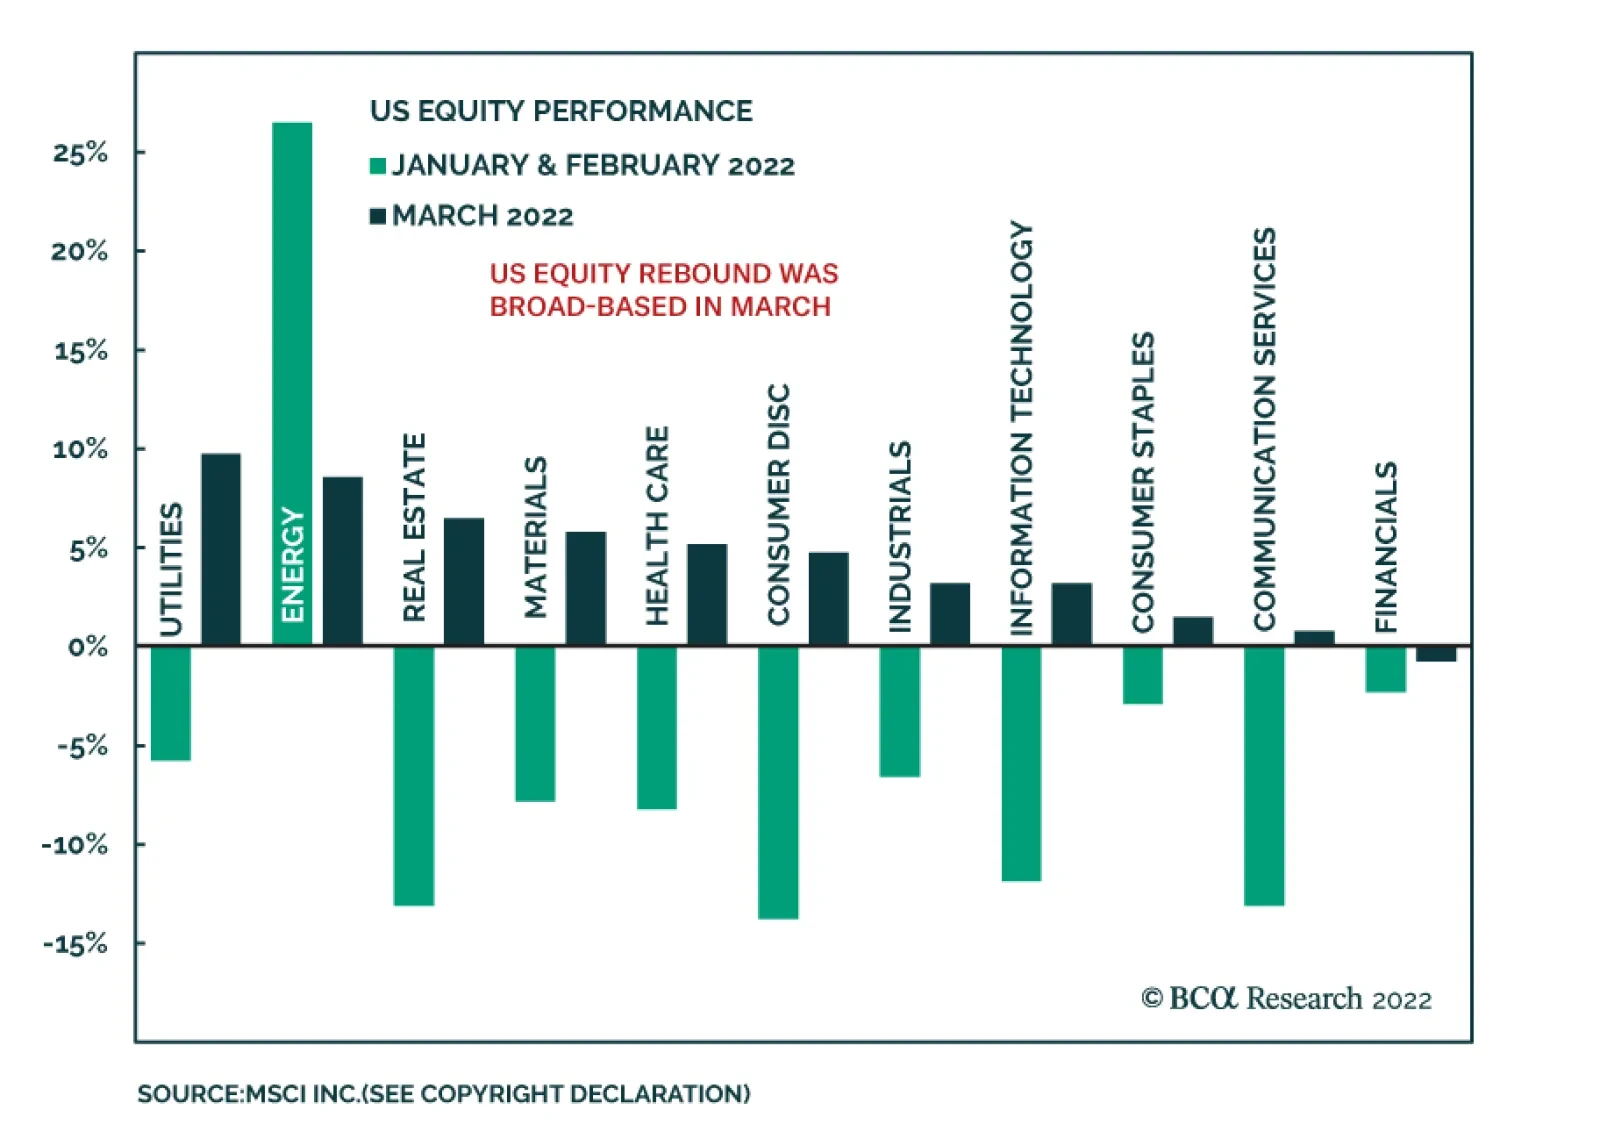
In our March In Review, we highlighted that US equities were the only major global bourse to post positive returns in March. Notably, the improvement was broad-based with nearly all US equity sectors ending the month in the green. Utilities led US stocks…
Executive Summary Tighter Financial Conditions May Affect Growth
Tighter Financial Conditions May Affect Growth
Tighter Financial Conditions May Affect Growth
Inflation Outlook: Inflation is becoming entrenched, spreading beyond a few pandemic-related items to “sticky price” categories. A wage-price spiral and unmoored inflation expectations translate into upside risk to the 2.5% consensus core PCE forecast. Consumer Spending: Americans are being forced to allocate a larger proportion of income towards food and gas, shifting consumption away from discretionary spending. As such, consumer spending alone may not be able to keep the economy afloat. On a 50bps hike: The rate hike increments are less important than the message the Fed is sending out to the market: Talking up 50 bp rate rises, the Fed is signaling that is it laser-focused on inflation, which is reassuring. Tightening and the economy: Aggressive monetary tightening will lead to slower economic growth, but this is not yet reflected in consensus economic growth forecasts. Recession Coming? Economic growth is slowing but off high levels, and recession is not imminent. Our recession indicator does not flash danger. However, we are watching out for a growth disappointment. Bottom Line: In a commentary to our bi-monthly sector chart pack report, we provide answers to the most frequently asked questions on the state of the US economy. Feature Performance Markets never cease to surprise. In March, US equities staged an unexpected rally despite the backdrop of a hawkish Fed, raging inflation, surging energy prices, and a war in the heart of Europe. The reversal was broad-based, not leaving a single sector in the red (Chart I-1). The S&P 500 has regained 9% since the market bottom on March 8, 2022 and is only 5.5% off its all-time high. The NASDAQ has rebounded 13%. Is this rally sustainable? In a report a couple of weeks ago, we aimed to answer this question. We recommended patience, although many ingredients, such as attractive valuations and oversold technical conditions, were already in place. Our reasons for patience were that: Economic growth expectations are still elevated and bottom-up earnings growth forecasts need to come down, to reflect slowing growth, a tighter monetary regime, and higher commodities and energy prices. Our view is unchanged. This week was a busy one: A media interview with The Deep Dive, and two virtual conferences in Australia, one run by Insider Network and the other by Equity Forum. In today’s cover report for our sector chartpack, we answer questions we received from the media and conference audience, that we believe will be of interest to clients. Chart I-1Powerful Rebound
INFLATION EXPECTATIONS
INFLATION EXPECTATIONS
Questions And Answers The Consumer Price Index (CPI) increased by 7.9% and the PCE price index, the Fed’s preferred measure of inflation, came in at 6.4% in February – readings not seen since 1982. What is your outlook on inflation? Inflation will come down, assisted by the arithmetic of the base effect. However, it is unlikely to revert to levels that the Fed and the US consumer will consider acceptable. Moreover, inflation could surprise further to the upside. The concern is that inflation is becoming entrenched. It has spread beyond a few pandemic-related items to goods for which prices are usually sticky (Chart I-2). There are also clear signs that price increases are feeding through to wage increases. Real wage growth remains negative at -2%, while demand for labor is robust – there are 1.7 open jobs per job seeker, and companies are raising wages to retain talent (Chart I-3). Subsequently, they will raise prices to pass on cost increases to customers. These are fertile conditions for a wage-price spiral, with inflation becoming even more entrenched. Chart I-2Even Sticky Prices Are Now Rising
Even Sticky Prices Are Now Rising
Even Sticky Prices Are Now Rising
Chart I-3Rising Wages Are In Lockstep With Rising Prices
Rising Wages Are In Lockstep With Rising Prices
Rising Wages Are In Lockstep With Rising Prices
Further, inflation expectations have become unmoored: According to a University of Michigan survey, consumers expect prices to rise by 5.5% over the next year, and by more than 3% a year over five to 10 years (Chart I-4). Concerningly, the upward adjustment in inflation expectations is relentless. The war in Ukraine exacerbates many causes of inflation: Its indirect effects are shortages of raw materials, energy, and shipping disruptions (Chart I-5). Chart I-4Inflation Expectations Are Unmoored
Inflation Expectations Are Unmoored
Inflation Expectations Are Unmoored
Chart I-5Supply Chains Remain Disrupted
Supply Chains Remain Disrupted
Supply Chains Remain Disrupted
Consensus forecasts for US core PCE inflation see it coming down to 2.5% by next year. The risk is that it could exceed that. Bottom Line: Inflation will come down but may not normalize any time soon. What is the effect of food and energy inflation on consumer spending? Negative real wage growth bites into consumer purchasing power, sapping confidence (Chart I-6). It does not help that food and energy prices are up by 8% and 14% respectively year over year (Chart I-7). However, the rising price of necessities has the most pronounced effect on low earners: Food accounts for more than a quarter of the after-tax income of the lowest quintile of earners, falling to just over five percent of income for top earners (Chart I-8). As many Americans are forced to allocate a larger proportion of income towards food and gas, they have to shift consumption away from discretionary spending. Thus, a high price for gasoline does not necessarily suppress demand for gasoline but rather reduces demand for, say, fast-food meals. Chart I-6High Inflation Saps Consumer Confidence
High Inflation Saps Consumer Confidence
High Inflation Saps Consumer Confidence
Chart I-7Food And Energy Prices Have Surged
Food And Energy Prices Have Surged
Food And Energy Prices Have Surged
This change in a spending basket explains a slowdown in consumer spending: PCE increased only 0.2% month-on-month in February, which is underwhelming compared to the 0.7% expected. It also explains rising credit-card balances (Chart I-9). Chart 8Rising Cost Of Food Cuts Into Discretionary Spending...
Sector Chart Pack Commentary
Sector Chart Pack Commentary
Chart I-9Many Consumers Are Struggling
Many Consumers Are Struggling
Many Consumers Are Struggling
At the same time, we know that US consumers have $2.3 trillion in excess savings – which are clearly not uniformly distributed across income groups. This nice stash of cash provides a solid consumer spending cushion for the US economy, but it may not be up to the challenge of keeping the economy afloat single-handedly. Bottom Line: For now, the US consumer is in good shape but there are cracks in the foundation as lower-income Americans are clearly struggling with rising food and gas prices. Fed Chair Jerome Powell noted last week that the Fed could raise rates from the traditional 25 basis points per meeting to 50 basis points if necessary. Do you think 50 basis points will have much of an impact on inflation or on the real economy? The Fed has gotten way behind the curve. In retrospect, it should have raised rates last summer – and it now understands its error. Its first hike this cycle came only when the economy had already over-heated (Chart I-10). At long last, the Fed, despite its dual objective, is laser-focused on inflation. As with most central banks, signaling is presumably more important than action – remember the famous Mario Draghi’s “whatever it takes.” Talking up 50 bp rate rises, the Fed is signaling that “the inflation cop is back in town.” And while it will be hard for the Fed to put the inflation genie back in the bottle, it is reassuring that it will at least try. As for a potential 50-basis-point rate rise, for now it does not present an immediate threat to the real economy: Real rates remain negative and monetary conditions are fairly loose, while the neutral rate (that elusive r-star) is still quite a ways off from where the rates are now (Chart I-11). Bottom Line: The rate hike increments are less important than the message the Fed is sending out to the market. Chart I-10The Fed Is Behind The Curve
Sector Chart Pack Commentary
Sector Chart Pack Commentary
Chart I-11The Market Expects The Fed To Move Aggressively To Combat Inflation
The Market Expects The Fed To Move Aggressively To Combat Inflation
The Market Expects The Fed To Move Aggressively To Combat Inflation
What will be the effect of monetary tightening on economic growth? Related Report US Equity StrategyHave US Equities Hit Rock Bottom? While early on, rate hikes can be shrugged off by a strong economy, over time, tighter financial conditions necessary to combat inflation, augur badly for growth. While financial conditions are still loose, they have already tightened on the back of higher long-term rates, widening credit spreads, and a strengthening dollar. The Goldman Sachs Financial Conditions Index points to the ISM Manufacturing Index falling below 50 later this year (Chart I-12). However, as we have pointed out in our “Have We Hit Rock Bottom Yet?” report, GDP growth forecasts do not reflect tighter monetary conditions and higher commodity prices (Chart I-13). The Atlanta Fed Nowcast points to only 0.9% annualized growth in Q1, yet consensus expectations have barely budged. Bottom Line: Aggressive monetary tightening will lead to slower economic growth. Chart I-12Tighter Financial Conditions May Affect Growth
Tighter Financial Conditions May Affect Growth
Tighter Financial Conditions May Affect Growth
Chart I-13The GDP Forecasts Have Not Been Revised Down To Reflect New Challenges
The GDP Forecasts Have Not Been Revised Down To Reflect New Challenges
The GDP Forecasts Have Not Been Revised Down To Reflect New Challenges
Investors are increasingly worried that the US is heading for a recession. What are your views? As my colleague, US Investment Strategist Doug Peta has put it: “Fed Chair Powell is attempting to steer the US economy between the Scylla of a recession and the Charybdis of entrenched high inflation.” Indeed, the Fed has a narrow margin of error for achieving a “soft landing.” The war in Ukraine makes the Fed’s objective even more challenging. Alan Blinder, a former Fed economist and current Princeton University professor who has a forthcoming book on monetary and fiscal policy history over the past 60 years, says the Fed has just once in the last 11 tightening periods nailed a “perfect soft landing” – in the early 1990s. But twice more, in the mid-1960s and early 1980s, the central bank raised interest rates without sparking an official recession—and such “soft-ish” landings, he said in a recent presentation, are not all that rare.1 This is a track record we find disturbing. However, we share Powell’s view that “the probability of a recession within the next year is not particularly elevated… all signs are that this is a strong economy and, indeed, one that will be able to flourish… in the face of less accommodative monetary policy.” We concur. A recession is unlikely in the next 12 months or so. The US economy is in the midst of a classic slowdown stage of the business cycle: Growth is still strong albeit slowing, inflation is elevated, liquidity is (still) abundant, capacity utilization is high, and the unemployment rate is low (Table 1). The American consumer is unhappy but has not tightened purse strings much yet. Importantly, growth is slowing off high levels so this stage can take a long time (Chart I-14). Table I-1Stages Of The Business Cycle
Sector Chart Pack Commentary
Sector Chart Pack Commentary
Doug Peta’s simple recession indicator, built from components that have reliably provided an advance warning, reinforces this conclusion. The 3-month/10-year segment of the yield curve is not yet close to inverting (Chart I-15). Chart I-14The Business Cycle Indicator Signals Slowdown
The Business Cycle Indicator Signals Slowdown
The Business Cycle Indicator Signals Slowdown
Chart I-1510-Year Treasury Yield Less 3-Months Treasury Bills Segment Is Not Inverted
10-Year Treasury Yield Less 3-Months Treasury Bills Segment Is Not Inverted
10-Year Treasury Yield Less 3-Months Treasury Bills Segment Is Not Inverted
The year-over-year change in the Conference Board’s Leading Economic Index is way above the zero line that has signaled past recessions (Chart I-16). The ISM Manufacturing PMI is well above 50. The Fed funds rate is nowhere near its equilibrium/neutral level, which we judge to be north of 3%, and it is highly unlikely to get there by the end of the year (Chart I-17). Chart I-16The LEI YoY% Is Way Above Zero
The LEI YoY% Is Way Above Zero
The LEI YoY% Is Way Above Zero
Chart I-17The Fed Funds Rate Is Far From Neutral
The Fed Funds Rate Is Far From Neutral
The Fed Funds Rate Is Far From Neutral
Excluding the pandemic, recessions over the last 50-plus years have occurred only when all three components sound the alarm; not one is flashing red now and not one is likely to do so during 2022. Bottom Line: We are watching out not for a recession, but for a growth disappointment. Irene Tunkel Chief Strategist, US Equity Strategy irene.tunkel@bcaresearch.com S&P 500 Chart II-1Macroeconomic Backdrop
Macroeconomic Backdrop
Macroeconomic Backdrop
Chart II-2Profitability
Profitability
Profitability
Chart II-3Valuations And Technicals
Valuations And Technicals
Valuations And Technicals
Chart II-4Uses Of Cash
Uses Of Cash
Uses Of Cash
Communication Services Chart II-5Macroeconomic Backdrop
Macroeconomic Backdrop
Macroeconomic Backdrop
Chart II-6Profitability
Profitability
Profitability
Chart II-7Valuations And Technicals
Valuations And Technicals
Valuations And Technicals
Chart II-8Uses Of Cash
Uses Of Cash
Uses Of Cash
Consumer Discretionary Chart II-9Macroeconomic Backdrop
Macroeconomic Backdrop
Macroeconomic Backdrop
Chart II-10Profitability
Profitability
Profitability
Chart II-11Valuations And Technicals
Valuations And Technicals
Valuations And Technicals
Chart II-12Uses Of Cash
Uses Of Cash
Uses Of Cash
Consumer Staples Chart II-13Macroeconomic Backdrop
Macroeconomic Backdrop
Macroeconomic Backdrop
Chart II-14Profitability
Profitability
Profitability
Chart II-15Valuations And Technicals
Valuations And Technicals
Valuations And Technicals
Chart II-16Uses Of Cash
Uses Of Cash
Uses Of Cash
Energy Chart II-17Macroeconomic Backdrop
Macroeconomic Backdrop
Macroeconomic Backdrop
Chart II-18Profitability
Profitability
Profitability
Chart II-19Valuations And Technicals
Valuations And Technicals
Valuations And Technicals
Chart II-20Uses Of Cash
Uses Of Cash
Uses Of Cash
Financials Chart II-21Macroeconomic Backdrop
Macroeconomic Backdrop
Macroeconomic Backdrop
Chart II-22Profitability
Profitability
Profitability
Chart II-23Valuations And Technicals
Valuations And Technicals
Valuations And Technicals
Chart II-24Uses Of Cash
Uses Of Cash
Uses Of Cash
Health Care Chart II-25Sector vs Industry Groups
Sector vs Industry Groups
Sector vs Industry Groups
Chart II-26Profitability
Profitability
Profitability
Chart II-27Valuations And Technicals
Valuations And Technicals
Valuations And Technicals
Chart II-28Uses Of Cash
Uses Of Cash
Uses Of Cash
Industrials Chart II-29Macroeconomic Backdrop
Macroeconomic Backdrop
Macroeconomic Backdrop
Chart II-30Profitability
Profitability
Profitability
Chart II-31Valuations And Technicals
Valuations And Technicals
Valuations And Technicals
Chart II-32Uses Of Cash
Uses Of Cash
Uses Of Cash
Information Technology Chart II-33Macroeconomic Backdrop
Macroeconomic Backdrop
Macroeconomic Backdrop
Chart II-34Profitability
Profitability
Profitability
Chart II-35Valuations And Technicals
Valuations And Technicals
Valuations And Technicals
Chart II-36Uses Of Cash
Uses Of Cash
Uses Of Cash
Materials Chart II-37Macroeconomic Backdrop
Macroeconomic Backdrop
Macroeconomic Backdrop
Chart II-38Profitability
Profitability
Profitability
Chart II-39Valuations And Technicals
Valuations And Technicals
Valuations And Technicals
Chart II-40Uses Of Cash
Uses Of Cash
Uses Of Cash
Real Estate Chart II-41Macroeconomic Backdrop
Macroeconomic Backdrop
Macroeconomic Backdrop
Chart II-42Profitability
Profitability
Profitability
Chart II-43Valuations And Technicals
Valuations And Technicals
Valuations And Technicals
Chart II-44Uses Of Cash
Uses Of Cash
Uses Of Cash
Utilities Chart II-45Macroeconomic Backdrop
Macroeconomic Backdrop
Macroeconomic Backdrop
Chart II-46Profitability
Profitability
Profitability
Chart II-47Valuations And Technicals
Valuations And Technicals
Valuations And Technicals
Chart II-48Uses Of Cash
Uses Of Cash
Uses Of Cash
Table II-1Performance
Sector Chart Pack Commentary
Sector Chart Pack Commentary
Table II-2Valuations And Forward Earnings Growth
Sector Chart Pack Commentary
Sector Chart Pack Commentary
Footnotes 1 "Recession Risks Are Rising. Can the Fed Stick a Soft Landing?" Barron's (barrons.com) Recommended Allocation Recommended Allocation: Addendum
Sector Chart Pack Commentary
Sector Chart Pack Commentary