Equities

Executive Summary Cheap Or Expensive?
Cheap Or Expensive?
Cheap Or Expensive?
President Emmanuel Macron will be re-elected.French growth will slow in the coming quarters but will also remain solid beyond that horizon.France’s reform push will continue, particularly pension reforms and efforts to reduce inefficiencies. However, austerity is unlikely to materialize.French stocks will underperform once energy inflation peaks. Consumer discretionary and staples have run ahead of themselves relative to the broad market and to their European peers. French small-cap stocks and aerospace and defense equities are attractive.RecommendationsINCEPTIONDATERETURN (%)COMMENTBuy French Small-Caps Equities / Sell French Large-Caps Equities (*)04/04/2022 CyclicalSell French Consumer Equities Relative to French Benchmark (*)04/04/2022 CyclicalOverweight French Aerospace & Defense**04/04/2022 Structural Bottom Line: A second Macron presidency will not boost the appeal of French large-cap equities, even if it helps French long-term growth. Investors should underweight the French market in Europe via a large underweight in French consumer discretionary and consumer staple stocks. However, investors should overweight French defense names as well as small-cap equities.FeatureThe French presidential election is upon us. President Emmanuel Macron ambitious pro-growth and pro-business reform agenda in 2017 tackled the roots of the French malaise of the past decades. Our conviction that Macron would win a second mandate has survived challenges such as the “Yellow Vest Movement” in 2019 and then COVID-19. Now, with the shock of the Ukraine war, the evidence still suggests he will win the upcoming election. Chart 1Five More Years Of Macron
France: Macron And Macro
France: Macron And Macro
Macron is the favorite with 53% of voting intentions against Marine Le Pen in the second round of the election (Chart 1). Even a potential Russian interference in the French election wouldn’t change the outcome of such a duel, which we discussed at length last summer. Since then, Macron’s advantages over Le Pen have only strengthened, boosted by his handling of Omicron and the Ukraine/Russia crisis while the center-right and the far-right battle each other (Chart 1, bottom panel).Macron also took the unofficial leadership of Europe after Angela Merkel exited the stage. He managed to breathe new life into the European Union (EU), bringing forth greater unity. As a result, the current war in Ukraine and elevated energy prices have made this political rendez-vous more relevant. Chart 2Less Euroscepticism Helps Macron
Less Euroscepticism Helps Macron
Less Euroscepticism Helps Macron
The main axis of Macron’s next term is to make France a more independent nation within a stronger Europe. This is a paradox, but what it means is that he is capitalizing on the current geopolitical climate of great power struggle and hypo-globalization. France is breaking with its tradition of Euroscepticism to secure its national interests within a closer European bloc (Chart 2).True, the French economy will not be spared from the current stagflation episode and growth will slow in the near term. However, France is in a better position to withstand the energy shock than most of its European peers.After Macron is re-elected, his political capital will be replenished and his structural reform effort will continue, albeit with modifications to deal with the post-pandemic and post-Ukraine environment. Fiscal and monetary policies remain very accommodative. As a result, Macron has a favorable chance of reforming France further. Pension reform as well as the green and digital transitions will improve France’s economic competitiveness over the long run.2017 vs. 2022: One Pandemic, One Recession, And One War Later Chart 3The French Economy Will Surprise To The Upside
France: Macron And Macro
France: Macron And Macro
France was badly hit by COVID-19. However, appropriate fiscal policy and strong domestic demand are driving the recovery (Chart 3). While most sectors are expected to recover fully by 2023, a few sectors, such as automotive, aeronautics, and tourism, still lag behind pre-pandemic levels (Chart 3, panel 2). On the upside, France appears to be doing better than the other major European economies (Chart 3, bottom panel). Moreover, about 1.5% of GDP worth of leftover funds from emergency measures and the recovery plan are to be deployed in 2022.The Ukrainian conflict challenges this positive backdrop. Growth forecasts for 2022 were revised to 2.8% from 4%. The impact from elevated energy prices is projected to reduce annual GDP growth by 0.7% and to trim an additional 0.2% once international spillovers are factored in (Table 1). Nonetheless, France is not as vulnerable to Russian energy as Germany and Italy (Chart 4). For now, Russia-EU energy flow continues, although the threats are rising. Germany once again rejected an energy boycott when Biden visited Europe two weeks ago, but it is also preparing for the eventuality that gas flows may dry up, which highlights the fluidity of the situation. Table 1Impact Of High Energy Prices
France: Macron And Macro
France: Macron And Macro
Chart 4Low Vulnerability To Russian Energy…
France: Macron And Macro
France: Macron And Macro
The direct consequences of the conflict on French exports are limited. Russia, Ukraine, and Belarus represent 1.2% of French exports, or EUR12 billion, most of which comes from transport equipment and other manufactured goods (Table 2). Table 2… And Low Trade Exposure
France: Macron And Macro
France: Macron And Macro
The evolution of the Chinese economy is another major external influence on French growth. France is exposed to the deceleration of the Chinese manufacturing PMI induced by the slowdown in Chinese credit growth. The recent closing of cities like Shanghai or Shenzhen because of the spread of the Omicron variant will accentuate near-term risks. However, Chinese policymakers want to stabilize growth by the time the Communist Party reshuffles this fall and the credit impulse is trying to bottom, which will help French exports to China improve later this year or next (Chart 5).Higher inflation is another consequence of supply disruptions and elevated energy prices caused by the Ukrainian war. For now, this is not a pressing concern in France. Headline inflation came in at 5.1%, well below the European average (Table 3). The government intervened to shield consumers from rising energy prices by handing out energy vouchers, freezing gas prices until the end of the year, and cutting electricity taxes. Chart 5France Is Sensitive To The Chinese Economy
France Is Sensitive To The Chinese Economy
France Is Sensitive To The Chinese Economy
Table 3Lower Inflation In France
France: Macron And Macro
France: Macron And Macro
Chart 6French Households Accumulated Plenty Of Excess Savings
France: Macron And Macro
France: Macron And Macro
This is good news for French households, as it preserves some of their purchasing power, especially when compared to Spanish households that suffer an inflation rate of 9.8%. However, it is not enough to prevent consumer confidence from crumbling. From Table 1, consumer spending is projected to fall by 1%. Yet, French consumers benefit from their large savings, accumulated during the pandemic (Chart 6). Unlike the US, where the household savings rate has already gone back to pre-pandemic levels, the savings rate in France is still high. Households can use those excess savings to mitigate elevated energy prices.With respect to employment, the generous French furlough scheme contributed to this accumulation of savings by limiting the rise in unemployment (Chart 7). Therefore, the French labor market was resilient throughout the crisis and has recovered quickly. Labor force participation exceeds its pre-crisis level by about 0.5%. Youth unemployment reached its lowest level since the 1980s, at 14.8 %, in part because of the 2017 labor and vocational reforms. Moreover, labor market conditions are now tighter than they were pre-pandemic and firms are increasingly complaining about labor shortages (Chart 8). The business sector still expects employment growth to remain as robust as it was in 2018. As a result, French wage growth will firm up before the year-end. Chart 7The French Labor Market Has Recovered...
The French Labor Market Has Recovered...
The French Labor Market Has Recovered...
Chart 8...And Is Showing Signs Of Tightening
...And Is Showing Signs Of Tightening
...And Is Showing Signs Of Tightening
The corporate sector has several reasons to be optimistic (Chart 9). The emergency measures prevented widespread corporate defaults and bank lending remained supportive through the crisis. Profit margins are high. Additionally, conducting business in France is becoming easier. Business creation has continued to rise (Chart 9, bottom panel) and FDI projects were up 32% in 2021, making France the largest investment destination in Europe. Nonetheless, the rise in non-financial gross corporate debt is concerning, even though the increase in net debt was limited by the jump in bank deposits during the crisis (Chart 10). Chart 9France Is Becoming More Business Friendly
France Is Becoming More Business Friendly
France Is Becoming More Business Friendly
Chart 10Corporate Debt Is A Concern
France: Macron And Macro
France: Macron And Macro
Bottom Line: French growth will decelerate in the coming quarter in response to the Ukrainian crisis, but it will remain stronger than that of its European peers. In the second half of the year, stronger demand recovery in hard-hit sectors, Chinese stimulus, European fiscal support, pent-up demand, and a declining energy drag will allow growth to recover markedly.Reforms: Take 2(022)The series of recent crises highlight several weaknesses in the French economy. The pandemic revealed how vulnerable and underfunded the French health sector is. It also underscored that digitalization is inadequate in French firms. The Ukraine/Russia conflict is mixed: it underscores the energy dependence of European countries and highlights the need for greater defense spending, even if France is already less dependent than others and manufactures state of the art military equipment.Related ReportEuropean Investment StrategyFrance: More Than Just A Déjà-VuIn both crises, the French social welfare state played a crucial role as an automatic stabilizer. The IMF estimates that stabilizers absorbed about 80% of the household income shock during the pandemic, while government spending to contain high energy prices amounted to €15.5 billion since last fall.The fiscal response to these crises caused a large addition to the public debt, which already stands at 115% of GDP. Furthermore, at 55% of GDP before COVID, France’s public expenditure ratio was already one of the highest in the Eurozone (Chart 11). For now, the debt burden is manageable because low interest rates make France’s debt arithmetic benign. However, such an elevated share of output controlled by the government increases resource misallocation and hurts productivity, meaning it weighs on potential GDP growth.Low interest rates are not guaranteed in the future. Putting France’s debt on a sustainable path requires structural reforms (Chart 12). Already, the OECD estimates that the 2017-2018 labor-market and tax reforms have generated positive economic spillovers across all income levels (Chart 12, bottom panel). Chart 11Public Debt Just Got Bigger
France: Macron And Macro
France: Macron And Macro
Chart 12Structural Reforms & Pubic Debt
France: Macron And Macro
France: Macron And Macro
Going forward, reducing debt and cutting spending will be hard considering France’s energy and defense structural goals. Macron’s political party, En Marche!, may perform well in this year’s legislative election, but it is unlikely to achieve the sweeping victory that it saw in 2017. Macron will therefore be forced to compromise to build a coalition in favor of structural reform. His strength in the Assembly will be the chief uncertainty and critical determinant of his ability to achieve his key reform goals in the coming five years. As a result, Macron will focus on lifting French trend growth further by encouraging digital and green transitions. Beyond pension reforms, fiscal austerity will be limited to ensure the social acceptability of structural reforms.In the rest of this section, we focus on the two most important reforms proposed by Macron for his second mandate: pensions and economic competitiveness plans. Reducing public spending is needed to alleviate the burden on resources created by the massive size of the French government, but France’s strategic needs outstrip Macron’s ability to slash spending.French Pension System: Too Generous Table 4Public Spending Comparison
France: Macron And Macro
France: Macron And Macro
Pension represents 14% of GDP compared with 10% in Germany (Table 4). Expenditures on pension explains 35% of the difference on total public spending between France and the Euro Area.Reforming the pension system is a sensitive topic in France. It arguably cost Nicolas Sarkozy his re-election bid in 2012. Yet, pension reforms are essential. The current system is complex and fragmented, with 42 different types of coexisting pensions, each with its own calculation rules. Chart 13Pension Reform Is Long Overdue
France: Macron And Macro
France: Macron And Macro
Additionally, it does not reflect the ageing of the population (Chart 13). Employment among the 55-64 age cohort is only 56% in France, compared to 62% in the OECD average. Also, the effective retirement age in France is 60.8, compared with an average of 65 in Europe. Furthermore, replacement rates (pension / last salaries) are high, which puts an unsustainable burden on the state’s finances.According to the French think tank Institut Montaigne, progressively pushing the retirement age to 65 would save €7.7 billion per year by 2027 and €18 billion per year by 2032. Overall, the government would save around €50 billion per year through such pension adjustments and simplification reforms as well as by operating cost reductions. This would largely finance Macron’s investment to improve competitiveness, digitalization, the green transition, and national defense.Transitioning To Reduce InefficienciesTo boost long-term growth, an important prong of Macron’s project is the €100 billion “France Relance” recovery plan. It is part of the NGEU pandemic relief funds and includes €30 billion for green transition (including measures to improve energy performance of buildings, to increase rail freight, and to support businesses to make the transition). It also includes €34 billion for competitiveness and innovation (tax cuts and support for digitalization). Chart 14French Handicap: Productivity
France: Macron And Macro
France: Macron And Macro
This plan is a band-aid if the many inefficiencies undermining France’s productivity are not tackled (Chart 14). The uptake of digital technologies is uneven and lags far behind other developed nations with respect to cloud computing and the internet of things. Small businesses perform particularly poorly (Chart 15). As a result, the French tech sector has become a priority of Macron’s government. The “France 2030” investment plan unveiled in October 2021, worth €30 billion over five years, aims to foster industrial and tech “champions of the future.” It intends to lift business creation in the tech sector. Nonetheless, this is easier said than done; picking low-hanging fruits will help productivity but matching the prowess of the US is highly unlikely.Another problem is the inefficiency of French R&D. Government support for business R&D is elevated but does not translate into high R&D intensity (Chart 16). This problem is not unique to France: R&D returns across the EU do not match those of the US. Addressing France’s bureaucratic and extremely centralized management structure could tackle some of this hindrance (Chart 16, bottom panel). Chart 15France Is Digitally Lagging …
France: Macron And Macro
France: Macron And Macro
Chart 16… And Full Of Inefficiencies
France: Macron And Macro
France: Macron And Macro
When it comes to the green transition, Macron focuses on three axes: renewable energies, energy efficiency, and electric vehicles.Macron wants a “massive deployment” of renewable energies. A new plan for the construction of additional nuclear reactors will be implemented, since it is the only solution that allows France to reduce its carbon emissions quickly. Alongside this plan for electricity generation, a strategy will be put in place to increase energy efficiency. This is where the support to electric vehicle production and adoption comes in (Chart 17).Reforming energy taxes is another avenue to generate greater revenues, such as from higher carbon pricing, and this would help finance more green investments. Eliminating fossil fuel subsidies, for which France spends significantly more than its peers, and streamlining tax collectioncould yield 1% in annual savings by 2027 (Chart 18). Moreover, increasing carbon prices to EUR65 per ton by 2030 would contribute to France’s environmental goals and provide additional revenue. Chart 17French EV-olution
France: Macron And Macro
France: Macron And Macro
Chart 18More Green Taxes
France: Macron And Macro
France: Macron And Macro
Bottom Line: The re-election of President Macron portends another reform push in France. The large public debt load threatens national long-term economic prospects. Hence, increasing potential GDP growth is paramount. True, Macron’s majority in the Assemblée Nationale will decrease, which will limit the scope of the next reform round. Nonetheless, France will implement pension reforms that can both increase the size of the labor force and finance further initiatives. Moreover, France will push forward with efforts to streamline tech investment, increase spending in the nuclear electricity production, and boost energy efficiency.Investment ImplicationsThe investment implications of a second Macron mandate are manifold. First, investors should remain overweight the French tech sector compared to that of the rest of the Eurozone because of the boost to earnings from greater public investment. Chart 19Small-Caps, Big Upside
Small-Caps, Big Upside
Small-Caps, Big Upside
French small-cap stocks will also benefit from reforms. French small-cap equities have become oversold relative to their large-cap counterparts, falling 30% in relative terms since their late 2017 peak (Chart 19). Part of that underperformance anticipated the drag on French households from spiking energy prices. However, French households are more insulated from the impact of high inflation than their US or European counterparts. Moreover, the previous set of reforms boosted lower- and middle-class income (Chart 12 on page 9). Consequently, French consumer confidence will grow compared to that in the US and China, which helps the relative performance of French small-cap shares (Chart 19, panel 2). Rising German yields and an eventual stabilization in the euro will also buoy these stocks (Chart 19, bottom two panels).French industrials equities will be another sector to enjoy a dividend from Macron’s policy initiatives. The “France 2030” plan involves an increase in capex. The build-up in nuclear power under the green transition plan is also positive for industrial earnings. These policies will favor domestic spending, which bolsters French industrial stocks.Last week, we described the tailwinds for European aerospace and defense equities. The same logic holds true for French aerospace and defense names, which are our favorite plays within the French industrial complex. Chart 3 on page 3 highlighted that the aerospace sector is among the major areas of the economy for which gross value added has yet to recoup its pandemic losses. The gradual re-opening of the global economy will create an important tailwind for the sector. Moreover, France is the fourth-largest global defense exporter. Thus, the French defense industry will profit from the upside in global military spending.Related ReportGeopolitical StrategyFrance: Macron (And Structural Reforms) Still Favored In 2022In this context, French aerospace and defense stocks should outperform not only the overall French market, but also their industrial peers (Chart 20). Since we already favor aerospace and defense equities within the Euro Area, the overweight of French aerospace and defense shares does not translate into an overweight compared to their European competitors. The position of French large-cap stocks within a European portfolio is more complex. They are unlikely to exhibit any significant net impact from Macron’s reform push. French equities have outperformed the rest of Europe already. Most of this outperformance reflected sectoral biases; the French market overweights industrial and consumer stocks. However, the country effect explains the recent outperformance of French equities (Chart 21). The country effect can be approximated by comparing French stocks to the rest of the European market on a sector-neutral basis. Chart 20Favor French Aerospace & Defense
Favor French Aerospace & Defense
Favor French Aerospace & Defense
Chart 21Country Effect Explains The Recent Outperformance Of French Equities
Country Effect Explains The Recent Outperformance Of French Equities
Country Effect Explains The Recent Outperformance Of French Equities
The lower vulnerability of the French economy to higher energy prices compared to the rest of Europe explains this outcome (see Chart 4 on page 4). The outperformance of French consumer stocks (which account for nearly a third of the index) relative to their European competitors added to the country effect as well.An end to the energy spike is likely to arrest the outperformance of French equities. Over the past six years, Brent crude oil prices expressed in euros as well as oil and gas inflation have supported the performance of French equities relative to German ones much better than core inflation or bond yields (Chart 22). The forward earnings of French equities compared to those of the Eurozone market closely track energy markets (Chart 23). Essentially, the French market biases and the country’s low reliance on imported energy are valuable hedges when stagflation fears are rampant (Chart 24). Chart 22The End Of The French Reign Draws Near
The End Of The French Reign Draws Near
The End Of The French Reign Draws Near
Chart 23Supply Shock Lifted French Earnings
Supply Shock Lifted French Earnings
Supply Shock Lifted French Earnings
The best vehicle to underweight French large-cap stocks is to underweight French consumer stocks compared to the Euro Area MSCI benchmark. French equities outperformed the rest of Europe by a greater extent than relative earnings would have implied, which resulted in a small P/E expansion (Chart 25). However, when consumer stocks are excluded, French stocks have performed in line with the rest of the Euro Area and have underperformed relative earnings, which has caused a derating of the French market excluding consumer stocks (Chart 25, bottom two panels). Chart 24French Equities Thrive When Stagflation Fears Are High
French Equities Thrive When Stagflation Fears Are High
French Equities Thrive When Stagflation Fears Are High
Chart 25Cheap Or Expensive?
Cheap Or Expensive?
Cheap Or Expensive?
French consumer equities have become very expensive. Their relative performance has completely decoupled from earnings compared to their Eurozone competitors and their relative valuation has expanded to two sigma above its past 20 years average (Chart 26). Measured against the French broad equity market, the same dynamics can be observed (Chart 26, bottom two panels). These divergences are unsustainable and the most likely catalyst for their correction is the rapid decline in global consumer confidence (Chart 27). Chart 26French Consumer Equities Are Expensive
Beware French Consumer Stocks
Beware French Consumer Stocks
Chart 27Crumbling Consumer Confidence Does Not Bode Well For French Consumer Stocks
French Consumer Equities Are Expensive
French Consumer Equities Are Expensive
Bottom Line: The best direct bets on President Macron’s re-election are to overweight French small-cap stocks compared to large-cap ones and to favor aerospace and defense stocks within the French market. Investors should also underweight French stocks in Europe. However, to do so, investors should underweight French consumer stocks and maintain a benchmark weight for the other French sectors compared to their allocation in the Eurozone benchmark. Traders should buy Euro Area consumer staples and consumer discretionary stocks and sell French ones. Jeremie Peloso,Associate EditorJeremieP@bcaresearch.comMathieu Savary,Chief European StrategistMathieu@bcaresearch.comFootnotes
Executive Summary US inflation is running at its highest level in over four decades. Although we expect it will soon peak, it appears certain to remain above the Fed’s 2% target level for an extended period. The war in Ukraine and COVID’s assault on China could give rise to a new round of supply disruptions that keep inflation at very high levels even after the initial wave of bottlenecks is cleared. Long-term price stability may best position an economy to achieve its potential, but real S&P 500 earnings have grown twice as fast when CPI inflation is above its mean than they have when it is below its mean. Historically, inflation has only begun to squeeze nominal earnings growth at two-standard-deviation extremes. Meaningful equity de-rating has been a feature when inflation exceeds its mean, however, and investors will have to be alert for any signs that TINA might be losing its grip on financial markets. We do not think that low-to-no-yield Treasuries or cash yet offer an appealing alternative, but animal spirits are always subject to change. Bumping Up Against Tactical Limits
Bumping Up Against Tactical Limits
Bumping Up Against Tactical Limits
Bottom Line: The question of how to navigate an inflationary environment is likely to be with investors across 2022 and beyond. We continue to recommend overweighting equities over our cyclical 6-12-month timeframe, but risks are heightened and we will change course if conditions dictate. Feature With consumer prices rising at a clip not seen in over 40 years, inflation is a hot-button topic for anyone with even a passing interest in the US economy. The relentless series of upside inflation surprises have investors preoccupied with finding havens. To help get a handle on where to invest against varying inflation backdrops, we divided inflation into five regimes since the consumer price index (CPI) was launched in 1947: extreme inflation (an annualized quarter-over-quarter rate more than two standard deviations above its mean), high inflation (more than one but less than or equal to two standard deviations above the mean), moderate inflation (up to one standard deviation above the mean), moderately low inflation (one standard deviation below the mean up to the mean) and deflation (two standard deviations below the mean up to one standard deviation below the mean). Related Report US Investment StrategyThe Last Line Of Inflation Defense (Is Holding Fast) We reviewed the performance of S&P 500 operating earnings, earnings multiples and returns in each CPI regime to see how equities have responded to inflation over the last 75 years. We then reviewed the available total return data for Treasuries, investment-grade corporate bonds and high-yield corporate bonds and analyzed them alongside equity total returns. The empirical record enhances our confidence in earnings growth, but the S&P 500 currently trades at nearly 20 times forward four-quarter earnings, and it is especially vulnerable to de-rating, given that contracting valuations have been the driver of underperformance when inflation exceeds its mean. We find it hard to contemplate overweighting fixed income over the next year when nominal yields are so far below the rate of inflation. It may require a modest leap of faith to believe that equity multiples can maintain their cruising altitude, but the odds are very long that a 10-year Treasury note yielding 2.4% will protect its owner’s purchasing power when prices might rise by 3.5% to 4.5% over the next year. The positive real returns that Treasuries have delivered in high-inflation environments since 1984 were achieved over a lengthy stretch in which inflation compensation at the date of purchase repeatedly topped actual inflation to maturity. Today it appears as if ex-ante inflation compensation is likely to prove woefully inadequate and we are skeptical that bonds can live up to their historical return patterns. 75 Years Of Inflation Data Chart 1 shows 299 quarters of annualized inflation data in standard deviation increments since the CPI was constructed in 1947. The shape of the distribution bears out the notion that prices are sticky to the downside; the population mean is well above the median as the high-inflation right tail is longer and fatter than the deflationary left tail. Across the CPI’s entire history, inflation has averaged 3.52% on an annualized quarter-over-quarter basis with a standard deviation (“sigma”) of 3.55%. Based on those parameters, we define extremely high inflation as CPI increases above 10.62% (17 instances), high inflation as 7.08% to 10.62% (22 instances), moderately high inflation as 3.53% to 7.07% (82 instances), moderately low inflation as -0.02% to 3.52% (155 instances), disinflation as -3.57% to -0.03% (21 instances) and deflation as less than -3.57% (2 instances). Chart 1The Complete Annualized CPI Distribution
Inflation And Investing
Inflation And Investing
Inflation And Equities We examined movements in operating earnings, trailing multiples and closing prices for the S&P 500 in each of the six inflation regimes, though we discarded the outlier deflation bucket for insufficient data. In the extreme (greater-than-two-sigma) inflation scenario, S&P 500 earnings initially surged amidst the early postwar period’s pent-up demand explosion before going backwards in the Korean War inflation, the sharp 1973-75 recession and the Volcker double dip (Chart 2, dark solid line). An expanding P/E multiple (dashed line) helped to mitigate the blow from shrinking earnings, but equity investors endured sharp real declines (bottom panel, light solid line). Chart 2Extreme Inflation Squashes Earnings
Extreme Inflation Squashes Earnings
Extreme Inflation Squashes Earnings
The one-to-two-sigma high-inflation scenario is a mirror image of the extreme inflation scenario. Nominal earnings growth surged (Chart 3, top panel) and managed to hold up well in real terms (Chart 3, bottom panel), but the index’s multiple de-rated at a vicious 15.5% annualized rate, sticking investors with double-digit real losses. 70% of this regime played out from 1973 to 1982 and it also spanned some of 1990-91 and great recessions. The last two data points occurred in 2021, when flat multiples allowed equities to benefit from robust earnings growth, but previously melting multiples illustrate the peril for equities if monetary tightening induces a hard landing. Chart 3High Inflation: Surging Nominal Earnings, Fierce De-Rating
High Inflation: Surging Nominal Earnings, Fierce De-Rating
High Inflation: Surging Nominal Earnings, Fierce De-Rating
The zero-to-one-sigma moderate-inflation scenario has fostered such robust earnings growth that even a steady de-rating headwind cannot hold back equity returns (Chart 4). Despite spanning the entire 1973-74 recession and the early stages of the global financial crisis, the moderate-inflation regime has been solidly conducive to growth. Chart 4Moderate Inflation Is Great For Growth
Moderate Inflation Is Great For Growth
Moderate Inflation Is Great For Growth
Just over half of the quarters have met our minus-one-to-zero-sigma moderately low inflation standard. They have featured subpar nominal earnings growth, but a benign inflation backdrop has helped them close the gap with mean real growth and a re-rating tailwind has pushed real annualized S&P 500 price returns above 7% (Chart 5). Most of the post-crisis period has unfolded against a moderately low inflation backdrop, which has been good for equity investors even as concerns about tepid growth lingered. Chart 5Moderately Low Inflation Is The Enduring Equity Sweet Spot
Moderately Low Inflation Is The Enduring Equity Sweet Spot
Moderately Low Inflation Is The Enduring Equity Sweet Spot
The minus-two-to-minus-one-sigma deflationary backdrop in which the price level contracts has featured even weaker aggregate growth, but a 10% annualized re-rating boost has allowed equities to deliver double-digit returns (Chart 6). One would expect growth to wither when the price level is deflating but ex-1Q20, when the pandemic halted activity in its tracks, growth in this phase has topped growth in every other phase. That counterintuitive result illustrates that inflation is a lagging indicator that exerts a heavy influence on monetary policy, which impacts the economy with a lag, while markets are forward looking. The ends of the inflation distribution are likely to mark inflection points where momentum reverses. Chart 6Once Prices Deflate, The Danger Has Already Passed
Once Prices Deflate, The Danger Has Already Passed
Once Prices Deflate, The Danger Has Already Passed
Our survey of equity performance across inflation regimes has shown that inflation is much better for earnings growth than disinflation/deflation until it reaches extreme levels. Nominal earnings have grown three times as fast and real earnings have grown twice as fast when inflation is above its 3.52% mean than when it’s below it (Table 1). The fundamental tailwind that comes with perky inflation is almost entirely offset by multiple contraction, however, just as the growth drag from low inflation is offset by multiple expansion. We don’t think investors should be unduly worried that inflation will squash growth this year, but they do need to be alert to anything that might presage de-rating. Table 1Inflation And Earnings, Multiples, And Returns
Inflation And Investing
Inflation And Investing
Inflation And Bonds To fill out the asset allocation picture, we also reviewed the performance of the Bloomberg US Treasury, US Corporate and US High Yield Total Return Indices. Table 2 tracks annual nominal and real total returns for all three indices, along with the S&P 500, since the second half of 1983, when the high-yield index was launched. The distribution of CPI changes from 1983 forward is more concentrated about the mean than the entire population distribution beginning in 1947 and nearly 80% of observations fall within one standard deviation of the mean, so the tail distributions have comparatively few observations. Table 2Inflation, Treasuries And Spread Product
Inflation And Investing
Inflation And Investing
Nonetheless, the extant tail observations suggest that high yield’s positive carry failed to generate positive excess returns over Treasuries in high-inflation environments while spread widening and increased defaults caused them to lag Treasuries amidst extreme deflation. Investment grade also lagged Treasuries in the tails, albeit by a smaller margin than high yield. High yield comfortably outperformed within the core minus-one-to-plus-one-sigma range, when equities also shined. The bottom line is that Treasuries have provided welcome ballast to multi-asset portfolios in both high-inflation and deflationary episodes over the last 40 years. They were even bigger winners from late 1972, when the Treasury and corporate indexes began, through late 1983, sporting annualized real returns that beat those of high-grade corporates and the S&P 500 by five and eight percentage points, respectively, when inflation exceeded its mean. We question the applicability of the empirical record in the current environment, however, as ex-ante inflation compensation routinely outstripped ex-post inflation over the four-plus decades that it was compiled. Even as the 10-year yield has recently flirted with 2.5%, we expect that the inflation compensation embedded in long-duration bonds will prove inadequate to preserve bondholders’ purchasing power over the bonds’ remaining life. Portfolio Construction The findings from our inflation review do not spur us to make any changes to the ETF portfolio. We continue to believe that the near-term foundations of the US economy are strong and will support above-trend growth over our six- to twelve-month investment timeframe. US growth is at risk from the war in Ukraine and the ongoing COVID-19 revival and aggressive Fed tightening could stifle the effects of past fiscal and monetary stimulus measures that have not yet been felt. We are actively monitoring global geopolitical and public health developments, along with the Fed, though we think it will be difficult for Chair Powell and company to surprise hawkishly over the rest of this year. We believe the moves we made four weeks ago, when we temporarily closed out our equity overweight, reduced our cyclicals-over-defensives positioning, dialed back our value and small-cap overweights, initiated direct exposure to the metals and mining space via the XME ETF and trimmed our Treasury underweight, will protect the portfolio adequately against ongoing inflationary surges and sporadic growth headwinds. The direct homebuilder exposure we took on via the ITB ETF at that time has weighed on performance, but we are sticking with it as we believe the widespread pessimism about the industry’s prospects has gotten way overdone. The labor market remains robust, as the March employment report and the February JOLTS release reiterated last week, less pecunious households are flush with excess pandemic savings and the wealthy are reveling in an unprecedented surge in household net worth. The global situation merits tactical caution, and it looks as if the S&P 500 has hit the top of its near-term range (Chart 7, top panel) while the VIX may have reached a near-term bottom (Chart 7, bottom panel), but our sanguine cyclical view remains intact. Chart 7Equities May Have Reached Another Short-Term Turning Point
Equities May Have Reached Another Short-Term Turning Point
Equities May Have Reached Another Short-Term Turning Point
ETF Portfolio Review - March The cyclical ETF portfolio returned 1.26% in March (Appendix Table), outperforming its benchmark by a modest 8 basis points (“bps”). Our bond underweight was auspicious as yields rose across all maturities last month. Overweighting the riskier segments of the fixed-income market – junk bonds and preferred stocks via the VRP ETF – generated 14 bps of relative performance. However, our equity positioning chipped away at those gains. We underweighted Utilities, March’s top performing sector, and overweighted value, which lagged. Our large Energy overweight mitigated those drags, leaving us with positive net alpha. Since inception two months ago, the portfolio’s value-added stands at 18 bps. Doug Peta, CFA Chief US Investment Strategist dougp@bcaresearch.com Jennifer Lacombe Associate Editor JenniferL@bcaresearch.com Cyclical ETF Portfolio
Inflation And Investing
Inflation And Investing
Executive Summary Equities Are Still Attractive Versus Bonds
Equities Are Still Attractive Versus Bonds
Equities Are Still Attractive Versus Bonds
Macroeconomic Outlook: Global growth will reaccelerate in the second half of this year provided a ceasefire in Ukraine is reached. Inflation will temporarily come down as the dislocations caused by the war and the pandemic subside, before moving up again in late 2023. Equities: Maintain a modest overweight in stocks over a 12-month horizon, favoring non-US equities, small caps, and value stocks. Look to turn more defensive in the second half of 2023 in advance of another wave of inflation. Fixed income: The neutral rate of interest in the US is around 3.5%-to-4%, which is substantially higher than the consensus view. Bond yields will move sideways this year but will rise over the long haul. Overweight Germany, France, Japan, and Australia while underweighting the US and the UK in a global bond portfolio. Credit: Corporate debt will outperform high-quality government bonds over the next 12 months. Favor HY over IG and Europe over the US. Spreads will widen again in late 2023. Currencies: As a countercyclical currency, the US dollar will weaken later this year, with EUR/USD rising to 1.18. We are upgrading our view on the yen from bearish to neutral due to improved valuations. The CNY will strengthen as the Chinese authorities take steps to boost domestic demand. Commodities: Oil prices will dip in the second half of 2022 as the geopolitical premium in crude declines and more OPEC supply comes to market. However, oil and other commodity prices will start moving higher by mid-2023. Bottom Line: The cyclical bull market in stocks that began in 2009 is running long in the tooth, but the combination of faster global growth later this year and a temporary lull in inflation should pave the way for one final hurrah for equities. Dear Client, Instead of our regular report this week, we are sending you our Quarterly Strategy Outlook, where we explore the major trends that are set to drive financial markets in the rest of 2022 and beyond. Next week, please join me for a webcast on Monday, April 11 at 9:00 AM EDT (2:00 PM BST, 3:00 PM CEST, 9:00 PM HKT) where I will discuss the outlook. Best regards, Peter Berezin, Chief Global Strategist P.S. You can now follow me on LinkedIn and Twitter. I. Overview We continue to recommend overweighting global equities over a 12-month horizon. However, we see downside risks to stocks both in the near term (next 3 months) and long term (2-to-5 years). In the near term, stocks will weaken anew if Russia’s stated intentions to scale back operations in Ukraine turn out to be a ruse. There is also a risk that China will need to temporarily shutter large parts of its economy to combat the spread of the highly contagious BA.2 Omicron variant. While stocks could suffer a period of indigestion in response to monetary tightening by the Fed and a number of other central banks, we doubt that rates will rise enough over the next 12 months to undermine the global economy. This reflects our view that the neutral rate of interest in the US and most other countries is higher than widely believed. If the neutral rate ends up being between 3.5% and 4% in the US, as we expect, the odds are low that the Fed will induce a recession by raising rates to 2.75%, as the latest dot plot implies (Chart 1). Chart 1The Market Sees The Fed Raising Rates To Around 3% And Then Backing Off
2022 Second Quarter Strategy Outlook – The New Neutral
2022 Second Quarter Strategy Outlook – The New Neutral
The downside of a higher neutral rate is that eventually, investors will need to value stocks using a higher real discount rate. How fast markets mark up their estimate of neutral depends on the trajectory of inflation. We were warning about inflation before it was cool to warn about inflation (see, for example, our January 2021 report, Stagflation in a Few Months?; or our February 2021 report, 1970s-Style Inflation: Yes, It Could Happen Again). Our view has been that inflation will follow a “two steps up, one step down” pattern. We are currently near the top of those two steps: US inflation will temporarily decline in the second half of this year, as goods inflation drops but service inflation is slow to rise. The decline in inflation will provide some breathing room for the Fed, allowing it to raise rates by no more than what markets are already discounting over the next 12 months. Unfortunately, the respite in inflation will not last long. By the end of 2023, inflation will start to pick up again, forcing the Fed to resume hiking rates in 2024. This second round of Fed tightening is not priced by the markets, and so when it happens, it could be quite disruptive for stocks and other risk assets. Investors should overweight equities on a 12-month horizon but look to turn more defensive in the second half of 2023. II. The Global Economy War and Pestilence Are Near-Term Risks BCA’s geopolitical team, led by Matt Gertken, was ringing the alarm bell about Ukraine well before Russia’s invasion. Recent indications from Russia that it will scale back operations in Ukraine could pave the way for a ceasefire; or they could turn out to be a ruse, giving Russia time to restock supply lines and fortify its army in advance of a new summertime campaign against Kyiv. It is too early to tell, but either way, our geopolitical team expects more fighting in the near term. The West is not keen to give Putin an easy off-ramp, and even if it were, it is doubtful he would take it. The only way that Putin can salvage his legacy among his fan base in Russia is to decisively win the war in order to ensure Ukraine’s military neutrality. For his part, Zelensky cannot simply agree to Russia’s pre-war demands that Ukraine demilitarize and swear off joining NATO unless Russian forces first withdraw. To give in to such demands without any concrete security guarantees would raise the question of why Ukraine fought the war to begin with. The Impact of the Ukraine War on the Global Economy The direct effect of the war on the global economy is likely to be small. Together, Russia and Ukraine account for 3.5% of global GDP in PPP terms and 1.9% in dollar terms. Exports to Russia and Ukraine amount to only 0.2% of G7 GDP (Chart 2). Most corporations have little direct exposure to Russia, although there are a few notable exceptions (Chart 3). Chart 2Little Direct Trade Exposure To Russia And Ukraine
2022 Second Quarter Strategy Outlook – The New Neutral
2022 Second Quarter Strategy Outlook – The New Neutral
In contrast to the direct effects, the indirect effects have the potential to be sizable. Russia is the world’s second largest oil producer, accounting for 12% of annual global output (Chart 4). It is the world’s top exporter of natural gas. About half of European natural gas imports come from Russia. Russia is also a significant producer of nickel, copper, aluminum, steel, and palladium. Chart 3Only A Handful Of Firms Have Significant Sales Exposure To Russia
2022 Second Quarter Strategy Outlook – The New Neutral
2022 Second Quarter Strategy Outlook – The New Neutral
Chart 4Russia is The World's Second Largest Oil Producer
Russia is The World's Second Largest Oil Producer
Russia is The World's Second Largest Oil Producer
Russia and Ukraine are major agricultural producers. Together, they account for a quarter of global wheat exports, with much of it going to the Middle East and North Africa (Chart 5). They are also significant producers of potatoes, corn, sugar beets, and seed oils. In addition, Russia produces two-thirds of all ammonium nitrate, the main source of nitrogen-based fertilizers. Largely as a result of higher commodity prices and other supply disruptions, the OECD estimates that the war could shave about 1% off of global growth this year, with Europe taking the brunt of the hit (Chart 6). At present, the futures curves for most commodities are highly backwardated (Chart 7). While one cannot look to the futures as unbiased predictors of where spot prices are heading, it is fair to say that commodity markets are discounting some easing in prices over the next two years. If that does not occur, global growth could weaken more than the OECD expects. Chart 5Developing Economies Buy The Bulk Of Russian And Ukrainian Wheat
2022 Second Quarter Strategy Outlook – The New Neutral
2022 Second Quarter Strategy Outlook – The New Neutral
Chart 6The War In Ukraine Could Shave One Percentage Point Off Of Global Growth
2022 Second Quarter Strategy Outlook – The New Neutral
2022 Second Quarter Strategy Outlook – The New Neutral
Chart 7Futures Curves For Most Commodities Are Backwardated
2022 Second Quarter Strategy Outlook – The New Neutral
2022 Second Quarter Strategy Outlook – The New Neutral
Another Covid Wave Two years after “two weeks to flatten the curve,” the world continues to underappreciate the power of exponential growth. Suppose that it takes five days for someone with Covid to infect someone else. If everyone with Covid infects an average of six people, the cumulative number of Covid cases would rise from 1,000 to 10 million in around four weeks. Suppose you could cut the number of new infections in half to three per person. In that case, it would take about six weeks for 10 million people to be infected. In other words, mitigation measures that cut the infection rate by half would only extend how long it takes for 10 million people to be infected by two weeks. That’s not a lot. The point is that any infection rate above one will generate an explosive rise in cases. In the pre-Omicron days, keeping the infection rate below one was difficult, but not impossible for countries with the means and motivation to do so. As the virus has become more contagious, however, keeping it at bay has grown more difficult. The latest strain of Omicron, BA.2, appears to be 40% more contagious than the original Omicron strain, which itself was about 4-times more contagious than Delta. BA.2 is quickly spreading around the world. The number of cases has spiked across much of Europe, parts of Asia, and has begun to rise in North America (Chart 8). In China, the authorities have locked down Shanghai, home to 25 million people. Chart 8Covid Cases Are On The Rise Again
2022 Second Quarter Strategy Outlook – The New Neutral
2022 Second Quarter Strategy Outlook – The New Neutral
The success that China has had in suppressing the virus has left its population with little natural immunity; and given the questionable efficacy of its vaccines, with little artificial immunity as well. Moreover, as is the case in Hong Kong, a large share of mainland China’s elderly population remains completely unvaccinated. Chart 9New Covid Drugs Are Set To Hit The Market
2022 Second Quarter Strategy Outlook – The New Neutral
2022 Second Quarter Strategy Outlook – The New Neutral
This presents the Chinese authorities with a difficult dilemma: Impose severe lockdowns over much of the population, or let the virus run rampant. As the logic of exponential change described above suggests, there is not much of a middle ground. Our guess is that the Chinese government will choose the former option. China has already signed a deal to commercialize Pfizer’s Paxlovid. The drug is highly effective at preventing hospitalization if taken within five days from the onset of symptoms. Fortunately, Paxlovid production is starting to ramp up (Chart 9). China will probably wait until it has sufficient supply of the drug before relaxing its zero-Covid policy. While beneficial to growth later this year, this strategy could have a negative near-term impact on activity, as the authorities continue to play whack-a-mole with Covid. Chart 10Inflation Is Running High, Especially In The US
Inflation Is Running High, Especially In The US
Inflation Is Running High, Especially In The US
Central Banks in a Bind Standard economic theory says that central banks should adjust interest rates in response to permanent shocks, while ignoring transitory ones. This is especially true if the shock in question emanates from the supply side of the economy. After all, higher rates cool aggregate demand; they do not raise aggregate supply. The lone exception to this rule is when a supply shock threatens to dislodge long-term inflation expectations. If long-term inflation expectations become unanchored, what began as a transitory shock could morph into a semi-permanent one. The problem for central banks is that the dislocations caused by the Ukraine war are coming at a time when inflation is already running high. Headline CPI inflation reached 7.9% in the US in February, while core CPI inflation clocked in at 6.4%. Trimmed-mean inflation has increased in most economies (Chart 10). Fortunately, while short-term inflation expectations have moved up, long-term expectations have been more stable. Expected US inflation 5-to-10 years out in the University of Michigan survey stood at 3.0% in March, down a notch from 3.1% in January, and broadly in line with the average reading between 2010 and 2015 (Chart 11). Survey-based measures of long-term inflation expectations are even more subdued in the euro area and Japan (Chart 12). Market-based inflation expectations have risen, although this partly reflects higher oil prices. Even then, the widely-watched 5-year, 5-year forward TIPS inflation breakeven rate remains near the bottom of the Fed’s comfort range of 2.3%-to-2.5% (Chart 13).1 Chart 11Long-Term Inflation Expectations Remain Contained In The US...
Long-Term Inflation Expectations Remain Contained In The US...
Long-Term Inflation Expectations Remain Contained In The US...
Chart 12... And In The Euro Area And Japan
... And In The Euro Area And Japan
... And In The Euro Area And Japan
Chart 13The Market's Long-Term Inflation Expectations Are Near The Bottom Of The Fed's Comfort Zone
The Market's Long-Term Inflation Expectations Are Near The Bottom Of The Fed's Comfort Zone
The Market's Long-Term Inflation Expectations Are Near The Bottom Of The Fed's Comfort Zone
Goods versus Services Inflation Most of the increase in consumer prices has been concentrated in goods rather than services (Chart 14). This is rather unusual in that goods prices usually fall over time; but in the context of the pandemic, it is entirely understandable. Chart 14Goods Prices Have Been A Major Driver Of Overall Inflation
2022 Second Quarter Strategy Outlook – The New Neutral
2022 Second Quarter Strategy Outlook – The New Neutral
The pandemic caused spending to shift from services to goods (Chart 15). This occurred at the same time as the supply of goods was being adversely affected by various pandemic-disruptions, most notably the semiconductor shortage that is still curtailing automobile production. Chart 15AGoods Inflation Should Fade As Consumption Shifts Back Towards Services (I)
Goods Inflation Should Fade Goods Inflation Should Fade As Consumption Shifts Back Towards Services (I)
Goods Inflation Should Fade Goods Inflation Should Fade As Consumption Shifts Back Towards Services (I)
Chart 15BGoods Inflation Should Fade As Consumption Shifts Back Towards Services (II)
Goods Inflation Should Fade Goods Inflation Should Fade As Consumption Shifts Back Towards Services (II)
Goods Inflation Should Fade Goods Inflation Should Fade As Consumption Shifts Back Towards Services (II)
Looking out, the composition of consumer spending will shift back towards services. Supply chain bottlenecks should also abate, especially if the situation in Ukraine stabilizes. It is worth noting that the number of ships on anchor off the coast of Los Angeles and Long Beach has already fallen by half (Chart 16). The supplier delivery components of both the manufacturing and nonmanufacturing ISM indices have also come off their highs (Chart 17). Even used car prices appear to have finally peaked (Chart 18). Chart 16Shipping Delays Are Abating
Shipping Delays Are Abating
Shipping Delays Are Abating
Chart 17Delivery Times Are Slowly Coming Down
Delivery Times Are Slowly Coming Down
Delivery Times Are Slowly Coming Down
Chart 18Used Car Prices May Have Finally Peaked
Used Car Prices May Have Finally Peaked
Used Car Prices May Have Finally Peaked
On the Lookout for a Wage-Price Spiral Could rising services inflation offset any decline in goods inflation this year? It is possible, but for that to happen, wage growth would have to accelerate further. For now, much of the acceleration in US wage growth has occurred at the bottom end of the income distribution (Chart 19). It is easy to see why. Chart 20 shows that low-paid workers have not returned to the labor market to the same degree as higher-paid workers. However, now that extended unemployment benefits have lapsed and savings deposits are being drawn down, the incentive to resume work will strengthen. Chart 19Wage Growth Has Picked Up, But Mostly At The Bottom End Of The Income Distribution
Wage Growth Has Picked Up, But Mostly At The Bottom End Of The Income Distribution
Wage Growth Has Picked Up, But Mostly At The Bottom End Of The Income Distribution
Chart 20More Low-Wage Employees Should Return To Work
More Low-Wage Employees Should Return To Work
More Low-Wage Employees Should Return To Work
Chart 21More Workers Will Return To Their Jobs Once The Pandemic Ends
More Workers Will Return To Their Jobs Once The Pandemic Ends
More Workers Will Return To Their Jobs Once The Pandemic Ends
The end of the pandemic should allow more workers to remain at their jobs. In January, during the height of the Omicron wave, 8.75 million US workers (5% of the total workforce) were absent from work due to the virus (Chart 21). How High Will Interest Rates Eventually Rise? If goods inflation comes down swiftly later this year, and services inflation is slow to rise, then overall inflation will decline. This should allow the Fed to pause tightening in early 2023. Whether the Fed will remain on hold beyond then depends on where the neutral rate of interest resides. Chart 22The Yield Curve Inverted in Mid-2019 But Growth Accelerated
The Yield Curve Inverted in Mid-2019 But Growth Accelerated
The Yield Curve Inverted in Mid-2019 But Growth Accelerated
The neutral rate, or equilibrium rate as it is sometimes called, is the interest rate consistent with full employment and stable inflation. If the Fed pauses hiking before interest rates have reached neutral, the economy will eventually overheat, forcing the Fed to resume hiking. In contrast, if the Fed inadvertently raises rates above neutral, unemployment will start rising, requiring the Fed to cut rates. Markets are clearly worried about the latter scenario. The 2/10 yield curve inverted earlier this week. With the term premium much lower than in the past, an inversion in the yield curve is not the powerful harbinger of recession that it once was. After all, the 2/10 curve inverted in August 2019 and the economy actually strengthened over the subsequent six months before the pandemic came along (Chart 22). Nevertheless, an inverted yield curve is consistent with markets expectations that the Fed will raise rates above neutral. That is always a dangerous undertaking. Raising rates above neutral would likely push up the unemployment rate. There has never been a case in the post-war era where the 3-month moving average of the unemployment rate has risen by more than 30 basis points without a recession occurring (Chart 23). Chart 23When Unemployment Starts Rising, It Usually Keeps Rising
When Unemployment Starts Rising, It Usually Keeps Rising
When Unemployment Starts Rising, It Usually Keeps Rising
As discussed in the Feature Section below, the neutral rate of interest is probably between 3.5% and 4% in the US. This is good news in the short term because it lowers the odds that the Fed will raise rates above neutral during the next 12 months. It is bad news in the long run because it means that the Fed will find itself even more behind the curve than it is now, making a recession almost inevitable. The Feature Section builds on our report from two weeks ago. Readers familiar with that report should feel free to skip ahead to the next section. III. Feature: A Higher Neutral Rate Conceptually, the neutral rate is the interest rate that equates the amount of investment a country wants to undertake at full employment with the amount of savings that it has at its disposal.2 Anything that reduces savings or increases investment would raise the neutral rate (Chart 24). Chart 24The Savings-Investment Balance Determines The Neutral Rate Of Interest
2022 Second Quarter Strategy Outlook – The New Neutral
2022 Second Quarter Strategy Outlook – The New Neutral
A number of factors are likely to lower desired savings in the US over the next few years: Households will spend down their accumulated pandemic savings. US households are sitting on $2.3 trillion (10% of GDP) in excess savings, the result of both decreased spending on services during the pandemic and the receipt of generous government transfer payments (Chart 25). Household wealth has soared since the start of the pandemic (Chart 26). Conservatively assuming that households spend three cents of every additional dollar in wealth, the resulting wealth effect could boost consumption by 4% of GDP. Chart 25Plenty Of Pent-Up Demand
Plenty Of Pent-Up Demand
Plenty Of Pent-Up Demand
Chart 26Net Worth Has Soared Since The Pandemic
Net Worth Has Soared Since The Pandemic
Net Worth Has Soared Since The Pandemic
The household deleveraging cycle has ended (Chart 27). Household balance sheets are in good shape. After falling during the initial stages of the pandemic, consumer credit has begun to rebound. For the first time since the housing boom, mortgage equity withdrawals are rising. Banks are easing lending standards on consumer loans across the board. Chart 27US Household Deleveraging Pressures Have Abated
US Household Deleveraging Pressures Have Abated
US Household Deleveraging Pressures Have Abated
Chart 28Baby Boomers Have Amassed A Lot Of Wealth
2022 Second Quarter Strategy Outlook – The New Neutral
2022 Second Quarter Strategy Outlook – The New Neutral
Baby boomers are retiring. They hold over half of US household wealth, considerably more than younger generations (Chart 28). As baby boomers transition from being savers to dissavers, national savings will decline. Government budget deficits will stay elevated. Fiscal deficits subtract from national savings. While the US budget deficit will come down over the next few years, the IMF estimates that the structural budget deficit will still average 4.9% of GDP between 2022 and 2026 compared to 2.0% of GDP between 2014 and 2019 (Chart 29).Chart 29Fiscal Policy: Tighter But Not Tight
2022 Second Quarter Strategy Outlook – The New Neutral
2022 Second Quarter Strategy Outlook – The New Neutral
On the investment front: The deceleration in trend GDP growth, which depressed investment spending, has largely run its course.3 According to the Congressional Budget Office, real potential GDP growth fell from over 3% in the early 1980s to about 1.9% today. The CBO expects potential growth to edge down only slightly to 1.7% over the next few decades (Chart 30). After moving broadly sideways for two decades, core capital goods orders – a leading indicator for capital spending – have broken out to the upside (Chart 31). Capex intention surveys remain upbeat (Chart 32). The average age of the nonresidential capital stock currently stands at 16.3 years, the highest since 1965 (Chart 33). Chart 30Much Of The Deceleration In Potential Growth Has Already Happened
Much Of The Deceleration In Potential Growth Has Already Happened
Much Of The Deceleration In Potential Growth Has Already Happened
Chart 31Positive Signs For Capex (I)
Positive Signs For Capex (I)
Positive Signs For Capex (I)
Chart 32Positive Signs For Capex (II)
Positive Signs For Capex (II)
Positive Signs For Capex (II)
Chart 33An Aging Capital Stock
An Aging Capital Stock
An Aging Capital Stock
Similar to nonresidential investment, the US has been underinvesting in residential real estate (Chart 34). The average age of the housing stock has risen to a 71-year high of 31 years. The homeowner vacancy rate has plunged to the lowest level on record. The number of newly finished homes for sale is half of what it was prior to the pandemic. Chart 34US Housing Is In Short Supply
US Housing Is In Short Supply
US Housing Is In Short Supply
The New ESG: Energy Security and Guns The war in Ukraine will put further upward pressure on the neutral rate, especially outside of the United States. After staging a plodding recovery following the euro debt crisis, European capital spending received a sizable boost from the launch of the NextGenerationEU Recovery Fund (Chart 35). As Mathieu Savary points out in his latest must-read report on Europe, capital spending will rise further in the years ahead as European governments accelerate efforts to make their economies less reliant on Russian energy. Germany has already announced plans to construct three new LNG terminals. The push to build out Europe’s energy infrastructure is coming at a time when businesses are looking to ramp up capital spending. As in the US, Europe’s capital stock has aged rapidly over the past decade (Chart 36). Chart 35European Capex Should Recover
European Capex Should Recover
European Capex Should Recover
Chart 36European Machines Need More Than Just An Oil Change
European Machines Need More Than Just An Oil Change
European Machines Need More Than Just An Oil Change
Chart 37The War In Ukraine Calls For More Spending Across Europe
The War In Ukraine Calls For More Spending Across Europe
The War In Ukraine Calls For More Spending Across Europe
Meanwhile, European governments are trying to ease the burden from rising energy costs. For example, France has introduced a rebate on fuel. It is part of a EUR 20 billion package aimed at cutting heating and electricity bills. European military spending will rise. Military spending currently amounts to 1.5% of GDP, well below NATO’s threshold of 2% (Chart 37). Germany has announced that it will spend EUR 100 billion more on defense. European governments will also need to boost spending to accommodate Ukrainian refugees. The UN estimates that four million refugees have left Ukraine, with the vast majority settling in the EU. A Smaller Chinese Current Account Surplus? The difference between what a country saves and invests equals its current account balance. Historically, China has been a major exporter of savings, which has helped depress interest rates abroad. While China’s current account surplus has declined as a share of its own GDP, it has remained very large as a share of global ex-China GDP, reflecting China’s growing weight in the global economy (Chart 38). Many analysts assume that China will double down on efforts to boost exports in order to offset the drag from falling property investment. However, there is a major geopolitical snag with that thesis: A country that runs a current account surplus must, by definition, accumulate assets from the rest of the world. As the freezing of Russia’s foreign exchange reserves demonstrates, that is a risky proposition for a country such as China. Rather than increasing its current account surplus, China may seek to bolster its economy by raising domestic demand. This could be achieved by either boosting domestic infrastructure spending or raising household consumption. Notably, China’s credit impulse appears to have bottomed and is set to increase in the second half of the year. This is good news not just for Chinese growth but growth abroad (Chart 39). Chart 38Will China Be A Source Of Excess Savings?
Will China Be A Source Of Excess Savings?
Will China Be A Source Of Excess Savings?
Chart 39China's Credit Impulse Appears To Have Bottomed
China's Credit Impulse Appears To Have Bottomed
China's Credit Impulse Appears To Have Bottomed
The IMF’s latest projections foresee China’s current account surplus falling by more than half between 2021 and 2026 as a share of global ex-China GDP. If this were to happen, the neutral rate in China and elsewhere would rise. IV. Financial Markets A. Portfolio Strategy Chart 40The Markets Wobbled And Then Recovered After The Beginning Of The Last Four Fed Rate Cycles
The Markets Wobbled And Then Recovered After The Beginning Of The Last Four Fed Rate Cycles
The Markets Wobbled And Then Recovered After The Beginning Of The Last Four Fed Rate Cycles
As noted in the overview, if the neutral rate turns out to be higher than currently perceived, the Fed is unlikely to induce a recession by raising rates over the next 12 months. That is good news for equities. A look back at the past four Fed tightening cycles shows that stocks often wobble when the Fed starts hiking rates, but then usually rise as long as rates do not move into restrictive territory (Chart 40). Unfortunately, a higher neutral rate also means that investors will eventually need to value stocks using a higher discount rate. It also means that any decline in inflation this year will not last. The US economy will probably start to overheat again in the second half of 2023. This will set the stage for a second, and more painful, tightening cycle in 2024. Admittedly, there is a lot of uncertainty over our “two steps up, one step down” forecast for inflation. It is certainly possible that the “one step down” phase does not last long and that the resurgence in inflation we are expecting in the second half of next year occurs earlier. It is also possible that investors will react negatively to rising rates, even if the economy is ultimately able to withstand them. As such, only a modest overweight to equities is justified over the next 12 months, with risks tilted to the downside in the near term. More conservative asset allocators should consider moving to a neutral stance on equities already, as my colleague Garry Evans advised clients to do in his latest Global Asset Allocation Quarterly Portfolio Outlook. B. Fixed Income Stay Underweight Duration Over a 2-to-5 Year Horizon Our recommendation to maintain below-benchmark duration in fixed-income portfolios panned out since the publication of our Annual Outlook in December, with the US 10-year Treasury yield rising from 1.43% to 2.38%. We continue to expect bond yields in the US to rise over the long haul. Conceptually, the yield on a government bond equals the expected path of policy rates over the duration of the bond plus a term premium. The term premium is the difference between the return investors can expect from buying a long-term bond that pays a fixed interest rate, and the return from rolling over a short-term bill. The term premium has been negative in recent years. Investors have been willing to sacrifice return to own long-term bonds because bond prices usually rise when the odds of a recession go up. The fact that monthly stock returns and changes in bond yields have been positively correlated since 2001 underscores the benefits that investors have received from owning long-term bonds as a hedge against unfavorable economic news (Chart 41). However, now that inflation has emerged as an increasingly important macroeconomic risk, the correlation between stock returns and changes in bond yields could turn negative again. Unlike weak economic growth, which is bad for only stocks, high inflation is bad for both bonds and stocks. Chart 41Correlation Between Stock Returns And Bond Yields Could Turn Negative
Correlation Between Stock Returns And Bond Yields Could Turn Negative
Correlation Between Stock Returns And Bond Yields Could Turn Negative
If bond yields start to rise whenever stock prices fall, the incentive to own long-term bonds will decline. This will cause the term premium to increase. Assuming the term premium rises to about 0.5%, and a neutral rate of 3.5%-to-4%, the long-term fair value for the 10-year US Treasury yield is 4%-to-4.5%. This is well above the 5-year/5-year forward yield of 2.20%. Move from Underweight to Neutral Duration Over a 12-Month Horizon Below benchmark duration positions usually do well when the Fed hikes rates by more than expected over the subsequent 12 months (Chart 42). Chart 42The Golden Rule Of Bond Investing
The Golden Rule Of Bond Investing
The Golden Rule Of Bond Investing
Given our view that US inflation will temporarily decline later this year, the Fed will probably not need to raise rates over the next 12 months by more than the 249 basis points that markets are already discounting. Thus, while a below-benchmark duration position is advisable over a 2-to-5-year time frame, it could struggle over a horizon of less than 12 months. Our end-2022 target range for the US 10-year Treasury yield is 2.25%-to-2.5%. Chart 43Bond Sentiment And Positioning Are Bearish
Bond Sentiment And Positioning Are Bearish
Bond Sentiment And Positioning Are Bearish
Supporting our decision to move to a neutral benchmark duration stance over a 12-month horizon is that investor positioning and sentiment are both bond bearish (Chart 43). From a contrarian point of view, this is supportive of bonds. Global Bond Allocation BCA’s global fixed-income strategists recommend overweighting German, French, Australian, and Japanese government bonds, while underweighting those of the US and the UK. They are neutral on Italy and Spain given that the ECB is set to slow the pace of bond buying. The neutral rate of interest has risen in the euro area, partly on the back of more expansionary fiscal policy across the region. In absolute terms, however, the neutral rate in the euro area is still quite low, and possibly negative. Unlike in the US, where inflation has risen to uncomfortably high levels, much of Europe would benefit from higher inflation expectations, as this would depress real rates across the region, giving growth a boost. This implies that the ECB is unlikely to raise rates much over the next two years. As with the euro area, Japan would benefit from lower real rates. The Bank of Japan’s yield curve control policy has been put to the test in recent weeks. To its credit, the BoJ has stuck to its guns, buying bonds in unlimited quantities to prevent yields from rising. We expect the BoJ to stay the course. Unlike in the euro area and Japan, inflation expectations are quite elevated in the UK and wage growth is rising quickly there. This justifies an underweight stance on UK gilts. Although job vacancies in Australia have climbed to record levels, wage growth is still not strong enough from the RBA’s point of view to justify rapid rate hikes. As a result, BCA’s global fixed-income strategists remain overweight Australian bonds. Finally, our fixed-income strategists are underweight Canadian bonds but are contemplating upgrading them given that markets have already priced in 238 basis points in tightening over the next 12 months. Unlike in the US, high levels of consumer debt will also limit the Bank of Canada’s ability to raise rates. Modest Upside in High-Yield Corporate Bonds Credit spreads have narrowed in recent days but remain above where they were prior to Russia’s invasion of Ukraine. Since the start of the year, US investment-grade bonds have underperformed duration-matched Treasurys by 154 basis points, while high-yield bonds have underperformed by 96 basis points (Chart 44). The outperformance of high-yield relative to investment-grade debt can be explained by the fact that the former has more exposure to the energy sector, which has benefited from rising oil prices. Looking out, falling inflation and a rebound in global growth later this year should provide a modestly supportive backdrop for corporate credit. High-yield spreads are still pricing in a default rate of 3.8% over the next 12 months (Chart 45). This is well above the trailing 12-month default rate of 1.3%. Our fixed-income strategists continue to prefer US high-yield over US investment-grade. Chart 44Spreads Have Narrowed Over The Past Two Weeks But Remain Above Pre-War Levels
Spreads Have Narrowed Over The Past Two Weeks But Remain Above Pre-War Levels
Spreads Have Narrowed Over The Past Two Weeks But Remain Above Pre-War Levels
Chart 45Spread-Implied Default Rate Is Too High
2022 Second Quarter Strategy Outlook – The New Neutral
2022 Second Quarter Strategy Outlook – The New Neutral
European credit is attractively priced and should benefit from any stabilization in the situation in Ukraine. Our fixed-income strategists prefer both European high-yield and investment-grade bonds over their US counterparts. As with equities, the bull market in corporate credit will end in late 2023 as the Fed is forced to resume raising rates in 2024 in the face of an overheated economy. C. Currencies Chart 46Widening Interest Rate Differentials Have Supported The Dollar
Widening Interest Rate Differentials Have Supported The Dollar
Widening Interest Rate Differentials Have Supported The Dollar
The US Dollar Will Weaken Starting in the Second Half of 2022 Since bottoming last May, the US dollar has been trending higher. While the dollar could strengthen further in the near term if the war in Ukraine escalates, the fundamental backdrop supporting the greenback is starting to fray. If US inflation comes down later this year, the Fed is unlikely to raise rates by more than what markets are already discounting over the next 12 months. Thus, widening rate differentials will no longer support the dollar (Chart 46). The dollar is a countercyclical currency: It usually weakens when global growth is strengthening and strengthens when global growth is weakening (Chart 47). The dollar tends to be particularly vulnerable when growth expectations are rising more outside the US than in the US (Chart 48). Chart 47The Dollar Is A Countercyclical Currency
The Dollar Is A Countercyclical Currency
The Dollar Is A Countercyclical Currency
Chart 48Better Growth Prospects Abroad Will Weigh On The US Dollar
Better Growth Prospects Abroad Will Weigh On The US Dollar
Better Growth Prospects Abroad Will Weigh On The US Dollar
Global growth should rebound in the second half of the year once the pandemic finally ends and the situation in Ukraine stabilizes. Growth is especially likely to recover in Europe. This will support the euro, a dovish ECB notwithstanding. Chester Ntonifor, BCA’s Foreign Exchange Strategist, expects EUR/USD to end the year at 1.18. The Dollar is Overvalued The dollar’s ascent has left it overvalued by more than 20% on a Purchasing Power Parity (PPP) basis (Chart 49). The PPP exchange rate equalizes the price of a representative basket of goods and services between the US and other economies. PPP deviations from fair value have done a reasonably good job of predicting dollar movements over the long run (Chart 50). Chart 49USD Remains Overvalued
2022 Second Quarter Strategy Outlook – The New Neutral
2022 Second Quarter Strategy Outlook – The New Neutral
Chart 50Valuations Matter For FX Long-Term Returns
Valuations Matter For FX Long-Term Returns
Valuations Matter For FX Long-Term Returns
Reflecting the dollar’s overvaluation, the US trade deficit has widened sharply (Chart 51). Excluding energy exports, the US trade deficit as a share of GDP is now the largest on record. Equity inflows have helped finance America’s burgeoning current account deficit (Chart 52). However, these inflows have ebbed significantly as foreign investors have lost their infatuation with US tech stocks. Chart 51The US Trade Deficit Has Widened
The US Trade Deficit Has Widened
The US Trade Deficit Has Widened
Chart 52Net Inflows Into US Equities Have Dried Up
Net Inflows Into US Equities Have Dried Up
Net Inflows Into US Equities Have Dried Up
Dollar positioning remains stretched on the long side (Chart 53). That is not necessarily an obstacle in the short run, given that the dollar tends to be a momentum currency, but it does suggest that the greenback could weaken over a 12-month horizon as more dollar bulls jump ship. The Yen: Cheaper but Few Catalysts for a Bounce The trade-weighted yen has depreciated by 6.4% since the start of the year. The yen is 31% undervalued relative to the dollar on a PPP basis (Chart 54). In a nod to these improved valuations, we are upgrading our 12-month and long-term view on the yen from bearish to neutral. Chart 53Still A Lot of Dollar Bulls
Still A Lot of Dollar Bulls
Still A Lot of Dollar Bulls
Chart 54The Yen Has Gotten Cheaper
The Yen Has Gotten Cheaper
The Yen Has Gotten Cheaper
While the yen is unlikely to weaken much from current levels, it is unlikely to strengthen. As noted above, the Bank of Japan has no incentive to abandon its yield curve control strategy. Yes, the recent rapid decline in the yen is a shock to the economy, but it is a “good” shock in the sense that it could finally jolt inflation expectations towards the BoJ’s target of 2%. If inflation expectations rise, real rates would fall, which would be bearish for the currency. Favor the RMB and other EM Currencies The Chinese RMB has been resilient so far this year, rising slightly against the dollar, even as the greenback has rallied against most other currencies. Real rates are much higher in China than in the US, and this has supported the RMB (Chart 55). Chart 55Higher Real Rates In China Have Supported The RMB
Higher Real Rates In China Have Supported The RMB
Higher Real Rates In China Have Supported The RMB
Chart 56The RMB Is Undervalued Based On PPP
The RMB Is Undervalued Based On PPP
The RMB Is Undervalued Based On PPP
Despite the RMB’s strength, it is still undervalued by 10.5% relative to its PPP exchange rate (Chart 56). While productivity growth has slowed in China, it remains higher than in most other countries. The real exchange rates of countries that benefit from fast productivity growth typically appreciates over time. China holds about half of its foreign exchange reserves in US dollars, a number that has not changed much since 2012 (Chart 57). We expect China to diversify away from dollars over the coming years. Moreover, as discussed earlier in the report, the incentive for China to run large current account surpluses may fade, which will result in slower reserve accumulation. Both factors could curb the demand for dollars in international markets. Chart 57Half Of Chinese FX Reserves Are Held In USD Assets
2022 Second Quarter Strategy Outlook – The New Neutral
2022 Second Quarter Strategy Outlook – The New Neutral
A resilient RMB will provide a tailwind for other EM currencies. Many EM central banks began to raise rates well before their developed market counterparts. In Brazil, for example, the policy rate has risen to 11.75% from 2% last April. With inflation in EMs likely to come down later this year as pandemic and war-related dislocations subside, real policy rates will rise, giving EM currencies a boost. D. Commodities Longer-Term Bullish Thesis on Commodities Remains Intact BCA’s commodity team, led by Bob Ryan, expects crude prices to fall in the second half of the year, before moving higher again in 2023. Their forecast is for Brent to dip to $88/bbl by end-2022, which is below the current futures price of $97/bbl. Chart 58Dearth Of Oil Capex Will Put A Floor Under Oil Prices
2022 Second Quarter Strategy Outlook – The New Neutral
2022 Second Quarter Strategy Outlook – The New Neutral
The risk to their end-2022 forecast is tilted to the upside. The relationship between the Saudis and the US has become increasingly strained. This could hamper efforts to bring more oil to market. Hopes that Iranian crude will reach global markets could also be dashed if, as BCA’s geopolitical strategists expect, the US-Iran nuclear deal falls through. A cut-off of Russian oil could also cause prices to rise. While Urals crude is being sold at a heavy discount of $30/bbl to Brent (compared to a discount of around $2/bbl prior to the invasion), it is still leaving the country. In fact, Russian oil production actually rose in March over February. An escalation of the war would make it more difficult for Russia to divert enough oil to China, India, and other countries in order to evade Western sanctions. Looking beyond this year, Bob and his team see upside to oil prices. They expect Brent to finish 2023 at $96/bbl, above the futures price of $89/bbl. Years of underinvestment in crude oil production have led to tight supply conditions (Chart 58). Proven global oil reserves increased by only 6% between 2010 and 2020, having risen by 26% over the preceding decade. Stay Positive on Metals As with oil, there has been little investment in mining capacity in recent years. While a weaker property market in China will weigh on metals prices, this will be partly offset by increased infrastructure spending. The shift towards green energy will also boost metals prices. The typical electric vehicle requires about four times as much copper as a typical gasoline-powered vehicle. Huge amounts of copper will also be necessary to expand electrical grids. Favor Gold Over Cryptos After breaking above $2,000/oz, the price of gold has retreated to $1,926/oz. In the near term, gold prices will be swayed by geopolitical developments. Longer term, real rates will dictate the direction of gold prices. Chart 59 shows that there is a very strong correlation between the price of gold and TIPS yields. If we are correct that the neutral rate of interest is 3.5%-to-4% in the US, real bond yields will eventually need to rise from current levels. Gold prices are quite expensive by historic standards, which represents a long-term risk (Chart 60). Chart 59Strong Correlation Between Real Rates And Gold
Strong Correlation Between Real Rates And Gold
Strong Correlation Between Real Rates And Gold
Chart 60Gold Is Quite Pricey From A Historical Perspective
Gold Is Quite Pricey From A Historical Perspective
Gold Is Quite Pricey From A Historical Perspective
That said, we expect the bulk of the increase in real bond yields to occur only after mid-2023. As mentioned earlier, the Fed will probably not have to deliver more tightening that what markets are already discounting over the next 12 months. Thus, gold prices are unlikely to fall much in the near term. In any case, we continue to regard gold as a safer play than cryptocurrencies. As we discussed in Who Pays for Cryptos?, the long-term outlook for cryptocurrencies remains daunting. Many of the most hyped blockchain applications, from DeFi to NFTs, will turn out to be duds. Concerns that cryptocurrencies are harming the environment, contributing to crime, and enriching a small group of early investors at the expense of everyone else will lead to increased regulatory scrutiny. Our long-term target for Bitcoin is $5,000. E. Equities Equities Are Still Attractively Priced Relative to Bonds Corporate earnings are highly correlated with the state of the business cycle (Chart 61). A recovery in global growth later this year will bolster revenue, while easing supply-chain pressures should help contain costs in the face of rising wages. It is worth noting that despite all the shocks to the global economy, EPS estimates in the US and abroad have actually risen this year (Chart 62). Chart 61The Business Cycle Drives Earnings
The Business Cycle Drives Earnings
The Business Cycle Drives Earnings
Chart 62Global EPS Estimates Have Held Up Reasonably Well
2022 Second Quarter Strategy Outlook – The New Neutral
2022 Second Quarter Strategy Outlook – The New Neutral
Chart 63Equities Are Still Attractive Versus Bonds
Equities Are Still Attractive Versus Bonds
Equities Are Still Attractive Versus Bonds
As Doug Peta, BCA’s Chief US Strategist has pointed out, the bar for positive earnings surprises for Q1 is quite low: According to Refinitiv/IBES, S&P 500 earnings are expected to fall by 4.5% in Q1 over Q4 levels. Global equities currently trade at 18-times forward earnings. Relative to real bond yields, stocks continue to look reasonably cheap (Chart 63). Even in the US, where valuations are more stretched, the earnings yield on stocks exceeds the real bond yield by 570 basis points. At the peak of the market in 2000, the gap between earnings yields and real bond yields was close to zero. Favor Non-US Markets, Small Caps, and Value Valuations are especially attractive outside the US. Non-US equities trade at 13.7-times forward earnings. Emerging markets trade at a forward P/E of only 12.1. Correspondingly, the gap between earnings yields and real bond yields is about 200 basis points higher outside the US. In general, non-US markets fare best in a setting of accelerating growth and a weakening dollar – precisely the sort of environment we expect to prevail in the second half of the year (Chart 64). US small caps also perform best when growth is strengthening and the dollar is weakening (Chart 65). In contrast to the period between 2003 and 2020, small caps now trade at a discount to their large cap brethren. The S&P 600 currently trades at 14.4-times forward earnings compared to 19.7-times for the S&P 500, despite the fact that small cap earnings are projected to grow more quickly both over the next 12-months and over the long haul (Chart 66). Chart 64A Weaker Dollar And Stronger Global Economy Are Tailwinds For Non-US Stocks
A Weaker Dollar And Stronger Global Economy Are Tailwinds For Non-US Stocks
A Weaker Dollar And Stronger Global Economy Are Tailwinds For Non-US Stocks
Chart 65US Small Caps Usually Fare Well When The Economy Is Strengthening And The Dollar Is Weakening
US Small Caps Usually Fare Well When The Economy Is Strengthening And The Dollar Is Weakening
US Small Caps Usually Fare Well When The Economy Is Strengthening And The Dollar Is Weakening
Globally, growth stocks have outperformed value stocks by 60% since 2017. However, only one-tenth of that outperformance has come from faster earnings growth (Chart 67). This has left value trading nearly two standard deviations cheap relative to growth. Chart 66Small Caps Look Attractive Relative To Large Caps
Small Caps Look Attractive Relative To Large Caps
Small Caps Look Attractive Relative To Large Caps
Chart 67Value Remains Cheap
Value Remains Cheap
Value Remains Cheap
Chart 68Higher Yields Tend To Flatter Bank Stocks And Usually Weigh On Tech
Higher Yields Tend To Flatter Bank Stocks And Usually Weigh On Tech
Higher Yields Tend To Flatter Bank Stocks And Usually Weigh On Tech
Tech stocks are overrepresented in growth indices, while banks are overrepresented in value indices. US banks have held up relatively well since the start of the year but have not gained as much as one would have expected based on the significant increase in bond yields (Chart 68). With the deleveraging cycle in the US coming to an end, US banks sport both attractive valuations and the potential for better-than-expected earnings growth. European banks should also recover as the situation in Ukraine stabilizes. They trade at only 7.9-times forward earnings and 0.6-times book. On the flipside, structurally higher bond yields will weigh on tech shares. Moreover, as we discussed in our recent report entitled The Disruptor Delusion, a cooling in pandemic-related tech spending, increasing market saturation, and concerns about Big Tech’s excessive power will all hurt tech returns. Peter Berezin Chief Global Strategist peterb@bcaresearch.com Footnotes 1 The Federal Reserve targets an average inflation rate of 2% for the personal consumption expenditures (PCE) index. The TIPS breakeven is based on the CPI index. Due to compositional differences between the two indices, CPI inflation has historically averaged 30-to-50 basis points higher than PCE inflation. This is why the Fed effectively targets a CPI inflation rate of about 2.3%-to-2.5%. 2 These savings can either by generated domestically or imported from abroad via a current account deficit. 3 Theoretically, there is a close relationship between trend growth and the equilibrium investment-to-GDP ratio. For example, if real trend growth is 3% and the capital stock-to-GDP ratio is 200%, a country would need to invest 6% of GDP net of depreciation to maintain the existing capital stock-to-GDP ratio. In contrast, if trend growth were to fall to 2%, the country would only need to invest 4% of GDP. Global Investment Strategy View Matrix
2022 Second Quarter Strategy Outlook – The New Neutral
2022 Second Quarter Strategy Outlook – The New Neutral
Special Trade Recommendations Current MacroQuant Model Scores
2022 Second Quarter Strategy Outlook – The New Neutral
2022 Second Quarter Strategy Outlook – The New Neutral
Listen to a short summary of this report. Executive Summary Tighter Financial Conditions May Affect Growth
Tighter Financial Conditions May Affect Growth
Tighter Financial Conditions May Affect Growth
It is still possible that equities can outperform bonds over the next 12 months, but the risks to this are rising. Inflation may surprise further to the upside, amid rising commodity prices, pushing the Fed to tighten aggressively. Tighter financial conditions augur badly for growth (see Chart). We cut our recommendation for global equities to neutral and increase our allocation to cash. We continue to prefer the lower-beta US stock market over the euro zone and Emerging Markets. We are overweight defensive and structural growth sectors: Healthcare, Consumer Staples, IT and Industrials. Government bond yields have limited upside from here to year-end. We are neutral duration. US high-yield bonds are attractive: They are pricing in a big rise in defaults this year, which we see as unlikely. Recommendation Changes
Quarterly Portfolio Outlook: Too Much Uncertainty To Ignore – Turn More Cautious
Quarterly Portfolio Outlook: Too Much Uncertainty To Ignore – Turn More Cautious
Bottom Line: Rising uncertainty warrants a more defensive stance. Prudent investors should have only a benchmark weight in equities, and look for other hedges against downside risk. Overview Recommended Allocation
Quarterly Portfolio Outlook: Too Much Uncertainty To Ignore – Turn More Cautious
Quarterly Portfolio Outlook: Too Much Uncertainty To Ignore – Turn More Cautious
Rather like Arnold Toynbee’s definition of history, markets in the past few months have been hit by “just one damned thing after another”. But, despite war in Ukraine, big upward surprises to inflation, and a swift aggressive turn by the Fed, global equities are only 6% off their all-time high. It is still possible that equities may outperform bonds over the next 12 months and that the global economy will avoid recession (Chart 1). But the risks to this are rising. We recommend, therefore, that prudent investors reduce their equity holdings to benchmark weight and generally have somewhat defensive portfolio positioning. We put the money raised from going neutral on equities into cash, not bonds. What are the risks? Inflation could surprise further to the upside. Inflation has spread beyond a few pandemic-related items to goods where prices are usually sticky (Chart 2). There are now clear signs that price rises are feeding through to wage increases in the US, UK and Canada – though not yet in the euro area, Japan or Australia (Chart 3). The supply response that we expected to see emerge later this year may be delayed because of Covid lockdowns in China and disruptions in supply from Russia and Ukraine (Chart 4). Consensus forecasts for US core PCE inflation see it coming down to 2.5% by next year. The risk is that it could exceed that. The Fed has got way behind the curve. In retrospect, it should have raised rates last summer – and it now understands its error. Its first hike this cycle came only when the economy had already overheated (Chart 5). The Fed may, therefore, be tempted to get rates up very quickly – something the futures market is now pricing in, since it implies that the year-end Fed Funds Rate will be 2.5%. An aggressive Fed cycle – propelled by inflation fears – is not a good environment for risk assets. Chart 1Can Stocks Keep On Outperforming Bonds?
Can Stocks Keep On Outperforming Bonds?
Can Stocks Keep On Outperforming Bonds?
Chart 2Even Sticky Prices Are Now Rising
Even Sticky Prices Are Now Rising
Even Sticky Prices Are Now Rising
Chart 3Price Rises Feeding Through To Wages In Some Regions
Price Rises Feeding Through To Wages In Some Regions
Price Rises Feeding Through To Wages In Some Regions
Chart 4Supply Chains Remain Disrupted
Supply Chains Remain Disrupted
Supply Chains Remain Disrupted
Financial conditions had already tightened before the Fed hiked because of higher long-term rates, widening credit spreads, and a strengthening dollar. The Goldman Sachs Financial Conditions Index points to the ISM Manufacturing Index falling below 50 later this year (Chart 6). That is the level that historically has been the dividing line between stocks outperforming bonds year-over-year (Chart 7). In particular, the sharp rise in long-term rates (the US 10-year Treasury yield has risen by 110 BPs, and the German yield by 93 BPs over the past seven months) could start to put some pressure on housing markets (Chart 8). Chart 5The Fed Hiked Too Late
Quarterly Portfolio Outlook: Too Much Uncertainty To Ignore – Turn More Cautious
Quarterly Portfolio Outlook: Too Much Uncertainty To Ignore – Turn More Cautious
Chart 6Tighter Financial Conditions May Affect Growth
Tighter Financial Conditions May Affect Growth
Tighter Financial Conditions May Affect Growth
Chart 7Will PMIs Fall Below 50?
Will PMIs Fall Below 50?
Will PMIs Fall Below 50?
Chart 8Rising Rates Might Dampen The Housing Market
Rising Rates Might Dampen The Housing Market
Rising Rates Might Dampen The Housing Market
The war in Ukraine is unlikely to be a risk in itself. BCA Research’s geopolitical strategists think it very improbable that the conflict will spill beyond the borders of Ukraine – though there remains tail risk of a mistake. But the war is having a big impact on energy prices, especially electricity prices in Europe (Chart 9). The oil price could remain high while Russian oil, which used to be consumed in Europe, is diverted elsewhere. Our Commodity & Energy Strategy service expects that increased supply from OPEC members will bring Brent crude down to around $90 a barrel by year-end. But, as our Client Question on page 14 details, that calculation relies on many assumptions, and the risk is that the oil price stays high. A doubling of the oil price year-on-year (which currently equates to $120/barrel) has historically often been followed by recession (Chart 10). Chart 9Europe's Electricity Prices Have Soared
Europe's Electricity Prices Have Soared
Europe's Electricity Prices Have Soared
Chart 10Oil Price Is Close To The Risk Level
Oil Price Is Close To The Risk Level
Oil Price Is Close To The Risk Level
China has been easing fiscal and monetary policy. But it is questionable how effective its stimulus will be this time. Confidence in the real estate market remains damaged. And the pick-up in credit growth has been limited to local government bond issuance; there is little sign that the private sector has appetite to borrow (Chart 11). Already some of these risks are affecting economic data. Consumer confidence has collapsed, presumably because of the rising cost of living (Chart 12). Although US activity indicators such as the manufacturing ISM remain elevated (see Chart 6 above), data in Europe is showing notable weakness (Chart 13). Chart 11China's Stimulus Not Helping The Private Sector
China's Stimulus Not Helping The Private Sector
China's Stimulus Not Helping The Private Sector
Chart 12Consumer Confidence Has Been Hit
Consumer Confidence Has Been Hit
Consumer Confidence Has Been Hit
The yield curve is also getting close to signaling recession. There has been much debate of late about which yield curve to use, with Fed Chair Jerome Powell arguing for the 3-month/3-month 18-month forward curve, rather than the more usual 2/10 year or 3 month/10 year curves (Chart 14). The 2/10 is close to inverting, while the others are still a long way away. All measures of the yield curve have historically given reliable recession signals; the difference is simply a matter of timing, with the 2/10 giving the longest lead time.1 If the Fed ends up tightening as much as it intends, all the yield curves will likely invert within the next year or so. Chart 13European Data Starting To Weaken
European Data Starting To Weaken
European Data Starting To Weaken
Chart 14It Depends On Which Yield Curve You Look At
It Depends On Which Yield Curve You Look At
It Depends On Which Yield Curve You Look At
And, despite all these warning signals, forecasts for economic and earnings growth have not been revised down much. Economists still expect 3.4-3.5% real GDP growth in the US and euro zone this year, well above trend (Chart 15). And, despite the drop in GDP forecasts, earnings forecasts have actually been revised up since the start of the year, with analysts now expecting 9.6% EPS growth in the US and 8.2% in the euro zone (Chart 16). Chart 15GDP Growth Is Still Expected To Be Above Trend...
GDP Growth Is Still Expected To Be Above Trend...
GDP Growth Is Still Expected To Be Above Trend...
Chart 16...And Earnings Have Not Been Revised Down At All
...And Earnings Have Not Been Revised Down At All
...And Earnings Have Not Been Revised Down At All
This all seems too much uncertainty for most asset allocators to want to stay fully risk-on. There are valid arguments that equities and other risk assets can continue to perform (which we outline in the following section, Risks To Our View). But the risks have shifted enough since the start of the year that a more defensive stance is now warranted. Garry Evans, Senior Vice President Global Asset Allocation garry@bcaresearch.com Risks To Our View Chart 17Fed Feedback Loop Back In Action?
Quarterly Portfolio Outlook: Too Much Uncertainty To Ignore – Turn More Cautious
Quarterly Portfolio Outlook: Too Much Uncertainty To Ignore – Turn More Cautious
Since our main scenario is somewhat cautious – and sentiment towards risk assets pretty pessimistic – we need to consider what could cause upside surprises to the economy and market. The most likely would be if the Fed were to turn more dovish. But the main trigger for this would be if the stock market fell sharply or growth showed clear signs of slowing – which would obviously be negative for stocks first. This scenario could produce the sort of Fed feedback loop we saw in 2015-17, when tightening financial conditions caused the Fed to ease back on rate hikes (Chart 17). More benign would be a gradual easing of inflation over the summer which would mean that the Fed could eventually hike a little less than the market currently expects. The economy may also not be as vulnerable to higher energy prices and higher rates as we fear. Food and energy are now a much smaller part of the consumption basket than they were in the 1970s (Chart 18). Rates may have a limited impact on the housing market, given the low inventory of new houses, strong household formation, and the fact that, in the US at least, some 90% of mortgages are 30-year fixed rate. Consumers continue to hold large amounts of excess savings – more than $2 trillion in the US alone. This should keep retail sales growth strong, though there might be some shift from spending on goods to spending on services as Covid fears recede (Chart 19). Chart 18Consumers Are Less Sensitive To Food And Energy Prices...
Consumers Are Less Sensitive To Food And Energy Prices...
Consumers Are Less Sensitive To Food And Energy Prices...
Chart 19...And So May Keep On Spending
...And So May Keep On Spending
...And So May Keep On Spending
Other upside risks include: A ceasefire and settlement in Ukraine (unlikely soon, since Russia will not withdraw without taking over Crimea and the Donbass, something Ukraine could not accept); more aggressive stimulus in China (possible, but only if Chinese growth weakened much further); and a sharp fall in the oil price caused by new supply coming onto the market from Saudi Arabia and North American shale fields, and possibly also Iran and Venezuela. What Our Clients Are Asking What Is The Risk Of Stagflation? Chart 20The Combination Of High Inflation And High Unemployment Was The Key Problem In The 1970s
Quarterly Portfolio Outlook: Too Much Uncertainty To Ignore – Turn More Cautious
Quarterly Portfolio Outlook: Too Much Uncertainty To Ignore – Turn More Cautious
Several clients have asked about the risk of stagflation, and how the current episode compares to the 1970s. We can begin by dispelling some myths about the 1970s. There is a notion that this was a decade of poor growth for the US. That is simply not true. Real GDP grew by a solid 3.3% annual rate during the 1970s, higher than in any post-WW2 decade other than the 1990s and the 1960s (Chart 20, panel 1). The underlying problem during the 1970s was the combination of high inflation and a poor labor market. Despite solid growth, the unemployment rate kept grinding higher as inflation was increasing, never dropping below 4.5% even at the peaks of the expansions (Chart 20, panel 2). This situation went against the commonly held belief that it was not possible for both these variables to remain high at the same time for an extended period. With the economy plagued by both high inflation and high unemployment, the Fed faced a difficult dilemma: Keep interest rates too high and the already weak labor market would worsen; keep interest rates too low and inflation would spiral out of control. Throughout the decade, the Fed chose the latter option, causing inflation expectations to become unmoored. Chart 21Demographic Shocks And The Structure Of The Labor Force Led To A Weak Labor Market
Quarterly Portfolio Outlook: Too Much Uncertainty To Ignore – Turn More Cautious
Quarterly Portfolio Outlook: Too Much Uncertainty To Ignore – Turn More Cautious
Why was there so much slack in the labor market? Demographics were one of the main culprits. The entrance of baby boomers into the workforce dramatically increased the pool of workers. At the same time, prime-age female participation rose at the fastest pace on record, adding additional supply to the labor force (Chart 21, panel 1). The structure of the labor market also played a key role. Almost a third of employees belonged to a union and most of their salaries were indexed to inflation (Chart 21, panels 2 & 3). This made for a rigid labor market where neither employment nor wages could adjust properly to the economic cycle. True, the oil shocks of 1974 and 1979 exacerbated inflationary pressures. But what made inflation truly pernicious during the 1970s was the inability of the Fed to fight it without compromising its employment mandate. Today the economic picture is very different. Union membership stands at only 10% and cost of living adjustments have essentially disappeared. There is also no labor supply shock on the horizon comparable to the baby boomers or women entering the labor force. This makes the calculus for the Fed easy. With its employment mandate already met, it will simply keep raising rates until inflation is back under control. As a result, the risk that it keeps policy too easy and unleashes further inflationary pressures is relatively low over the next 12 months. How Will The War In Ukraine Affect The World Economy? Chart 22The Ukrainian War Has Impacted The Global Economy
Quarterly Portfolio Outlook: Too Much Uncertainty To Ignore – Turn More Cautious
Quarterly Portfolio Outlook: Too Much Uncertainty To Ignore – Turn More Cautious
Global growth, monetary policy, and employment were projected to return to pre-pandemic trends in 2023. In January, the IMF projected global growth of 4.4% in 2022, but now it is poised to cut its forecast due to the war in Ukraine. According to OECD estimates, global economic growth could be 1% lower than what was previously predicted (Chart 22, panel 1). The conflict is putting fresh strain on overstretched global supply chains, causing the price of many commodities to surge. Russia and Ukraine are relatively small in terms of economic output (together they comprise only 1.9% of global GDP in US dollar terms). But they are very big producers and exporters of energy, metals, and key food items. Russia, for example, produces 12% of global oil, one-third of palladium, and (with Belarus) 40% of potash (used in fertilizers). Ukraine is also a major producer of auto parts, such as wire harnesses. Some European car manufacturers have had to idle factories due to a lack of components. Global central banks have been increasing interest rates to battle inflation. But higher energy and food prices will require additional rate hikes to ensure price stability. The war in Ukraine could push up world inflation by around 2.5% this year, according to the OECD. Developing economies are in a particularly tight spot, being hit with high inflation in food and basic commodities. Their consumer price indices are very sensitive to these items. Russia and Ukraine are the main global exporters of several agricultural items (for example, they together account for a quarter of global wheat exports) which could cause global food insecurity to increase (Chart 22, panel 2). International sanctions on Russia create a risk for foreign companies with operations there. Withdrawal could have a meaningful effect on earnings. Most multinationals have only limited exposure to Russia, but a small number of prominent names make more than 5% of global revenues from the country (Chart 22, panel 3). Chart 23AOPEC Is Able To Cover Supply Shortages...
OPEC Is Able To Cover Supply Shortages...
OPEC Is Able To Cover Supply Shortages...
Chart 23B...Unlike Other Countries...
...Unlike Other Countries...
...Unlike Other Countries...
Chart 23CTo Restore A Balanced But Tight Market
To Restore A Balanced But Tight Market
To Restore A Balanced But Tight Market
What Is The Risk That The Oil Price Stays High? Our Commodity & Energy strategists see 1.3mm b/d of supply from OPEC coming onto the market beginning in May. Because of this, they expect the price of Brent crude to fall back, to average $93 per barrel this year and next. OPEC core producers fear that low inventories and an oil price above $100 per barrel will lead to demand destruction. They will therefore aim to bring prices down. They have enough spare capacity (approximately 3.2mm b/d) to cover physical deficits in global markets (Chart 23A). However, the risk to this view is tilted to the upside. The key question is whether OPEC producers will in fact ramp up production. The OPEC meeting held on March 2, 2022 noted that current market volaility is a function of geopolitical developments and does not reflect changes in market fundamentals: This could imply a reluctance to increase production as quickly as we expect. Saudi Arabia’s interest in exploiting yuan-settled oil trades with China adds an element of uncertainty. With OPEC’s intention to increase production in question, and Russian oil sanctioned and unlikely to be rerouted easily and quickly, there remains little alternative supply: Countries such as Iraq and Venezuela are unlikely to make up for supply deficits (Chart 23B). The US-Iran talks also add downside uncertainty to our price outlook. Our commodity strategists have recently ended their forecast of a return of 1-1.3mm b/d of Iranian oil (Chart 23C). A no-deal scenario is likely to lead to an escalation in tensions and volatility, warranting higher oil prices in the short term. Nevertheless, there remains the possibility that the US administration will be keen on striking a deal with Iran to reduce the risk of a global oil supply shock. This would, in turn, reduce the risk of military conflict, at least in the short-term, and remove some risk premium from oil prices. It might also lead to further increases in production from the Gulf states to prevent Iran from stealing market share, putting further downward pressure on the oil price. Chart 24Is It Time To Favor EMU Equities?
Is It Time To Favor EMU Equities?
Is It Time To Favor EMU Equities?
When Will Euro Area Stocks Rebound? Chinese policy makers have sounded more aggressive of late in terms of supporting the Chinese economy and stock market, especially property and tech shares. This is a positive development for euro area equities given the region’s strong reliance on the Chinese economy (Chart 24, panel 1). Euro area equities have been in a structural downtrend relative to US equities, but have historically staged occasional counter-trend rallies (Chart 24, panel 2). It’s possible that stocks in this region may stage another short-term rebound at some point because they are technically oversold, and valuation is extremely cheap (Chart 24, panel 3). Investors with a longer-term investment horizon, however, should remain underweight euro area stocks until there are more signs that the region is out of its stagflation state. As we argue in the Global Equities section on page 18, the key factor to watch over the next 9-12 months is profitability. Global earnings growth will slow significantly this year in response to higher input costs and lower revenue growth. As a net importer of energy and industrial metals, euro area earnings growth will continue to slow more than in the US (Chart 24, panel 4). In addition, in times of high uncertainty, we prefer to shelter in less volatile markets. The euro area has a much higher beta than the US (Chart 24, panel 5). Bottom Line: While there could be an opportunity to overweight euro area stocks versus the US tactically, long-term investors should continue to favor the US. Global Economy Chart 25Global Growth Remains Robust...
Global Growth Remains Robust...
Global Growth Remains Robust...
Overview: Global growth has been strong. But this has triggered a surge in inflation, which is pushing central banks to tighten policy more quickly than was expected even three months ago. At the same time, higher prices – and falling real wages – have started to hurt consumer confidence. This raises the risk of stagflation, particularly if disruptions caused by the war in Ukraine push commodity prices up further. A recession is still unlikely over the next 12-18 months, but the risk of one has clearly risen. US economic growth has remained robust, led by consumption and capex. GDP growth in Q4 was 5.6% QoQ annualized. The ISMs remain strong, with manufacturing at 58.5 and services 58.9 (Chart 25, panel 2). However, there are some early signs of slowdown. The Atlanta Fed Nowcast points to only 0.9% annualized growth in Q1. The effect of higher inflation (with headline CPI at 7.9% YoY) might hurt consumer confidence, since average hourly earnings growth lags behind inflation at only 5.1%. Higher rates could also dampen the housing market. With the average mortgage rate rising to 4.5%, from 3.3% at the end of last year, there are signs of a slowdown in house sales (which fell 9.5% YoY in January). Euro Area: Growth remains decent, with Q4 GDP 4.6% QoQ annualized, and robust PMIs (manufacturing at 57.0 and services at 54.8). However, wage growth lags that in the US (negotiated wages rose only 1.5% YoY in Q4), and the impact of a sharp jump in energy prices (exacerbated by the war in Ukraine) could dent consumption. Recent data have deteriorated noticeably: Consumer confidence collapsed to -18.7 in March, and the March ZEW survey (Chart 26, panel 1) fell to -38.7 (from +48.6 in February). With weak underlying growth, and core CPI inflation a relatively modest 2.7%, the ECB will not need to rush to raise rates. Chart 26...But Higher Inflation Is Starting To Damage Confidence
...But Higher Inflation Is Starting To Damage Confidence
...But Higher Inflation Is Starting To Damage Confidence
Japan: Economic growth remains rather anemic. Manufacturing is supported by exports (which rose by 19.1% YoY in January), helping the manufacturing PMI to stay in positive territory at 53.2. But wage growth remains stagnant (0.9% YoY) and the rise in oil prices has pushed up headline inflation to 0.9%, leading to a weakening of consumer sentiment. The services PMI is a weak 48.7. There are hopes that this year’s shunto wage round will lead to strong wage rises (the government is lobbying businesses to raise wages by 3%) but this seems unlikely. With inflation ex food and energy languishing at -1.9% (even if that is distorted by cuts in mobile phone charges), there seems little need for the Bank of Japan to tighten policy. Emerging Markets: Chinese economic indicators remain depressed (Chart 26, panel 3), even though global demand for manufactured goods means exports are rising 16.4% YoY. The authorities have been easing policy, which has led to a mild uptick in credit growth. But there are questions on how effective stimulus will be, since the housing market has been damaged by the problems at Evergrande and other developers, and because China seems to be sticking to its zero-Covid policy. Some other EMs will be helped by the rise in commodity prices: South Africa, for example, saw 4.9% annualized GDP growth in Q4. But many developed countries were forced to raise rates sharply last year because of inflation and this may slow growth in 2022. Brazil’s policy rate, for example, has risen to 11.75% from 2% last April, and that has dampened activity: Brazilian industrial production is falling 7.2% YoY, and retail sales are -1.9% YoY. Interest Rates: Recorded inflation and inflation expectations (Chart 26, panel 4) have risen sharply everywhere. Slowing demand for manufactured goods and a supply-side response should allow monthly inflation to peak over the next few months – although the risks remain to the upside if commodity prices continue to rise. The surge in inflation has pushed up long-term rates, with the US 10-year Treasury yield rising by 82 BPs year-to-date and that in Germany by 73 BPs. However, the market is now pricing in very aggressive tightening by central banks through year-end: 214 BPs of further hikes by the Fed, and even 75 BPs by the ECB. The probability is that neither will do quite that much, and therefore the upside for long-term government bond yields is probably capped around its current level for the next 6-9 months. Global Equities Chart 27Watch Earnings Revisions Closely
Watch Earnings Revisions Closely
Watch Earnings Revisions Closely
Watch Earnings Closely: Global equities suffered a loss of 4% in Q1/2022 despite strong earnings growth. Except for the Utilities sector, all other sectors have positive 12-month trailing and forward earnings growth. Consequently, overall equity valuation, based on forward PE, is no longer stretched (Chart 27). Going forward, however, the macro backdrop of rising inflation and a slowing economy does not bode well for earnings growth, with the profit margin in developed markets already at a historical high. Rising input costs from both materials and wages will put downward pressure on profit margins while revenue growth slows. BCA Research’s global earnings model suggests that earnings growth will slow significantly this year. As such, we downgrade equities to neutral from overweight at the asset class level (see Overview section on page 2). Within equities, we maintain our already cautious country allocation, which served us well in both 2021 and Q1/22. The out-of-consensus overweight on the US and underweight on the euro area panned out well in Q1 2022, as the US outperformed the euro area by 5.9%. After the more defensive adjustment between the UK and Canada in the March Monthly Update, our country allocation portfolio has been well positioned, with overweights in the US and UK, underweights in the euro area, Canada and emerging markets excluding China, while neutral Australia, Japan, and China. In line with the shift of our structural view on industrial commodities, we upgrade the Materials sector to neutral from underweight at the expense of Real Estate and Communication Services. After these adjustments and the added defensive tilt that we took in the February Monthly Update, our global sector portfolio has a tilt towards defensive and structural growth by being overweight Tech, Industrials, Healthcare and Consumer Staples, underweight Consumer Discretionary, Utilities, and Communication Services, while neutral Materials, Financials, Energy and Real Estate. Chart 28Sector Adjustments
Quarterly Portfolio Outlook: Too Much Uncertainty To Ignore – Turn More Cautious
Quarterly Portfolio Outlook: Too Much Uncertainty To Ignore – Turn More Cautious
Sector Allocation: Upgrade Materials To Neutral, Downgrade Real Estate to Neutral, Downgrade Communication Services to Underweight. Russia’s war on Ukraine is a watershed moment for industrial metals. It has altered the dynamics of the metals market which used to be dominated by Chinese demand. We had a structural underweight in the Materials sector because China was undergoing a deleveraging process. Now the Russian-Ukrainian war has demonstrated how dangerous it is for Europe to rely on Russia for energy supply and how important it is for Europe to have a strong military defense system. Rebuilding Europe’s defense will compete with energy diversification initiatives to boost demand for metals. Such a structural shift no longer warrants an underweight in Materials (Chart 28, panel 1). In addition, relative valuation in the Materials sector is as low as it was in the early 2000s, right before the multi-year upcycle in Materials’ relative performance (Chart 28, panel 2). Why not go overweight then? The concern is that the sector is technically overbought due to the sharp rises in metal price. Covid lockdowns in China have disrupted the supply chain in metals, and the Russian-Ukrainian war has further intensified the rise in metals prices due to extremely low inventories. We will watch closely for a better entry point to upgrade this sector to overweight. To finance this upgrade, we downgrade Real Estate to neutral from overweight, and Communication Services to underweight from neutral. Both downgrades are driven by a deteriorating relative earnings growth outlook as shown in Chart 28, panels 4 and 5. Rising mortgage rates do not bode well for the Real Estate sector. “Reopening from Covid lockdowns” reduces the “work from home” tailwind for the Communication Services sector, where relative valuation is also stretched. Government Bonds Chart 29WILL INFLATION COME DOWN IN 2022?
WILL INFLATION COME DOWN IN 2022?
WILL INFLATION COME DOWN IN 2022?
Maintain At-Benchmark Duration. The first quarter of 2022 had seen a steady rise in global bond yields even before the Russian-Ukrainian war, in response to a higher inflation outlook. The negative shock to bond yields from the war was quickly reversed and bond yields continued to march higher as the supply shortage in the commodity complex further pushed up commodity prices and inflation expectations. The US 10-year TIPS breakeven inflation rate has risen above the 2.3-2.5% range that is consistent with the Fed’s 2% PCE target. However, the 5-year/5-year forward breakeven inflation rate, the measure that the Fed pays more attention to, is only slightly above 2.3% (Chart 29, panel 2). The base case of BCA Research’s Fixed Income Strategists is that inflation will moderate in the coming months so that there should be limited upside for bond yields. We already upgraded duration to at-benchmark from below-benchmark, and government bonds to neutral from underweight within the bond asset class in the March Portfolio Update. These are still appropriate going forward with the US 10-year Treasury yield currently standing at 2.33%. Inflation-linked bonds are not cheap anymore. We maintain a neutral stance to hedge against the tail risk of a further rise in inflation. Corporate Bonds Chart 30Continue To Favor High-Yield Credit
Continue To Favor High-Yield Credit
Continue To Favor High-Yield Credit
Since the beginning of the year, investment-grade bonds have underperformed duration-matched Treasurys by 191 basis points, while high-yield bonds have underperformed duration-marched Treasurys by 173 basis points. Even with spreads widening, we continue to underweight investment-grade credits within the fixed-income category. Spreads currently do not offer enough value to warrant a neutral shift. Moreover, investment-grade corporate bonds have been performing poorly compared to high-yield corporate bonds (Chart 30, panel 1). But shouldn’t one expect lower-rated bonds to perform worse in bear markets, and better in bull markets? Our US Bond Service believes that one explanation for the poor performance of investment-grade compared to high-yield bonds is that the industry composition of the two categories is quite different. High-yield has a large concentration in the Energy sector while investment-grade bonds have a larger weighting in Financials. And with the recent surge in oil prices, it’s possible that the strong performance of Energy credits is the reason behind that return divergence. We continue to overweight high-yield bonds, as there is likely to be no material increase in corporate default risk. The market currently implies that defaults will rise to 3.7% during the next 12 months, from 1.2% over the past 12 months (Chart 30, panel 2). That seems too high. What about European credit? The ECB’S hawkish turn and then the Ukranian crisis made yields almost double this year. The spreads for both investment-grade and high-yield corporate bonds have been widening since the beginning of the year (Chart 30, panel 3). Their valuations seem to offer an attractive entry point but investors should be cautious as spreads could continue to widen in response to the negative news from the Ukranian crisis. Commodities Chart 31Risks To Oil Price Are To The Upside
Quarterly Portfolio Outlook: Too Much Uncertainty To Ignore – Turn More Cautious
Quarterly Portfolio Outlook: Too Much Uncertainty To Ignore – Turn More Cautious
Energy (Overweight): Oil prices surged to $120 – the highest level since 2013 – in the aftermath of Russia’s invasion of Ukraine, pricing in sanctions against the nation’s oil producers and an estimated 3-5 mm b/d of supply disruptions (Chart 31, panel 1). While the actual hit to Russian production might end up being lower, Russia accounts for over 10% of global production, almost half of which is exported (Chart 31, panel 2). The price shock was slightly offset by a marginal demand weakness from China amid another outbreak of Covid-19. However, uncertainty regarding how quickly core OPEC producers will ramp up production to fill supply shortages – as well as the breakdown in the US-Iranian talks – continue to keep oil prices jittery. Our Commodity & Energy strategists see 1.3mm b/d of increased supply from OPEC coming onto the market beginning in May. This should bring the price of Brent crude down to average $93 per barrel this year and next. The risks to this view however remain tilted to the upside. For more details, see What Our Clients Are Asking on page 14. Industrial Metals (Neutral): Russia is a major player in the metals market, providing more than a third of the world’s palladium output; it is also the third biggest producer of nickel (Chart 31, panel 3). The prices of those metals, as well as the broad industrial metals complex, have shot up following the invasion: Industrial metals had the largest weekly price change since 1990 in the week following the invasion. The outlook for industrial metals prices is tilted to the upside. Inventories for some of the industrial metals required for the energy transition are low. Moreover, if China implements significant stimulus – and supply remains tight – prices are likely to stay elevated. Precious Metals (Neutral): Gold prices reacted in line with the moves in US real rates over the first quarter of this year, initially relatively flat, before rising in the past few weeks as real rates came down. The upward move in gold prices was further amplified by Russia’s invasion of Ukraine, which pushed the bullion’s price close to $2040, just shy of its all-time high in late 2020. This comes as no surprise: The metal is known (despite its volatility) for its safe-haven and inflation-hedging characteristics. We maintain our neutral exposure to gold. Real rates should start to rise as inflation pressures abate in the second half of the year. Gold is also somewhat expensively valued, with the price in inflation-adjusted terms close to its record high (Chart 31, panel 4). Currencies Chart 32Don't Turn Bearish On The Dollar Yet
Don't Turn Bearish On The Dollar Yet
Don't Turn Bearish On The Dollar Yet
US Dollar: The DXY index has risen by 2.3% this quarter. We are maintaining our neutral stance on the US dollar. While the dollar is expensive by more than 20% according to purchasing power parity (PPP), positive momentum continues to be too strong to take an outright bearish position (Chart 32, panels 1 and 2). We will look to downgrade the dollar to underweight when momentum starts to weaken and when there is clear evidence that the Fed will have to back off from its tightening path. Japanese Yen: With stock markets rebounding and expectations of interest-rate hikes rising in the US, the yen has fallen by more than 18% since the beginning of the year. Still, we reiterate the overweight that we placed at the beginning of March. The yen should act as a hedge if global stock markets sell off anew. Moreover, we believe there is now limited upside for US yields, given that there are now more than 250 basis points of Fed hikes priced over the next 12 months. This should put a cap on USDJPY, as this cross is closely tied to the relative expectations of tightening between the US and Japan (Chart 32, panel 3). Canadian Dollar: We are currently underweight the Canadian dollar. Our Commodity and Energy Strategists believe that oil should come down to around $90/barrel by the end of the year. Additionally, the BoC won’t be able to follow along with the Fed in its tightening cycle, given that household debt is much higher in Canada than in the US. Both developments should put downward pressure on the CAD over the next 12 months. Alternatives Chart 33Prepare To Turn To Defensive Alternatives
Prepare To Turn To Defensive Alternatives
Prepare To Turn To Defensive Alternatives
Return Enhancers: We previously suggested that private equity tends to outperform other alternative assets in the early years of expansions as it benefits from cheaper financing opportunities and attractive entry valuations. This view has been correct: Following the large drawdown in Q1 2020 due to Covid, PE returns have significantly outperformed those of hedge funds (Chart 33, panel 1). However, financing conditions are tightening and could weigh down on economic activity and PE returns going forward (Chart 33, panel 2). Preliminary results for Q3 2021 show PE funds returning only around 6% compared to an average quarterly return of 10% since the beginning of the pandemic. Given the time it takes to move allocations in the illiquid space, investors should prepare to pare back exposure from PE, and look for more defensive alternative assets, such as macro hedge funds. Inflation Hedges: We have been of the view that inflation will follow a “two steps up, one step down” trajectory: More likely than not, we are near the top of those two steps. Accordingly, we were positioned to favor real estate over commodities; real estate tends to outperform when inflation is more subdued (close to 2%-3%). Inflation, globally, however has turned out to be stickier than expected and recent economic and political developments have propelled another surge in commodity prices. Scarce inventories, lingering inflation, and a potential significant Chinese stimulus imply, at least in the short-term, that commodity prices have room to run (Chart 33, panel 3). Volatility Dampeners: Timberland and Farmland remain our long-time favorite assets within this bucket. We have previously shown that both assets outperform other traditional and alternative assets during recessions and equity bear markets. Farmland particularly continues to offer an attractive yield of approximately 2.8% (Chart 33, panel 4). Footnotes 1 Please see BCA Research Special Report, "The Yield Curve As An Indicator," for a detailed analysis of this. Recommended Asset Allocation Model Portfolio (USD Terms)
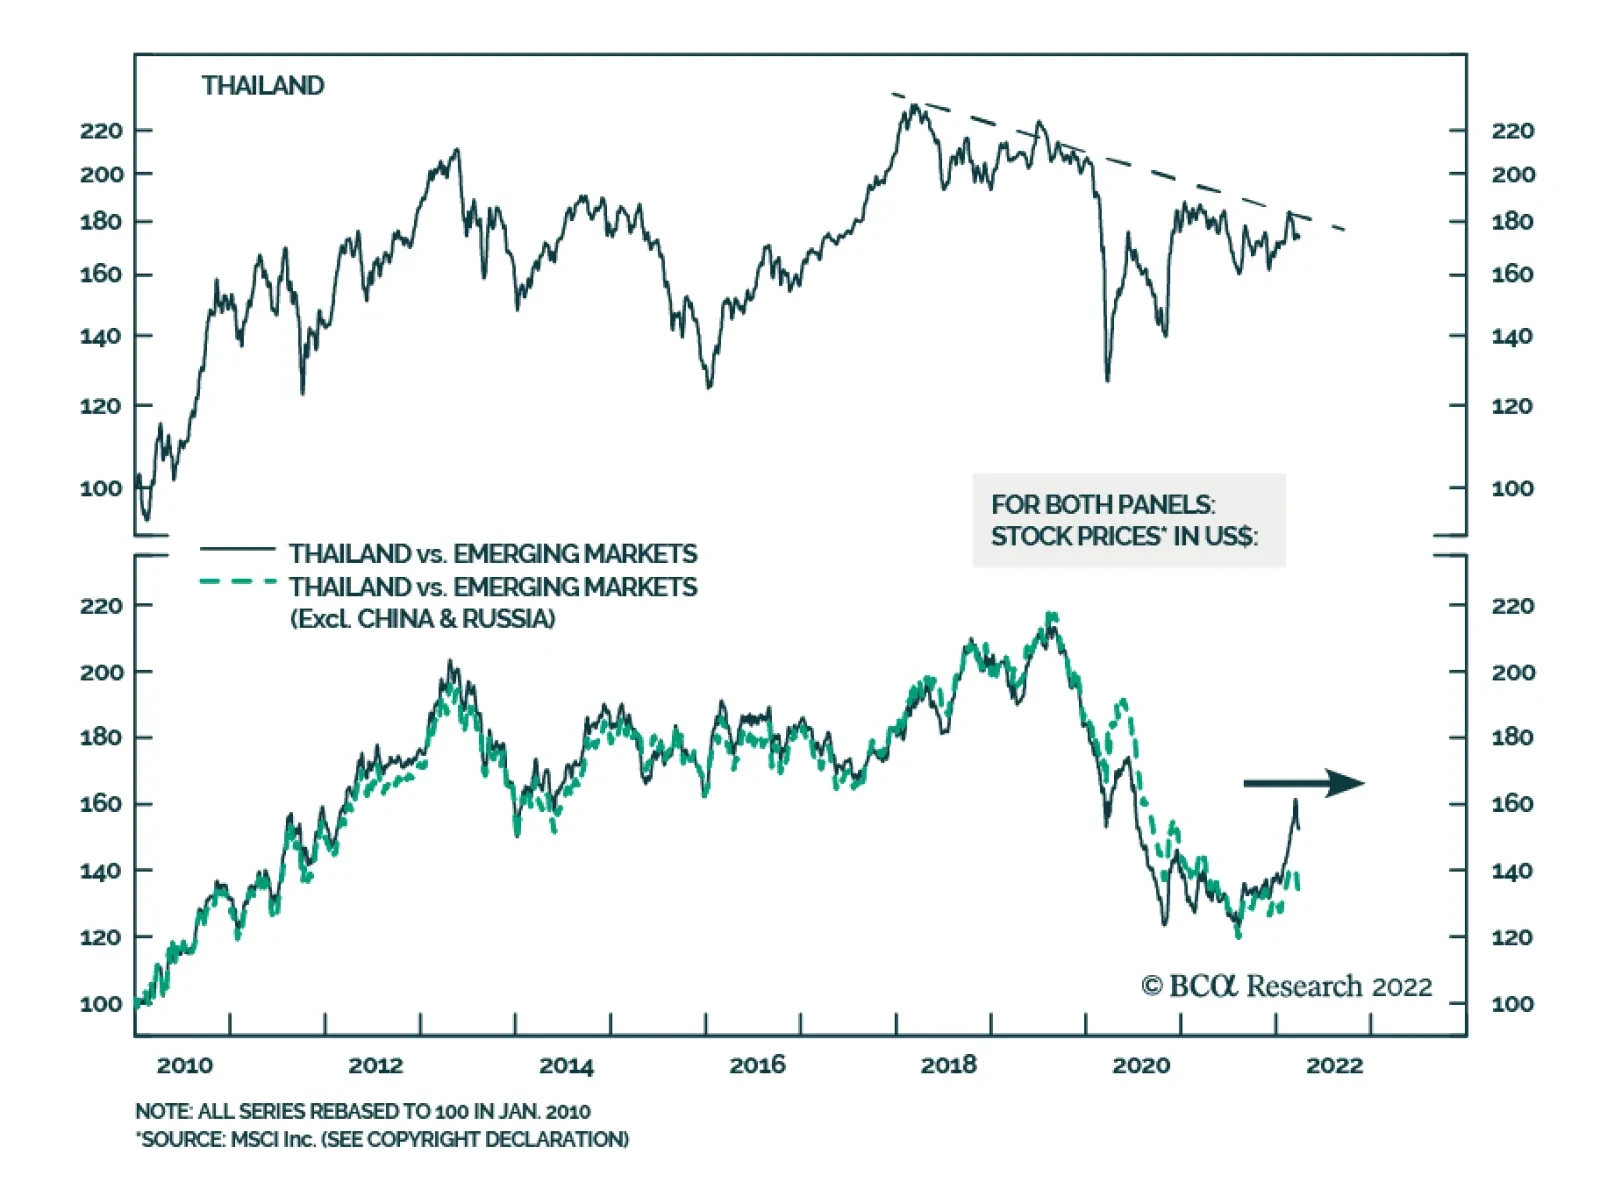
BCA Research’s Emerging Markets Strategy service concludes that investors should maintain a neutral allocation to Thai equities in EM and emerging Asian portfolios for now, but put the bourse on an upgrade watch. Thai stocks have held up relatively well…
Executive Summary Thai stocks’ recent outperformance had more to do with investors forsaking Chinese and Russian markets to rotate elsewhere, rather than Thailand’s bullish outlook. Thai domestic demand is still shaky as households are struggling with meagre income growth amid high indebtedness. Tight fiscal policy is another headwind. All this will delay the recovery in Thai corporate profits, without which a sustainable equity bull market is unlikely. On the positive side, the baht is much more competitive now, which is a boon for an economy where trade makes up 100% of GDP. The country’s travel and tourism revenues are also set to rise. Keep An Eye On Order Books For A Hint On A Sustainable Stock Rally
Keep An Eye On Order Books For A Hint On A Suatainable Stock Rally
Keep An Eye On Order Books For A Hint On A Suatainable Stock Rally
Bottom Line: Equity investors should stay neutral for now; but put this bourse on an upgrade watchlist. Domestic bond investors should upgrade Thai local currency bonds from neutral to overweight in EM portfolios, and from underweight to neutral in Emerging Asian portfolios. Chart 1Thai Stocks' Recent Outperformance Will Not Linger
Thai stocks's Recent Outperformance Will Not Linger
Thai stocks's Recent Outperformance Will Not Linger
Thai stocks have held up relatively well during the market turbulence of the past two months or so. Can this be a sign that the end of the Thai bear market is near (Chart 1, top panel)? We believe that this bourse is not about to experience a major breakout in absolute or in relative terms. Thai domestic demand is still shaky, and might take some more time to recover. This is because households’ real income growth remains lackluster, and they are saddled with high debts. This will hinder consumer demand from rising strongly even after the pandemic subsides. That, in turn, will also discourage capital investments. Notably, Thai stocks’ recent relative breakout is more due to a meltdown in Chinese and Russian markets following the Ukraine crisis rather than any major improvements in Thailand’s domestic fundamentals. Thai relative performance looks much less impressive versus the EM equity index excluding Chinese and Russian stocks (Chart 1, middle and bottom panels). That said, two major macro headwinds that had hamstrung this market over the past several years have eased. The baht is no longer expensive, and the country’s decimated travel and tourism revenues – which fell from 12% of the GDP before the pandemic to nearly naught – are also set to recoup some of the losses. All this warrants that investors maintain a neutral allocation to this bourse in EM and emerging Asian portfolios for now, but put it on an upgrade watchlist. As for domestic bonds, investors should upgrade Thai bonds to overweight in an EM local currency bond portfolio, and to neutral in Emerging Asian portfolios. The Economy: An Extended Bottoming Phase Chart 2Thai Private Consumption Is Struggling
Thai Private Consumption Is Stuggling
Thai Private Consumption Is Stuggling
The Thai economy is still in an extended bottoming phase. Top panel of Chart 2 shows that private consumption is barely at 2019 levels, and is still about 10% lower than what would be the pre-pandemic trend. Consumption clearly slows as new COVID-19 cases go up are. The latter have been on the rise again lately, and it could slow the pace of recovery again. This is at a time when durable goods sales have not recovered to even their pre-pandemic levels (Chart 2, bottom panel). More importantly, what could hinder the economic recovery beyond the pandemic is the fact that Thai households are quite depleted in terms of their purchasing power: Household incomes are severely impaired as average wage growth has been very poor. In fact, both private and government sector jobs have barely seen any rise in their real wages in the past six years (Chart 3, top panel). Given the current higher energy and transportation prices, that leaves households with little discretionary income to spend elsewhere. Lack of employment opportunities is exacerbating the poor wages issue. Non-farm jobs have not grown at all since 2016. The number of manufacturing jobs has actually fallen by 10% during this period (Chart 3, bottom panel). All this has been a headwind to household income. Prospects of a strong job/wage recovery in the near future is also not high. One reason for this is that Thai banks have substantially retrenched their loans to the SME sector in the past couple of years. From a high of 30% of GDP in 2019, these loans are now down to 21% (Chart 4). Credit retrenchment of this order in the job-intensive SME sector has driven many companies out of business, shrinking job opportunities. It will take a considerable time to recoup all these jobs even when the pandemic subsides. Chart 3Real Wages Have Stagnated For Years As Employment Stopped Growing
Real Wages Have Stagnated For Years As Employment Stopped Growing
Real Wages Have Stagnated For Years As Employment Stopped Growing
Chart 4Massive Credit Retrenchment To SMEs Will Cost Jobs
Massive Credit Retrenchment To SME Sectors Will Cost Jobs
Massive Credit Retrenchment To SME Sectors Will Cost Jobs
Notably, Thai households were already highly leveraged going into the pandemic. Household borrowing from banks and other financial institutions taken together now amount to a very high 90% of GDP. The top panel of Chart 5 shows that for almost a decade until 2015, Thai households were leveraging up incessantly. Those loans did help boost consumer demand during all those years. But now, when jobs are scarce and wage growth is paltry, households are shy to add more leverage to their balance sheets. This means a debt-fueled recovery in consumer demand is not in the cards. Notably, total domestic credit (including households and corporates) had also surged in a similar fashion, and is now very high at 170% of GDP (Chart 5, bottom panel). Facing subdued demand, Thai manufacturing and shipments are also struggling. Weak sales mean businesses are struck with high inventories. Order books do not appear to be strong either (Chart 6). Chart 5High Household Debt Entails No Debt-Fueled Consumer Demand Recovery
Already High Household Debts Means No Debt Fueled Consumer Demand Recovery
Already High Household Debts Means No Debt Fueled Consumer Demand Recovery
Chart 6Mediocre Orders Amid High Inventory Does Not Entail Strong Manufacturing Recovery
Mediocre Orders Amid High Investory Does Not Entail Strong Manufacturing Recovery
Mediocre Orders Amid High Investory Does Not Entail Strong Manufacturing Recovery
The combination of rather high finished goods inventories and mediocre order books entail that a strong manufacturing recovery is not around the corner. If so, that could be a problem as only a sustained recovery in manufacturing can lead to a major breakout in Thai stock performance. Indeed, the first hints of an improving economy often come from the status of order books. At present, middling order book figures do not imply that Thai stocks are on the cusp of a major rally (Chart 7). Chart 7Keep An Eye On Order Books For A Hint On A Sustainable Stock Rally
Keep An Eye On Order Books For A Hint On A Suatainable Stock Rally
Keep An Eye On Order Books For A Hint On A Suatainable Stock Rally
Chart 8Thai Profits Are Far Too Low Compared To Stock Prices
Thai Profits Are Far Too Low Compared To Stock Prices
Thai Profits Are Far Too Low Compared To Stock Prices
Notably, Thai share prices have outpaced corporate profits since 2012. The listed companies’ EPS in US dollar terms are still languishing at around the same level as they were a decade back. As such, multiples have steadily risen over the past 10 years, and stocks are not cheap (Chart 8). Provided that the policy rate is already close to zero (with little room to fall), any multiple expansion-based rally in Thai equities is also unlikely. In sum, for a new bull market to develop, this bourse needs a sustained rise in corporate profits. But given the macro backdrop, that kind of sustained earnings expansion will take more time to materialize. What About Policy Support? Fiscal policy in Thailand will remain tight. In its fiscal budget, the government plans to spend about 5.5% less this year (October 2021 – September 2022) than the year before. Actual fiscal expenditure is indeed contracting in nominal terms. The IMF estimates that the fiscal thrust in 2022 will be a significantly negative 3% of GDP (Chart 9). As for monetary policy, the policy rate is already very low at 0.5% since early 2020. Yet, it hasn’t helped much in terms of credit growth. Meanwhile, thanks to a sharp rise in commodity prices, headline CPI has surged past the central bank’s upper inflation target band. CPI-excluding sectors affected by energy and food prices, however, are still very low (Chart 10). The lingering softness in domestic demand, weak employment and muted wages also indicate that deflationary pressures are more dominant in the Thai economy than are inflationary pressures. As such, the central bank is unlikely to raise interest rates in the foreseeable future. Chart 9Thai Fiscal Policy Is Very Restrictive
Thai Fiscal Policy Is Very Restrictive
Thai Fiscal Policy Is Very Restrictive
Chart 10There Is No Genuine Inflation
There Is No Genuine Inflation
There Is No Genuine Inflation
In sum, fiscal policy will tighten considerably this year and there will be little change in monetary policy. Altogether, these factors do not herald a strong recovery. External Outlook Thailand’s external outlook has improved. One reason for that is the currency is now more competitive as it has cheapened significantly in real terms (Chart 11, top panel). For a small, open economy where external trade (exports + imports) makes up 100% of GDP, a competitive currency is a major positive. Right on cue, Thai export volumes, which have been falling for a decade relative to global and EM exports, appears to have bottomed (Chart 11, bottom panel). The country’s travel and tourism revenues are set to rise as well. Thailand has already relaxed various travel restrictions for foreign tourists and further relaxation will be in effect from April 1. The country hosted 40 million foreign tourists in 2019, earning about $60 billion in revenues. All this disappeared during the pandemic in the past two years, leading to a massive drop in the country’s services sector balance. In fact, those losses also pushed the Thai current account balance into deficit – even though the country’s goods balance held up well (Chart 12). Chart 11The Baht Has Cheapened Significantly In Real Terms, Improving Competitiveness
The Baht Has Cheapened Significantly In Real Terms, Improving Competitiveness
The Baht Has Cheapened Significantly In Real Terms, Improving Competitiveness
Chart 12With Easing Travel Restrictions, The Current Account Balance Will Improve
With Easing Travel Restrictions Current Account Balance Will Improve
With Easing Travel Restrictions Current Account Balance Will Improve
Going forward, even if a quarter of those lost revenues come back over the next year, that should be enough to push the current account and the balance of payments back into surplus. An improving balance of payments is a bullish development for the currency. Chart 13The Depreciation In The Baht Is Likely Over
The Depreciation In Baht Is Likely Over
The Depreciation In Baht Is Likely Over
All this means that the baht depreciation is likely over. It has fallen about 10% against the US dollar since February last year when we first recommended that investors short the baht (Chart 13). We sent a special alert on February 18 this year announcing the closing of this trade. Upgrade Domestic Bonds Chart 14Thai Domestic Bond Returns Are Highly Dependent On The Baht
Thai Domestic Bond Returns Are Highly Dependent On The Baht
Thai Domestic Bond Returns Are Highly Dependent On The Baht
Thai domestic bond returns in US dollar terms are highly contingent on the baht’s performance. Chart 14 shows that both have fallen materially over the past year. However, given that the baht has likely bottomed, Thai bonds’ total return in USD terms will get a boost from now on. The Thai currency could also be one of the more resilient currencies in EM going forward. Historically, the baht had tended to perform better than most other EM currencies during periods of global uncertainty. We are witnessing such a period in view of the rapidly rising US bond yields and the Ukraine crisis. A better-performing baht compared to other currencies would help boost Thai bonds’ total returns relative to other EM bonds. Notably, Thai bond yields have been falling relative to that of the GBI-EM (excluding Russia) index. This is reflecting the difference in the inflationary backdrop between Thailand and many other EM countries, especially in Latin America and EMEA. The relative yields, therefore, might fall further. Considering the above, we recommend that investors upgrade Thai domestic bonds from neutral to overweight in EM domestic bond portfolios (Chart 15). Relative to their Emerging Asian peers, we recommend a neutral allocation to Thai bonds. This is because inflationary pressures in Asia are very similar to those in Thailand. Meanwhile, Thai relative bond yields have already risen significantly versus their Emerging Asian counterparts since the height of the pandemic scare in early 2020. As such, the relative yield compression move is likely late (Chart 16, top panel). Considering that Thai bonds have already had a steep underperformance, and that the baht is also cheaper now, we recommend that investors upgrade Thai bonds to a neutral allocation in Emerging Asian portfolios (Chart 16, bottom panel). Chart 15Upgrade Thai Domestic Bonds To Overweight In An EM Bond Portfolio
Upgrade Thai Domestic Bonds To Overweight In An EM Bond Portfolio
Upgrade Thai Domestic Bonds To Overweight In An EM Bond Portfolio
Chart 16Upgrade Thai Domestic Bonds To Neutral In An Emerging Asian Portfolio
Upgrade Thai Domestic Bonds To Neutral In An Emerrging Asian Portfolio
Upgrade Thai Domestic Bonds To Neutral In An Emerrging Asian Portfolio
Investment Recommendations Currency: The baht has fallen about 10% in nominal terms over the past year or so. It has cheapened significantly in real terms also – which has enhanced the economy’s competitiveness. Going forward, prospects of an improving balance of payments means the Thai currency will be one of the more resilient ones in the EM. Stocks: A sustainable rise in Thai corporate profits is still some way off. But a much cheaper currency and an improving balance of payments will help. One should not chase the recent Thai outperformance. It had more to do with investors forsaking Chinese stocks en masse to pile on elsewhere in EM, including Thai equities. Chart 17 shows that the Thai bourse saw an unusual amount of foreign net purchases over the past month. Some of these inflows are at risk of unwinding in the months ahead. Instead, equity managers should put this market on an upgrade watchlist to move its allocation from the current neutral to overweight in EM and Emerging Asian portfolios. Chart 17Some Of The Recent Foreign Equity Inflows Are At Risk Of Unwinding
Some Of The Recent Foreign Equity Inflows Are At Risk Of Unwinding
Some Of The Recent Foreign Equity Inflows Are At Risk Of Unwinding
Domestic Bonds: Investors should upgrade Thai bonds from neutral to overweight in an EM basket, and from underweight to neutral in an Emerging Asian basket. Rajeeb Pramanik Senior EM Strategist rajeeb.pramanik@bcaresearch.com
Executive Summary Energy and National Security Will Drive the Market
Energy and National Security Will Drive the Market
Energy and National Security Will Drive the Market
Our 2022 key views are broadly on track. Biden’s shift from domestic to foreign policy is dominating the other views. However, Democrats still have a 65% chance of passing a reconciliation bill that will raise taxes to pay for green energy and prescription drug caps. Then gridlock will set in. The US is developing a new national consensus. Generational change is promoting the shift to proactive fiscal policy to address the country’s social unrest and rising foreign policy challenges. Polarization is still at peak levels in the short term but will fall over the coming decade as the US pursues “nation building” at home while confronting geopolitical rivals. The return of Big Government is being priced into the bond market today. But it will be Limited Big Government, as the sharp spike in inflation today will provoke a backlash. Recommendation Inception Level Inception Date Return Long Aerospace And Defense Vs. Broad Market (Cyclical) 30-Mar-22 Long Oil And Gas Transportation And Storage Vs. Broad Market (Cyclical) 30-Mar-22 Long Refinitive Renewable Energy Vs. Broad Market (Tactical) 30-Mar-22 Bottom Line: Investors dedicated to the US market should stay tactically defensive. Cyclically favor the new US policy consensus on national defense, infrastructure, cyber security, and energy security. Feature The title of our annual outlook was “Gridlock Begins Before The Midterms.” We argued that Biden would still have some room for legislative maneuver in the first half of 2022 but that checks and balances would grow as the year went on. Checks will grow due to (1) the looming midterm elections; (2) Biden’s falling political capital and need to rely on executive action; (3) rising foreign policy challenges. Of these, foreign policy has proven decisive, with Russia invading Ukraine and the US and Europe imposing economic sanctions. The resulting energy shock is adding to inflation, weighing on consumer confidence, stock market multiples, and investor sentiment (Chart 1). Having said that, we also argued that congressional Democrats still had enough political capital to pass a watered-down fiscal 2022 budget reconciliation bill before the scene of action shifted to the White House. The second quarter is the last chance for this prediction to come true – and we are sticking with our 65% odds. The reconciliation bill will be even more watered down than we expected. But the point is that fiscal policy – especially tax hikes – can still move markets in the second quarter, even though inflation, the Fed, and the war will have a bigger influence. Chart 1US Seeks National Security And Energy Security
US Seeks National Security And Energy Security
US Seeks National Security And Energy Security
Related Report US Political Strategy2022 Key Views: Gridlock Begins Before The Midterms The war in Europe is clearly the most important political, geopolitical, and policy dynamic for investors this year. It is prompting some important congressional action that speaks to Biden’s room for maneuver in the first half of the year. In so doing it reinforces our long-term themes of “Peak Polarization” and “Limited Big Government.” As Americans face rising foreign policy challenges, a new bipartisanship is emerging, particularly on industrial and trade policy. Checking Up On Our Three Key Views For 2022 Here are our three key trends for 2022 with comments about their development over the past three months: 1. From Single-Party Rule To Gridlock: We argued that the Biden administration would pass a watered-down reconciliation bill on a party-line vote by June at latest. Then Congress would grind to a halt for election campaigning, to be followed by Republicans taking one or both chambers of Congress, restoring gridlock and making it hard to pass major legislation from the second half of 2022 through 2024. This view is still generally on track. The basis for believing that a bill will still pass is that the Democrats are in trouble in the midterms and badly need a legislative victory. Public opinion polls suggest they face a beating reminiscent of President Trump and the Republicans in 2018 (Chart 2). Democrats trail Republicans in enthusiasm. Only about 45% of Democrats and 42% of Biden voters are enthusiastic to vote, while 50% of Republicans and 54% of Trump voters are enthusiastic. Men, who lean Republican, are more enthusiastic than women, by 51% to 38%, according to the pollster Morning Consult.1 With the economy and foreign policy rising as the most important issues of the election, Democrats have lost their key issues of health care and the pandemic. Notably Democrats have also lost ground on traditional strengths like education. However, the Ukraine war has put a new emphasis on energy security which Democrats are harnessing to repackage their climate agenda. Hence Democrats will make a last-ditch effort to pass a reconciliation bill before the summer campaigning gets under way. The “Build Back Better” plan was always going to be watered down but now it will be extensively revised. The bill will now have to be closer to neutral in its impact on the deficit so as not to feed inflation. Public opinion polls back in January, when the bill was primarily a social welfare bill, showed 61% of political independents in favor, not to mention 85% of Democrats. A majority of independents supported the bill even when asked about each provision separately and when the tax hikes were made plain.2 By halting progress on the left-wing version of the bill that the House of Representatives passed late last year, West Virginia Senator Joe Manchin saved his party from passing a highly stimulative fiscal bill in the middle of the biggest outbreak of inflation since the 1980s, when the output gap was virtually closed (Chart 3). Chart 2Democrats Not Faring Much Better Than Trump Republicans In 2018
Second Quarter Outlook: Gridlock Looms
Second Quarter Outlook: Gridlock Looms
Chart 3Output Gap Closed, No More Stimulus Needed
Output Gap Closed, No More Stimulus Needed
Output Gap Closed, No More Stimulus Needed
Now Manchin will face a “Build Back Slimmer” bill that will be harder to oppose when Congress comes back from Easter.3 Our research over the past year suggests that Manchin is likely to vote for a bill that meets his main demands. The bill will be crafted for his approval. Manchin supports corporate tax hikes, funding for green energy transition (as long as it is not punitive toward certain sources or technologies), and a cap on prescription drug costs.4 Tax hikes, such as a minimum 15% corporate tax rate on book earnings, will be included, albeit diluted from the original proposals. Most investors have forgotten about the risk of tax hikes altogether so stock investors may not be happy that the US is hiking taxes amid inflation. Earnings estimates for the year are not reflecting any negative news, whether energy shock, or weak consumer confidence, or new taxes (Chart 4). If the bill fails to pass, equity investors may well cheer, since they are worried about inflation rather than deflation and the bill will not truly be deficit-neutral. Chart 4Inflation, War, Potentially Tax Hikes Will Weigh On Earnings Estimates
Inflation, War, Potentially Tax Hikes Will Weigh On Earnings Estimates
Inflation, War, Potentially Tax Hikes Will Weigh On Earnings Estimates
Given Democrats’ thin majorities in both houses (222 versus 210 seats in the House and 50 versus 50 seats in the Senate), a single defection in the Senate can derail the bill, so we cannot have high conviction that it will pass. We are sticking with our 65% subjective odds. Passage of a reconciliation bill will slightly help Democrats’ fortunes ahead of the midterm but Republicans are still highly likely to win at least the House of Representatives. So the transition to gridlock will still occur. Only very rarely do ruling parties gain seats in the midterms. Biden’s loss of support among women voters is a tell-tale sign that trouble looms, as was the case for the Obama administration at this stage in its first term (Chart 5). The implication for financial markets is that the budget reconciliation bill will bring a negative surprise in the form of tax hikes that will weigh on bullish or pro-cyclical sentiment in the second quarter, at least marginally. Chart 5Women Like Biden Less Than Obama, Who Suffered Midterm Losses
Second Quarter Outlook: Gridlock Looms
Second Quarter Outlook: Gridlock Looms
Chart 6Biden's Energy Shock
Biden's Energy Shock
Biden's Energy Shock
2. From Legislative To Executive Power: Similarly we anticipated a transition from legislative action to executive action over the course of 2022. After the budget reconciliation bill is decided, the president will have to rely on executive action to achieve any policy goals. We expected this trend to derive from Biden’s regulatory aims as well as from the need to respond to rising geopolitical challenges, especially the energy shock (Chart 6). This shock is the single biggest reason for the market consensus that Democrats will lose Congress this year. The chief equity sector winner was the energy industry, as we expected. Now Biden needs to encourage rather than discourage supply. Until Biden decides whether to lift sanctions on Iran, volatility will prevail in energy markets. But Biden will condone domestic energy production, with a view to alleviating shortages prior to 2024. He will abandon his left wing and adopt the Obama administration’s permissiveness toward domestic energy, which will help oil and natural gas rig counts to rise (Chart 7). Renewable energy policy will gain traction as it will now clearly be seen in the context of national security and energy security. It also combines trade policy with national security in the form of exports to allies. The US now has a free pass to help Europe diversify away from Russian energy. Not that the US can replace Russia but merely that it can make a dent in both oil and liquefied natural gas (Chart 8). Subsidies for green energy are still likely but not a carbon tax or punitive measures toward the fossil fuel industry. Chart 7Biden Revives Obama Truce With O&G
Biden Revives Obama Truce With O&G
Biden Revives Obama Truce With O&G
Chart 8US Helps Europe Diversify Away From Russia
Second Quarter Outlook: Gridlock Looms
Second Quarter Outlook: Gridlock Looms
3. From Domestic To Foreign Policy: We fully expected Biden to be forced to pay attention to foreign affairs in 2022, despite his desire to focus on the voter ahead of midterms. We argued that he would maintain a defensive or reactive foreign policy since he would not want to create higher inflation ahead of the midterms and yet oil producers like Russia or Iran would go on offensive due to energy shortage. While Biden has imposed harsh sanctions on Russia, we still define his foreign policy as defensive rather than offensive. First, Biden is reacting to a Russian attack and will not sabotage a ceasefire. Second, Biden is carving out exceptions to US sanctions rather than disciplining or coercing allies into adopting US policy. The administration’s chief foreign policy aim is to refurbish US alliances. Hence the US condones the EU’s continued energy imports from Russia, thus ensuring that Russian energy makes it into the global market, unless the Russians cut natural gas exports (Chart 9). Nevertheless a risk to our view is that Biden will start to adopt a more offensive foreign policy, especially if Democrats are floundering ahead of the midterms. He could turn more aggressive about sanction enforcement if Russia starts bombarding Kyiv again. Or he could slap broad sanctions on China for helping Russia bypass sanctions. To be clear, we fully expect secondary sanctions on China, based on US record of doing so, but we expect them to be targeted rather than broad (Table 1). Chart 9Russian Energy Still Reaches Global Market
Russian Energy Still Reaches Global Market
Russian Energy Still Reaches Global Market
Table 1US Will Slap China With Sanctions Over Russia – Sooner Or Later
Second Quarter Outlook: Gridlock Looms
Second Quarter Outlook: Gridlock Looms
Foreign policy will define US politics and policy in 2022. What matters for markets is whether the energy supply shock gets worse as a result of Biden’s handling of Russia and Iran. A worse energy shock will amplify stock market volatility. On one hand, if Biden suffers a humiliating foreign policy defeat, it will reinforce the negative trends for Democrats in the 2022-24 cycle. Since Republicans, especially former President Trump, would be expected to pursue an offensive rather than defensive foreign and trade policy (e.g. toward Iran’s nuclear program and China’s economy), global economic policy uncertainty would rise and investor risk appetite would fall in this situation (Chart 10). On the other hand, investors will be surprised if Biden achieves a remarkable domestic or foreign policy success that boosts Democrats’ odds in 2022. An early ceasefire in Ukraine combined with a reconciliation bill would give Biden and Democrats a boost. Global policy uncertainty might rise anyway but it would not be super-charged and it would be flat-to-down relative to US policy uncertainty. Democrats could conceivably retain control of the Senate in the latter case. Our quantitative election model says Democrats have a 49% chance of retaining the Senate (Chart 11). This means the election is too close to call, though subjectively we would agree with the model and bet on the Republicans since they only need to gain one seat on a net basis. The model shows Georgia and Arizona flipping back to the Republican side. If the economy and opinion polling improve between now and November, the swing states will see higher probabilities of Democrats staying in power but the model is trending against Democrats and shows their odds of victory falling in every state. Chart 10US Political Outlook Affects Relative Policy Uncertainty
US Political Outlook Affects Relative Policy Uncertainty
US Political Outlook Affects Relative Policy Uncertainty
Chart 11Senate Race Too Close To Call, But Quant Model Now Tips Republicans
Second Quarter Outlook: Gridlock Looms
Second Quarter Outlook: Gridlock Looms
Anything that pares Democrats’ expected losses in Congress will cause US economic policy uncertainty to rise since it goes against the consensus view. Moreover if Republicans only win the House, they will be obstructionist and disruptive in 2023-24, whereas if they win all of Congress they will have to produce bills and try to compromise with Biden. Thus a Republican House but Democratic Senate would imply an increase in policy uncertainty. By contrast, anything that hurts the Democrats will reinforce current expectations and imply that tax hikes might fail, or that they will freeze after the reconciliation bill, which would be marginally positive for US equity investors in an inflationary context. Bottom Line: Democrats still have a 65% subjective chance of passing a reconciliation bill that raises taxes. Investors should favor defensives over cyclicals. Checking Up On Our Strategic Themes For The 2020s Our central long-term thesis is that generational change, social instability, and foreign policy threats are generating a new national consensus in the United States, particularly on economic policy. Hence US political polarization is peaking in the short run and will decline over the long run. The new consensus rests on proactive fiscal policy and a larger government role in the economy to reduce social unrest and improve national security. Table 2 shows our three strategic US political themes. The past year’s inflation surge and the Ukraine war will affect these themes, so we make the following points: Table 2US Political Strategy Structural Themes
Second Quarter Outlook: Gridlock Looms
Second Quarter Outlook: Gridlock Looms
1. Millennials/Gen Z Rising: Labor market participation is recovering rapidly from the pandemic. However, workers older than 55 years are not rejoining rapidly, implying that retirees are staying retired and not yet chasing rising wages. Prime age women, however, are rejoining the work force, in a sign that as kids get back to school mothers can return to work (Chart 12). The implication is that the labor shortage will continue for the foreseeable future due to the generational transition but not due to any shift toward traditional values or lifestyles among young women. 2. Peak Polarization: Polarization has fallen after the 2020 election, as expected, but will likely stay at or near peak levels over the 2022-24 election cycle (Chart 13). Chart 12Generational Shift Evident In Labor Participation
Generational Shift Evident In Labor Participation
Generational Shift Evident In Labor Participation
Chart 13Polarization Near Peak Levels But Will Fall Over Long Run
Polarization Near Peak Levels But Will Fall Over Long Run
Polarization Near Peak Levels But Will Fall Over Long Run
For example, Biden’s reconciliation bill will feed polarization in 2022, since it can only pass on a party-line vote. But its tax and spending programs will have majority support, will redirect funds from corporations that pay low effective tax rates toward corporations that provide renewable energy solutions. Domestic manufacturing will benefit. Another example: Another Biden-Trump showdown in 2024 will fuel polarization but 2024 or 2028 and subsequent elections will see fresh faces with updated policy platforms. The merging of trade protectionism and renewable energy exemplifies the new policy evolution. Again, with polarization at historic levels, domestic terrorism of whatever stripe is a pronounced risk in 2022 and the coming years. But any significant political violence will ultimately drive a new national consensus in favor of federalism. 3. Limited Big Government: The story of the 2000s and 2010s was the revival of Big Government, first in the George W. Bush national security state, then in the Barack Obama liberal spending tradition, then in the big spending Republican tradition with Trump, and finally in the liberal tradition again with Biden. The combination of popular discontent at home and great power struggle abroad means that the US is unlikely to slash either social programs or defense spending. As for tax hikes, aggressive tax hikes are impractical. Biden may pass some tax hikes but the budget deficit will continue to expand over the long run (Chart 14). At the same time, the shift to Big Government is occurring with an American context. The geography, constitution, and political system militate against centralization. The return of inflation means that fiscal conservatism will also make a comeback, starting with Republicans in the House in 2023, who will oppose new spending as a standard opposition tactic. So while Big Government has returned, and bond investors are pricing this sea change by pushing up Treasury yields, nevertheless the market will also need to price the fact that the growth of government still faces structural limits. Chart 14Reconciliation Bill Will Have Miniscule Impact On Budget Outlook
Second Quarter Outlook: Gridlock Looms
Second Quarter Outlook: Gridlock Looms
These structural themes face crosswinds in 2022. The Millennials and younger generations will not carry the day in the midterm election – the Baby Boomers and Greatest Generation will. Peak polarization will bring negative surprises for investors over the 2022-24 election cycle and potentially even in 2024-28 if Trump is reelected. A Democratic reconciliation bill will expand government programs in 2022, while Republicans will revert to big spending ways if they gain full control of government again in 2025. Nevertheless the evidence suggests that generational change, peak polarization, and limited big government will prevail over time. The younger generations favor more proactive fiscal policy. Fiscal policy will address social unrest and geopolitical threats. But big government will drive inflation, which will in turn force voters to impose limits on government over the long run. Bottom Line: The US will opt to inflate away its debt over the long run – but it will also need growth and some structural reform once the ills of inflation become fully absorbed by voters. The huge bout of inflation in 2022 is only the beginning of this political process, though it will also accelerate the process. Investment Takeaways Stocks tend to be flattish ahead of midterm elections. This includes elections when a united government becomes gridlocked as is likely in 2022-23. Equities tend to perform better after election uncertainty passes. The transition from single-party government to gridlock also tends to imply higher yields until after the election is over, at which point yields decline (Chart 15). Single-party governments can manipulate fiscal policy to try to stay in power. Chart 15Stocks Tend To Be Flat, Bond Yields High, Until After Midterm Elections
Stocks Tend To Be Flat, Bond Yields High, Until After Midterm Elections
Stocks Tend To Be Flat, Bond Yields High, Until After Midterm Elections
Defensives are outperforming cyclicals on slowing growth, rising interest rates, rising labor costs and energy prices, and rising uncertainty. Our worst call for Q1 was our tactical long growth over value stocks. We made this trade knowing it went against our strategic approach, which has favored value over growth since we launched the US Political Strategy in January 2021. Our reasoning was that a geopolitical crisis would cause a temporary spike in energy prices but a longer drop in bond yields. In fact bond yields rose anyway. We still think tech is increasingly attractive, especially after the corporate minimum tax passes. The brief inversion of the 2-year/10-year yield curve suggests the US economy is flirting with recession. Other parts of the curve are not yet confirming this signal and there can be a long lead time between inversion and recession. However, there is not yet a ceasefire in Ukraine and certainly not a durable ceasefire. The US and Iran do not yet have a deal to avoid a major increase in geopolitical tensions. The risk of a bigger energy shock from Russia or Iran or both is significant and could shorten the cycle. We recommend going strategically long S&P 500 oil and gas transportation and storage relative to the broad market. We also recommend taking advantage of the lull in fighting in Ukraine to join our Geopolitical Strategy in going strategically long US defense stocks relative to the broad market. Tactically we recommend going long renewable energy since the Democrats’ pending reconciliation bill will benefit from broader public recognition of the need for the energy security of both the US and its allies (Chart 16). Chart 16Go Long Defense, Energy Storage, And Renewables
Go Long Defense, Energy Storage, And Renewables
Go Long Defense, Energy Storage, And Renewables
Matt Gertken Senior Vice President Chief US Political Strategist mattg@bcaresearch.com Footnotes 1 See “National Tracking Poll,” Morning Consult and Politico, #2202029, February 5-6, 2022, assets.morningconsult.com. 2 Admittedly this poll is by a left-leaning organization but polling throughout 2021 supports the general conclusion that a majority of political independents support the key proposals. See Anika Dandekar and Ethan Winter, “Majority of Voters Still Want the Build Back Better Act Passed,” Data for Progress, January 4, 2022, dataforprogress.org. 3 See Nick Sobczyk and Nico Portuondo, “Democrats eye ‘Build Back Slimmer’ on reconciliation,” E&E News, March 24, 2022, eenews.net. 4 See Eugene Daniels, “The Left Gears Up to Take on Manchin Again,” Politico, March 29, 2022, politico.com. See also “Regan, McCarthy, Wyden talk revival of BBB,” The Fence Post, March 25, 2022, thefencepost.com. Strategic View Open Tactical Positions (0-6 Months) Open Cyclical Recommendations (6-18 Months) Table A2Political Risk Matrix
Second Quarter Outlook: Gridlock Looms
Second Quarter Outlook: Gridlock Looms
Table A3US Political Capital Index
Second Quarter Outlook: Gridlock Looms
Second Quarter Outlook: Gridlock Looms
Chart A1Presidential Election Model
Second Quarter Outlook: Gridlock Looms
Second Quarter Outlook: Gridlock Looms
Chart A2Senate Election Model
Second Quarter Outlook: Gridlock Looms
Second Quarter Outlook: Gridlock Looms
Table A4APolitical Capital: White House And Congress
Second Quarter Outlook: Gridlock Looms
Second Quarter Outlook: Gridlock Looms
Table A4BPolitical Capital: Household And Business Sentiment
Second Quarter Outlook: Gridlock Looms
Second Quarter Outlook: Gridlock Looms
Table A4CPolitical Capital: The Economy And Markets
Second Quarter Outlook: Gridlock Looms
Second Quarter Outlook: Gridlock Looms
Executive Summary China’s Business Cycle Has Not Bottomed
China's Business Cycle Has Not Bottomed
China's Business Cycle Has Not Bottomed
Recent data showed a substantial improvement in the economy in the first two months of the year. However, the optimism is not well supported by other industry and high-frequency data. China’s exports were resilient, while infrastructure investment also rebounded sharply on the back of front-loaded fiscal stimulus. Nonetheless, domestic demand in China remains in the doldrums. Housing market indicators show a further deterioration in home sales and prices in January and February. Consumption in tourism during the Chinese New Year and service sector activities were also weaker compared with the same period last year. While we expect policymakers to roll out more measures to shore up domestic demand, China’s economy will likely have a choppy bottom in the first half of 2022. We maintain our neutral position on Chinese onshore stocks in a global portfolio. In absolute terms, we are cautious and are looking for a better price entry point in Q2. Bottom Line: Economic data in the first two months of the year sent mixed signals, which suggests that China’s economy has not reached a solid bottom. Feature Newly released economic data from January and February (i.e. industrial production, fixed-asset investment, retail sales and property investment) all generated sizable positive surprises. However, other industry and high-frequency data sent conflicting messages. The improvement in China’s total social financing (TSF) in the past few months has been due to local government (LG) bond issuance (Chart 1). Corporate credit showed little advancement, while household loans were extremely weak (Chart 2). In addition, further contracting home sales paint a bleak picture of housing demand. Soft readings in the service sector Purchasing Managers' Index (PMI) and core consumer price index (CPI) suggest that consumption remains sluggish. Chart 1The Credit Impulse Continued To Trend Down (Excluding LG Bond Issuance)
The Credit Impulse Continued To Trend Down (Excluding LG Bond Issuance)
The Credit Impulse Continued To Trend Down (Excluding LG Bond Issuance)
Chart 2No Improvement In Corporate Or Household Demand For Credit
No Improvement In Corporate Or Household Demand For Credit
No Improvement In Corporate Or Household Demand For Credit
Beijing is stepping up its pro-growth stimulus, particularly on the fiscal front. However, the country will unlikely undergo a strong recovery in its business cycle without a major reversal in the housing market and an improvement in demand from the private sector. Moreover, recent lockdowns to tame surging domestic COVID-19 cases amid China’s zero-tolerance pose major downside risks to the near-term economic outlook. Chinese equities sold off in response to lockdown news despite the release of better economic data earlier this month, highlighting investors’ weak sentiment. Chart 3China's Business Cycle Has Not Bottomed
China's Business Cycle Has Not Bottomed
China's Business Cycle Has Not Bottomed
We maintain our neutral view on China’s onshore stocks relative to their global peers, but we are cautious on Chinese equities in absolute terms. On a cyclical time horizon (6 to 12 months), there are increasing odds that Chinese policymakers will stimulate the economy more aggressively, particularly in the 2nd half of the year. However, it is too early to turn bullish on Chinese equities (Chart 3). The ongoing war in Ukraine and elevated oil prices, coupled with risks of further lockdowns in China and a prolonged downturn in domestic demand, present significant near-term risks to the performance of Chinese equities. Investors should closely watch for more reflationary efforts from Beijing and we believe a better entry point to upgrade Chinese stocks may emerge in Q2. Qingyun Xu, CFA Associate Editor qingyunx@bcaresearch.com Near-Term Outlook For The Housing Market Remains Bleak Real estate investment growth in January-February was surprisingly strong, according to data from China’s National Bureau of Statistics. However, headline growth in real estate investment deviates from the continued weaknesses in other housing market indicators (Chart 4). In addition, data on the production of some key construction materials showed little improvement (Chart 5). Chart 4Conflicting Signals From The January-February Housing Market Indicators
Conflicting Signals From The January-February Housing Market Indicators
Conflicting Signals From The January-February Housing Market Indicators
Chart 5Data On Building Materials Also Deviate From Strong Investment Growth In Real Estate
Data On Building Materials Also Deviate From Strong Investment Growth In Real Estate
Data On Building Materials Also Deviate From Strong Investment Growth In Real Estate
Demand for housing remains lackluster. February’s medium- to long-term household loan growth, which is mainly mortgage loans and is highly correlated with home sales, plunged to an all-time low (Chart 6). Meanwhile, the deep contraction in home sales growth continued in February, and sentiment among home buyers remains downbeat (Chart 6, bottom panel) Chart 6Demand For Housing Remains In The Doldrums
Demand For Housing Remains In The Doldrums
Demand For Housing Remains In The Doldrums
Chart 7Policymakers Are Trying To Avoid Further Inflating The Housing Price Bubble
Policymakers Are Trying To Avoid Further Inflating The Housing Price Bubble
Policymakers Are Trying To Avoid Further Inflating The Housing Price Bubble
Although authorities have reiterated that they want to stabilize the property market, the policy measures have been only fine-tuned. Regional governments have been allowed to initiate their own housing policies and some cities have eased processes for home purchases.1 However, given that maintaining stable home prices is an overarching goal and China’s leadership is trying to avoid further inflating the home price bubble, it is doubtful that the government will allow significant re-leveraging in the property market (Chart 7). Chart 8 shows that funds to real estate developers have slowed to the lowest level since 2010, which will further dampen housing construction. Chart 8Housing Construction Activities Will Weaken Further In 1H22
Housing Construction Activities Will Weaken Further In 1H22
Housing Construction Activities Will Weaken Further In 1H22
Chart 9The Latest Spike In Domestic COVID Cases Will Weigh On Home Sales
The Latest Spike In Domestic COVID Cases Will Weigh On Home Sales
The Latest Spike In Domestic COVID Cases Will Weigh On Home Sales
Moreover, high-frequency floor space sold data shows a broad-based decline in housing sales in tier-one, two and three cities through mid-March (Chart 9). The latest spike in China’s domestic COVID-19 cases and regional lockdowns will likely weigh on home sales in the short term. Property investment and construction will remain at risk without a decisive rebound in home sales. A Disrupted Recovery In Household Consumption Both retail and online sales of consumer goods held up better than expected in January and February (Chart 10). However, the subdued underlying data highlight that the strong reading in retail sales in the first two months of the year may be less than meets the eye. Chart 10Although Growth In Retail Sales Rebounded In January-February...
Although Growth In Retail Sales Rebounded In January-February...
Although Growth In Retail Sales Rebounded In January-February...
Chart 11...Service Sector Activities Still Struggle To Return To Pre-Pandemic Levels
...Service Sector Activities Still Struggle To Return To Pre-Pandemic Levels
...Service Sector Activities Still Struggle To Return To Pre-Pandemic Levels
Service sector and passenger activities are still well below their pre-pandemic levels, two years after the first COVID lockdowns in early 2020 (Chart 11). Consumption in tourism during the Chinese New Year holiday was weaker than last year. Households’ propensity to spend also showed few signs of rebounding (Chart 12 & 13). Chart 12Travel Consumption Was Weak During The Chinese New Year
Travel Consumption Was Weak During The Chinese New Year
Travel Consumption Was Weak During The Chinese New Year
Chart 13Households’ Propensity To Consume Continues To Trend Down
Households' Propensity To Consume Continues To Trend Down
Households' Propensity To Consume Continues To Trend Down
Furthermore, both core and service CPI weakened in February, reflecting lackluster demand from consumers (Chart 14). Labor market dynamics have also worsened and the unemployment rate, particularly among young workers, has risen rapidly since the beginning of the year (Chart 15). Chart 14Weak Core And Service CPIs In February Suggest Lackluster Household Demand
Weak Core And Service CPIs In February Suggest Lackluster Household Demand
Weak Core And Service CPIs In February Suggest Lackluster Household Demand
Chart 15Labor Market Situation Is Worsening
Labor Market Situation Is Worsening
Labor Market Situation Is Worsening
The ongoing fight against mounting new COVID cases in China will likely drag down service sector activities in the coming months (Chart 16A & 16B). Importantly, the new round of lockdowns and mobility restrictions are primarily in busier and more developed coastal metropolitans, such as Shenzhen and Shanghai. Therefore, the negative impact from social activity restrictions will be more substantive compared with previous lockdowns. Chart 16AEscalating New Cases In China Will Constrain Domestic Consumption
Escalating New Cases In China Will Constrain Domestic Consumption
Escalating New Cases In China Will Constrain Domestic Consumption
Chart 16BEscalating New Cases In China Will Constrain Domestic Consumption
Escalating New Cases In China Will Constrain Domestic Consumption
Escalating New Cases In China Will Constrain Domestic Consumption
Strong Rebound In Manufacturing Investment Growth In January-February Probably Not Sustainable A strong rebound in the growth of manufacturing investment helped to support overall fixed-asset investment in the first two months of the year (Chart 17). Robust external demand for China’s manufacturing goods has likely contributed to the pickup in manufacturing output and helped to sustain Chinese manufacturers’ near-maximum capacity (Chart 18). Chart 17Strong Pickup In Manufacturing Investment Growth
Strong Pickup In Manufacturing Investment Growth
Strong Pickup In Manufacturing Investment Growth
Chart 18Robust Exports Support Chinese Manufacturing Output And Capacity Utilization
Robust Exports Support Chinese Manufacturing Output And Capacity Utilization
Robust Exports Support Chinese Manufacturing Output And Capacity Utilization
While the volume of manufacturing output increased, prices that producers charge consumers have rolled over (Chart 19). Historically, prices have been more important in driving corporate profits than the volume of output. In addition, a strong RMB and sharply climbing shipping costs will also weigh on Chinese exporters’ profitability (Chart 20). Chart 19Manufacturing Output Picked Up While Prices Rolled Over
Manufacturing Output Picked Up While Prices Rolled Over
Manufacturing Output Picked Up While Prices Rolled Over
Chart 20Strong RMB And Rising Shipping Costs Will Reduce Chinese Exporters' Profitability
Strong RMB And Rising Shipping Costs Will Reduce Chinese Exporters' Profitability
Strong RMB And Rising Shipping Costs Will Reduce Chinese Exporters' Profitability
Chart 21Manufacturing Sector's Profit Margins Will Be Further Squeezed
Manufacturing Sector's Profit Margins Will Be Further Squeezed
Manufacturing Sector's Profit Margins Will Be Further Squeezed
The elevated prices of oil and global industrial metals will continue to disproportionally benefit upstream industries, which are mainly composed of commodity producers. Meanwhile, the manufacturing sector’s profit margins will be squeezed by rising input costs and sluggish final demand (Chart 21). Chinese manufacturers’ profit growth will likely weaken through 1H22 and the downtrend may be exacerbated by the ongoing struggle to contain COVID cases. The impact from recent lockdowns in the northern city of Jilin (an auto production center), Shenzhen (a high-tech manufacturing production and export hub), and Shanghai (a city with major ports and a key logistics provider) will disrupt China’s manufacturing production and curb investment in the near term. Infrastructure Sector Will Remain A Bright Spot Through 1H22 Related Report China Investment StrategyAiming High, Lying Low Infrastructure investment staged a strong recovery in January-February on the back of front-loaded fiscal stimulus (Chart 22). LG bond issuance started to accelerate last November and will boost both traditional and new-economy infrastructure spending at least through 1H22. Our calculations suggest that fiscal thrust will rise to more than 2% of GDP this year, a sharp reversal from last year’s negative impulse of 2% (Chart 23). Chart 22Fiscal Stimulus Is At Work
Fiscal Stimulus Is At Work
Fiscal Stimulus Is At Work
Chart 23Fiscal Thrust In 2022 Could Reach More Than 2% Of GDP
Fiscal Thrust In 2022 Could Reach More Than 2% Of GDP
Fiscal Thrust In 2022 Could Reach More Than 2% Of GDP
Chart 24Subdued Shadow Bank Activities Will Limit The Magnitude Of Rebound In Infrastructure Investment
Subdued Shadow Bank Activities Will Limit The Magnitude Of Rebound In Infrastructure Investment
Subdued Shadow Bank Activities Will Limit The Magnitude Of Rebound In Infrastructure Investment
However, shadow bank activity, which historically had a tight correlation with infrastructure investment, remains downbeat (Chart 24). February’s reading of shadow bank credit was extremely weak, highlighting that local governments still face constraints in off-balance sheet leveraging through local government financing vehicles (LGFVs). The trend in shadow bank loans bears close attention in the coming months because it will signal whether the central government will allow more backdoor financing to help local governments fund their infrastructure projects. A continued soft reading in shadow bank activities will likely limit the upside in infrastructure investment growth. Table 1China Macro Data Summary
A Choppy Bottom
A Choppy Bottom
Table 2China Financial Market Performance Summary
A Choppy Bottom
A Choppy Bottom
Footnotes 1 Guangzhou lowered its down-payment ratio from 30% to 20%, along with a 20bp cut in mortgage rates. Zhengzhou marginally relaxed home purchase restrictions by allowing families who bring elderly relatives to live in the city to buy one extra home and also lifted the “definition of second home ownership by physical unit & mortgage history”. Strategic Themes Cyclical Recommendations
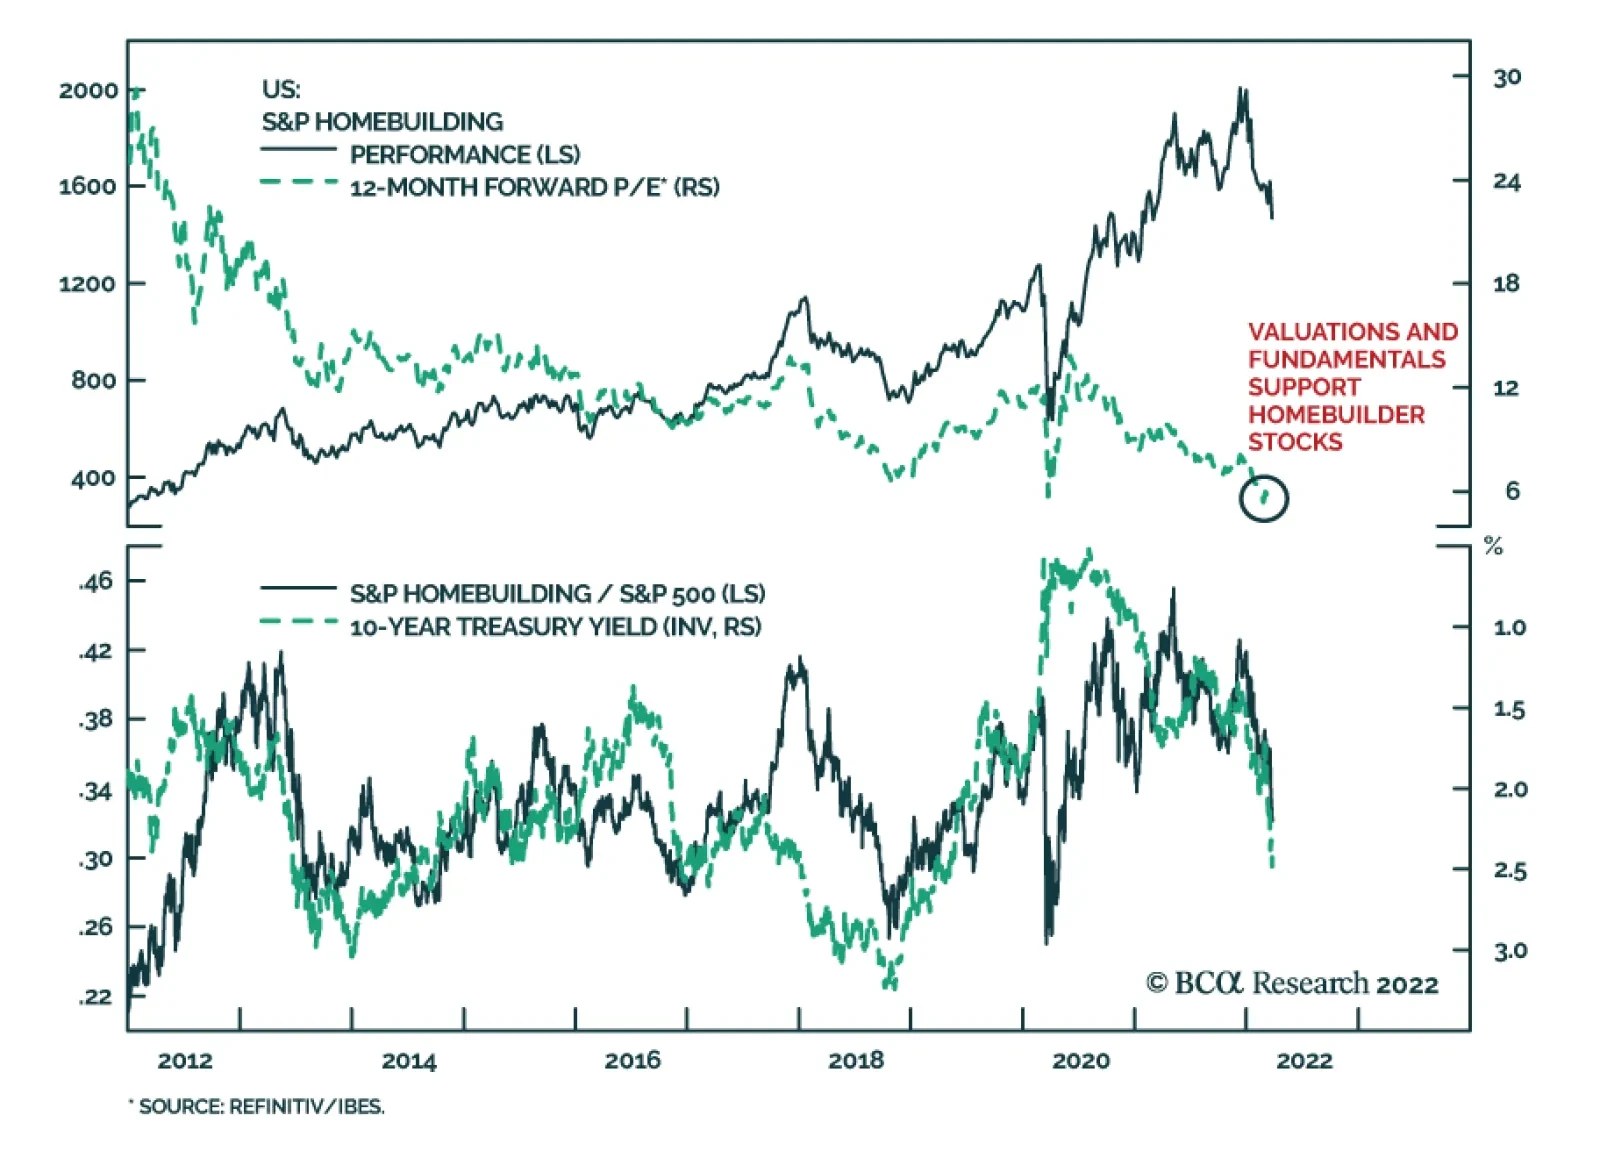
US Homebuilder stocks have had a poor start to the year. They are down 26% since the beginning of 2022 and are underperforming the S&P 500 by 22%. The sharp increase in interest rates over this period explains why homebuilders have performed so badly.…
Executive Summary An inverted yield curve is a reliable recession indicator. Inversions of the 3-month/10-year Treasury slope and the 3-month/3-month, 18-months forward slope both provide more timely recession signals than inversion of the 2-year/10-year Treasury slope. An inverted yield curve is a reliable equity bear market indicator. Even when it’s not signaling a recession, the yield curve’s movements offer some insight into equity returns as stocks have consistently performed better while it is flattening than they have when it is steepening. The 2-year/10-year Treasury slope embeds useful information for corporate bond excess returns. Corporates perform best when the slope is very steep and worst when it is very flat and/or inverted. Treasury securities generally outperform cash when the yield curve is either very steep or inverted. The one exception is the early-1980s when the Fed continued to tighten aggressively even after an inversion of the yield curve. Different Slopes Are Sending Different Signals
Different Slopes Are Sending Different Signals
Different Slopes Are Sending Different Signals
Bottom Line: The overall message from the yield curve is that, while the economic recovery is no longer in its early stages, it is premature to talk about a recession. On a 6-to-12 month investment horizon, investors should overweight equities in multi-asset portfolios. Within US bond portfolios, investors should maintain a neutral allocation to investment grade corporate bonds and keep portfolio duration close to benchmark. Feature It’s a well-known maxim in macro-finance that an inverted yield curve signals a recession. While that adage embeds a lot of truth, it is also sufficiently vague that it raises more questions than it answers. How far in advance does an inverted yield curve signal a recession? What specific yield curve segment sends the most helpful signal? And most importantly, does the yield curve tell us anything useful about the future performance of financial assets? These sorts of questions are particularly relevant today as we observe some sections of the yield curve approaching inversion while others make new highs (Chart 1). Chart 1Different Slopes Are Sending Different Signals
Different Slopes Are Sending Different Signals
Different Slopes Are Sending Different Signals
This Special Report explains how to think about the slope of the US Treasury curve as an indicator for the economy and financial markets. We first examine the yield curve’s empirical track record as a recession indicator. We then consider what the slope of the yield curve tells us about future equity, corporate bond and Treasury returns. The analysis presented in this report focuses on three different measures of the yield curve slope: The 2-year/10-year Treasury slope, the 3-month/10-year Treasury slope and the spread between the 3-month T-bill rate and the 3-month T-bill rate, 18 months forward. That last spread measure is less commonly cited, but Fed research has shown it to be a reliable predictor of recession.1 It was also recently highlighted by Fed Chair Jerome Powell.2 In the remainder of this report we will refer to the 3-month/3-month, 18-month forward spread as the “Fed Slope”. The Yield Curve & Recession Recession forecasting is a tricky business. It is often not so much a question of identifying “good” and “bad” recession indicators, but a question of balancing lead time and reliability. Recession indicators derived from financial market prices tend to offer greater advance warning of recession but also provide more false signals. On the flipside, indicators derived from macroeconomic data tend to give less lead time but with fewer false signals. Typically, the most useful recession indicators involve some combination of financial market and economic data. For example, a 2018 report from our US Investment Strategy service showed that a useful recession indicator can be created by combining the 3-month/10-year Treasury slope and the Conference Board’s Leading Economic Indicator.3 The Treasury slope’s reputation as an excellent recession indicator is justified because, despite it being derived from volatile financial market data, an inversion of the yield curve provides a very reliable recession signal. The 2-year/10-year Treasury slope has inverted in advance of 7 of the past 8 recessions and has not sent a false signal.4 The 3-month/10-year Treasury slope has done even better, calling 8 out of the past 8 recessions without a false signal. The Fed Slope, meanwhile, has also called 8 out of the past 8 recessions, but it sent one false signal in September 1998. There is room to quibble about the usefulness of the yield curve as a recession indicator in terms of lead time. The 2-year/10-year Treasury slope has, on average, inverted 15.9 months before the start of the next recession (Table 1). This inversion has always occurred before the first Fed rate cut of the cycle, and in all but one instance (1973-75), before the peak in the S&P 500. Table 1Lead Times For Yield Curve Segments, Equity Bear Markets And Fed Rate Cuts
The Yield Curve As An Indicator
The Yield Curve As An Indicator
But while some advance warning is good, the 2-year/10-year slope probably gives too much lead time. For example, the 2-year/10-year slope inverted a full 24 months before the 2007-09 recession, but it would have been unwise to act on that information since the S&P 500 didn’t peak for another 22 months! The historical record shows that the 3-month/10-year Treasury curve and the Fed Slope offer more useful signals than the 2-year/10-year curve. On average, these curves provide less lead time than the 2-year/10-year slope but still generally provide advance warning of recession and stock market peaks. The recession signal from the 3-month/10-year slope has only missed the peak in the S&P 500 twice. The signal from the Fed Slope has only missed the stock market’s peak once, but it also sent one false signal. Synthesizing all this information, we conclude that the 3-month/10-year Treasury curve and the Fed Slope are both highly reliable recession indicators that typically provide more than enough advance warning for equity investors to adjust their positions. The main value of the 2-year/10-year Treasury curve is that its inversion warns that we may soon get a timelier signal from the 3-month/10-year Treasury slope and the Fed Slope. Looking at the present situation, the 2-year/10-year Treasury slope has flattened dramatically during the past few months, but at 18 bps it remains un-inverted. Meanwhile, the 3-month/10-year Treasury slope and the Fed Slope are both elevated at 195 bps and 255 bps, respectively. We can conclude from this that recession warnings are premature. We will become more concerned about an upcoming recession when the 3-month/10-year slope and the Fed Slope approach inversion. The Yield Curve & Equity Returns Identifying a recession and demarcating its beginning and ending dates may seem like a trivial exercise that has little practical import. Celebrated mutual fund manager Peter Lynch has repeatedly offered the opinion that any time an equity investor spends thinking about the economy is wasted time. We beg to differ. Equity bear markets reliably coincide with recessions (Chart 2) – since the late 1960s, only one recession has occurred without a bear market (the first leg of the Volcker double dip from January to July 1980) and only one bear market has occurred without a recession (October 1987’s Black Monday bear market) – and an asset allocator who reduced equity exposure upon receiving advance notice of recessions would have been in a position to generate significant alpha. Chart 2Recessions And Bear Markets Tend To Coincide
Recessions And Bear Markets Tend To Coincide
Recessions And Bear Markets Tend To Coincide
The relationship between equity returns and the business cycle is not happenstance – variation in stock prices correlates closely with variation in corporate earnings and corporate earnings growth is a function of the business cycle. Equity prices, P, are simply the product of earnings per share, E, and the multiple investors are willing to pay for them, P/E: P = E x (P/E). If we hold somewhat fickle P/E multiples constant, stock prices will rise and fall with earnings. Given that earnings rarely decline outside of recessions (Chart 3), investors can expect equities to rise during expansions and decline during recessions. Chart 3Earnings Grow In Expansions And Fall In Recessions Earnings Declines Outside Of Recessions Are Rare
Earnings Grow In Expansions And Fall In Recessions Earnings Declines Outside Of Recessions Are Rare
Earnings Grow In Expansions And Fall In Recessions Earnings Declines Outside Of Recessions Are Rare
Digging a little more deeply into the empirical record since consensus S&P 500 earnings estimates began to be compiled reinforces the earnings/returns link. With the exception of the first leg of the Volcker double dip recession in 1980, forward four-quarter earnings estimates have fallen in every recession and have contracted in the aggregate at an annualized 16% rate (Table 2). Multiples have expanded at a hearty 9% clip from the beginning to the end of recessions but have always declined, sometimes sharply, during them. Conversely, earnings estimates always grow heartily during expansions, while multiples tend to observe a fairly tight range. Multiples and stocks move ahead of the business cycle, consistently troughing before the end of a recession, but the 20-percentage-point expansion/recession disparity in annualized returns testifies to the yield curve’s utility as an investment leading indicator. Table 2When Earnings Fall, So Do Stocks
The Yield Curve As An Indicator
The Yield Curve As An Indicator
The yield curve’s usefulness as a predictor of equity returns goes beyond recession signaling. Over the last half-century, the yield curve has tended to steepen and flatten in distinct phases. Defining a phase as a move of at least 200 basis points (bps) between the 3-month/10-year curve slope’s peak and trough, we count ten steepenings and nine flattenings since August 1969 (Chart 4). Chart 450 Years Of Steepening And Flattening
50 Years Of Steepening And Flattening
50 Years Of Steepening And Flattening
After segmenting performance by slope increments in steepening (Table 3, top panel) and flattening (Table 3, middle panel) phases, we find a clear distinction. S&P 500 total returns tend to be much stronger when the yield curve is in a flattening phase than when it is steepening. In general, a steeper curve is better than a flatter (or inverted) one for equity returns but flattening dominates steepening in every segment but the current one (150-200 bps). The cheery news for investors concerned about an inverted yield curve’s effect on stocks is that the upcoming flattening increments between now and inversion have historically been favorable. Though we are tactically neutral equities, we recommend overweighting them in multi-asset portfolios over a cyclical 6-to-12 month timeframe. Table 3Stocks Like A Flattening Yield Curve
The Yield Curve As An Indicator
The Yield Curve As An Indicator
The Yield Curve & Corporate Bond Returns This section of the report considers investment grade corporate bond returns in excess of a duration-matched position in US Treasuries and whether the slope of the Treasury curve can help us predict their magnitude. First, it’s important to point out that there is a lot of overlap between excess corporate bond returns and equity returns, but it is not complete (Chart 5). Corporates certainly tend to underperform duration-matched Treasuries during recessions and equity bear markets, but there have also been significant bouts of underperformance that fall outside of those periods. For example, corporate bond returns peaked well before equity returns in the late-1990s and corporates also underwent a severe selloff in 2014-15. Chart 5Investment Grade (IG) Corporate Bond Returns By Starting Slope Level And Trend
Investment Grade (IG) Corporate Bond Returns By Starting Slope Level And Trend
Investment Grade (IG) Corporate Bond Returns By Starting Slope Level And Trend
That said, Table 4 shows that, as is the case with stocks, a strategy of reducing corporate bond exposure during recessions will profit over time. Corporate bonds have underperformed Treasuries by a cumulative 3.1% (annualized) during recessions since 1979 and have outperformed by 1.2% (annualized) in non-recessionary periods. Table 4Corporate Bond Performance In And Out Of Recessions
The Yield Curve As An Indicator
The Yield Curve As An Indicator
The results in Table 4 suggest that investors should remain overweight corporate bonds versus Treasuries at least until the 3-month/10-year Treasury slope inverts. However, we think investors can perform even better if they pay attention to early warning signs from the 2-year/10-year Treasury slope. Table 5 shows historic 12-month corporate bond excess returns given different starting points for the 2-year/10-year slope. The starting points are also split depending on whether the 2-year/10-year slope was in a steepening or flattening trend at the time. Table 512-Month Investment Grade (IG) Corporate Bond Returns By Starting Slope Level And Trend
The Yield Curve As An Indicator
The Yield Curve As An Indicator
The results presented in Table 5 show that the level of the slope matters much more than whether the curve is in a steepening or flattening trend. They also show that, in general, excess returns tend to be much higher when the slope is steep than when it is flat. We also see that the odds of corporate bonds outperforming duration-matched Treasuries on a 12-month horizon decline markedly for periods when the 2-year/10-year slope starts below 25 bps. At present, the 2-year/10-year Treasury slope is 18 bps, just below the 25-bps cutoff. Though we take this negative signal from the yield curve seriously, we also anticipate that peaking inflation will prevent the Fed from raising rates by 245 bps during the next 12 months, the pace that is currently discounted in the yield curve. If this view pans out it will likely lead to some modest 2/10 curve steepening and a relief rally in corporate spreads. To square the difference between the current negative message from the yield curve and our more optimistic macro view, we recommend a neutral allocation to investment grade corporate bonds within US fixed income portfolios. Though we will likely downgrade our recommended allocation if the 2-year/10-year slope continues to flatten and approaches inversion. The Yield Curve & Treasury Returns This section of the report considers US Treasury index returns in excess of a position in cash, a metric designed to proxy for the returns earned by varying a US bond portfolio’s average duration. Treasury outperformance of cash indicates that long duration positions are profiting while Treasury underperformance of cash indicates that short duration positions are in the green. The historical relationship between Treasury returns and the slope of the yield curve is heavily influenced by the early-1980s period when the Fed plunged the economy into a double-dip recession to contain spiraling inflation. Chart 6 shows that this early-1980s episode is the only one where Treasuries sold off steeply even after all three of our yield curves had inverted. Chart 6A Repeat Of The Early 1980s Episode Remains Unlikely
A Repeat Of The Early 1980s Episode Remains Unlikely
A Repeat Of The Early 1980s Episode Remains Unlikely
In fact, if we look at the history of 12-month Treasury returns going back to 1973 split by the starting point for the slope (Tables 6A, 6B & 6C), we see that returns are worst after the curve is inverted and best when the curve is very steep. Table 6A12-Month Treasury Excess Returns* Given Different Starting Points For 2-Year / 10-Year Slope Since 1973
The Yield Curve As An Indicator
The Yield Curve As An Indicator
Table 6B12-Month Treasury Excess Returns* Given Different Starting Points For 3-Month / 10-Year Slope Since 1973
The Yield Curve As An Indicator
The Yield Curve As An Indicator
Table 6C12-Month Treasury Excess Returns* Given Different Starting Points For the Fed Slope** Since 1973
The Yield Curve As An Indicator
The Yield Curve As An Indicator
However, that picture changes if we start our historical sample in 1985 to exclude the early-1980s episode. Now, we see that Treasury returns tend to be high when the yield curve is very steep and when it is inverted (Tables 7A, 7B & 7C). The worst 12-month periods for Treasury returns are when the 2-year/10-year slope is between 75 bps and 100 bps, when the 3-month/10-year slope is between 50 bps and 75 bps and when the Fed Curve is between 0 bps and 25 bps. If we apply today’s situation to the post-1985 results shown in Tables 7A, 7B & 7C, we would conclude that the outlook for Treasury returns is very positive. The 3-month/10-year slope and Fed Curve are very steep, and the 2-year/10-year slope is in the 0 bps to 25 bps range. Of course, that message from the 2-year/10-year slope flips if viewed in the context of the post-1973 data shown in Table 6A. Table 7A12-Month Treasury Excess Returns* Given Different Starting Points For 2-Year / 10-Year Slope Since 1985
The Yield Curve As An Indicator
The Yield Curve As An Indicator
Table 7B12-Month Treasury Excess Returns* Given Different Starting Points For 3-Month / 10-Year Slope Since 1985
The Yield Curve As An Indicator
The Yield Curve As An Indicator
Table 7C12-Month Treasury Excess Returns* Given Different Starting Points For the Fed Slope** Since 1985
The Yield Curve As An Indicator
The Yield Curve As An Indicator
Our assessment is that the risk of a repeat of the early-1980s episode is still relatively small. Yes, inflation is extremely high, but it is likely to moderate naturally as we gain more distance from the pandemic. In that environment, the Fed will not feel the need to continue tightening aggressively even after all three segments of the yield curve have inverted. As such, we are inclined to view the message from the yield curve as positive for Treasury returns on a 12-month horizon, and we continue to advocate keeping average bond portfolio duration “at benchmark”. Ryan Swift US Bond Strategist rswift@bcaresearch.com Doug Peta, CFA Chief US Investment Strategist dougp@bcaresearch.com Footnotes 1 https://www.federalreserve.gov/econres/notes/feds-notes/dont-fear-the-yield-curve-20180628.htm 2 https://www.bloomberg.com/news/articles/2022-03-21/powell-says-look-at-short-term-yield-curve-for-recession-risk?sref=Ij5V3tFi 3 Please see US Investment Strategy Special Report, “How Much Longer Can The Bull Market Last?”, dated August 13, 2018. 4 We define an instance of “inversion” as a yield curve slope below zero for two consecutive months. Treasury Index Returns Spread Product Returns