Equities
The S&P 500 is up 7% from its March 8 trough, reducing year-to-date losses to 6.4% and bringing gains since the start of the Russian invasion of Ukraine to 5.6%. The trajectory of the Nasdaq is similar: it has recouped all of its losses since the…

Executive Summary Table 1Equity Capitulation Scorecard
Have US Equities Hit Rock Bottom?
Have US Equities Hit Rock Bottom?
We have put together a framework to capture the extent to which recent economic and political developments have been priced in by the equity market. It has seven criteria: Rate stabilization has not materialized yet, monetary conditions will continue to tighten Economic growth expectations do not yet reflect the deteriorating economic backdrop. US GDP forecasts will be downgraded which will be a drag on equity performance Earnings growth expectations need to come down to reflect supply disruptions, raging input prices, and the stronger dollar Oil prices have stabilized which provides support for US equities Valuations have retraced, signaling that the market is reasonably priced Technicals signal that the market is oversold “Black swans”: The effects of the war in Ukraine will be a drag on US equities and are not yet fully priced in. However, China’s pledge to be more investor-friendly is a positive. On balance, risks for US equities slightly outweigh the upside opportunity. Bottom Line: Although many ingredients for a sustainable rally are already in place, our analysis concludes that US equities have not hit rock bottom yet, and time is needed to resolve remaining headwinds. Feature The S&P 500 and NASDAQ are in correction territory, having pulled back 13% and 22%, respectively from their peak. Over the past few months, investors had to process a witches’ brew of staggering inflation, impending monetary tightening, and a war in the heart of Europe. Too much! Related Report US Equity StrategyAre We There Yet? However, over the past couple of days, US equities have staged an aggressive rally: The S&P rebounded 5.5% and the NASDAQ 8%. While we are long-term investors and don’t focus on short-term market moves, we find a recent market turn a good excuse to take a close look at US equities and gauge whether this recent rally is a “dead-cat bounce” or the market has truly bottomed and is in the early stages of a recovery rally. To do so, we have put together a framework to capture the extent to which recent economic and political developments have been priced in by the equity market. “Equity Capitulation” Framework Historically, equities bottomed when bad news had been reflected in expectations, valuations had come down to reflect the new economic reality, and investors had capitulated. Here are our criteria for an equity rebound this economic cycle: Monetary tightening has been priced in and rates have stabilized Economic growth expectations have been downgraded Energy prices have normalized Earnings growth expectations have come down and earnings are unlikely to surprise on the downside Investors have capitulated and sentiment is rock-bottom Valuations have lost their “good times” froth and are attractive There are resolutions of the geopolitical factors that have contributed to market turmoil In this report, we will go through each of the criteria and do our best to gauge whether “we are there yet.” Pricing In Tighter Monetary Policy – Rate Stabilization Is Still Elusive The recent correction of US equities reflects a repricing due to tighter monetary policy. The million-dollar question is how much monetary tightening is priced in and when will rates stabilize? To our minds, this is one of the key conditions for a sustainable bull market. Last week, the Fed raised rates for the first time since 2018. This first rate hike is 0.25 - 0.50, which did not come as a surprise and was broadcast well in advance. The latest dot plot also signals that the Fed expects the target rate to reach 1.75% by the end of 2022, i.e., six more hikes are expected this year. However, a day after the announcement, the market is pricing eight to nine rate hikes (Chart 1), with the Fed rate ending the year at 2.25-2.5%. Thus, the market expects aggressive Fed action and is likely to be positively surprised when the Fed takes a more measured approach than anticipated. This is certainly positive for equities. Chart 1The Market Is Pricing More Hikes In 2022 Then The Fed
The Market Is Pricing More Hikes In 2022 Then The Fed
The Market Is Pricing More Hikes In 2022 Then The Fed
Chart 2Monetary Conditions Will Continue To Tighten
Monetary Conditions Will Continue To Tighten
Monetary Conditions Will Continue To Tighten
However, despite the market coming to terms with an aggressive hiking schedule, monetary conditions are still easy (Chart 2), and real rates are negative. With the Fed’s emphasis on combating inflation, it is reasonable to expect that monetary conditions will continue to tighten, and real rates will rise. Also, nominal rates don’t yet show any signs of stabilization either (Chart 3). What does this mean for equities? Empirical analysis demonstrates that it takes around three months after the first hike for equities to adjust to a new monetary regime and deliver positive returns (Chart 4). Chart 3Rates Have Not Stabilized Yet
Rates Have Not Stabilized Yet
Rates Have Not Stabilized Yet
Chart 4Adjusting to A Tighter Monetary Regime Takes Time
Have US Equities Hit Rock Bottom?
Have US Equities Hit Rock Bottom?
Monetary conditions are likely to tighten further. Rate stabilization, which we are looking for, has not materialized just yet. On a positive note, we don’t expect any negative surprises from the Fed. Forecasts Need To Reflect Slowing Economic Growth According to the Bloomberg consensus, economic growth expectations for 2022 are still robust and have not been substantially downgraded (Chart 5). The market still expects the US economy to grow at 3.55%, compared to 3.8% in January, despite monetary tightening, falling ISM PMI readings (Chart 6), and soaring energy costs. The Fed is more realistic about the effects of its policy on economic growth, changing expectations from 4% to 2.8%. The logical conclusion is that more GDP growth downgrades are on the way. The latest reading of the Atlanta Fed stands at only 1.3%. Chart 5Economic Forecasts Do Not Yet Reflect Deteriorating Macro Backdrop
Economic Forecasts Do Not Yet Reflect Deteriorating Macro Backdrop
Economic Forecasts Do Not Yet Reflect Deteriorating Macro Backdrop
Chart 6Surveys Signal Growth A Slow Down
Surveys Signal Growth A Slow Down
Surveys Signal Growth A Slow Down
It is also important to note that both the direct and indirect effects of the war in Ukraine are yet to be reflected in US growth forecasts: Since the beginning of the war, the GSCI Commodities index has increased by 11%. One might argue that soaring commodity prices are a temporary phenomenon and forward curves signal eventual reversion to long-term averages. However, this may take months and even years, and by then, most of the stockpiles and hedges are likely to run out. Growth expectations are likely to fall, or worse yet, economic growth may surprise on the downside. Earnings Expectations Need To Come Down Similar to economic growth forecasts, bottom-up earnings growth expectations have barely budged (Chart 7): The market is still expecting about 9% earnings growth over the next 12 months. However, global supply disruptions and raging input prices are bound to cut into corporate profitability and slow earnings growth. Chart 7Earnings Expectations Have Not Budged
Earnings Expectations Have Not Budged
Earnings Expectations Have Not Budged
To make things worse, the US dollar has appreciated by nearly 10% since the beginning of 2021 (Chart 8). Since companies in the S&P 500 derive 40% from abroad, the strong greenback is bound to translate into softer overseas profits, cutting into the profitability of US multinationals. The effect of a stronger currency will be further exacerbated by the withdrawal of US companies from Russia to protest the war in Ukraine. While most US companies have limited exposure to Russia, there are some that will take a hit: For example, Philip Morris derives 8% of sales from that market. McDonald’s announced that closing its restaurants in Russia will cost $50 million a month or 9% of annual sales. While it is hard to accurately gauge the effect of the war and self-sanctions on US corporate profits, on the margin it is definitely a negative. Chart 8Dollar Has Strengthened Significantly
Dollar Has Strengthened Significantly
Dollar Has Strengthened Significantly
Earnings growth expectations have barely budged, and do not reflect a surge in commodity prices, a war, and slowing economic growth. We posit that downgrades are highly likely, and will be a drag on US equity performance. Oil Prices Have Stabilized The key channel for the war in Ukraine to affect the rest of the world is through the supply of energy. High energy prices present an economic danger because they touch every facet of the economy. Goldman Sachs estimates that spiraling electricity prices have already taken down 900,000 tonnes of aluminum capacity and 700,000 tonnes of zinc capacity in Europe. Certainly, in the past, a jump in the oil price has often been associated with recessions and negative equity returns (Chart 9). Therefore, we consider it a major shot in the arm that the WTI has come down from $130 to $105 on the back of lockdowns in China. This hiatus gives policymakers and oil producers time to negotiate deals and restart production – the onus is on US shale producers and Gulf nations. However, the long-term resolution is yet to be seen. Chart 9Oil Price Increases Have Been Associated With Negative Equity Returns
Oil Price Increases Have Been Associated With Negative Equity Returns
Oil Price Increases Have Been Associated With Negative Equity Returns
Oil price stabilization provides solid support for US equity performance. Valuations – No Longer An Excuse Not To Buy The correction in US equity markets has taken the froth off valuations: The S&P 500 forward multiple has come down from roughly 23x to 19x earnings (Chart 10), with all of the change attributable to multiple contraction. The BCA S&P 500 Valuation Indicator shows that the index is no longer “overvalued” (Chart 11). Outright cheap? No. But valuations can no longer be an excuse not to buy. Also, there are multiple corners of the market that are outright cheap – lots of bottom fishing is already taking place. Chart 10Valuations Have Moderated
Valuations Have Moderated
Valuations Have Moderated
Chart 11The S&P 500 Is No Longer Overvalued...
The S&P 500 Is No Longer Overvalued...
The S&P 500 Is No Longer Overvalued...
Valuations have moderated and the market is reasonably priced. Technicals – The Market Is Oversold While valuation multiples may contract further, most technical and sentiment indicators are flashing capitulation. The AAII Investor Bull/Bear Sentiment Indicator is below its March 2020 reading while the BCA Technical Indicator has shifted towards the oversold zone (Chart 12). It is important to note that this indicator is driven primarily by momentum components – its reading is oblivious to the top-heavy index composition and reflects prospects for large caps. A useful way to look under the index’s hood is to consider the number of stocks that retraced from their highs, currently over 95% of NASDAQ stocks have retraced (Chart 13). This high a reading flashes that the market is oversold, and there are lots of bargains to be had. Chart 12...Or Overbought
...Or Overbought
...Or Overbought
Chart 13Majority Of Stocks Are Oversold
Majority Of Stocks Are Oversold
Majority Of Stocks Are Oversold
Technicals indicate an oversold market. Black Swans Have Landed The war in Ukraine: Optimism about a potential peace deal between Russia and Ukraine seems premature – the conflict is just getting started and neither side will be backing off until it has to surrender unconditionally. However, while the war is contained in Ukraine, and Russian gas is flowing to Europe, any crisis in the equity market would be averted. The war in Ukraine will remain a headwind to global equities for a while. And while the US equity market is insulated from the direct consequences of the crisis, indirect effects will continue to reverberate through its economy for now. The direct and indirect effects of the war in Ukraine will be a drag on US equities and are not yet fully priced in. China pledged to keep capital markets stable and vowed to support overseas stock listings, indicating that regulation of Big Tech will end soon. In addition, it promised to offer support for property developers to minimize their risks. And China’s pledge to be more investor-friendly is believable as in its current stage of economy and with the onset of COVID, the government is in dire need of propping up both the economy and the stock market. Of course, China still presents great uncertainty associated with lockdowns. This is a positive for the US market as there are a number of Chinese companies listed on the US stock exchanges. Putting It All Together Our Equity Capitulation scorecard has seven different criteria, as discussed above. According to our assessment of the economic and market environments, there are two factors that signal near-term equity rebound: Investor capitulation or Technicals, and Energy prices. However, there are still headwinds: Monetary conditions will continue to tighten, economic and earnings growth expectations will be downgraded, and the war in Ukraine is unlikely to end soon. On balance, risks for US equities slightly outweigh the opportunity. The final score is -1, which indicates a mildly negative stance on US equities (Table 1). However, most of the outstanding negatives are likely to be resolved soon (i.e., downward revisions of expectations). Table 1Equity Capitulation Scorecard
Have US Equities Hit Rock Bottom?
Have US Equities Hit Rock Bottom?
Investment Implications Our equity capitulation indicator signals that cautious investors should continue to be underweight equities on the back of monetary tightening, slowing growth, and upcoming downward revision cycles. While Technicals and valuations make equities tempting, volatility in equities is likely to continue, and rallies will probably be short-lived. As always, long-term investors have more latitude in investment decision-making, and we believe that the long-term outlook for equities is positive. Bottom Line Our analysis concludes that US equities have not hit rock bottom yet, although many ingredients are already in place: Valuations are attractive, and equities are outright oversold. While buying equities at these levels is tempting, we recommend patience: Economic growth expectations are still elevated, and bottom-up earnings growth forecasts need to come down to reflect slowing growth and the direct and indirect effects of the war in Ukraine. Irene Tunkel Chief Strategist, US Equity Strategy irene.tunkel@bcaresearch.com Recommended Allocation
Executive Summary Ebbing Stagflation Fear Will Prompt Rerating
Ebbing Stagflation Fear Will Prompt Rerating
Ebbing Stagflation Fear Will Prompt Rerating
European inflation will rise further before peaking this summer. Core CPI will reach between 2.8% and 3.2% by year-end before receding. The combination of stabilizing growth and the eventual peak in inflation will cause stagflation fears to recede. European assets have greater upside. Cyclicals, small-caps, and financials will be major beneficiaries of declining stagflation fears. The underperformance of UK small-cap stocks is nearing its end. UK large-cap equities are a tactical sell against Eurozone and Swedish shares. TACTICAL INCEPTION DATE RETURN SINCE INCEPTION (%) COMMENT EQUITIES Buy European & Swedish Equities / Sell UK Large Caps Stocks 03/21/2022 Bottom Line: Stagflation fears are near an apex as commodity inflation recedes. A peak in these fears will allow European asset prices to perform strongly over the coming quarters. Despite a glimmer of hope that Ukraine and Russia may find a diplomatic end to the war, the reality on the ground is that the conflict has intensified. Although the hostilities are worsening and the European Central Bank (ECB) surprised the markets with its hawkish tone, European assets have begun to catch a bid. The crucial question for investors is whether this rebound constitutes a new trend or a counter-trend move? Our view about Europe is optimistic right now. The path is not a direct line upward. The recent optimism about the outcome of the Russia-Ukraine talks is premature; however, we are getting to the point when markets are becoming desensitized to the war and energy prices are losing steam. Moreover, the increasing number of statements by Chinese economic authorities pointing toward greater stimulus and support to alleviate the pain created by China’s stringent zero-COVID policy are another positive omen. Higher Inflation For Some Time European headline inflation is set to exceed 7% this summer and core CPI will increase between 2.8% and 3.2% by the end of 2022. Related Report European Investment StrategySpring Stagflation The main force that will push inflation higher in Europe remains commodity prices. Energy inflation is extremely strong at already 32% per annum (Chart 1). It will increase further because of both the recent jump in Brent prices to EUR122/bbl on March 8 and the upsurge in natural gas prices, which were as high as EUR212/MWh on the same day before settling to EUR106/MWh last Friday. The impact of energy prices will not be limited to headline inflation and will filter through to core CPI (Chart 1, bottom panel). The average monthly percentage change in the Eurozone core CPI inflation stands at 0.25% for the past six months (compared to an average of 0.09% over the past ten years), or the period when energy-prices inflation has been the strongest. Assuming monthly inflation remains at such an elevated level, annual core CPI will hit 3.3% in the Eurozone by the end of 2022 (Chart 2). Chart 2Core CPI to Rise Further
Core CPI to Rise Further
Core CPI to Rise Further
Chart 1Energy Inflation: Alive And Well
Energy Inflation: Alive And Well
Energy Inflation: Alive And Well
The picture is not entirely bleak. Many forces suggest that these inflationary forces will recede before year-end in Europe. Energy prices are peaking, which is consistent with a diminishing inflationary impulse from that space. We showed two weeks ago that the massive backwardation of oil curves, the heavy bullish sentiment, and the high level of risk-reversals were consistent with a severe but transitory adjustment in the energy market. Oil markets will experience further volatility, as uncertainty around peace/ceasefire negotiations continues to evolve in Ukraine. Nonetheless, the peak in energy prices has most likely been reached. BCA’s energy strategists expect Brent to average $93/bbl in 2022 and in 2023. The potential for a decline in headline CPI after the summer is not limited to energy prices. Dramatic moves in the commodity market, from metals to agricultural resources, have made headlines. Yet, the rate of change of commodity prices is decelerating, hence, the commodity impulse to inflation is slowing sharply. As Chart 3 shows, this is a harbinger of a slowdown in European headline CPI. Related Report European Investment StrategyFallout From Ukraine Looking beyond commodity markets, the recent deceleration in European economic activity also suggests weaker inflation in the latter half of 2022. Germany will likely suffer a recession because it already registered a negative GDP growth in Q4 2021. Q1 2022 growth will be even worse because of the country’s high exposure to both China and fossil fuel prices. More broadly, the recent deceleration in the rate of change of both the manufacturing and services PMIs is consistent with an imminent peak in the second derivative of goods and services CPI (Chart 4). Chart 3Commodity Impulse Is Peaking
Commodity Impulse Is Peaking
Commodity Impulse Is Peaking
Chart 4Inflation's Maximum Momentum Is Now
Inflation's Maximum Momentum Is Now
Inflation's Maximum Momentum Is Now
Underlying drivers of inflation also remain tame in Europe. European negotiated wages are only expanding at a 1.5% annual rate, which translates into unit labor costs growth of 1% (Chart 5). This contrast with the US, where wages are expanding at a 4.3% annual rate. A peak in inflation, however, does not mean that CPI readings will fall below the ECB’s 2% threshold anytime soon. The European economy continues to face supply shortages that the Ukrainian conflict exacerbates (Chart 6). Moreover, the recent wave of COVID-19 in China increases the risk of disruptions in supply chains, as highlighted by the closure of Foxconn factories in Shenzhen. Finally, inflation has yet to peak; mathematically, it will take a long time before it falls back below levels targeted by Frankfurt. Chart 5The European Labor Market Is Not Inflationary
The European Labor Market Is Not Inflationary
The European Labor Market Is Not Inflationary
Chart 6Not Blemish-Free
Not Blemish-Free
Not Blemish-Free
Bottom Line: European headline inflation will peak this summer, probably above 7%. Additionally, core CPI is likely to reach between 2.8% and 3.2% in the second half of 2022. As a result of a decline in the commodity impulse, inflation will decelerate afterward, but it will remain above the ECB’s 2% target for most of 2023. Hopes For Growth Two weeks ago, we wrote that Europe was facing a stagflation episode in the coming one to two quarters, but that, ultimately, economic activity will recover well. Recent evidence confirms that assessment. Chart 7A Coming Chinese Tailwind?
A Coming Chinese Tailwind?
A Coming Chinese Tailwind?
The tone of Chinese policymakers is becoming more aggressive, in favor of supporting the economy. On March 16, Vice-Premier Liu He highlighted that Beijing was readying to support property and tech shares and that it will do more to stimulate the economy. True, this response was made in part to address the need to close cities affected by the sudden spike of Omicron cases around China. Nonetheless, the global experience with Omicron demonstrates that, as spectacular and violent the surge in cases may be, it is short-lived. Meanwhile, the impact of stimulus filters through the economy over many months. As a result, Europe will experience the impact of China’s Omicron-induced slowdown, while it also suffers from the growth-sapping effects of the Ukrainian conflict; however, it will also enjoy the positive effect on growth of a rising credit impulse over several subsequent quarters (Chart 7). Beyond China, the other themes we have discussed in recent weeks remain valid. First, European fiscal policy will become looser, as governments prepare to fight the slowdown caused by the war, while also increasing infrastructure spending to wean Europe off Russian energy. Moreover, European military spending is well below NATO’s 2% objective. This will not remain the case, as military expenditure may leap from less than EUR100bn per year to nearly EUR400bn per year over the coming decade. Second, European spending on consumer durable goods still lags well behind the trajectory of the US. With the energy drag at its apex today, consumer spending on durable goods will be able to catch up in the latter half of the year, especially with the household savings rate standing at 15% or 2.5 percentage points above its pre-COVID level. Bottom Line: European growth will be very low in the coming quarters. Germany is likely to face a technical recession as Q1 2022 data filters in. Nonetheless, Chinese stimulus, European fiscal support, pent-up demand, and a declining energy drag will allow growth to recover in the latter half of the year. As a result, we agree with the European Commission estimates that European growth will slow markedly this year. Market Implications In the context of a transitory shock to European economic activity and a coming peak in inflation, European stock prices have likely bottomed. Chart 8Depressed Sentiment To Help Beta
Depressed Sentiment To Help Beta
Depressed Sentiment To Help Beta
Sentiment has reached levels normally linked with a durable market floor. The NAAIM Exposure Index has fallen to a point from which global markets often recover. Europe’s high beta nature increases the odds that European equities will greatly benefit in that context (Chart 8). Valuations confirm that sentiment toward European assets has reached a capitulation stage. The annual rate of change of the earnings yields in the earnings yields has hit 73%, which is consistent with a market bottom (Chart 9). More importantly, the change in European forward P/E tracks closely our European Stagflation Sentiment Proxy (ESSP), based on the difference between the Growth and Inflation Expectations’ components of the ZEW survey (Chart 10). For now, our ESSP indicates that stagflation fears in Europe have never been so widespread, but these fears will likely dissipate as energy inflation declines. This process will lift European earnings multiples. Chart 9Bad News Discounted?
Bad News Discounted?
Bad News Discounted?
Chart 10Ebbing Stagflation Fear Will Prompt Rerating
Ebbing Stagflation Fear Will Prompt Rerating
Ebbing Stagflation Fear Will Prompt Rerating
Earnings revisions will likely bottom soon as well. The ESSP is currently consistent with a dramatic decline in European net earnings revisions (Chart 10, bottom panel). It will take a few more weeks for lower earnings revisions to be fully reflected. However, they follow market moves and, as such, the 17% decline in the MSCI Europe Index that took place earlier this year already anticipates their fall. Consequently, as stagflation fears recede, earnings revisions will rise in tandem with equity prices. Chart 11Maximum Pressure On Corporate Spreads
Maximum Pressure On Corporate Spreads
Maximum Pressure On Corporate Spreads
A decline in stagflation fears is also consistent with a decrease in European credit spreads in the coming months (Chart 11). This observation corroborates the analysis from the Special Report we published jointly with BCA’s Global Fixed-Income Strategy team last week. In terms of sectoral implications, a decline in stagflation fears is often associated with a rebound in the performance of small-cap equities relative to large-cap ones (Chart 12, top panel). This reflects the greater sensitivity of small-cap equities to domestic economic conditions compared to large-cap stocks. Moreover, small-cap equities had been oversold relative to their large-cap counterparts but now, momentum is improving (Chart 12). As a result, it is time to buy these equities. Similarly, financials have suffered greatly from the recent events associated with the Ukrainian conflict. European financial institutions have not only been penalized for their modest exposure to Russia, they have also historically declined when stagflation fears are prevalent (Chart 13). This relationship reflects poor lending activity when the economy weakens, and the risk of a policy-induced recession caused by high inflation. Financials will continue their sharp rebound as stagflation fears dissipate. Chart 13Financials Have Suffered Enough
Financials Have Suffered Enough
Financials Have Suffered Enough
Chart 12Small-Caps Time To Shine
Small-Caps Time To Shine
Small-Caps Time To Shine
The dynamics in inflation alone are very important. As Table 1 highlights, in periods of elevated inflation over the past 20 years, financials underperform the broad market by 11.3% on average. It is also a period of pain for small-cap equities and cyclicals. Logically, exiting the current environment will offer opportunities in European cyclical equities and for financials in particular. Table 1Who Suffers From High Inflation?
Is Europe Turning The Corner?
Is Europe Turning The Corner?
Chart 14Long Industrials & Materials / Short Energy
Long Industrials & Materials / Short Energy
Long Industrials & Materials / Short Energy
Finally, a pair trade buying industrials and materials at the expense of energy makes sense today. Materials and industrials suffer relative to energy equities when stagflation rises, especially in periods when these fears reflect rising energy pressures (Chart 14). A reversal in relative earnings revisions in favor of materials and industrials will propel this position higher. Bottom Line: Sentiment toward European assets reached a selling climax in recent weeks. Stagflation fears in Europe have reached an apex, and their reversal will lift both multiples and earnings revisions in the subsequent quarters. Diminishing stagflation fears will also boost the appeal of European corporate credit, contributing to an easing in financial conditions. Small-cap stocks, cyclicals, and financials will reap the greatest benefits from this adjustment. Going long materials and industrials at the expense of energy stocks is an attractive pair trade. Key Risk: A Policy Mistake The view above is not without risks. The number one threat to European growth and assets is a policy mistake from the ECB. On March 10, 2022, the ECB’s policy statement and President Christine Lagarde’s press conference showed that the Governing Council (GC) will decrease asset purchases faster than anticipated. Chart 15Will The ECB Repeat It Past Mistakes?
Will The ECB Repeat It Past Mistakes?
Will The ECB Repeat It Past Mistakes?
It is important to keep in mind the dynamics of 2011. Back then, the ECB opted to increase interest rates as European headline CPI was drifting toward 2.6% on the back of rising energy prices. According to our ESSP, the April 2011 interest rates hike took place at the greatest level of stagflation fears recorded until the current moment (Chart 15). Lured by rising inflation, the ECB ignored underlying weaknesses in European economic activity, which wreaked havoc on European financial markets and growth. If the ECB were to increase rates as growth remains soft, a similar outcome would take place. For now, the ECB’s communications continue to de-emphasize the need for rate hikes in the near term, which suggests that the GC is cognizant of the risk created by weak growth over the coming months. Waiting until next year, when activity will be stronger and the output gap will be closed, will offer the ECB a better avenue to lift rates durably. This risk warrants close monitoring of the ECB’s communication over the coming months. If headline inflation does not peak by the summer, the ECB is likely to repeat its past error, which will substantially hurt European assets. Our optimism is tempered by this threat. UK Outperformance Long In The Tooth? Last week, the Bank of England (BoE) increased the Bank Rate by 25bps to 0.75%, in a move that was widely expected. Yet, the pound fell 0.7% against the euro and gilt yields fell 6 bps. This market reaction reflected the BoE’s choice to temper its forward guidance. The central bank is now expected to increase interest rates to 2.2% next year, before they decline in 2024. The dovish projection of the BoE shows the MPC’s concerns over the impact of higher energy costs and rising National Insurance contributions on household spending. In the BoE’s opinion, the economy is very inflationary right now, but it will slow, which will mitigate the inflationary impact down the road. We share the BoE’s worries about the UK’s near-term economic outlook. The combination of higher taxes, higher interest rates, and rising energy costs will have an impact on growth. However, the rapid decline in small-cap stocks, which have massively underperformed their large cap-counterparts, already discounts considerable bad news (Chart 16). Additionally, small-cap equities relative to EPS have begun to stabilize, while relative P/E and price-to-book ratios have also corrected their overvaluations. In this context, UK small-cap equities are becoming attractive. Chart 17UK vs Eurozone: A Stagflation Bet
UK vs Eurozone: A Stagflation Bet
UK vs Eurozone: A Stagflation Bet
Chart 16UK Small-Cap Stocks Have Purged Their Excesses
UK Small-Cap Stocks Have Purged Their Excesses
UK Small-Cap Stocks Have Purged Their Excesses
In contrast to small-cap stocks, UK large-cap equities have greatly benefited from the global stagflation scare. The UK large-cap benchmark had the right sector mix for the current environment, overweighting defensive names as well as energy and resources. It is likely that when stagflation fears recede, UK equities will undo their outperformance (Chart 17). Technically, UK equities are massively overbought against Euro Area and Swedish stocks, both of which have been greatly impacted by stagflation fears and their pro-cyclical biases (Chart 18 & 19). An attractive tactical bet will be to sell UK large-cap stocks while buying Eurozone and Swedish equities, as energy inflation declines and as China’s stimulus boosts global industrial activity in the latter half of 2022 Bottom Line: Move to overweight UK small-cap stocks within UK equity portfolios. Go long Euro Area and Swedish equities relative to UK large-cap stocks as a tactical bet. Chart 18UK Overbought Relative To Euro Area...
UK Overbought Relative To Euro Area...
UK Overbought Relative To Euro Area...
Chart 19… And Sweden
... And Sweden
... And Sweden
Mathieu Savary, Chief European Strategist Mathieu@bcaresearch.com Tactical Recommendations Cyclical Recommendations Structural Recommendations Closed Trades
Executive Summary Investors Think The Fed Will Not Be Able To Raise Rates Much Above 2%
Is A Higher Neutral Rate Good Or Bad For Stocks?
Is A Higher Neutral Rate Good Or Bad For Stocks?
The neutral rate of interest is 3%-to-4% in the United States. This is substantially higher than the market estimate of around 2%. It is also higher than the central tendency range for the Fed’s terminal interest rate dot, which remained at 2.3%-to-2.5% following this week’s FOMC meeting. If the neutral rate turns out to be higher than expected, this is arguably good news for stocks over the short-to-medium term because it lowers the risk that the Fed will accidentally induce a recession this year by bringing rates into restrictive territory. Over a longer-term horizon of 2-to-5 years, however, a higher neutral rate is bad news for stocks because it means that investors will eventually need to value equities using a higher discount rate. It also means that the Fed could find itself woefully behind the curve in normalizing monetary policy. Bottom Line: Global equities will rise over the next 12 months as the situation in Ukraine stabilizes, commodity prices recede, and inflation temporarily declines. Stocks will peak in the second half of 2023 in advance of a second, and currently unexpected, round of Fed tightening beginning in late-2023 or 2024. Dear Client, Instead of our regular report next week, we will be sending you a Special Report written by Matt Gertken, BCA Research’s Chief Geopolitical Strategist, discussing the geopolitical implications of the war in Ukraine. We will be back the following week with the GIS Quarterly Strategy Outlook, where we will explore the major trends that are set to drive financial markets in the rest of 2022 and beyond. As always, I will hold a webcast discussing the outlook the week after, on Thursday, April 7th. Best regards, Peter Berezin Chief Global Strategist https://www.linkedin.com/in/peter-berezin-1289b87/ https://twitter.com/BerezinPeter A Two-Stage Fed Tightening Cycle The FOMC raised rates by 25 basis points this week, the first of seven rate hikes that the Federal Reserve has telegraphed in its Summary of Economic Projections for the remainder of 2022. We expect the Fed to follow through on its planned rate hikes this year, but then go on pause in early-2023, as inflation temporarily comes down. However, the Fed will resume raising rates in late-2023 or 2024 once inflation begins to reaccelerate and it becomes clear that monetary policy is still too easy. This second round of monetary tightening is currently not anticipated by market participants. If anything, investors think the Fed is more likely to cut rates than raise rates towards the end of next year (Chart 1). The Fed’s own views are not that different from the markets’: The central tendency range for the Fed’s terminal interest rate dot remained at 2.3%-to-2.5% following this week’s FOMC meeting, with the median dot actually ticking lower to 2.4% from 2.5% (Chart 2).
Image
Chart 2The Fed Is Still In The Secular Stagnation Camp
The Fed Is Still In The Secular Stagnation Camp
The Fed Is Still In The Secular Stagnation Camp
A Higher Neutral Rate
Image
Our higher-than-consensus view of where US rates will eventually end up reflects our conviction that the neutral rate of interest is somewhere between 3% and 4%. One can think of the neutral rate as the interest rate that equates the amount of investment a country wants to undertake at full employment with the amount of savings that it has at its disposal.1 Anything that reduces savings or increases investment would raise the neutral rate (Chart 3). As we discussed last month, a number of factors are likely to lower desired savings in the US over the next few years: Households will spend down their accumulated pandemic savings. US households are sitting on $2.3 trillion (10% of GDP) in excess savings, the result of both decreased spending on services during the pandemic and the receipt of generous government transfer payments (Chart 4). Household wealth has soared since the start of the pandemic (Chart 5). Conservatively assuming that households spend three cents of every additional dollar in wealth, the resulting wealth effect could boost consumption by nearly 4% of GDP.
Image
Chart 5Net Worth Has Soared Since The Pandemic
Net Worth Has Soared Since The Pandemic
Net Worth Has Soared Since The Pandemic
The household deleveraging cycle has ended (Chart 6). Household balance sheets are in good shape. After falling during the initial stages of the pandemic, consumer credit has begun to rebound. Banks are easing lending standards on consumer loans across the board. Baby boomers are retiring. They hold over half of US household wealth, considerably more than younger generations (Chart 7). As baby boomers transition from savers to dissavers, national savings will decline. Chart 6US Household Deleveraging Pressures Have Abated
US Household Deleveraging Pressures Have Abated
US Household Deleveraging Pressures Have Abated
Chart 7Baby Boomers Have Amassed A Lot Of Wealth
Is A Higher Neutral Rate Good Or Bad For Stocks?
Is A Higher Neutral Rate Good Or Bad For Stocks?
Government budget deficits will stay elevated. Fiscal deficits subtract from national savings. While the US budget deficit will come down over the next few years, the IMF estimates that the structural budget deficit will still average 4.9% of GDP between 2022 and 2026 compared to 2.0% of GDP between 2014 and 2019 (Chart 8). On the investment front: The deceleration in trend GDP growth, which depressed investment spending, has largely run its course.2 According to the Congressional Budget Office, real potential GDP growth fell from over 3% in the early 1980s to about 1.9% today. The CBO expects potential growth to edge down only slightly to 1.7% over the next few decades (Chart 9). Chart 8Fiscal Policy: Tighter But Not Tight
Is A Higher Neutral Rate Good Or Bad For Stocks?
Is A Higher Neutral Rate Good Or Bad For Stocks?
Chart 9Much Of The Deceleration In Potential Growth Has Already Happened
Much Of The Deceleration In Potential Growth Has Already Happened
Much Of The Deceleration In Potential Growth Has Already Happened
After moving broadly sideways for two decades, core capital goods orders – a leading indicator for capital spending – have broken out to the upside (Chart 10). Capex intention surveys remain upbeat (Chart 11). The average age of the nonresidential capital stock currently stands at 16.3 years, the highest since 1965 (Chart 12). Chart 10Positive Signs For Capex (I)
Positive Signs For Capex (I)
Positive Signs For Capex (I)
Similar to nonresidential investment, the US has been underinvesting in residential real estate (Chart 13). The average age of the housing stock has risen to a 71-year high of 31 years. The homeowner vacancy rate has plunged to the lowest level on record. The number of newly finished homes for sale is half of what it was prior to the pandemic. Chart 11Positive Signs For Capex (II)
Positive Signs For Capex (II)
Positive Signs For Capex (II)
Chart 12An Aging Capital Stock
An Aging Capital Stock
An Aging Capital Stock
Chart 13Housing Is In Short Supply
Housing Is In Short Supply
Housing Is In Short Supply
The New ESG: Energy Security and Guns The war in Ukraine will put further pressure on the neutral rate, especially outside of the United States. Chart 14European Capex Should Recover
European Capex Should Recover
European Capex Should Recover
After staging a plodding recovery following the euro debt crisis, European capital spending received a sizable boost from the launch of the NextGenerationEU Recovery Fund (Chart 14). Capital spending will rise further in the years ahead as European governments accelerate efforts to make their economies less reliant on Russian energy. Meanwhile, European governments are trying to ease the burden from rising energy costs. France has introduced a rebate on fuel starting on April 1st. It is part of a EUR 20 billion package aimed at cutting heating and electricity bills. Other countries are considering similar measures. European military spending will also rise. Germany has already announced that it will spend EUR 100 billion more on defense. European governments will also need to boost spending to accommodate potentially several million Ukrainian refugees. A Smaller Chinese Current Account Surplus? Chart 15Will China Be A Source Of Excess Savings?
Will China Be A Source Of Excess Savings?
Will China Be A Source Of Excess Savings?
The difference between what a country saves and invests equals its current account balance. Historically, China has been a major exporter of savings, which has helped depress interest rates abroad. While China’s current account surplus has declined as a share of its own GDP, it has remained very large as a share of global ex-China GDP, reflecting China’s growing weight in the global economy (Chart 15). Many analysts assume that China will double down on efforts to boost exports in order to offset the drag from falling property investment. However, there is a major geopolitical snag with that thesis: A country that runs a current account surplus must, by definition, accumulate assets from the rest of the world. As the freezing of Russia’s foreign exchange reserves demonstrates, that is a risky proposition for a country such as China. Rather than increasing its current account surplus, China may seek to bolster its economy by raising domestic demand. This could be achieved by either boosting domestic investment on infrastructure and/or consumption. Notably, the IMF’s latest projections foresee China’s current account surplus falling by more than half between 2021 and 2026 as a share of global ex-China GDP. If this were to happen, the neutral rate in China and elsewhere would rise. The Path to Neutral: The Role of Inflation If one accepts the premise that the neutral rate in the US is higher than widely believed, what will the path to this higher rate look like?
Image
The answer hinges critically on the trajectory of inflation. If inflation remains stubbornly high, the Fed will be forced to hike rates by more than expected over the next 12 months. In contrast, if inflation comes down rapidly, then the Fed will be able to raise rates at a more leisurely pace. As late as early February, one could have made a strong case that US inflation was set to fall. The demand for goods was beginning to moderate as spending shifted back towards services. On the supply side, the bottlenecks that had impaired goods production were starting to ease. Chart 16 shows that the number of ships anchored off the coast of Los Angeles and Long Beach has been trending lower while the supplier delivery components of both the ISM manufacturing and nonmanufacturing indices had come off their highs. Since then, the outlook for inflation has become a lot murkier. As we discussed last week, the war in Ukraine is putting upward pressure on commodity prices, ranging from energy, to metals, to agriculture. BCA’s geopolitical team, led by Matt Gertken, expects the war to worsen before a truce of sorts is reached in a month or two. Meanwhile, a new Covid wave is gaining momentum. New daily cases are rising across Europe and have exploded higher in parts of Asia (Chart 17). In China, the number of new cases has reached a two-year high. The government has already locked down parts of the country encompassing 37 million people, including Shenzhen, a major high-tech hub adjoining Hong Kong. Chart 17Covid Cases Are On The Rise Again In Some Countries
Is A Higher Neutral Rate Good Or Bad For Stocks?
Is A Higher Neutral Rate Good Or Bad For Stocks?
Most new cases in China and elsewhere stem from the BA.2 subvariant of Omicron, which appears to be at least 50% more contagious than Omicron Classic. Given its extreme contagiousness, China may be forced to rely on massive nationwide lockdowns in order to maintain its zero-Covid strategy. While such lockdowns may provide some relief in the form of lower oil prices, the overall effect will be to worsen supply-chain disruptions. Watch For Signs of a Wage-Price Spiral As the experience of the 1960s demonstrates, the relationship between inflation and unemployment is inherently non-linear: The labor market can tighten for a long time with little impact on prices and wages, only for a wage-price spiral to suddenly develop once unemployment falls below a certain threshold (Chart 18). Chart 18A Wage-Price Spiral Was Ignited By Very Low Unemployment Levels In The 1960s
Is A Higher Neutral Rate Good Or Bad For Stocks?
Is A Higher Neutral Rate Good Or Bad For Stocks?
Chart 19Wage Growth Has Picked Up, But Mostly At The Bottom End Of The Income Distribution
Wage Growth Has Picked Up, But Mostly At The Bottom End Of The Income Distribution
Wage Growth Has Picked Up, But Mostly At The Bottom End Of The Income Distribution
For the time being, a wage-price spiral does not appear imminent. While wage growth has picked up, most of the increase in wages has occurred at the bottom end of the income distribution (Chart 19). Chart 20More Low-Wage Employees Should Return To Work
More Low-Wage Employees Should Return To Work
More Low-Wage Employees Should Return To Work
Low-wage workers have not returned to the labor force to the same extent as higher-wage workers (Chart 20). However, now that extended unemployment benefits have lapsed and savings deposits are being drawn down, the incentive to resume work will strengthen. An influx of workers back into the labor market will cap wage growth, at least for this year. Long-Term Inflation Expectations Still Contained A sudden increase in long-term inflation expectations can be a precursor to a wage-price spiral because the expectation of higher prices can induce consumers to shop now before prices rise further, while also incentivizing workers to demand higher wages. Reassuringly, long-term inflation expectations have not risen that much. Expected inflation 5-to-10 years out in the University of Michigan survey registered 3.0% in March, down a notch from 3.1% in February (Chart 21). While the widely followed 5-year, 5-year forward TIPS inflation breakeven rate has climbed to 2.32%, it is still at the bottom of the Fed’s comfort zone of 2.3%-to-2.5% (Chart 22).3 Chart 21Long-Term Inflation Expectations Remain Contained (I)
Long-Term Inflation Expectations Remain Contained (I)
Long-Term Inflation Expectations Remain Contained (I)
Chart 22Long-Term Inflation Expectations Remain Contained (II)
Long-Term Inflation Expectations Remain Contained (II)
Long-Term Inflation Expectations Remain Contained (II)
Chart 23The Magnitude Of Damage Depends On How Long The Commodity Price Shock Lasts
Is A Higher Neutral Rate Good Or Bad For Stocks?
Is A Higher Neutral Rate Good Or Bad For Stocks?
Moreover, the jump in market-based inflation expectations since the start of the war in Ukraine has been fueled by rising oil prices. The forwards are pointing to a fairly pronounced decline in the price of crude and most other commodity prices over the next 12 months (Chart 23). If that happens, inflation expectations will dip anew. Investment Implications The neutral rate of interest is higher in the United States than widely believed. A higher neutral rate is arguably good for stocks over the short-to-medium term because it lowers the risk that the Fed will accidentally induce a recession this year by bringing rates into restrictive territory. Over a longer-term horizon of 2-to-5 years, however, a higher neutral rate is bad news for stocks because it means that investors will eventually need to value stocks using a higher discount rate. It also means that the Fed could find itself woefully behind the curve in normalizing monetary policy. While the war in Ukraine and yet another Covid wave could continue to unsettle markets for the next month or two, global equities will be higher in 12 months than they are now. With inflation in the US likely to temporarily come down in the second half of the year, bond yields probably will not rise much more this year. However, yields will start moving higher in the second half of next year as it becomes clear that policy rates still have further to rise. The bull market in stocks will end at that point. Peter Berezin Chief Global Strategist peterb@bcaresearch.com Footnotes 1 These savings can either by generated domestically or imported from abroad via a current account deficit. 2 Theoretically, there is a close relationship between trend growth and the equilibrium investment-to-GDP ratio. For example, if real trend growth is 3% and the capital stock-to-GDP ratio is 200%, a country would need to invest 6% of GDP net of depreciation to maintain the existing capital stock-to-GDP ratio. In contrast, if trend growth were to fall to 2%, the country would only need to invest 4% of GDP. 3 The Federal Reserve targets an average inflation rate of 2% for the personal consumption expenditures (PCE) index. The TIPS breakeven is based on the CPI index. Due to compositional differences between the two indices, CPI inflation has historically averaged 30-to-50 basis points higher than PCE inflation. This is why the Fed effectively targets a CPI inflation rate of about 2.3%-to-2.5%. View Matrix
Is A Higher Neutral Rate Good Or Bad For Stocks?
Is A Higher Neutral Rate Good Or Bad For Stocks?
Special Trade Recommendations Current MacroQuant Model Scores
Is A Higher Neutral Rate Good Or Bad For Stocks?
Is A Higher Neutral Rate Good Or Bad For Stocks?
Executive Summary Major EM’s Defense Spends Will Be Comparable To That Of Developed Countries
Beware EMs That Borrow Too Much Or Wage War
Beware EMs That Borrow Too Much Or Wage War
Tectonic geopolitical trends are taking shape in Emerging Markets (EMs) today that will leave an indelible imprint on the next decade. First, EMs have gone on a relatively unnoticed public debt binge at a time when the economic prospects of the median EM citizen have deteriorated. This raises the spectre of sudden fiscal populism, aggressive foreign policy or social unrest in EMs. China, Brazil and Saudi Arabia appear most vulnerable to these risks. Second, the defense bill of major EMs could be comparable to that of the top developed countries of the world in a decade from now. Investors must brace for EMs to play a central role in the defense market and in wars, in the coming years. To profit from ascendant geopolitical risks in China, we reiterate shorting TWD-USD and the CNY against an equal-weighted basket of Euro and USD. To extract most from the theme of EM militarization, we suggest a Long on European Aerospace & Defense relative to European Tech stocks. Trade Recommendation Inception Date Return LONG EUROPEAN AEROSPACE & DEFENSE / EUROPEAN TECH EQUITIES (STRATEGIC) 2022-03-18 Bottom Line: Even as EMs are set to emerge as protagonists on the world stage, investors must prepare for these countries to exhibit sudden fiscal expansions, bouts of social unrest or a newfound propensity to initiate wars. The only way to dodge these volatility-inducing events is to leverage geopolitics to foresee these shocks. Feature Only a few weeks before Russia’s war with Ukraine broke out, a client told us that he was having trouble seeing the importance of geopolitics in investing. “It seems like geopolitics was a lot more relevant a few years back, with the European debt crisis, Brexit, and Trump. Now it does not seem to drive markets at all”, said the client. To this we gave our frequent explanation which is, “Our strategic themes of Great Power Struggle, Hypo-Globalization, and Nationalism/Populism are now embedded in the international system and responsible for an observable rise in geopolitical risk that is reshaping markets”. In particular we highlighted our pessimistic view on both Russia and Iran, which have incidentally crystallized most clearly since we had this client conversation. Related Report Geopolitical StrategyBrazil: The Road To Elections Won't Be Paved With Good Intentions Globally key geopolitical changes are afoot with Russia at war. In the coming weeks and months, we will write extensively about the dramatic changes we see taking shape in the realm of geopolitics and investing. We underscored the dramatic geopolitical realignment taking place as Russia severs ties with the West and throws itself into China’s arms in a report titled “From Nixon-Mao To Putin-Xi”. In this Special Report we highlight two key geopolitical themes that will affect emerging markets (EMs) over the coming decade. The aim is to help investors spot these trends early, so that they can profit from these tectonic changes that are sure to spawn a new generation of winners and losers in financial markets. (For BCA Research’s in-depth views on EMs, do refer to the Emerging Markets Strategy (EMS) webpage). Trend #1: Beware The Wrath Of EMs On A Debt Binge Chart 1The Pace Of Debt Accumulation Has Accelerated In Major EMs
Beware EMs That Borrow Too Much Or Wage War
Beware EMs That Borrow Too Much Or Wage War
Investors are generally aware of the debt build-up that has taken place in the developed world since Covid-19. The gross public debt held by the six most developed countries of the world (spanning US, Japan, Germany, UK, France and Italy) now stands at an eye-watering $60 trillion or about 140% of GDP. This debt pile is enormous in both absolute and relative terms. But at the same time, the debt simultaneously being taken on by EMs has largely gone unnoticed. The cumulative public debt held by eight major EMs today (spanning China, Taiwan, Korea, India, Brazil, Russia, Saudi Arabia and Turkey) stands at $20tn i.e., about 70% of GDP. Whilst the absolute value of EM debt appears manageable, what is worrying is the pace of debt accumulation. The average public debt to GDP ratio of these EMs fell over the early 2000s but their public debt ratios have now doubled over the last decade (Chart 1). EMs have been accumulating public debt at such a rapid clip that the pace of debt expansion in EMs is substantially higher than that of the top six developed countries (Chart 1). These six DMs have a larger combined GDP than the eight EMs with which they are compared. Related Report Geopolitical StrategyIndia's Politics: Know When To Hold 'Em, Know When To Fold 'Em (For in-depth views on China’s debt, do refer to China Investment Strategy (CIS) report here). Now developed countries taking on more debt makes logical sense for two reasons. Firstly, most developed countries are ageing, and their populations have stopped growing. So one way to prop up falling demand is to get governments to spend more using debt. Secondly, this practice seems manageable because developed country central banks have deep pockets (in the form of reserves) and their central banks are issuers of some of the safest currencies of the world. But EMs using the same formula and getting addicted to debt at an earlier stage of development is risky and could prove to be lethal in some cases. Also distinct from reasons of macroeconomics, the debt binge in EMs this time is problematic for geopolitical reasons. This Time Is Different EMs getting reliant on debt is problematic this time because their median citizen’s economic prospects have deteriorated. Growth is slowing, inflation is high, and job creation is stalling; thereby creating a problematic socio-political backdrop to the EM debt build-up. Growth Is Slowing: In the 2000s EMs could hope to grow out of their social or economic problems. The cumulative nominal GDP of eight major EMs more than quadrupled over the early 2000s but a decade later, these EMs haven not been able to grow their nominal GDP even at half the rate (Chart 2). Inflation Remains High: Despite poorer growth prospects, inflation is accelerating. Inflation was high in most major EMs in 2021 (Chart 3) i.e., even before the surge seen in 2022. Chart 2Major EM’s Growth Engine Is No Longer Humming Like A Well-Tuned Machine
Beware EMs That Borrow Too Much Or Wage War
Beware EMs That Borrow Too Much Or Wage War
Chart 3Despite Slower Growth, Inflation In Major EMs Remains High
Beware EMs That Borrow Too Much Or Wage War
Beware EMs That Borrow Too Much Or Wage War
Rising Unemployment: Employment levels have improved globally from the precipice they had fallen into in 2020. But unemployment today is a far bigger problem for major EMs as compared to developed markets (Chart 4). If the economic miseries of the median EM citizen are not addressed, then they can produce disruptive sociopolitical effects that will fan market volatility. This problem of rising economic misery alongside a rapid debt build-up, can also be seen for the next tier of EMs i.e. Mexico, Indonesia, Iran, Poland, Thailand, Nigeria, Argentina, Egypt, South Africa and Vietnam. While the average public debt to GDP ratios of these EMs fell over the early 2000s, the pace of debt accumulation has almost doubled over the last decade (Chart 5). Furthermore, the growth engine in these smaller EMs is no longer humming like a well-tuned machine and inflation remains at large (Chart 5). Chart 4Unemployment - A Bigger Problem In Major EMs Today
Unemployment - A Bigger Problem In Major EMs Today
Unemployment - A Bigger Problem In Major EMs Today
Chart 5Smaller EMs Must Also Deal With Rising Debt, Alongside Slowing Growth
Beware EMs That Borrow Too Much Or Wage War
Beware EMs That Borrow Too Much Or Wage War
Chart 6The Debt Surge In EMs This Time, Poses Unique Challenges
Beware EMs That Borrow Too Much Or Wage War
Beware EMs That Borrow Too Much Or Wage War
History suggests that periods of economic tumult are frequently followed by social unrest. The eruption of the so-called Arab Spring after the Great Recession illustrated the power of this dynamic. Then following the outbreak of Covid-19 in 2020 we had highlighted that Turkey, Brazil, and South Africa are at the greatest risk of significant social unrest. We also showed that even EMs that looked stable on paper faced unrest in the post-Covid world, including China and Russia. In this report we take a decadal perspective which reveals that growth is slowing, and debt is growing in EMs. Given that EMs suffer from rising economic miseries alongside growing debt and lower political freedoms (Chart 6), it appears that some of these markets could be socio-political tinderboxes in the making. Policy Implications Of The EM Debt Surge “As it turns out, we don't 'all' have to pay our debts. Only some of us do.” – David Graeber, Debt: The First 5,000 Years (Melville House Publishing, 2011) The trifecta of fast-growing debt, slowing growth and/or low political freedoms in EMs can add to the volatility engendered by EMs as an asset class. Given the growing economic misery in EMs today, politicians will be wary of outbreaks of social unrest. To quell this unrest, they may resort broadly to fiscal expansion and/or aggressive foreign policy. Both of these policy choices can dampen market returns in EMs. Chart 7India's Performance Had Flatlined Post Mild Populist Tilt
India's Performance Had Flatlined Post Mild Populist Tilt
India's Performance Had Flatlined Post Mild Populist Tilt
Policy Choice #1: More Fiscal Spending Despite High Debt Policymakers in some EMs may respond by de-prioritizing contentious structural reforms and prioritizing fiscal expansion. The Indian government’s decision to repeal progressive changes to farm laws in late 2021, launch a $7 billion home-building program in early 2022 and withholding hikes in retail prices of fuel, illustrates how policymakers are resorting to populism despite high public debt levels. As a result, it is no surprise that MSCI India had been underperforming MSCI EM even before the war in Ukraine broke out (Chart 7). Brazil is another EM which falls into this category, while China’s attempts to run tighter budgets have failed in the face of slowing growth. Policy Choice #2: Foreign Policy Aggression EMs may also adopt an aggressive foreign policy stance. Russia’s decision to invade Ukraine, Turkey’s interventions in several countries, and China’s increasing assertiveness in its neighboring seas and the Taiwan Strait provide examples. Wars by EMs are known to dampen returns as the experience of the Russian stock market shows. Russian stocks fell by 14% during its invasion of Georgia in 2008 and are down 40% from 24 February 2022 until March 9, 2022, i.e. when MSCI halted trading. If politicians fail to pursue either of these policies, then they run the risk of social unrest erupting due to tight fiscal policy or domestic political disputes. In fact, early signs of social discontent are already evident from large protests seen in major EMs over the last year (see Table 1). Table 1Social Unrest In Major EMs Is Already Ascendant
Beware EMs That Borrow Too Much Or Wage War
Beware EMs That Borrow Too Much Or Wage War
Bottom Line: The last decade has seen major EMs go on a relatively unnoticed public debt binge. This is problematic because this debt surge has come at a time when economic prospects of the median EM citizen have deteriorated. Politicians will be keen to quell the resultant discontent. This raises the specter of excessive fiscal expansion, aggressive foreign policy, and/or social unrest. All three outcomes are negative from an EM volatility perspective. Trend #2: The Rise And Rise Of EM Defense Spends Great Power Rivalry is an outgrowth of the multipolar structure of international relations. This theme will drive higher defense spending globally. In this report we highlight that even after accounting for a historic rearmament in developed countries following Russia’s invasion of Ukraine, a decade from now EMs will play a key role in driving global military spends. The defense bill of the six richest developed countries of the world (the US, Japan, Germany, UK, France and Italy) will increasingly be rivaled by that of the top eight EMs (China, Taiwan, Korea, India, Brazil, Russia, Saudi Arabia and Turkey). While key developed markets like Japan and Germany in specific (and Europe more broadly) are now embarking on increasing defense spends, the unstable global backdrop will force EMs to increase their military budgets as well. The combination of these forces could mean that the top eight EM’s defense spends could be comparable to that of the top six developed markets in a decade from now i.e., by 2032 (Chart 8). This is true even though the six DMs have a larger GDP. The assumptions made while arriving at the 2032 defense spend projections include: Substantially Higher Pace Of Defense Spends For Developed Countries: To reflect the fact that Russia’s invasion of Ukraine will trigger a historical wave of armament in developed markets we assume that: (a) NATO members France, Germany and Italy (who spent about 1.5% of GDP on an average on defense spends in 2019) will ramp up defense spending to 2% of GDP by 2032, (b) US and UK i.e. NATO members who already spend substantially more than 2% of GDP on defense spends will still ‘increase’ defense spends by another 0.4% of GDP each by 2032 and finally (c) Japan which spends less than 1% of GDP on defense spends today, in a structural break from the past will increase its spending which will rise to 1.5% of GDP by 2032. China And Hence Taiwan As Well As India Will Boost Spends: To capture China’s increasingly aggressive foreign policy stance and the fact that India as well as Taiwan will be forced to respond to the Chinese threat; we assume that China increases its stated defense spends from 1.7% of GDP in 2019 to 3% by 2032. Taiwan follows in lockstep and increases its defense spends from 1.8% of GDP in 2019 to 3% by 2032. India which is experiencing a pincer movement from China to its east and Pakistan to its west will have no choice but to respond to the high and rising geopolitical risks in South Asia. The coming decade is in fact likely to see India’s focus on its naval firepower increase meaningfully as it feels the need to fend off threats in the Indo-Pacific. India currently maintains high defense spends at 2.5% of GDP and will boost this by at least 100bps to 3.5% of GDP by 2032. Defense Spending Trends For Five EMs: For the rest of the EMs (namely Russia, Saudi Arabia, South Korea and Brazil), the pace of growth in defense spending seen over 2009-19 is extrapolated to 2032. For Turkey, we assume that defense spends as a share of GDP increases to 3% of GDP by 2032. Extrapolation Of Past GDP Growth For All Countries: For all 14 countries, we extrapolate the nominal GDP growth calculated by the IMF for 2022-26 as per its last full data update, to 2032. This tectonic change in defense spending patterns has important historical roots. Back in 1900, UK and Japan i.e., the two seafaring powers were top defense spenders (Chart 9). Developed countries of the world continued to lead defense spending league tables through the twentieth century as they fought expensive world wars. Chart 8Major EM’s Defense Spends Will Be Comparable To That Of Developed Countries
Beware EMs That Borrow Too Much Or Wage War
Beware EMs That Borrow Too Much Or Wage War
Chart 9Back In 1900, Developed Countries Like UK And Japan Were Top Military Spenders
Beware EMs That Borrow Too Much Or Wage War
Beware EMs That Borrow Too Much Or Wage War
Chart 10By 2000, EMs Had Begun Spending Generously On Armament
Beware EMs That Borrow Too Much Or Wage War
Beware EMs That Borrow Too Much Or Wage War
But things began changing after WWII. Jaded by the world wars, developed countries began lowering their defense spending. By the early 2000s EMs had now begun spending generously on armament (Chart 10). The turn of the century saw growth in developed markets fade while EMs like China and India’s geopolitical power began rising (Chart 11). Then a commodities boom ensued, resulting in petro-states like Saudi Arabia establishing their position as a high military spender. The confluence of these factors meant that by 2020 EMs had becomes major defense spenders in both relative and absolute terms too (Chart 12). Going forward, we expect the coming renaissance in DM defense spending in the face of Russian aggression, alongside rising geopolitical aspirations of China, to exacerbate this trend of rising EM militarization. Chart 11The 21st Century Saw Developed Countries’ Geopolitical Power Ebb
Beware EMs That Borrow Too Much Or Wage War
Beware EMs That Borrow Too Much Or Wage War
Chart 12EMs Today Are Top Military Spenders, Even In Absolute Terms
Beware EMs That Borrow Too Much Or Wage War
Beware EMs That Borrow Too Much Or Wage War
Why Does EM Weaponizing Matter? History suggests that wars are often preceded by an increase in defense spends: Well before WWI, a perceptible increase in defense spending could be seen in Austria-Hungary, Germany, and Italy (Chart 13). These three countries would go on to be known as the Triple Alliance in WWI. Correspondingly France, Britain and Russia (i.e., countries that would constitute the Triple Entente) also ramped up military spending before WWI (Chart 14). Chart 13Well Before WWI; Austria-Hungary, Germany, And Italy Had Begun Ramping Up Defense Spends
Beware EMs That Borrow Too Much Or Wage War
Beware EMs That Borrow Too Much Or Wage War
Chart 14The ‘Triple Entente’ Too Had Increased Defense Spends In The Run Up To WWI
Beware EMs That Borrow Too Much Or Wage War
Beware EMs That Borrow Too Much Or Wage War
History tragically repeated itself a few decades later. Besides Japan (which invaded China in 1937); Germany and Italy too ramped up defense spending well before WWII broke out (Chart 15). These three countries would come to be known as the Axis Powers and initiated WWII. Notably, Britain and Russia (who would go on to counter the Axis Powers) had also been weaponizing since the mid-1930s (Chart 16). Chart 15Axis Powers Had Been Increasing Defense Spends Well Before WWII
Beware EMs That Borrow Too Much Or Wage War
Beware EMs That Borrow Too Much Or Wage War
Chart 16Allied Powers Too Had Been Increasing Defense Spends In The Run Up To WWII
Beware EMs That Borrow Too Much Or Wage War
Beware EMs That Borrow Too Much Or Wage War
Chart 17Militarily Active States Have Been Ramping Up Defense Spends
Beware EMs That Borrow Too Much Or Wage War
Beware EMs That Borrow Too Much Or Wage War
Russia, Ukraine, Turkey and Gulf Arab states like Iraq have been involved in wars in the recent past and noticeably increased their defense budgets in the lead-up to military activity (Chart 17). Given that a rise in military spending is often a leading indicator of war and given that EMs are set to spend more on defense, it appears that significant wars are becoming more rather than less likely, which Russia’s invasion of Ukraine obviously implies. A large number of “Black Swan Risks” are clustered in the spheres of influence of Russia, China, and Iran, which are the key powers attempting to revise the US-led global order today (Map 1). Map 1Black Swan Risks Are Clustered Around China, Russia & Iran
Beware EMs That Borrow Too Much Or Wage War
Beware EMs That Borrow Too Much Or Wage War
Distinct from major EMs, eight small countries pose meaningful risks of being involved in wars over the next. These countries are small (in terms of their nominal GDPs) but spend large sums on defense both in absolute terms (>$4 billion) and in relative terms (>4% of GDP). Incidentally all these countries are located around the Eurasian rimland and include Israel, Pakistan, Algeria, Iran, Kuwait, Oman, Ukraine and Morocco (Map 2). In fact, the combined sum of spending undertaken by these countries is so meaningful that it exceeds the defense budgets of countries like Russia and UK (Chart 18). Map 2Eight Small Countries That Spend Generously On Defense
Beware EMs That Borrow Too Much Or Wage War
Beware EMs That Borrow Too Much Or Wage War
Chart 188 Countries Located Near The Eurasian Rimland, Spend Large Sums On Defense
Beware EMs That Borrow Too Much Or Wage War
Beware EMs That Borrow Too Much Or Wage War
Bottom Line: As EM geopolitical power and aspirations rise, the defense bill of top developed countries will be challenged by the defense spending undertaken by major EMs. On one hand this change will mean that certain EMs may be at the epicenter of wars and concomitant market volatility. On the other hand, this change could spawn a new generation of winners amongst defense suppliers. Investment Conclusions In this section we highlight strategic trades that can be launched to play the two trends highlighted above. Trend #1: Beware The Wrath Of EMs On A Debt Binge Investors must prepare for EMs to witness sudden fiscal expansions, unusually aggressive foreign policy stances, and/or bouts of social unrest over the next few years. The only way to dodge these volatility-inducing events in EMs is to leverage geopolitics to foresee socio-political shocks. Using a simple method called the “Tinderbox Framework” (Table 2), we highlight that: Table 2Tinderbox Framework: Identifying Countries Most Exposed To Socio-Political Risks
Beware EMs That Borrow Too Much Or Wage War
Beware EMs That Borrow Too Much Or Wage War
Within the eight major EMs; China, Brazil, Russia and Saudi Arabia face elevated socio-political risks. Amongst the smaller ten EMs, these risks appear most elevated for Egypt, South Africa and Argentina. It is worth noting that Brazil, South Africa and Turkey appeared most vulnerable as per our Covid-19 Social Unrest Index that we launched in 2020. We used the tinderbox framework in the current context to fade out effects of Covid-19 and to add weight to the debt problem that is brewing in EMs. Client portfolios that are overweight on most countries that fare poorly on our “Tinderbox Framework” should consider actively hedging for volatility at the stock-specific level. To profit from ascendant geopolitical risks in China, we reiterate shorting TWD-USD and the CNY against an equal-weighted basket of Euro and USD. China’s public debt ratio is high and social pressures may be building with limited valves in place to release these pressures (Table 2). The renminbi has performed well amid the Russian war, which has weighed down the euro, but China faces a confluence of domestic and international risks that will ultimately drag on the currency, while the euro will benefit from the European Union’s awakening as a geopolitical entity in the face of the Russian military threat. Trend #2: EM’s Will Drive Wars In The 21st Century Wars are detrimental to market returns.1 Furthermore, as the history of world wars proves, even the aftermath of a war often yields poor investment outcomes as wars can be followed by recessions. It is in this context that investors must prepare for the rise of EMs as protagonists in the defense market, by leveraging geopolitics to identify EMs that are most likely to be engaged in wars. While we are not arguing that WWIII will erupt, investors must brace for proxy wars as an added source of volatility that could affect EMs as an asset class. To profit from these structural changes underway we highlight two strategic trades namely: 1. Long Global Aerospace & Defense / Broad Market Thanks to the higher spending on defense being undertaken by major EMs, global defense spends will grow at a faster rate over the next decade as compared to the last. We hence reiterate our Buy on Global Aerospace & Defense relative to the broader market. 2. Long European Aerospace & Defense / European Tech Up until Russia invaded Ukraine and was hit with economic sanctions, Russia was the second largest exporter of arms globally accounting for 20% global arms exports. With Russia’s ability to sell goods in the global market now impaired, the two other major suppliers of defense goods that appear best placed to tap into EM’s demand for defense goods are the US (37% share in the global defense exports market) and Europe (+25% share in the global defense exports market). Chart 19American Defense Stocks Have Outperformed, European Defense Stocks Have Underperformed
Beware EMs That Borrow Too Much Or Wage War
Beware EMs That Borrow Too Much Or Wage War
Chart 20Defense Market: Russia’s Loss Could Be Europe’s Gain
Beware EMs That Borrow Too Much Or Wage War
Beware EMs That Borrow Too Much Or Wage War
But given that (a) American aerospace & defense stocks have rallied (Chart 19) and given that (b) France, Germany, and Italy are major suppliers of defense equipment to countries that Russia used to supply defense goods to (Chart 20), we suggest a Buy on European Aerospace & Defense relative to European Tech stocks to extract more from this theme. In fact, this trade also stands to benefit from the pursuance of rearmament by major European democracies which so far have maintained lower defense spends as compared to America and UK. This view from a geopolitical perspective is echoed by our European Investment Strategy (EIS) team too who also recommend a Long on European defense stocks and a short on European tech stocks. Ritika Mankar, CFA Editor/Strategist ritika.mankar@bcaresearch.com Footnotes 1 Please see: Andrew Leigh et al, “What do financial markets think of war in Iraq?”, NBER Working Paper No. 9587, March 2003, nber.org. David Le Bris, “Wars, Inflation and Stock Market Returns in France, 1870-1945”, Financial History Review 19.3 pp. 337-361, December 2012, ssrn.com. Strategic Themes Open Tactical Positions (0-6 Months) Open Cyclical Recommendations (6-18 Months) Regional Geopolitical Risk Matrix
Executive Summary Profit Margins Are Headed Lower; So Are Equity Multiples
Profit Margins Are Headed Lower; So Are Equity Multiples
Profit Margins Are Headed Lower; So Are Equity Multiples
The post pandemic profit recovery in India was driven by a one-off revival of demand from very depressed levels, which led to a spike in profit margins as companies’ sales outpaced their costs (hiring costs and financing cost). The glacial pace of job creation since the pandemic and the muted wage growth is to blame for weak household income, which in turn is hurting consumption. Indian growth is wobbling as household consumption is losing steam, and capital investments are decelerating. The Ukraine crisis and the resulting oil / commodity price surge will hurt Indian firms’ margins and profits even more in the months to come. Indian stocks are still expensive, and future profit expectations are elevated – especially relative to their EM and emerging Asian counterparts. This has set the stage for profit disappointment. Bottom Line: Indian growth is decelerating amid high stock valuations. Higher for longer commodity prices will hurt as well. Equity investors should downgrade Indian stocks tactically from neutral to underweight in EM and emerging Asian portfolios. Domestic bond investors should book profits on their Indian exposure, and downgrade to neutral in EM and emerging Asian baskets. Feature Chart 1Indian Stocks Are Headed For A Turbulent Time
Indian Stocks Are Headed For A Turbulent Time
Indian Stocks Are Headed For A Turbulent Time
Long COVID is a condition that manifests itself after a person recovers from the acute phase of the disease. The Indian economy is showing similar signs: after an initial post-COVID recovery, household consumption and investment have begun to disappoint. This is happening at a time when Indian equity valuations and investors’ profit expectations are much higher than those of the rest of the EM. As such, Indian share prices are set for a turbulent time ahead. Equity investors should tactically downgrade this bourse to underweight in EM and emerging Asian portfolios (Chart 1). Domestic bond investors should book profits on their Indian exposure, and downgrade it to neutral in EM and emerging Asian baskets. Consumer Spending During and in the immediate aftermath of the pandemic, the Indian government did not supplement lost household income caused by the lockdowns and the layoffs by any good measure. Tangible fiscal stimulus (i.e., excluding government guarantees etc.) amounted to less than 2% of GDP. Post-pandemic, jobs have been growing at a glacial pace. In fact, India’s total employment is estimated to be still 8% lower as of the end of 2021 compared to the first quarter of 2020, as per Oxford Economics data. Consistently, wage growth has been very poor as well – in both urban and rural areas (Chart 2). Wages in real terms (deflated by CPI) have been contracting. Household income has therefore remained severely impaired. The consequences of meagre household incomes can now be seen in persistently weak consumer durable sales. Chart 3 shows that passenger cars and 2-wheeler sales are languishing at much lower levels than they were in the pre-pandemic period. Chart 2Subdued Employment And Poor Wage Growth Sapped Household Income …
Subdued Employment And Poor Wage Growth Sapped Household Income ...
Subdued Employment And Poor Wage Growth Sapped Household Income ...
Chart 3… Leading To Impaired Household Consumption
... Leading To Impaired Household Consumtion
... Leading To Impaired Household Consumtion
Chart 4Signs Of Softening Business Activity
Signs Of Softening Business Activity
Signs Of Softening Business Activity
The overall growth in India was seen to be softening even before the Ukraine crisis. The economy grew at a 5.4% YoY rate in the last quarter of 2021, down from 8.5% in the previous quarter. The trend appears to be continuing into this year. Corroborating evidence comes in the form of the number of E-way bills1 issued – which is a barometer of business activity. The number peaked in October last year and has been struggling since (Chart 4). Persistently weak consumer demand is a crucial reason why manufacturing production is also struggling to get back to the pre-pandemic trend – which would be a good 10% higher than the current level (Chart 4, bottom panel). Industrial production will face difficulty gaining traction should weakness in consumer demand linger. On the whole, the post-pandemic economic recovery in India was a rapid one initially; but is now gradually losing steam as joblessness remains high and wages remain low. Looming Energy Tax Ominously, odds have risen that core (non-oil) consumer demand could be even weaker in the months ahead. The sharp rise in crude prices will soon mean that Indian consumers and businesses will have to shell out more for their energy-related purchases. Chart 5 shows that retail gasoline and diesel prices in India did not keep pace with the global crude prices in recent months. Hence, if some or all of the rise is passed on to the consumers, domestic fuel prices could go up by about 10 - 20%. If so, that would be a major tax on the economy. Higher expenses on fuel and transportation – which make up about 15% of consumer spending – will force households to curtail their non-oil spending elsewhere. That means non-energy firms would see lower sales. Those firms would also see their own operating and raw material costs going up given the higher oil and other commodity prices. Together, these will have a pronounced negative impact on these firms’ profit margins. Lower margins are a harbinger of lower stock multiples (Chart 6). Chart 5Retail Gasoline And Diesel Prices Could Rise Materially
Reatil Gasoline And Diesel Prices Could Rise Materially
Reatil Gasoline And Diesel Prices Could Rise Materially
Chart 6Profit Margins Are Headed Lower; So Are Equity Multiples
Profit Margins Are Headed Lower; So Are Equity Multiples
Profit Margins Are Headed Lower; So Are Equity Multiples
Notably, Indian corporate profit margins had surged to decade high levels last year thanks mainly to cost cutting. Wage bills had gone down as businesses slashed employees; and were slow to re-hire them. Interest expenses had also gone down – both relative to sales and profits – as the central bank cut interest rates aggressively. When sales revived after the lockdowns, the higher/rising margins led to surging profits. But now, both sales and margins are in jeopardy as weak consumer demand is hurting the former, while rising raw materials cost will hurt the latter. Profits are set to disappoint as a result. Related Report Emerging Markets StrategyEquity Capitulation, A Commodity Shock And Geopolitics What’s more, faltering profits could also lead to a premature slowdown in India’s capital investments. Firms’ capex plans are highly contingent on profit growth; and therefore, the former may see a dip in the coming months with dwindling profits (Chart 7). This potential development could be a major negative for India’s sustainable growth story, and its ill-effects may linger. What makes this episode of oil/commodity shock particularly negative for India is that it is taking place when consumer demand is already sluggish. Previous oil shocks in 2007-08 and 2011-12 took place when the underlying growth was quite robust. Stronger underlying growth allows for the absorption of negative exogenous shocks like higher oil & energy prices. Overall, rising oil prices have historically been bearish for Indian stocks’ relative performance. That correlation had broken down since the onset of the pandemic two years ago (Chart 8). However, now with the crude price hovering around $100 a barrel, India’s relative equity outperformance versus the EM benchmark will give up some of its gains of the past two years. Chart 7Dwindling Profits Could Lead To A Slowdown In Caital Expenditure
Dwindling Profits Could Lead To A Slowdown In Caital Expenditure
Dwindling Profits Could Lead To A Slowdown In Caital Expenditure
Chart 8India’s Relative Equity Outperformance Cannot Continue With $100 Oil
India' Relative Equity Outperformance Cannot Continue With $100 Oil
India' Relative Equity Outperformance Cannot Continue With $100 Oil
How About Inflation? Chart 9Global Commodity Prices Dictate Indian PPI, But Not So Much CPI
Global Commodity Prices Dictate Indian PPI, But Not So Much CPI
Global Commodity Prices Dictate Indian PPI, But Not So Much CPI
India’s producer price inflation (PPI) is highly geared to global commodity prices. As such, one can expect PPI to re-accelerate in the months ahead. That said, commodity prices are not a major driver of India’s consumer price inflation (CPI). The latter will therefore likely remain more well behaved than PPI would (Chart 9). Historically, the two primary drivers of India’s CPI have been the economy’s productivity growth rate and broad money (M3) growth rate. Since productivity trends do not change much in the near term, it’s money supply that determines the short-term trajectory of CPI (Chart 10). Chart 10Money Supply Determines India’s CPI Over Cyclical Horizon
Money Supply Determines India's CPI Over Cyclical Horizon
Money Supply Determines India's CPI Over Cyclical Horizon
Chart 11Drivers Of India’s Money Supply Will See Only A Mediocre Growth
Drivers Of India's Money Supply Will See Only A Mediocre Growth
Drivers Of India's Money Supply Will See Only A Mediocre Growth
Money growth has been quite mediocre recently; and will likely stay that way. This is because neither of the two main drivers of money supply, bank credit and fiscal expenditure, are set to rise very strongly. In the proposed fiscal budget for April 2022 – March 2023, the government is planning to raise current expenditure2 by just 1% in nominal terms; and the total expenditure by 5%. Meanwhile, non-interest government spending growth has already come back to normal levels following the one-off surge during the pandemic (Chart 11, top panel). Bank credit has also slowed on the margin this year. That it has barely grown in real terms in the past couple of years is also dampening inflationary pressures (Chart 11, bottom panel). All this means that any rise in consumer price inflation will be limited. Notably, a marginal rise in consumer price inflation is unlikely to lead to policy tightening by the central bank. This is because the source of inflation would be supply driven, rather than demand driven. The central bank would recognize that higher commodity prices will exacerbate the already weak consumer demand; and therefore, any further policy tightening could decimate growth. On the whole, very sluggish wage growth and contained core CPI support the fact that there are no genuine demand-driven inflationary pressures in the country (Chart 12). A rise in global food prices should also not impact India much as the country is not a big importer of food grains and most of its food is domestically grown. All in all, the RBI is likely to ignore the slight pickup in CPI, and will refrain from raising rates. How Much Downside In Stocks? Indian stocks have been in a trading range relative to their EM counterparts since we downgraded them to neutral in October last year. In absolute terms also they have not fallen much so far – even though foreign investors have exited this market en masse over the past several months. The missing piece of the puzzle for this apparent dichotomy is the massive purchases by domestic mutual funds in recent months. This local demand is what prevented this bourse from tanking (Chart 13). Chart 12India’s Consumer Inflation Will Not Rise By Too Much
India's Consumer Inflation Will Not Rise By Too Much
India's Consumer Inflation Will Not Rise By Too Much
Chart 13The Massive Purchases Of Mutual Funds Will Wane With Profit Disappointment
The Massive Purchases Of Mutual Funds Will Wane With Profit Disappointment
The Massive Purchases Of Mutual Funds Will Wane With Profit Disappointment
Chart 14Indian Stock Multiples Are Still Very High Relative To Their Counterparts
Indian Stock Multiples Are Still Very High Relative To Their Counterparts
Indian Stock Multiples Are Still Very High Relative To Their Counterparts
Going forward, however, those domestic purchases are likely to wane as growth and profits slow, and local investors become wary of their equity exposures. That would lead to a sell-off in stock prices. Notably, Indian stocks are still quite pricey when compared to both their EM and emerging Asian counterparts based on the cyclically adjusted P/E ratio (Chart 14). As explained above, Indian stock multiples are set to fall materially as firms’ profit margins are squeezed in the months to come. Investors have paid high equity multiples as they have extrapolated the strong profit recovery post-pandemic into the future. However, the profit recovery post-pandemic was driven by a one-off revival of demand from very depressed levels and a one-off spike in profit margins as companies’ sales outpaced their costs (hiring costs and financing cost). As and when investors realize that a sustainable profit growth rate is much lower than the initial post-pandemic trajectory, multiples will shrink somewhat. At the same time, firms’ topline will also wobble as non-oil consumer spending sees forced retrenchment. Weakish topline, multiplied by lower margins, entails weak earnings growth. That would be another drag (besides shrinking multiples) on Indian share prices. Notably, a sell-off in Indian stocks usually comes with a depreciating rupee – thereby compounding woes for foreign investors in Indian stocks. All in all, this bourse could witness a major down leg in absolute USD terms in the months to come. Relative to other EM and emerging Asian markets also they will trade on the weaker side. Book Profits On Domestic Bonds We have been overweight India in EM local currency bond portfolios given Indian bonds’ rather high yields, and the country’s prudent fiscal policy, benign inflation outlook, and a cheap currency. The call has worked out well (Chart 15, top panel). However, following the sharp rise in EM bond yields, Indian bond yields are no longer attractive in relative terms (Chart 15, bottom panel). A less sanguine rupee outlook over the short term is another cause for concern. Besides, rising US bond yields would make Indian bonds look less attractive. Considering all, we recommend EM local currency bond investors take profits on their overweight India exposure and reduce the allocation to neutral in EM and emerging Asian baskets. Investment Recommendations Equities: Indian firms’ profit outlook has deteriorated significantly given odds of disappointing margins and still high equity valuations. Investors should tactically downgrade this market from neutral to underweight in EM and emerging Asian equity portfolios. Absolute return investors should avoid this market outright. Currency and Bonds: The Indian rupee is at a risk of mild depreciation along with a sell-off in the Indian stock markets. However, given that the currency is cheap, its relapse will not be large (Chart 16). Chart 15Indian Domestic Bonds Are Not As Attractive Any More; Book Profits
Indian Domestic Bonds Are Not As Attractive Any More; Book Profits
Indian Domestic Bonds Are Not As Attractive Any More; Book Profits
Chart 16Indian Rupee Is Cheap, And Hence Has Only A Limited Downside
Indian Rupee Is Cheap, And Hence Has Only A Limited Downside
Indian Rupee Is Cheap, And Hence Has Only A Limited Downside
Indian government bonds have outperformed their EM counterparts over the past four years; but are no longer as attractive as the yield advantage has disappeared and the rupee has a weaker near-term outlook. Investors should book profits on their overweight allocations, and downgrade them to neutral relative to EM and emerging Asian baskets. Rajeeb Pramanik Senior EM Strategist rajeeb.pramanik@bcaresearch.com Footnotes 1 E-way bills are issued as part of Goods & Services Tax (GST) collection mechanism. 2 The rest is capital expenditure – which the government is planning to raise by 24%, albeit from a much smaller base (2.6% of GDP) compared to current expenditure (13.6% of GDP).
Executive Summary For the Fed, maintaining its credibility with a long sequence of rate hikes that does not crash the economy, real estate market, and stock market is akin to the ‘Hail Mary’ move of (American) football. The likelihood that the Fed completes the straight sequence of eight rate hikes which the market is now pricing seems very low. Hence, today we are opening a new trade. Go long the September 2023 Eurodollar futures contract. Additionally, stay underweight Treasury Inflation Protected Securities (TIPS) versus T-bonds. And on a 12-month horizon, underweight the commodity complex, whose elevated prices are highly vulnerable to a near-certain upcoming demand destruction. Fractal trading watchlist: US interest rate futures, 3-year T-bond, Canada versus Japan, AUD/KRW, and EUR/CHF. Spending On Goods Looks Like An Earthquake On A Seismograph
Spending On Goods Looks Like An Earthquake On A Seismograph
Spending On Goods Looks Like An Earthquake On A Seismograph
Bottom Line: The likelihood that the Fed completes the straight sequence of eight rate hikes which the market is now pricing seems very low. Feature Amid the uncertainties of the Ukraine crisis, there is one certainty. The latest surge in energy and grain prices is a classic supply shock. Prices have spiked because vital supplies of Russian and Ukrainian energy and grains have been cut. This matters for central banks, because to the extent that they can bring down inflation, they can do so by depressing demand. They can do nothing to boost supply. In fact, depressing demand during a supply shock is a sure way to start a recession. But what about the inflation that came before the Ukraine crisis, wasn’t that due to excess demand? No, that inflation came not from a demand shock, but from a displacement of demand shock – as consumers displaced their firepower from services to goods on a massive scale. This matters because central banks are also ill placed to fix such a misallocation of demand. Chart I-1 looks like a seismograph after a huge earthquake, and in a sense that is exactly what it is. The chart shows the growth in spending on durable goods, which has just suffered an earthquake unlike any in history. Zooming in, we can see the clear causality between the surges in spending on durables and the surges in core inflation. The important corollary being that when the binge on durables ends – as it surely must – or worse, when durable spending goes into recession, inflation will plummet (Chart I-2). Chart I-1Spending On Goods Looks Like An Earthquake On A Seismograph
Spending On Goods Looks Like An Earthquake On A Seismograph
Spending On Goods Looks Like An Earthquake On A Seismograph
Chart I-2The Goods Binges Caused The Core Inflation Spikes
The Goods Binges Caused The Core Inflation Spikes
The Goods Binges Caused The Core Inflation Spikes
But, argue the detractors, what about the uncomfortably high price inflation in services? What about the uncomfortably high inflation expectations? Most worrying, what about the recent surge in wage inflation? Let’s address these questions. Underlying US Inflation Is Running At Around 3 Percent In the US, the dominant component of services inflation is housing rent, which comprises 40 percent of the core consumer price index. Housing rent combines actual rent for those that rent their home, with the near-identically behaving owners’ equivalent rent (OER) for those that own their home. Given the state of the jobs market, there is nothing unusual in the current level of rent inflation. Housing rent inflation closely tracks the tightness of the jobs market, because you need a job to pay the rent. With the unemployment rate today at the same low as it was in 2006, rent inflation is at the same high as it was in 2006: 4.3 percent. In other words, given the state of the jobs market, there is nothing unusual in the current level of rent inflation (Chart I-3). Chart I-3Given The Jobs Market, Rent Inflation Is Where It Should Be
Given The Jobs Market, Rent Inflation Is Where It Should Be
Given The Jobs Market, Rent Inflation Is Where It Should Be
Given its dominance in core inflation, rent inflation running at 4.3 percent would usually be associated with core inflation running at around 3 percent – modestly above the Fed’s target, rather than the current 6.5 percent (Chart I-4). Confirming that it is the outsized displacement of spending into goods, and its associated inflation, that is giving the Fed and other central banks a massive headache. Yet, to repeat, monetary policy is ill placed to fix such a misallocation of demand. Chart I-4Given Rent Inflation, Core Inflation Should Be 3 Percent
Given Rent Inflation, Core Inflation Should Be 3 Percent
Given Rent Inflation, Core Inflation Should Be 3 Percent
Still, what about the surging expectations for inflation? Many people believe that these are an independent and forward-looking assessment of how inflation will evolve. Yet nothing could be further from the truth. The bond market’s expected inflation is just the result of an algorithm that uses historic inflation. And at that, an extremely short period of historic inflation, just six months.1 The upshot is that when the backward-looking six month inflation rate is low, like it was in the depths of the global financial crisis in late 2008 or the pandemic recession in early 2020, the market assumes that the forward-looking ten year inflation rate will be low. And when the backward-looking six-month inflation rate is high, like early-2008 or now, the bond market assumes that the forward-looking ten year inflation rate will be high. In other words: Inflation expectations are nothing more than a reflection of the last six months’ inflation rate (Chart I-5). Chart I-5Inflation Expectations Are Just A Reflection Of The Last Six Months' Inflation Rate
Inflation Expectations Are Just A Reflection Of The Last Six Months' Inflation Rate
Inflation Expectations Are Just A Reflection Of The Last Six Months' Inflation Rate
Turning to wage inflation, with US average hourly earnings inflation running close to 6 percent, it would appear to be game, set, and match to ‘Team Inflation.’ Except that this is a flawed argument. To the extent that wages contribute to inflation, it must come from the inflation in unit labour costs, meaning the ratio of hourly compensation to labour productivity. After all, if you get paid 6 percent more but produce 6 percent more, then it is not inflationary (Chart I-6). Chart I-6If You Get Paid 6 Percent More But Produce 6 Percent More, Then It Is Not Inflationary
If You Get Paid 6 Percent More But Produce 6 Percent More, Then It Is Not Inflationary
If You Get Paid 6 Percent More But Produce 6 Percent More, Then It Is Not Inflationary
In this regard, US unit labour costs increased by 3.5 percent through 2021, and slowed to just a 0.9 percent (annualised) increase in the fourth quarter.2 Still, 3.5 percent, and slowing, is modestly above the Fed’s inflation target, and could justify a slight nudging up of the Fed funds rate. But it could not justify the straight sequence of eight rate hikes which the market is now pricing. The Fed Is Praying For A ‘Hail Mary’ Fortunately, the bond market understands all of this. How else could you say 7 percent inflation and 2 percent long bond yield in the same breath?! This is crucial, because it is the long bond yield that drives rate-sensitive parts of the economy, such as housing and construction. And it is the long bond yield that sets the level of all asset prices, including real estate and stocks. Although the Fed cannot admit it, the central bank also understands all of this and hopes that the bond market continues to ‘get it.’ Meaning that it hopes that the long end of the interest rate curve does not lift too far and crash the economy, real estate market, and stock market. So why is the Fed hiking the policy interest rate? The answer is that there will be a time in the future when it does need to lift the entire interest rate curve, and for that it will need its credibility intact. Not hiking now could potentially shred the credibility that is the lifeblood of any central bank. Still, to maintain its credibility without crashing the economy the Fed will have to make the ‘Hail Mary’ move of (American) football. For our non-American readers, the Hail Mary is a high-risk desperate move with little hope of completion. Go long the September 2023 Eurodollar futures contract. To sum up, the likelihood that the Fed completes the straight sequence of eight rate hikes which the market is now pricing seems very low. Hence, today we are opening a new trade. Go long the September 2023 Eurodollar futures contract (Chart I-7). Chart I-7The Likelihood That The Fed Completes A Straight Sequence Of Eight Rate Hikes Seems Low
The Likelihood That The Fed Completes A Straight Sequence Of Eight Rate Hikes Seems Low
The Likelihood That The Fed Completes A Straight Sequence Of Eight Rate Hikes Seems Low
Additionally, stay underweight Treasury Inflation Protected Securities (TIPS) versus T-bonds (Chart I-8). Chart I-8Underweight TIPS Versus T-Bonds
Underweight TIPS Versus T-Bonds
Underweight TIPS Versus T-Bonds
And on a 12-month horizon, underweight the commodity complex, whose elevated prices are highly vulnerable to a near-certain upcoming demand destruction. Fractal Trading Watchlist Confirming the fundamental analysis in the preceding sections, the strong trend in both the 18 month out US interest rate future and the equivalent 3 year T-bond has reached the point of fragility that has identified previous turning-points in 2018 and 2021 (Chart I-9 and Chart I-10). This week we are also adding to our watchlist the commodity plays Canada versus Japan and AUD/KRW, whose outperformances are vulnerable to reversal. From next week you will be able to see the full watchlist of investments that are vulnerable to reversal on our website. Stay tuned. Finally, the underperformance of EUR/CHF has reached the point of fragility on its 260-day fractal structure that has identified the previous major turning-points in 2018 and 2020 (Chart I-11). Accordingly, this week’s recommended trade is long EUR/CHF, setting a profit target and symmetrical stop-loss at 3.6 percent. Chart I-9The Strong Trend In The 18-Month-Out US Interest Rate Future Is Fragile
The Strong Trend In The 18-Month-Out US Interest Rate Future Is Fragile
The Strong Trend In The 18-Month-Out US Interest Rate Future Is Fragile
Chart I-10The Strong Trend In The 3 Year T-Bond Is Fragile
The Strong Trend In The 3 Year T-Bond Is Fragile
The Strong Trend In The 3 Year T-Bond Is Fragile
Chart I-11Go Long EUR/CHF
Go Long EUR/CHF
Go Long EUR/CHF
Canada Versus Japan Is Vulnerable To Reversal
Canada Versus Japan Is Vulnerable To Reversal
Canada Versus Japan Is Vulnerable To Reversal
AUD/KRW Is Vulnerable To Reversal
AUD/KRW Is Vulnerable To Reversal
AUD/KRW Is Vulnerable To Reversal
Dhaval Joshi Chief Strategist dhaval@bcaresearch.com Footnotes 1 The expected 10-year inflation rate = (deviation of 6-month annualized inflation from 1.6)*0.2 + 1.6. 2 Source: Bureau of Labor Statistics Fractal Trading System Fractal Trades
The Fed Needs A ‘Hail Mary’ To Maintain Credibility Without Crashing The Economy
The Fed Needs A ‘Hail Mary’ To Maintain Credibility Without Crashing The Economy
The Fed Needs A ‘Hail Mary’ To Maintain Credibility Without Crashing The Economy
The Fed Needs A ‘Hail Mary’ To Maintain Credibility Without Crashing The Economy
6-Month Recommendations Structural Recommendations Closed Fractal Trades Indicators To Watch - Bond Yields Chart II-1Indicators To Watch - Bond Yields - Euro Area
Indicators To Watch - Bond Yields - Euro Area
Indicators To Watch - Bond Yields - Euro Area
Chart II-2Indicators To Watch - Bond Yields - Europe Ex Euro Area
Indicators To Watch - Bond Yields - Europe Ex Euro Area
Indicators To Watch - Bond Yields - Europe Ex Euro Area
Chart II-3Indicators To Watch - Bond Yields - Asia
Indicators To Watch - Bond Yields - Asia
Indicators To Watch - Bond Yields - Asia
Chart II-4Indicators To Watch - Bond Yields - Other Developed
Indicators To Watch - Bond Yields - Other Developed
Indicators To Watch - Bond Yields - Other Developed
Indicators To Watch - Interest Rate Expectations Chart II-5Indicators To Watch - Interest Rate Expectations
Indicators To Watch - Interest Rate Expectations
Indicators To Watch - Interest Rate Expectations
Chart II-6Indicators To Watch - Interest Rate Expectations
Indicators To Watch - Interest Rate Expectations
Indicators To Watch - Interest Rate Expectations
Chart II-7Indicators To Watch - Interest Rate Expectations
Indicators To Watch - Interest Rate Expectations
Indicators To Watch - Interest Rate Expectations
Chart II-8Indicators To Watch - Interest Rate Expectations
Indicators To Watch - Interest Rate Expectations
Indicators To Watch - Interest Rate Expectations
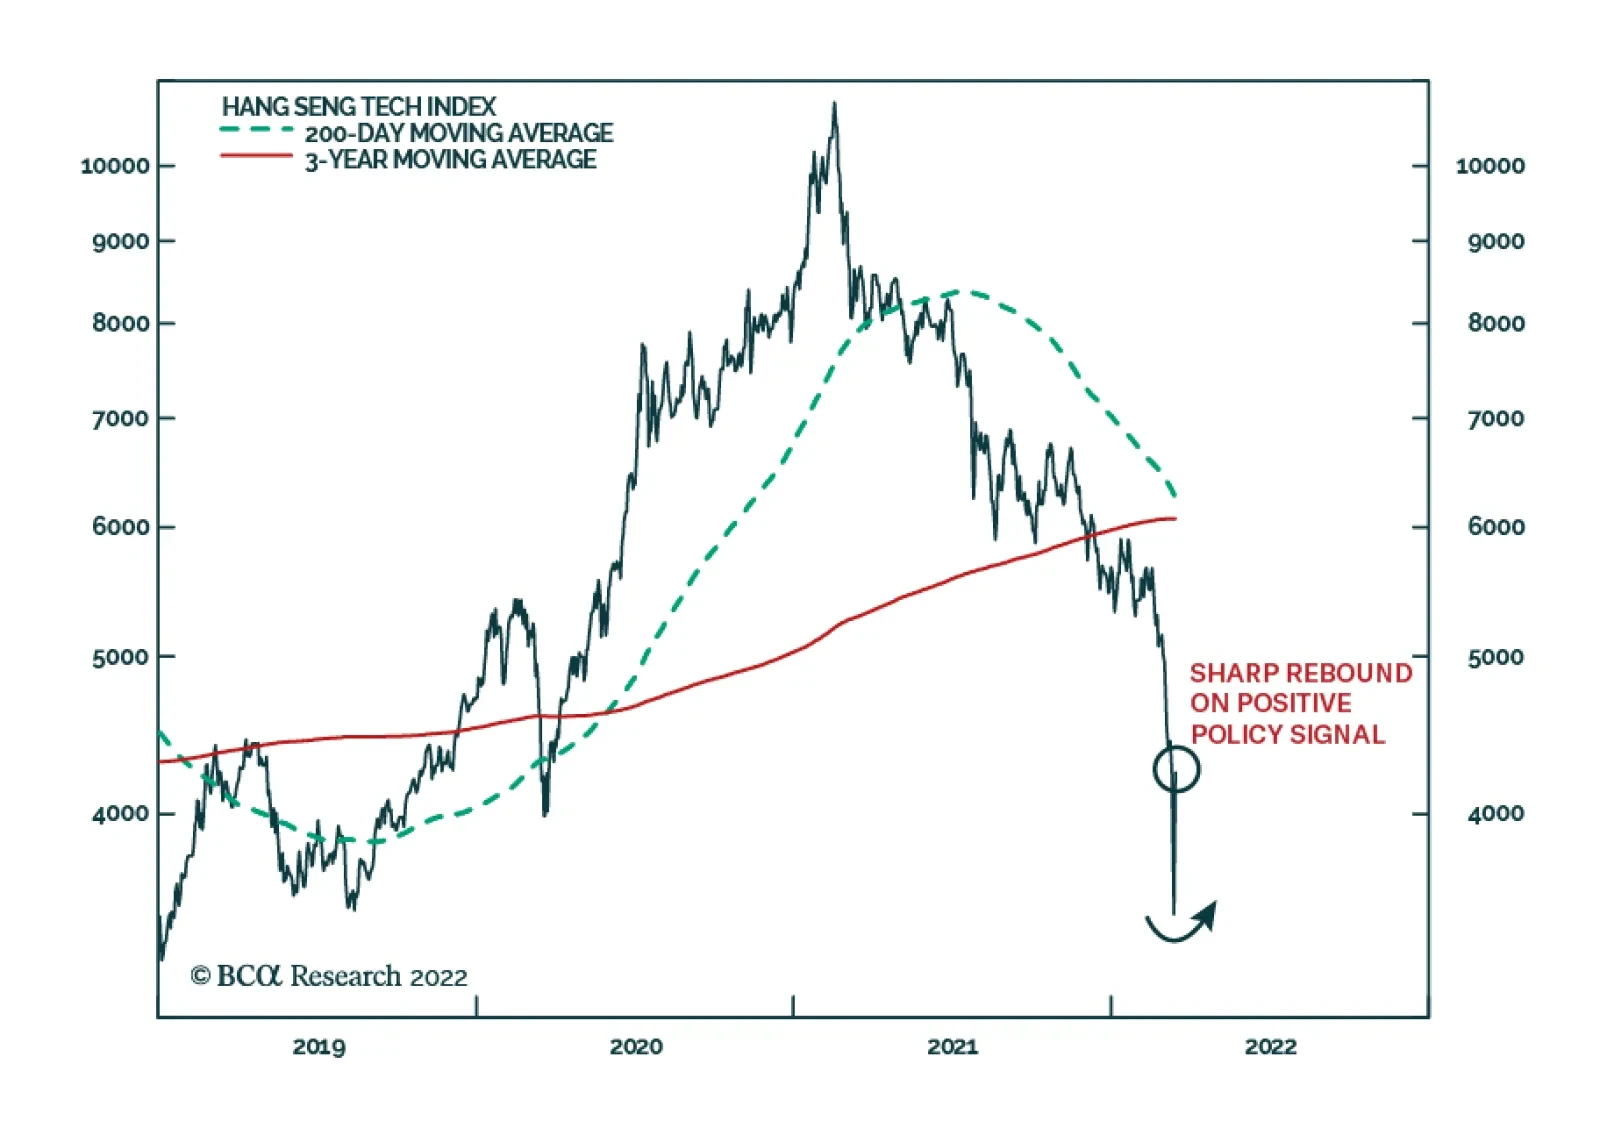
Global equity markets enjoyed a healthy rebound on Wednesday. Asian equities led the move higher as pledges from Beijing to support the economy and capital markets improved sentiment among investors. Hong Kong’s Hang Seng index rallied 9.08% and the CSI 300…
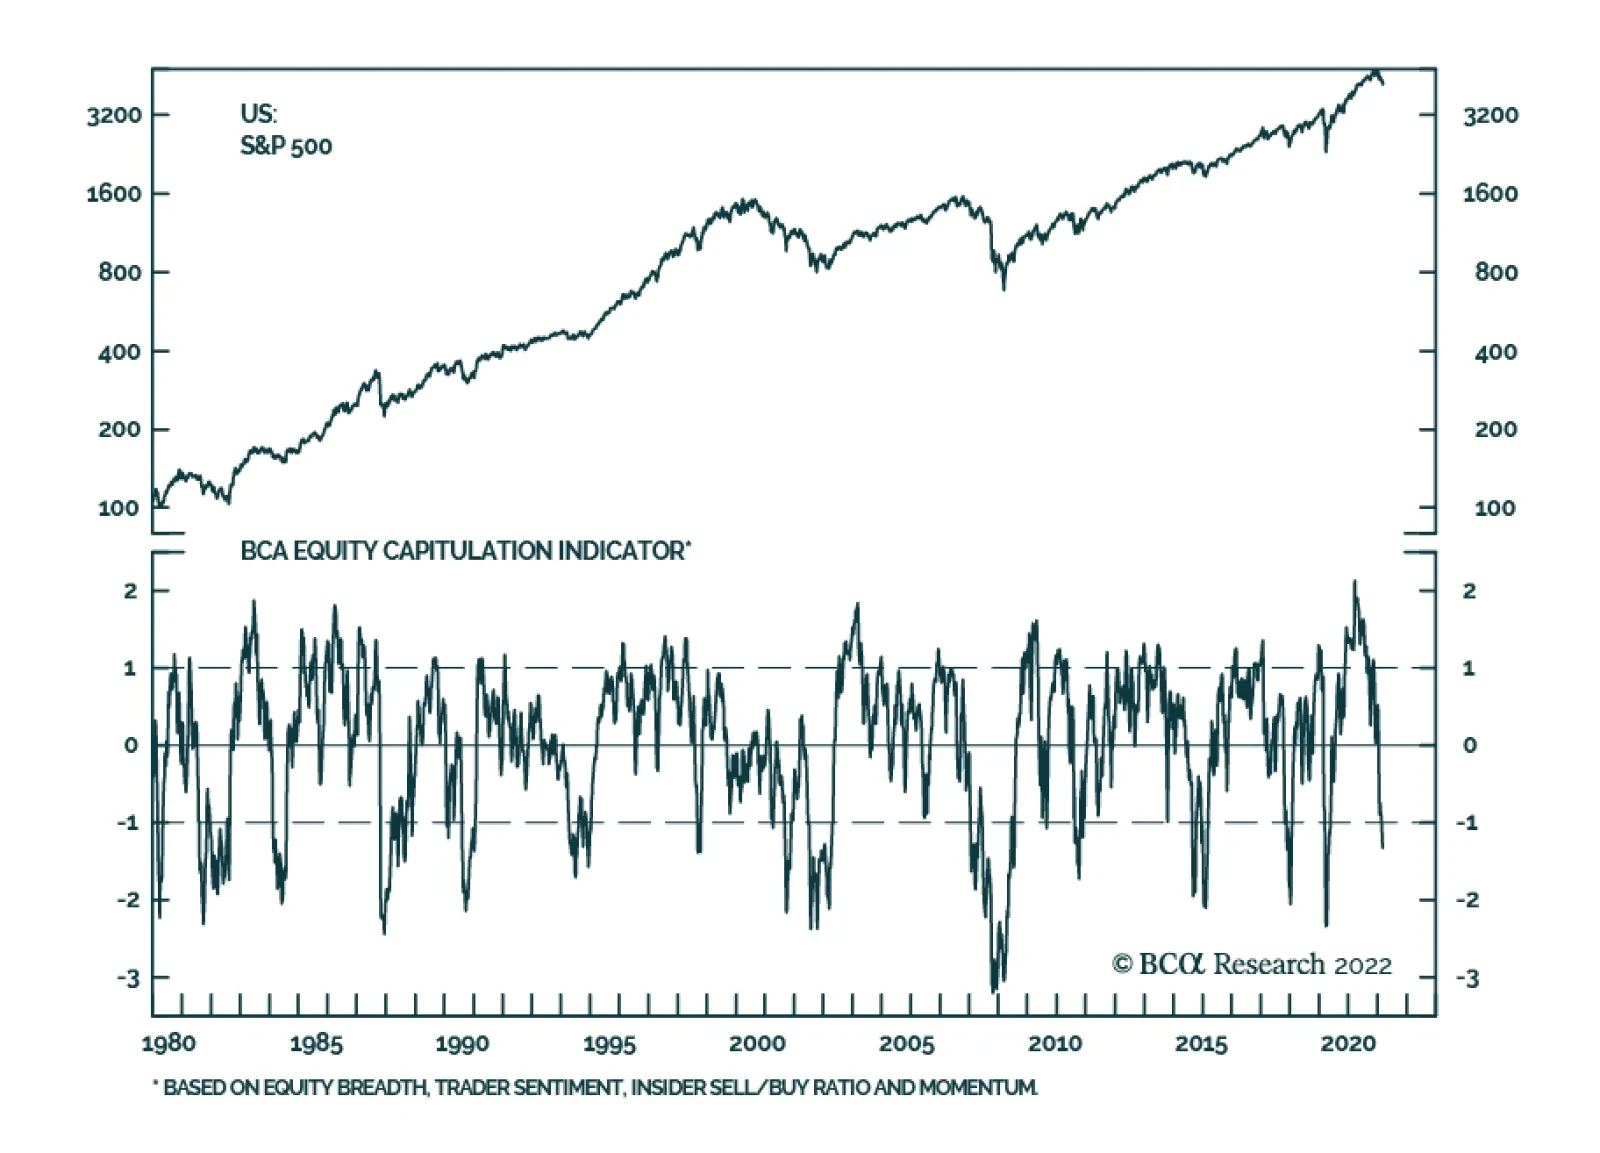
The US stock market has had a rough start to 2022. At its lowest point on March 8, the S&P 500 was down 12.5% year-to-date. It has since recovered slightly, and is up 4.5% since then. Meanwhile, the BCA Equity Capitulation Index – which is based on equity…
Executive Summary Global Oil Price Pushes Up Inflation Expectations
Global Oil Price Pushes Up Inflation Expectations
Global Oil Price Pushes Up Inflation Expectations
The US cut off of Russian energy exports has limited immediate impact because EU trade with Russia continues. Russia is unlikely to embargo the EU as it needs revenues to wage war. However, the EU will diversify away from Russia over time, which means that Russia will intensify its efforts to replace the government in Ukraine. The Biden administration began with an adversarial posture toward the energy sector, both US producers and Gulf Arab petro-states. Now it is adjusting its stance as prices surge. The OPEC states do not favor Biden but have an interest in calibrating production to avoid global recession and prolong their profit windfall. Even if the US restores the 2015 nuclear deal with Iran, which we doubt, investors should fade the oil price implications and stay focused on OPEC. Recommendation (Tactical) Inception Level Inception Date Return Long DXY (Dollar Index) 96.19 Feb 23, 2022 2.9% Bottom Line: Stagflation is the likeliest economic outcome of today’s global supply constraints. Feature Biden’s Oil Policy: Implications Will the Ukraine crisis lead to a US recession? The probability of a recession is 7.7% today, according to the bond market, but the oil price shock suggests that the probability will only increase from here. Stagflation, at least, is now highly likely. Short-term interest rates are rising faster than long-term rates, causing the 2-year/10-year Treasury slope to slide toward inversion, though it is not there yet. That would be a telltale sign of a looming recession (Chart 1). The 3-mo/10-year Treasury yield slope is nowhere near inverting and has a better record of predicting recessions than the 2-year/10-year. The Federal Reserve’s interest rate hikes are expected to cause the 10-year yield to rise and the yield curve to steepen. But exogenous shocks may push short rates even higher. When the oil price doubles, a recession often ensues. Out of the past seven recessions, five of them witnessed an oil spike beforehand. True, not every spike causes a recession. But the causality is clear. Today’s spike is large enough to be recessionary (Chart 2). The critical question is where will the price settle? If it settles above $90-$100 per barrel then it will erode global demand. Chart 1An End-Of-Cycle Crisis?
An End-Of-Cycle Crisis?
An End-Of-Cycle Crisis?
Chart 2Oil Price Often Doubles Before Recessions
Oil Price Often Doubles Before Recessions
Oil Price Often Doubles Before Recessions
Most likely the price will settle at around $85 per barrel by the end of 2022, and average $85 in 2023, according to our Commodity & Energy Strategy. High prices will discourage consumption and incentivize new production, leading to a price drop and new equilibrium. The OPEC cartel will increase production because they want to prolong the business cycle. Non-OPEC producers like US shale oil companies will also increase production. It is not likely that the US will significantly lift sanctions on Iran and Venezuela, though that would free up 1.3 million barrels per day and 700,000 barrels per day respectively. More on this below. Even so, this year’s energy spike will feed into a larger bout of inflation that is eroding real incomes. Headline consumer price inflation is running at 7.9% as of February, the highest in four decades. Core inflation is running at 6.4%. The Ukraine war did not prevent the European Central Bank from delivering a hawkish surprise in its fight against inflation on March 10, so it is even less likely to prevent the Fed from delivering a hawkish surprise on March 16. The Fed has a history of hiking rates even during geopolitical crises (as during the Arab oil embargo of 1973), which implies that the war in Ukraine will not prevent the Fed from hiking rates four times or more this year. There is a close relationship between the global oil price and the financial market’s long-term inflation expectations (Chart 3). When the costs of production and transportation go up, investors start to expect higher prices. Expectations are already rising because of the global pandemic, stimulus, supply constraints, wage pressure, and tardy policy normalization. Gasoline prices at the pump will shape consumer expectations (Chart 4). Chart 3Global Oil Price Pushes Up Inflation Expectations
Global Oil Price Pushes Up Inflation Expectations
Global Oil Price Pushes Up Inflation Expectations
Chart 4Geopolitics Compound Inflation
Geopolitics Compound Inflation
Geopolitics Compound Inflation
Yet high commodity prices are not coinciding with strong global growth and a weak dollar, as one might suspect. Global growth is falling and the dollar is strengthening. The energy shock from Russia will rattle importing countries like Europe, China, and India and thus enhance the dollar’s rise (Chart 5). Investor sentiment will suffer as the war in Ukraine reinforces the secular rise in geopolitical risk. Global policy uncertainty is also rising sharply, which will reinforce the dollar, weighing on global economic activity. Chart 5Dollar Strengthens on Weak Global Growth
Dollar Strengthens on Weak Global Growth
Dollar Strengthens on Weak Global Growth
Bottom Line: A stagflationary dynamic is taking shape. Moreover the risk of recession is underrated by the bond market’s measure of recession probability. Investors should maintain tactically bearish trades and cut losses on cyclically bullish trades that suffer from higher rates and persistent inflation. US Boycotts Russia And Begs OPEC The Biden administration’s decision to ban Russian oil exports – and to encourage private sector boycotts of the Russian energy trade – raises the potential for the Russian conflict to escalate beyond Ukraine’s borders. While a total boycott of Russian oil exports is unlikely, it would be one of the larger oil shocks in modern history (Chart 6). Unlike the Iranian attack on the Saudi oil refinery in 2019, the Russian shock would come amid an existing energy shortage. Chart 6Worst Case Oil Risk in Historical Context
Biden's Oil Shock
Biden's Oil Shock
There are two critical questions about US policy at this stage: Will the US foist its energy boycott on Europe, triggering a Russian retaliation? This could plunge Europe into recession and further upset the global economy. Will the US convince the OPEC cartel to increase oil production? A production boost would reduce prices and help to rebalance the economy, salvaging the business cycle. The next two sections discuss these options. US Boycotts Russia The first question is how Russia will respond to the US boycott and whether the Biden administration will try to force Europe to adopt the boycott. The US is comfortable boycotting Russian energy because oil and gas imports only account for 0.6% of GDP and those from Russia only 0.04%. Europe cannot make the same decision. While O&G imports are only 2.21% of GDP, and Russian O&G imports at 0.4%, these numbers will spike to near 2008 levels as a result of the price shock (Charts 7A & 7B). Major European countries, notably Germany, have already rejected the US boycott, and any EU direct sanctions require unanimity. The EU is instead outlining a plan to diversify away from Russia more gradually. This is a medium-term threat to Russia and hence a major concern for global stability but it is not an instant cutoff, which would cause an immediate recession in Europe. Chart 7AThe US Is Energy Independent...
Biden's Oil Shock
Biden's Oil Shock
Chart 7B...The EU Is Not
Biden's Oil Shock
Biden's Oil Shock
The EU’s plan would theoretically reduce its dependency on Russian energy by 66% by the end of the year. But that is easier said than done. Also, Europe cannot simply swap the US for Russia. American exports to the rest of the world could be redirected to Europe, but the switch requires an overhaul of supply chains. A total switch of US exports to Europe is impracticable in the short run and would leave other US allies dependent on Russian exports (Charts 8A & 8B). Chart 8AUS Will Not Replace Russian Energy Anytime Soon
Biden's Oil Shock
Biden's Oil Shock
Chart 8BUS Will Not Replace Russian Energy Anytime Soon
Biden's Oil Shock
Biden's Oil Shock
US shale producers are only starting to increase production. With WTI crude oil at $100, and Henry Hub natural gas spot price at $4.6 per million BTU, American production will speed up. But US companies are more focused on profitability and returns to shareholders than they were at the beginning of the shale boom, which has restrained oil production (Charts 9A & (9B). Chart 9AUS Production And Exports Increase After Pandemic Lull
US Production And Exports Increase After Pandemic Lull
US Production And Exports Increase After Pandemic Lull
Chart 9BUS Production And Exports Increase After Pandemic Lull
US Production And Exports Increase After Pandemic Lull
US Production And Exports Increase After Pandemic Lull
The Biden administration has not yet fully adopted the tactics necessary: promoting the domestic fossil fuel industry and coordinating it for purposes of national strategy. American oil executives complain that while the Biden administration courts foreign energy producers and contemplates arbitrarily lifting sanctions on Iran and Venezuela, it has not approached domestic producers about facilitating production.1 Meanwhile there is a risk that Russia will retaliate against western sanctions by cutting off natural gas to the EU, for instance via the Nord Stream I pipeline. This is a risk, rather than a base case, because Moscow would prefer to sell energy as long as Europe is buying – and even increase the amount it produces at today’s high prices. Russian energy exports to the EU account for 5% of Russian GDP and thus provide an important lifeline at a time when the country is suffering heavily under banking, technology, and trade sanctions (Chart 10). Russian natural resource exports on average provide 43% of government revenue, which is essential for Moscow to carry on its war effort (Chart 11). Chart 10Russia Will Not Punish EU For US Boycott
Biden's Oil Shock
Biden's Oil Shock
Chart 11Russia Needs EU Energy Imports
Biden's Oil Shock
Biden's Oil Shock
And yet Russians are now slapping an embargo on agricultural exports, constricting global food supply and pushing up food prices. The implication is that a reduction in energy exports to the EU is not out of the question, especially an incremental reduction aimed at increasing Russian diplomatic pressure on Europe. If the Russians cut off Europe, it will fall into a severe recession and the energy shock will risk a global recession. While US direct trade exposure to Europe is limited, at about 3.8% of GDP (Chart 12A), nevertheless the US would suffer from price pressures. The US is already seeing import prices rise toward 2008 levels (Chart 12B). Chart 12AUS Exposure To The EU Is Limited...
US Exposure To The EU Is Limited...
US Exposure To The EU Is Limited...
Chart 12B...But Its Import Prices Will Rise
...But Its Import Prices Will Rise
...But Its Import Prices Will Rise
Bottom Line: The US is boycotting Russian oil but not forcing the EU to join the boycott. Europe is pursuing gradual diversification but Russia is unlikely to cut off Europe’s supply. However, this dynamic is showing signs of faltering, which means investors are justified in taking further risk off the table. US Begs OPEC The Biden administration started off on the wrong foot with the Gulf Arab states by criticizing them for autocratic government and human rights abuses, threatening to withhold arms sales, and trying to restore the 2015 nuclear deal and détente with Iran. Now, with a global energy shock unfolding, Biden is going back to Saudi Arabia and the UAE and imploring them to increase oil production and ease the supply pressure. The Arab states are reportedly giving him the cold shoulder, ignoring his phone calls while answering Russian President Vladimir Putin’s calls.2 These states never have an interest in producing oil at any US president’s beck and call. The US and Iran have also reached a critical stage in nuclear negotiations. So it is only fitting that the Arab states play hard to get. While the UAE ambassador to the US suggested that his country supporting increasing production on March 9, the country’s energy minister said the opposite. However, the core OPEC states are even less likely to do Russia’s bidding. Moscow propped up the Syrian regime, arms and subsidizes Iran, and aspires to gain ever greater control over Middle East exports to Europe. The Gulf states also know that the Russians will produce as much energy as they can since they need the revenues to sustain their war (Chart 13). Chart 13Core OPEC Countries Have An Interest In Increasing Oil Supply
Core OPEC Countries Have An Interest In Increasing Oil Supply
Core OPEC Countries Have An Interest In Increasing Oil Supply
The Gulf states rely on the US military for national security, they fear that US-Iran détente will lead to US abandonment and Iranian regional ascendancy, and they seek to sustain their centrality to the global oil market. They want to prolong their export revenues in the context of a growing global economy for the sake of their own delicate internal stability and reforms. They do not aim to incentivize non-OPEC oil production and renewable energy transition with excessive prices, or to trigger a global recession (Chart 14). Hence the Saudi and UAE strategy will be to lower the oil price closer to their fiscal breakeven rate of $82.3 and $62.8 (oil price consistent with a balanced budget) and prolong the business cycle (Chart 15). Chart 14Core OPEC Does Not Want To Threaten Their Fiscal Future
Biden's Oil Shock
Biden's Oil Shock
Chart 15Current Oil Price Comfortably Supports Fiscal Spending In OPEC
Biden's Oil Shock
Biden's Oil Shock
The critical factor in the negotiation with the Biden administration will be Iran, their chief rival. Biden is trying to rejoin the 2015 nuclear deal, which would require removing sanctions in exchange for Iran’s halting its nuclear progress. A deal would bring 1.3 million barrels per day online, at least for the next two years or so. It could also prompt the Saudis or others to increase production to prevent Iran from stealing market share, as occurred in 2014 (Chart 16). Any deal would reduce the risk of military conflict in the short term and as such would remove some risk premium from oil prices. If Biden agrees to walk away from the Iran deal, then perhaps the Saudis and UAE will oblige him with a larger and quicker production boost. They know the Democratic Party is doomed in this year’s midterm elections anyway. Sanctions are not preventing the Iranians from exporting oil today and there is very little chance that they will truly abandon their quest for nuclear weapons (Chart 17). Chart 16Production Ramped Up Ahead Of The Iran Deal In 2015
Production Ramped Up Ahead Of The Iran Deal In 2015
Production Ramped Up Ahead Of The Iran Deal In 2015
Chart 17Production May Ramp Up Again As Iran Managed To Evade Sanction
Production May Ramp Up Again As Iran Managed To Evade Sanction
Production May Ramp Up Again As Iran Managed To Evade Sanction
Either way the core OPEC members need to adjust the oil supply to maintain market share and prolong the business cycle. Taking it all together, investors should expect oil prices to remain volatile and for oil supply risks to remain elevated, meaning that oil prices will likely resume their rise after the expected OPEC intervention. Biden is also tinkering with the idea of easing sanctions on Venezuela. This would take a long time and require regime change to come to fruition. Venezuela produces about 700,000 barrels per day at present, down from about 2 million bpd in 2017.Given the lack of capital, investment, and engineering expertise, the Venezuelans probably cannot increase production beyond 1 million bpd over the next year or so. Of that, maybe 600,000 barrels could be sent to export markets, according to our Commodity & Energy Strategist Bob Ryan. The US cannot remove all sanctions from Venezuela as it does not recognize the legitimacy of President Nicolas Maduro’s regime. The Department of Justice indicted Maduro in 2020. Accommodating Maduro will create even more bad blood between the Democrats and the Cuban-American voters in electorally critical Florida. US companies will be reluctant to get involved in oil production in Venezuela on such a flimsy basis, as they will fear future sanctions if Republicans win in 2024. So investment in Venezuela, and hence oil production, will remain limited even if Biden waives some sanctions. Bottom Line: Biden’s attempts to ease sanctions on Iran and Venezuela are unlikely to have a lasting impact on oil prices. But it is possible that he will convince the OPEC states to increase production, as their own interests support such a move. Investment Takeaways Comparing Russia’s 2022 invasion of Ukraine to the original invasion in 2014, the major trends are parallel: stocks are falling relative to bonds, cyclical sectors are underperforming defensives, and small caps are outperforming large caps (Chart 18A). Chart 18AMarket Response 2022 Versus 2014
Market Response 2022 Versus 2014
Market Response 2022 Versus 2014
Chart 18BMarket Response 2022 Versus 2014
Market Response 2022 Versus 2014
Market Response 2022 Versus 2014
If Russia imposes an energy embargo or OPEC refuses to increase production, then there will be an even larger global energy shock and a European recession that will weigh on global growth. The dollar will stay well bid in the near term. Value stocks are far outpacing growth stocks in the 2022 crisis, in keeping with high inflation and rising bond yields (Chart 18B). While we favor value over growth on a structural basis, we took the opposite stance as a tactical trade at the beginning of this year in expectation of falling bond yields, which has backfired. We are closing this trade for a loss of 7.7%. Matt Gertken Senior Vice President Chief US Political Strategist mattg@bcaresearch.com Footnotes 1 See Shannon Pettypiece, “White House, oil industry spar anew over drilling as gas prices surge”, NBC News, March 12, nbcnews.com. 2 See Holman Jenkins, “The Putin Endgame,” The Wall Street Journal, March 1, 2022, wsj.com Strategic View Open Tactical Positions (0-6 Months) Open Cyclical Recommendations (6-18 Months) Table A2Political Risk Matrix
Biden's Oil Shock
Biden's Oil Shock
Table A3US Political Capital Index
Biden's Oil Shock
Biden's Oil Shock
Chart A1Presidential Election Model
Biden's Oil Shock
Biden's Oil Shock
Chart A2Senate Election Model
Biden's Oil Shock
Biden's Oil Shock
Table A4APolitical Capital: White House And Congress
Biden's Oil Shock
Biden's Oil Shock
Table A4BPolitical Capital: Household And Business Sentiment
Biden's Oil Shock
Biden's Oil Shock
Table A4CPolitical Capital: The Economy And Markets
Biden's Oil Shock
Biden's Oil Shock