Equities

Dear Client, Next week, in lieu of our regular weekly report, I will be hosting two webcasts where I will discuss our view on China’s economy and financial markets. In particular, I will share our view on the announced economic growth target and stimulus measures for this year, as well as our takes on the recent developments in China’s onshore and offshore equity markets. The webcasts will be held on Wednesday, March 23 at 9:00 AM HKT (Mandarin) and Wednesday, March 23 at 9:00 AM EDT (English). I look forward to discussing with you during the webcast. We will return to our regular publishing schedule on Wednesday, March 30. Best regards, Jing Sima China Strategist Executive Summary Demand For Housing Remains In The Doldrums
Demand For Housing Remains In The Doldrums
Demand For Housing Remains In The Doldrums
Chinese policymakers set an ambitious goal for this year’s economic expansion. While the growth target is above market consensus and a positive surprise, the path will be full of obstacles. Policy restrictions will be the biggest hurdle. While the authorities will continue to ease some industry policies, it is unlikely that all regulations will be rolled back at once. Therefore, it is questionable whether the announced growth-supporting measures will be enough to offset the housing slump and a slow recovery in consumption. We remain cautious on Chinese stocks. In the near term, equities will face headwinds from risk-off sentiment among global investors and a prolonged downturn in domestic demand. Policymakers will eventually allow more aggressive easing in the next 6 to 12 months. We will look for signs of more reflationary efforts and a better price entry point to upgrade Chinese stocks. We are closing our tactical trade of Long MSCI Hong Kong Index/Short MSCI ACW, due to spillover effects from Chinese offshore tech stock selloff on the Hong Kong equity market. ASSET INITIATION DATE RETURN SINCE INCEPTION (%) COMMENT LONG MSCI HONG KONG INDEX / SHORT MSCI ALL COUNTRY WORLD 1/19/2022 -0.08 Closed Bottom Line: Chinese policymakers are aiming for above-expectation economic growth this year. However, we recommend that investors lie low given the substantial challenges that China faces in expanding its economy. Feature Beijing set the 2022 economic growth target during last week’s National People’s Congress (NPC) at “around 5.5%”, which exceeds the market consensus. The topline growth target is encouraging. However, the announced stimulus measures are less than meets the eye. Fiscal support will increase, but not massively. Monetary policy may ease further. However, the easing efforts since July last year have failed to boost sentiment among private-sector corporates and households. Importantly, policy restrictions in the past several years, such as reducing local governments’ shadow bank borrowing and property developers’ leverage, and stringent counter-COVID measures, are having a lasting effect on the economy. As such, China’s domestic demand will likely remain sluggish until more aggressive policy easing is introduced. Meanwhile, Chinese stock prices in absolute terms have been falling due to global equity market selloffs and concerns about China’s domestic economy, although Chinese onshore stocks have fared better than their offshore peers. We expect that China will eventually allow more substantive easing to shore up growth and meet the target. Meanwhile, investors should remain cautious. We recommend that global shareholders with exposure to Chinese onshore stocks maintain a neutral position in their portfolios for now. We continue to look for signs of more reflationary efforts and the right opportunity to upgrade Chinese onshore stocks, especially if prices decline further in the near term. We maintain our underweight stance on Chinese offshore stocks, in both absolute terms and relative to global equities. De-listing from the US stock exchange is a real risk for some of the big-name Chinese tech companies. We will provide more insights on this topic in the coming weeks. In the meantime, we are closing our tactical trade: Long MSCI Hong Kong Index/Short MSCI All Country World with a minor 0.08% loss. While the recent steep falls in the MSCI Hong Kong Index prices may provide some buying opportunities in the next 6 to 12 months, near-term downside risks are substantial due to geopolitical tensions as well as a new round of lockdowns in the mainland. An Ambitious Growth Target … The 5.5% growth goal set for 2022 is the lowest in more than three decades, but it is above the consensus forecast of close to 5% and the IMF’s projection of 4.8% (Chart 1). The target also marks a significant departure from the past couple of years and reinforces our view that the authorities are determined to ensure a stable domestic economy amid rising geopolitical turmoil (Table 1). Chart 1China Set An Above-Expectation Growth Target For 2022
China Set An Above-Expectation Growth Target For 2022
China Set An Above-Expectation Growth Target For 2022
Table 12022 Economic And Policy Targets
Aiming High, Lying Low
Aiming High, Lying Low
The stimulus measures unveiled at last week’s NPC imply that Beijing will mainly use fiscal levers to support the economy. Some key takeaways from the published Government Work Report include: Chart 2A Significant Jump In Available SPBs In 2022
Aiming High, Lying Low
Aiming High, Lying Low
A bigger fiscal push. The fiscal budget is set at 2.8% of GDP this year, or 3.37 trillion yuan, and is a modest decrease from the 3.2% deficit in 2021. The quota for local government special purpose bonds (SPBs) remains unchanged at RMB3.65 trillion yuan. However, local governments will be allowed to carry over SPB proceeds from last year, which will add about RMB1.1 trillion yuan to fund this year’s spending. This translates to about RMB4.7 trillion yuan in SPB in 2022, an 80% jump from the actual usage of 2.57 trillion yuan in 2021 (Chart 2). Furthermore, tax and fee cuts will total RMB2.5 trillion yuan, more than double the 2021 amount. Small and medium enterprises will receive value-added tax credits and refunds. Tax cuts will favor the service sectors most affected by the pandemic, along with manufacturing, and science and technology research. The fiscal budget also includes a record-high transfer from the central to local governments. Adding central government fund transfers and off-budgetary fiscal expenditures, we estimate that the augmented fiscal deficit this year will be around 7.8% of GDP, implying a fiscal thrust of more than 2% of GDP. The estimated thrust will be a reversal from the negative impulse of 2.1% of GDP in 2021 (Chart 3). Further easing in monetary policy. The government reiterated that money supply and total social financing (TSF) growth should be consistent with nominal GDP growth. We expect another cut next month in the reserve requirement ratio and/or the policy rate. We also maintain our view that the credit impulse – measured by the 12-month change in adjusted TSF as a percentage of GDP – will climb to 29% of GDP (assuming an 8% nominal GDP for 2022), 2 percentage points higher than the 27% of GDP in 2021 (Chart 4). Chart 3Fiscal Thrust In 2022 Could Reach More Than 2% Of GDP
Fiscal Thrust In 2022 Could Reach More Than 2% Of GDP
Fiscal Thrust In 2022 Could Reach More Than 2% Of GDP
Chart 4China Needs To Create RMB35 Trillion In Credit In 2022
China Needs To Create RMB35 Trillion In Credit In 2022
China Needs To Create RMB35 Trillion In Credit In 2022
Chart 5"Green Investment" Will Get A Big Boost This Year
Aiming High, Lying Low
Aiming High, Lying Low
A more relaxed carbon reduction policy. The government did not announce an annual numeric target related to de-carbonization or energy consumption intensity reduction. Nonetheless, a more relaxed policy setting will allow flexibility, especially in the first half of the year when infrastructure projects will be accelerated. In the second half, however, there is still a risk that de-carbonization efforts will step up to align the country’s carbon and energy intensity reduction with the 14th Five-Year Plan target. Still, the negative impact from de-carbonization seen last year will be much smaller this year, while green energy development will make an increased contribution to this year’s growth (Chart 5). Bottom Line: China set an ambitious economic growth target of 5.5% for the year, relying on fiscal stimulus to shore up topline economic growth. … But A Challenging Path Ahead Achieving growth of “around 5.5%” will not be easy. As noted in previous reports, the regulations put in place in a wide range of industries since 2017 significantly constrain growth in both credit creation and the economy. Furthermore, aggressive regulatory crackdowns on the property sector and internet-related industries last year, coupled with rising domestic COVID cases and a new round of lockdowns, will likely have enduring ramifications on private-sector sentiment and weaken the effectiveness of policy easing. The following risks are notable: Constraints on infrastructure investment. We expect infrastructure investment to pick up from last year’s meager 0.5% growth. Even so, a larger fiscal impulse for 2022 would not necessarily lead to an outsized increase in infrastructure spending by local governments. In 2019, the fiscal deficit widened to 5% of GDP from 3.5% in 2018 and the quota for local government SPBs increased by 60% from a year earlier. However, infrastructure investment only grew by 3.3% in 2019, 1.5 percentage points higher than that in 2018 (Chart 6). The key factor is that the rebound in shadow banking activities, which highly correlate with infrastructure spending by local governments, was subdued in 2019. The stock of shadow banking continues to shrink in February, indicating that local governments remain extremely cautious in expanding their off-balance sheet leverage (Chart 6, bottom panel). Chart 6Shadow Bank Lending Continues To Shrink In February
Shadow Bank Lending Continues To Shrink In February
Shadow Bank Lending Continues To Shrink In February
Chart 7Demand For Housing Remains In The Doldrums
Demand For Housing Remains In The Doldrums
Demand For Housing Remains In The Doldrums
Demand for housing is still in the doldrums. February’s credit data paints a bleak picture of demand for housing, which is also reflected in recent hard data on home sales (Chart 7). It is questionable whether policymakers will allow a significant re-leverage, i.e. a 2016/17-style widespread easing in the property sector to stimulate demand for housing. So far, the government has stated that the housing policy should be city specific. Some cities have already lowered mortgage rates and down payment thresholds. Pledged supplementary lending, a tool that the government utilized to monetize massively excess inventories in the market in 2015/16, has also ticked up (Chart 8). Nevertheless, we do not expect the authorities to allow a sharp upturn in home prices or leverage by households and/or property developers (Chart 9). The government reiterated its stance at last week’s NPC that “housing is for living in and not for speculation.” Chart 8PSL Injections Ticked Up This Year
PSL Injections Ticked Up This Year
PSL Injections Ticked Up This Year
Chart 9Policymakers Are Trying To Avoid Further Inflating The Housing Price Bubble
Policymakers Are Trying To Avoid Further Inflating The Housing Price Bubble
Policymakers Are Trying To Avoid Further Inflating The Housing Price Bubble
Chart 10Aggregate Demand For Housing Will Dwindle Along With Shrinking Labor Force
Aggregate Demand For Housing Will Dwindle Along With Shrinking Labor Force
Aggregate Demand For Housing Will Dwindle Along With Shrinking Labor Force
Furthermore, demands for housing and property-sector investment in China are set to structurally shift lower due to the country’s slumping birthrate and shrinking working-age population (Chart 10). China’s total population will start to shrink within the next five years and the United Nations estimates that China’s marriageable population will be less than 350 million by 2030 – a drop of nearly 100 million people from 2010. Slowing urbanization rates are also a constraint for housing demand. China’s urban population growth is on a sharp downtrend; only 12 million people moved to cities last year, less than half the number who migrated in 2016. Weak consumption. The NPC reported that the government will provide support in rural areas for the consumption of new-energy vehicles (NEVs) and home appliances. There also was a mention of services for elder care and tax credits for having babies. However, there was no indication of a fiscal transfer to low-income households or a cash payout/consumption voucher to boost the marginal propensity to spend. Chart 11Sharply Rising New Cases In China And Its Zero-COVID Policy Will Constraint Domestic Consumption
Sharply Rising New Cases In China And Its Zero-COVID Policy Will Constraint Domestic Consumption
Sharply Rising New Cases In China And Its Zero-COVID Policy Will Constraint Domestic Consumption
Ultimately, it will be difficult for Chinese policymakers to bolster consumption without relaxing COVID containment measures (Chart 11). The government has made it clear that relaxing COVID policy will not be possible in the near term, given the ongoing outbreaks in China. Therefore, any improvement in household consumption, which accounts for about 40% of China’s GDP, will remain modest. Bottom Line: China’s economic progress this year will hinge on whether a rebound in infrastructure investment can offset the negative effects from slumping demand for real estate and weak consumption. Investment Implications China will eventually ease policies more aggressively to ensure a stable domestic economic, financial and political environment against highly uncertain global and domestic backdrops. More easing and stimulus could be forthcoming by mid-2022, especially when the mainland's COVID situation is rapidly worsening and front-loaded fiscal supports will start to lose momentum. Meanwhile, Chinese stocks face substantial downside risks derived from the turmoil in global equity markets and a downturn in domestic profit growth. As witnessed in China’s onshore and offshore risk assets in the past two weeks, a slightly more positive signal from the NPC was not enough to offset the jitters from heightened geopolitical tensions and rising domestic COVID cases (Chart 12A and 12B). Chart 12AChinese Onshore Stocks Are Not Immune To Geopolitical Risks...
Chinese Onshore Stocks Are Not Immune To Geopolitical Risks...
Chinese Onshore Stocks Are Not Immune To Geopolitical Risks...
Chart 12B...But Have Fared Better Than Their Offshore Peers
...But Have Fared Better Than Their Offshore Peers
...But Have Fared Better Than Their Offshore Peers
We maintain our neutral stance on Chinese onshore stocks in a global portfolio, but do not yet recommend that investors buy in the onshore market in absolute terms. We also continue to recommend overweight Chinese government bonds versus stocks in the onshore market, and an underweight stance on Chinese offshore equities in both absolute and relative terms. Jing Sima China Strategist jings@bcaresearch.com Strategic Themes Cyclical Recommendations Tactical Recommendations
One of the key financial market ramifications of the war in Ukraine is its impact on energy markets. The price of Brent jumped from $95/bbl to an apex of $127/bbl less than two weeks into the conflict. Since this peak, Brent has fallen back down just below…
According to BCA Research’s Global Asset Allocation service, Value/Growth is an inferior framework to sector positioning. Quality remains a better factor than Growth. The recent rebound in the relative performance of Value versus Growth has been driven by…
Executive Summary Is Factor Investing Dead?
Is Factor Investing Dead?
Is Factor Investing Dead?
After decades of outperformance, in the past few years equity factors have started to underperform the broad indexes. But this may just be because US-centric factor research and US-dominated global factor indexes have masked an underlying divergence in the behavior of factor premiums in major countries/regions. In this report, we identify differences in smart beta strategies in the US, euro area (EMU), UK, Japan, Canada, Australia, and emerging markets (EM). Quality and Minimum Volatility factors are the most consistent across all markets. However, the magnitude of the factor premiums varies significantly among certain countries/regions. These variations can be attributed to a factor’s differing exposure to the same sector in specific countries, as well as the diverse performance of the same sector in specific countries. Value/Growth is an inferior framework to sector positioning. Quality remains a better factor than Growth. Bottom Line: Factor investing is still a viable investing approach, but investors should consider that factor premiums have diverged among major countries/regions. Factor strategies may be less profitable in the US, Japan, and Australia. We suggest that global investors implement smart beta strategies on an individual country basis to better capture the factor premium in each country/region. Feature Chart 1Diverging Factor Performance
DIVERGING FACTOR PERFORMANCE
DIVERGING FACTOR PERFORMANCE
Late last year, quant hedge fund AQR announced it would cut back resources because poor performance had induced significant investor outflows.1 Based on MSCI’s diversified multi-factor (DMF) index, which is a bottom-up 4-factor-index (value, momentum, quality and size) optimized using Barra equity models,2 the global DMF index underperformed the MSCI ACWI by 21% between March 2018 (when the relative performance peaked) and the end of January 2022, even though it had outperformed by 373% over the previous 20 years (Chart 1, top panel). Many clients have asked: Is factor investing dead? As shown in Chart 1, however, MSCI Global DMF’s recent poor relative performance was driven largely by a 23.6% underperformance from the developed markets (DM), especially the US (33% underperformance) and Japan (23.6% underperformance), while the DMF index in the emerging markets (EM) lagged its benchmark by only about 1% in the same period. We have advocated a simple approach to factor allocation to smooth out the cyclicality of individual factors by equally weighting five time-tested factors: Quality, Momentum, Minimum Volatility (Min Vol), Value and Equal Weight. Our equally-weighted-5-factor aggregate (EW5) index is less volatile than the more sophisticatedly optimized DMF; it therefore suffered less underperformance in the same period. However, even with this approach, the regional divergence is still notable, with the EW5 factor index in the developing markets underperforming its benchmark by 9%, while the EM EW5 factor index outperformed its benchmark by about 5.5% (Chart 1, panels 2 and 3). Interestingly, the EW5 index for Japan looks more like that for the US than it looks like the Japanese DMF (Chart 1, panels 4 and 5). This highlights the importance of factor allocation methodology. Table 1US Dominance In Global Markets
Is Factor Investing Dead?
Is Factor Investing Dead?
US equities dominate the global equity index by market capitalization. Momentum and Quality, the two best performing factors globally, have even higher weightings in US companies than the broad benchmark, as shown in Table 1. An academic paper published in 2019 based on studies of the US and 38 international stock markets indicates that the US is the only country with a statistically significant, economically meaningful and robust post-publication decline of long-short equity factor returns.3 This is because the US is the most researched market and large mispriced anomalies are arbitraged away quickly after they are identified in academic publications, which results in lower strategy returns. Most quant funds are US-focused, which may explain the ill fortunes of some quant funds. Smart beta strategies are long-only factor strategies, instead of long-short strategies. At the aggregate level, the MSCI factor indexes in developed markets and emerging markets performed much better than in the US, in line with the academic findings (Chart 1, panels 2, 3, and 4). Yet, the Japanese DMF index’s relative performance peaked in October 2012 and has been in a consistent down trend since that time (Chart 1, panel 5). Our research shows that Japan is not an anomaly. Factor divergence among countries exists not only at the aggregate level, but also at the individual factor level. Factor Performances Diverge Among Countries/Regions Factor returns in the US, UK, EMU, Japan, Canada, Australia, and EM, both in absolute and relative terms, have had notable divergences in the past 20 years, as shown in Table 2.4 Several observations from Table 2: Quality and Min Vol are two factors with positive premiums in all countries. In terms of magnitude, however, Min Vol premiums in the US, Japan and Australia are the closest to zero, while the EM scores the highest. Quality premium in Australia is also close to zero while the UK stands out. Momentum is the best performing factor in all countries/regions except in Japan where it has a slightly negative premium. The ineffectiveness of Momentum in Japan may be due to its cultural biases. Momentum tends to fare better in countries that promote individuality (unlike Japan) and where self-attribution and overconfidence are more pervasive. EM is the only market where our five preferred factors (Momentum, Quality, Min Vol, Value and Equal Weight) have had positive premiums, even though the Value premium is not statistically different from zero, while the Growth premium is negative. Despite the well-telegraphed underperformance of Value versus Growth in the US and global markets, this has not been the case in Japan, Canada, and the EM. Momentum, Quality, Min Vol and Value in the EM and Canada have much higher absolute returns than in the US. This aspect cannot be fully explained by the overall index performance difference between these countries and the US. Even though Momentum, Quality, Min Vol and Value in the UK and euro area have returned much less than their US counterparts, the magnitude of the underperformance of each factor is much smaller than what the overall index performance divergence would imply. Table 2Factor Performance Divergence*
Is Factor Investing Dead?
Is Factor Investing Dead?
The widely quoted explanation for the impressive factor performance in the EM, especially in the Chinese A-share market, is that emerging markets have higher trading costs such that it’s harder to arbitrage away the mispriced anomalies. It’s true that trading cost is higher in the EM than in the US, which explains why there are fewer EM-dedicated quant funds than US-focused quant funds. Trading cost alone, however, cannot fully explain the exceptionally large premiums in EM Momentum, Quality and Min Vol compared with the US. In fact, the market with the best factor relative performance since the end of 2001 has been the UK (Chart 2) where trading costs are comparable to the US. The EM is the second in terms of relative returns even though it is more volatile than the euro area. Canada has also performed better than the US, while Australia has been the least favorable market to harvest any factor premium. Japan behaves more like the US, yet with higher volatility. The risk-adjusted active return, defined as the average of the return difference (between EW5 and benchmark) divided by the volatility of the return difference, on an annualized basis using monthly returns, is illustrated in Chart 3. The chart shows both the full-period (from December 2001 to January 2022) risk-adjusted active return (RAAR) and four-year moving RAAR to demonstrate how factors have evolved in each market. Several observations can be made from Chart 3: In the past 20 years, factor premiums (aka active factor returns) in the US have gone through three stages: High premium, low positive premium and then sharply declining premium to negative territory. The last stage started about four years ago. The US factor premium is at its lowest level in the past 20 years and is also the lowest among the seven countries/regions (Chart 3, panel 5). This supports the argument that too many quant funds trade with each other in the US equity market, resulting in lower and lower factor returns. Japan shares a similar pattern with the US, but on a much smaller scale (Chart 3, panel 4). Canada and Australia are similar because their indexes are dominated by financials and commodities. The four-year RAAR trends oscillate in a similar fashion in both countries, but the Canadian cycle seems to lead the Australian cycle by about 2-1/2 years. Canada has a meaningfully positive average factor premium and its four-year RAAR is near a historical low. In contrast, Australia’s average premium is close to zero and its four-year RAAR is still above previous lows (Chart 3, panels 6 and 7). The EMU is the only market with a positive four-year moving RAAR, currently at the well-established lower bound (Chart 3, panel 2). The UK has the highest average premium. It is the only market in which the four-year RAAR has had large cyclical swings and only two brief periods in negative territory (Chart 3, panel 1). EM is the only market where the four-year RAAR has improved since the Covid-19 pandemic started in March 2020 (Chart 3, panel 3). Chart 2Factor Relative Return Performance*
FACTOR RELATIVE RETURN PERFORMANCE*
FACTOR RELATIVE RETURN PERFORMANCE*
Chart 3Risk-Adjusted Active Performance
RISK-ADJUSTED ACTIVE PERFORMANCE*
RISK-ADJUSTED ACTIVE PERFORMANCE*
Bottom Line: US-centric factor research and the US-dominated global factor indexes have masked different behaviors of factors in various countries/regions. Thus, it is important to analyze each market instead of drawing investment conclusions from US-based research. What Drives The Divergence In Quality Premium? The Quality factor has been consistently rewarded, but the magnitude of the Quality premium varies significantly among countries/regions, and non-US countries have low correlations with the US, as shown in Table 2 (on page 4) and Charts 4 and 5. Chart 4Quality Performance Divergence*
QUALITY PERFORMANCE DIVERGENCE*
QUALITY PERFORMANCE DIVERGENCE*
Chart 5Quality Premium* Country Correlation
Is Factor Investing Dead?
Is Factor Investing Dead?
MSCI Quality is defined by three accounting measures: Return on equity (ROE), debt-to-equity and five-year volatility of EPS YoY growth. Earnings may be affected by accounting standards. Countries have different accounting standards, which may explain part of the country divergence in Quality. Our research focuses on an important aspect of Quality, which is persistence, i.e., a Quality stock today will be a Quality stock in the future. The implication is that the Quality factor index has a low turnover and its sector composition does not change much over time. As such, we can take a snapshot and see the relationship between Quality and sector exposure. The sector weights of the broad benchmark in each market are shown in Table 3. Notably, the US and EM have the highest exposure to the Tech sector while both the UK and Australia have little. Although Australia and Canada are both regarded as commodity-driven markets, they have dissimilar exposures to non-Financials: Australia is concentrated in Materials and Healthcare, while Canada has a more even exposure in Energy, Industrial, Materials and Tech. Table 3Broad Market Sector Compositions
Is Factor Investing Dead?
Is Factor Investing Dead?
Given that Quality is measured on profitability, capital structure and earnings stability, does Quality show universal sector preference? The answer is both Yes and No. Yes, because Quality is universally underweight Financials, Energy and Utilities (Table 4). It is also overweight Tech and underweight Real Estate in all markets, except Australia. Tech has outperformed Financials, Utilities and Energy in general (except for Canada), therefore, these three sector tilts may explain the universal existence of Quality premium (Chart 6). Table 4Quality Index Sector Deviations
Is Factor Investing Dead?
Is Factor Investing Dead?
Chart 6What Drives Quality Premium?
WHAT DRIVES QUALITY PREMIUM?
WHAT DRIVES QUALITY PREMIUM?
However, the commonality ends here. Canadian Tech has underperformed Financials by a very large margin (Chart 6, panel 3), which would have caused a huge underperformance in Quality; Quality indexes in the UK and EMU have benchmark exposures to Tech. So what else have contributed to Quality’s outperformance in these three countries/regions? A look at their exposures to other sectors reveals the answers. In the UK, EMU and Canada, Quality indexes have also overweight tilts in Industrials, Consumer Discretionary and Consumer Staples (Table 4). These three sectors have all outperformed their respective benchmarks in the past 20 years, as shown in Table 5. The table also shows that Consumer Staples is the only sector that has outperformed in all markets, yet both US and Australian Quality indexes underweight this sector. Table 5Sector Performance*
Is Factor Investing Dead?
Is Factor Investing Dead?
In addition, in both the UK and Canada, Quality overweights Materials, which is a top outperforming sector in the UK, but an underperforming sector in Canada. Materials also outperforms in the EMU, yet EMU Quality underweights it. Despite the impressive overall outperformance since 2001, the Quality factor in DM has suffered in the past few years, especially since the Covid 19-induced selloff in March 2020. Quality relative performance in EM peaked long before DM but has stood out as the only significant outperformer since March 2020. This is because profitability in Quality has improved in EM but deteriorated in the US and other DM countries as shown in Charts 7 and 8. Chart 7Quality Premium Driver: ROE*
QUALITY PREMIUM DRIVER: ROE*
QUALITY PREMIUM DRIVER: ROE*
Chart 8Quality Premium Driver: EPS*
QUALITY PREMIUM DRIVER: EPS*
QUALITY PREMIUM DRIVER: EPS*
Chart 9Quality Premium Driver: Valuation*
QUALITY PREMIUM DRIVER-VALUATION*
QUALITY PREMIUM DRIVER-VALUATION*
Valuation-wise, Quality indexes in the UK and Canada are at their cheapest levels since 2013, while Japan has become more expensive. Meanwhile, Quality valuation in the US, EMU and Australia is in line with their respective historical average5 (Chart 9). Bottom Line: Quality premium is driven by profitability and has strong sector preferences. The divergence of Quality premium among countries indicates that the same sector in different countries does not necessarily share the same behavior relative to its own benchmark. Sector behaviors in each market have not been as consistent as globalization would have implied, even though “global sectors” have become a well-accepted concept. What Drives The Min Vol Premium Divergence? Beside Quality, Min Vol has consistently outperformed in all the countries/regions in the past 20 years, even though the premiums in the US and Japan are close to zero, as shown in Table 2 on page 4. Over time, however, Min Vol’s relative performance is very cyclical. At the global aggregate level, this cyclicality is determined by its defensive nature given its positive correlation with the relative equity return ratio of Defensives/Cyclicals and negative correlation with bond yields. It is no surprise that the strong recovery in global equities and the rise in bond yields have caused Min Vol to underperform the broad market since March 2020. What is surprising, however, is the magnitude of the underperformance, which cannot be explained by historical relationships (Chart 10). Chart 10What Drives Global Min Vol Premium?
WHAT DRIVES GLOBAL MIN VOL PREMIUM?
WHAT DRIVES GLOBAL MIN VOL PREMIUM?
Looking at the global aggregate only, however, can provide misguided information, because Global Min Vol is dominated by the US (56.81%) and Japan (9.88%), where Min Vol has performed the worst. In the most recent cycle since March 2020, the US is the only country where Min Vol has deviated sharply from the historical relationship with the relative performance of defensives/cyclicals and with bond yields, incurring the largest relative performance drawdown ever, erasing all the relative gains achieved in the previous two decades (Chart 11A). Japanese Min Vol also suffered large drawdown, but was in line with the defensives/cyclicals, albeit undershooting what implied by the bond yield (Chart 11B). The relative performance of Min Vol in the UK, Canada, EM, and Australia all behaved in line with what is implied by the historical relationships with bond yields and defensives/cyclicals, while Min Vol in EMU does not have a close correlation with defensives/cyclicals (Charts 11 C-G). Chart 11AUS Min Vol Premium
US MIN VOL PREMIUM
US MIN VOL PREMIUM
Chart 11BJapan Min Vol Premium
JAPAN MIN VOL PREMIUM
JAPAN MIN VOL PREMIUM
Chart 11CUK Min Vol Premium
UK MIN VOL PREMIUM
UK MIN VOL PREMIUM
Chart 11DEMU Min Vol Premium
EMU MIN VOL PREMIUM
EMU MIN VOL PREMIUM
Chart 11ECanada Min Vol Premium
CANADA MIN VOL PREMIUM
CANADA MIN VOL PREMIUM
Chart 11FAustralia Min Vol Premium
AUSTRALIA MIN VOL PREMIUM
AUSTRALIA MIN VOL PREMIUM
Chart 11GEM Min Vol Premium
EM MIN VOL PREMIUM
EM MIN VOL PREMIUM
Min Vol has become the worst performing factor since March 2020, led by the US, Japan, and EMU, while the UK has been almost flat, as shown in Table 6. This is in stark contrast to its historical track record (Table 2 on page 4) but can be explained by its defensive tilt in a strong equity market. Currently, Min Vol’s general defensive nature is reflected by its overweight in Consumer Staples and underweight in Consumer Discretionary, overweight in Communication Services and underweight in Energy in all markets. In interest-rate-sensitive sectors, Min Vol overweighs Utilities in all markets except Japan and underweights Financials in all markets, except EM (Table 7). Table 6Min Vol Was The Worst Performer Since The Covid-Induced Recovery*
Is Factor Investing Dead?
Is Factor Investing Dead?
Table 7Min Vol Index Sector Deviations
Is Factor Investing Dead?
Is Factor Investing Dead?
Communication Services in the UK and Australia bucked the trend, outperforming the broad market. UK Financial also opposed the trend but did not outperform. In addition, the UK is overweight in Real Estate, which did much better than the broad market (Table 8). Table 8Sector Performance Since March 2020
Is Factor Investing Dead?
Is Factor Investing Dead?
Chart 12Min Vol Premium Divergence: Valuation*
MIN VOL PREMIUM DIVERGENCE:VALUATION*
MIN VOL PREMIUM DIVERGENCE:VALUATION*
Min Vol in EM has an overweight in Financials, which also outperformed. In addition, EM Consumer Discretionary resisted the general trend, coming in under its benchmark by 17% annualized; an underweight in this sector contributed to EM’s Min Vol’s performance. Why has US Min Vol performed so badly? According to a GAA Special Report published in January 2020, extreme overvaluation of Min Vol relative to the broad market could induce poor subsequent performance in near future. US Min Vol reached peak valuation relative to the market in 2019, and the subsequent underperformance was accompanied by sharp multiple contraction. Currently, Min Vol’s relative valuation is in line with historical average in the US, implying the turnaround since November 2021 may have further staying power (Chart 12). Bottom Line: Global Min Vol’s defensive tilts explain its underperformance since March 2020. However, divergences in the magnitude of underperformance among countries is explained by different sector exposures and the varying performance of some sectors in different countries, in addition to relative valuation. Chart 13Value Vs. Growth: Is This Time Different?
VALUE VS. GROWTH: IS THIS TIME DIFFERENT?
VALUE VS. GROWTH: IS THIS TIME DIFFERENT?
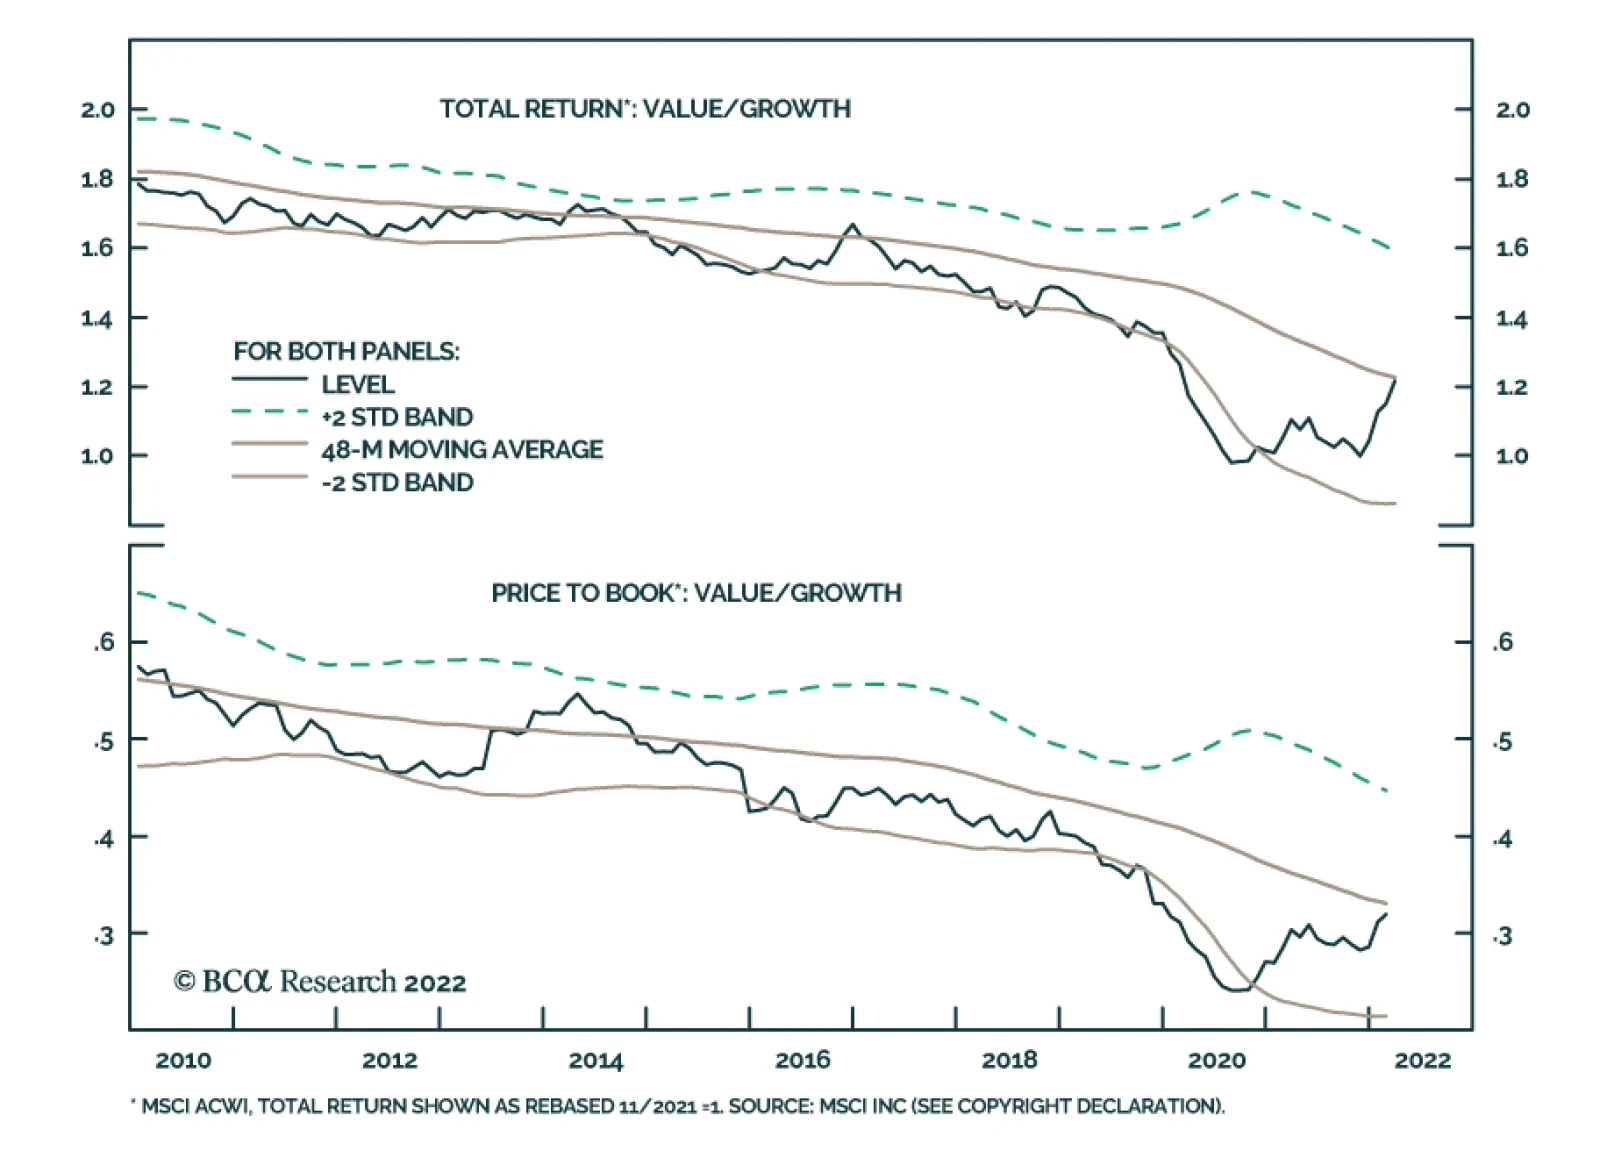
Is It Time To Overweight Value Versus Growth? This is one of the most frequently asked questions over the past few years, especially after the turnaround in AQR last year hit the newswire. The impressive performance of AQR so far this year has prompted more heated debate on the sustainability of the “Revenge of Value” after Value's longest streak of underperformance).6 The recent rebound in the relative performance of Value versus Growth has been driven by extremely oversold conditions, very cheap valuation and faster EPS growth led by the rise in global bond yields. Even though sector exposures change over time for Value and Growth, sector exposures to Financials and Tech have been stable since 2010 at the global aggregate level (Chart 13). The large bets in Financial, Utilities and Tech are universal, as shown in Table 9. Other sector exposures in specific countries vary significantly. For example, the US Value/Growth split is basically between Tech, Communication Services and Consumer Discretionary versus the other eight sectors. These three sectors are dominated by a few mega-cap stocks. The other eight sectors are a mixed bag of cyclicals, defensives, and interest rate sensitives, which have different macro drivers. It does not make sense to overweight them together. It is important to note that Consumer Staples and Healthcare are overweight in Growth outside the US and EMU. Table 9Sector Tilts In Value And Growth
Is Factor Investing Dead?
Is Factor Investing Dead?
In addition, Growth has similar sector preferences as Quality (Table 4 and Table 9), which explains the high correlation between the two factor premiums (Chart 14A), However, Quality has been a much better factor than Growth outside the US and Australia. In the US, Quality and Growth are almost the same with a stable correlation, but Quality has been inferior to Growth in Australia (Chart 14B). Chart 14AClose Correlation* Between Quality And Growth
CLOSE CORRELATION* BETWEEN QUALITY AND GROWTH, BUT...
CLOSE CORRELATION* BETWEEN QUALITY AND GROWTH, BUT...
Chart 14BQuality Is Superior To Growth Outside US And Australia
QUALITY IS SUPERIOR TO GROWTH OUTSIDE US AND AUSTRALIA
QUALITY IS SUPERIOR TO GROWTH OUTSIDE US AND AUSTRALIA
Finally, Value and Growth behave very differently in various market-cap segments, as shown in Table 10. Despite the well-telegraphed underperformance of Value versus Growth by the media, Value has consistently outperformed Growth in Canada, EM and Japan. Furthermore, mid-cap Value has also outperformed mid-cap Growth universally.
Image
Bottom Line: Value is extremely cheap and the rebound from an extremely oversold condition has been supported by the relative earnings trend and a rise in interest rates. Yet the mixed bag of sector exposure makes the Value/Growth allocation inferior to sector allocation. Investors who want to focus on Growth are advised to look for Quality outside of the US and Australia. Conclusions Related Report Global Asset AllocationValue? Growth? It Really Depends! The US-centric factor research and media coverage have masked an underlying divergence of factor premiums in specific countries/regions. Factor premiums in the UK, EMU, Canada, and EM have been stronger than in the US, while Japan and Australia have been weaker. This divergence can be explained by different sector exposures of the same factor, along with varying behaviors of the same sector in specific countries/regions. While factor investing is not dead, it may be less profitable to utilize in the US, Japan, and Australia. We suggest that global investors implement smart beta strategies on an individual country basis to better capture the factor premium in each country. Even though Quality, Min Vol and Momentum have been outperformers in the past 20 years, all factors have embedded cyclicality. We do not advocate factor timing and reiterate our long-standing approach of equally weighting the five factors to smooth out the cyclicality of individual factors. Value/Growth is a popular style split; however, it is an inferior framework to sector positioning. In addition, Quality is a better factor than Growth, which is already included in our five-factor approach. Xiaoli Tang Associate Vice President xiaolit@bcaresearch.com Footnotes 1 Please see "Quant Hedge Fund Icon AQR Cuts Back as Investors Exit," Chief Investment Officer, dated November 15, 2021. 2 Please see "MSCI Diversified Multiple-Factorindexes Methodology," MSCI.com, dated May 2018. 3 Please see "Anomalies across the globe: Once public, no longer existent?" Journal of Financial Economics, Volume 135, Issue 1, January 2020, Pages 213-230. 4 Historical data for all MSCI factor indexes in major markets is available for this period 5 Since Jan 2013 based on MSCI data availability. 6 Jessica Hamlin, "AQR Posts Record Performance in January," Institutional Investor, dated February 9, 2022.
Our colleagues at BCA Research’s US Investment Strategy service do not think equities have bottomed, but they expect that they will generate a positive real return between now and the rest of the year. The S&P 500 can live up to less-than-demanding…
Executive Summary Winners And Losers
The Impact Of The Ukraine War On The US Economy And Equity Sectors
The Impact Of The Ukraine War On The US Economy And Equity Sectors
Combining Russia and Ukraine: Taken together, Russia and Ukraine account for a small fraction of global trade. However, Russia is a key player in the global energy and metals markets, providing rare materials like palladium. Ukraine is a sizable agricultural producer, as well as an exporter of specialized products such as neon. Effects on global trade: Shortages of metals and agricultural goods will reverberate across the global economy, exacerbating shortages and supply disruptions. Manufacturer anxiety about the availability of raw input materials catalyzed an explosive rally in the commodity universe. Effect on the US companies: Most US equity sectors have limited direct sales exposure to Russia. However, self-sanctioning will have an adverse immediate effect on many multinationals, while indirect effects of the war will be even more impactful. Winners and losers: At the margin, the escalation in Ukraine is a net positive for Energy, Big Tech, and Metals & Mining, while Travel, Consumer Staples, Semiconductors Manufacturers, and Automakers will be hit by shortages and surging input costs. Bottom Line:The war in Ukraine has wreaked havoc in the US equity market, even though US trade with Russia and Ukraine is insignificant and is mostly limited to energy, palladium, and other rare metals. However, US companies are affected by the scarcity of selected metals and materials, soaring prices, and supply chain disruptions. Feature Introduction The war in Ukraine has become the proverbial black swan that has blindsided even the most cautious investors. The world simply did not expect Russia to wage such a bloody, and all-out war. As such, tragically, small Ukraine has come out of obscurity, and became a focal point of the world’s attention, mostly for humanitarian reasons. While our heart goes out to the people living under fire, it is our job as investment strategists to conduct a detailed economic analysis of the effect of the war in Ukraine and sanctions on Russia’s goods and services on US equities. To do so, we will first investigate trade links between Ukraine, Russia, and the US. And then look at the indirect effects of the war on US equity sectors. Russia And Ukraine Effect On Global Trade Taken together, Russia and Ukraine account for about 3.5% of global GDP in PPP terms and only 1.9% in dollar terms. Even a deep recession in each of these economies is unlikely to cause a dent in global growth, at least not directly. Unfortunately, the indirect effects of this war are substantial. What Is Russia Producing? In 2019, Russia exported $407B in goods, which made it the 13th largest exporter in the world. It is the second-largest commodities exporter (after the US) and the second-largest oil producer, accounting for 12% of annual global output. Energy: Russia’s crude oil exports account for 8.4% of global crude consumption, while natural gas exports account for 5.9% of global consumption, and 3.4% for coal (Table 1). These energy products constitute roughly 60% of Russia’s exports. Its exports of natural gas represent close to half of all European gas imports. Table 1Russia’s Global Share In Various Commodities
The Impact Of The Ukraine War On The US Economy And Equity Sectors
The Impact Of The Ukraine War On The US Economy And Equity Sectors
Nickel: Russia is also one of the top metal producers. It is the third largest producer of nickel, accounting for 4.4.% of global output. The recent surge in nickel prices reflects manufacturers’ anxiety about the potential shortages of this metal.1 Elon Musk has said that a shortage of nickel is the “biggest challenge” in “producing high-volume, long-range batteries”. Palladium: In addition, to nickel, Russia accounts for 35.6% of global palladium output. Palladium is widely used in catalytic converters, electrodes, and other types of electronics.2 Palladium prices are up 46% since the start of the year. Chart 1War Wreaked Havoc In Commodities Market
The Impact Of The Ukraine War On The US Economy And Equity Sectors
The Impact Of The Ukraine War On The US Economy And Equity Sectors
Fertilizers: Together, Russia and Belarus account for about 40% of global potash production, a key ingredient in potassium-based fertilizers. Russia also produces two-thirds of all ammonium nitrate, the main source of nitrogen-rich fertilizers. Wheat and lumber: Russia produces 10% of the global supply of wheat and lumber. While Russia’s trading network is wide, the most common destinations for its exports are China (14%), Netherlands (10%), Belarus (5%), and Germany (4.6%), making its direct effect on global trade limited. What Is Ukraine Producing? Ukraine’s effect on global trade is less significant: In 2019 it exported only $49.5B, with exports dominated by agricultural products and metals (Chart 2). Food: Ukraine’s production is dominated by foodstuffs such as corn, wheat, and seed oils. Russia and Ukraine together account for 25% of global wheat exports, much of which is going to the developing nations of Africa and Asia (Chart 3). Russia and Ukraine are also significant producers of potatoes, sunflowers, and sugar beets. Chart 2Ukraine Exports Metals And Food
The Impact Of The Ukraine War On The US Economy And Equity Sectors
The Impact Of The Ukraine War On The US Economy And Equity Sectors
Chart 3Wheat Is Exported To North Africa And Asia
The Impact Of The Ukraine War On The US Economy And Equity Sectors
The Impact Of The Ukraine War On The US Economy And Equity Sectors
With war and sanctions, most of this output will be lost or kept for domestic consumption, accelerating food inflation, which is already rampant. Of course, the rest of the world could try to compensate for lost agricultural output, but there is a major snag: Russia, Ukraine, and Belarus are significant producers of fertilizer. Metals: Ukraine produces significant amounts of steel. ArcelorMittal and Metinvest suspended production at their Ukrainian plants last week. Auto Components: In addition, Ukraine is a major producer of automotive wire harnesses. Volkswagen, BMW, and Porsche have all had to curtail auto production due to war-related shortages. Neon: Then there are the more esoteric commodities. The bulk of semiconductor-grade neon, used in high-precision lasers, comes from Ukraine. A dearth of this critical gas could exacerbate the semiconductor shortage. While Ukraine trades predominately with its European neighbors, such as Russia, Germany, Poland, and Italy, shortages of agricultural products, semiconductors, and automotive components are likely to reverberate across the globe. The US Is An Island… Almost According to the OEC,3 in 2019 the US was the number two economy in terms of total exports ($1.51T), and the number one economy in total imports ($2.38T). Russia barely registers as the US trading partner, with only $14.B or 0.61% of total imports coming from Russia. Ukraine is even less significant for the US: Its exports constitute only $1.23B. US exports to Ukraine and Russia constitute less than 1% of its total exports. However, to uncover the potential effects of the possible halting of Russian trade on the US economy, let’s look at what goods the US is buying. The reality on the ground may be complex. Petrochemicals Refined and crude petroleum constitute about half of all Russian imports to the US and account for roughly $7 billion (Chart 4). The US sanctioning of Russian oil is unlikely to have a significant effect on the US economy: It constitutes only about 5.7% of all the US oil imports, both crude and refined, which in 2019 were about $123B. As a result, the recent US embargo of Russian oil is unlikely to have much impact. Platinum, Titanium, And Other Rare and Precious Metals US imports roughly $7B worth of platinum, over one-fifth of which is sourced from Russia. Russia also provides about 21.5% of all titanium and 23% of radioactive chemicals that the US imports. Chart 4US Imports Fuels And Rare Metals From Russia
The Impact Of The Ukraine War On The US Economy And Equity Sectors
The Impact Of The Ukraine War On The US Economy And Equity Sectors
Palladium The situation with palladium is even more strained: Russia produces 42% of the palladium imported by the US while South Africa supplies another 30%. All other exports of palladium are fragmented, and producers are unlikely to be able to ramp up production fast enough. Nickel US imports only $1.4B worth of nickel per year, 11% of which is coming from Russia. Australia and Canada are the only other large producers of this metal, and it is not clear if they will be able to step in and fill in the void left by Russia. How Much Production From Russia Will Be Curtailed? The West’s official sanctions affect Russian exports of certain commodities but there is also a reluctance on the part of private companies to buy or ship Russian exports. This latter factor makes it nearly impossible to gauge just how much supply of each individual commodity will be curtailed. In addition, Putin has announced his decision to suspend some commodity exports at least until 2023. Assuming in the near term that a considerable share of Russia’s commodity exports will be blocked from global markets, the largest impact will be on oil, palladium, copper, nickel, fertilizer, and grains. The Stock Market Is Not The Economy US Companies Most Exposed To Russian Trade Most US multinational companies have limited direct sales exposure to Russia. Among those that do have some exposure (Table 2), Philip Morris comes on top of the list at 8% of sales, PepsiCo 4.3%, Mondelez 3.1%, and McDonald’s 4.5%. Apple has generated only 1.3% of its sales in Russia. Overall, the Consumer Staples sector has the highest exposure to Russia. Exodus The majority of US multinationals have announced their exit from the Russian market in protest at the war. The exodus affects wide swaths of the Russian economy, including joint ventures in energy, auto manufacturing, finance, retail, entertainment, and fast food (See Appendix for the list). The war affects US sectors in many different way, and there are winners and losers (Chart 5). Table 2US Multinationals With The Highest Exposure To Russia
The Impact Of The Ukraine War On The US Economy And Equity Sectors
The Impact Of The Ukraine War On The US Economy And Equity Sectors
Chart 5Winners And Losers
The Impact Of The Ukraine War On The US Economy And Equity Sectors
The Impact Of The Ukraine War On The US Economy And Equity Sectors
Investment Implications Energy Sector – Positive The US embargo of Russian oil does not have a pronounced immediate and direct effect on the US energy sector as US imports from Russia are minor. Exxon’s exit from Russia is not going to have any noticeable short-term effect on the US energy sector. On the contrary, elevated oil and gas prices create an impetus for the US shale producers to ramp up output. Oil Equipment and Services companies will be the key beneficiaries of the new energy Capex cycle. While we closed our overweight in E&P companies with a view that OPEC will open oil spigots and cure high prices, locking in a gain of 60%, we remain overweight E&S Energy industry. Consumer Staples – Negative Companies such as Mondelez, Philip Morris, and PepsiCo are most exposed to the Russian market. All three have announced that they are discontinuing or curtailing Russian operations, taking a direct hit on earnings. However, disruptions in agricultural exports from Russia and Ukraine, and accompanying soaring food prices (Chart 6), are likely to have a broad negative effect on the sector, increasing input prices while sector margins are already razor-thin. So far, the sector had been able to pass on costs to customers, but its pricing power may be limited going forward (Chart 7). Chart 6Food Price Surge Is Parabolic
Food Price Surge Is Parabolic
Food Price Surge Is Parabolic
Chart 7Consumer Staples Have Been Able To Pass Costs On To Customers
Consumer Staples Have Been Able To Pass Costs On To Customers
Consumer Staples Have Been Able To Pass Costs On To Customers
We are overweight Consumer Staples thanks to its defensive attributes in the face of overall market volatility. However, we will be monitoring this position closely. Semiconductors - Neutral Disruptions in supplies of neon, palladium, and nickel, which are essential components of the manufacturing of semiconductors, will exacerbate global chip shortages, and hit profits of semiconductor manufacturers, mostly in Asia. However, the majority of the large US semiconductor companies are chip designers and are unlikely to be affected. The only exception is Intel, which is an integrated semiconductor company. Intel has also announced that it is exiting Russia, which may have an adverse effect on its profitability. Auto Manufacturers - Negative Overall, US car manufacturers have limited direct exposure to Russia. Ford has recently closed its joint venture with a Russian car manufacturer. GM does not have a significant presence in Russia, selling only 3,000 cars a year there, of the six million it sells worldwide. Tesla’s presence in Russia is also insignificant – there are only 700 Teslas registered there. However, there are supply problems. Shortages of metals, such as palladium and nickel, widely used in catalytic converters and electrodes, will compound shortages in tight auto component markets. Travel Complex: Hotels, Restaurants, and Airlines Hilton, Marriott, and Hyatt have announced that they are halting development and new investments in Russia. While these actions on the margin will have a long-lasting negative effect on their business, a more immediate concern is that a war in Europe will suppress travel, which only recently started rebounding after COVID-19 country closures. US airlines will suffer from a double whammy of rising fuel costs, and consumer reluctance for international travel in the light of hostilities in the heart of Europe. International and business travel are the most lucrative segments of their business, the rebound of which is needed for these companies to restore profitability. We were positive on airlines in light of the reopening of international travel as the Omicron wave was receding, but now have to reconsider our optimistic stance if oil prices don’t normalize soon. Fast-food restaurant closures in Russia (Burger King, McDonald’s, Starbucks, etc.) will result in a significant hit to their bottom line. To put these actions in perspective, McDonald’s announced that temporary closures of its 750 restaurants in Russia and 180 in Ukraine will make it lose $50 million a month, resulting in a 9% hit to its revenue. In addition, these businesses are already reeling from rising food prices and consumers shifting their goods and services away from discretionary spending to necessities because of negative wage growth. We are overweight the Travel complex but are likely to downgrade it in the coming days. Big Tech – Positive According to a recent report by the IDC, the global impact of a steep decline in Information and Communications Technology (ICT) spending in Russia and Ukraine will be somewhat limited. Combined, the two countries only account for 5.5% of all ICT spending in Europe and 1% worldwide.4 Meanwhile, tech spending among Western European countries may increase in part due to expanded defense and security allocations. We believe that dislocation also creates an opportunity for US technology companies, especially in the software and cybersecurity space. Exiting the Russian market is likely to have a limited negative effect on US technology companies’ revenue, as most of them derive only a very small proportion of it from Russia. We are overweight the Software and Cybersecurity industries. Metals and Mining - Positive Disruption of the supply of metals from Russia and Ukraine creates an opportunity for US metals and mining companies, with soaring pricing promising a profits windfall. Unlike with oil and gas, an increase of supply in metals not only takes substantial investment but also takes years to bring to production. As a result, there is no respite in sight. As such, we will consider adding to our existing position, bringing allocation to an overweight. Stay tuned. Bottom Line The war in Ukraine has wreaked havoc in the US equity market, even though US trade with Russia and Ukraine is insignificant and is mostly limited to energy, palladium, and other rare metals. However, the US economy is affected by the scarcity of selected metals and materials, soaring prices, and supply chain disruptions. As is often the case, there are winners and losers: Energy, and Metals & Mining are mostly immune to the crisis and are likely to benefit by picking up slack in supply. The Technology sector, especially Software and Cybersecurity, will benefit from the disruption of the war. Consumer Staples, Travel, Auto Manufacturers, and Semiconductor Manufacturers are likely to take a hit because of shortages and soaring input prices. Irene Tunkel Chief Strategist, US Equity Strategy irene.tunkel@bcaresearch.com Appendix: Companies’ Self-Sanctions In Russia5 Airlines American Airlines, Delta, and United cut ticket sales partnerships with Russian airlines. All three have stopped flying over Russia. Banks Goldman Sachs became the first American bank to announce that it is exiting Russia. Citigroup also indicated that it is curtailing operations in Russia. Technology Accenture is discontinuing its operations in Russia. Airbnb (ABNB) announced that the company is suspending all operations in Russia and Belarus. Amazon (AMZN)’s cloud division, Amazon Web Services (AWS), said it would halt new sign-ups for the service in Russia and Belarus. AWS indicated that it has no data centers in Russia and, as a matter of policy, it does not do business with the Russian government. It stated that while it had Russian customers, they are all headquartered outside of Russia. Apple (AAPL) has stopped selling its products in Russia, and limited access to digital services, such as Apple Pay, inside Russia. Google confirmed that it is no longer accepting new Google Cloud customers in Russia. It has also halted its advertisement operations in the country. IBM (IBM) has suspended all business in Russia. Intel (INTC) has stopped all shipments to Russia and Belarus, the company announced. Microsoft (MSFT) is suspending all new sales of its products and services in Russia. Microsoft (MSFT) also said it will continue aiding in Ukrainian cybersecurity. Netflix (NFLX) said it will be suspending its streaming service in Russia. Spotify (SPOT) said it has closed its office in Russia “indefinitely” and restricted shows “owned and operated by Russian state-affiliated media.” Adobe stopped all new sales in Russia Uber is divesting from internet company Yandex Paypal suspended all services in Russia Big Four Accounting Firms Ernst & Young, Deloitte, KPMG, and PwC are pulling out of the country. Energy Exxon pledged to leave its last remaining oil and gas project in Russia and not to invest in new developments in the country. Credit Card Providers All three American credit card giants, Mastercard (MA), Visa (V), and American Express (Amex), have suspended all their network operations in Russia. Credit cards issued by Russian banks will not work in other countries, and cards issued elsewhere will not work for purchases in Russia. Hotels Hyatt (H), Hilton (HLT), and Marriott (MAR) are halting development and new investments in Russia. Hilton and Marriott are closing their corporate offices. Hilton is keeping its existing 26 hotels open (a fraction of the company’s 6,800 properties worldwide). Marriott hotels are franchised and the company is evaluating the ability to keep these hotels open. Industrials 3 has halted operations in Russia. Dow (DOW) has suspended all purchases of feedstocks and energy from Russia. It has also stopped all investments in the region and is supplying only limited essential goods in Russia. General Electric (GE) suspended most of its operations in Russia, with the exception of “providing essential medical equipment and supporting existing power services.” John Deere (DE) has halted shipments of its products to Russia. Caterpillar (CAT) is suspending operations at its Russian manufacturing facilities. Boeing (BA) said it would suspend support for Russian airlines. Automakers Ford (F) announced it was suspending its operations in Russia. The American automaker has a 50% stake in Ford (F) Sollers, a joint venture that employs at least 4,000 workers. GM does not have much of a presence in Russia. Entertainment Disney (DIS) is also suspending the release of its theatrical films in Russia, citing “the unprovoked invasion of Ukraine.” WarnerMedia said on February 28 that it would pause the release of “The Batman” in Russia. The company is also pausing all new business in Russia, ceasing broadcast of its channels, halting all new content licensing with Russian entities, and pausing planned theatrical and games releases. Retail Estée Lauder Companies will suspend all commercial activity in Russia, including closing every store and brand site and halting shipments to any of our retailers in Russia. The company had also already suspended business investments and initiatives in Russia. TJX has promised to divest its equity ownership in Familia, an off-price retailer with more than 400 stores in Russia. Consumer Staples Mondelez (MDLZ) said it would scale back all non-essential activities in Russia “while helping maintain continuity of the food supply.” The company said it would focus on “basic offerings,” and discontinue all new capital investments and suspend advertising spending in the country. Procter & Gamble (PG) has discontinued all new capital investments in Russia and is suspending all media, advertising, and promotional activity. The company will continue to provide basic health, hygiene, and personal care items. Philip Morris suspended planned investments and will reduce manufacturing in Russia. PepsiCo will stop selling soda in Russia but will continue to produce dairy and baby food. Restaurants Yum Brands (YUM) is closing 70 company-owned KFC restaurants and 50 Pizza Hut franchises in Russia. It will also suspend all investment and restaurant development in the country. McDonald’s (MCD) is closing some 750 restaurants in Russia. Russia’s restaurants along with another 108 in Ukraine, accounted for 9% of the company’s revenue in 2021. The company said that halting Russian operations will cost it $50 million a month. Restaurant Brands International (owner of Burger King) will end corporate support for 800 locations in Russia and will not approve any additional investment or expansion. Starbucks is closing all of its locations in Russia. Transportation UPS, DHL, and FedEx have suspended operations in Russia and Belarus. Footnotes 1 The nickel price increase was compounded by a margin call on a major Chinese nickel producer that had accumulated a large short position through forward contracts in order to lock in a price for future delivery. 2 Palladium - Wikipedia 3 United States (USA) Exports, Imports, and Trade Partners | OEC - The Observatory of Economic Complexity 4 A New Report from IDC Looks at the Initial Impact of the Russia-Ukraine War on Global ICT Markets. 5 Which Companies Have Pulled Out of Russia? Here’s a List. - The New York Times (nytimes.com) and https://www.cnn.com/2022/03/02/business/companies-pulling-back-russia-ukraine-war-intl-hnk/index.html Recommended Allocation
Executive Summary On a tactical (3-month) horizon, the inflationary impulse from soaring energy and food prices combined with the choke on growth from sanctions will weigh on both the global economy and the global stock market. As such, bond yields could nudge higher, the global stock market has yet to reach its crisis bottom, and the US dollar will rally. But on a cyclical (12-month) horizon, the short-term inflationary impulse combined with sanctions will be massively demand-destructive, at which point the cavalry of lower bond yields will charge to the rescue. Therefore: Overweight the 30-year T-bond and the 30-year Chinese bond, both in absolute terms and relative to other 30-year sovereign bonds. Overweight equities. Overweight long-duration US equities versus short-duration non-US equities. Fractal trading watchlist: Brent crude oil, and oil equities versus banks equities. The DAX Has Sold Off ##br##Because It Expects Profits To Plunge…
The DAX Has Sold Off Because It Expects Profits To Plunge...
The DAX Has Sold Off Because It Expects Profits To Plunge...
…But The S&P 500 Has Sold Off ##br##Because The Long Bond Has Sold Off
...But The S&P 500 Has Sold Off Because The Long Bond Has Sold Off
...But The S&P 500 Has Sold Off Because The Long Bond Has Sold Off
Bottom Line: In the Ukraine crisis, the protection from lower bond yields and fiscal loosening will not come as quickly and as powerfully as it did during the pandemic. If anything, the fixation on inflation and sanctions may increase short-term pain for both the economy and the stock market, before the cavalry of lower bond yields ultimately charges to the rescue. Feature Given the onset of the largest military conflict in Europe since the Second World War, with the potential to escalate to nuclear conflict, you would have thought that the global stock market would have crashed. Yet since Russia’s full-scale invasion of Ukraine on February 24 to the time of writing, the world stock market is down a modest 4 percent, while the US stock market is barely down at all. Is this the stock market’s ‘Wile E Coyote’ moment, in which it pedals hopelessly in thin air before plunging down the chasm? Is this the stock market’s ‘Wile E Coyote’ moment, in which it pedals hopelessly in thin air before plunging down the chasm? Admittedly, since the invasion, European bourses have fallen – for example, Germany’s DAX by 10 percent. And stock markets were already falling before the invasion, meaning that this year the DAX is down 20 percent while the S&P 500 is down 12 percent. But there is a crucial difference. While the DAX year-to-date plunge is due to an expected full-blooded profits recession that the Ukraine crisis will unleash, the S&P 500 year-to-date decline is due to the sell-off in the long-duration bond (Chart I-1 and Chart I-2). This difference in drivers will also explain the fate of these markets as the crisis evolves, just as in the pandemic. Chart I-1The DAX Has Sold Off Because It Expects Profits To Plunge...
The DAX Has Sold Off Because It Expects Profits To Plunge...
The DAX Has Sold Off Because It Expects Profits To Plunge...
Chart I-2...But The S&P 500 Has Sold Off Because The Long Bond Has Sold Off
...But The S&P 500 Has Sold Off Because The Long Bond Has Sold Off
...But The S&P 500 Has Sold Off Because The Long Bond Has Sold Off
During The Pandemic, Central Banks And Governments Saved The Day… We can think of a stock market as a real-time calculator of the profits ‘run-rate.’ In this regard, the real-time stock market is several weeks ahead of analysts, whose profits estimates take time to collect, collate, and record. For example, during the pandemic, the stock market had already discounted a collapse in profits six weeks before analysts’ official estimates (Chart I-3 and Chart I-4). Chart I-3The German Stock Market Is Several Weeks Ahead Of Analysts
The German Stock Market Is Several Weeks Ahead Of Analysts
The German Stock Market Is Several Weeks Ahead Of Analysts
Chart I-4The US Stock Market Is Several Weeks Ahead ##br##Of Analysts
The US Stock Market Is Several Weeks Ahead Of Analysts
The US Stock Market Is Several Weeks Ahead Of Analysts
We can also think of a stock market as a bond with a variable rather than a fixed income. Just as with a bond, every stock market has a ‘duration’ which establishes which bond it most behaves like when bond yields change. It turns out that the long-duration US stock market has the same duration as a 30-year bond, while the shorter-duration German stock market has the same duration as a 7-year bond. Pulling this together, and assuming no change to the very long-term structural growth story, we can say that: The US stock market = US profits multiplied by the 30-year bond price (Chart I-5 and Chart I-6). The German stock market = German profits multiplied by the 7-year bond price (Chart I-7 and Chart I-8). Chart I-5US Profits Multiplied By The 30-Year Bond Price...
US Profits Multiplied By The 30-Year Bond Price...
US Profits Multiplied By The 30-Year Bond Price...
Chart I-6...Equals The US Stock Market
...Equals The US Stock Market
...Equals The US Stock Market
Chart I-7German Profits Multiplied By The 7-Year Bond Price...
German Profits Multiplied By The 7-Year Bond Price...
German Profits Multiplied By The 7-Year Bond Price...
Chart I-8...Equals The German Stock Market
...Equals The German Stock Market
...Equals The German Stock Market
When bond yields rise – as happened through December and January – the greater scope for a price decline in the long-duration 30-year bond will hurt the US stock market both absolutely and relatively. But when bond yields decline – as happened at the start of the pandemic – this same high leverage to the 30-year bond price can protect the US stock market. When bond yields decline, the high leverage to the 30-year bond price can protect the US stock market. During the pandemic, the 30-year T-bond price surged by 35 percent, which more than neutralised the decline in US profits. Supported by this surge in the 30-year bond price combined with massive fiscal stimulus that underpinned demand, the pandemic bear market lasted barely a month. What’s more, the US stock market was back at an all-time high just four months later, much quicker than the German stock market. …But This Time The Cavalry May Take Longer To Arrive Unfortunately, this time the rescue act may take longer. One important difference is that during the pandemic, governments quickly unleashed tax cuts and stimulus payments to shore up demand. Whereas now, they are unleashing sanctions on Russia. This will choke Russia, but will also choke demand in the sanctioning economy. Another crucial difference is that as the pandemic took hold in March 2020, the Federal Reserve slashed the Fed funds rate by 1.5 percent. But at its March 2022 meeting, the Fed will almost certainly raise the interest rate (Chart I-9). Chart I-9As The Pandemic Took Hold, The Fed Could Slash Rates. Not Now.
As The Pandemic Took Hold, The Fed Could Slash Rates. Not Now.
As The Pandemic Took Hold, The Fed Could Slash Rates. Not Now.
As the pandemic was unequivocally a deflationary shock at its outset, it was countered with a massive stimulatory response from both central banks and governments. In contrast, the Ukraine crisis has unleashed a new inflationary shock from soaring energy and food prices. And this on top of the pandemic’s second-round inflationary effects which have already dislocated inflation into uncomfortable territory. Our high conviction view is that this inflationary impulse combined with sanctions will be massively demand-destructive, and thereby ultimately morph into a deflationary shock. Yet the danger is that myopic policymakers and markets are not chess players who think several moves ahead. Instead, by fixating on the immediate inflationary impulse from soaring energy and food prices, they will make the wrong move. In the Ukraine crisis, the big risk is that the protection from lower bond yields and fiscal loosening will not come as quickly and as powerfully as it did during the pandemic. If anything, the fixation on inflation and sanctions may increase short-term pain for both the economy and the stock market. Compared with the pandemic, both the sell-off and the recovery will take longer to play out. In the Ukraine crisis, the big risk is that the protection from lower bond yields and fiscal loosening will not come as quickly and as powerfully as it did during the pandemic. One further thought. The Ukraine crisis has ‘cancelled’ Covid from the news and our fears, as if it were just a bad dream. Yet the virus has not disappeared and will continue to replicate and mutate freely. Probably even more so, now that we have dismissed it, and Europe’s largest refugee crisis in decades has given it a happy hunting ground. Hence, do not dismiss another wave of infections later this year. The Investment Conclusions Continuing our chess metaphor, a tactical investment should consider only the next one or two moves, a cyclical investment should be based on the next five moves, while a long-term structural investment (which we will not cover in this report) should visualise the board after twenty moves. All of which leads to several investment conclusions: On a tactical (3-month) horizon, the inflationary impulse from soaring energy and food prices combined with the choke on growth from sanctions will weigh on both the global economy and the global stock market. As such, bond yields could nudge higher, the global stock market has yet to reach its crisis bottom, and the US dollar will rally (Chart I-10). Chart I-10When Stock Markets Sell Off, The Dollar Rallies
When Stock Markets Sell Off, The Dollar Rallies
When Stock Markets Sell Off, The Dollar Rallies
But on a cyclical (12-month) horizon, the short-term inflationary impulse combined with sanctions will be massively demand-destructive, at which point the cavalry of lower bond yields will charge to the rescue. Therefore: Overweight the 30-year T-bond and the 30-year Chinese bond, both in absolute terms and relative to other 30-year sovereign bonds. Overweight equities. Overweight long-duration US equities versus short-duration non-US equities. How Can Fractal Analysis Help In A Crisis? When prices are being driven by fundamentals, events and catalysts, as they are now, how can fractal analysis help investors? The answer is that it can identify when a small event or catalyst can have a massive effect in reversing a trend. In this regard, the extreme rally in crude oil has reached fragility on both its 65-day and 130-day fractal structures. Meaning that any event or catalyst that reduces fears of a supply constraint will cause an outsized reversal (Chart I-11). Chart I-11The Extreme Rally In Crude Oil Is Fractally Fragile
The Extreme Rally In Crude Oil Is Fractally Fragile
The Extreme Rally In Crude Oil Is Fractally Fragile
Equally interesting, the huge outperformance of oil equities versus bank equities is reaching the point of fragility on its 260-day fractal structure that has reliably signalled major switching points between the sectors (Chart I-12). Given the fast-moving developments in the crisis, we are not initiating any new trades this week, but stay tuned. Chart I-12The Huge Outperformance Of Oil Equities Versus Banks Equities Is Approaching A Reversal
The Huge Outperformance Of Oil Equities Versus Banks Equities Is Approaching A Reversal
The Huge Outperformance Of Oil Equities Versus Banks Equities Is Approaching A Reversal
Fractal Trading Watchlist Biotech To Rebound
Biotech Is Starting To Reverse
Biotech Is Starting To Reverse
US Healthcare Vs. Software Approaching A Reversal
US Healthcare Vs. Software Approaching A Reversal
US Healthcare Vs. Software Approaching A Reversal
Norway's Outperformance Could End
Norway's Outperformance Could End
Norway's Outperformance Could End
Greece’s Brief Outperformance To End
Greece Is Snapping Back
Greece Is Snapping Back
Dhaval Joshi Chief Strategist dhaval@bcaresearch.com Fractal Trading System Fractal Trades
Are We In A Slow-Motion Crash?
Are We In A Slow-Motion Crash?
Are We In A Slow-Motion Crash?
Are We In A Slow-Motion Crash?
6-Month Recommendations Structural Recommendations Closed Fractal Trades Indicators To Watch - Bond Yields Chart II-1Indicators To Watch - Bond Yields ##br##- Euro Area
Indicators To Watch - Bond Yields - Euro Area
Indicators To Watch - Bond Yields - Euro Area
Chart II-2Indicators To Watch - Bond Yields ##br##- Europe Ex Euro Area
Indicators To Watch - Bond Yields - Europe Ex Euro Area
Indicators To Watch - Bond Yields - Europe Ex Euro Area
Chart II-3Indicators To Watch - Bond Yields ##br##- Asia
Indicators To Watch - Bond Yields - Asia
Indicators To Watch - Bond Yields - Asia
Chart II-4Indicators To Watch - Bond Yields ##br##- Other Developed
Indicators To Watch - Bond Yields - Other Developed
Indicators To Watch - Bond Yields - Other Developed
Indicators To Watch - Interest Rate Expectations Chart II-5Indicators To Watch - Interest Rate Expectations
Indicators To Watch - Interest Rate Expectations
Indicators To Watch - Interest Rate Expectations
Chart II-6Indicators To Watch - Interest Rate Expectations
Indicators To Watch - Interest Rate Expectations
Indicators To Watch - Interest Rate Expectations
Chart II-7Indicators To Watch - Interest Rate Expectations
Indicators To Watch - Interest Rate Expectations
Indicators To Watch - Interest Rate Expectations
Chart II-8Indicators To Watch - Interest Rate Expectations
Indicators To Watch - Interest Rate Expectations
Indicators To Watch - Interest Rate Expectations
Executive Summary US Equity Drawdowns During Geopolitical Crises/Commodity Shocks
US Equity Drawdowns During Geopolitical Crises/Commodity Shocks
US Equity Drawdowns During Geopolitical Crises/Commodity Shocks
The most recent examples of geopolitical and commodity price shocks similar the current one include the Cuban missile crisis in 1962, the oil embargo of 1973 in response to the Yom Kippur War as well as the Gulf War of 1990. The magnitude of the S&P 500 selloff was 28% in 1962, 23% in 1973 and 20% in 1990 (Chart of the week). Neither of our capitulation indicators for the S&P 500 or for EM stocks have reached their previous lows. As for commodity prices, the only thing that is certain in the next couple of months is that volatility will remain very elevated. Having incurred considerable costs, Russia will push to maximize its gains and secure a new, more favorable agreement with NATO. This will keep geopolitical tension elevated. Bottom Line: The drawdown in global and EM stocks in not over yet. The US dollar has more upside in the near term. This is consistent with the S&P500 outperforming and EM stocks underperforming. A rising US dollar bodes ill for EM fixed-income markets. Feature Chart 1US Equity Drawdowns During Geopolitical Crises/Commodity Shocks
US Equity Drawdowns During Geopolitical Crises/Commodity Shocks
US Equity Drawdowns During Geopolitical Crises/Commodity Shocks
The world is experiencing geopolitical and commodity price shocks that have not been seen in over a generation. The most recent examples of this kind of shock include the Cuban missile crisis in 1962, the oil embargo of 1973 in response to the Yom Kippur War as well as the Gulf War of 1990. Chart 1 illustrates the current trajectory of the S&P 500 with selloffs that occurred during those three episodes. The magnitude of the S&P 500 selloff was 28% in 1962, 23% in 1973 and 20% in 1990. The S&P 500 is down only 11% from its peak. Based on the above three profiles, the current selloff in US stocks has further to go. This also means that non-US equities, including EM, will continue to suffer. What are the conditions needed for global stocks to bottom? In our opinion, a durable bottom in share prices will occur when measures of capitulation in equity markets reach their previous lows, commodity prices (particularly crude prices) decline and geopolitical tensions peak. We elaborate on each below. Equity Capitulation Neither of our capitulation indicators for the S&P 500 or for EM stocks have reached their previous lows. Chart 2 displays our capitulation indicator for US equities. Its construction is based on four equal-weighted components: the composite momentum indicator, the US equity sentiment indicator, industry group breadth and the advance-decline line (shown individually in Chart 7-8 below). Chart 2US Stocks Have Not Reached Their Selling Climax
US Stocks Have Not Reached Their Selling Climax
US Stocks Have Not Reached Their Selling Climax
This indicator has not reached its lows of 2010, 2011, 2018 and 2020. In 2011 and 2018, the S&P500 selloffs were 19.5% and 19.8%, respectively. Hence, our best guess for the magnitude of an equity drawdown in this selloff is about 20%. This puts the potential S&P500 low at 3600-3700. The latter is consistent with the technical support (3-year moving average) that held up in 2011, 2016 and 2018 (Chart 2, top panel). Chart 3 illustrates our EM equity capitulation indicator. Its four equal-weighted components are the composite momentum indicator, EM equity sentiment, industry group breadth and net EPS revisions (shown individually in Chart 9-10 below). We believe that EM share prices will drop until this capitulation indicator comes to the levels reached in the 2011, 2013 and 2018 selloffs. Chart 3The EM Equity Capitulation Has Further To Run
The EM Equity Capitulation Has Further To Run
The EM Equity Capitulation Has Further To Run
Concerning the magnitude of further EM equity selloff, the next technical defense line for the MSCI EM stock index in USD is 10%, or in the worst-case scenario, 25% below current levels (Chart 3, top panel). The Commodity Shock Global share prices have become negatively correlated with commodity (primarily oil) prices and such an inverse relationship will likely persist for now. In fact, an important signal of the bottom in the S&P 500 during the 1990 oil spike was the peak in crude prices (the latter is shown inverted in Chart 4). In the case of the oil embargo of 1973-74, the oil market was not developed, and US share prices were negatively correlated with US 10-year Treasury yields (Chart 5). Chart 4The 1990 Oil Shock
The 1990 Oil Shock
The 1990 Oil Shock
Chart 5The 1973 Oil Shock
The 1973 Oil Shock
The 1973 Oil Shock
Presently, given that US stocks were reacting negatively to rising US bond yields prior to the Ukraine crisis, it is reasonable to expect American share prices to bottom only when two conditions are satisfied: (1) oil prices start falling on a sustainable basis and (2) US bond yields do not rise much. How much will oil and other commodity prices rise? It is hard to know because multiple forces are in play. First, Russia is the second largest commodity exporter in the world (after the US). Russia’s crude oil exports account for 8.4% of global crude consumption, natural gas exports for 5.9% of global consumption and 3.4% for coal (Table 1). Across metals, Russia is a large producer too – 35.6% for palladium, 4.4% for nickel and 4.2% for copper (Table 1). In turn, Russia and Ukraine production together accounts for 14% of global wheat consumption. Table 1Russia’s Global Share In Various Commodities
Equity Capitulation, A Commodity Shock And Geopolitics
Equity Capitulation, A Commodity Shock And Geopolitics
The West’s official sanctions affect Russian exports of certain commodities but there is also a reluctance on the part of private companies to buy or ship Russian exports. This latter factor makes it nearly impossible to gauge just how much supply of each individual commodity will be curtailed. Assuming in the near term that a considerable share of Russia’s commodity exports will be blocked from global markets, the largest impact will be on oil, palladium, copper, nickel and fertilizer. While ratcheting sales of resources to China is a saving grace for Russia, it might take some time until shipments can be rerouted and reorganized. Second, the US is pressuring allied nations in the Gulf as well as other countries like Venezuela to produce and bring more oil to the market. Finally, the surge in commodity prices is probably already destroying demand. Oil and wheat prices have risen to record highs in many EM currencies (Chart 36 and 37 below). This will push inflation higher and herald more rate hikes from central banks. High interest rates along with tight fiscal policy and eroding discretionary spending (due to high energy and food prices) entail weak demand in developing economies. Bottom Line: In the very short run, risks to many commodity prices are skewed to the upside due to supply constraints. Yet, enormous uncertainty over factors driving their demand and supply makes prices over the next three months impossible to forecast. During this period, individual commodity prices might be driven by idiosyncratic factors. The only thing that is certain in the next couple of months is that volatility in commodity prices will remain very elevated. Price surges might be followed by large drawdowns and vice versa. Geopolitical Tensions The Kremlin will continue its military assault until it establishes firm control over Kyiv and the Black Sea coast, including the city of Odessa. As we wrote in our March 2 report, Putin’s objective is to install a very loyal government in Kyiv and to control the territory east of the Dniepr river. It is not clear to us whether the Kremlin has the appetite to control the Ukraine territory west of the Dniepr river. Western Ukraine has always been very anti-Russian and Putin might realize that it will be too costly to capture and control it. We do not think Putin has ambitions to go beyond Ukraine (Moldova being an exception). That said, there is no doubt that the Kremlin will be presenting more demands to NATO and threatening if those demands are not met. Having incurred considerable costs, Russia will push to maximize its gains and secure a new, more favorable agreement with NATO. It is not clear how many geopolitical concessions or what security guarantees the US is willing to provide to Russia. On the whole, geopolitical tensions between Russia and NATO/the US will continue until there is a new deal between the parties. Investment Strategy Chart 6No Trend Change In EM And US Relative Equity Performance
No Trend Change In EM And US Relative Equity Performance
No Trend Change In EM And US Relative Equity Performance
The drawdown in global and EM stocks in not over yet. Within a global equity portfolio, we continue to recommend underweighting EM and Europe and overweighting the US. Interestingly, the EM relative equity performance versus the global stock index has rolled over at its 200-day moving average, while the US’s relative performance has found a support at its 200-day moving average (Chart 6). Such a technical configuration suggests that EM stocks will continue underperforming for now while US equities will have another upleg in relative terms. The US dollar has more upside in the near term. This is consistent with the S&P500 outperforming and EM stocks underperforming. A rising US dollar bodes ill for EM fixed-income markets. Arthur Budaghyan Chief Emerging Markets Strategist arthurb@bcaresearch.com Components Of Our US Equity Capitulation Indicator Not all components of our US Equity Capitulation Indicator have reached their previous lows. Given the backdrop of still expensive US equity valuations, heightened geopolitical risks, very elevated inflation and high inflation expectations as well as the little maneuvering room that the Fed has, odds are that US share prices will drop further. Chart 7Components Of Our US Equity Capitulation Indicator
Components Of Our US Equity Capitulation Indicator
Components Of Our US Equity Capitulation Indicator
Chart 8Components Of Our US Equity Capitulation Indicator
Components Of Our US Equity Capitulation Indicator
Components Of Our US Equity Capitulation Indicator
Components Of Our EM Equity Capitulation Indicator Not all components of our EM Equity Capitulation Indicator have reached their previous lows either. The share of industry groups above their 200-day moving average, analysts’ net EPS revisions as well as the momentum and equity sentiment indicators remain above their lows. Further downside in EM share prices is likely. Chart 9Components Of Our EM Equity Capitulation Indicator
Components Of Our EM Equity Capitulation Indicator
Components Of Our EM Equity Capitulation Indicator
Chart 10Components Of Our EM Equity Capitulation Indicator
Components Of Our EM Equity Capitulation Indicator
Components Of Our EM Equity Capitulation Indicator
US Stocks Have Not Yet Reached Their Selling Climax The NYSE’s advance/decline line has broken down and is dropping, signifying a broadening equity rout. Yet, we doubt the US equity indexes will bottom when 35% of NYSE listed stocks are above their 200-day moving average. Finally, the US median stock has broken below its 200-day moving average. Given the fundamental backdrop, all of these technical signposts point to a larger than 10% correction in the S&P 500. Chart 11US Stocks Have Not Yet Reached Their Selling Climax
US Stocks Have Not Yet Reached Their Selling Climax
US Stocks Have Not Yet Reached Their Selling Climax
Chart 12US Stocks Have Not Yet Reached Their Selling Climax
US Stocks Have Not Yet Reached Their Selling Climax
US Stocks Have Not Yet Reached Their Selling Climax
Chart 13US Stocks Have Not Yet Reached Their Selling Climax
US Stocks Have Not Yet Reached Their Selling Climax
US Stocks Have Not Yet Reached Their Selling Climax
Chart 14US Stocks Have Not Yet Reached Their Selling Climax
US Stocks Have Not Yet Reached Their Selling Climax
US Stocks Have Not Yet Reached Their Selling Climax
Global Overall And Global ex-US Equities Although Global ex-US stocks are much more oversold than US stocks, their growth and profit backdrops are worse. As we argued in the front section of this report (Chart 6 above), odds are that US stocks will continue outperforming non-US stocks in the near term. Despite crashing, European stocks might not have found a support yet. Chart 15Global Overall And Global ex-US Equities
Global Overall And Global ex-US Equities
Global Overall And Global ex-US Equities
Chart 16Global Overall And Global ex-US Equities
Global Overall And Global ex-US Equities
Global Overall And Global ex-US Equities
Chart 17Global Overall And Global ex-US Equities
Global Overall And Global ex-US Equities
Global Overall And Global ex-US Equities
Chart 18Global Overall And Global ex-US Equities
Global Overall And Global ex-US Equities
Global Overall And Global ex-US Equities
European Stocks: Is A Support At Hand? Investor sentiment on European stocks has become depressed. Yet, European economies will decelerate due to the energy shock (natural gas prices have shot up two-fold since October 1) as well as falling consumer and business confidence. A bottom for euro area stocks might be lower than current prices. Chart 19European Stocks: Is A Support At Hand?
European Stocks: Is A Support At Hand?
European Stocks: Is A Support At Hand?
Chart 20European Stocks: Is A Support At Hand?
European Stocks: Is A Support At Hand?
European Stocks: Is A Support At Hand?
Chart 21European Stocks: Is A Support At Hand?
European Stocks: Is A Support At Hand?
European Stocks: Is A Support At Hand?
EM Equities: Cheap But Mind The Profit Outlook According to our cyclically adjusted P/E ratio, EM stocks are slightly cheap in absolute terms and are very attractive versus US equities. However, this valuation indicator should be used by long-term investors. In the short run and even from a cyclical perspective, this valuation indicator is not very useful. Besides, investor sentiment on EM equities was neutral in the middle of February. It might take more weakness before bad news get priced in EM share prices. Chart 22EM Equities: Cheap But Mind The Profit Outlook
EM Equities: Cheap But Mind The Profit Outlook
EM Equities: Cheap But Mind The Profit Outlook
Chart 23EM Equities: Cheap But Mind The Profit Outlook
EM Equities: Cheap But Mind The Profit Outlook
EM Equities: Cheap But Mind The Profit Outlook
Chart 24EM Equities: Cheap But Mind The Profit Outlook
EM Equities: Cheap But Mind The Profit Outlook
EM Equities: Cheap But Mind The Profit Outlook
EM Profits In A Soft Spot As projected by our EM narrow money (M1) aggregate, EM corporate earnings will continue to disappoint. This is the key risk to EM share prices. In fact, EM EPS has been broadly flat over the past 15 years. That is why EM stocks appear cheap. Plus, EM ex-TMT stocks have not yet fallen much and downside risks remain. Chart 25EM Profits In A Soft Spot
EM Profits In A Soft Spot
EM Profits In A Soft Spot
Chart 26EM Profits In A Soft Spot
EM Profits In A Soft Spot
EM Profits In A Soft Spot
Chart 27EM Profits In A Soft Spot
EM Profits In A Soft Spot
EM Profits In A Soft Spot
Chinese Investable Stocks Are At Their March 2020 Lows Offshore and onshore Chinese shares prices have been falling hard. Not only have Chinese corporate profit expectations been downshifting but also Chinese Investable stocks have been derating (their multiples have been compressing). This has been due to foreign investors projecting/extrapolating the US-Russia confrontation to a possible future US-China geopolitical standoff, and therefore possible sanctions the West can impose on China. Chart 28Chinese Investable Stocks Are At Their March 2020 Lows
Chinese Investable Stocks Are At Their March 2020 Lows
Chinese Investable Stocks Are At Their March 2020 Lows
Chart 29Chinese Investable Stocks Are At Their March 2020 Lows
Chinese Investable Stocks Are At Their March 2020 Lows
Chinese Investable Stocks Are At Their March 2020 Lows
Chart 30Chinese Investable Stocks Are At Their March 2020 Lows
Chinese Investable Stocks Are At Their March 2020 Lows
Chinese Investable Stocks Are At Their March 2020 Lows
Chart 31Chinese Investable Stocks Are At Their March 2020 Lows
Chinese Investable Stocks Are At Their March 2020 Lows
Chinese Investable Stocks Are At Their March 2020 Lows
China: No "All-In" Stimulus Yet The improvement in China’s total social financing has been entirely due to local government bond issuance. Corporate and household credit have not improved at all. Consistently, traditional infrastructure investment has probably bottomed. Yet, outside this sector the outlook is uninspiring. Property construction remains at risk, consumer spending is very sluggish and private business sentiment is downbeat. Chart 32China: No "All-In" Stimulus Yet
China: No "All-In" Stimulus Yet
China: No "All-In" Stimulus Yet
Chart 33China: No "All-In" Stimulus Yet
China: No "All-In" Stimulus Yet
China: No "All-In" Stimulus Yet
Chart 34China: No "All-In" Stimulus Yet
China: No "All-In" Stimulus Yet
China: No "All-In" Stimulus Yet
Chart 35China: No "All-In" Stimulus Yet
China: No "All-In" Stimulus Yet
China: No "All-In" Stimulus Yet
EM Woes: Energy And Food Prices Many low-income developing countries will be suffering from elevated food and energy prices. Oil and wheat prices in EM currencies have surged to all-time highs. This will lift headline inflation in many emerging economies, lead to monetary tightening and reduce household income available for discretionary spending. All of these and the lack of fiscal easing in many developing countries entail growth disappointments this year. Chart 36EM Woes: Energy And Food Prices
EM Woes: Energy And Food Prices
EM Woes: Energy And Food Prices
Chart 37EM Woes: Energy And Food Prices
EM Woes: Energy And Food Prices
EM Woes: Energy And Food Prices
Chart 38EM Woes: Energy And Food Prices
EM Woes: Energy And Food Prices
EM Woes: Energy And Food Prices
Chart 39EM Woes: Energy And Food Prices
EM Woes: Energy And Food Prices
EM Woes: Energy And Food Prices
EM Credit Spreads Are Widening Rapidly EM sovereign and corporate spreads have broken out. Such spread widening is not simply due to Russian credit. The pace of spread widening differs among countries. However, directionally, credit spreads seem to have embarked on a widening path. In a nutshell, Chinese USD corporate in general and property bond prices in particular are tanking (see below). This foreshadows the poor outlook for Chinese housing. Chart 40EM Credit Spreads Are Widening Rapidly
EM Credit Spreads Are Widening Rapidly
EM Credit Spreads Are Widening Rapidly
Chart 41EM Credit Spreads Are Widening Rapidly
EM Credit Spreads Are Widening Rapidly
EM Credit Spreads Are Widening Rapidly
Chart 42EM Credit Spreads Are Widening Rapidly
EM Credit Spreads Are Widening Rapidly
EM Credit Spreads Are Widening Rapidly
Chart 43EM Credit Spreads Are Widening Rapidly
EM Credit Spreads Are Widening Rapidly
EM Credit Spreads Are Widening Rapidly
EM Credit Markets And EM Equities Historically, rising EM corporate USD bond yields led to a selloff in EM share prices. This is the cost of capital that matters for EM equities. Unless EM sovereign and corporate bonds yields start falling on a sustainable basis, EM equities will continue to struggle. Chart 44EM Credit Markets And EM Equities
EM Credit Markets And EM Equities
EM Credit Markets And EM Equities
Chart 45EM Credit Markets And EM Equities
EM Credit Markets And EM Equities
EM Credit Markets And EM Equities
Chart 46EM Credit Markets And EM Equities
EM Credit Markets And EM Equities
EM Credit Markets And EM Equities
Global Resource Stocks The relative performance of global energy and basic materials versus the global equity index has bottomed. In the medium term, odds are that TMT stocks will underperform while resource companies outperform. Yet, the outlook for energy stocks and basic materials in absolute terms is complicated (in line with the elevated volatility in commodity prices we discussed in the front section). Notably, even though commodity prices have skyrocketed, basic materials and energy share prices have not yet broken out. It seems the market is doubting the sustainability of high commodity prices. Chart 47Global Resource Stocks
Global Resource Stocks
Global Resource Stocks
Equity Capitulation, A Commodity Shock And Geopolitics
Equity Capitulation, A Commodity Shock And Geopolitics
Equity Capitulation, A Commodity Shock And Geopolitics
Equity Capitulation, A Commodity Shock And Geopolitics
Footnotes
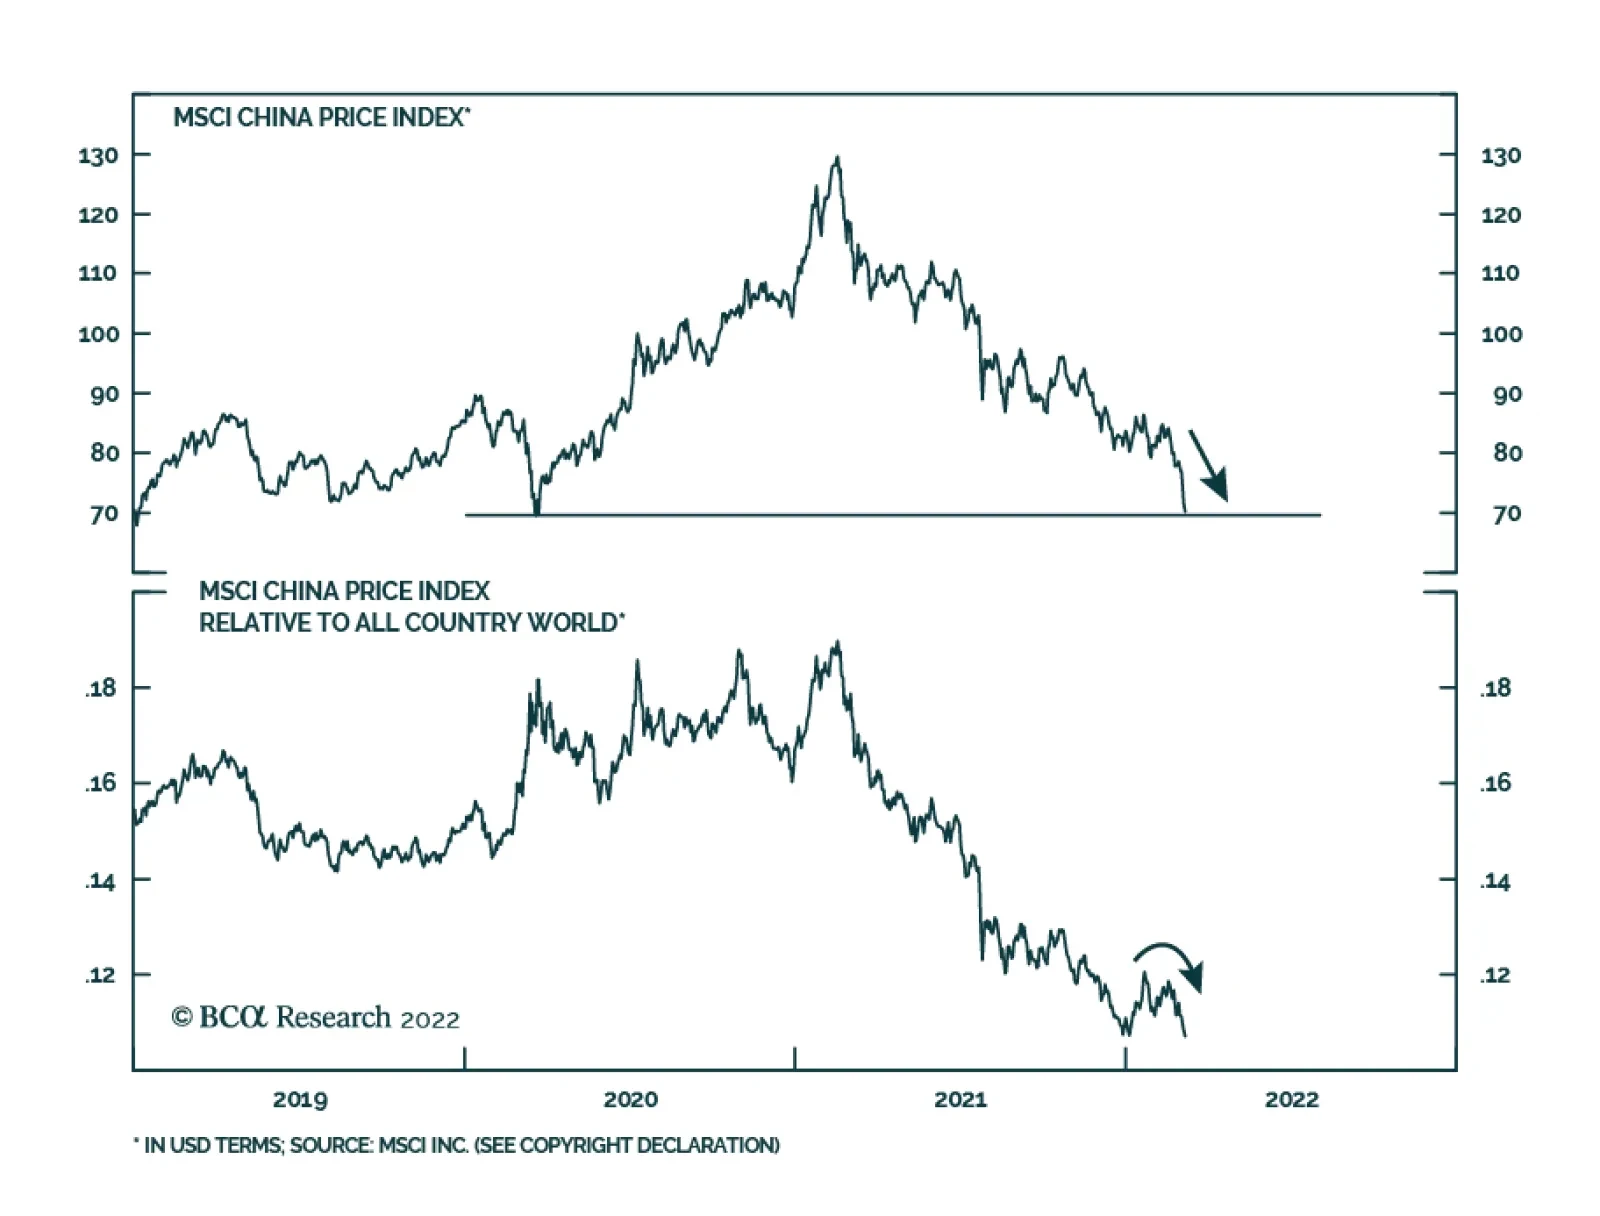
Chinese investable stocks have collapsed 12.4% since the start of the Russia-Ukraine war in late-February. The MSCI investable index is now at its mid-March 2020 pandemic low. Several factors are contributing to the selloff. First, domestic economic…
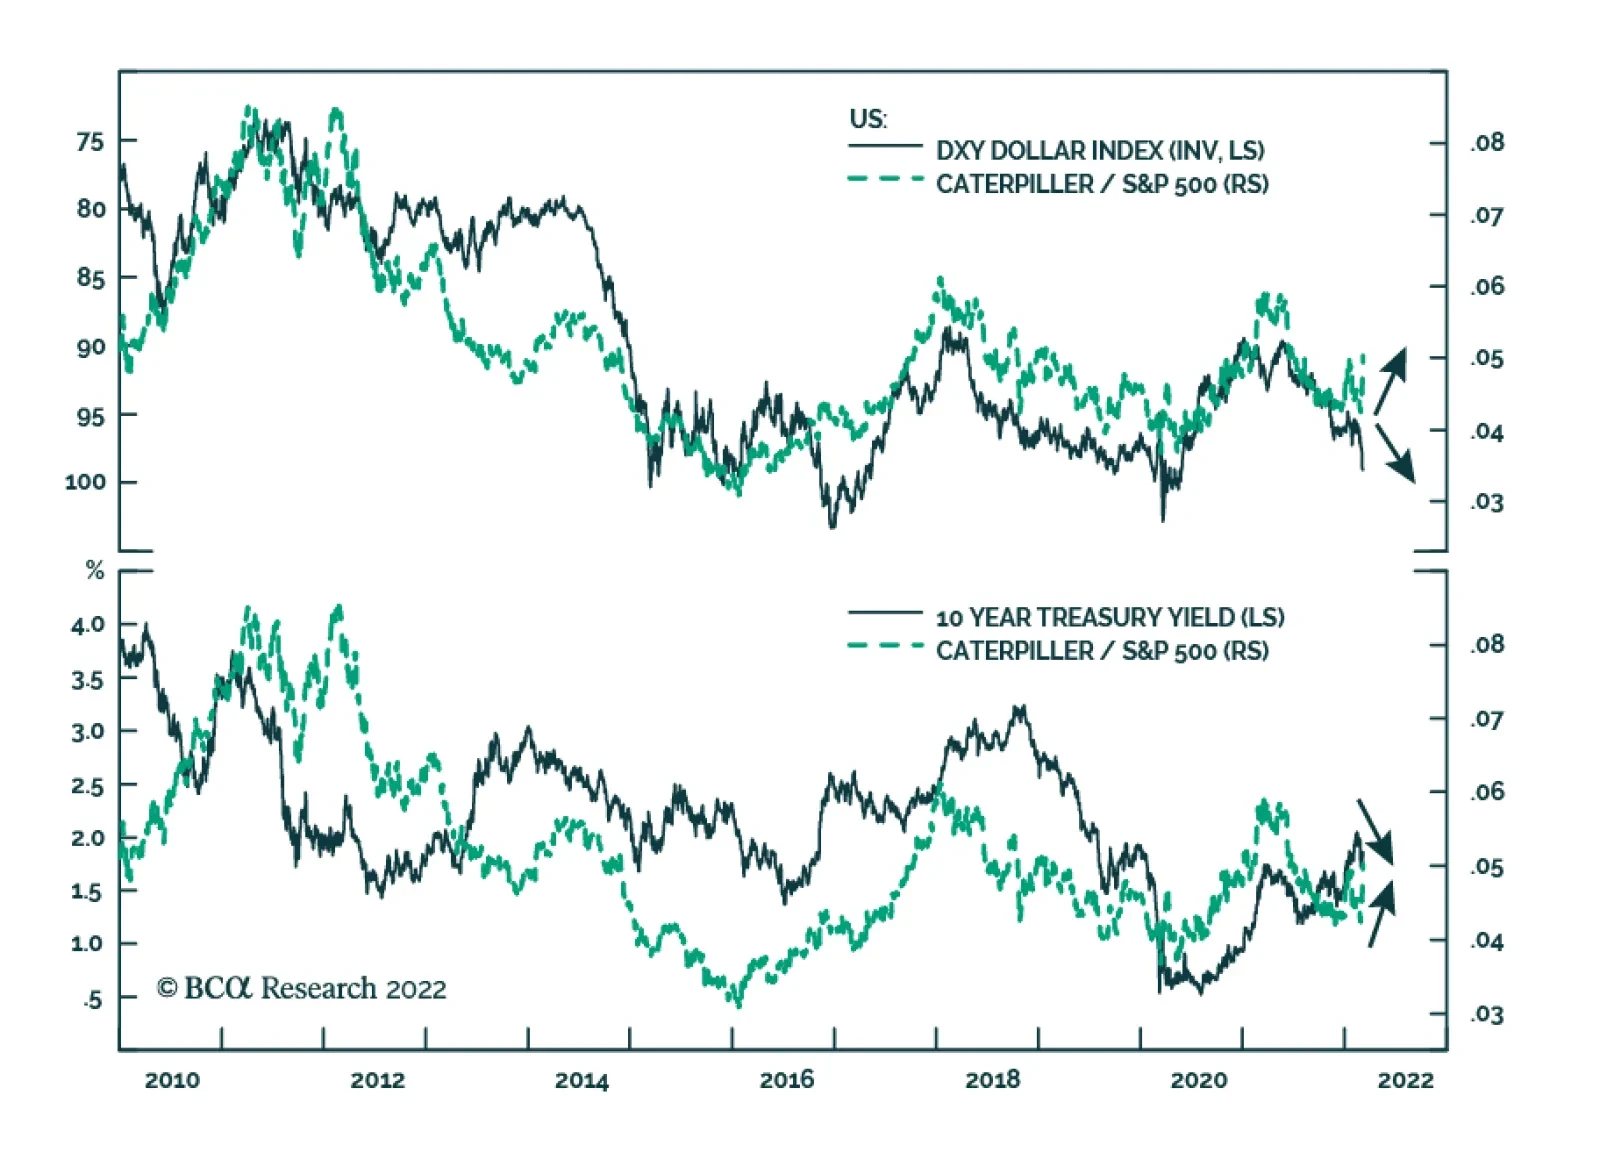
Caterpillar is up 12.5% since the start of the Russian invasion of Ukraine two weeks ago, significantly outperforming the S&P 500 which is down 1.3% over this period. The performance of the equipment maker’s stock is highly cyclical and therefore…