Equities
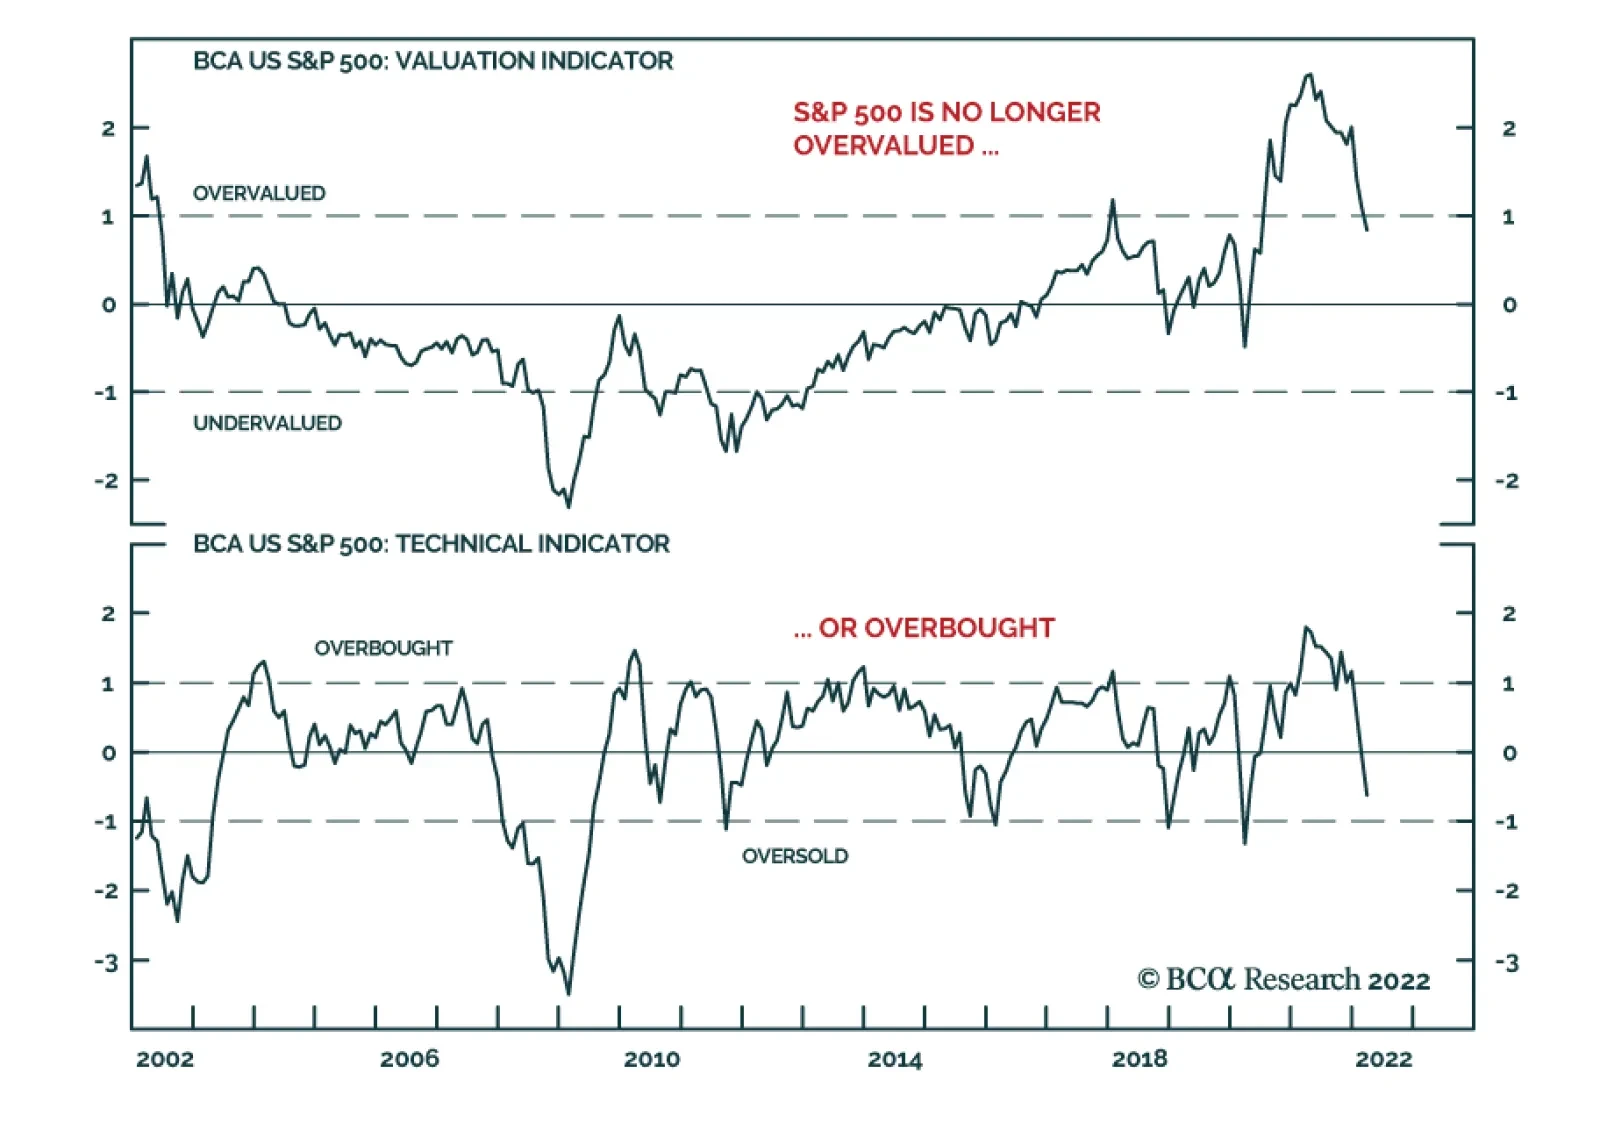
This year’s equity selloff has taken some froth off S&P 500 valuations. Our US Equity Strategists’ Composite Valuation Indicator – which is based on P/E, price-to-sales, price-to-dividends, and price-to-book –was two standard deviations above fair…
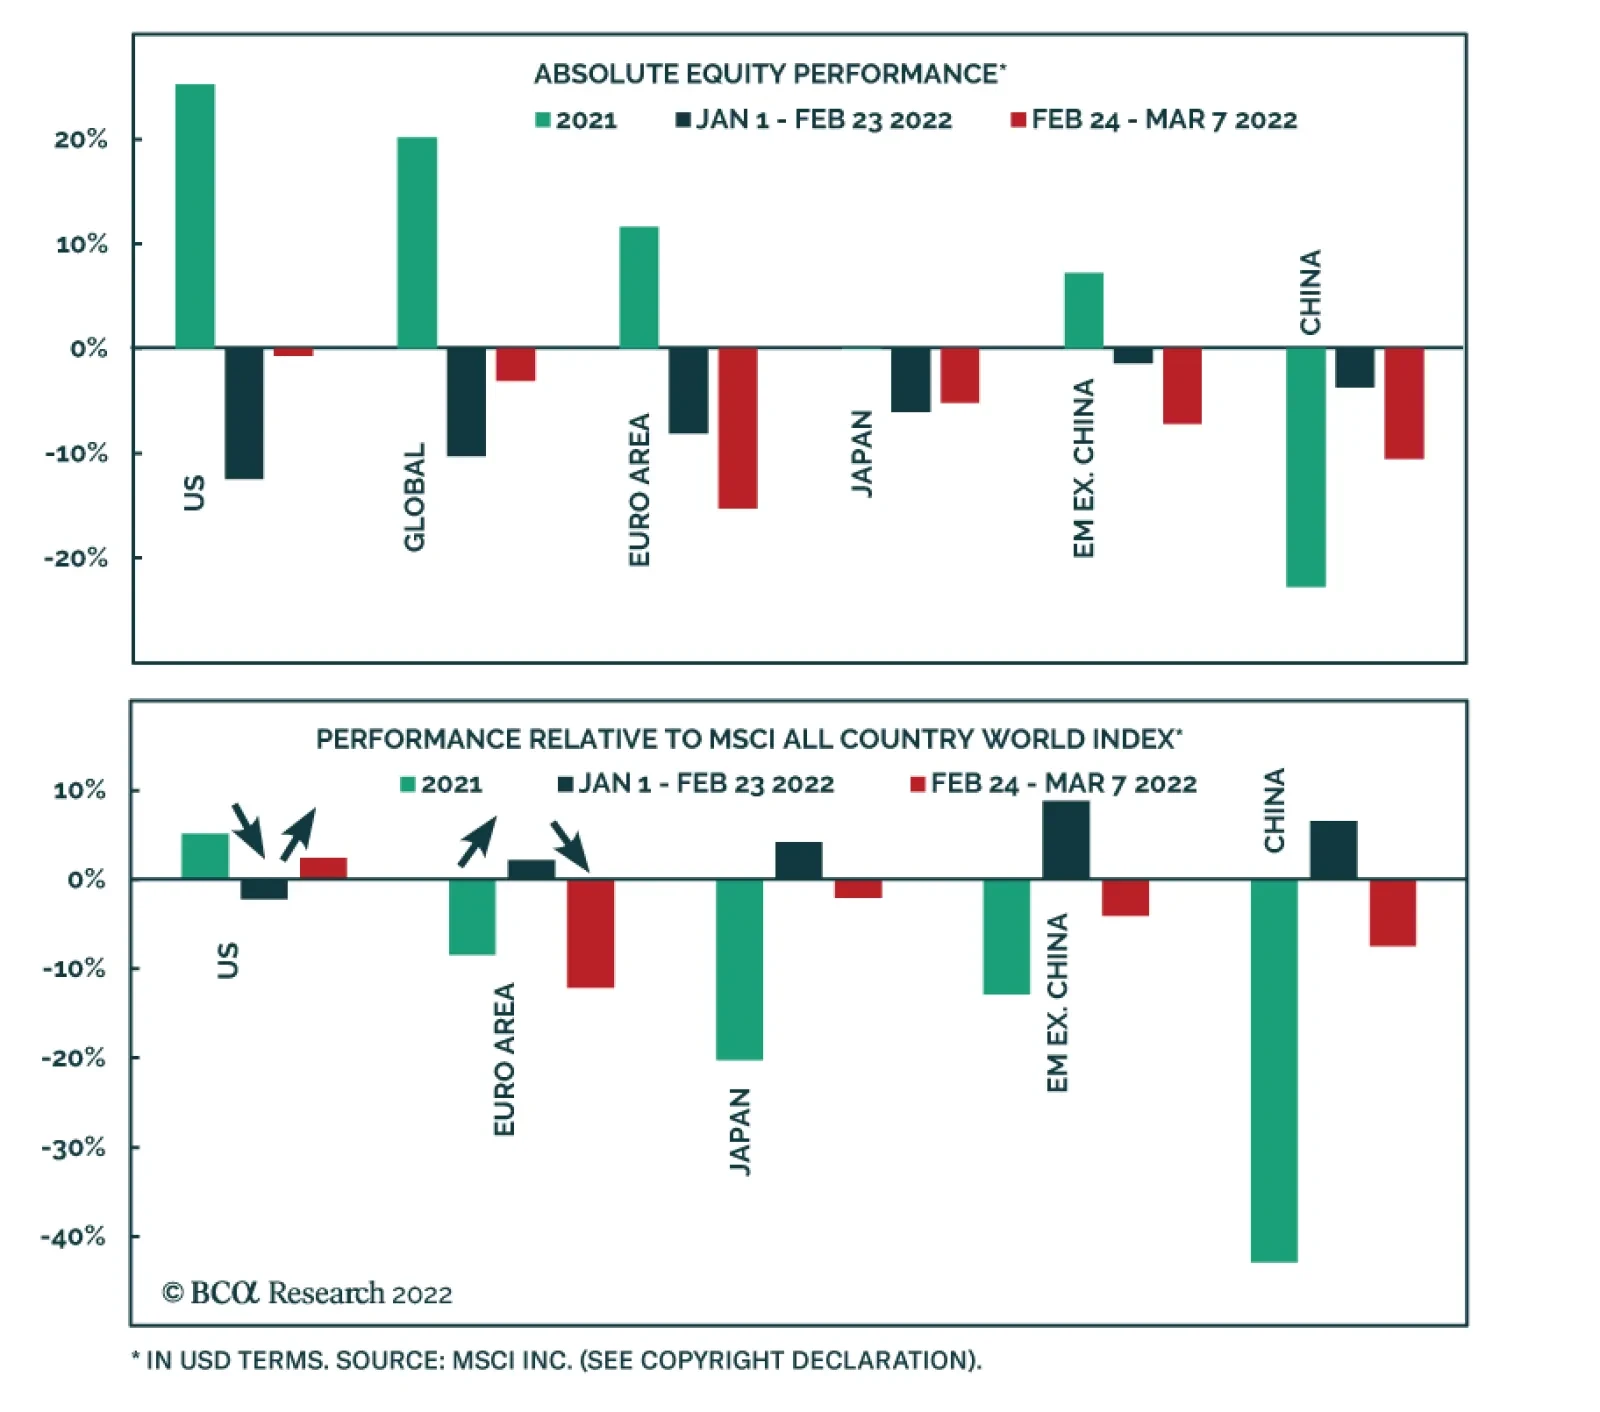
In late-January we highlighted that US stocks were the worst performing major global equity market at the start of this year. This reflected a reversal of last year’s trend: bourses that generated the greatest returns in 2021 generally suffered the biggest…

Executive Summary A Perfect Metals Storm
A Perfect Metals Storm
A Perfect Metals Storm
The bitter truth at the heart of the Ukraine conflict is that the constraints the US and Europe are willing to impose on Russia are not enough to deter it from completing its conquest of the eastern and coastal parts of the country and installing a puppet government in Kiev. The conflict will reduce the available supplies of oil and gas, base metals and grains. Increasing commodity costs will add to existing inflation pressures and threaten to aggravate slowing growth trends in Europe. However, we expect that the net effect in the US will be more inflationary than deflationary, as flush consumers are well positioned to withstand upward price pressure. BCA has turned tactically neutral on equities as it does not appear that stock markets have yet come to terms with the glum reality of the military campaign. We foresee increased near-term market turbulence as investors experience periodic episodes of panic in response to developments on the ground. We are making several moves to dial down the risk in our ETF portfolio for the time being. We plan to unwind the moves before too long to align the portfolio with our bullish 12-month view but are relieved to have adopted a more defensive position while financial markets digest the implications of the geopolitical shock. Bottom Line: Financial market moves seem to be lagging the course of events in Ukraine. We recommend that investors position more defensively until markets catch up. Feature Chart 1Extreme Volatility
Extreme Volatility
Extreme Volatility
Ukraine has dominated the news since Russia invaded it a week and a half ago. The fighting has already triggered huge single-day swings in global financial markets with Russian equities falling nearly 40% the day the invasion began and rising 26% the next day before failing to open all of last week (Chart 1, top panel), western European sovereign 10-year bond yields falling by over six standard deviations across the board last Tuesday before retracing much of the move the next day (Chart 1, second panel) and Brent crude moving more than three standard deviations on several days (Chart 1, third panel). The S&P 500’s reversal from losing 3.5% in overnight futures markets to closing up 3% during the New York session on the day of the invasion is modest by comparison, as is the 10-year Treasury yield’s 2-3-standard deviation moves (Chart 1, bottom panel), though they show that the US is not immune. The inevitability that US markets and the US economy will be affected by events seven time zones away has led us to devote this week’s report to Ukraine and its potential consequences. This report is not meant to be the definitive guide to the conflict. It simply synthesizes the views expressed within BCA under the leadership of our Geopolitical Strategy team and adds our own thoughts about market implications and how investors in US markets might prepare to manage their way through the crisis. What’s The Endgame? BCA does not expect Russia to halt its offensive until Kiev is captured and Ukraine’s government is toppled. We therefore view any rallies on hopes for a negotiated settlement to be premature and vulnerable to subsequent reversals. Despite their stirring courage, resolve and pluck, the Ukrainians are massively outgunned and the ultimate military outcome is not in doubt. The cities that are under siege will fall unless Russian forces relent. No one within BCA imagines that Russia will relent until it achieves its aim of establishing a buffer between NATO forces and its own territory. It appears as if the only logical option for Russia’s Vladimir Putin is to proceed until Kiev has fallen. Now that he has already triggered nearly all the economic retaliation that the US and a surprisingly united Europe is likely to muster, there is very little reason not to complete his objective. As dispiriting as it is for humankind, conditions on the ground are likely to get worse. BCA’s base-case scenario is that the military campaign will continue until the coast and all the major cities east of the Dnieper River have succumbed (Map 1). At that point, we expect that the de facto political outcome will leave Russia in control of the eastern half of the country and its southern coast while the remnants of Ukraine’s democratically elected officials establish a new federal government in the country’s west. Once the political borders are redrawn, the active conquest can end. Russia will remain a pariah state, and heated rhetoric between Washington and Moscow and various European capitals and Moscow will wax and wane, but no party will have an incentive to disturb the fragile and uneasy equilibrium. Map 1Tightening The Noose
Ukraine’s Grim Tidings
Ukraine’s Grim Tidings
We are saddened by the Ukrainian peoples’ grim plight. We are dismayed by the way that events have laid bare multilateral institutions’ weaknesses. We lament the clinical tone with which we are discussing events that involve extreme human suffering. As we’ve said before, albeit in more comfortable contexts, our job is bullish or bearish, not good or bad and not right or wrong. The coldly objective bottom line is that the US and Europe are unwilling to interpose their own troops or risk escalating tensions with the possessor of the world’s second largest nuclear arsenal over the integrity of Ukraine’s borders. The constraints they are willing to impose on Russia’s actions are insufficient to preserve Kiev and the other cities within its crosshairs. Economic And Market Implications The most immediate economic consequence will be a reduction in the supply of crude oil, natural gas, several base metals and wheat and corn. Russia is the world’s third-largest oil producer; second-largest natural gas producer; a major source of aluminum, copper and nickel; and Russia and Ukraine together account for one-seventh of global wheat and corn production. Banks and shipping companies are increasingly unwilling to finance and transport Russian exports and Ukraine’s ability to cultivate and ship crops will likely be limited by ground-level hazards and Russian control of its ports. Crop and metals prices will rise at least temporarily while alternatives to established trade flows are developed and energy prices could spike if either side cuts off flows between Russia and Europe. Increased energy prices are properly viewed as a tax on economic activity for oil importing economies and the 1973-74 Arab oil embargo’s contribution to the November 1973 to March 1975 recession and the grinding 1973-74 equity bear market loom large in American minds. There are two key distinctions between then and now, however. First, the American economy is far less energy intensive than it was in the early seventies (Chart 2). Second, now that the US is the world’s largest oil producer, rising oil prices lead to increased employment (Chart 3), greater income and marginally better credit performance, given that the energy sector is the plurality issuer of high-yield bonds. Higher oil prices are no longer unadulteratedly negative for the US economy. Chart 3... And Higher Prices Now Mean More Jobs
... And Higher Prices Now Mean More Jobs
... And Higher Prices Now Mean More Jobs
Chart 2Oil Ain't What It Used To Be ...
Oil Ain't What It Used To Be ...
Oil Ain't What It Used To Be ...
There is a threat, however, that rising commodity prices could push up long-run inflation expectations, forcing the Fed to take a harder line on rate hikes than it otherwise might. Although the 10-year Treasury yield fell last week, inflation expectations rose (Chart 4). Fortunately, American households are unusually well positioned to confront higher inflation, thanks to their modest debt burden, enormous savings cushion and robust pandemic wealth gains powered by advances in financial markets and home prices. We therefore expect that events in Ukraine will prove to be more inflationary than deflationary in the US, though risk-off moves may make it look like the economy is slowing in a worrisome way in the near term. Chart 4Longer-Run Inflation Expectations Have Perked Up
Longer-Run Inflation Expectations Have Perked Up
Longer-Run Inflation Expectations Have Perked Up
From Investment Strategy … Though we are still constructive on financial markets and the economy, we expect that markets will be subject to downdrafts as investors come to terms with the likely course of events in Ukraine. Although our base-case scenario does not include an expansion of the conflict beyond Ukraine’s borders, financial markets will experience additional turbulence as they price in the non-zero probability that it might. Against that backdrop, we are tactically reducing risk in our ETF portfolio and recommend that investors follow suit. … To Portfolio Construction To reduce our near-term exposure to what our Global Investment Strategy colleagues describe as “panic events,” we are temporarily closing out our equity overweight. We are also reducing our cyclicals-over-defensives, value and small-cap positions as a further way of trimming the sails. We are directly investing in two sub-industry groups that will help protect the portfolio against lower interest rates and higher metals prices. To get our overall equity exposure down by 500 basis points (bps), we are reducing our four remaining equal weight sector exposures (Table 1). Table 1Tactical Equity Adjustments In The ETF Portfolio
Ukraine’s Grim Tidings
Ukraine’s Grim Tidings
To reduce our cyclicals-over-defensives exposure, we are closing out the respective 160- and 100-bps overweights in Industrials (XLI) and Financials (XLF) while reducing our Consumer Staples (XLP) underweight by 230 bps. Those moves have the effect of reducing our net equity exposure by 30 bps. We are dialing back our Value (RPV) overweight by 250 bps to defend against the potential drag on the Financials-heavy position from lower interest rates and a flatter yield curve. We are trimming our small-cap exposure (IJR) by 100 bps. These moves free up 350 bps of capital. The potential for further war-inspired disruptions leads us to drill down from sectors to sub-industry groups to tailor exposure to homebuilders and miners of metals and alternative fuels. Consumer Discretionaries are rate-sensitive but homebuilders are hyper sensitive, as their customers typically finance 80 to 90% of their purchase price. Every penny of the group’s revenue is earned in the US, which is less exposed to Ukraine disruptions than Europe, Japan (which imports all of its oil and gas) and emerging markets (vulnerable to a rising dollar). Demand is robust (Chart 5), supply will remain limited and the group’s low P/E multiple stands out in a world with few cheap stocks. We are selling 100 bps of our overall sector exposure (XLY) to fund the targeted purchase of ITB, the ETF offering the purest play on homebuilders. We follow the same targeted-exposure playbook in zeroing out our overall Materials position (XLB) to initiate a 150-bps position in XME, a pure-play metals and mining ETF which our Commodity and Energy Strategy team recommends to profit from tight base metals markets (Chart 6). As a tactical move, we are effectively swapping exposure to chemicals, which use natural gas as a feedstock, for base metals, precious metals and coal and uranium. XLB is vulnerable to higher natural gas prices while XME would benefit from them, as well as from base metals supply interruptions and flight-to-safety demand for gold and silver. Given our commodity colleagues’ expectation that alternative energy ambitions will keep base metals well bid for an extended period, XME may remain in the portfolio after markets fully digest Ukraine implications. Chart 5The Homebuilding Outlook ##br##Is Bright
The Homebuilding Outlook Is Bright
The Homebuilding Outlook Is Bright
Chart 6Metals Inventories Were Tight Before Russian Resources Went Offline
Metals Inventories Were Tight Before Russian Resources Went Offline
Metals Inventories Were Tight Before Russian Resources Went Offline
The foregoing equity moves reduce our net holdings by 380 bps; we trim each of our four remaining equal weight positions – in Communication Services (XLC), Health Care (XLV), Real Estate (XLRE) and Tech (XLK) – by 30 bps to shed the remaining 120 bps needed to reset equities to equal weight to ride out temporary market turbulence. We also reduce our hybrid preferred stock position (VRP), as there’s less need for variable-rate protection if yields are going to decline and the preferred space may become more volatile as retail investors react to unsettling headlines. The 250-bps hybrid drawdown will be allocated to traditional fixed income, along with 250 bps of the equity sales proceeds, to bulk up our Treasury positions (SHY, IEI and IEF) in the proportion required to maintain benchmark duration (Appendix Table, shown at the back of the report). The remaining 250 bps raised by equity sales will be parked in cash to await an opportunity to re-risk the portfolio in line with our bullish cyclical view. Our relative equity sector positioning as of today is shown in Chart 7 and our relative fixed income positioning is shown in Chart 8. Chart 7Narrowing Our Sector Tilts
Ukraine’s Grim Tidings
Ukraine’s Grim Tidings
Chart 8Shrinking Our Treasury Underweight
Ukraine’s Grim Tidings
Ukraine’s Grim Tidings
Doug Peta, CFA Chief US Investment Strategist dougp@bcaresearch.com Cyclical ETF Portfolio
Ukraine’s Grim Tidings
Ukraine’s Grim Tidings
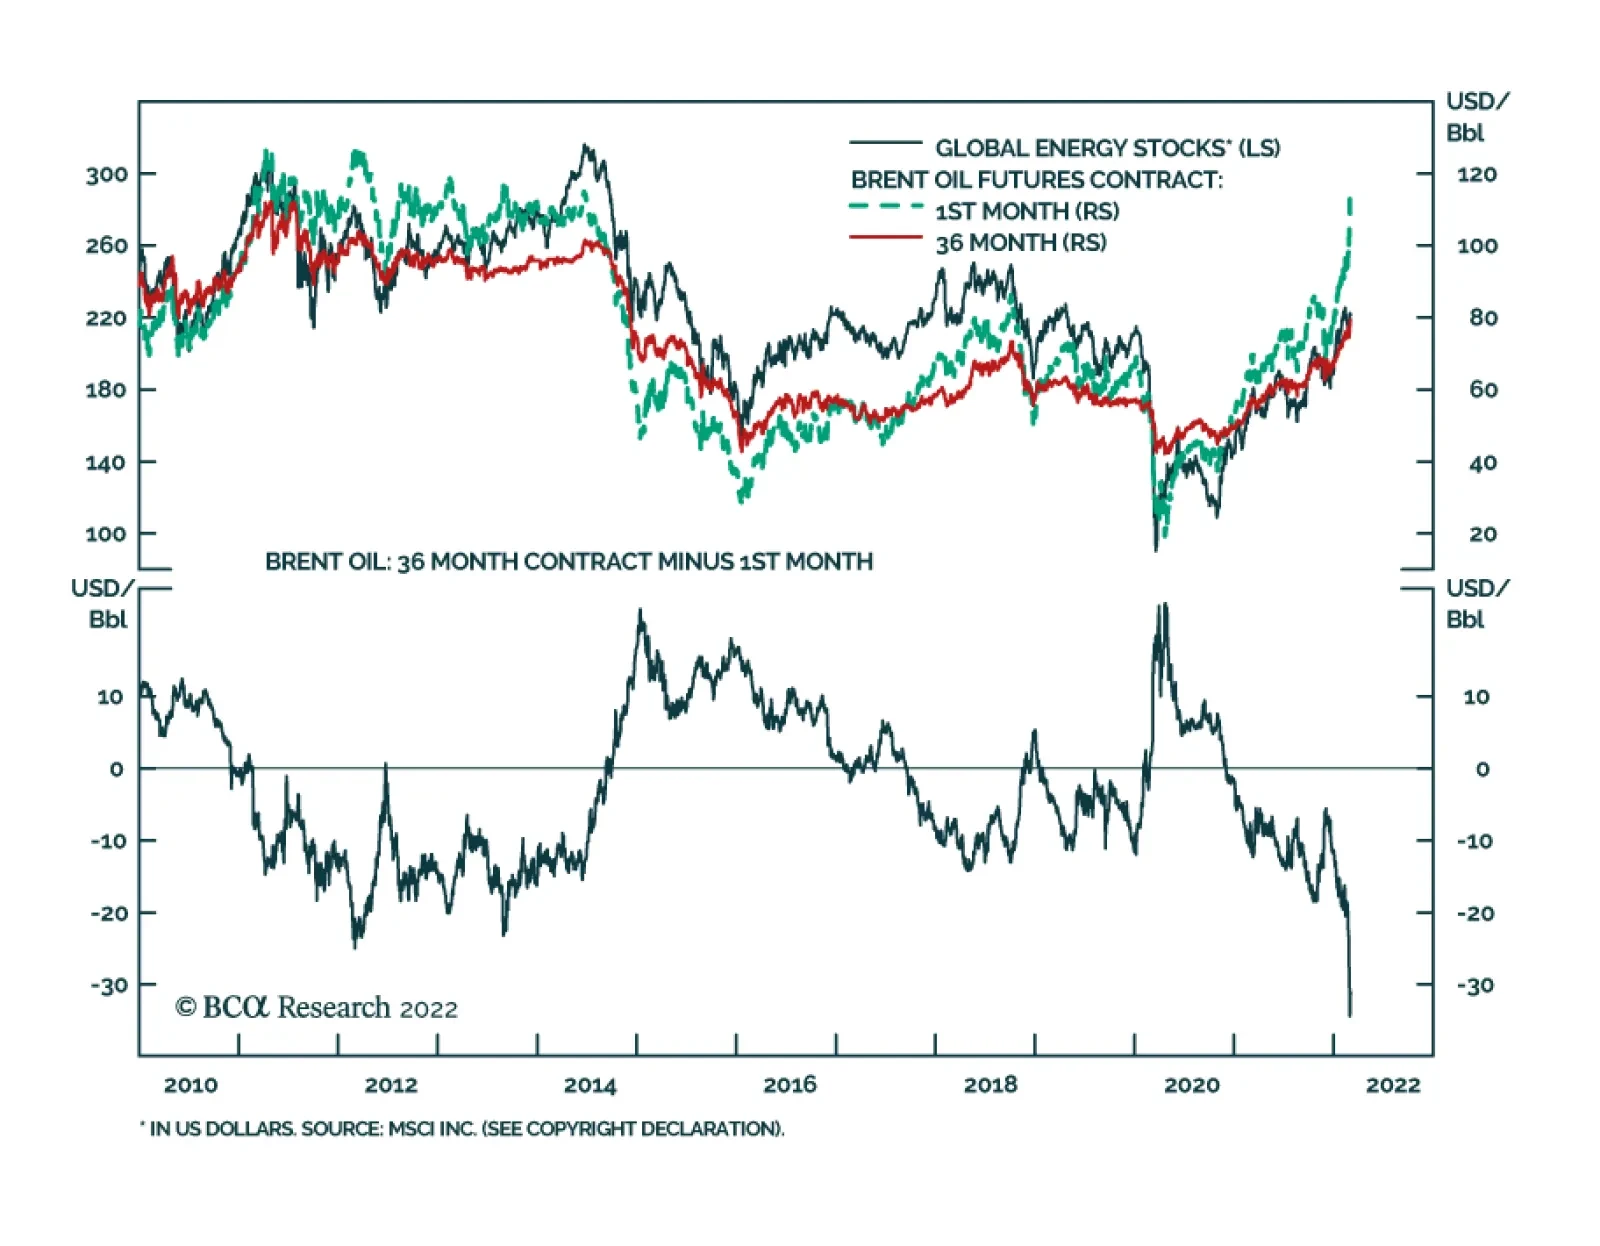
One consequence of the Russo-Ukrainian conflict has been a surge in energy (and other commodity) prices. Brent crude is up 47% this year. As a result, global energy stocks have been the best performing sector this year, rising 17% versus -8% for the broad…
Executive Summary Russia Not Prepared To Invade West Ukraine Yet
Imbalance Of Terror (GeoRisk Update)
Imbalance Of Terror (GeoRisk Update)
Russia is escalating its aggressiveness in Ukraine, marked by the shelling of a nuclear power station, troop reinforcements, and rhetorical threats of nuclear attack. Global financial markets will continue to suffer from negative news arising from this event until Russia achieves its aims in eastern Ukraine. Private sector boycotts on Russian commodity exports are imposing severe strains on the Russian economy, provoking it to apply more pressure on Ukraine and the West. Western governments are losing the ability to control the pace of strategic escalation, a dangerous dynamic. Moscow’s demand for security guarantees from Finland and Sweden will lead to a further escalation of strategic tensions between Russia and the West. During the Cold War the US and USSR saw a “balance of terror” due to rapidly expanding nuclear arms, which prevented them from waging war against each other. Today the same balance will probably prevent nuclear war but a nuclear scare that rattles financial markets may be required first. Trade Recommendation Inception Date Return Long Gold (Strategic) 2019-12-06 32.1% Bottom Line: Russia’s aggressiveness toward the US and Europe, including nuclear threats and diplomatic demands, will continue to escalate until it achieves its core military objectives. Investors should stick to safe havens and defensive equity markets and sectors on a tactical basis. Book profits on tactical trade long Japan/Germany industrials at close of trading on March 4. Feature Russian military forces shelled the Zaporizhzhia Nuclear Power Station on March 4, causing a fire. The International Atomic Energy Agency (IAEA) declared that “essential equipment” was not damaged and that the facility possessed adequate containment structures to prevent a nuclear meltdown. Local authorities said the facility was “secured.” This incident, which may or may not be settled, should be added to several others to highlight that Russia is escalating its aggression in Ukraine and global financial markets face more bad news that they will be forced to discount. Signposts For Further Escalation Map 1 shows the status of the Russian invasion of Ukraine, along with icons for the nuclear power plants. Map 1War In Ukraine, Status Of Russian Invasion As Of March 2, 2022
Imbalance Of Terror (GeoRisk Update)
Imbalance Of Terror (GeoRisk Update)
To understand the end-game in Ukraine – and why we think the war will escalate and are keeping open our bearish trade recommendations – we need to review our net assessment for this conflict: Our 65% “limited invasion” scenario included the seizure of strategic territory east of the Dnieper river and all of the southern coastline. Energy trade would be exempt from sanctions, saving Europe from a recession and limiting the magnitude of global energy shock. We gave 10% odds to a “full-scale invasion of all of Ukraine” (deliberate wording) because we viewed it as highly unlikely that Russia would invade the mountainous and guerilla-happy far west, the ethnic Ukrainian core. Energy trade would be sanctioned, delivering a global energy shock and European recession. A handful of clients have criticized us for not predicting that Russia would attack Kiev and for not defining a full-scale invasion as one that involved replacing the government. We never gave a view on whether Russia would invade Kiev. It is not clear that the focus on Kiev is warranted since the US and EU had committed to powerful sanctions in the event of any invasion at all. This fixed price of invasion may have given Moscow the perverse incentive to invade Kiev. Either way, Russia invaded Kiev and eastern Ukraine and the US and EU imposed crippling sanctions but exempted the energy trade. Thus anything that breaks off energy trade between the EU and Russia – and any Russian attempt to invade the west of the country to Poland – should be seen as a significant escalation. Unfortunately there are signs that the energy trade is being disrupted. Any westward campaign to Poland will be delayed until Putin sacks Kiev and controls the east and south of Ukraine, at which point he will be forced either to invade the west to cut off the supply lines of the insurgency or, more likely, to negotiate a ceasefire that partitions Ukraine. Global investors will not care about the war in Ukraine as long as strategic stability is achieved between Russia and the West. But that is far away. Today, as Russia’s economic situation deteriorates, Putin is escalating on the nuclear front. Bottom Line: Russia’s showdown with the West is escalating. Good news for the Ukrainians will lead to bad news for financial markets. Global investors should not view the situation as stabilized and should maintain safe haven trades and defensive equity positioning. Energy Boycotts Will Antagonize Russia Chart 1Russia Not Prepared To Invade West Ukraine Yet
Imbalance Of Terror (GeoRisk Update)
Imbalance Of Terror (GeoRisk Update)
So far Russia has not conducted a full-scale invasion of all of Ukraine. The reason is that it does not have the necessary military forces, as we have highlighted. Russia is limiting its invasion force to around 200,000 troops while Ukraine consists of 30 million prime age citizens (Chart 1). Unless Russia massively reinforces its troops, it does not have the basic three-to-one troop ratio that is the minimum necessary to invade, conquer, and hold the entire country. However, Russia is likely to increase troop sizes. We are inclined to believe that Russia has started shifting troops from its southern and eastern military districts to reinforce the Ukraine effort, according to the Kyiv Independent, citing the Ukrainian armed forces’ general staff. Apparently it aims to conquer the east and then either invade further west or negotiate a new ceasefire with greater advantage. Investors should not accept the consensus narrative in the western world that Russia is losing the war in the east. Russia is encountering various difficulties but it is gradually surrounding and blockading Ukraine and cutting its power supply. It is capable of improving its supply lines and increasing the size and destructiveness of its forces. Remember that the US took 20 days to sack Baghdad in 2003. Russia has only been fighting for nine days. Having incurred crippling economic sanctions, Putin cannot afford to withdraw without changing the government in Kiev. The odds of Ukraine “winning” the war are low, while the odds of Russia dramatically intensifying its efforts are high. This is why new developments on the energy front and worrisome: Chart 2Energy Trade Remains The Fulcrum
Imbalance Of Terror (GeoRisk Update)
Imbalance Of Terror (GeoRisk Update)
While western governments refrained from sanctioning Russian energy as predicted, private companies are boycotting Russian energy to avoid sanctions and unpopularity. Estimates vary but about 20% of Russian oil exports could be affected so far.1 Russian oil will make its way to global markets – Russian, Chinese, and other third parties will pick up the slack – but in the meantime the Russian economy is suffering more than expected due to the cutoff. Energy is the vital remaining source of Russian economic stability and Russo-European relations (Chart 2). If it fails then Russia could grow more desperate while Europe’s economy would fall into recession and Europe would become less stable and less coordinated in its responses to the conflict. These private boycotts make it beyond the control of western governments to control the pace and intensity of pressure tactics, since it is politically impractical to demand that companies trade with the enemy. Bottom Line: With the rapidly mounting economic pressure, it should be no surprise that Russia is escalating its threats – it is under increasing economic pressure and wants to drive the conflict to a quick decision in its favor. Russia’s Nuclear Threats And Putin’s Mental State Russia is terrorizing Ukraine and the western world with threats of either nuclear missile attacks or a nuclear meltdown. Putin put the country’s nuclear deterrent forces on “special combat status” on February 27. His forces began shelling the Zaporizhzhia nuclear power plant on March 4. Russia is also demanding security guarantees from Finland and Sweden, which are becoming more favorable toward joining the NATO alliance.2 Their lack of membership in NATO, while maintaining a strong military deterrent with defense support from the US, was a linchpin of stability in the Cold War but is now at risk. They will retain the right to choose their alliances at which point Russia will need to threaten them with attack. Since Russia cannot plausibly invade them with full armies while invading Ukraine, it may resort to nuclear brinksmanship. The western media is greatly amplifying a narrative in which Russia’s actions can only be understood in the context of Putin’s insanity or fanaticism. This may be true. But it is also suspicious because it saves the West from having to address the problem of NATO enlargement, which, along with Russia’s domestic weaknesses, contributed to Russia’s decision over the past 17 years to stage an aggressive campaign to control Ukraine and the former Soviet Union. There is a swirl of conspiracy theories in the news about Putin’s illnesses, age, vaccines, or psychology, none of which are falsifiable. Putin has an incentive to appear reckless and insane so that his enemies capitulate sooner. The decision to invade a non-NATO member, rather than a NATO member, suggests that he is still making rational calculations. Rational, that is, from the perspective of Russian history and an anarchic international system in which nation states that seek to survive, secure themselves, and expand their power. If Ukraine were to become a military ally of the US then Russian security would suffer a permanent degradation. Of course, Putin may be a fanatic and it is possible that he grows desperate or miscalculates. The western public (and global investors) will thus be reminded of the “balance of terror” that prevailed throughout the Cold War, in which the world lived and conducted business under the shadow of nuclear holocaust. Today Russia has 1,588 deployed strategic nuclear warheads, contra the US’s 1,644. Both countries can deliver nuclear weapons via ballistic missiles, submarines, and bombers and are capable of destroying hundreds of each other’s cities on short notice (Table 1). While the US has at times contemplated the potential for nuclear attacks to occur but remain limited, the Soviet Union’s nuclear doctrine ultimately rejected the likelihood of limitations and anticipated maximum escalation.3 Table 1The Return Of The Balance Of Terror
Imbalance Of Terror (GeoRisk Update)
Imbalance Of Terror (GeoRisk Update)
Ultimately the US and Russia avoided nuclear war in the Cold War because it entailed “mutually assured destruction” which violated the law of self-preservation. Neither Stalin nor Mao used nukes on their opponents, including when they lost conflicts (e.g. to Afghanistan and Vietnam). The US tied with North Korea and lost to Vietnam without using nukes. However in the current context the US has been wary of antagonizing Putin for fear of his unpredictable and aggressive posture. In response to Putin’s activation of combat-ready nuclear forces, the US called attention to its own nuclear deterrent subtly by canceling the regular test of a ballistic missile and issuing a press statement highlighting the fact and saying that it was too responsible to bandy in nuclear threats. Yet the autocratic nature of Putin’s regime means that if Putin ultimately does prove to be a lunatic then large parts of the world face existential danger. Our Global Investment Strategist Peter Berezin ascribes Russian Roulette odds to nuclear Armageddon – while arguing that investors should stay invested over the long run anyway. Sanctions on the Russian central bank have frozen roughly half of the country’s $630 billion foreign exchange reserves (Table 2). If the energy trade also stops, then the economy will crash and Putin could become desperate. Table 2Western Sanctions On Russia As Of March 4, 2022
Imbalance Of Terror (GeoRisk Update)
Imbalance Of Terror (GeoRisk Update)
Bottom Line: Global financial markets have yet to experience the full scare that is likely as Russia escalates its aggression and nuclear brinksmanship to ensure it achieves it strategic aims in Ukraine and prevents Finland from joining NATO. GeoRisk Indicators In March In what follows we provide our monthly update of our quantitative, market-based GeoRisk Indicators. Russian geopolitical risk is surging as the ruble and equity markets collapse (Chart 3). The violent swings of the underlying macroeconomic variables as Russia saw a V-shaped recovery from the COVID-19 lockdowns, then sharply decelerated again, prevented our risk indicator from picking up the full scale of the geopolitical risk until recently. But alternative measures of Russian risk show the historic increase more clearly – and it can also be demonstrated by reducing the weighting of the underlying macroeconomic variables relative to the USD-RUB exchange rate in the indicator’s calculation (Chart 4). Chart 3Russian GeoRisk Indicator
Russian GeoRisk Indicator
Russian GeoRisk Indicator
Chart 4Other Measures Of Russian Geopolitical Risk
Other Measures Of Russian Geopolitical Risk
Other Measures Of Russian Geopolitical Risk
This problem of dramatically volatile pandemic-era macro data skewing our risk indicators has been evident over the past year and is more apparent with some indicators than with others. China’s geopolitical risk as measured by the markets is starting to peak and stall but we do not recommend investors try to take advantage of the situation. China’s domestic and international political risk will remain elevated through the twentieth national party congress this fall. The sharp increase in commodity prices will amplify the problem. The earliest China’s political environment can improve substantially is in 2023 after President Xi Jinping cements another ten years’ in power (Chart 5). And yet that very process is negative for long-term political stability. Chart 5China GeoRisk Indicator
China GeoRisk Indicator
China GeoRisk Indicator
British geopolitical risk is contained. It enjoys some insulation from the war on the continent, underpinning our long GBP-CZK trade and long UK equities trade relative to developed markets other than the United States (Chart 6). Chart 6United Kingdom GeoRisk Indicator
United Kingdom GeoRisk Indicator
United Kingdom GeoRisk Indicator
German and French geopolitical risk is being priced higher as expected (Charts 7 and 8). Of these two Germany is the more exposed due to the risk of energy shortages. France is nuclear-armed and nuclear-powered, and unlikely to see a change of president in the April presidential elections. Italian risk was already at a higher level than these countries but the Russian conflict and high energy supply risk will keep it elevated (Chart 9). Chart 7Germany GeoRisk Indicator
Germany GeoRisk Indicator
Germany GeoRisk Indicator
Chart 8France GeoRisk Indicator
France GeoRisk Indicator
France GeoRisk Indicator
Chart 9Italy GeoRisk Indicator
Italy GeoRisk Indicator
Italy GeoRisk Indicator
Canada’s trucker strikes are over and the loonie will benefit from the country’s status as energy producer and insulation from geopolitical threats due to proximity with the United States (Chart 10). Chart 10Canada GeoRisk Indicator
Canada GeoRisk Indicator
Canada GeoRisk Indicator
Spain still has substantial domestic political polarization but this will have little impact on markets amid the Ukraine war. Spain is distant from the fighting and will act as a conduit for liquefied natural gas imports into Europe (Chart 11). Chart 11Spain GeoRisk Indicator
Spain GeoRisk Indicator
Spain GeoRisk Indicator
Australia’s political risk will remain elevated due to its clash with China amid the emerging global conflict between democracies and autocracies as well as the country’s looming general election, which threatens a change of ruling party (Chart 12). However, as a commodity and LNG producer and staunch US ally the country’s risks are overrated. Chart 12Australia GeoRisk Indicator
Australia GeoRisk Indicator
Australia GeoRisk Indicator
Markets are gradually starting to price the risk of an eventual China-Taiwan military conflict as a result of the Ukrainian conflict. China is unlikely to invade Taiwan on Russia’s time frame given the greater difficulties and risks associated with an amphibious invasion of a much more strategically critical territory in the world. But Taiwan’s situation is comparable to that of Ukraine and it is ultimately geopolitically unsustainable, so we expect Taiwanese assets to suffer a higher risk premium over the long run (Chart 13). Chart 13Taiwan Territory GeoRisk Indicator
Taiwan Territory GeoRisk Indicator
Taiwan Territory GeoRisk Indicator
South Korea faces a change of ruling parties in its March 9 general election as well as uncertainties emanating from China and a new cycle of provocations from North Korea (Chart 14). However these risks are probably not sufficient to prevent a rally in South Korean equities on a relative basis as China stabilizes its economy. Chart 14Korea GeoRisk Indicator
Korea GeoRisk Indicator
Korea GeoRisk Indicator
Turkey’s international environment has gotten even worse as a result of Russia’s invasion of Ukraine and effective closure of the Black Sea to international trade. Turkey has invoked the 1936 Montreux Convention to close the Dardanelles and Bosporus straits to Russian warships, although it will let those ships return to home from outside the Black Sea. The Black Sea is highly vulnerable to “Black Swan” events, highlighted by the sinking of an Estonian ship off Ukraine’s coast in recent days. Turkey’s domestic political situation will also generate a political risk premium through the 2023 presidential election (Chart 15), as President Recep Erdogan’s reelection bid may benefit from international chaos and yet he is an unorthodox and market-negative leader, and if he loses the country will be plunged into factional conflict. Chart 15Turkey GeoRisk Indicator
Brazil GeoRisk Indicator
Brazil GeoRisk Indicator
South Africa looks surprisingly attractive in the current environment given our assessment that the government is stable and relatively friendly to financial markets, the next general election is years away, and the search for commodity alternatives to Russia amid a high commodity price context will benefit South Africa (Chart 16). Chart 16South Africa GeoRisk Indicator
South Africa GeoRisk Indicator
South Africa GeoRisk Indicator
India And Brazil: A Tale Of Two Emerging Markets Russia’s invasion of Ukraine will have a minimal impact on the growth engines of India and Brazil. This is because Russia directly accounts for a smidgeon of both these countries trade pie. However, the main route through which this war will be felt in both markets is through commodity prices. Brazil by virtue of being a commodity exporter is better positioned as compared to India which is a commodity importer and is richly valued to boot. The year 2022 promises to be important from the perspective of domestic politics in both countries and will add to the policy risks confronting both EMs. Our Brazilian GeoRisk indicator has collapsed but is highly likely to recover and rise from here (Chart 17). Chart 17Brazil GeoRisk Indicator
Brazil GeoRisk Indicator
Brazil GeoRisk Indicator
Commodity Price Spike – Advantage Brazil Politically India and Brazil have a lot in common today. The popularity ratings of their respective right-leaning heads of states, Prime Minister Narendra Modi in India and President Jair Bolsonaro in Brazil, have suffered over the last two years. The economic prospects of the median voter in both countries have weakened over the last year (Chart 18). Policymakers in both countries face a dilemma: they cannot stimulate their way out of their problems without an adverse market reaction since both countries are loaded with public debt. Chart 18Economic Miseries Rising For Both India's And Brazil's Median Voter
Economic Miseries Rising For Both India's And Brazil's Median Voter
Economic Miseries Rising For Both India's And Brazil's Median Voter
Despite these commonalties, Brazil’s equity markets have outperformed relative to EMs whilst India has underperformed (Chart 19). On a tactical horizon, we expect this divergent performance to continue as the effects of the Russian invasion feed through commodity markets. Chart 19India Is Richly Valued, Brazil Has Outperformed EMs
India Is Richly Valued, Brazil Has Outperformed EMs
India Is Richly Valued, Brazil Has Outperformed EMs
Commodity markets were tight even before the Russian invasion. The ongoing war will force inventories to draw across a range of commodities including oil, iron ore and even corn. Given that India is a net importer of oil whilst Brazil is a net commodity exporter, the current spike in commodity prices will benefit Brazil over India in the short term. However, our Commodity & Energy Strategy team expects supply responses from oil producers to eventually come through, thereby sending the price of Brent crude to $85 per barrel by the end of 2022. Hence if Indian equities correct in response to the current oil spike or domestic politics (see below), then investors can turn constructive on India on a tactical horizon. Elections Stoke Policy Risks – In India And Brazil Results of key state elections in India will be announced on March 10, 2022. Of all the state elections, the results that the market will most closely watch will be those of Uttar Pradesh, the most populous state of India. In a base case scenario, we expect the Bhartiya Janata Party (BJP) which rules this state, to cross the 50% seat share mark and retain power. But the BJP will not be able to beat the extraordinary 77% seat share it won at the 2017 elections in Uttar Pradesh. A sharp deviation from this benchmark may lead the BJP to focus on populism ahead of the next round of state elections due in 4Q 2022. At a time when the Indian government’s appetite to take on structural reforms is waning, we worry that such a populist tilt could perturb Indian equity markets. Also, general elections are due in India in 2024. If the latest state election results suggest that the BJP has ceded a high vote share to regional parties (such as the Samajwadi Party in Uttar Pradesh or Aam Aadmi Party in Punjab), then this would mean that regional parties can pose a credible threat to BJP’s ability to maintain a comfortable majority in 2024. In Brazil, some polls show that left-leaning former president Lula da Silva's lead on President Bolsonaro may have narrowed. While we expect Lula to win the presidential elections due in Brazil in October 2022, the road to victory will not be as smooth as markets expect. If the difference between the two competitors’ popularity stays narrow, then there is real a chance that President Bolsonaro will make a last-ditch effort to cling to power. He will resort to fiscal populism and attacks on Brazil’s institutions, potentially opening up institutional or civil-military rifts that generate substantially greater uncertainty among investors. Bolsonaro already appears to be planning a cut in fuel prices and a bill to further this could be tabled as soon as next week. He has coddled Russian President Putin to shore up his base of authoritarian sentiment at home. To conclude, investors must balance these two opposing forces affecting Brazilian markets today. On one hand are the latent policy risks engendered by a far-right populist who still has a few months left in office. On the other hand, in a year’s time Bolsonaro will likely be gone while Brazil stands to benefit as commodity prices rise and EM investors shift funds into commodity exporters like Brazil. Against this backdrop, we re-iterate our view that investors should take-on selective tactical exposure in Brazil. Risk-adjusted returns in Brazil at this juncture can be maximized by buying into sectors like financials as these sectors’ inherent political and policy sensitivity is low. Postscript: Is India’s Foreign Policy Reverting To Non-Alignment? India traditionally has followed a foreign policy of non-alignment, carefully maintaining ties with both America and Russia through the Cold War. Things changed in the 2000s as Russia under President Putin courted closer ties with China while the US tried to warm up to India. India’s decision to join the newly energized US-led “quadrilateral” alliance in 2017 is a clear sign that India is gradually shedding its historical stance of neutrality and veering towards America. However, this thesis is being questioned as India, like China, is continuing to trade and transact with Russia despite its invasion of Ukraine, providing Russia with a lifeline as it suffers punishing sanctions from the US and European Union. India repeatedly abstained from voting resolutions critical of Russia at the United Nations in recent weeks. In other words, India’s process of transitioning over to the US alignment will be “definitive yet slow,” owing to reasons of both history and practicality. The former Soviet Union’s support played a critical role in helping India win several regional battles like the Indo-Pakistan war of 1971. Russia’s military and security influence in Central Asia makes it useful to India, which seeks a counter to Pakistan on its flank in Afghanistan. India sees Russia as a fairly dependable partner that cannot be abandoned until America is willing to provide much greater and more reliable guarantees and subsidies to India – through military support and beneficial trade deals. The backbone of Indo-Russia relations has been their arms trade (Chart 20). India’s reliance on Russia for arms could decline in the long term. But in the short term, as India tilts towards the US at a calibrated pace, India could remain a source of meaningful defense revenue for Russia. It is possible but not likely that the US would impose sanctions on India for maintaining this trade. Chart 20India Today Is A Key Buyer Of Russian Weapons
Imbalance Of Terror (GeoRisk Update)
Imbalance Of Terror (GeoRisk Update)
The fundamental long-term dynamic is that Russia has foreclosed its relations with the West and will therefore be lashed to China, at least until the Putin regime falls and a Russian diplomatic reset with the West can be arranged. In the face of this combined geopolitical bloc, India will gradually be driven to cooperate more closely with the United States. But India will not lead the transition away from Russia – rather it will react appropriately depending on the US’s focus and resolve in countering China and assisting India’s economy. Matt Gertken Chief Geopolitical Strategist mattg@bcaresearch.com Ritika Mankar, CFA Editor/Strategist ritika.mankar@bcaresearch.com Footnotes 1 Energy Aspects long-term estimate. 2 Tzvi Joffre, “Russian FM repeats nuclear war rhetoric as invasion of Ukraine continues,” Reuters, March 3, 2022. 3 Jack L. Snyder, “The Soviet Strategic Culture : Implications for Limited Nuclear Operations,” Rand Corporation, R-2154-AF (1977), argues that Soviet and American strategic cultures differ greatly and that the US should not be “sanguine about the likelihood that the Soviets would abide by American-formulated rules of intrawar restraint." Strategic Themes Open Tactical Positions (0-6 Months) Open Cyclical Recommendations (6-18 Months) Regional Geopolitical Risk Matrix "Batting Average": Geopolitical Strategy Trades (2022) Section III: Geopolitical Calendar
Executive Summary We look at the Ukraine crisis in the broader context of shocks, what we can learn from them, and how we can incorporate them into our strategy for investment, and life in general. Our high-conviction view is that the Ukraine crisis will be net deflationary, because the economic and financial sanctions imposed on Russia will lead to a generalized demand destruction. Bond yields will be lower in the second half of the year. Underweight cyclicals such as banks, ‘value’ sectors, and value-heavy stock markets such as the FTSE 100. Stay structurally overweight the 30-year T-bond. The ultimate low in the 30-year T-bond yield is yet to come, and will be a long way below the current 2.1 percent. Fractal trading watchlist: We focus on banks, add alternative electricity, and review bitcoin. Every Shock Is Always Supplanted By A New Shock
Every Shock Is Always Supplanted By A New Shock
Every Shock Is Always Supplanted By A New Shock
Bottom Line: The recent rise in bond yields and the associated outperformance of cyclical sectors such as banks, ‘value’, and value-heavy stock markets such as the FTSE 100 was just a short-lived countertrend move within a much bigger structural downtrend. This structural downtrend is now set to resume. Feature Suddenly, nobody is worried about Covid and everybody is worried about nuclear war. Or as Vladimir Putin warns, “such consequences that you have never experienced in your history.” The life lesson being that every shock is always supplanted by a new shock. Hence, in this report we look at the Ukraine crisis through a wider lens. We look at the broader context of shocks, what we can learn from them, and how we can incorporate them into our strategy for investment, and life in general. The Predictability Of Shocks Shocks are very predictable. This sounds like a contradiction, but we don’t mean the timing or nature of individual shocks. As specific events, Russia’s full-scale invasion of Ukraine and the global pandemic were ‘tail-events’ that did come as shocks. Yet the statistical distribution of such tail-events is very predictable. This predictability of shocks forms the bedrock of the world’s $5 trillion insurance industry, and should also form the bedrock of any long-term strategy for investment, or life in general. The predictability of shocks forms the bedrock of the world’s $5 trillion insurance industry, and should also form the bedrock of any long-term investment strategy. We define a shock as any event that causes the long-duration bond price in a major economy to rally or slump by at least 20 percent, albeit this is just one definition.1On this definition, the Ukraine crisis is not yet a far-reaching economic or financial shock, but it is certainly well-placed to become one. Applying this definition of a shock through the last 60 years, the statistical distribution of shocks over any long period is well-defined and very predictable. For example, over a ten-year period the number of shocks exhibits a Poisson distribution with parameter 3.33 (Chart I-1), while the time between shocks exhibits an Exponential distribution with parameter 3.33. Chart 1The Statistical Distribution Of Shocks Is Very Predictable
The Predictable Anatomy Of Shocks
The Predictable Anatomy Of Shocks
Many economists and investment strategists present their long-term forecasts for the economy and financial markets, yet completely ignore this very predictable distribution of shocks – making their long-term forecasts worthless! The question to such economists and strategists is why are there no shocks over your forecasting horizon? Their typical answer is that it is not an economist’s job to predict ‘acts of god’ or ‘black swans.’ But if insurance companies can incorporate the very predictable distribution of acts of god and black swans, then why can’t economists and strategists? Over any ten-year period, the likelihood of suffering a shock is a near-certainty, at 95 percent; in any five-year period, it is an extremely high 80 percent; in a two-year period, it is a coin toss at 50 percent; and even in one year it is a significant 30 percent (Chart I-2). Chart I-2On A Multi-Year Horizon, Another Shock Is A Near-Certainty
The Predictable Anatomy Of Shocks
The Predictable Anatomy Of Shocks
Witness that since just 2016 we have experienced Brexit, and the election of Donald Trump as US president. These were binary-outcome events where we could ‘visualise’ the tail-event in advance, but many dismissed it as implausible. Then we had a global pandemic, and now Russia’s full-scale invasion of Ukraine. Therefore, the crucial question is not whether we will experience shocks. We always will. The crucial question is, will the shock be net deflationary or net inflationary? Our high-conviction view is that the Ukraine crisis will be net deflationary. Meaning that even if it starts as inflationary, it will quickly morph into deflationary. The Danger From Higher Energy Prices: The Obvious And The Not So Obvious Many people have noticed the suspicious proximity of oil price surges to subsequent economic downturns – most recently, the 1999-2000 trebling of crude and the subsequent 2000-01 downturn, and the 2007-2008 trebling of crude and the subsequent 2008-09 global recession. Begging the question, should we be concerned that the Ukraine crisis has lifted the crude oil price to a near-trebling since October 2020, not to mention the massive spike in natural gas prices? Many people have noticed the suspicious proximity of oil price surges to subsequent economic downturns. Of course, we know that the root cause of both the 2000-01 downturn and the 2008-09 recession was not the oil price surge that preceded them. As their names make crystal clear, the 2001-01 downturn was the dot com bust and the 2008-09 recession was the global financial crisis. And yet, and yet… while the oil price surge was not the culprit, it was certainly the accessory to both murders. The obvious way that high energy prices hurt is that they are demand destructive to both energy and non-energy consumption. In this regard, the good news is that the economy is becoming much less energy-intensive – every unit of real output requires about 40 percent less energy than at the start of the millennium (Chart I-3). Nevertheless, even if the scope to hurt is lessening, higher energy prices are still demand destructive. Chart I-3The Economy Is Becoming Less Energy-Intensive
The Economy Is Becoming Less Energy-Intensive
The Economy Is Becoming Less Energy-Intensive
The not so obvious way that high energy prices hurt is that they risk driving up the long-duration bond yield and thereby tipping more systemically important economic and financial fragilities over the brink. This was the where the greater pain came from in both 2000 and 2008 (Chart I-4 and Chart I-5). Chart I-4Fears Of Energy-Driven Inflation Drove Up The Bond Yield In 1999
Fears Of Energy-Driven Inflation Drove Up The Bond Yield In 1999
Fears Of Energy-Driven Inflation Drove Up The Bond Yield In 1999
Chart I-5Fears Of Energy-Driven Inflation Drove Up The Bond Yield In 2008
Fears Of Energy-Driven Inflation Drove Up The Bond Yield In 2008
Fears Of Energy-Driven Inflation Drove Up The Bond Yield In 2008
Fortunately, the recent decline in the 30-year T-bond yield suggests that the bond market is looking through the short-term inflationary impulse of higher energy prices (Chart I-6). Instead, it is focussing on the deflationary impulse that will come from the demand destruction that the higher prices will trigger. Chart I-6Today, The Bond Market Is Looking Through The Inflationary Impulse From Higher Energy Prices
Today, The Bond Market Is Looking Through The Inflationary Impulse From Higher Energy Prices
Today, The Bond Market Is Looking Through The Inflationary Impulse From Higher Energy Prices
The economic and financial sanctions imposed on Russia will only lead to additional demand destruction. Sanctions restrict trade and economic and financial activity – therefore they hurt both the side that is sanctioned and the side that is sanctioning. This mutuality of pain caused the West to balk at both the timing and severity of its sanctions. But absent an unlikely backdown from Russia, the sanctions noose will tighten, choking growth everywhere. If bond yields were to re-focus on inflation and move higher, it would add a further headwind to the economy and markets, forcing the 30-year T-bond yield back down again from a ‘line in the sand’ at around 2.4-2.5 percent. So, the long-duration bond yield will go down directly or via a short detour higher. Either way, bond yields will be lower in the second half of the year. Given the very tight connection between bond yields and stock market sector, style, and country allocation, it will become clear that the recent outperformance of cyclicals such as banks, ‘value’ sectors, and value-heavy stock markets such as the FTSE 100 was just a short-lived countertrend move in a much bigger structural downtrend (Chart I-7). This structural downtrend is set to resume. Chart I-7When Bond Yields Decline, Banks Underperform
When Bond Yields Decline, Banks Underperform
When Bond Yields Decline, Banks Underperform
Underweight cyclicals such as banks, ‘value’ sectors, and value-heavy stock markets such as the FTSE 100. Yet, the over-arching message from the anatomy of shocks is that the ultimate structural low in the 30-year T-bond yield is yet to come, and will be a long way below the current 2.1 percent. Stay structurally overweight the 30-year T-bond. Fractal Trading Watchlist This week’s analysis focusses on banks, adds alternative electricity, and reviews bitcoin. Supporting the fundamental arguments in the main body of this report, the recent outperformance of banks has reached the point of fractal fragility that has signalled several important turning-points through the past decade (Chart 1-8). Accordingly, this week’s recommended trade is to go short world banks versus world consumer services, setting the profit target and symmetrical stop-loss at 12 percent. Chart I-8The Recent Outperformance Of Banks May Soon End
The Recent Outperformance Of Banks May Soon End
The Recent Outperformance Of Banks May Soon End
Alternative Electricity Is Rebounding From An Oversold Position
Alternative Electricity Is Rebounding From An Oversold Position
Alternative Electricity Is Rebounding From An Oversold Position
Bitcoin's Support Is Holding
Bitcoin's Support Is Holding
Bitcoin's Support Is Holding
Dhaval Joshi Chief Strategist dhaval@bcaresearch.com Footnotes 1 As bond yields approach their lower limit, this definition of a shock will need to change as it will become impossible for long-duration bond prices to rally by 20 percent. Fractal Trading System Fractal Trades
The Predictable Anatomy Of Shocks
The Predictable Anatomy Of Shocks
The Predictable Anatomy Of Shocks
The Predictable Anatomy Of Shocks
6-Month Recommendations Structural Recommendations Closed Fractal Trades Indicators To Watch - Bond Yields Chart II-1Indicators To Watch - Bond Yields ##br##- Euro Area
Indicators To Watch - Bond Yields - Euro Area
Indicators To Watch - Bond Yields - Euro Area
Chart II-2Indicators To Watch - Bond Yields ##br##- Europe Ex Euro Area
Indicators To Watch - Bond Yields - Europe Ex Euro Area
Indicators To Watch - Bond Yields - Europe Ex Euro Area
Chart II-3Indicators To Watch - Bond Yields ##br##- Asia
Indicators To Watch - Bond Yields - Asia
Indicators To Watch - Bond Yields - Asia
Chart II-4Indicators To Watch - Bond Yields ##br##- Other Developed
Indicators To Watch - Bond Yields - Other Developed
Indicators To Watch - Bond Yields - Other Developed
Indicators To Watch - Interest Rate Expectations Chart II-5 Indicators To Watch - Interest Rate Expectations
Indicators To Watch - Interest Rate Expectations
Indicators To Watch - Interest Rate Expectations
Chart II-6 Indicators To Watch - Interest Rate Expectations
Indicators To Watch - Interest Rate Expectations
Indicators To Watch - Interest Rate Expectations
Chart II-7Indicators To Watch - Interest Rate Expectations
Indicators To Watch - Interest Rate Expectations
Indicators To Watch - Interest Rate Expectations
Chart II-8Indicators To Watch - Interest Rate Expectations
Indicators To Watch - Interest Rate Expectations
Indicators To Watch - Interest Rate Expectations
Executive Summary Russian Stocks Are Breaking Below Their 2008 And 2015 Lows
Russian Stocks Are Breaking Below Their 2008 And 2015 Lows
Russian Stocks Are Breaking Below Their 2008 And 2015 Lows
The Kremlin will not halt its military operations in Ukraine for now. The strategic objective of Putin is to bring Ukraine back into its geopolitical and economic orbit. His immediate goal is to unseat the current government in Kyiv and install a pro-Kremlin administration. Russia is embracing a long period of economic and financial isolation. Russian financial markets will remain uninvestable for an extended period. We are downgrading Central European equities and local currency bonds to underweight within their respective EM portfolios. As a new trade, we recommend shorting the Polish zloty versus the US dollar. Recommendation Inception Date Return Short PLN / Long USD Mar 02, 2022 Bottom Line: The security situation in Europe will continue to deteriorate, especially if the Russian army fails to secure a rapid military victory. This poses a risk to global and EM risk assets. Within a global equity portfolio, investors should overweight the US, and underweight EM and Europe. Feature Global macro has taken a back seat and geopolitics has become the dominant driver of financial markets. Still, we believe geopolitical risks are underappreciated by global financial markets. Will Western Sanctions Halt Russia’s Military Operation? While sanctions have started and will continue to hurt the Russian economy and its financial system, the Kremlin will not halt its military operations in Ukraine for now. The strategic objective of Putin is to bring Ukraine back into its geopolitical and economic orbit. His immediate goal is to unseat the current government in Kyiv and install a pro-Kremlin administration. In fact, having already incurred considerable economic and financial costs, Russia will not pull back its army anytime soon. If anything, Russia’s rhetoric and actions will get more aggressive in the coming weeks. For now, the Kremlin will not agree to anything short of the surrender of Ukraine’s government and its army. In turn, Ukraine authorities and its military intend to continue fighting with the support of arms supplies from the West. As a result, any peace talks will be futile. The situation will thus continue to escalate and the risk premium in global financial markets will rise further. The global political uncertainty index will be rising and, as a rule of thumb, it heralds a lower P/E ratio for global equities (Chart 1). Chart 1Rising Geopolitical Risks = Lower P/E Ratio
Rising Geopolitical Risks = Lower P/E Ratio
Rising Geopolitical Risks = Lower P/E Ratio
The main question is, therefore, how bad could it get? We believe the conflict might take a turn for the worse. If the Russian military fails to achieve its goal to remove the current government in Kyiv, Putin will go all out. Losing this war is not an option for him. The failure of the Kremlin to secure a rapid military victory implies a massive escalation on two fronts: (1) the military actions of the Russian army in Ukraine will intensify and civilian infrastructure and potentially the population at large might be threatened; and (2) Russia will become more aggressive in its threats to the West. If and when Putin perceives that his military operation is failing or his power is threatened at home, he will resort to the extreme actions he has been warning about. Putin will bolster his military threats to Europe and to the US. In such a scenario, global risk assets will tank. Bottom Line: The security situation in Europe will continue to deteriorate, especially if the Russian army fails to secure a rapid military victory. Investors should position their portfolio to account for the fact that things will get worse before they improve. Russian Markets Are Uninvestable Chart 2No Buyers For Russian Bonds
No Buyers For Russian Bonds
No Buyers For Russian Bonds
Russian markets have become uninvestable and will remain so for some time (Chart 2). The elevated odds of further military escalation in Ukraine entails more downside in Russian financial assets. Additional sanctions on the Russian economy cannot be ruled out at this point. These sanctions as well as the capital controls imposed by Russia on both residents and non-residents make Russian financial markets uninvestable. We downgraded Russian stocks to underweight within an EM equity portfolio on December 17, 2021, arguing that geopolitical tensions surrounding Ukraine would escalate. Chart 3 suggests that Russian share prices in USD terms are about to break below their 2008 and 2015 lows. Technically speaking, if this transpires, it will entail considerable downside. Similarly, the ruble versus an equally-weighted basket of the US dollar and euro on a total return basis has formed a technically bearish head-and-shoulders configuration (Chart 4, top panel). Notably, the ruble’s real effective exchange rate based on both CPI and PPI is not as cheap as it was in 1998 and 2015 (Chart 4, bottom panel). Chart 4More Downside In The Ruble
More Downside In The Ruble
More Downside In The Ruble
Chart 3Russian Stocks Are Breaking Below Their 2008 And 2015 Lows
Russian Stocks Are Breaking Below Their 2008 And 2015 Lows
Russian Stocks Are Breaking Below Their 2008 And 2015 Lows
The sanctions have effectively cut off the largest Russian commercial banks1 from the SWIFT electronic system and frozen the central bank of Russia’s (CBR) foreign exchange reserves deposited at foreign institutions. As of June 2021, roughly US$ 377 billion out of US$ 585 billion of Russian foreign exchange reserves were held in Western commercial banks or institutions, most of it in liquid financial securities. Meanwhile, the rest were held either in gold physical holdings (US$ 127 billion) or at Chinese institutions (US$ 80 billion). If all western countries freeze the CRB’s assets held at their banks, Russia’s effective foreign exchange reserves will be down to US$ 207 billion. This assumes the amount of international reserves at western banks has not changed since June 2021. As a result, the ratio of the central bank’s foreign reserves-to-broad money supply (all household and corporate local currency deposits) has dropped from 0.9 to 0.6 (Chart 5). This suggests that the central bank’s available amount of foreign exchange reserves coverage of broad money supply has been reduced dramatically in recent days due to economic and financial sanctions. This and a massive flight of capital out of the country has led the authorities to impose capital controls. Also, the government is compelling domestic exporting firms to sell 80% of their foreign generated revenues. Will the West lift sanctions right after the war in Ukraine ends? We doubt it. In our view, Russia is embracing a long period of economic and financial isolation. Besides, Russia lacks the manufacturing capabilities needed to mitigate the effects of these sanctions. Chart 6 shows that Russia has been investing little outside resource sectors and real estate. At 8-8.5% of GDP, investment in non-resource sectors excluding properties has been too low for too long. Chart 5Russia: FX Reserves' Coverage Of Money Supply
Russia: FX Reserves' Coverage Of Money Supply
Russia: FX Reserves' Coverage Of Money Supply
Chart 6Russia Has Not Been Investing Much
Russia Has Not Been Investing Much
Russia Has Not Been Investing Much
This entails that Russia cannot become self-sufficient in many manufacturing sectors and technology. Trade with China will be the main channel that Russia can secure the manufacturing goods, machinery and technology it requires. Still, this will not allow the Russian economy to avoid a prolonged period of stagflation. Bottom Line: Odds are high that Russian financial markets will remain uninvestable for an extended period. The Russia economy is facing years of stagflation. Central European Financial Markets: Contagion Or An Existential Threat? Chart 7Central European Currencies Will Depreciate
Central European Currencies Will Depreciate
Central European Currencies Will Depreciate
Although Central European countries are not at risk from Russia’s military attack, their financial markets will remain jittery for a while. We are downgrading Polish, Czech and Hungarian equities, currencies and domestic bonds to underweight (Chart 7). The likelihood of strikes on Poland, the Baltic states or any other neighboring NATO member country is very low. Attacking a NATO member would trigger Article V of NATO and force the organization to defend its member. Importantly, we do not think the Kremlin has the appetite for war against NATO. Even though Russia is unlikely to stage an attack on any NATO member, there could still be threats from Moscow and escalation involving central European countries. This will be especially so if Putin fails to secure the change of government in Kyiv in the coming weeks and starts threatening the West due to the latter’s support of Ukraine. As a result, Central European financial markets will continue selling off further in response to this potential escalation. Bottom Line: We are downgrading Central European equities and local currency bonds to underweight within a respective EM universe. We are maintaining the long CZK / short HUF trade. As a new trade, we recommend shorting the Polish zloty versus the US dollar. Investment Recommendations Global share prices will continue selling off. Our US equity capitulation indicator has fallen significantly but is not yet at 2010, 2011, 2015-16 and 2018 levels (Chart 8). It will at least reach this level before the S&P 500 bottoms. Chart 8The S&P 500 Selloff Is Not Over
The S&P 500 Selloff Is Not Over
The S&P 500 Selloff Is Not Over
Our capitulation indicator for EM stocks is not low yet either (Chart 9). Hence, there is more downside. Investors should continue to take a defensive stance. Chart 9EM Stocks: Is There A Capitulation Phase Still Ahead?
EM Stocks: Is There A Capitulation Phase Still Ahead?
EM Stocks: Is There A Capitulation Phase Still Ahead?
Chart 10US Stocks Are About To Resume Their Relative Outperformance
US Stocks Are About To Resume Their Relative Outperformance
US Stocks Are About To Resume Their Relative Outperformance
Within a global equity portfolio, investors should overweight the US, and underweight EM and Europe. As US/global bond yields drop due to geopolitical jitters, the US stock market and growth stocks will resume their outperformance, at least for a period of time (Chart 10). Within an EM equity portfolio, we recommend overweighting Brazil, Mexico, Chinese A-shares, Singapore and Korea and underweighting Russia, Central Europe, South Africa, Indonesia, Turkey, Peru, Chinese Investable Stocks, Colombia and Chile. EM currencies and fixed-income markets remain vulnerable as the global risk off move causes the US dollar to spike. Arthur Budaghyan Chief Emerging Markets Strategist arthurb@bcaresearch.com Andrija Vesic Associate Editor andrijav@bcaresearch.com Footnotes 1 Following the invasion of Ukraine on February 26, the US administration added the two largest Russian banks, Sberbank and VTB Bank, to the sanction lists. Both banks combined total assets represent close to 40% of total Russian banking system assets.
Executive Summary Chinese Onshore Stocks Are Less Impacted By External Factors
Upgrading Chinese Onshore Stocks To Neutral
Upgrading Chinese Onshore Stocks To Neutral
We are upgrading Chinese onshore stocks from underweight to neutral relative to global stocks. At the same time, we are closing our tactical trade of long Chinese investable stocks/short global stocks. In the near term, Russia’s armed invasion of Ukraine will spark a further selloff in global risk assets. Volatility in Chinese onshore stock prices will remain high; A-share prices in absolute terms may also drop but should fall by less than their peers in European and emerging markets. On the other hand, Chinese offshore stocks are more vulnerable to geopolitical risks compared with their onshore counterparts. There are tentative signs that home prices may be stabilizing, although demand for housing remains in deep contraction. Chinese policymakers remain vigilant in preventing the property market from overheating and credit creation from overshooting. However, the ongoing Russia/Ukraine incursion has the potential to catalyze a larger stimulus package in China. If the escalating geopolitical crisis threatens the global economy, China’s authorities will likely strengthen policy supports at home to buttress the country’s domestic political, economic and financial conditions. Bottom Line: Chinese onshore stocks will weather the ongoing geopolitical storm better than their offshore and global peers. China’s economy is also less negatively impacted by the Russia/Ukraine hostilities. If the crisis deepens, China’s leadership will likely step up measures to support its economy and ensure stable domestic financial and political dynamics. Feature The conflict between Russia and Ukraine unnerved global financial markets in the past few weeks. Chinese offshore stocks were not insulated from the geopolitical event; the MSCI China Index declined by about 4% in February, in-line with the selloff in global stocks. Chart 1Chinese Onshore Financial Markets Held Up Relatively Well Last Month
Chinese Onshore Financial Markets Held Up Relatively Well Last Month
Chinese Onshore Financial Markets Held Up Relatively Well Last Month
The current global geopolitical environment, however, has turned us a bit more positive on Chinese onshore stocks in relative terms. In the near term, the onshore market should hold up better than its offshore and European counterparts. China’s closed capital market prevents panic capital outflows and its large current account surplus as well as favorable real interest rate differentials help to maintain strength in the RMB (Chart 1). On a cyclical basis, China’s domestic economic fundamentals will continue to drive prices in the A-share market. China’s aggregate economy is less affected by the Russia/Ukraine conflict than Europe. Energy supplies from Russia to China will likely continue and may even accelerate, mitigating the risks of energy shock-induced inflation spikes. As such, we are upgrading Chinese onshore stocks from underweight to neutral in a global portfolio, both in tactical and cyclical time horizons. We remain cautious about the size of Chinese stimulus for the year and, therefore, are neutral in our cyclical view on Chinese onshore stocks relative to global equities. Despite some nascent signs of reflation and an easing of housing policy in a few Chinese cities, aggregate property demand remains weak and overall policy easing in the sector has been marginal. Nonetheless, the situation surrounding Ukraine and the global sanctions against Russia are highly fluid and may provide some ground for Chinese policymakers to ramp up stimulus at home. If the conflict intensifies and derails the European/global economy, Beijing will be more inclined to adopt measures to ensure the stability of its domestic economy, financial markets and political dynamics. Meanwhile, we are closing our long MSCI China/short MSCI global tactical trade. Chinese offshore stocks are more vulnerable to geopolitical tensions and risk-off sentiment among global investors. The Russia Incursion Has Limited Direct Impact On China’s Economy Chinese stocks were not immune last week to the global financial market’s gyrations triggered by Russia’s invasion of Ukraine. While Russia’s attack on its neighbor will create short-term disruptions on the prices of global commodities and China’s A-shares, the cyclical performance of Chinese onshore stocks is tied to the country’s domestic economic fundamentals. The military conflict between Russia and Ukraine should have a limited knock-on effect on China’s business cycle dynamics for the following reasons: Russia and Ukraine together account for less than 3% of Chinese total exports as of 2021, limiting the negative impact from reduced demand in the region on China’s current account balance. Chart 2Ukraine: China’s Major Source Of Agricultural Commodity Supplies
Upgrading Chinese Onshore Stocks To Neutral
Upgrading Chinese Onshore Stocks To Neutral
Russia’s incursion of Ukraine may have consequences on China’s food prices. Ukraine is a major agricultural commodity exporter to China, hence a prolonged military conflict may disrupt agricultural supplies and push up imported food prices in China (Chart 2). In this scenario, we expect that Beijing will provide subsidies to ease pressures on domestic food prices due to supply shocks, rather than tighten monetary policy to reduce demand. China is unlikely to experience shocks linked to possible energy disruptions. Russia is a core exporter of energy to China and supplies of crude oil, natural gas and coal have increased in recent years (Chart 3). We do not expect that Russia’s energy supply to China will be disrupted. Indeed, following the 2014 Russia’s invasion of Crimea, Russia’s crude oil exports to China increased by 40% (Chart 3, top panel). We anticipate that oil prices will fall from the current level in the second half of the year, limiting the upshot from higher oil prices on Chinese inflation. So far, the US and EU have announced tough sanctions on Russia’s non-energy sectors, but they have avoided halting Russia’s energy exports. In the unlikely scenario that energy flows from Russia to Europe are disrupted in any meaningful and long-lasting way, either through European sanctions or a Russian embargo, Russia would probably turn to China to absorb its energy exports. Given that Russia cannot easily replace Europe with any other alternative market, particularly natural gas, China would gain an upper hand in price negotiations with the Russians (Chart 4). Thus, a steady supply of cheap natural gas and other forms of energy would be a net positive for China’s economy. Chart 4Russia Cannot Easily Replace Europe With Any Alternative Consumer Other Than China
Upgrading Chinese Onshore Stocks To Neutral
Upgrading Chinese Onshore Stocks To Neutral
Chart 3Russia's Ties With China On Energy Supplies Will Likely Strengthen
Russia's Ties With China On Energy Supplies Will Likely Strengthen
Russia's Ties With China On Energy Supplies Will Likely Strengthen
Meanwhile, oil’s current price spike may widen the gap in profits between China’s upstream and downstream industrial enterprises (Chart 5). However, the effect from higher oil prices on Chinese downstream manufacturers should be temporary. Our Commodity and Energy Strategists believe that the Russian invasion will prompt increased production from core OPEC producers. These production increases would reduce prices from last week’s $105 per barrel level to $85 per barrel by the second half of 2022 and keep it at that level throughout 2023 (Chart 6). Chart 6Crude Oil Price Risk Premium Will Abate But Not Disappear
Crude Oil Price Risk Premium Will Abate But Not Disappear
Crude Oil Price Risk Premium Will Abate But Not Disappear
Chart 5Rising Oil Prices May Temporarily Widen Profit Gaps Between China's Up- And Downstream Industries
Rising Oil Prices May Temporarily Widen Profit Gaps Between China's Up- And Downstream Industries
Rising Oil Prices May Temporarily Widen Profit Gaps Between China's Up- And Downstream Industries
Bottom Line: Russia’s invasion of Ukraine should have a limited direct impact on China’s domestic economy, inflation and monetary policy. Tentative Signs Of Home Price Stabilization Although the property market is showing some signs of improvement, the aggregate demand for homes remains very sluggish. Recently released housing data in China show some slight progress, as fewer cities reported a month-on-month drop in new home prices in January (Chart 7). The monthly average new home prices among China’s 70 cities were broadly flat last month following four consecutive months of falling prices. Tier 1 and Tier 2 cities had the largest increases in home prices, whereas prices in other regions continued to contract through January, albeit to a lesser degree (Chart 7, bottom panel). The minor improvement in home prices reflects recently implemented measures to help shore up the flagging market. Last month, the PBoC cut the policy rate by 10 bps and reduced the one- and five-year loan prime rates by 10 bps and 5 bps, respectively. Moreover, last week several regional banks lowered the down payments on mortgages for homebuyers. Chart 8...Demand For Housing Remains In Deep Contraction
...Demand For Housing Remains In Deep Contraction
...Demand For Housing Remains In Deep Contraction
Chart 7Although There Are Some Early Signs Of Stabilization In Home Prices...
Although There Are Some Early Signs Of Stabilization In Home Prices...
Although There Are Some Early Signs Of Stabilization In Home Prices...
Nonetheless, the aggregate demand for housing remains weak. China’s 100 largest developers experienced a roughly 40% year-on-year plunge in total sales in January, indicating that recent easing measures failed to revive the downbeat sentiment among homebuyers (Chart 8). Bottom Line: Policymakers will remain vigilant in not inducing another surge in house prices and will continue to target steady home prices. As such, it is too early to upgrade our cyclical view on China’s property market, stimulus and economic recovery. Investment Conclusions We are upgrading Chinese onshore stocks to neutral relative to global equities (both tactically and in the next 6 to 12 months), while closing our tactical trade of long MSCI China/short MSCI global index. Chart 9Chinese Onshore Stock Prices Are Largely Driven By Domestic Rather Than External Factors...
Chinese Onshore Stock Prices Are Largely Driven By Domestic Rather Than External Factors...
Chinese Onshore Stock Prices Are Largely Driven By Domestic Rather Than External Factors...
Given the limited impact of the Russia/Ukraine conflict on China’s domestic economy and the low correlation to the global equity index, Chinese onshore stock prices may also fall in absolute terms in the coming weeks, but not by as much as their offshore and European counterparts (Chart 9). Furthermore, while we maintain a cautious cyclical outlook for China’s stimulus, the ongoing geopolitical crisis has the potential to provide a catalyst for Chinese policymakers to stimulate the domestic economy more forcefully. If the clash evolves into a real risk to the European economy and global financial markets, odds are high that Chinese policymakers will step up stimulus measures to ensure domestic stability. In this scenario, Chinese onshore stocks will likely outperform global equities. In the past, Chinese authorities refrained from a credit overshoot when the business cycle slowed in an orderly manner, but they stimulated substantially following an exogenous shock. For example, China rolled out massive stimulus packages after the 2008 Global Financial and the 2011/12 European credit crises. Beijing did not directly respond to Russia’s 2014 annexation of Crimea with additional monetary support to China’s domestic economy. However, the Chinese authorities started to aggressively stimulate when a collapse in domestic demand coincided with a global manufacturing recession in 2015. Chart 10...Whereas Chinese Offshore Stocks Are More Vulnerable To Global Risk-Off Sentiment
...Whereas Chinese Offshore Stocks Are More Vulnerable To Global Risk-Off Sentiment
...Whereas Chinese Offshore Stocks Are More Vulnerable To Global Risk-Off Sentiment
The PBoC’s outsized liquidity injection in the interbank system last Friday is also a sign that Beijing is willing to accelerate policy easing if the geopolitical backdrop meaningfully worsens. Regarding Chinese investable stocks, we maintain our cyclical underweight stance relative to global equities. In the near term, risk-off sentiment among global investors will undermine the performance of Chinese offshore stocks in both absolute and relative terms (Chart 10). Over a longer time horizon (6 to 12 months), growth stocks will likely underperform value stocks when global stocks recover. Thus, the tech-heavy MSCI China Index is less attractive to investors compared with other emerging and developed market equities that are more value-centric. Jing Sima China Strategist jings@bcaresearch.com Strategic Themes Cyclical Recommendations Tactical Recommendations
Executive Summary Wars Don’t Usually Affect Markets For Long
Monthly Portfolio Update: Keep Calm And Stay Invested
Monthly Portfolio Update: Keep Calm And Stay Invested
We expect the war in Ukraine to stay within its borders, and therefore to have little impact on global growth. Markets will be volatile, but we recommend allocators stay invested – with some moderate hedges in place. The Fed won’t tighten as fast as markets expect, and US long rates will not rise much further this year. So, within fixed-income, we raise government bonds to neutral. Flat rates remove a positive for the Financials equity sector, which we lower to neutral. The oil price will fall back to $85 by the second half, as Saudi and others increase supply. We reduce our recommendation for Canadian equities and the CAD. Recommendation Changes
Monthly Portfolio Update: Keep Calm And Stay Invested
Monthly Portfolio Update: Keep Calm And Stay Invested
Bottom Line: Stay invested in risk assets, but have some hedges. We shift from Financials to the defensive-growth IT sector, raise our weight in UK equities, and suggest long positions in cash, CHF and JPY. Recommended Allocation
Monthly Portfolio Update: Keep Calm And Stay Invested
Monthly Portfolio Update: Keep Calm And Stay Invested
The war in Ukraine is likely to have only a limited impact on markets beyond the short term. As disturbing as the human tragedy is, Russia’s aims are limited to regime change in Kyiv. The European Union and US face restraints on how draconian sanctions against Russia can be, balking (so far at least) at blocking imports of Russian energy to the EU, given how much this would hurt the economy. The risk of the conflict spreading beyond Ukraine’s borders is low, limited perhaps to cyberattacks on Western targets. A Russian attack on a NATO member, such as Poland or one of the Baltic states, is extraordinarily unlikely – though Moldova and Georgia (not NATO members) might be more vulnerable at some point in the future. For more detailed analysis, please read the two reports on the Ukraine situation by our Geopolitical Service that we have made available to all BCA Research subscribers.1 Asset allocators need to look at these events dispassionately. Markets are likely to remain volatile over the coming months, as events in Ukraine unfold. But the lesson of most major conflicts is that they typically do not have a long-lasting impact on asset performance (Chart 1). There is little chance that the Ukraine war will significantly dent global growth. The only exception would be if the oil price were to rise much further to, say, $120 a barrel as some are forecasting. Certainly, in the past, a jump in the oil price has often been associated with recessions – even though the causality is unclear (Chart 2). But BCA’s Energy strategists expect to see an increase in oil supply by Saudi Arabia and Gulf states which will bring Brent crude back to $85 by the second half (from $98 now). Chart 1Wars Don't Usually Affect Markets For Long
Wars Don't Usually Affect Markets For Long
Wars Don't Usually Affect Markets For Long
Chart 2But A Jump In Oil Prices Would
But A Jump In Oil Prices Would
But A Jump In Oil Prices Would
Meanwhile, global growth remains robust, with all major economies expected to continue to grow well above trend this year, supported by robust consumption and capex (Chart 3). And sentiment towards equities has turned very pessimistic since the start of the year, with indicators such the US Association of Individual Investors’ weekly survey at its most bearish level since 2008 (Chart 4). These sort of sentiment levels have typically pointed to a rebound in risk assets. Chart 4Sentiment Is At Rock-Bottom
Sentiment Is At Rock-Bottom
Sentiment Is At Rock-Bottom
Chart 3Economic Growth Still Above Trend
Monthly Portfolio Update: Keep Calm And Stay Invested
Monthly Portfolio Update: Keep Calm And Stay Invested
Our advice now would be to stay invested, but with some moderate safe-haven hedges in place – largely as we have recommended since late last year. We continue to recommend an overweight in cash, but will look to allocate this to risk assets when it becomes clearer how the situation in Ukraine will pan out. The trajectory of markets over the rest of this year still largely comes down to what the Fed and other central banks will do. The hawkish turn by the Fed in December has been the driver of markets in the past two months, with the result that none of the major asset classes have produced positive returns year to-date – only inflation hedges such as commodities and gold (Chart 5). Chart 5Most Asset Classes Are Down Year-To-Date
Monthly Portfolio Update: Keep Calm And Stay Invested
Monthly Portfolio Update: Keep Calm And Stay Invested
The futures market is pricing the Fed to raise rates seven times over the next 12 months, the fastest rate of predicted tightening since the early 2000s (Chart 6). We think that is a little excessive. Inflation, as we have argued previously, is likely to fade over the coming quarters, as the supply response to strong consumer demand for manufactured goods brings down the price of cars, semiconductors, shipping and other major items. The Fed may well start in March with the intention of raising rates by 25bps every meeting, but the slowing of inflation we expect, and the tightening of financial conditions already under way (Chart 7), make it unlikely that it will continue at that pace. And remember that Fed policy will need to be even more hawkish than the market is currently pricing in for it to have an incrementally negative impact on risk assets. Chart 6Market Believes Fed Will Hike Fast
Market Believes Fed Will Hike Fast
Market Believes Fed Will Hike Fast
Chart 7Financial Conditions Have Already Tightened
Financial Conditions Have Already Tightened
Financial Conditions Have Already Tightened
There are certainly risks to this scenario. The forward yield curve is pointing to inversion one year ahead, something which normally presages recession over the following 1-3 years (Chart 8). Higher prices are starting to hurt consumer confidence, though there is a big disparity between the two main US indicators (Chart 9). Chart 8Will Yield Curve Invert Within A Year?
Will Yield Curve Invert Within A Year?
Will Yield Curve Invert Within A Year?
Chart 9Inflation May Be Hurting Consumer Confidence
Inflation May Be Hurting Consumer Confidence
Inflation May Be Hurting Consumer Confidence
What all this boils down to is how high a level of interest rates the economy is able to withstand. The futures markets imply that, in most countries, central banks will raise rates aggressively this year, but then be forced to stop or even cut rates after that because their actions cause an economic slowdown (Table 1). Our view is that the terminal rate is much higher than what is priced by markets and projected by central banks: In the US perhaps 3-4% in nominal terms.2 Even with seven Fed hikes over the next year, the policy rate would therefore remain well below neutral – an environment in which historically equities have outperformed bonds (Chart 10). Table 1Central Banks Will Hike Aggressively – But Then Stop Soon
Monthly Portfolio Update: Keep Calm And Stay Invested
Monthly Portfolio Update: Keep Calm And Stay Invested
Chart 10Even In A Year, Rates Will Be Well Below Neutral
Even In A Year, Rates Will Be Well Below Neutral
Even In A Year, Rates Will Be Well Below Neutral
One final comment: On long-term returns. As a result of the recent moderate equity correction, strong earnings growth, and higher long-term rates, the outlook is somewhat rosier than when we published our most recent report on Return Assumptions in May 2021 – though admittedly forward long-term returns are still likely to be lower than over the past 20 years (Table 2). This is not, then, a time to turn defensive. Table 2Long-Term Return Outlook No Longer Looks So Gloomy
Monthly Portfolio Update: Keep Calm And Stay Invested
Monthly Portfolio Update: Keep Calm And Stay Invested
Fixed Income: In the short-term, government bonds look oversold (Chart 11). With inflation set to peak and the Fed likely to be less hawkish than the market has priced in, we do not see the 10-year US Treasury yield rising more than another 25 basis points or so above its current level this year. Accordingly, we are changing our duration call from underweight to neutral, and raise our recommendation for government bonds within the (still underweight) fixed-income bucket to neutral. For more cautious investors, a slight increase in government bond holdings might be warranted. Within credit, investment-grade bonds still offer little pickup, despite the moderate rise in spreads this year (from 92 to 121 in the US, for example), and so we lower this asset class to underweight. We continue to prefer high-yield bonds, which in the US now imply a jump in the default rate from 1.2% over the past 12 months to 4.5% over the coming year (Chart 12). As long as the economy grows in line with our expectations, that is very unlikely. Chart 11Government Bonds Look Oversold
Government Bonds Look Oversold
Government Bonds Look Oversold
Chart 12Will Defaults Really Jump This Much?
Will Defaults Really Jump This Much?
Will Defaults Really Jump This Much?
Equities: With the economy continuing to grow above-trend, global earnings should remain robust. This will not be a classic year for equity returns, but we expect them to do better than bonds. We continue to prefer US over European equities. As was seen in the aftermath of the invasion of Ukraine, US stocks are more defensive, and European growth will continue to be under threat from higher energy prices (Chart 13). We also move our recommended portfolio a little in the defensive direction by going overweight UK equities (which have a particularly high weight in defensive growth sectors, such as a 13 point overweight in Consumer Staples); we fund this by lowering Canadian equities to underweight, given their close linkage with oil (Chart 14), and the vulnerability of the Canadian housing market to rising rates. We remain underweight EM, but Chinese stocks (which were very oversold in late 2021) have been a relative safe haven as China started to stimulate, and so we continue with our neutral position for now. Chart 13Higher Energy Prices Threaten Europe
Higher Energy Prices Threaten Europe
Higher Energy Prices Threaten Europe
Chart 14Canadian Stocks Move With The Oil Price
Canadian Stocks Move With The Oil Price
Canadian Stocks Move With The Oil Price
Chart 15Financials Not So Attractive If Rates Don't Rise
Financials Not So Attractive If Rates Don't Rise
Financials Not So Attractive If Rates Don't Rise
Our view that long-term rates have limited upside this year makes us more cautious on Financials stocks, which are closely correlated with rates, and so we cut this sector to neutral (Chart 15). A period of slowing growth points towards a preference for defensive growth, and so we raise our recommended weight in the IT sector to overweight from neutral. It is tempting to think of this sector as being composed of ridiculously overvalued speculative internet names, but it is in fact dominated by established hardware and software titans with deep competitive moats (Table 3). While the sector is not exactly cheap, its risk premium over bonds is quite reasonable by historical standards (Chart 16). Table 3Tech Sector Is Not Made Up Of Speculative Stocks
Monthly Portfolio Update: Keep Calm And Stay Invested
Monthly Portfolio Update: Keep Calm And Stay Invested
Chart 16Tech Is Not Unreasonably Priced
Tech Is Not Unreasonably Priced
Tech Is Not Unreasonably Priced
Chart 17Relative Rates Suggest Some Upward Pressure On USD
Relative Rates Suggest Some Upward Pressure On USD
Relative Rates Suggest Some Upward Pressure On USD
Currencies: A neutral position on the US dollar still makes sense. Short-term rates are likely to rise somewhat faster in the US, relative to expectations, than in Europe or Japan (Chart 17). Nevertheless, the USD is expensive, and long-dollar is a consensus trade – reasons why the dollar has risen by less than 1% year-to-date on a trade-weighted basis, despite all the higher rate expectations and geopolitical shocks. Investors looking for hedges against downside risk might look to the Japanese yen, which is particularly cheap, and the Swiss franc. By contrast, the Canadian dollar, like Canadian equities, is closely linked to the oil price and a fallback in the Brent price would be negative; we move underweight. We also raise the CNY to neutral, since it may become a safe haven currency in the current geopolitical situation, though the Chinese authorities won’t let it rise too much since that would slow the economy. Commodities: China’s stimulus remains somewhat halfhearted (Chart 18). Although the credit and fiscal impulse has bottomed, we expect to see it rebound only moderately, with just minor cuts in interest rates and the reserve ratio. This will stabilize Chinese growth, but not cause a boom as in 2020, 2016 or 2013. The rise in industrial commodities prices, therefore, is likely to be limited from here. For oil, as mentioned above, we expect to see Brent crude return to around $85 by the second half, as new supply comes onto the market. Gold has done well, as expected, in the face of a major geopolitical event. But it is expensive by historical standards, vulnerable to a rise in real (as opposed to nominal rates) as inflation eases (Chart 19), and faces cryptocurrencies as a rival. We keep our neutral, as a hedge against the tail-risk of much higher inflation, but would not chase the price at this level. Chart 18China's Stimulus Isn't Enough To Help Metals Prices
China's Stimulus Isn't Enough To Help Metals Prices
China's Stimulus Isn't Enough To Help Metals Prices
Chart 19Rising Real Rates Are Negative For Gold
Rising Real Rates Are Negative For Gold
Rising Real Rates Are Negative For Gold
Garry Evans, Senior Vice President Global Asset Allocation garry@bcaresearch.com Footnotes 1 Please see Geopolitical Strategy Special Reports, “Russia Takes Ukraine: What Next?” dated February 24, 2022, and "From Nixon-Mao To Putin-Xi," dated February 25, 2022. 2 Please see Global Investment Strategy, “The New Neutral” dated January 14, 2022. Recommended Asset Allocation Model Portfolio (USD Terms)
Executive Summary Hopes of an imminent peace deal between Russia and Ukraine will be dashed. The conflict will worsen over the coming days. As was the case during the original Cold War, both sides will eventually forge an understanding that allows the pursuit of mutually beneficial arrangements. A stabilization in geopolitical relations, coupled with fading pandemic headwinds, should keep global growth above trend this year, helping to support corporate earnings. The era of hyperglobalization is over. While central banks will temper their plans to raise rates in the near term, increased spending on defense and energy independence will lead to higher interest rates down the road. How Stocks Fared During The Cuban Missile Crisis
How Stocks Fared During The Cuban Missile Crisis
How Stocks Fared During The Cuban Missile Crisis
Bottom Line: The near-term outlook for risk assets has deteriorated. We are downgrading global equities from overweight to neutral on a tactical 3-month horizon. We continue to expect stocks to outperform bonds on a 12-month horizon as the global economic recovery gains momentum. On an even longer 2-to-5-year horizon, equities are likely to struggle as interest rates rise more than expected. Dear Client, Given the rapidly evolving situation in Ukraine, we are sending you our thoughts earlier than normal this week. We will continue to update you as events warrant it. Best regards, Peter Berezin Chief Global Strategist False Dawn In the lead-up to the invasion, Vladimir Putin assumed that Ukrainian forces would fold just as quickly as US-backed Afghan forces did last summer. He also presumed that the rest of the world would reluctantly accept Russia’s takeover of Ukraine. Both assumptions appear to have been proven wrong. Even if Putin succeeds in installing a puppet government in Kyiv, a protracted insurgency is sure to follow. In the initial days of the invasion, Russian troops generally tried to avoid harming civilians, partly in the hope that Ukrainians would see the Russian military as liberators. Now that this hope has been dashed, a more brutal offensive could unfold. This would trigger even more sanctions, leading to a wider gulf between Russia and the West. It is highly doubtful that sanctions will dissuade Putin from trying to subdue Ukraine. Putin made a name for himself by staging a successful invasion of Chechnya in 1999, just three years after the Yeltsin government had suffered a major defeat there. To withdraw from Ukraine now, without having fomented a regime change in Kyiv, would be a humiliating outcome for him. In this light, BCA’s geopolitical team, led by Matt Gertken, has argued that ongoing peace talks taking place on the border of Ukraine and Belarus are unlikely to amount to much. The situation will get worse before it gets better. Market Implications It always feels a bit crass writing about finance during times like this, but as investment strategists, it is our job to do so. With that in mind, we would make the following observations: Global equities are likely to suffer another leg down in the near term as hopes of an imminent peace deal fizzle. Consequently, we are downgrading our view on global stocks from overweight to neutral on a 3-month horizon. Nimble investors with a low risk tolerance should consider going underweight equities. We are shifting our stance on US stocks from underweight to neutral on a 3-month horizon. Europe could face significant pressures from near-term disruptions to Russian gas supplies. It does not make much sense for Russia to export gas if it is effectively barred from accessing the proceeds of its sales. Central and Eastern Europe will be particularly hard hit (Chart 1). Chart 1Central and Eastern Europe Would Suffer The Most From A Russian Energy Blockade
A New Cold War
A New Cold War
For now, we are maintaining an overweight to stocks on a 12-month horizon. While it will take a month or two, both sides will ultimately forge an understanding whereby Russia and the West continue to publicly bad-mouth each other while still pursuing mutually beneficial arrangements. Remember that during the Cold War, the Soviet Union continued to sell oil to the West. Even the Cuban Missile Crisis had only a fleeting impact on equities (Chart 2). Chart 2How Stocks Fared During The Cuban Missile Crisis
How Stocks Fared During The Cuban Missile Crisis
How Stocks Fared During The Cuban Missile Crisis
Chart 3European Fiscal Policy Will Remain Structurally Looser Over The Coming Years
A New Cold War
A New Cold War
Assuming that any reduction in Russian energy exports is temporary, oil prices will eventually recede. BCA’s commodities team, led by Bob Ryan, expects Brent to settle to $88/bbl by the end of 2022 (down from the current spot price of $101/bbl and close to the forward price of $87/bbl). Like oil, gold prices have upside in the near term but should edge lower once the dust settles. Global growth should remain solidly above trend in 2022 as pandemic-related headwinds fade and fiscal policy turns more expansionary. Even before the Ukraine invasion, the structural primary budget deficit in Europe was set to swing from a small surplus to a deficit (Chart 3). The emerging new world order will lead to sizable additional military spending, as well as increased outlays towards achieving energy independence (new LNG terminals, more investment in renewables, and perhaps even some steps towards restarting nuclear power programs). China will also step up credit easing and fiscal stimulus. This will not only benefit the Chinese economy, but it will also provide some much-needed support to European exporters (Chart 4). While credit spreads are apt to widen further in the near term, corporate bonds should benefit from stronger growth later this year. US high-yield bonds are pricing in a jump in the default rate from 1.3% over the past 12 months to 4.2% over the coming year, which seems somewhat excessive (Chart 5). Chart 4Chinese Policy Will Be A Tailwind For Growth
Chinese Policy Will Be A Tailwind For Growth
Chinese Policy Will Be A Tailwind For Growth
Chart 5Credit Markets Are Pricing In An Excessive Default Rate
Credit Markets Are Pricing In An Excessive Default Rate
Credit Markets Are Pricing In An Excessive Default Rate
Central banks will temper their plans to raise rates in the near term. Investors and speculators are net short duration at the moment, which could amplify any downward move in bond yields (Chart 6). However, over a multi-year horizon, recent events will lead to both higher inflation and interest rates. Larger budget deficits will sap global savings. The retreat from globalization will also put upward pressure on wages and prices. As defensive currencies, the US dollar and the Japanese yen will strengthen in the near term as the conflict in Ukraine escalates. Looking beyond the next few months, the dollar will weaken. On a purchasing power parity basis, the dollar is amongst the most expensive currencies (Chart 7). For example, relative to the euro, the dollar is 22% overvalued (Chart 8). The US trade deficit has doubled since the start of the pandemic, even as equity inflows have dipped (Chart 9). Speculators are long the greenback, which raises the risk of an eventual reversal in dollar sentiment. Chart 6Short Duration Is A Crowded Trade
Short Duration Is A Crowded Trade
Short Duration Is A Crowded Trade
Chart 7The US Dollar Is Overvalued…
A New Cold War
A New Cold War
Chart 8...Especially Against The Euro
A New Cold War
A New Cold War
The freezing of Russia’s foreign exchange reserves will encourage China to diversify away from US dollars towards hard assets such as land and infrastructure in economies where they are less likely to be seized. It will also encourage the Chinese authorities to bolster domestic demand and permit a further modest appreciation of the RMB since these two steps will reduce the current account surpluses that make foreign exchange accumulation necessary. EM currencies will benefit from this trend. Chart 9The Trade Deficit Is A Headwind For The Dollar
The Trade Deficit Is A Headwind For The Dollar
The Trade Deficit Is A Headwind For The Dollar
In summary, the near-term outlook for risk assets has deteriorated. We are downgrading global equities from overweight to neutral on a tactical 3-month horizon. We continue to expect stocks to outperform bonds on a 12-month horizon as the global economic recovery gains momentum. On an even longer 2-to-5-year horizon, equities are likely to struggle as interest rates rise more than expected. Trade Update: We closed our long Brent oil trade for a gain of 24% last week. Earlier today, we were stopped out of the trade we initiated on September 16, 2021 going long the Russian ruble and the Brazilian real. The BRL leg was up 6.2% at the time of termination while the RUB leg was down 23.1% (based on the Bloomberg RUB/USD Carry Return Index as of 4pm EST today). Peter Berezin Chief Global Strategist peterb@bcaresearch.com View Matrix
A New Cold War
A New Cold War
Special Trade Recommendations
A New Cold War
A New Cold War
Current MacroQuant Model Scores
A New Cold War
A New Cold War