Equities
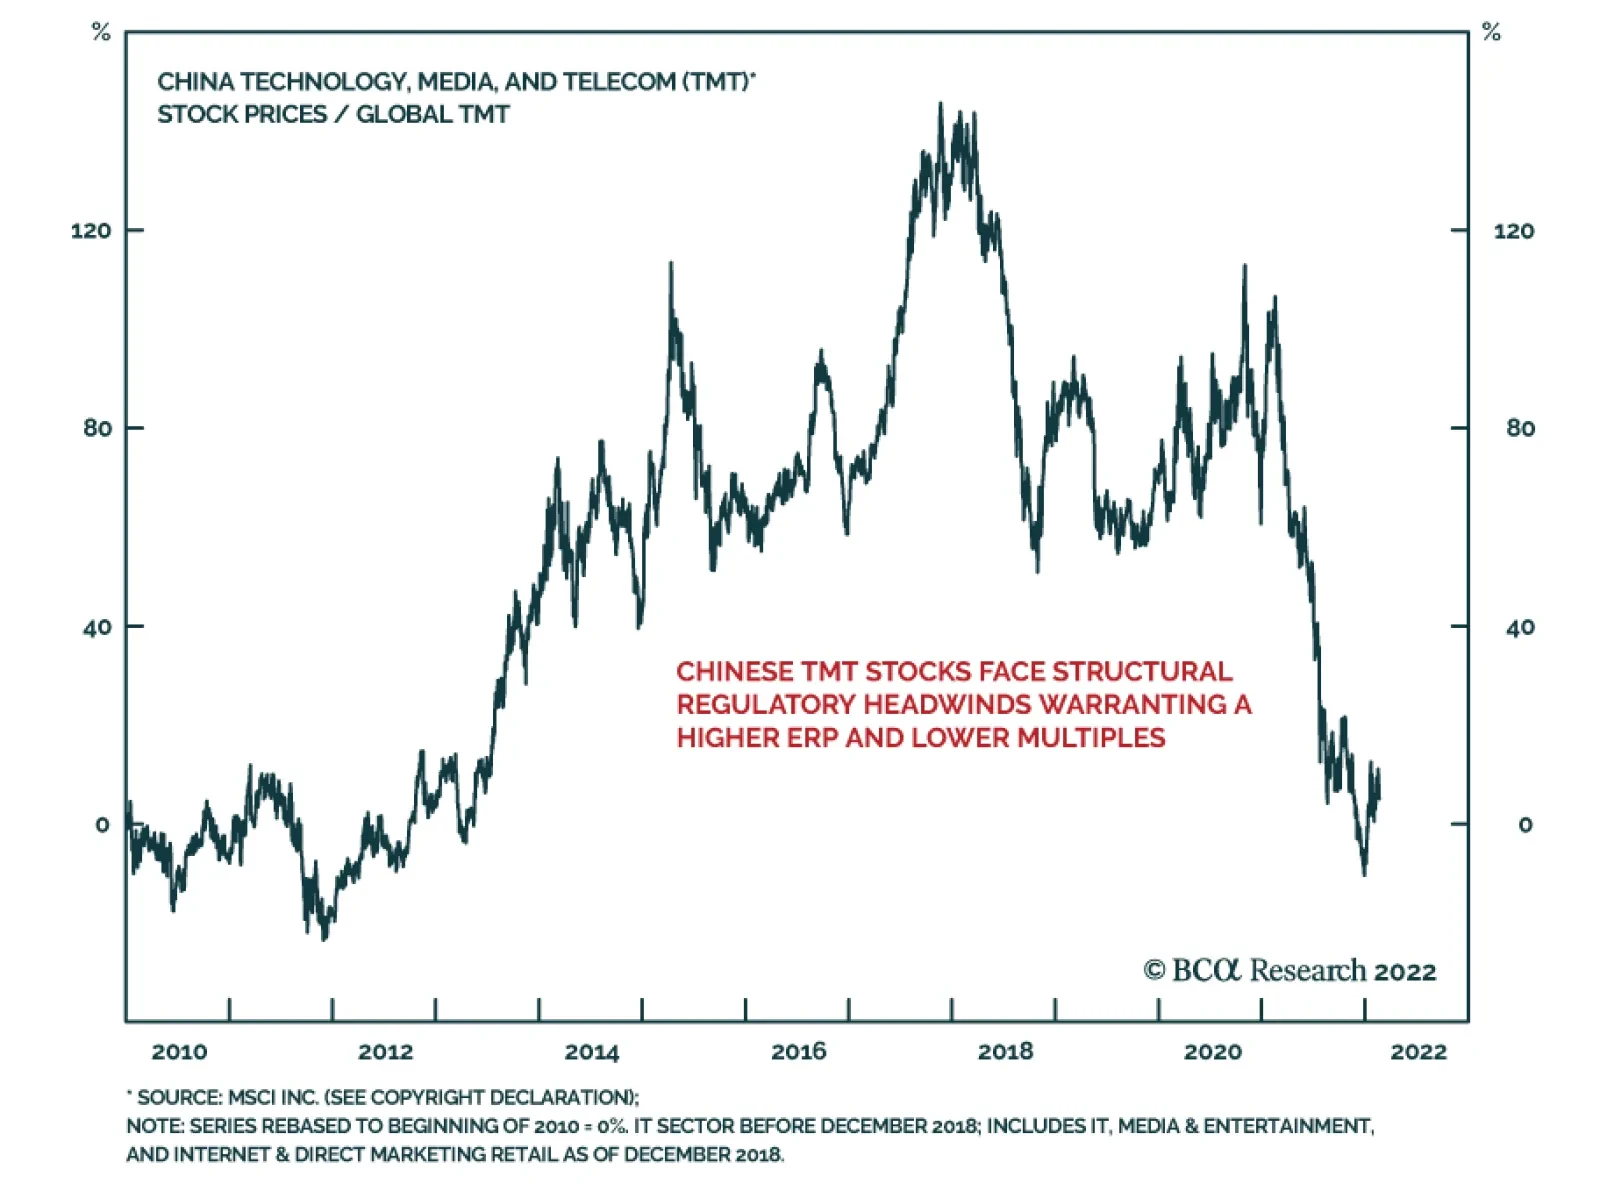
Chinese authorities have asked state-owned firms and banks to closely examine their exposure to Ant Group and report their findings as soon as possible. The move highlights that the regulatory clampdown on Chinese companies operating in the technology, media,…
Even though the Eurozone economy is more exposed to potential negative ramifications from the deterioration in Russia’s relationship with the West, Euro Area equities have been passively outperforming US ones since mid-December. Several factors likely explain…

Executive Summary A Swedish Warning
A Swedish Warning
A Swedish Warning
Stocks are oversold but downside risks persist. The Fed is on the verge of beginning a tightening cycle, which creates a process often linked to deeper and longer equity corrections around the world. Global economic activity is decelerating, as growth transitions away from splurging on consumer goods to a return to trend in the service sector. Equities are more levered to industrial than services activity, which creates a risk window. Ukraine remains another near-term hurdle. Equity risk premia are not elevated enough to compensate for these threats. Despite near-term risks, the equity bull market will recover and Europe stocks will ultimately outperform. Bottom Line: Investors need to continue to hold portfolio hedges as the near-term outlook remains treacherous for equities. Nonetheless, a wholesale portfolio liquidation is unwarranted as we face a mid-cycle slowdown, not a recession. Feature Last week’s pattern of relaxation and renewed tensions in Ukraine is an acute reminder that markets remain fragile in the near-term. Investors must still contend with an imminent monetary tightening cycle in the US. Additionally, a few cracks are emerging on the global growth picture as a transition from spending on goods to services takes place. Under this light, we worry that risk premia remain too low, and that equities are still vulnerable to further near-term pullbacks. The situation is particularly complex for Europe, which is most exposed to the Ukrainian problems and to the global manufacturing cycle. We thus continue to recommend investors exposed to Europe hold protections. Oversold Enough? Many commentators argue that following the January equity sell-off, the mood of investors soured enough to warrant buying equities anew and closing our eyes. Most famously, the AAII Bull/Bear ratio is once again flirting with its 2018 and 2020 lows, two periods that, in hindsight, proved to be selling climaxes (Chart 1). The picture is complex. BCA’s Equity Capitulation Index is indeed becoming oversold (Chart 2). However, its reading is murky. It can either decline further, which would imply greater weaknesses in stocks, or rebound. Our first instinct is to look at the indicator’s behavior at the onset of Fed tightening cycles, which constitute close historical analogues: Chart 2... But Maybe Not Enough
... But Maybe Not Enough
... But Maybe Not Enough
Chart 1Stocks Are Oversold...
Stocks Are Oversold...
Stocks Are Oversold...
In late 2015, when the last Fed tightening cycle began, the Capitulation Index plunged to much lower levels as stocks collapsed. In the background, the global economy was weakened by EM countries hammered by China’s slowdown and balance of payments crises. Around the hiking cycle that begun in June 2004, the Capitulation Index never plunged considerably, but the S&P 500 fell more than 8% between March and August 2004, in a volatile pattern. Back then, both US and global growth was very robust. In 1999, once the Fed resumed hiking rates after the 75bps of cuts following the LTCM debacle, the Capitulation Index and equities were very resilient. This strength persisted until the Nasdaq peaked in March 2000. The S&P 500 formed a complex top between March and August before starting a relentless collapse that September. Following the onset of the 1994-1995 tightening cycle, the Capitulation Index collapsed to much more oversold readings than current ones and equities entered a range-bound volatile episode that lasted until Q1 1995, as the Fed stopped hiking rates. The economy was replete with inflation fears and a mid-cycle slowdown was descending upon the US. The hiking cycle that started in 1988 did not witness significant downside in the Capitulation Index and stocks, but it took place soon after the 1987 crash when equities had become exceptionally oversold. Black Monday itself happened as inflation fear rose as a result of a weak dollar and as the Fed hiked rates through 1987. In 1984, the rate hike cycle was accompanied by a collapse in the Capitulation Index. The tightening in financial conditions caused by the Fed was exacerbated by the surge in the dollar that hurt US profitability and increased EM borrowing costs tremendously. After the 1981 hiking cycle, the Capitulation Index plunged as the US economy entered the second leg of the early 1980s double-dip recession. The latter was an economic crisis prompted by Federal Chairman Paul Volcker’s willingness to put an end to the inflation mentality of the 1970s. These historical experiences highlight one thing: Economic conditions were key to periods when the beginning of a tightening cycle caused a deeper correction in stocks than the one witnessed until now. Economic Clouds Today, the big question shaping the investment world is inflation. BCA expects inflation to peak over the coming months, whether in the US or in Europe. However, this process will take more time. CPI will not crest until after the Fed has begun to hike rates. In the meantime, there are plenty of factors that could easily fan inflation worries and, consequently, a continued upward repricing of the Fed’s interest rate path in the next few weeks. As Arthur Budaghyan highlighted in the most recent Emerging Market Strategy Report, US labor costs are rapidly rising, with the Atlanta Fed Median Wage growth measure up 5.1% annually and the Employment Cost Index (ECI) expanding at a 4.5% annual rate. Of particular worry, this surge in wages does not reflect underlying productivity and unit labor costs, which are up 3.2% annually (Chart 3), their highest rate since 2001, when the Fed funds rate was 4% and 10-year Treasurys yielded 5.4%. Chart 3US Wage-Price Spiral?
US Wage-Price Spiral?
US Wage-Price Spiral?
Elevated unit labor costs are a powerful inducement for inflation and, thus, are likely to continue to fan inflation fears among market participants. Of particular concern today, the rise in unit labor costs is not counterbalanced by a decline in US import prices and foreign deflationary pressures. Inflation fears remain a major risk for the market. As our BCA Monetary Indicator highlights, the liquidity backdrop is not supportive of equities anymore (Chart 4). Moreover, the technical picture is deteriorating, while speculation remains elevated. With investors fretting about the threat of inflation, the danger is that they start to anticipate a greater deterioration in monetary conditions. The problem is not unique to the US. At the global level, 75% of central banks are tightening policy and those that have not yet done so are gearing up to remove monetary accommodation. Adding to inflation fears are signs of a slowdown in the global goods sector. This slowdown reflects a natural transition from the spending binge on goods that took place during the pandemic, which is ebbing, to service spending, which is accelerating (Chart 5). This pattern is particularly evident for US consumers, the largest spenders in the world. Chart 5Transitioning From Goods To Services
Transitioning From Goods To Services
Transitioning From Goods To Services
Chart 4Deteriorating Liquidity Conditions
Deteriorating Liquidity Conditions
Deteriorating Liquidity Conditions
One of the world’s most sensitive economies to the global industrial cycle is already feeling the pinch from this adjustment: Sweden. Swedish economic numbers have been weakening and Swedish assets are particularly soft (Chart 6), which heralds poorly for the global manufacturing sector. This deceleration in goods spending and industrial activity is a problem for equities because stock market profits are more geared toward the evolution of the industrial cycle than the service sector (Chart 7). Chart 6A Swedish Warning
A Swedish Warning
A Swedish Warning
Chart 7Manufacturing, Not Services, Drives Profits
Manufacturing, Not Services, Drives Profits
Manufacturing, Not Services, Drives Profits
Investment Conclusions In this context, it is prudent to maintain hedges to protect stock holdings. It is commonly argued that stocks are expensive, but if one considers the low level of bond yields, these valuations can be justified. Chart 8 challenges this notion. Yes, the earnings yield is still very elevated relative to 30-year Treasury bond yields; however, it is at its lowest in 42 years against core inflation. Why would core inflation be relevant? In a context in which investors are worried about the impact of inflation on both profit margins (higher labor costs) and the direction of policy, they are unlikely to remain unmoved by inflation fears, especially as the perception of higher policy rates may lift rates higher. Moreover, with many investors anxious that the Fed is falling far behind the curve, the marginal market players could easily become the individuals concerned that a catch up by the Fed will lead the economy into a recession. Considering the risks linked to Ukraine, the potentially negative impact on profitability of slowing goods spending, the growing policy uncertainty globally and in the US, and the inversion of many segments of the yield curve, prudence remains appropriate (Chart 9). Chart 8Value Is In The Eye Of The Beholder
Value Is In The Eye Of The Beholder
Value Is In The Eye Of The Beholder
Chart 9Rising Policy Uncertainty
Rising Policy Uncertainty
Rising Policy Uncertainty
Chart 10The Importance Of Manufacturing To Europe
The Importance Of Manufacturing To Europe
The Importance Of Manufacturing To Europe
The problem for European equities is their elevated beta and pro-cyclicality. A pullback in US stocks will automatically drag down European stocks. Moreover, the region’s heavy reliance on manufacturing activity is reflected in the sectoral tilt of European benchmarks. As a result, the performance of European stocks is particularly sensitive to the evolution of the global industrial cycle (Chart 10). Add the fact that European economies are much more exposed to potential energy market disruptions emanating from Ukraine and the recent rebound in Europe’s relative equity performance becomes tenuous at best. Why would these dynamics be temporary and only warrant hedges, not a cyclical underweight in stocks and Europe? First, the inflation fear will recede in the second half of 2022. Our Global Supply Disruption Index has peaked and suggests that inflation surprises will soon ebb. Moreover, a measure of suppliers’ constraints based on the ISM Supplier Delivery Times, Backlog of Orders, Prices Paid, and Inventories is also rolling over (Chart 11). Second, a deepening of the stock market correction will tighten financial conditions and push credit spreads higher. This is a deflationary process that will cause inflation fears to recede and, thus, the pricing of expected Fed rate hikes to lessen. Third, the slowdown in the goods sector is concentrated among consumer goods. Capex will firm up. Capex intentions are elevated in Europe and the US, and global capital goods orders remain robust, despite having decelerated from their extraordinary rebound following the Q1 2020 shutdowns (Chart 12). Moreover, the political and corporate demand to build greater redundancy in global supply chains following the disruptions caused by the Sino-US trade war and COVID-19 will also boost corporate investments for a few more years. This means that many industrial sectors will recover globally and propel industrial equities higher. Chart 11Apex Bottlenecks?
Apex Bottlenecks?
Apex Bottlenecks?
Chart 12Capex Will Stay Strong
Capex Will Stay Strong
Capex Will Stay Strong
Fourth, Matt Gertken, BCA’s geopolitical strategist, continues to see a limited Ukrainian conflict as the most likely outcome of the current tensions. As a result, any dislocation to global stocks and European assets caused by a conflict will be transitory. Finally, the business cycle has further to run. In 1994/95 and in 2015/16, the Fed tightening cycle materialized around the time of a mid-cycle slowdown. The economy recovered and profit firmed up anew, which allowed stocks to rebound. The Fed Funds rate is rising but remains below the neutral rate. Interest rates in Europe also have ample scope to rise before monetary policy becomes tight. Simultaneously, the recovering service sector will continue to support employment and, thus, final demand. Equity bear markets rarely materialize outside of recessions (Chart 13). Chart 13Bear Markets Demand A Recession
Bear Markets Demand A Recession
Bear Markets Demand A Recession
Bottom Line: Global equities are oversold, but the combination of rising inflation, Fed tightening, Ukrainian risks, and a transition from a goods-driven recovery to a service sector-led economy means that stocks risk becoming even more oversold in the near term. European equities are not immune to these threats. While rising rates are a lesser problem for Europe than the US, the developments in Ukraine and a manufacturing transition represent greater hurdles. Ultimately, the difficulties faced by stocks reflect a mid-cycle slowdown taking place alongside a period of policy tightening. It will be, therefore, temporary. Consequently, investors should not abandon stocks, but rather continue to hold protections. Mathieu Savary, Chief European Strategist Mathieu@bcaresearch.com Tactical Recommendations Cyclical Recommendations Structural Recommendations Closed Trades
Executive Summary The ultimate inflation anchor is unit labor costs. If relative price shocks cause employees to demand higher wages from their employers, and if they are granted wage increases above and beyond their productivity advances, inflation will become broad-based and persistent. US unit labor costs have been rising rapidly, which indicates that US inflation is becoming pervasive and entrenched (Chart of the week). The Fed is facing an acute dilemma that it has not encountered in the last 35 years or so: It either needs to slow growth materially to contain inflation or allow inflation to proliferate. The Fed will make a dovish pivot only after financial conditions tighten substantially, i.e., if the S&P 500 falls by 20% or more (from its peak) and credit spreads widen much more from the current levels. Rapid Rises In Unit Labor Costs Entail High Inflation
Rapid Rises In Unit Labor Costs Entail High Inflation
Rapid Rises In Unit Labor Costs Entail High Inflation
Bottom Line: The Fed and equity markets are on a collision course: The Fed will not make a dovish pivot until markets sell off and markets cannot rally unless the Fed backs off. Feature In a report we published a year ago titled Riding A Tiger, we stated that “the enormous size of US stimulus and overflow of liquidity is creating a thrill akin to riding a tiger… Riding a tiger is fun. The hitch is that no one can safely get off a tiger. Similarly, US authorities are currently enjoying the exuberance from stimulus, but they will not be able to safely and smoothly dismount.” We also contended that “in any system where an explosive money/credit boom persists, the outcome will be one or a combination of the following: inflation, asset bubbles or capital misallocation… Odds are that the US will experience asset bubbles and inflation in the real economy.” Riding a tiger was indeed fun but now it is time for US policymakers to dismount. Yet, exiting the era of super easy monetary and fiscal policies will not be without costs and considerable financial market turbulence. Are the Fed and financial markets heading into a collision in the fog of inflation? Transitory Versus Persistent Inflation Chart 1US Inflation Is Broad Based, As Evidenced By Median And Trimmed-Mean CPIs
US Inflation Is Broad Based, As Evidenced By Median And Trimmed-Mean CPIs
US Inflation Is Broad Based, As Evidenced By Median And Trimmed-Mean CPIs
US inflation has become broad-based.1 Not only is core CPI surging but also trimmed-mean, median and sticky core consumer price inflation have risen substantially (Chart 1). Median and trimmed-mean price indexes would not be rocketing if inflation was limited to select goods or services. Particularly, the aforementioned measures exclude components with extreme price changes. What might have started as a narrow-based relative price shock has evolved into broad-based genuine inflation. The key to the transition from one-off inflation spikes to persistent genuine inflation is wages, more specifically unit labor costs. Unit labor cost are calculated as nominal wages divided by productivity (the latter is output per hour per employee). As long as unit labor costs are not rising considerably, sharp price increases in several types of goods do not entail genuine inflation and central banks should not tighten aggressively. However, when unit labor costs are escalating, odds are that higher inflation could become entrenched and persistent. The importance of wages stems from the fact that labor compensation makes up the largest share of costs for the majority of industries. Consequently, rising unit labor costs squeeze profit margins. When this transpires, businesses try to pass on rising costs to customers. Provided that robust wage growth propels consumer demand, companies often succeed in raising their prices. Chart 2US Wages Are Rising Rapidly
US Wages Are Rising Rapidly
US Wages Are Rising Rapidly
In turn, inflation erodes the purchasing power of wages, and employees demand substantial pay raises. When revenues are strong, employers typically accommodate employees’ claims for higher compensation, and a wage-price spiral emerges. These dynamics are presently unfolding in the US. US wage growth has reached multi-decade highs of 4.5-5.5% (Chart 2). Plus, the high and climbing quit rate points to further wage acceleration (Chart 3). As US productivity cannot rise as fast as the current wage growth of 4.5-5.5% (Chart 4), the ratio of wages to productivity (unit labor costs) is escalating. Unit labor costs are rising faster than they have in the past 38-40 years. Historically, an acceleration in unit labor costs has often heralded higher inflation (Chart 5). Chart 3US Wages Will Continue Accelerating
US Wages Will Continue Accelerating
US Wages Will Continue Accelerating
Chart 4Wage Growth Is Outpacing Productivity Gains
Wage Growth Is Outpacing Productivity Gains
Wage Growth Is Outpacing Productivity Gains
Chart 5Rapid Rises In Unit Labor Costs Entail High Inflation
Rapid Rises In Unit Labor Costs Entail High Inflation
Rapid Rises In Unit Labor Costs Entail High Inflation
The only period when US core inflation fell despite rising unit labor costs was during the second half of the 1990s (Chart 5). During this period, EM currency devaluations from China to Mexico and then to Asia unleashed the deflation tsunami in goods prices. US imports prices from Asia collapsed allowing US inflation to drift lower despite rising unit labor costs. The current backdrop is different: US import prices from Asia, including China, are rising (Chart 6). Importantly, US wage growth is presently below headline and core CPI, i.e., real wages are contracting (Chart 7). Provided US employees have experienced a decline in their purchasing power in the past 12 months, they are keen to secure substantial pay raises in the coming months. Chart 6Unlike The Late 1990s, US Import Prices From Asia Are Rising
Unlike The Late 1990s, US Import Prices From Asia Are Rising
Unlike The Late 1990s, US Import Prices From Asia Are Rising
Chart 7US Real Wages Are Shrinking
US Real Wages Are Shrinking
US Real Wages Are Shrinking
Employers facing strong demand cannot afford an employee exodus. Businesses will raise salaries and hike selling prices to preserve their profit margins, thereby giving rise to a wage-price spiral. Bottom Line: The ultimate inflation anchor is unit labor costs. This is why wages, more specifically unit labor costs, are the most important variable to monitor. If relative price shocks lead employees to demand higher wages from their employers, and if they are granted wage increases above and beyond their productivity advances, inflation will become broad-based and persistent. The Fed’s Dilemma When inflation becomes pervasive and entrenched, as it is now in the US, the only way to bring it down is to slow the economy. Unless demand decelerates meaningfully, US inflation will not go away because it has already spilled over into consumer and business expectations. Even though US headline and core CPI will likely drop in the coming months, core inflation will remain well above the Fed’s target of 2% (Chart 1 above). To maintain its credibility, the Fed should hike rates continually despite the potential rollover in headline and core CPI measures. Chart 8High Probability Of US Core Inflation Exceeding 4% In The Next 12 Months
High Probability Of US Core Inflation Exceeding 4% In The Next 12 Months
High Probability Of US Core Inflation Exceeding 4% In The Next 12 Months
My colleague, Jonathan Laberge, Managing Editor of the Bank Credit Analyst, has quantitatively estimated that there is a almost 100% probability that in next 12 months core PCE inflation will be above 3%, and a 70% probability that it will be above 4% (Chart 8). All this means that if the Federal Reserve is serious about bringing core inflation closer to 2%, it will have to slow down the economy meaningfully. In short, the Fed cannot both achieve decent growth and bring inflation down to its 2% target in the next 1-2 years. The Fed seemed omnipotent over the past 35 years because inflation was falling or was very low. That allowed US monetary authorities during financial crises/deflationary shocks to cut rates aggressively and flood the system with liquidity. That playbook worked well in a disinflation context and the US central bank has prevented protracted debt deflation. When inflation – rather than deflation – is the problem, authorities can do little without slowing growth. In short, an inflation redux has made US policymakers’ jobs much more difficult. If the Fed tightens too much, the economy will slump. If policymakers drag their feet and do not raise interest rates rapidly and significantly, inflation will hover well above its target and inflation expectations will escalate with negative ramifications for the economy (more on this below). Bottom Line: The Fed is facing an acute dilemma. The Fed will not publicly acknowledge it, but financial markets are gradually waking up to the new reality that the era of an omnipotent Fed might be over, at least for a period of time. Why Not Allow Inflation To Proliferate? Why should authorities tighten policy and slow growth to reduce inflation? Why can’t the US operate with inflation in a range of 3.5-5%? First, there is no guarantee that core inflation will stabilize at 3.5-5% and not rise further. When higher consumer and business inflation expectations set in, they are not easily dislodged. Second, persistent inflation can damage growth itself. High price volatility increases business uncertainty as producers cannot properly plan their costs and selling prices. Higher uncertainty leads companies to abandon expansion projects and new investments. Consequently, economic growth, employment and ultimately productivity suffer. Lower productivity growth creates fertile ground for inflation to thrive. This can lead to stagflation whereby growth slows but inflation remains high. Finally, from a political perspective, inflation can be more damaging to a government’s popularity than modestly high unemployment. For example, if the unemployment rate is at 6-7%, there would be some unhappy voters, but the majority of the population would be employed and their real purchasing power would be rising. Hence, the majority of voters might be content about the incumbent government’s policies. In an inflation scenario, however, everyone would be unhappy because inflation erodes the purchasing power of household income and wealth. The point is that moderately high unemployment affects a few families who do not have jobs while inflation affects everyone. US politicians and policymakers have forgotten the perils of inflation because rapidly rising prices have not been a problem for decades. Therefore, they have erred on the side of helicopter money assuming that deflationary pressures and higher unemployment are worse than inflation. They have forgotten that inflation is not only worse for the wider population but that it could cause growth to slump resulting in stagflation: a combination of high inflation and high unemployment. Inflation has already become a political problem in the US. With income growth lagging behind inflation, household purchasing power has declined, which has fueled dissatisfaction with the current government. Biden’s popularity has tanked in the past nine months along with the rise of inflation. If inflation is not quelled by this fall, chances are that the Democrats will lose Congress to the Republicans in the midterm elections. Further, if high inflation persists in the next two years, odds of a Republican candidate winning the 2024 presidential elections will be considerable. Recognizing this, the Biden administration will not oppose the Fed’s hawkish policy for now. While we are sympathetic to the view that the Fed will ultimately not raise rates too aggressively, they have no reason not to hike and cannot afford to appear dovish at the current juncture. Even as headline and core inflation measures start falling (which is very likely in the months ahead), the Fed has no excuse to turn dovish. The rationale is that the US core inflation rate, while dropping from 5.5-6%, will still be well above the central bank’s target of 2%. In our opinion, the Fed will make a dovish pivot only after financial conditions tighten substantially, i.e., if the S&P 500 falls by 20% or more (from its peak) and credit spreads widen much more from current levels. Bottom Line: Until panic selling occurs in the equity and credit markets or the economy is materially weaker, the Fed will hike interest rates at every meeting and will start quantitative tightening soon. Thus, US bond yields and the US dollar have more upside for the time being. Overall, the Fed and equity markets are on a collision course: the Fed will not make a dovish pivot until markets sell off and markets cannot rally unless the Fed backs off. Implications For Financial Markets Chart 9Second Half Of The 1960s: The S&P 500 And US Bond Yields Became Negatively Correlated
Second Half Of The 1960s: The S&P 500 And US Bond Yields Became Negatively Correlated
Second Half Of The 1960s: The S&P 500 And US Bond Yields Became Negatively Correlated
As long as the Fed maintains its hawkish bias (which is very likely in the coming months), US bond yields will rise and/or the yield curve will flatten, the greenback will be firm, and stocks will struggle. The current environment will be more reminiscent of what occurred in the late 1960s than any other period of the past 40 years. In the second half of the 1960s, when US core CPI spiked, US share prices became negatively correlated with US bond yields (Chart 9). We discussed this topic at great length in a report from a year ago. Hawkish monetary policy amid the inflation overshoot means that the Fed appears to be credible, and this stance is positive for the US dollar. As soon as the Fed makes a dovish pivot however, the US dollar will tank. The basis is that by turning dovish earlier than warranted, odds are that inflation would remain well above its target, i.e., the Fed would fall behind the inflation curve. When a central bank is behind the inflation curve, the currency depreciates. Our US Equity Capitulation Indicator has fallen quite a bit but has not yet reached its 2018, 2016, 2011 and 2010 lows (Chart 10). We believe the macro backdrop is poor enough to justify a pullback on par with those selloffs (17-20% from the peak). In such an environment, EM stocks will outperform DM only if the US dollar weakens (Chart 11). Chart 10More Downside In The S&P 500?
More Downside in The S&P 500?
More Downside in The S&P 500?
Chart 11EM Relative Equity Performance Moves With The US Dollar
EM Relative Equity Performance Moves With The US Dollar
EM Relative Equity Performance Moves With The US Dollar
Chart 12Will The Current Episode Play Out Like Q4 2018?
Will The Current Episode Play Out Like Q4 2018?
Will The Current Episode Play Out Like Q4 2018?
Alternatively, we might be witnessing a replay of Q4 2018 when the S&P 500 sold off hard led by tech stocks, but having underperformed earlier that year EM outperformed (Chart 12). While such a scenario is quite possible, we need to downgrade our view on the US dollar in order to upgrade EM stocks from underweight. We are not ready to do so because we believe the Fed’s hawkish bias will for now support the greenback. On the whole, we continue to recommend underweight allocations to EM equities and credit markets within their respective global portfolios. Absolute-return investors should stay cautious on EM risk assets. Arthur Budaghyan Chief Emerging Markets Strategist arthurb@bcaresearch.com Footnotes 1 Please note this is the view of Emerging Markets Strategy team and does not reflect the view of other BCA services. Equities Recommendations Currencies, Credit And Fixed-Income Recommendations
Executive Summary Russian Invasion Scenarios And Likely Equity Impact
Ukraine Crisis Decision Tree
Ukraine Crisis Decision Tree
The Ukraine crisis is escalating as predicted. We maintain our odds: 65% limited incursion, 10% full-scale invasion, 25% diplomatic de-escalation. Russia says it will take “military-technical” measures as its demands remain unmet, while the US says an invasion is imminent. Fighting has picked up in the Donbas region. Our Ukraine decision tree highlights that the key to a last-minute diplomatic resolution is a western renunciation of defense cooperation with Ukraine after a verified Russian troop withdrawal. The opposite is occurring as we go to press. Stay long gold, defensives over cyclicals, and large caps over small caps. Stay long cyber security stocks and aerospace/defense stocks relative to the broad market. Trade Recommendation Inception Date Return LONG GOLD (STRATEGIC) 2019-12-06 27.6% Bottom Line: Our 75% subjective odds of a partial Russian re-invasion of Ukraine appear to be materializing. At the same time, we are not as optimistic about an imminent solution to the US-Iran nuclear problem. A near-term energy price spike is negative for global growth so we recommend sticking with our defensive tactical trades. Feature Chart 1Ukraine: Don't Be Complacent
Ukraine: Don't Be Complacent
Ukraine: Don't Be Complacent
Fears about a heightened war in Ukraine fell back briefly this week before redoubling. Russian President Vladimir Putin showed a willingness to pursue diplomacy but then western officials refuted Russian claims that it was reducing troops around Ukraine. US President Biden said Russia is highly likely to invade Ukraine in the next few days. The Russian foreign ministry sent a letter reiterating Russia’s earlier threat that it will take unspecified “military-technical” actions given that its chief demands have not been met by the United States. A worsening security outlook as we go to press will push the dollar up against the euro, the euro up against the ruble, will lead to global equities falling (with US not falling as much as ex-US), and global bond yields falling (Chart 1). To assess the situation we need to weigh the signs of escalation against those of de-escalation. What were the signs of de-escalation? First, the Russian Defense Ministry claimed it is reducing troop levels near Ukraine, although NATO and the western powers have not verified any drawdown. An unspecified number of troops were said to return to their barracks in the Western and Southern Military Regions, according to Russian Defense Ministry spokesman General Igor Konashenkov. A video showed military units and hardware pulling back from Crimea. Officials claimed all troops would leave Belarus after military drills ended on February 20.1 Second, the Kremlin signaled that diplomacy has not been exhausted. In a video released to the public, Putin met with Foreign Minister Sergei Lavrov. He asked whether there was still a chance “to reach an agreement with our partners on key issues that cause our concern?” Lavrov replied, “there is always a chance.” Putin replied, “Okay.” Then, after speaking with German Chancellor Olaf Scholz in Moscow, Putin said: "We are ready to work further together. We are ready to go down the negotiations track.”2 Third, the Ukrainians are supposedly restarting efforts to implement the 2015 Russia-imposed ceasefire, under pressure from Germany and France. Ukraine’s ruling party is expected to introduce three bills to the Rada (parliament) that would result in implementing the terms of the Russian-imposed 2015 ceasefire, the so-called Minsk II Protocols. Ukraine is supposed to change its constitution to adopt a more federal system that grants autonomy to the two Russian separatist regions in the Donbas, Donetsk and Luhansk. Ukraine is also supposed to hold elections.3 The caveats to these three points are already clear: The US said Russia actually added 7,000 troops to the buildup on the Ukrainian border. Without Russia’s reducing troops, the US and its allies cannot offer major concessions. The US cannot allow itself to be blackmailed as that would encourage future hostage-taking and blackmail. Putin’s offer of talks is apparently separate from its “military-technical” response to the West’s failure to meet its three core demands on NATO. Russia’s three core demands are no further NATO enlargement, no intermediate-range missiles within threatening range, and withdrawal of NATO forces from eastern Europe to pre-1997 status. Putin reiterated that these three demands are inseparable from any negotiation and that Russia will not engage endlessly without resolution. Yet the West has consistently rejected these demands. Then came the Foreign Ministry statement pledging Russia’s military-technical response. So talks that focus on other issues – like missile defense and military transparency – are a sideshow. Ukraine is reiterating its desire to join NATO and will struggle to implement the Minsk Protocol. The Minsk format is not popular in Ukraine as it grants influence and recognition to the breakaway ethnic Russian regions. Ostensibly President Volodymyr Zelenskiy has sufficient strength in the Rada to change the constitution, given the possibility of assistance from opposition parties that oppose war or favor Russia. But passage or implementation could fail. The Russian Duma has also advised Putin to recognize the Donetsk and Luhansk People’s Republics as independent countries, which Putin is not yet ready to do, but could do if Ukraine balks, and would nullify the Minsk format.4 Of Russia’s three core demands, investors should bear in mind the following points: Ukraine is never going to join NATO. One of the thirty NATO members will veto its membership to prevent war with Russia. Therefore Russia is either making this demand knowing it will fail to justify military action, or driving at something else, such as NATO defense cooperation with Ukraine. Even if NATO membership is practically unrealistic, the US and NATO are providing Ukraine with arms and training, making it a de facto member. The quality and quantity of western defense cooperation is not sufficient to threaten Russia’s military balance so far but it could grow over time and Russia is insisting that it stop. While there is also a broader negotiation over Europe’s entire security system, immediate progress depends on whether the US and its allies stop trying to turn Ukraine into a de facto NATO ally. NATO is not going to sacrifice all of the strategic, territorial, and military-logistical gains it has made since 1997. Especially not when Russia is attempting to achieve such a dramatic pullback by military blackmail. But NATO could reduce some of the most threatening aspects of its stance if Russia reciprocates and there is more military transparency. Similarly, the US and Russia have a track record of negotiating missile defense deals so this kind of agreement is possible over time. The problem, again, hinges on whether agreement can be found over Ukraine. The opposite looks to be the case. Based on the above points, Diagram 1 provides a “Decision Tree” that outlines the various courses of action, our subjective probabilities, and the sum of the conditional probabilities for each final scenario. Diagram 1Russia-Ukraine Decision Tree, February 9, 2022
Ukraine Crisis Decision Tree
Ukraine Crisis Decision Tree
We start with the view that there is a 55% chance that the status quo continues: the West will not rule out Ukraine’s right to join NATO and will not halt defense cooperation. If this is true, then the new round of talks will fail because Russia’s core security interests will not be met. However, we also give a 25% chance to the scenario in which Ukraine is effectively barred from NATO but not defense cooperation. This may be the emerging scenario, given Chancellor Scholz’s point that Ukrainian NATO membership is not on the agenda and the White House’s claim that it will not pressure states to join NATO. Basically, western leaders could provide informal assurances that Ukraine will never join. But then the matter of defense cooperation must be resolved in the next round of talks. Given that the US and others have increased arms transfers to Ukraine in recent months and years (with US providing lethal arms for the first time in 2018), it seems more likely (60/40) that they will continue with arms transfers. After all, if they halt arms, Russia can invade anyway, but Ukraine will have less ability to resist. We allot a 15% chance to a scenario in which the US and its allies halt defense cooperation, even if they officially maintain NATO’s “open door” policy. If the Russians withdraw troops in this scenario, then a lasting reduction of tensions will occur. Again, while allied defense cooperation has been limited so far, it is up to Russia whether it poses a long-term threat. Finally, we give a 5% chance that the US and NATO will bar Ukraine from membership and halt defense cooperation. This path would mark a total capitulation to Russia’s demands. So far the allies have done nothing like this. They have insisted on NATO’s open door policy and have continued to transfer arms. No one should be surprised that tensions are escalating. De-escalation could still conceivably occur if Russia verifiably withdraws troops, if Ukraine moves to implement the Minsk II protocol, and if the US and its allies pledge to halt defense cooperation with Ukraine. The first step is for Russia to reduce troops, since that enables the US and allies to make major concessions when they are not under duress. If the US and NATO guarantee they will halt defense cooperation, given that Ukraine is practically unlikely to join NATO, then Russia may not be as concerned with Ukraine’s implementation of Minsk. As we go to press, none of these conditions are falling into place. The security situation is deteriorating rapidly. Bottom Line: Russia is likely to stage a limited military intervention into Ukraine (75%). The odds of a diplomatic resolution at the last minute are the same (25%). A full-scale invasion of all of Ukraine remains unlikely (10%). Market Reaction To Re-Escalation Chart 2 highlights the global equity market response to the Russian invasion of Crimea in 2014, which should serve as the baseline for assessing the market reaction to any renewed attack today. Stocks fell and moved sideways relative to bonds for several months, cyclicals (except energy) underperformed defensives, small caps briefly rose then collapsed against large caps, and value stocks rose relative to growth stocks. The takeaway was to stay invested over the cyclical time frame, prefer large caps, and prefer value. The difference today is that cyclicals and small caps are already performing worse against defensives and large caps than in 2014, while value has vastly outstripped growth (Chart 3). The implication is that once war breaks out, cyclicals and small caps have less room to fall whereas value has limited near-term upside. Chart 2Market Response To Crimea Invasion, 2014
Market Response To Crimea Invasion, 2014
Market Response To Crimea Invasion, 2014
Chart 3Market Response 2022 Versus 2014
Market Response 2022 Versus 2014
Market Response 2022 Versus 2014
If we look closely at global equity gyrations over the past week – when the Ukraine story moved to front and center – we see that stocks are falling relative to bonds, cyclicals are flat relative to defensives, small caps are rising relative to large caps, and value is flat relative to growth but may have peaked (Chart 4). In the short term the geopolitical dynamic will move markets so we expect cyclicals, small caps, and value to underperform. Commodity prices and the energy sector are initially benefiting from tensions as expected – oil prices and energy equities spiked amid the tensions (Chart 5). But assuming war materializes, Russia will at least cut off natural gas flowing through Ukraine, cutting off about 20% of Europe’s natural gas supply and triggering a bigger price shock. Ultimately, however, this price shock will incentivize production, destroy global demand, and drive energy prices down. Chart 4Global Equities Just Woke Up To Ukraine
Global Equities Just Woke Up To Ukraine
Global Equities Just Woke Up To Ukraine
Chart 5Global Energy Sector Just Woke Up To Ukraine
Global Energy Sector Just Woke Up To Ukraine
Global Energy Sector Just Woke Up To Ukraine
Thus we expect energy price volatility. Russia will keep shipping energy to Europe to finance its military adventures. Europe will be loath to slap sanctions on critical energy supplies, assuming Russia’s military action is limited. The Saudis may or may not increase production to prevent demand destruction – in past Russian invasions they have actually reduced production once prices started to fall. A temporary US-Iran nuclear deal could release Iranian oil to the market, though that is not what we expect in the short run (discussed below). Bottom Line: Tactically investors should favor bonds over stocks, the US dollar and US equities over global currencies and equities (especially European), defensive sectors over cyclicals, large caps over small caps, and growth over value stocks. Is Ukraine Already Priced? Not Yet. Chart 6Crisis Events And Peak-To-Trough Market Drawdown
Ukraine Crisis Decision Tree
Ukraine Crisis Decision Tree
The peak-to-trough equity drawdown – in geopolitical crises that are comparable to a Russian invasion of Ukraine – range from 11%-14% going back to 1931. The following research findings are derived from a list of select events, from the Japanese invasion of China to the German invasion of Poland to lesser invasions, all the way down to Russia’s seizure of Crimea in 2014. We used the S&P 500 as it is the most representative stock index over this long period of time. The fully updated and broader list of geopolitical crises can be found in Appendix 1. Geopolitical crises tend to trigger an average 10% equity decline, smaller than economic crises or major terrorist attacks (Chart 6). The biggest geopolitical shocks to the equity market occur when an event is a truly global event, as opposed to regional shocks. Interestingly Europe-only shocks have seen some of the smallest average drawdowns at around 8% (Chart 7). An expanded Ukraine war would be limited to Europe. The average equity selloff is largest, at 14%, if both the US and its allies are directly involved in the geopolitical event. But the range is 11%-14% regardless of whether the US or its allies are involved (Chart 8). Ukraine is not an official ally, which is one reason the markets will tend to play down a larger war there. However, the market is underrating the fact that Ukraine’s neighbors are NATO members and will have a powerful interest in supporting the Ukrainian militant insurgency, which could lead to unexpected conflicts that involve NATO member-state’s citizens. Chart 7Geopolitical Crises And Markets: Where Is The Crisis?
Ukraine Crisis Decision Tree
Ukraine Crisis Decision Tree
Chart 8Geopolitical Crises And Markets: Who Are The Players?
Ukraine Crisis Decision Tree
Ukraine Crisis Decision Tree
Chart 9Russian Invasion Scenarios And Likely Equity Impact
Ukraine Crisis Decision Tree
Ukraine Crisis Decision Tree
The Russians have as many as 150,000 troops on the border with Ukraine, according to President Biden’s latest speech. The Ukrainian active military numbers 215,000. This ratio is not at all favorable for a full-scale invasion. The Russians are contemplating a limited action directed at teaching Ukraine a lesson or encroaching further onto Ukrainian territory, especially coastal territory. History suggests that a limited incursion will produce a 10% total equity drawdown, whereas a full-scale invasion would produce 13% or more (Chart 9). Still, investors should view 11%-14% as the appropriate range for a geopolitically induced crisis. The S&P has fallen by 9% since its peak on January 3, 2022. But Russia has not invaded yet. If war breaks out, there is more downside, given high uncertainty. Markets could still be surprised by the initial force of any Russian military action. The US will impose sweeping sanctions immediately. The Europeans will modify their sanctions according to Russia’s actions, a key source of uncertainty. If a diplomatic resolution is confirmed – with Russia withdrawing troops and the US and its allies cutting defense cooperation with Ukraine – then the market may continue to rally. However, there are other reasons to be cautious: especially inflation and monetary policy normalization, with the Federal Reserve potentially lifting rates by 50 basis points in March. Bottom Line: Stocks can fall further given that investors do not yet know the magnitude of the Russian military action or the US and European sanctions response. However, a buying opportunity is around the corner once this significant source of global uncertainty is clarified. New Iran Deal Is Neither Guaranteed Nor Durable A short note is necessary on the situation with Iran, another major risk this year, which falls under our third 2022 key view: oil-producing states gain geopolitical leverage. The implication is that the Iran risk will not be resolved quickly or easily. The global economy could suffer a double whammy of energy supply shock from Ukraine and energy supply risk in the Middle East this year. The US-Russia showdown is connected to the US-Iran nuclear negotiation. Russia took Crimea in 2014 in part because it saw an opportunity to exact a price from the United States, which sought Russia’s assistance in negotiating the 2015 nuclear deal with Iran. Today a similar dynamic is playing out, in which Russian diplomats cooperate on Iranian talks while encroaching on Ukraine. The Russians do not have an interest in Iran achieving a deliverable nuclear weapon and thus will offer some limited cooperation to this end. Their pound of flesh is Ukraine. According to media reports, the Iranian negotiations have seen some positive developments over the past month. US interest in rejoining the 2015 deal: The Biden administration has an interest in preventing Iran from reaching “breakout” levels of uranium enrichment and triggering a conflict in the region that would drive up oil prices ahead of the midterm election. It is going to be hard for Biden to remove sanctions in the context of Russian aggression but it is likely he would do it if the Iranians recommit to complying with the 2015 restrictions on their nuclear program. Iranian interest in rejoining the 2015 deal: The Iranians have an interest in convincing President Biden to remove sanctions to improve their economy and reduce the risk of social unrest. They are demanding the removal of all sanctions, not only those levied by President Trump. They also know that rejoining the 2015 deal itself is not so bad, since it starts expiring in 2025 and does not limit their missile production or support of militant proxies in the region. However, note that the Iranian regime has suppressed domestic instability since Trump’s “maximum pressure” sanctions, and the economy is improving on oil prices, so the threat of social unrest is not forcing Iran to accept a deal today. Also note that Iran is making demands that cannot be met: Iranian Foreign Minister Hossein Amirabdollahian is asking the US to provide guarantees that the US will not renege on the deal again, for example if the Republicans return to the White House in 2025. President Biden cannot provide these guarantees. The voting margins are too thin for a “political statement,” promising that the US will not renege on a deal, to pass Congress. While House Speaker Nancy Pelosi might be willing to provide such a statement to the Iranians, Senate Majority Leader Chuck Schumer probably will not – he opposed the originally 2015 deal. Even if Congress gave Iran guarantees, the fact remains that the GOP could win the White House in 2025, so the current, hawkish Iranian leadership cannot be satisfied on this front. Furthermore, even if Biden pulls back sanctions and Iran complies with the 2015 deal for a brief reprieve, Iran’s underlying interest is to obtain a deliverable nuclear weapon to achieve regime survival in the future. Iran faces a clear distinction between Ukraine, which gave up nukes and is now being dismembered (like Libya and Iraq), and North Korea, which now has a deliverable nuclear arsenal and commands respect from the US on the national stage. Moreover if the Republicans take back power in 2025, Iran will want to have achieved or be close to achieving a deliverable nuclear weapon. The Biden administration is weak at home and facing a crisis with Russia, which may present a window of opportunity for Iran to make a dash for the nuclear deterrent. Still, we acknowledge the short-term risk to our pessimistic view: It is possible that Iran will rejoin the deal to gain sanctions relief. In this case about 1-1.2 million barrels per day of Iranian crude will hit the global market. The implication, depending on the size of the energy shock, is that Brent crude prices will fall back to the $80 per barrel average that our Commodity & Energy Strategy expects. We also agree with our Commodity & Energy Strategist that global oil production will pick up in the face of supply risks that threaten to destroy demand. Bottom Line: We doubt Iran will rejoin the 2015 nuclear deal quickly. We expect energy prices to continue spiking in the short term due to Ukraine and any setbacks in the Iran negotiations. Yet we also expect oil producers around the world to increase production, which will sow the seeds for an oil price drop. Our tactical trade recommendations rest on falling oil prices and bond yields in the short run. Investment Takeaways Stay long gold. Stay long global defensive equity sectors over cyclicals. Favor global large caps over small caps. Stay long cyber security stocks and aerospace/defense stocks relative to the broad market. Stay long Japanese industrials relative to German and long yen. Stay long British stocks relative to other developed markets excluding the US, and long GBP-CZK. Favor Latin American equities within emerging markets, namely Mexican stocks and Brazilian financials relative to Indian stocks. Matt Gertken Chief Geopolitical Strategist mattg@bcaresearch.com Footnotes 1 See "Russia Announces Troop Withdrawal," Russia Today, February 15, 2022, rt.com; "Ukraine crisis: Russian claim of troop withdrawal false, says US," BBC, February 17, 2022, bbc.com. 2 David M. Herszenhorn, “On stage at the Kremlin: Putin and Lavrov’s de-escalation dance,” Politico, February 14, 2022, politico.eu. 3 "Scholz says Zelensky promised to submit bills on Donbass to Contact Group," Tass, February 15, 2022, tass.com; "Scholz in Kyiv confirms Germany won’t arm Ukraine, stays mum on Nord Stream 2," February 15, 2022, euromaidanpress.com. 4 "Kiev makes no secret Minsk-2 is not on its agenda — Russian Foreign Ministry," Tass, February 17, 2022, tass.com; Felix Light, "Russian Parliament Backs Plan To Recognize Breakaway Ukrainian Regions," Moscow Times, February 15, 2022, themoscowtimes.com. Appendix 1: Geopolitical Events And Equity Market Impact
Ukraine Crisis Decision Tree
Ukraine Crisis Decision Tree
Strategic Themes Open Tactical Positions (0-6 Months) Open Cyclical Recommendations (6-18 Months)
Executive Summary The recent 26 percent overspend on durable goods constitutes one of the greatest imbalances in economic history. An overspend on goods is corrected by a subsequent underspend; but an underspend on services is not corrected by a subsequent overspend. This unfortunate asymmetry means that the recent overspend on goods at the expense of services makes the economy vulnerable to a downturn. And the risk is exacerbated by central banks’ intentions to hike rates in response to inflation. As the spending on durable goods wanes, so too will monthly core inflation and the 30-year T-bond yield. As the 30-year T-bond rallies, so too will other long-duration bonds, long-duration stocks, long-duration sectors, and long-duration stock markets such as the S&P 500 versus short-duration stock markets such as the FTSE 100. Fractal trading watchlist: We focus on emerging markets, add financials versus industrials, and review tobacco versus cannabis, CAD/SEK, and biotech. If A 26 Percent Overspend On Goods Is Not A Massive Economic Imbalance, Then What Is?
If A 26 Percent Overspend On Goods Is Not A Massive Economic Imbalance, Then What Is?
If A 26 Percent Overspend On Goods Is Not A Massive Economic Imbalance, Then What Is?
Bottom Line: As the spending on durable goods wanes, so too will monthly core inflation and the 30-year T-bond yield. Go overweight long-duration bonds, long-duration stocks, and long-duration stock markets such as the US versus non-US. Feature My colleague Peter Berezin recently wrote that recessions tend to happen when: “1) the build-up of imbalances makes the economy vulnerable to downturn; 2) a catalyst exposes these imbalances; and 3) amplifiers exacerbate the slump.” Peter is spot on. Using this checklist, I would argue that right now: There is a massive imbalance that makes the economy vulnerable to a downturn. Specifically, a 26 percent overspend on durable goods constitutes one of the greatest imbalances in economic history – the 26 percent overspend on durables refers to the US, but other advanced economies have experienced similar binges on goods. The catalyst that exposes this massive imbalance is the realisation that durables are, well, durable. They last a long time. So, if you front-end loaded many of this year’s purchases into last year, then you will not buy them this year. If you overspent by 26 percent in 2021, then the risk is that you symmetrically underspend by 26 percent in 2022. If central banks hike rates into this demand downturn, they will amplify and exacerbate the slump. A Massive Imbalance In Spending Makes The Economy Vulnerable To A Downturn Much of the recent overspend on goods was spending displaced from the underspend on services which became unavailable in the pandemic – such as eating out, going to the movies, and going to in-person doctor’s appointments. Raising the obvious question, can a future underspend on goods be countered by a future overspend on services? The answer is no. The consumption of services is constrained by time, opportunity, and biology. For example, there is a limit on how often you can eat out, go to the movies, or go to the doctor. If you are used to eating out and going to the movies once a week, and the pandemic prevented you from doing so for a year, that does not mean you will eat out and go to the movies an extra 52 times for the 52 times you missed! Rather, you will quickly revert to your previous pattern of going out once a week. This constraint on services spending means that the underspend will not become a symmetric overspend. In fact, the underspend on certain services will persist. This is because we have made some permanent changes to our lifestyles – for example, hybrid office/home working and more online shopping and online medical care. Additionally, a small but significant minority of people have changed their behaviour, shunning services that require close contact with strangers. To repeat the crucial asymmetry, an overspend on goods is corrected by a subsequent underspend; but an underspend on services is not corrected by a subsequent overspend (Chart I-1 and Chart I-2). Therefore, the recent massive overspend on goods at the expense of services makes the economy vulnerable to a downturn, and the risk is exacerbated by central banks’ intentions to hike rates in response to inflation. These hikes will prove to be overkill, because inflation is set to cool of its own accord. Chart I-1An Overspend On Goods Can Be Corrected By A Subsequent Underspend...
An Overspend On Goods Can Be Corrected By A Subsequent Underspend...
An Overspend On Goods Can Be Corrected By A Subsequent Underspend...
Chart I-2...But An Underspend On Services Cannot Be Corrected By A Subsequent Overspend
...But An Underspend On Services Cannot Be Corrected By A Subsequent Overspend
...But An Underspend On Services Cannot Be Corrected By A Subsequent Overspend
Durables Are Driving Inflation, And Inflation Is Driving The 30-Year T-Bond The recent binge on goods really comprises three mini-binges, which peaked in May 2020, January-March 2021, and October 2021. With a couple of months lag, these three mini-binges have caused three mini-waves in core inflation. To see the cause and effect, it is best to examine the evolution of inflation granularly – on a month-on-month basis – which removes the distorting ‘base effects.’ The mini-binges in goods lifted the core monthly inflation rate to an (annualised) 7 percent in July 2020, 10 percent in April-June 2021, and 7 percent in January 2022 (Chart I-3). Chart I-3Spending On Durables Is Driving Inflation
Spending On Durables Is Driving Inflation
Spending On Durables Is Driving Inflation
Worryingly, the sensitivity of inflation has increased in each new mini-binge in goods spending, possibly reflecting more pressure on already-creaking supply chains as well as more secondary effects. Nevertheless, the key driver of the mini-waves in core inflation is the demand for durables, and as that demand wanes, so will core inflation. As monthly core inflation eases back, so too will the 30-year T-bond yield. What about the 30-year T-bond yield? Although it is a long-duration asset, its yield has recently been tracking the short-term contours of core inflation. So, when monthly inflation reached an (annualised) 10 percent last year, the 30-year T-bond yield reached 2.5 percent. At the more recent 7 percent inflation rate, the yield has reached 2.35 percent. It follows that as monthly core inflation eases back, so too will the 30-year T-bond yield (Chart I-4). Chart I-4Inflation Is Driving The 30-Year T-Bond
Inflation Is Driving The 30-Year T-Bond
Inflation Is Driving The 30-Year T-Bond
Get The 30-Year T-Bond Right, And You’ll Get Most Things Right For the past year, the story of stocks has been the story of bonds. Or to be more precise, the story of long-duration stocks has been the story of the 30-year T-bond. Through this period, the worry du jour has changed – from the Omicron mutation of SARS-CoV-2 to an Evergrande default to Facebook subscriber losses and now to Russia/Ukraine tensions. Yet the overarching story through all of this is that the long-duration Nasdaq index has tracked the 30-year T-bond price one-for-one (Chart I-5). And the connection between S&P 500 and the 30-year T-bond price is almost as good (Chart I-6). Chart I-5Get The 30-Year T-Bond Right, And You'll Get The Nasdaq Right
Get The 30-Year T-Bond Right, And You'll Get The Nasdaq Right
Get The 30-Year T-Bond Right, And You'll Get The Nasdaq Right
Chart I-6Get The 30-Year T-Bond Right, And You'll Get The S&P 500 Right
Get The 30-Year T-Bond Right, And You'll Get The S&P 500 Right
Get The 30-Year T-Bond Right, And You'll Get The S&P 500 Right
The tight short-term connection between long-duration stocks and the 30-year T-bond makes perfect sense. The cashflows of any investment can be simplified into a ‘lump-sum’ payment in the future, and the ‘present value’ of this payment will move in line with the present value of an equal-duration bond. So, all else being equal, a long-duration stock will move one-for-one in line with a long-duration bond. The story of long-duration stocks has been the story of the 30-year T-bond. ‘Value’ stocks and non-US stock markets which are over-weighted to value have a shorter-duration. Therefore, they have a much weaker connection with the 30-year T-bond. It follows that if you get the 30-year T-bond right, you’ll get most things right: The performance of other long-duration bonds (Chart I-7). The performance of long-duration growth stocks (Chart I-8). The performance of ‘growth’ versus ‘value’ (Chart I-9). The performance of growth-heavy stock markets like the S&P 500 versus value-heavy stock markets like the FTSE100 (Chart I-10). Of course, the corollary is that if you get the 30-year T-bond wrong, you’ll get most things wrong. Observe that the 1-year charts of long-duration bonds, growth stocks, growth versus value, and S&P 500 versus FTSE100 are indistinguishable. Proving once again that investment is complex, but it is not complicated! Chart I-7Get The 30-Year T-Bond Right, And You'll Get The 30-Year German Bund Right
Get The 30-Year T-Bond Right, And You'll Get The 30-Year German Bund Right
Get The 30-Year T-Bond Right, And You'll Get The 30-Year German Bund Right
Chart I-8Get The 30-Year T-Bond Right, And You'll Get Growth Stocks Right
Get The 30-Year T-Bond Right, And You'll Get Growth Stocks Right
Get The 30-Year T-Bond Right, And You'll Get Growth Stocks Right
Chart I-9Get The 30-Year T-Bond Right, And You'll Get Growth Versus Value Right
Get The 30-Year T-Bond Right, And You'll Get Growth Versus Value Right
Get The 30-Year T-Bond Right, And You'll Get Growth Versus Value Right
Chart I-10Get The 30-Year T-Bond Right, And You'll Get S&P 500 Versus FTSE100 Right
Get The 30-Year T-Bond Right, And You'll Get S&P 500 Versus FTSE100 Right
Get The 30-Year T-Bond Right, And You'll Get S&P 500 Versus FTSE100 Right
Our expectation is that as the spending on durable goods wanes, so too will monthly core inflation and the 30-year T-bond yield. Go overweight long-duration bonds, long-duration stocks, long-duration sectors, and long-duration stock markets such as the US versus non-US. Fractal Trading Watchlist This week we focus on emerging markets, add financials versus industrials, and review tobacco versus cannabis, CAD/SEK, and biotech. Emerging markets (EM) have been a big underperformer through the past year, but it may be time to dip in again, at least relative to value-heavy developed market (DM) indexes. Specifically, MSCI Emerging Markets versus MSCI UK has reached the point of fractal fragility that signalled previous major turning-points in 2014, 2018, and 2020 (Chart I-11). Accordingly, this week’s recommended trade is to go long MSCI EM versus UK (dollar indexes), setting the profit-target and symmetrical stop-loss at 10 percent. Chart I-11Time To Dip Into EM Again, Selectively
Time To Dip Into EM Again, Selectively
Time To Dip Into EM Again, Selectively
Financials Versus Industrials Is Approaching A Turning-Point
Financials Versus Industrials Is Approaching A Turning-Point
Financials Versus Industrials Is Approaching A Turning-Point
Image
CAD/SEK At A Top
CAD/SEK At A Top
CAD/SEK At A Top
Awaiting A Major Entry-Point Into Biotech
Awaiting A Major Entry-Point Into Biotech
Awaiting A Major Entry-Point Into Biotech
Dhaval Joshi Chief Strategist dhaval@bcaresearch.com Fractal Trading System
A Massive Economic Imbalance, Staring Us In The Face
A Massive Economic Imbalance, Staring Us In The Face
A Massive Economic Imbalance, Staring Us In The Face
A Massive Economic Imbalance, Staring Us In The Face
6-Month Recommendations Structural Recommendations Closed Fractal Trades Indicators To Watch - Bond Yields Indicators To Watch - Bond Yields - Euro Area
Indicators To Watch - Bond Yields - Euro Area
Indicators To Watch - Bond Yields - Euro Area
Indicators To Watch - Bond Yields - Europe Ex Euro Area
Indicators To Watch - Bond Yields - Europe Ex Euro Area
Indicators To Watch - Bond Yields - Europe Ex Euro Area
Indicators To Watch - Bond Yields - Asia
Indicators To Watch - Bond Yields - Asia
Indicators To Watch - Bond Yields - Asia
Indicators To Watch - Bond Yields - Other Developed
Indicators To Watch - Bond Yields - Other Developed
Indicators To Watch - Bond Yields - Other Developed
Indicators To Watch - Interest Rate Expectations Indicators To Watch - Interest Rate Expectations I
Indicators To Watch - Interest Rate Expectations
Indicators To Watch - Interest Rate Expectations
Image
Indicators To Watch - Interest Rate Expectations III
A Massive Economic Imbalance, Staring Us In The Face
A Massive Economic Imbalance, Staring Us In The Face
Image
Executive Summary Foreign And Domestic Politics Won't Stop The Fed
Foreign And Domestic Politics Won't Stop The Fed
Foreign And Domestic Politics Won't Stop The Fed
Investors woke up to the Ukraine risk this week. It is not yet resolved. Stay defensive. Market reactions to Ukraine suggest investors will favor defensive sectors and growth stocks in the short term, with the notable exception of the energy sector. External risks will not dissuade the Fed from hiking rates in the face of 6% core inflation. Later the Fed might adjust to foreign crises but the stock market faces more downside in the interim. Polarization is reviving ahead of the midterm elections, which will usher in gridlock. Gridlock is disinflationary, reinforcing a tactically defensive market positioning despite our cyclical House View. Bottom Line: Biden’s external risks are not yet subsiding. The Fed will hike rates even in the face of external supply shocks. Stay tactically defensive. Feature Our three key views for the year are: gridlock, executive power, and foreign policy. First, Congress will become gridlocked even prior to the midterm elections. Second, President Biden will have to shift to executive power to achieve policy objectives. Third, Biden’s focus will be forced to engage in foreign policy more than he would prefer due to rising external risks. The Ukraine crisis – covered extensively in our Geopolitical Strategy – is the most pressing external risk but it is not the only one that we think will trouble markets this year. We expect politically induced volatility to persist all year. The cyclical investment view should be driven by the underlying macroeconomic reality. But that macro reality will change if external risks materialize and cause greater supply disruptions or if they alter the US midterm election outlook. We maintain our tactically defensive positioning for now. Mr. Market Wakes Up To Ukraine Risk The reason for the crisis is the historic Russian military buildup on all sides of Ukraine, in the face of US defense cooperation with Ukraine, not the “hysterical” American propaganda over the risk of war. When and if Russian forces withdraw, the crisis will melt away. But for now, Russia’s reported withdrawal of some troops is contradicted by movements of other troops as well as the fact that the Russian navy has effectively blocked off the Black Sea. Investors must judge by capabilities, not intentions, and Russia still has the capability to stage a limited attack at present so investors should maintain a defensive or cautious approach. In this context investors are rightly bidding up the US dollar and bidding down US equities in absolute terms (albeit not relative to European equities). Bond yields have not responded much to the external risk due to the high rate of inflation, which is pushing yields up (Chart 1). If Russia re-invades, stocks and bond yields will fall at least temporarily and the dollar will rise higher. When Russia initially invaded Ukraine eight years ago, in February 2014, the US stock-to-bond ratio moved sideways for several months but cyclicals outperformed defensives. Energy stocks rallied, until the oil crash in summer 2014. Small caps underperformed large caps, yet value outperformed growth stocks (Chart 2). Small caps likely suffered from risk-off sentiment and expectations of a drag on global growth, while value benefited from gently rising interest rates at that time. Chart 1Ukraine Crisis Escalates
Ukraine Crisis Escalates
Ukraine Crisis Escalates
Chart 2Market Response To Crimea Invasion, 2014
Market Response To Crimea Invasion, 2014
Market Response To Crimea Invasion, 2014
Comparing the situation today, the difference is that cyclicals are trailing defensives and small caps are trailing large caps even more than they were in 2014. Yet value stocks have performed far better against growth now than then, in accordance with higher inflation and bond yields (Chart 3). Further escalation of the Ukraine crisis should drive investors to favor defensives, large caps, and growth stocks on a tactical time frame, even though this decision runs against our BCA House View on a cyclical time frame. The past week’s market moves reinforce the 2014 experience in general, with the stock-to-bond ratio faltering and cyclicals falling back (Chart 4). Small caps and value have benefited but these charts suggest that a negative hit to global growth will hurt small caps, while value is overextended relative to growth in the short term. The market only really began to discount the risk of a new war in Europe this past week, specifically on Friday, February 11 and Monday, February 14. Chart 3Market Response 2022 Versus 2014
Market Response 2022 Versus 2014
Market Response 2022 Versus 2014
Chart 4US Equities Just Woke Up To Ukraine
US Equities Just Woke Up To Ukraine
US Equities Just Woke Up To Ukraine
There is not yet a solid diplomatic solution as we go to press on Tuesday, February 15, but some positive signs are fueling a rebound in risk assets. Fade these improvements in risk appetite until Russia makes its decision on whether to use military force and, if so, until Europe makes its decision on whether to impose crippling sanctions. Bottom Line: Tactically stay long growth stocks versus value, but prepare to switch back to overweighting value if the Ukraine crisis abates. The Energy Sector Response To Ukraine So Far Commodity prices and the energy sector are naturally benefitting from rising supply risks. But there is a risk that they will suffer later if a war breaks out and generates a supply shock and energy price shock that weigh on European and global growth. Russia will likely maintain energy production to help pay for its military adventures. The Saudis could increase production to prevent demand destruction. It is also possible that a US-Iran nuclear deal could release Iranian oil to the market. The global economy can handle gradually rising energy prices but maybe not a sharp supply shock. Oil prices are rising on signs of escalating tensions and energy sector equities are generally outperforming the broad market and other cyclical sectors. Domestically oriented small cap energy stocks are rising relative to large caps, suggesting that the market does not believe that global growth will suffer greatly from any conflict. Apparently investors do believe that US energy companies will benefit from shipping more fossil fuels abroad (Chart 5). Bottom Line: Cyclically stay long small cap energy stocks versus their large cap brethren. Chart 5US Energy Sector Just Woke Up To Ukraine
US Energy Sector Just Woke Up To Ukraine
US Energy Sector Just Woke Up To Ukraine
Peak-To-Trough Drawdowns Amid Geopolitical Crises The peak-to-trough equity drawdown amid major geopolitical crises ranges from 11%-15%, depending on the magnitude and nature of the crisis (Chart 6). In this case, the US will not be directly involved in any war in Ukraine, but US NATO allies will be right next door and providing aid to Ukraine. For “limited incursion” scenarios we looked at over a dozen crises, from the Berlin Blockade of 1949 to the Russian invasion of Crimea in 2014. The peak-to-trough drawdown averages 10%. For an unlimited or “full-scale” invasion, we looked at the S&P500 reaction to major invasions at the dawn of World War II as well as significant wars in the twentieth century, down to the US invasion of Iraq and NATO’s intervention in Libya in 2011. The peak-to-trough equity drawdown averaged 13%. Chart 6Range Of US Equity Peak-To-Trough Drawdowns Amid Geopolitical Crisis
Biden, The Fed, And External Risks
Biden, The Fed, And External Risks
Given that the S&P500 has fallen by 8% since its peak on January 3, 2022, investors should be prepared for more downside. Health care stocks and consumer staples are outperforming the broad market this year so far, though they are underperforming energy where the supply squeeze is happening (Chart 7). The magnitude of war and sanctions will determine whether energy ultimately falls in expectation of demand destruction. Bottom Line: It is too soon to buy the dip in the S&P 500. Stay long health stocks relative to the broad market. Chart 7Health Care And Consumer Staples
Health Care And Consumer Staples
Health Care And Consumer Staples
Will The Fed Respond To External Risks? No. Over the past year, we have argued with investors who tried to differentiate the current bout of inflation from the inflation of the 1970s by arguing that there is no energy supply shock. We argued that an energy shock could transpire by pointing to external risks such as Russia and Iran. While the Biden administration will likely prove risk-averse, for fear that higher prices at the pump will weigh on the Democratic Party in the midterm elections, what about the Federal Reserve? During the Arab oil embargo of late 1973, and the Iranian revolution of 1979, the Federal Reserve continued to hike interest rates, responding to domestic inflation and rising bond yields. Foreign supply shocks threatened to push up inflation, so the Fed was not deterred from hiking rates (Chart 8). When the US itself engages in war, the Fed might react differently (Chart 9). Chart 8The Fed Responds to Oil Shocks by Hiking Rates But...
The Fed Responds to Oil Shocks by Hiking Rates But...
The Fed Responds to Oil Shocks by Hiking Rates But...
Chart 9... US At War Could Trigger Looser Monetary Policy
... US At War Could Trigger Looser Monetary Policy
... US At War Could Trigger Looser Monetary Policy
In 1990, the Fed cut the policy rate once after the US entered the Iraq war, then kept rates flat for a few months before cutting more at the end of the year. Bond yields were falling due to recession. In 2001, the Fed was already cutting rates due to the business cycle and the September 11 terrorist attacks reinforced that process. In 2003, the Fed cut rates after the beginning of the Iraq war and did not start hiking rates until mid-2004 when the initial phase of the war ended. The implication is that Fed Chair Alan Greenspan accommodated both the war and the 2004 presidential election. Most external risks will not prevent the Fed from hiking rates, especially during an inflation bout when the nature of the external risk may be an energy supply disruption that pushes up prices. However, while we do not doubt that the Fed could hike by 50bps in March, we doubt that the consensus of 175bps in hikes in 2022 will pan out. The combination of initial hikes, fiscal drag, and foreign growth shocks would temper the Fed’s enthusiasm. Bottom Line: Stocks face more downside risk in this environment. Bipartisanship And The Return Of Gridlock Polarization and partisanship are recovering. The Philadelphia Fed “Partisan Conflict Index” is now only 0.6% below its 2020 peaks as the midterm election approaches (Chart 10). Interestingly, one of our key views from last year – bipartisan reform – is still taking place beneath the surface. Our 2022 view of gridlock has not yet fully set in. Congress is stealthily cooperating on fiscal spending, the US Postal Service, women’s issues, public servants’ stock trading, and an attempt to revise the Electoral Count Act. Congress is also passing a bipartisan bill to make the US more economically competitive with China and impose sanctions against Russia. Chart 10Foreign And Domestic Politics Won't Stop The Fed
Foreign And Domestic Politics Won't Stop The Fed
Foreign And Domestic Politics Won't Stop The Fed
The only area where bipartisanship is not happening is Biden’s “Build Back Better” reconciliation bill, which even lacks sufficient support from moderate Democratic senators due to high inflation. Passage is still possible in a partisan, watered-down, and deficit-neutral form. These developments show that Republican lawmakers are demonstrating some pragmatic governing ability and will use their voting records to make a case in the midterms, while pinning the blame for inflation, crime, immigration, and any foreign crises on Democrats. As such they reinforce the market consensus that Republicans are likely to take back Congress this fall. Thus while last year’s bipartisanship is spilling into the current legislative session, gridlock is rapidly approaching. When investors look to the second half of the year and beyond, they should expect to see legislative cooperation dry up, especially if Republicans only take the House and not the Senate. Bottom Line: Gridlock will freeze fiscal policy, which is non-inflationary or disinflationary for 2022-24. As such the midterm election is not fully priced. Midterm dynamics will support an overweight or at least neutral stance toward defensives and growth stocks. Investment Takeaways Tactically stay long defensives, notably health care, and growth stocks. Cyclically remain invested in the bull market – and stay long energy small caps. The chief risks to these views would be a speedy diplomatic resolution to the Ukraine and Iran conflicts or a dramatic revival of the Democratic Party’s popular support ahead of the midterm election. Diplomacy would remove risks to global growth, whereas a Democratic comeback would boost inflation expectations. Matt Gertken Senior Vice President Chief US Political Strategist mattg@bcaresearch.com Jesse Anak Kuri Associate Editor jesse.kuri@bcaresearch.com Strategic View Open Tactical Positions (0-6 Months) Open Cyclical Recommendations (6-18 Months) Table A2Political Risk Matrix
Biden, The Fed, And External Risks
Biden, The Fed, And External Risks
Table A3US Political Capital Index
Biden, The Fed, And External Risks
Biden, The Fed, And External Risks
Chart A1Presidential Election Model
Biden’s Floor, Republican Cracks
Biden’s Floor, Republican Cracks
Chart A2Senate Election Model
Biden’s Floor, Republican Cracks
Biden’s Floor, Republican Cracks
Table A4APolitical Capital: White House And Congress
Biden, The Fed, And External Risks
Biden, The Fed, And External Risks
Table A4BPolitical Capital: Household And Business Sentiment
Biden, The Fed, And External Risks
Biden, The Fed, And External Risks
Table A4CPolitical Capital: The Economy And Markets
Biden, The Fed, And External Risks
Biden, The Fed, And External Risks
Footnotes
Executive Summary China Needs To Create RMB35 Trillion In Credit In 2022
China Needs To Create RMB35 Trillion In Credit In 2022
China Needs To Create RMB35 Trillion In Credit In 2022
The pace of credit creation in January increased sharply over December. However, the jump was less than meets the eye compared with previous easing cycles and adjusted for seasonality. Our calculation suggests that a minimum of approximately RMB35 trillion of new credit, or a credit impulse that accounts for 29% of this year's nominal GDP, will be needed to stabilize the economy. January’s credit expansion falls short of the RMB35 trillion mark on a six-month annualized rate of change basis. Our model will provide a framework for investors to gauge whether the month-over-month credit expansion data is on track to meet our estimate of the required stimulus. Despite an improvement in January's credit growth from December, it is premature to update Chinese stocks (on- and off-shore) to overweight relative to global equities. Bottom Line: Approximately RMB35 trillion in newly increased credit this year will probably be needed to revive China’s domestic demand. Any stimulus short of this goal would mean that investors should not increase their cyclical asset allocation of Chinese stocks in a global portfolio. Feature January’s credit data for China exceeded the market consensus. The aggregate total social financing (TSF) more than doubled in the first month of 2022 from December last year. However, on a year-over-year basis, the increase in January’s TSF was smaller than in previous easing cycles, such as in 2013, 2016 and 2019. Furthermore, underlying data in the TSF reflects a prolonged weak demand for bank loans from both the corporate and household sectors. While January’s uptick in credit expansion makes us slightly more optimistic about China’s policy support, economic recovery and equity performance in the next 6 to 12 months, we are not yet ready to upgrade our view. An estimated RMB35 trillion in newly increased credit this year will likely be necessary to revive flagging domestic demand. In the absence of seasonally adjusted TSF data in China, our framework will help investors determine whether incoming stimulus is on course to meet this objective. Interpreting January’s Credit Numbers Chart 1A Sharp Increase In Credit Creation In January
A Sharp Increase In Credit Creation In January
A Sharp Increase In Credit Creation In January
January’s credit creation beat the market consensus to reach RMB6.17 trillion, pushed up by a seasonal boost and a frontloading of government bond issuance (Chart 1). However, the composition of the TSF data reflects an extended weakness in business and consumer credit demand. On the plus side, net government bond financing, including local government special purpose bonds, rose to RMB603 billion last month, more than twice the amount from January 2021 (Chart 1, bottom panel). Corporate bond issuance also picked up, reflecting cheaper market rates and more accommodative liquidity conditions (Chart 2). Furthermore, shadow credit (including trust loans, entrust loans and bank acceptance bills) also ticked up in January compared with a year ago. The increase in informal lending sends a tentative signal that policymakers may be willing to ease the regulatory pressure on shadow bank activities (Chart 3). Chart 2Corporate Financing Through Bond Issuance Also Increased
Corporate Financing Through Bond Issuance Also Increased
Corporate Financing Through Bond Issuance Also Increased
Chart 3Shadow Banking Activity Ticked Up For The First Time In A Year
Shadow Banking Activity Ticked Up For The First Time In A Year
Shadow Banking Activity Ticked Up For The First Time In A Year
Meanwhile, several factors suggest that the surge in January’s credit expansion may be less than what it appears to be at first glance. First, credit growth is always abnormally strong in January. Banks typically increase lending at the beginning of a year, seeking to expand their assets rapidly before administrative credit quotas kick in. In recent years loans made during the first month of a year accounted for about 17% - 20% of total bank credit generated for an entire year. Secondly, the credit flow in January, although higher than in January 2021, was weaker than in the first month of previous easing cycles. Credit impulse – measured by the 12-month change in TSF as a percentage of nominal GDP – only inched up by 0.6 percentage points of GDP in January this year from December, much weaker than that during the first month in previous easing cycles (Chart 4). TSF increased by RMB980 billion from January 2021, lower than the RMB1.5 trillion year-on-year jump in 2019 and the RMB1.4 trillion boost in 2016 (Chart 4, bottom panel). Chart 4The Magnitude Of Increase In January’s Credit Impulse Less Than Meets The Eye
Takeaways From January’s Credit Data
Takeaways From January’s Credit Data
Chart 5Corporate Demand For Bank Credit Remains Soft
Corporate Demand For Bank Credit Remains Soft
Corporate Demand For Bank Credit Remains Soft
Furthermore, China’s households and private businesses have significantly lagged in their responses to recent policy easing measures and their demand for credit remained soft in January (Chart 5). Bank credit in both short and longer terms to households were lower than a year earlier due to downbeat consumer sentiment (Chart 6A and 6B). Chart 6AConsumption Was Unseasonably Weak During Chinese New Year
Consumption Was Unseasonably Weak During Chinese New Year
Consumption Was Unseasonably Weak During Chinese New Year
Chart 6BHouseholds' Propensity To Consume Continues Trending Down
Households' Propensity To Consume Continues Trending Down
Households' Propensity To Consume Continues Trending Down
How Much Stimulus Is Necessary? Our calculation suggests that China will probably need to create approximately RMB35 trillion in new credit, or 29% of GDP in credit impulse, over the course of this year to avoid a contraction in corporate earnings. In our previous reports, we argued that the state of the economy today is in a slightly better shape than the deep deflationary period in 2014/15, but the magnitude of the property market contraction is comparable to that seven years ago. Chart 7 illustrates our approach, which uses a model of Chinese investable earnings growth. The model is designed to predict the likelihood of a serious contraction in investable earnings in the coming 12 months. It includes variables on credit, manufacturing new orders and forward earnings momentum. The chart shows that the flow of TSF as a share of GDP needs to reach a minimum of 28.5% in order that the probability of a major earnings contraction falls below 50%. The size of the credit impulse necessary is 2 percentage points higher than that achieved last year, but still lower than the scope of the stimulus rolled out in 2016. Assuming an 8% growth rate in nominal GDP in 2022, the credit flow that should to be originated this year would be about RMB35 trillion, as illustrated in Chart 8. The chart also shows that this amount would exceed a previous high in credit flow reached in late-2020. Chart 7China Needs At Least A 29% Credit Impulse In 2022 To Avoid An Earnings Recession
China Needs At Least A 29% Credit Impulse In 2022 To Avoid An Earnings Recession
China Needs At Least A 29% Credit Impulse In 2022 To Avoid An Earnings Recession
Chart 8China Needs To Create RMB35 Trillion In Credit In 2022
China Needs To Create RMB35 Trillion In Credit In 2022
China Needs To Create RMB35 Trillion In Credit In 2022
Based on a 3-month annualized rate of change, January’s credit growth appears that it will achieve the RMB35 trillion mark. However, the jump in TSF largely reflects a one-month leap in frontloaded local government bond issuance and it is not certain if private credit will accelerate in the months ahead. For now, we contend the stimulus have been insufficiently provided during the past six months (Chart 8, bottom panel). Chance Of A Stimulus Overshoot? We will closely monitor whether the month-to-month pace of credit growth is consistent with the scope of the reflationary policy response required to revive China’s domestic demand. Despite a sharp improvement in January’s headline credit number, we view the policy signal from January’s credit data as neutral. China’s unique cyclical patterns and the lack of official seasonally adjusted data make monthly credit figures difficult to interpret. Charts 9 and 10 represent an approach that we previously introduced to help gauge whether the pace of credit creation is on track to meet the stimulus called for to stabilize the economy. Chart 9Jan Credit Growth Looked To Be Stronger Than A “Half-Strength” Credit Cycle…
Takeaways From January’s Credit Data
Takeaways From January’s Credit Data
Chart 10…But It Is Too Early To Conclude It Is In Line With What Is Needed
Takeaways From January’s Credit Data
Takeaways From January’s Credit Data
The charts show an average cumulative amount of TSF as the year advances, along with a ±0.5 standard deviation, based on data from 2010 to 2021. The thick black line in both charts shows the progress in new credit creation this year, assuming an 8% annual nominal GDP growth rate. Chart 9 shows the cumulative progress in credit, assuming a 27% new credit-to-GDP ratio for the year, whereas Chart 10 assumes 30%. The 27% ratio scenario shown in Chart 9, which is slightly higher than the magnitude of stimulus in 2019, would correspond to a very measured credit expansion. If the thick black line continues to trend within this range, it would suggest that policymakers are reluctant to allow credit growth to surge. Consequently, global investors should continue an underweight stance on Chinese stocks. In contrast, Chart 10 represents a 30% rate of TSF as a share of this year’s GDP; this would be the adequate stimulus needed for a recovery in domestic demand. A cumulative amount of TSF that trends within or above this range would provide more confidence that a credit overshoot similar to 2015/16 and 2020 would occur. Investment Conclusions It is premature to upgrade Chinese stocks to an overweight cyclical stance (i.e. over 6-12 months) within a global portfolio. For now, we recommend investors stay only tactically overweight in Chinese investable equities versus the global benchmark, given their cheap relative valuations. Meanwhile, the increase in January’s TSF, while registering an improvement relative to previous months, does not signal that the pace of credit growth will be strong enough to overcome the negative ramifications of the ongoing deceleration in housing market activity. Therefore, in view of policymakers’ steadfast desire to avoid another major credit overshoot, our cyclical recommendation to underweight Chinese stocks remains unchanged. Jing Sima China Strategist jings@bcaresearch.com Strategic Themes Cyclical Recommendations Tactical Recommendations
Executive Summary We back-tested equity strategies based on our rotation framework. They deliver positive excess returns and lower volatility. We also introduce our Excess Returns Rotation Maps, a new investment tool with an impressive track record. Based on the current reading of our rotation graphs and the predictive ability of our Rotation Maps, we recommend investors favor both the Euro Area Volatility index over the Momentum index and Value over Growth over the next twelve months. Strategy Performance For Sectors
The Great Rotation
The Great Rotation
Bottom Line: At the national level, favor Swedish equities over German ones, German equities over both Italian and French equities, and Dutch stocks over their Spanish counterparts. At the sector level, overweight Materials relative to Energy, Energy to Financials, and Tech stocks to Communication stocks. Feature 2022 started with a bang. Economic activity slowed because of the Omicron variant, but labor markets continue to improve. Meantime, yields rose and inflation has remained sticky, thus forcing the Fed—and even the European Central Bank (ECB)—into a hawkish pivot. Suddenly, the prospect of rising interest rates and tightening of financial conditions has dawned upon investors. And, if this were not enough, the potential for a major geopolitical event is rising because the tensions between Russia and Ukraine have flared, refueling the European energy crisis. Considering how elevated equity valuations already are, these developments have ultimately caused investment sentiment to deteriorate sharply. Net bullish sentiment hit its lowest level since April 2013 according to the latest American Association of Individual Investors (AAII) survey, followed shortly thereafter by an inversion of the VIX curve and a record volume for put options. In January, the S&P 500 and the Nasdaq fell, respectively, by 5.2% and 9%, while the Euro Area MSCI index fell by 3%. However, these exhaustion / worry signs are not harbingers of a recession. The yield curve—which provides an historically excellent leading indicator of recessions—has not inverted. Credit spreads are widening, but they do not yet flash major stress points. We remain bullish on a cyclical horizon, especially for European equities, even if the near-term market outlook continues to be tricky, which is why we recommend investors hold protections. Nonetheless, we expect economic growth to remain solid. The Chinese credit impulse is trying to bottom, the global capex cycle is firm, and European households are still flush with savings that they will ultimately spend. Finally, the ECB is unlikely to raise interest rates until year-end. Bouts of volatility such as the current one are common at the beginning of episodes of policy tightening. The rise in inflation forces investors to experience a rather painful rotation that moves them from the pain of rising rates, to the fear of a more severe market correction, and which ultimately shifts them away from the deflationary mindset of the last decade. Last November, we introduced our relative rotation graphs to identify where equities stood in their rotation and thereby to help investors navigate these dangerous waters.To obtain a visual representation of the rotation, we position different assets in quadrants1 based on proprietary indicators of their relative strength and relative momentum. In this follow-up report, we put the effectiveness of our rotation framework to the test by providing the backtest summary results of the relative equity returns associated with each quadrant over time, as well as the relative returns obtained by picking long/short equity pairs based on our Rotation Maps framework. Our Rotation Maps framework delivers positive excess returns and lower volatility. More importantly, an ex-ante investment strategy based their predictive ability yields strong results, in relation to its application to investment styles, at sector or national levels. Timing The Rotations The main assumption of the Rotation Maps framework is that, on average, equities follow the rotation pattern illustrated in Diagram 1. We do not expect it to operate like clockwork, but gathering more descriptive statistics about these patterns over time provides valuable information, from the amount of time spent in each of the quadrants to how much time it takes to complete a rotation. One does not want to assume equities have just stepped into the Leading quadrant when, in fact, they have been there for several weeks already, implying it is probably not a good entry point on a tactical basis. This is why we show the entire rotation trail and not only the last reading. We have added these descriptive statistics in each quadrant on Diagram 1. Diagram 1Stylized Rotation Pattern
The Great Rotation
The Great Rotation
Knowing that on average—and ignoring temporary moves—equities tend to remain between 15 and 16 weeks within one quadrant means that we can calculate what the expected returns over the next one to three months will be once equities come to occupy a specific quadrant. Unsurprisingly, the best (worst) expected returns are obtained when equities are in the Leading (Lagging) quadrant, notwithstanding the ones we look at (Table 1). Table 1Stepping Into A Quadrant: 1-Month & 3-Month Returns
The Great Rotation
The Great Rotation
The results clearly show that you can identify both future winners and losers based on where they currently stand in their rotation and thus enter long/short pairs trades accordingly. Within a three-month time horizon, this observation generally means buying equities that are in the Leading quadrant and selling those that are in the Lagging quadrant. To do so beyond a three-month time horizon requires using the information we collected about each rotation to predict where equities will stand in their respective rotation patterns at a certain point in the future. Having done that, we can anticipate what the predicted excess returns2 will be for a given pair trade based on the current quadrants of each leg. Table 2 presents the Excess Returns Rotation Map for Euro Area Value / Growth equities over different time horizons. At present, Value equities are located in the Leading quadrant, whereas Growth equities are in the Lagging quadrant. In the past, when this was the case, Value outperformed Growth on a three-, six-, and twelve-month horizon by 0.8%, 1.1%, and 3.1%, respectively. Table 2Excess Return Rotation Map: Value Versus Growth
The Great Rotation
The Great Rotation
For presentation purposes, we only display one example of Rotation Map in this report. The Excess Returns Rotation Maps for each European investment style, sector, and national market mentioned thereafter is available on demand. Rotation Maps… Or Treasure Maps? The true usefulness of Rotation Maps lies in looking at each rotation graph at any point in time and using its predictive ability to pick the best pair trades, thus generating alpha. We designed two investment strategies to see whether our Rotation Maps framework adds value to the investment process. Both strategies are purely mechanical and do not require any judgement. Chart 1Strategy Performance For Investment Styles
The Great Rotation
The Great Rotation
In the first strategy, we picked a pair trade with the highest predicted returns over the next twelve months among all the rotation maps and held it over that timeframe, and then we repeated this process for every year. In the second investment strategy, rather than picking the best predicted pair trade, we selected a basket comprised of the top 10% The results of both strategies for European equity styles, sectors, and national bourses are shown in Charts 1, 2, and 3. These results are astounding. The main value of this framework seemingly comes from its ability not only to avoid major stock market corrections but also to deliver strong positive returns. Case in point: when the Euro Area MSCI index fell by 47% in 2008, our top 10% baskets had an average return of 18% (styles), 22% (sector level), and 13% (nation level). Chart 2Strategy Performance For Sectors
The Great Rotation
The Great Rotation
Chart 3Strategy Performance For National Markets
The Great Rotation
The Great Rotation
The two strategies do not consistently beat the market. However, used over a multi-year horizon, our framework achieves annual returns that are, on average, two to three times higher than those of the market. We are confident we can improve the overall effectiveness of our framework by applying it in conjunction with our own cyclical macro views. In future research, we will explore how to exploit the rotation framework under different macro environments, such as when yields or inflation are rising. Having said that, which equities are predicted to generate the most alpha over the next twelve months based on the current picture? European Investment Styles Over the past three months, many European investment styles have moved into the Lagging quadrant, notably growth stocks (Chart 4). Meanwhile value stocks are solidly in the Leading quadrant, supported by rising yields. Small-caps equities finally escaped the Lagging quadrant and should deliver positive relative returns over the next few months. Chart 4Relative Rotation Graph: European Investment Styles
The Great Rotation
The Great Rotation
Our Rotation Maps framework suggests that going long volatility stocks relative to momentum ones as well as going long value versus growth are the two trades predicted to deliver the highest returns over the next twelve months. European Sectors The sector shifts in European markets mirror the general confusion in the market: ignore the volatility and keep chasing cyclical stocks or find shelter in defensive stocks (Chart 5)? It looks like they did both. Most defensive sectors have moved into either the Improving or Leading quadrants, except for Consumer Staples. In the meantime, Energy and Financials, two cyclical sectors, have been occupying the Leading quadrant for quite some time. Chart 5Relative Rotation Graph: European Sectors
The Great Rotation
The Great Rotation
Our Rotation Maps framework indicates that the following trades are predicted to deliver the highest returns over the next twelve months: Materials over Energy Energy over Financials Tech over Communication Services Utilities over Tech Health Care over Industrials Industrials over Financials European National Markets As expected, the rotational pattern exhibited by European national bourses continues to reflect their respective sectoral biases (Chart 6). The tech-heavy Dutch market has finally moved into the Lagging quadrant. Until industrials do better, the Swedish market will linger in the Lagging quadrant. Chart 6Relative Rotation Graph: European National Markets
The Great Rotation
The Great Rotation
Germany scarcely moved at all, mostly staying in the Improving quadrant. We take it that the rotation pattern will shift German stocks to the Leading quadrant over the next few months, which support an overweight position in German equities. Similarly, the rotation should shift Spanish equities to the Leading quadrant over the short run, especially if German yields keep rising. Italian equities appear to have already been raised by higher yields into the Leading quadrant. Our Rotation Maps indicates that the following trades are predicted to deliver the highest returns over the next twelve months: Swedish stocks over German ones German stocks over Italian ones German stocks over French ones Dutch stocks over Spanish ones Jeremie Peloso, Associate Editor JeremieP@bcaresearch.com Footnotes 1 The “Leading” (“Lagging”) quadrant denotes assets performing better (worse) than their benchmark, with strengthening (weakening) momentum. The “Improving” (“Weakening”) quadrant denotes assets that are performing worse (better) than the benchmark, with strengthening (weakening) momentum. 2 We define excess returns as the total returns of the long/short position based on the rotation in excess of the average returns observed in the past.
Executive Summary The Pandemic-Led Surge In E-Commerce Spending Is Reverting Back To Trend
The Pandemic-Led Surge In E-Commerce Spending Is Reverting Back To Trend
The Pandemic-Led Surge In E-Commerce Spending Is Reverting Back To Trend
Rising interest rates and a cooling in pandemic-related tech spending will cap the upside for technology shares over the remainder of 2022. Looking further out, US big tech companies are likely to suffer from heightened competition in increasingly saturated markets. Concerns about big tech’s excessive market power, cavalier attitudes towards personal data, proclivity for censoring non-establishment opinions, and the deleterious impact of social media on teenage mental health are all fueling a public backlash. Investors should expect increased regulation and antitrust enforcement of big tech companies in the years ahead. Bottom Line: The hegemony of today’s US-based big tech companies is coming to an end. While we do not expect tech stocks to decline in absolute terms in 2022, they will lag the S&P 500. Given tech’s heavy representation in the US, investors should underweight the US in a global equity portfolio. Sinking Ark Tech stocks have had a tough ride since the start of the year. So far in 2022, the NASDAQ Composite has fallen 9.3% compared to 5.5% for the S&P 500. The ARK Innovation ETF, Cathie Wood’s collection of “disruptor” companies, has dropped -22%, and is now down -53% from its peak last year (Chart 1). We expect tech shares to lag the market during the remainder of 2022. The pandemic was a boon for many tech companies. Generous stimulus payments and stay-at-home policies led to a surge in e-commerce spending (Chart 2). As economies continue to reopen, many tech companies could face an air pocket in demand for their goods and services. Chart 1Tech Stocks: Rough Start to 2022
Tech Stocks: Rough Start to 2022
Tech Stocks: Rough Start to 2022
Chart 2The Pandemic-Led Surge In E-Commerce Spending Is Reverting Back To Trend
The Pandemic-Led Surge In E-Commerce Spending Is Reverting Back To Trend
The Pandemic-Led Surge In E-Commerce Spending Is Reverting Back To Trend
Despite some softening of late, retail sales remain well above their pre-pandemic trendline (Chart 3). If Amazon’s still-rosy projections are any guide, a further slowdown in goods spending is something that the analyst community is not fully discounting (Chart 4). Chart 3US Retail Spending Is Above Trend
US Retail Spending Is Above Trend
US Retail Spending Is Above Trend
Chart 4Amazon Sales Estimates May Be Too Optimistic
Amazon Sales Estimates May Be Too Optimistic
Amazon Sales Estimates May Be Too Optimistic
Rate Hikes Will Disproportionately Hit Tech Chart 5Long Rates Anticipate The Movements In Short Rates
Long Rates Anticipate The Movements In Short Rates
Long Rates Anticipate The Movements In Short Rates
US rate expectations continued to move up this week, egged on by St. Louis Fed President James Bullard’s statement earlier today declaring that he favors raising interest rates by a full percentage point by the start of July. The market is now pricing in six rate hikes by the end of the year. Historically, bond yields have increased starting about four months before the first rate hike and over the period in which the Fed is raising rates (Chart 5). While we do not think the Fed will need to deliver more tightening this year than what is already discounted, we do think that investors will eventually be forced to revise up their expectations of the neutral rate to between 3%-and-4%. As Chart 6 shows, the market expects the Fed to stop raising rates when they reach 2%, which we regard as unrealistic. Chart 6The Market Thinks The Fed Will Not Be Able To Lift Rates Above 2%
The Disruptor Delusion
The Disruptor Delusion
An increase in the market’s estimate of the neutral rate will push up bond yields. Unlike banks, tech tends to underperform in a rising yield environment (Chart 7). Priced For Perfection? Higher bond yields and a reversion-to-trend in tech spending would be less of a problem for technology shares if valuations were cheap. They are not, however. The Nasdaq Composite still trades at 29-times forward earnings compared to 20-times forward earnings for the broader S&P 500 (Chart 8). Chart 8Tech Shares Are No Bargain
Tech Shares Are No Bargain
Tech Shares Are No Bargain
Chart 7Rising Bond Yields Will Help Bank Stocks But Hurt Tech Shares
Rising Bond Yields Will Help Bank Stocks But Hurt Tech Shares
Rising Bond Yields Will Help Bank Stocks But Hurt Tech Shares
Tech investors would argue that such a hefty valuation premium is warranted given the tech sector’s superior growth prospects. Underlying this argument is the assumption that just because tech spending will grow more quickly than the rest of the economy, this will necessarily translate into above-average earnings growth and outsized returns for publicly-listed tech companies. But is that really the case? Over short horizons of a few years, there is a decent correlation between relative industry growth and relative equity returns (Chart 9). However, that relationship evaporates over very long-term horizons (Chart 10). In fact, since 1970, the best-performing equity sector has been tobacco, hardly a paragon of technological innovation (Chart 11). Chart 9Stocks In Industries That Experience A Burst Of Output Growth Do Tend To Outperform Other Stocks …
The Disruptor Delusion
The Disruptor Delusion
Chart 10… But Over The Long Haul, Companies In Fast- Growing Industries Do Not Outperform Their Peers
The Disruptor Delusion
The Disruptor Delusion
Chart 11Tobacco Industry Returns Have Smoked All Others
The Disruptor Delusion
The Disruptor Delusion
What Goes Around Comes Around Table 1History Shows Leaders Can Become Laggards
The Disruptor Delusion
The Disruptor Delusion
Tech stock enthusiasts tend to forget that the disruptors themselves can be disrupted. History is littered with tech companies that failed to keep up with a changing world: RCA, Kodak, Polaroid, Atari, Commodore, Novell, Digital, Sinclair, Wang, Iomega, Corel, Netscape, AltaVista, AOL, Myspace, Compaq, Sun, Lucent, 3Com, Nokia, Palm, and RIM were all major players in their respective industries, only to fade into oblivion. Table 1 shows that all but one of the ten biggest tech names in the S&P 500 IT index in 2000 underperformed the broader market by a substantial degree over the subsequent ten years. Today, the incentive for startups to emerge has never been stronger. Venture capital funds are flush with cash. Tech profit margins are near record highs, making challenging the incumbents an increasingly enticing goal. About one-third of the outperformance of US tech stocks since 1996 can be explained by rising relative profit margins, with faster sales growth and relative P/E multiple expansion explaining 45% and 23% of the remainder, respectively (Chart 12). Chart 12Decomposing Tech Outperformance
The Disruptor Delusion
The Disruptor Delusion
Meta’s Malaise Chart 13Unlike Economists, Facebook Just Ain't Cool No More
The Disruptor Delusion
The Disruptor Delusion
Which of today’s tech titans could join the “has been club”? As we flagged in August, Meta is certainly a possibility. In its disastrous quarterly earnings report, the company revealed that globally, the number of Facebook users is shrinking for the first time ever. While this came as a surprise to many investors, the writing has been on the wall for a long time. According to Piper Sandler’s survey of teen preferences conducted late last year, only 27% of teenagers used Facebook, down from 94% in 2012 (Chart 13). Meta has been fortunate in that many Facebook users have migrated to Instagram, a social media platform it acquired in 2012. Unfortunately, the latest data suggests that even Instagram usage is starting to slow as more young people flock to TikTok. Google Also Vulnerable Unlike Meta, Alphabet crushed earnings estimates. However, the similarities between the two companies may be greater than most investors are willing to admit. Like Facebook, Google’s profits almost entirely come from ad spending. According to eMarketer, Google garnered 44% of digital ad spending in 2021 while Facebook took in 23%. Digital advertising accounted for 63% of all ad spending in 2021, up from 58% in 2020 and 51% in 2019. While there may be scope for digital ads to take further market share, eventually, growth in digital ad spending will converge with overall consumption growth, which in the US is likely to average no more than 2% in real terms over time. Monopoly Power Another important similarity between Meta and Alphabet is that both companies are increasingly coming under scrutiny from politicians and regulators. The antitrust case brought against Alphabet by 14 US states contains a litany of allegations of unfair practices. After an initial failed attempt, the Federal Trade Commission’s antitrust suit against Meta is also moving forward. Privacy Matters In addition, the way big tech companies handle private data is raising some hackles. In its annual report filed earlier this month, Meta warned that it would need to shut down Facebook and Instagram in Europe unless regulators drew up new privacy regulations. This came on top of Meta’s disclosure that it will lose $10 billion this year after Apple introduced pop-ups on the iPhone’s operating system asking users if they wanted to be tracked by apps. Turn Off That Phone! Another looming worry revolves around the corrosive impact of excessive social media usage on mental health. Academic studies have shown that adolescents who use Facebook and Instagram frequently feel greater anxiety and unease than those who do not. The share of students reporting high levels of loneliness more than doubled in both the US and abroad over the past decade, a trend that predates the pandemic (Chart 14). In 2020, the last year for which comprehensive data is available, one-quarter of US girls between the ages of 12 and 17 reported experiencing a major depressive episode, up from 12% in 2011 (Chart 15). Chart 15The Rise In Depression Rates Coincided With Increased Social Media Usage
The Disruptor Delusion
The Disruptor Delusion
Chart 14Alone In The Crowd
The Disruptor Delusion
The Disruptor Delusion
Backlash Public contempt for tech companies is fueling a political backlash. According to a Gallup poll conducted last year, only 34% of Americans held a favorable view of tech companies such as Amazon, Facebook, and Google, down from 46% in 2019; 45% had an unfavorable opinion, up from 33% in 2019 (Chart 16). Chart 16Americans Do Not Hold Tech Companies In High Regard
The Disruptor Delusion
The Disruptor Delusion
The shift in public sentiment over the past two years has been entirely driven by Independent and Republican voters, many of whom feel that tech companies are unfairly censoring their opinions (Table 2). The same poll revealed that the majority of Americans – including the majority of Republicans – now favor increased regulation of tech companies. Table 2American Views On Big Tech
The Disruptor Delusion
The Disruptor Delusion
Investment Conclusions Chart 17Value Stocks Are Cheap
Value Stocks Are Cheap
Value Stocks Are Cheap
Considering that global growth is likely to remain above-trend this year, we do not expect tech stocks to decline in absolute terms. A flattish, though volatile, trajectory is the most plausible outcome. In relative terms, however, tech stocks will underperform. Despite having outperformed tech-heavy growth stocks by 14% since last November, value stocks remain exceptionally cheap by historic standards (Chart 17). Tech stocks are overrepresented in the US. Thus, if tech continues to underperform, it stands to reason that non-US equities will outperform their US peers over the coming years. Peter Berezin Chief Global Strategist peterb@bcaresearch.com Global Investment Strategy View Matrix
The Disruptor Delusion
The Disruptor Delusion
Special Trade Recommendations Current MacroQuant Model Scores
The Disruptor Delusion
The Disruptor Delusion