Equities

Highlights The Biden administration faces significant risks from outside the US economy – our third “key view” for 2022. The Ukraine conflict brings one external risk to the forefront. These external risks would exacerbate the global supply squeeze, potentially pushing up commodity prices until they start to kill demand. Investors should prepare for oil price overshoots. Exogenous risks – such as foreign policy crises – rarely help the president’s party in the midterm election. Any crisis that adds to short-term inflation will hurt the ruling party. Tactically we continue to prefer defensive equities. Close our tactical long industrials / short consumer discretionary trade for a gain of 11.6%. Close long energy stocks for a 15.6% gain and convert to long energy small caps versus large caps. Buy the dip in cyber security stocks. Feature Stock market volatility is back, thanks in no small part to external risks such as Europe’s energy shortage and Russia’s conflict with the West over Ukraine. In our forecast for 2022, we highlighted the Biden administration’s external risks as our third key view. The rapidly deteriorating geopolitical situation was one of several reasons behind this view and it has now clearly moved to the forefront. In this report we highlight the consequences for domestic-oriented US investors. Biden’s immediate external risks, if they materialize, will increase the likelihood that Democrats will lose control of Congress, causing US fiscal policy to freeze and driving policy uncertainty and the dollar upward. For detailed coverage of the Ukraine conflict and its global geopolitical, macro, and market implications please refer to our Geopolitical Strategy reports. Why Is Biden Vulnerable To External Risks The Biden administration and the Democratic Party face serious external risks in 2022. The Omicron variant and global supply constraints are a major factor. Also the US’s domestic political divisions invite challenges from abroad. President Biden is politically weak ahead of midterm elections on November 8. His net approval rating is under water at -10 percentage points. Republicans are now leading the generic congressional ballot with 45.5% support against Democrats’ 41.8%. On a deeper level, Democrats are beset by a socialist fringe on their left wing, making it difficult to pass legislation, and an enthusiastic nationalist opposition movement with a viable challenger for the presidency in 2024 (former President Trump). At best they will pass one more major bill this year before Congress gets gridlocked. Foreign rivals have an advantage in this context. America’s chief rivals face limited political constraints at home (no midterm elections) but they can make low-cost, high-impact threats against the Biden administration through their leverage over the global supply chain and hence voters’ pocketbooks. External Risks Are Inflationary (At Least At First) External risks begin with inflation. The US’s large imbalance of investment over savings is evident in a current account deficit of 3.3% and deteriorating terms of trade. American demand is exceedingly strong due to accumulated household savings, a new capex cycle, and lingering effects of monetary and fiscal stimulus. Yet global supply is impeded. Import prices are rising at a 5.7% rate, the fastest since the BLS started the series in 2010, while imports from China are rising at a 4.7% clip. China’s “zero Covid” policy implies that supply disruptions will keep up the inflationary pressure this year (Chart 1, first panel). The US is also importing inflation from rising commodity prices. West Texas Intermediate crude oil prices have risen to $83 per barrel and average gasoline prices stand at $3.3. With global supply-demand balances tight, WTI prices should average $77 per barrel this year and $78 next year, according to our Commodity & Energy Strategy. In this context, unplanned supply disruptions are likely and will put more pressure on the supply side. Any conflicts with oil producers such as Russia and Iran will backfire in the form of higher prices at the pump (Chart 1, second panel). Yet geopolitical competitors (Russia, Iran, China) have unfinished business with the US stemming from the Trump administration. It is also possible that Biden could negotiate diplomatic solutions, reducing the risk of an oil price spike, but that is not the current trajectory. Chart 1Biden's External Risks Are Inflationary For Now
Biden's External Risks Are Inflationary For Now
Biden's External Risks Are Inflationary For Now
Interest rate hikes from the Federal Reserve will not easily control inflation derived from external sources and supply constraints. They will take time to dampen domestic demand. Yet voters usually solidify their opinions by mid-summer. Inflation may not have come down much by that time. Biden and the Democratic Party are at the mercy of the global supply chain. In this context Russia deliberately forced its way to the top of the US and global agenda by demanding that the West renounce any attempt to threaten its national security via Ukraine or the former Soviet Union. Energy Shock From Russia? The Ukraine crisis threatens an increase in global energy prices. Russia provides 8% of Europe’s commodity imports, 18% of its energy imports, and 16% of its natural gas imports (Chart 2). Russia is already withholding energy supplies from Europe, helping push natural gas prices up by 122% since last August. If war ignites, Russia could reduce energy flows to Ukraine and hence to the rest of Europe. Europe would not be willing to impose as harsh of sanctions as the US because its energy supply depends on it. The US can increase exports to Europe but it cannot replace Russia without depriving its other allies and partners, including India, Japan, and South Korea (Chart 3). The squeeze will cause prices to rise at first but if it is not addressed by higher output from the US and OPEC 2.0, then demand will be destroyed. Note that in 1979, 2008, and 2014, Russian military invasions coincided with a peak in global oil prices. Chart 2Geopolitical Risks Cause Resource Squeeze
Biden’s External Risks
Biden’s External Risks
Chart 3Can US Replace Russia For Europe? Not Really.
Biden’s External Risks
Biden’s External Risks
If other supply problems emerged simultaneously, the slowdown could be especially disruptive. If US-Iran negotiations fail, then another energy supply risk will emerge immediately this spring. The implication is not only a rise in oil prices but also a resilient dollar, which is also the implication of the Fed’s looming rate hikes. Defensive plays would tend to beat cyclical plays, at least in the short run until the crisis abates. But it is important to look at previous examples of Russian aggression to test this hypothesis. US Market Response To Russian Belligerence When Russia invaded Georgia in August 2008, the attack had limited impact on global financial markets, which were focused on the subprime mortgage crisis unfolding on Wall Street. Naturally stocks underperformed bonds, cyclicals underperformed defensives, and value went sideways against growth. Small caps rallied at first versus large caps but then hit a turning point from outperformance to underperformance (Chart 4). Note that the invasion began while President Putin watched the summer Olympics live in Beijing. So one cannot rule out a limited military action against Ukraine in the near term just because Putin is also headed to Beijing for this winter’s Olympics. When Russia invaded Ukraine in February 2014, seizing the Crimean peninsula in the Black Sea, the attack had a greater impact on global financial markets than with Georgia, although Ukraine’s relevance to the global economy was (and is) still limited. Chart 4Market Reaction To Russia Invasion Of Georgia, 2008
Market Reaction To Russia Invasion Of Georgia, 2008
Market Reaction To Russia Invasion Of Georgia, 2008
Chart 5Market Reaction To Russia Invasion Of Ukraine, 2014
Market Reaction To Russia Invasion Of Ukraine, 2014
Market Reaction To Russia Invasion Of Ukraine, 2014
Bonds outperformed stocks, cyclicals were flat-to-up against defensives (energy clearly outperformed defensives), and small caps stumbled but then beat out large caps (Chart 5). Energy stocks theoretically stood to benefit but crashed later that year due to supply glut and China policy tightening. In 2022 the situation is different from these previous Russian invasions in that the world is already in the thrall of an energy supply squeeze brought on by various factors. China’s economy is growing slowly but authorities are easing policy. A comparison of the winter of 2021-22 with that of 2013-14, when Russia invaded Crimea, suggests that energy stocks have already far outpaced growth and defensives (Chart 6). Energy small caps, however, could rally substantially against large cap peers. Tactically US investors should maintain a risk-averse positioning until the Russians make a military decision and the West announces its retaliatory measures. This analysis suggests that cyclicals and small caps face volatility but can ultimately grind higher after the onset of any new war in Ukraine. The magnitude of the war will obviously matter, which is why we maintain a defensive tactical positioning. The next question centers on the medium-term policy impact of Biden’s external risks. Chart 6Market Context: 2022 Versus 2014
Market Context: 2022 Versus 2014
Market Context: 2022 Versus 2014
Implications For US Midterms And Policy It is possible that Biden’s external risks will play a role in the 2022 midterms. It depends on which risks materialize. Most likely a Russian re-invasion of Ukraine would have a negative effect on the Democrats, especially if it adds to voters’ inflation woes. Major foreign policy successes or failures have a substantial impact on a president’s re-election chances but midterms are less obvious. Midterms almost always go against the president’s party because the previous election’s losers turn out in droves while winners sit home in complacency or disillusionment. The midterm electorate tends to be older, whiter, and more educated than the presidential electorate. Chart 7 shows only midterm elections in which external risks – such as foreign policy – played a major role. In the House, the only time the president’s party gained seats was in 2002, though it only lost four seats in 1962. In the Senate, the president’s party gained seats in 1962, 2002, and 2018 and only lost 2 seats in 1954. From these points we can draw the following conclusions: Chart 7US Midterm Elections: Ruling Party Performance Amid Foreign Policy Crises
Biden’s External Risks
Biden’s External Risks
Foreign policy crises do not generally help the president’s party. While major crises like 9/11 helped the Republicans, and the 1962 Cuban Missile Crisis minimized Democrats’ losses, nevertheless the 1942 midterm occurred after Pearl Harbor and the Democrats lost seats. Minor crises like the 1958 “Lebanon Crisis” also do not help. Russia’s invasion of Ukraine in 2014 falls under this category and did not help President Obama’s Democrats. A major threat to the homeland can help the president’s party on the margin. This is the significance of 1962 and 2002. The ruling party either minimized losses or made absolute gains in the House, while gaining seats in the Senate. (The 2018 midterm is the other case in which the president’s party gained Senate seats, amid President Trump’s trade war with China, but Republicans suffered heavily in the House.) Wartime escalation and entanglement hurt the president’s party. President Johnson’s Democrats suffered deep losses in 1966, as did President George W. Bush’s Republicans in 2006. Obama’s troop surge in Afghanistan was not the main issue but did not help his party in 2010. Ceasefires and peace treaties do not help the president’s party, even when the end of the war is seen as a victory. World War I was drawing to a close in 1918 but Democrats suffered for having gotten the US involved. Democrats also lost in 1946, despite US triumph in WWII. The Korean war ended on a far more ambivalent note and Republicans suffered at the ballot box. Vietnam was drawing to an ignominious close in 1974, which also occurred in the aftermath of the Arab oil embargo, recession, and Watergate scandal, so no surprise Republicans lost seats. If there is a foreign policy crisis this year, the “best case” for Biden’s Democrats – in crass political terms – would be one that engenders a patriotic rally, like happened with the Cuban Missile Crisis or 9/11. If Democrats only lose four seats in 2022, like Kennedy in 1962, they will have a one-seat majority in the House. However, this best-case scenario is unlikely. As noted, 1962 and 2002 consisted of direct threats to the US homeland. All other crises either hurt or did not help the president’s party. In 2014, while voters had other things on their minds that year, Russia’s invasion of Crimea reinforced criticisms of Obama’s foreign policy already centered on Libya, Syria, and Iran. Obama responded with sanctions and aid to Ukraine, as Biden threatens to do today. Democrats lost 13 seats in the House and 9 seats in the Senate. A similar negative impact should be expected if Russia re-invades in 2022. Biden is already vulnerable: his approval rating collapsed after his messy withdrawal from Afghanistan (reinforcing the fourth bullet about ending wars above). A new foreign policy crisis could cement the narrative of foreign policy incompetence. It matters a great deal whether an exogenous crisis automatically hurts the voter’s pocketbook. If it does, then any initial rally around the flag will fade over time, leaving the negative material impact behind and angering voters. In 1974, President Ford’s approval rating shot up above 50% as he took over from Nixon, yet his party still suffered from the inflationary economic backdrop and dour foreign policy backdrop. In 1978, President Carter’s approval rating also recovered to nearly 50% in time for the vote but it was not enough to overcome inflationary malaise – and Iranian oil strikes began in September (Chart 8). If we subtract the Misery Index (unemployment plus inflation) from the president’s approval rating, we see that Kennedy had a 70% approval during the Cuban Missile Crisis, and Bush had a 62% approval in 2002. But Johnson and Carter were sinking toward 35% during their first midterms, which is where Biden stands today (Chart 9). Chart 8Different Reactions For Different Crises
Biden’s External Risks
Biden’s External Risks
Chart 9Best And Worst Case Scenarios Of Foreign Policy Crisis For Democrats
Biden’s External Risks
Biden’s External Risks
Thus Biden’s external risks, depending on which ones materialize, suggest that the Democratic Party will face another headwind in November. Democrats are very likely to lose the House and somewhat likely to lose the Senate. Gridlock is already setting in – as will be apparent with the potential government shutdown over the February 18 deadline to pass spending bills. But the midterm will formalize it. Policy uncertainty will continue to creep up and weigh on investor risk appetite this year. In other words, even if cyclicals rally through a Ukraine conflict, they may not outperform defensives later this year. Investment Takeaways Cyclically we are booking an 15.6% gain on our long energy trade and will convert it to a long US energy small caps relative to large caps trade. The external risks highlighted in this report would push up oil prices at least initially (Chart 10). However, volatility will pick up from here. OPEC 2.0 will want to keep Brent crude prices from settling above the $90 per barrel that starts to crimp demand, as our Commodity & Energy Strategy argues. Higher prices will also encourage new production, including from the US shale patch (Chart 11). Note that energy stocks, like other cyclicals, tend to underperform during midterm election years as policy uncertainty affects markets. Chart 10Book Gains On Tactical Long Energy Equities Trade
Book Gains On Tactical Long Energy Equities Trade
Book Gains On Tactical Long Energy Equities Trade
Chart 11US Oil Producers Will Step Up
US Oil Producers Will Step Up
US Oil Producers Will Step Up
Tactically we recommend closing our long industrials / short consumer discretionary for a gain of 11.6%. Normally, consumer discretionary stocks are the best performing sector during midterm election years while industrials are the worst. But because of China’s policy easing, we took a tactical bet that the opposite would occur at the start of the year. However, external risks should now cause this situation to reverse by pushing up the dollar, penalizing industrials, without hurting the American consumer too much (Chart 12). Industrial equities are pricing in strong capex intentions but geopolitical conflicts would weigh on those intentions, while new orders and core durable goods orders could suffer a bit (Chart 13). The midterms will come into focus later this year and weigh on industrials as well. Chart 12Close Long Industrials Trade For Now
Close Long Industrials Trade For Now
Close Long Industrials Trade For Now
Chart 13Industrials Still Attractive On Cyclical Basis
Industrials Still Attractive On Cyclical Basis
Industrials Still Attractive On Cyclical Basis
Cyclically stick with cyber security stocks. They have sold off along with the tech sector as interest rates rise. But long cyber security is a secular investment thesis based on digitization of the economy, rising cyber crime, and geopolitical risk. Tensions with Russia, proxied by the fall in the ruble and rise in aerospace/defense stocks, point to the fact that investors recognize international tensions will remain high (Chart 14). Cyber space will remain an area of conflict even if physical conflict does not materialize. Growth stocks should also revive later as midterm policy uncertainty picks up. Chart 14Cyber Security Is A Secular Trade ... Buy The Dip
Cyber Security Is A Secular Trade ... Buy The Dip
Cyber Security Is A Secular Trade ... Buy The Dip
Chart 15Overweight Health Care Amid Political Risk
Overweight Health Care Amid Political Risk
Overweight Health Care Amid Political Risk
Tactically stick with overweight health care on rising uncertainty and expectations that the dollar will pick up (Chart 15). Defensives, especially health, should also outperform as the year goes on and midterms approach. Pricing power is returning to the sector but the Biden administration only has a little legislative ammunition left and its regulatory focus lies elsewhere for now. Matt Gertken Vice President US Political Strategist mattg@bcaresearch.com Strategic View Open Tactical Positions (0-6 Months) Open Cyclical Recommendations (6-18 Months) Table A2Political Risk Matrix
Biden’s External Risks
Biden’s External Risks
Table A3US Political Capital Index
Biden’s External Risks
Biden’s External Risks
Image
Image
Table A4APolitical Capital: White House And Congress
Biden’s External Risks
Biden’s External Risks
Table A4BPolitical Capital: Household And Business Sentiment
Biden’s External Risks
Biden’s External Risks
Table A4CPolitical Capital: The Economy And Markets
Biden’s External Risks
Biden’s External Risks
Feature Chart 1Weak Economic Fundamentals Undermine Stock Performance
Intensified Monetary Policy Easing, Unresponsive Underlying Demand
Intensified Monetary Policy Easing, Unresponsive Underlying Demand
Monetary policy easing has intensified in the past two months. The PBoC reduced one-year loan prime rate (LPR) by 10 bps and five-year by 5 bps following last week’s 10bps cut in policy rates1 and December’s 50 bps drop in the reserve requirement rate (RRR). Nonetheless, the onshore financial market’s response to the monetary policy actions has been muted. China’s A-share market price index fell by 3% in the past month. Credit growth has bottomed, but there is no sign of a strong rebound despite recent rate decreases (Chart 1, top panel). The impaired monetary policy transmission mechanism will likely delay China’s economic recovery, which normally lags the credit cycle by six to nine months. Moreover, the marginal propensity to spend among both corporates and households continues to decline, highlighting a lack of confidence among real economy participants, and will in turn dampen the positive effects of policy stimulus (Chart 2). The poor performance of Chinese onshore stocks (in absolute terms) is due to a muted improvement in credit growth and deteriorating economic fundamentals (Chart 1, bottom panel). Our model shows that China’s corporate profits are set to contract in next six months, implying that the risk-reward profile of Chinese stocks in absolute terms is not yet attractive (Chart 3). Therefore, investors should maintain an underweight allocation to Chinese equities for the time being. Chart 2Lack Of Confidence Dampens Corporate Earnings Outlook
Lack Of Confidence Dampens Corporate Earnings Outlook
Lack Of Confidence Dampens Corporate Earnings Outlook
Chart 3China's Corporate Profits Set To Contract In Next Six Months
China's Corporate Profits Set To Contract In Next Six Months
China's Corporate Profits Set To Contract In Next Six Months
Qingyun Xu, CFA Associate Editor qingyunx@bcaresearch.com Improving Liquidity, Weakening Credit Demand The modest uptick in December’s total social financing (TSF) growth largely reflects a significant increase in government bond issuance, while bank loan growth continued on a downward trend (Chart 4). Corporate loan demand remained sluggish, which dragged down aggregate bank credit growth (Chart 5). Downbeat business confidence suggests that corporate demand for credit will take longer to turn around, and therefore will reduce the effectiveness of current easing measures. Chart 4Monetary Easing Since Q3 Has Failed To Boost Credit Growth So Far
Monetary Easing Since Q3 Has Failed To Boost Credit Growth So Far
Monetary Easing Since Q3 Has Failed To Boost Credit Growth So Far
Chart 5Corporate Demand For Loans Weaker Than Suggested By Headline Data
Corporate Demand For Loans Weaker Than Suggested By Headline Data
Corporate Demand For Loans Weaker Than Suggested By Headline Data
Meanwhile, corporate bill financing has risen rapidly in recent months and now accounts for almost 40% of new bank loans, the highest level since 2010 (Chart 5, bottom panel). The high share of short-term lending to the corporate sector highlights the underlying weakness in both loan supply and demand. Banks are risk averse and reluctant to approve longer-term credit to the corporate sector, while corporates are unwilling to take on more debt. As a result, banks have had to issue short-term bills in order to meet their lending quota. Proactive Fiscal Policy Will Have A Limited Impact On Infrastructure Investments Chart 6Local Government SPBs Will Be Frontloaded In 2022
Intensified Monetary Policy Easing, Unresponsive Underlying Demand
Intensified Monetary Policy Easing, Unresponsive Underlying Demand
Fiscal policy will likely be frontloaded in Q1 this year, but the impact of a proactive fiscal policy on boosting infrastructural investment may be limited. According to a statement by the Ministry of Finance last December, around RMB1.46 trillion in the quota for local government special purpose bonds (SPBs) has been frontloaded for 2022. If we assume that all of the SPBs will be issued in Q1, the amount will be higher than SPBs issued during the same period in 2019, 2020 and 2021 (Chart 6). We expect a total SPBs quota of RMB 3.5 trillion for 2022, roughly the same as 2021. This implies a zero fiscal impulse on SPBs in 2022 compared with 2021. However, there were an estimated 1.2 trillion in SPB proceeds in 2021 that local governments failed to invest and this amount could be deployed in 2022. If we add last year’s SPB carryover to this year’s quota, there may be a 30% increase in the available funds to invest in infrastructure projects in 2022. Chart 7Higher LG Bond Issuance Does Not Mean Substantial Boost In Infrastructure Spending
Higher LG Bond Issuance Does Not Mean Substantial Boost In Infrastructure Spending
Higher LG Bond Issuance Does Not Mean Substantial Boost In Infrastructure Spending
However, a 30% jump in SPB proceeds does not suggest an equal boost in infrastructure spending this year (Chart 7). As noted in previous reports, SPBs issued by local governments only account for around 15% of total funding for infrastructure spending. Bank loans, which remain in the doldrums, are a much more significant driver in supporting the sector’s investment. Secondly, infrastructure spending has structurally downshifted since 2017 due to a sweeping financial deleveraging campaign to rein in shadow banking activity by local government financing vehicles (LGFVs). Shadow banking activity, which is highly correlated with infrastructure investment growth, is stuck in a deep contraction with no signs of an imminent turnaround (Chart 7, bottom panel). Thirdly, land sales play a prominent role in local government financing, accounting for more than 40% of local government aggregate revenues2 compared with about 15% from SPBs (Chart 8). Local government fiscal spending power will be constrained due to a significant and ongoing slowdown in land sales and regulatory pressures on LGFVs (Chart 8, bottom panel). Therefore, we expect that infrastructure spending will only moderately rebound in 2022. At best, it will return to its pre-pandemic rate of around 4% (year-over-year) in 2022 (Chart 9, top panel). Notably, onshore infrastructure stocks have priced in the recent favorable news about proactive fiscal policy support in 2022 (Chart 9, bottom panel). Given that infrastructure investment will likely only improve modestly this year, on a cyclical basis the sector’s stock performance upside will be capped and renewed weakness is likely. Chart 8Government Funds Face Headwinds From Falling Land Sales
Government Funds Face Headwinds From Falling Land Sales
Government Funds Face Headwinds From Falling Land Sales
Chart 9Infrastructure Investment Will Likely Recover To Its Pre-Pandemic Growth Rate
Infrastructure Investment Will Likely Recover To Its Pre-Pandemic Growth Rate
Infrastructure Investment Will Likely Recover To Its Pre-Pandemic Growth Rate
More Policy Fine-Tuning Is Underway, But Housing Policy Reversal Remains Doubtful Last week’s 5bp reduction in the 5-year LPR, which serves as a benchmark for mortgage loans, was positive for the housing market. However, the cut is insufficient to revive the demand for housing. Moreover, the asymmetrical rate reductions - a 10bps drop in the 1-year LPR versus a 5bps reduction in the 5-year - signals that the authorities are reluctant to decisively reverse housing policies. Sentiment in the housing sector remains downbeat. A survey conducted by the PBoC shows that the willingness to buy a home has plunged to the lowest level since 2017 (Chart 10). Medium- to long-term household loan growth, which is highly correlated with home sales, decelerated further in December (Chart 10, bottom panel). Given that home prices continue to decline, buyers may be expecting more price discounts and refrain from making purchases despite slightly cheaper mortgage rates. Although there was a modest pickup in medium- to long-term consumer loan growth in November, it was mainly driven by pent-up mortgage applications delayed by the banks in Q3. Moreover, advance payments for real estate developers remained in contraction through end-2021. The prolonged weakness in the demand for mortgages and homes highlights our view that it will take more than a minor mortgage rate cut to revive sentiment (Chart 11). Chart 10Sentiment In Housing Market Has Plummeted To A Multi-Year Low
Sentiment In Housing Market Has Plummeted To A Multi-Year Low
Sentiment In Housing Market Has Plummeted To A Multi-Year Low
Chart 11Funding Among Real Estate Developers Has Not Improved
Funding Among Real Estate Developers Has Not Improved
Funding Among Real Estate Developers Has Not Improved
Without a decisive improvement in home sales, real estate developers will continue to face funding constraints, which will weigh on new investment and housing projects (Chart 12). We expect the contraction in real estate investment and housing starts to be sustained through at least 1H22 (Chart 13). Chart 12Policymakers Will Have To Allow Significant Re-leveraging To Revive Housing Demand
Policymakers Will Have To Allow Significant Re-leveraging To Revive Housing Demand
Policymakers Will Have To Allow Significant Re-leveraging To Revive Housing Demand
Chart 13Real Estate Investment And Housing Starts Will Remain In Contraction Through 1H22
Real Estate Investment And Housing Starts Will Remain In Contraction Through 1H22
Real Estate Investment And Housing Starts Will Remain In Contraction Through 1H22
Chinese Export Growth Will Converge To Long-Term Growth Chart 14Vigorous Exports Provided Crucial Support To China's Economy In 2021
Vigorous Exports Provided Crucial Support To China's Economy In 2021
Vigorous Exports Provided Crucial Support To China's Economy In 2021
China’s exports grew vigorously in 2021, providing critical support to the economy. Net exports contributed 1.7 percentage points to the 8.1% rate of real GDP growth in 2021, the highest growth contribution since 2006. China’s share of global exports expanded to more than 15%, about 2 percentage points higher than the pre-pandemic average from 2015 to 2019 (Chart 14). The export sector probably will not repeat last year’s strong performance. The widening divergence of exports in value and in volume suggests that the solid aggregate value of exports has been mainly buttressed by soaring export prices since July 2021 (Chart 15). The price effect will likely gradually abate in 2022 due to easing global supply chain constraints, softer global economic growth and a high base factor from 2021. Indeed, export prices from China and other industrialized countries may have already peaked (Chart 16). Chart 15Robust Exports Growth Since 2H21 Driven By Soaring Export Prices
Robust Exports Growth Since 2H21 Driven By Soaring Export Prices
Robust Exports Growth Since 2H21 Driven By Soaring Export Prices
Chart 16Export Prices May Have Peaked
Export Prices May Have Peaked
Export Prices May Have Peaked
Services spending worldwide will likely normalize and lead global demand growth in 2022. Meanwhile, goods spending will moderate, implying weaker demand for China’s manufactured goods (Chart 17). Furthermore, China’s strong exports to emerging markets (EM) since Q2 2021 reflected supply shortages due to production interruptions in the EMs (Chart 18). We expect supply chain disruptions in these economies to ease in 2H22 when Omicron-induced infections subside and antiviral treatments become available worldwide. As such, China’s exports to those regions may gradually return to pre-pandemic levels. Chart 17US Household Consumption Will Likely Rotate From Goods To Services In 2022
US Household Consumption Will Likely Rotate From Goods To Services In 2022
US Household Consumption Will Likely Rotate From Goods To Services In 2022
Chart 18Rising Exports To EMs In 2021 May Not Continue Into 2022
Rising Exports To EMs In 2021 May Not Continue Into 2022
Rising Exports To EMs In 2021 May Not Continue Into 2022
China’s manufacturing utilization capacity reached a historical high in 2021, supported by hardy external demand for goods. However, profit margins in the manufacturing sector have been squeezed due to surging input costs (Chart 19). Manufacturing investment growth has been falling, reflecting the reluctance by manufacturers to expand their business operations amid narrowing profit margins (Chart 20). The profit outlook for the manufacturing sector will be at risk of deterioration when the growth in both export volumes and prices moderate in 2022. Chart 19Manufacturing Sector's Profit Margins Have Been Squeezed
Manufacturing Sector's Profit Margins Have Been Squeezed
Manufacturing Sector's Profit Margins Have Been Squeezed
Chart 20Manufacturing Investment Growth And Output Volume Both Rolled Over
Manufacturing Investment Growth And Output Volume Both Rolled Over
Manufacturing Investment Growth And Output Volume Both Rolled Over
Rising Import Prices Mask The Weakness In Chinese Domestic Demand Chinese import growth in value remained resilient through December, but has increasingly been driven by rising import prices. Import growth in volume, which is a truer picture of China’s domestic demand, decelerated at a faster rate in 2H21 (Chart 21). Credit impulse, which normally leads import growth by around six months, only ticked up slightly. The minor improvement in the rate of Chinese credit expansion will provide limited support to the country’s imports in 1H 2022 (Chart 22). Chart 21Rising Import Prices Masked The Weakness In China's Domestic Demand
Rising Import Prices Masked The Weakness In China's Domestic Demand
Rising Import Prices Masked The Weakness In China's Domestic Demand
Chart 22Modest Rebound In Credit Impulse Will Provide Limited Support To Chinese Imports
Modest Rebound In Credit Impulse Will Provide Limited Support To Chinese Imports
Modest Rebound In Credit Impulse Will Provide Limited Support To Chinese Imports
Chart 23Chinese Imports Of Key Commodities Rebounded Aimed Easing In Production Constraints
Chinese Imports Of Key Commodities Rebounded Aimed Easing In Production Constraints
Chinese Imports Of Key Commodities Rebounded Aimed Easing In Production Constraints
The volume of Chinese-imported key commodities, such as iron ore and steel, rebounded in the past three months, but its growth remains in contraction on a year-on-year basis (Chart 23). The improvement in Chinese commodity imports, in our view, reflects an easing in production constraints rather than escalating demand. Recently released economic data, ranging from manufacturing PMI, industrial production, fixed-asset investment and construction activity, all point to an imbalanced supply-demand picture in China’s economy (discussed in the next section). Sluggish Quarterly Economic Growth At End Of 2021 China’s economy expanded by 8.1% in 2021 or at a 5.1% average annual rate in the past two years. However, quarterly GDP growth on a year-over-year basis slowed further to 4% in Q4 from 4.9% in the previous quarter. On a sequential basis, seasonally adjusted GDP growth in Q4 was 1.6 percentage points above that of Q3, but slightly below its historical mean (Chart 24). Chart 24Subdued GDP Growth In Q4
Subdued GDP Growth In Q4
Subdued GDP Growth In Q4
Chart 25Investment And Consumption Have Been Poor Economic Links
Investment And Consumption Have Been Poor Economic Links
Investment And Consumption Have Been Poor Economic Links
Chart 26Softness In Investment And Consumption More Than Offset Robust Exports
Softness In Investment And Consumption More Than Offset Robust Exports
Softness In Investment And Consumption More Than Offset Robust Exports
Although industrial production accelerated somewhat in December, it reflects a catch-up phase following a period of constrained output amid last fall’s energy crisis (Chart 25). On the other hand, lackluster domestic demand and a further slowdown in the housing market significantly dragged down China’s economic expansion in Q4. Both fixed-asset investment and consumption decelerated significantly in 2021 Q4, more than offsetting an improvement in net exports (Chart 26, top panel). Notably, year-over-year growth rates in construction and real estate components of real GDP fell below zero in Q4 (Chart 26, bottom panel). In light of the subdued credit growth through end-2021, China’s economic activity will not regain its footing until mid-2022. Slow Recovery In Household Consumption Likely Through 1H22 The household consumption recovery was sluggish in 2021 and it will face strong headwinds at least through 1H22. China’s consumption recovery has been hindered by a worsening labor market situation, depressed household sentiment and renewed threats from flareups in domestic COVID-19 cases. China’s labor market situation shows a mixed picture. The urban unemployment rate has dropped to pre-pandemic levels and stabilized at 5.1% in December. It remains well within the government’s 2021 unemployment target of “around 5.5%”. However, urban new job creations plunged sharply and the number of migrant workers returning to the cities remains far below the pre-pandemic trend (Chart 27). China’s imbalanced economic recovery in the past two years led to a substantially slower pace of job creation in labor-intensive service sectors (Chart 28). Moreover, wages have been cut and the unemployment rate among younger workers have climbed rapidly in sectors suffering from last year’s regulatory crackdowns in real estate, education and internet platforms. Even though policies have recently eased at margin, it will take time for labor market dynamics (a lagging indicator) to improve. Chart 27Labor Market Situation Is Worsening
Labor Market Situation Is Worsening
Labor Market Situation Is Worsening
Chart 28Imbalanced Economic Recovery Led To A Mixed Picture In The Labor Market
Imbalanced Economic Recovery Led To A Mixed Picture In The Labor Market
Imbalanced Economic Recovery Led To A Mixed Picture In The Labor Market
Chinese household expenditures have lagged disposable incomes since the outbreak of the pandemic (Chart 29). The propensity to consume has declined since 2018 and the downward trend has been exacerbated by the pandemic since early 2020 along with a soaring preference to save (Chart 30). Chart 29Chinese Household Expenditures Have Lagged Disposable Income Growth
Chinese Household Expenditures Have Lagged Disposable Income Growth
Chinese Household Expenditures Have Lagged Disposable Income Growth
Chart 30Poor Sentiment On Future Income Contributes To Consumers' Unwillingness To Spend
Poor Sentiment On Future Income Contributes To Consumers' Unwillingness To Spend
Poor Sentiment On Future Income Contributes To Consumers' Unwillingness To Spend
Household consumption also faces renewed threats from increases in domestic COVID-19 cases. Since Q3 last year, more frequent city-wide lockdowns and inter-regional travel bans have had profound negative effects on the country’s service sector and retail sales (Chart 31 & 32). Omicron has also spread to China, triggering new waves of stringent countermeasures. China will not abandon its zero-tolerance policy towards COVID anytime soon, thus we expect the stop-and-go economic reopening to continue to weigh on the country’s service sector activity and consumption at least through 1H22. Chart 32Service Sector Activities Struggle To Return To Pre-Pandemic Trends
Service Sector Activities Struggle To Return To Pre-Pandemic Trends
Service Sector Activities Struggle To Return To Pre-Pandemic Trends
Chart 31China's Stringent COVID Countermeasures Will Curb Service Sector Recovery In 2022
China's Stringent COVID Countermeasures Will Curb Service Sector Recovery In 2022
China's Stringent COVID Countermeasures Will Curb Service Sector Recovery In 2022
Table 1China Macro Data Summary
Intensified Monetary Policy Easing, Unresponsive Underlying Demand
Intensified Monetary Policy Easing, Unresponsive Underlying Demand
Table 2China Financial Market Performance Summary
Intensified Monetary Policy Easing, Unresponsive Underlying Demand
Intensified Monetary Policy Easing, Unresponsive Underlying Demand
Footnotes 1 The 7-day reverse repo and the 1-year Medium-term Lending Facility (MLF) rates. 2 Including local government budgetary and managed funds revenues. Strategic View Cyclical Recommendations Tactical Recommendations
BCA Research’s US Equity Strategy service argues that the stars have not yet aligned for beaten-up US Tech stocks. A useful indicator of market breadth is the percentage of stocks making new lows – which currently stands at nearly 75%. Once this metric…
2022 has so far been unwelcoming for equity markets. The sharp climb in bond yields (see Country Focus) is in part to blame: the greatest drawdowns are among interest-rate sensitive sectors such as real estate and technology. Similarly, value stocks are…
Our Global Investment strategists often highlight that their “golden rule” for investing is to stay bullish on equities as long as a recession isn’t around the corner. This framework is instructive to assess the current environment. The question facing…
Highlights 2022 has had a rough start for equity investors: the S&P 500 is now down 8% from its peak, and NASDAQ is officially in correction territory. The question on everyone’s mind is how long this correction will last, and whether it is the right time to start buying beaten-up Tech stocks. Looking “under the hood” of the NASDAQ, we observe that with the technology space being top-heavy and dominated by the likes of Microsoft and Apple, index returns mask the heavy losses of some of the smaller, and less profitable, constituents, with many down 40-50% from their peaks. Analysis of the market breadth shows that three-quarters of NASDAQ names are trading below their one-week highs, which, according to our analysis, indicates that Tech is (almost) ripe for a bounce back.
Chart 0
However, the sector is currently under duress from rising rates and imminent monetary tightening. Historically, Tech’s worst performance was two to three months prior to the first rate hike – the current pullback is a “textbook” behavior. It will take another couple of months after the rate hike for a sustainable rebound. In addition to headwinds from rising rates, there is also an ongoing slowdown in demand for tech products and services, which translates into a deceleration of earnings and sales growth. On the valuations front, Technology is trading with a significant premium to the market, while its expected earnings growth is on par with that of the S&P 500. We recommend investors to be patient: While Tech appears oversold, and recent volatility is a function of market panic, the stars have not yet aligned for the sector. We are tactically bearish but structurally bullish. Feature 2022 has had a rough start for equity investors: Since the beginning of January, the S&P 500 has pulled back 8%. Market consensus is that this violent rotation is a repricing of risk, triggered by the Fed’s new hawkish stance aimed at taming the runaway inflation that has surged to a nearly 40-year high. The market expects the first rate hike as soon as March, followed by three more into the year-end. It is also grappling with the timing and degree of quantitative tightening (QT), which will follow on the heels of tapering. Energy and Financials are the only sectors in the green so far this year, with Real Estate, Healthcare, and Tech being hit the hardest (Chart 1). Internet Retail is down almost 20% from its local peak in mid-2021 and Interactive Media, home of Facebook, is down 11%. NASDAQ is officially in correction territory (Chart 2). Rising rates have hit growth and interest-rate-sensitive areas of the market the hardest.
Chart 1
Chart 2
While these negative returns indicate a sharp pullback, they don’t do justice to how painful this correction has been, as much of it was happening under the radar. The S&P 500 and many of its tech-related sectors and industries are top-heavy, being home to FAANG+M, which has proven to be more immune to rising rates. It is the smaller growth companies that have fallen much more than the top-line number indicates, with many down 40-50% from their peaks. However, now with more than 58% of stocks in the NASDAQ trading below their 30-week moving average, the natural question is: “Are we there yet?” or how much longer will this sell-off last? There are early signs of bottom-fishing among the stocks and industries hit hardest. Yet most days, both the S&P 500 and the NASDAQ start in the green, only to finish splattering to a new low (Chart 3). Chart 3Mega-cap Tech Has Fallen But Less Than Small-cap Brethren
Mega-cap Tech Has Fallen But Less Than Small-cap Brethren
Mega-cap Tech Has Fallen But Less Than Small-cap Brethren
In this report, we will aim to gauge when the sell-off in tech names will have run its course by focusing on the S&P 500 Technology sector. Also in today’s publication, we will reverse our usual course of analysis: We will start from the technicals as they are most helpful for timing entry points, and we will follow with macro and fundamentals. Tech Sector Is Top Heavy The S&P 500 Technology sector is top-heavy, with each industry group dominated by one of the tech giants, such as Microsoft in Software and Services, Apple in Hardware and Equipment, and Nvidia in Semiconductors. We call this trio “MAN.” The MAN accounts for 50% of the S&P 500 Technology sector market capitalization (Chart 4). As a result, both sector performance and valuation are heavily affected by index composition.
Chart 4
To unpack what is going on within the Tech sector, we plotted the dispersion of last month’s performance within the sector through a market cap bucket, with the first bucket containing the MANs. The last couple of buckets, 10 and 11, contain some of the smallest stocks in the index. Unsurprisingly, the largest stocks in the sector have not fallen that much. The correction has most affected stocks in buckets 7 through 11, with a market cap of between $8 to $33 billion, and these are the names that may be most tempting for “bottom-fishing.” Technicals It Is A Blood Bath Out There A useful indicator of market breadth, allowing us a look under the hood”, is the percentage of stocks making new lows – which currently stands at nearly 75% (Chart 5). This is a high reading which has happened only 11% of the months since 2000. However, once this metric rises above 85%, it indicates that the market is oversold. When that happens, the Tech sector outperforms the S&P 500 by around 7% over the next six months, and returns are positive every month (Chart 6). Based on this indicator, the NASDAQ in general, and Tech in particular, are close to the oversold conditions and are ready for a bounce. Chart 5Pullback In Tech Stocks Is Broad-based
Pullback In Tech Stocks Is Broad-based
Pullback In Tech Stocks Is Broad-based
Chart 6
However, the BCA Technical Indicator for the sector (Chart 7) is still in neutral territory. It is driven primarily by momentum components: It gauges the trend in equities and determines if the market is at an extreme in terms of momentum or investor psychology. This indicator is highly affected by the performance of the largest index constituents. All in all, we conclude that from a technical standpoint, the Tech sector is getting closer to a rebound. Chart 7The Technical Indicator Is In The Neutral Territory
The Technical Indicator Is In The Neutral Territory
The Technical Indicator Is In The Neutral Territory
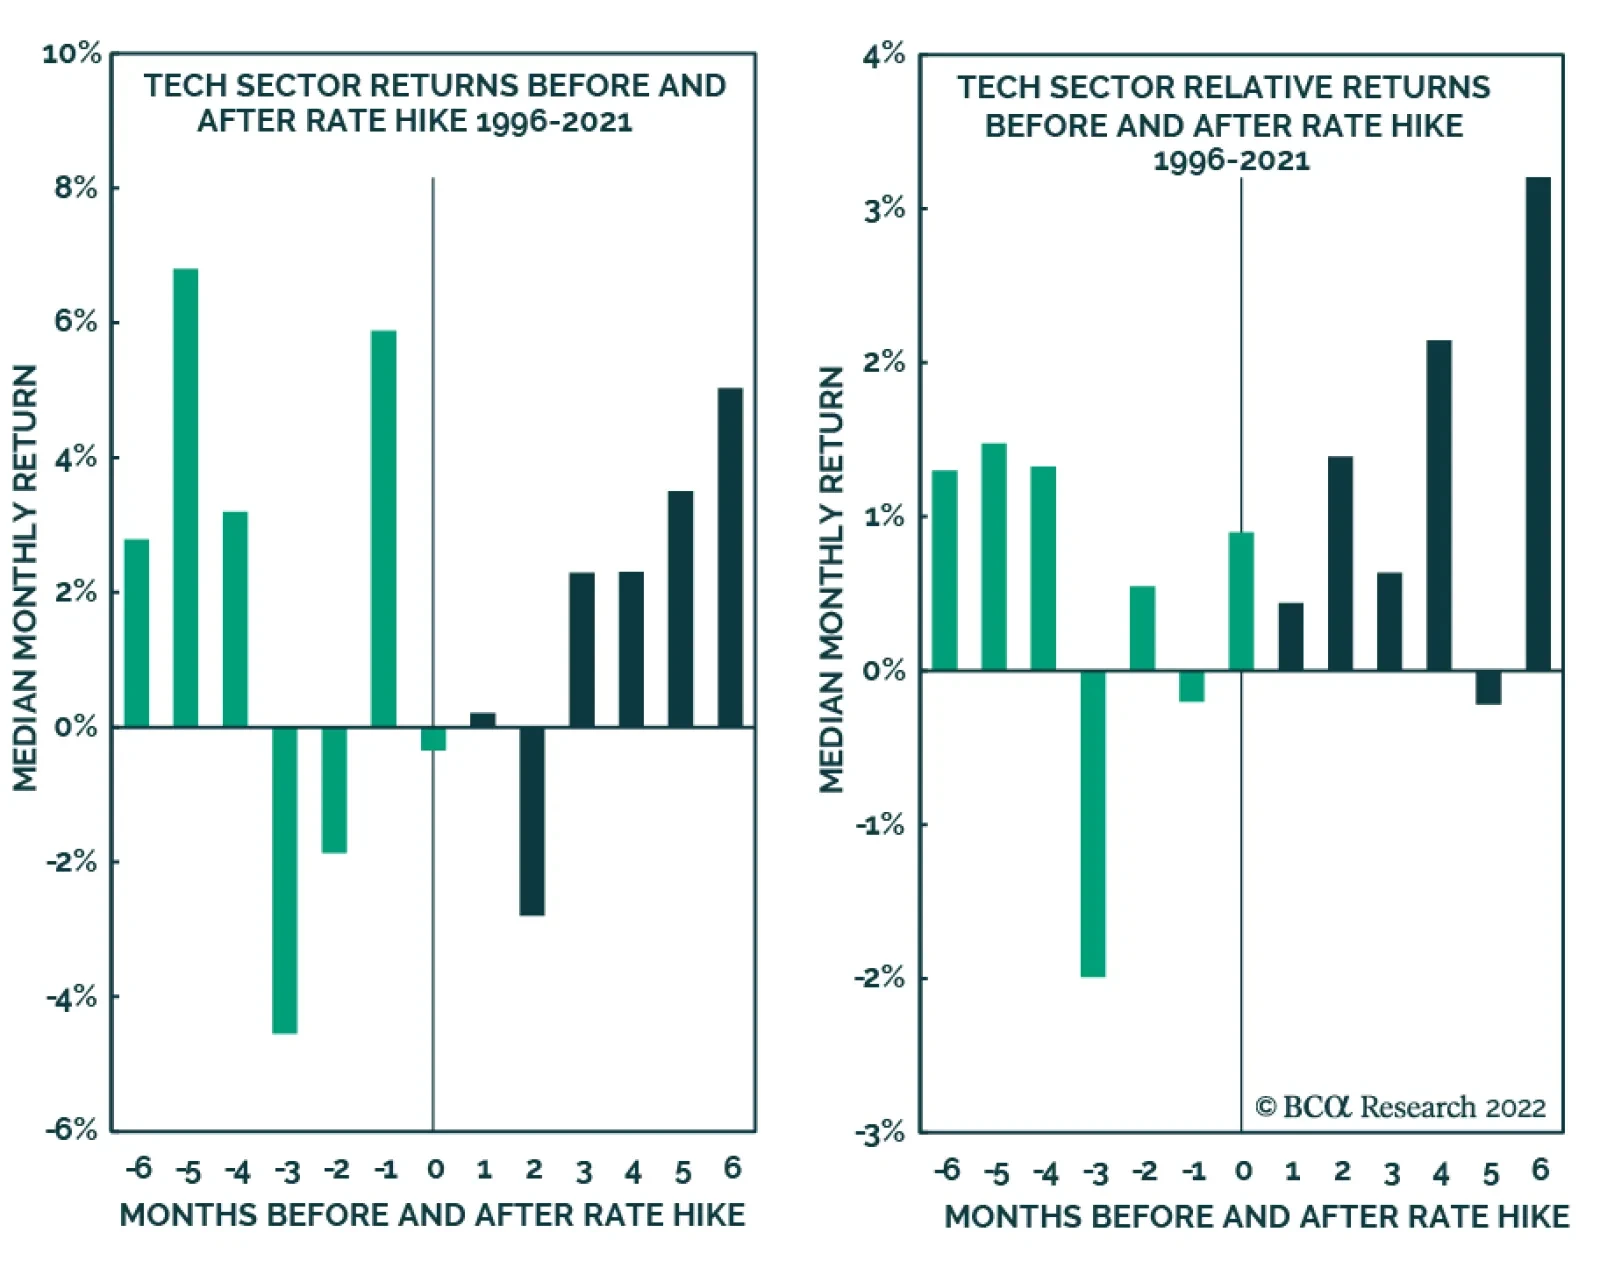
Macroeconomic Backdrop New Rate Hiking Cycle Will Take Time Getting Used To Ok, Tech is oversold. Yet there is still the not-so-small matter of a new, tighter monetary regime. How does Tech fare in the environment of rising rates? Clearly, not so good so far. However, the question is, how long will it take for the higher rates to be priced in, and for Tech to rebound. To answer this question, we have run another empirical study, anchoring the performance of the Tech sector to the beginning of each hiking cycle since 1996 (Charts 8 and 9).
Chart 8
Chart 9
According to our analysis, Tech’s worst performance is two to three months prior to the first rate hike – the current pullback in Tech is a perfect illustration. While we may expect a rebound rally “when the second shoe drops” and the Fed announces the first hike, it appears that a sustainable rally may still be a couple of months away. Based on this analysis, we conclude that it will pay off to be patient and wait until the summer. It Is The Economy, Stupid! Apart from the headwind from rising rates, there is also an ongoing slowdown in demand for Tech Business Investment (Chart 10). Moreover, the Tech New Orders Index peaked at a high level at the end of 2021 and has recently turned (Chart 11). So has Private Tech Investment (Chart 12). This indicates that demand is waning following the surge that accompanied the most recent push to digital transformation—which was accelerated by the onset of the pandemic. Chart 10Slowdown In Tech Business Investment
Slowdown In Tech Business Investment
Slowdown In Tech Business Investment
Chart 11Tech New Orders Have Peaked
Tech New Orders Have Peaked
Tech New Orders Have Peaked
Chart 12Private Tech Investment Is Also Slowing
Private Tech Investment Is Also Slowing
Private Tech Investment Is Also Slowing
The macroeconomic backdrop is unfavorable for the Tech Sector Fundamentals Sales And Earnings Growth Are Slowing While the Tech sector enjoyed a fantastic sales recovery in 2021, with sales growth exceeding pre-pandemic levels, this year may be different. Waning demand for tech products and services translates into a sales growth slowdown (Chart 13). Chart 13The Tech Sector Sales Growth Is Slowing...
The Tech Sector Sales Growth Is Slowing...
The Tech Sector Sales Growth Is Slowing...
Chart 14... So Is Earnings Growth
... So Is Earnings Growth
... So Is Earnings Growth
With sales growth slowing, earnings growth is bound to follow (Chart 14), which is no different from the broad market. Technology sector earnings growth for the next 12 months is converging with that of the S&P 500: 10% vs. 9% respectively (Chart 15). Margins are expected to compress in 2022, albeit from the high levels (Chart 16). Chart 15Tech And The S&P 500 Expected Earnings Growth Has Converged
Tech And The S&P 500 Expected Earnings Growth Has Converged
Tech And The S&P 500 Expected Earnings Growth Has Converged
Chart 16Margins Are Expected To Compress
Margins Are Expected To Compress
Margins Are Expected To Compress
Of course, the Q4-2021 earnings results could bring a respite. So far blended the year-on-year earnings growth rate is 15.8%: However, only 5 companies out of 71 have reported, beating expectations by 4.6%. Will these results save the day? Possibly – expectations are a low bar to clear. Time will tell. But to prop up the sector, results from the MAN have got to be stellar. Valuations: Better But Not Good Enough While Tech earnings are expected to grow in line with the S&P 500, the sector is trading with a 28% premium to the market at 27x vs. 21x forward PE (Table 1). Relative PE NTM currently stands at 1.7 standard deviations above the five-year average. Although this may seem high, the froth has come off as, only two months ago, Tech was trading at 2.4 standard deviations. This is a significant change, but the sector is not yet cheap enough for bargain hunting. Adjusting for the growth rate differential between Tech and the S&P 500, we divide PE NTM over EPS Growth NTM, to arrive at PEG: Even so, Tech is still more expensive trading at 2.7 for a percentage of future growth, compared to 2.3 for the S&P 500. However, Tech is a growth sector, and perhaps by looking at only one-year-ahead earnings growth, we are being myopic. Let’s take a look at longer-term growth expectations. Curiously, over the next five years, Tech earnings are expected to grow at about an 18% annualized rate, while the S&P 500 is expected to grow at 21% (Chart 17). As a result, the PE/Long-Term Earnings Growth Rate for Tech is 1.5 vs. 1.0 for the S&P 500. Table 1Tech Valuation Premium Is Still Too High
Are We There Yet?
Are We There Yet?
Chart 17Long-term Earnings Growth Does Not Justify Valuation Premium Either
Long-term Earnings Growth Does Not Justify Valuation Premium Either
Long-term Earnings Growth Does Not Justify Valuation Premium Either
Of course, we need to keep in mind that since this sector is so top-heavy, the forward PE of the MAN affects overall sector valuations. As you can see in the table below (Table 2), MAN is trading with a premium to the sector. However, within the sector, companies with sky-high valuations are easier to find among smaller constituents (Chart 18). Valuations are elevated, while fundamentals are deteriorating Table 2The Largest Tech Companies Are Trading With A Premium To The Sector
Are We There Yet?
Are We There Yet?
Chart 18
Investment Implications While it is tempting to add to Technology on the back of this pullback, we recommend caution. Tech is oversold and recent volatility is a function of market panic, yet the stars have not yet aligned for the sector. Historically, Tech has delivered negative returns several months prior to rate hikes and underperformed the broad market. Economic normalization also brings a slowdown in demand for tech goods and services, which translates into less exciting sales and earnings growth, and margin compression. Although some froth has come off, valuations for the sector remain elevated, and the premium over the S&P 500 is not justified. The scorecard summarizes each of these points, and it is clear that, on balance, the sector has quite a few challenges ahead (Table 3). Table 3Technology Sector Scorecard
Are We There Yet?
Are We There Yet?
On a more optimistic note, this sell-off has been fast and furious, and the worst is most likely behind. We are underweight the Technology sector. Within the sector, we are underweight Semiconductors, and Hardware and Equipment. We are still overweight Software and Services for portfolio diversification purposes. The Software sector will be one of our next “deep dives.” Stay tuned. Are we there yet? No, we still have a few months to go. Structural Positioning While we reiterate our tactical underweighting of the Tech sector, we are bullish on it over the longer investment horizon. This sector is at the heart of US technological innovation, such as cloud computing, artificial intelligence, cybersecurity, chip design that powers EV and AV, and many others. The sector is home to some of the best American companies, which have powered US equities throughout the past decade, and will continue to do so for decades ahead. Bottom Line Despite a sell-off of NASDAQ and the Technology sector, we are not yet recommending increasing cyclical allocation to Tech: While technicals appear attractive, tighter monetary policy, the slowdown in demand for tech goods and services, pressures on profitability, and elevated valuations remain headwinds. We reiterate our underweight to the Technology sector on a tactical basis. We are structurally bullish. Irene Tunkel Chief Strategist, US Equity Strategy irene.tunkel@bcaresearch.com Recommended Allocation
Banks kicked off the Q4 earnings season in the US with generally positive results. Most major banks – BAC, JPM, C, MS, and WFC – topped analysts’ estimates for profit. USB and GS were the exceptions. In the case of Goldman Sachs, although the $12.64 billion…
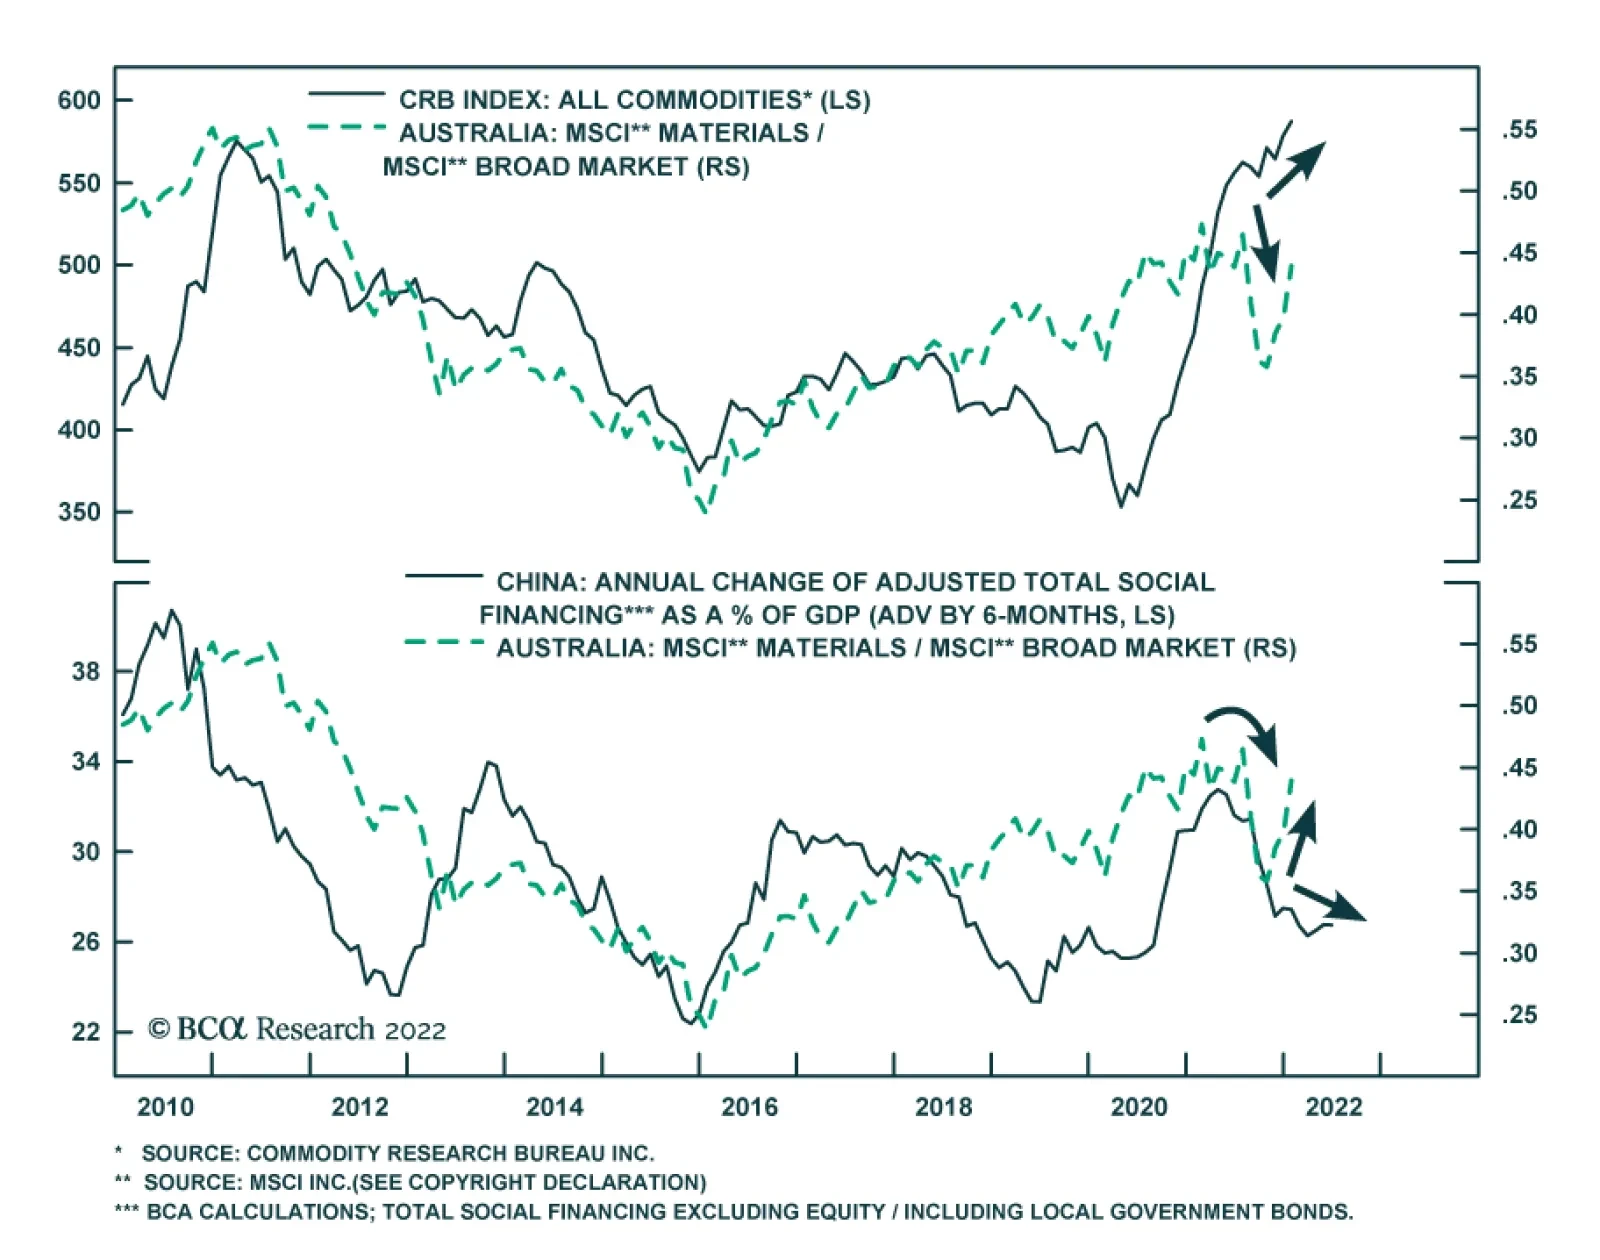
Australian material stocks underperformed the overall Aussie equity market for most of last year. It started out with just a slight underperformance amid positive absolute returns. However, the sector took a sharp turn for the worse at the end of July and…
Dear Client, The subject of cryptocurrencies elicits more emotion that any topic I can think of. As is true for the broader investment community, there is no unanimity of opinion among BCA strategists on the matter. This week, our Global Asset Allocation team is publishing a report taking a favorable view on NFTs. My report is far less sanguine on NFTs and the broader crypto landscape. I hope you enjoy the spirited debate. Best regards, Peter Berezin, Chief Global Strategist Highlights The price of Bitcoin and other cryptocurrencies has become increasingly correlated with the direction of equities. Stocks should recover over the coming months as bond markets stabilize and corporate earnings continue to expand thanks to a resurgent global economy. This could give cryptos a temporary lift. The long-term outlook for cryptocurrencies remains daunting, however. In most cases, anything that cryptocurrencies can do, the existing financial system can do better. Many of the most hyped blockchain applications, from DeFi to NFTs, will turn out to be duds. Concerns that cryptocurrencies are harming the environment, contributing to crime, and enriching a small group of early investors at the expense of everyone else will lead to increased regulatory scrutiny. Our long-term target for Bitcoin is $5,000. Investors looking to hedge their risks should consider going long Cardano, Solana, and Polkadot (three up-and-coming “proof of stake” coins) versus Bitcoin, Litecoin, and Doge (three doomed “proof of work” coins). The Cost Of Crypto Who pays for cryptocurrencies? That may seem like a simple question with a simple answer: The people who buy them!
Chart 1
Yet, as economists have long known, purchases can produce externalities – costs or benefits that are borne by someone other than the person making the purchase. Some purchases can produce positive externalities, such as when you buy nice flowers to plant in front of your house. Other purchases produce negative externalities, such as when you buy a product that harms the environment. The negative externalities arising from Bitcoin mining are well known. A single Bitcoin transaction consumes 14 times as much energy as 100,000 Visa transactions (Chart 1). Bitcoin’s annual electricity consumption exceeds that of Pakistan and its 217 million inhabitants (Chart 2). The growth in crypto mining is one reason why electricity prices are so high in many countries.
Chart 2
Chart 3
Crime is another negative externality that cryptocurrencies facilitate. Bitcoin first entered the popular lexicon in 2013 when its price briefly eclipsed $1,000 due to rising demand for the currency as a medium of exchange on Silk Road and other parts of the so-called dark web. Fast forward to today and crime continues to be a major problem for the crypto industry. According to Chainalysis, illicit addresses received $14 billion in 2021, almost double 2020 levels (Chart 3). Scamming revenue grew 82% while cryptocurrency theft rose 516%. Don’t Feed The Whales There is another cost arising from cryptocurrencies that is rarely mentioned – a cost borne by people who have never bought cryptocurrencies and probably assume they are immune from the vagaries of crypto markets: The holders of regular fiat money. Early investors in today’s most popular cryptocurrencies are sitting on huge profits. A recent study found that 1% of Bitcoin holders control 27% of supply. Ownership is even more concentrated for most other cryptocurrencies (Chart 4).
Chart 4
If these whales were to sell their coins, they could purchase billions of dollars of goods and services. But since there is no indication yet that the proliferation of cryptocurrencies has expanded the aggregate supply of goods and services, their purchasing power must come at someone else’s expense.1 Still Waiting Cryptocurrency proponents would counter that blockchain technologies will usher in a golden age of innovation. Based on this perspective, Bitcoin is a lot like Amazon, a company that created immense wealth for Jeff Bezos and other early shareholders, but has reshaped the global economy in a way that arguably left most people, including those who never bought Amazon stock, better off. The problem with this argument is that Bitcoin is nothing like Amazon. Chainalysis estimates that online merchants processed less than $3 billion in cryptocurrency transactions in 2020, a number that has barely grown over time (Chart 5). While updated numbers for 2021 will be released in February, our analysis of data from Coinmap suggests that the number of merchants accepting cryptocurrency increased less last year than in either 2017 or 2018 (Chart 6). This is consistent with anecdotal evidence which suggests that the vast majority of cryptocurrency transactions continue to be motivated by investment flows rather than e-commerce.
Chart 5
Chart 6
A Feature Not A Bug “Just wait and see,” crypto evangelists say. “Sure, Bitcoin has been around since 2008, but new applications are just around the corner.” There are good reasons to be skeptical of such pronouncements. The Bitcoin network can barely process five transactions per second, compared to over 20,000 for the Visa network (Chart 7). The fee for a Bitcoin transaction can fluctuate significantly, and is typically much greater than for a debit card (Chart 8). Chart 7We Apologize For The Wait
We Apologize For The Wait
We Apologize For The Wait
Chart 8It Costs A Lot To Fill Up The Crypto Tank
It Costs A Lot To Fill Up The Crypto Tank
It Costs A Lot To Fill Up The Crypto Tank
Bitcoin’s sluggishness is inherent to how it was designed. Due to their decentralized nature, blockchains must rely on elaborate procedures to prevent bad actors from taking control. Bitcoin and other popular cryptocurrencies such as Doge use the so-called “proof of work” algorithm. To see how this algorithm works in simple terms, think of spam email. One way of eliminating spam is to require everyone to waste $10 in electricity to send a single email. That is effectively how Bitcoin functions. It is secure, but it is also very clunky. An alternative to “proof of work” is “proof of stake.” Smaller cryptocurrencies such as Cardano and Solana use this algorithm, and Ethereum is in the process of migrating to it. Continuing with the spam analogy, imagine requiring everyone to put $10 down before they send an email. If the email is opened, the $10 is returned. If the email is deleted, the $10 is forfeited. A Solution In Search Of A Problem Proof of stake systems are arguably superior to proof of work systems since the former do not require wasteful energy consumption. But are they superior to the current financial system? That is far from clear. Listening to crypto enthusiasts, one would think that everyone is still using paper money, or perhaps shells or cattle, to make transactions. In fact, the global financial system is already nearly 100% digital. Digital transfer systems such as Zelle in the US and Interac in Canada permit instantaneous transfers at very little cost. Granted, cross-border payments are far from seamless. However, this largely reflects anti-money laundering rules and other regulations that banks must follow rather than some inherent technological limitations with, say, the SWIFT system. The DeFi Delusion Decentralized Finance, or DeFi, has become a hot topic of late. Like most things involving cryptocurrencies, there is more hype than substance. The idea that there will ever be large-scale crypto-denominated lending is wishful thinking. To see why, put yourself in the position of someone contemplating lending 25 bitcoins to a borrower who is interested in buying a house for, say, $1,000,000. On the one hand, if the price of bitcoin drops, you will likely be repaid, but in depreciated coins. On the other hand, if the price of bitcoin rises, you might not be repaid at all since the value of the loan will exceed the value of the house. Any way you cut it, there is no incentive to make the loan. There are other potential DeFi applications, such as those involving smart contracts, that could potentially prove useful. The Ethereum blockchain, where many of these contracts reside, is secured by ether (ETH). The market cap of ETH is currently $370 billion. How much ether is held for investment purposes and how much is held by people looking to make transactions on the Ethereum blockchain? It is impossible to be sure, but it would not surprise us if investment demand accounts for well over 90% of ETH holdings. It would be as if the price of oil rose to $1,000 per barrel, with 90% of that value driven by investment demand. Most people would agree that this would not be a sustainable situation. NFTs: Why So Ugly? Chart 9NFTs Have Taken Off
NFTs Have Taken Off
NFTs Have Taken Off
The popularity of non-fungible tokens (NFTs) has soared over the past year. During the past four weeks, more than $250 million of NFTs were traded on average every day, up from almost nothing at the beginning of 2021 (Chart 9). NFTs allow artists to transform their work into verifiable assets that can be listed and sold on the blockchain. Or at least that is the claim. When they were first introduced, the expectation was that the most desirable NFTs would turn out to be unique and beautiful. Instead, as the CryptoPunks collection aptly demonstrates, many turned out to be repetitive and ugly. Why? One plausible answer is that many NFT buyers are not really looking to acquire digital art. Instead, they are looking to buy supercharged proxies for the cryptocurrency in which the NFT is denominated. As evidence, consider that 99% of the discussions in NFT forums are about how much money NFT buyers hope to make rather than about the “art” itself. Shadow Crypto Supply If this interpretation is correct, it undermines one of the main selling points of cryptocurrencies: That they are limited in supply. Just like banks can create money out of thin air whenever they make loans, the blockchain can spawn synthetic assets such as NFTs that increase the effective supply of the underlying cryptocurrency.2 And that is just for a single cryptocurrency. There is nothing that obliges someone to list a smart contract on the Ethereum blockchain as opposed to any other blockchain. Indeed, there is no limit to the number of blockchains, and by extension, the number of cryptocurrencies that can be created. Chart 10 shows that there are currently more than 9,000 cryptocurrencies in circulation, up from 1,000 in 2017 and less than 100 in 2013. At least with gold, they are not adding any new elements to the periodic table.
Chart 10
The Paradox Of Low Gas Fees Competition among blockchains will favor those that offer the lowest “gas fees,” that is, those that require only a small amount of cryptocurrency to update their ledgers. As users abandon blockchains with high gas fees, the prices of their cryptocurrencies will fall. The cryptocurrencies of the more efficient blockchains will benefit, but probably not as much as one might assume. Just as the demand for petrol would decline if automobiles became much more fuel efficient but miles driven did not rise much, falling gas fees could reduce demand for cryptocurrencies unless activity on their blockchains increased proportionately more than the decline in prices. Crypto prices may fall dramatically if governments offer blockchain networks as a public good. The rollout of Central Bank Digital Currencies (CBDCs) could pave the way for this development. Concluding Thoughts On The Current Market Environment And Long-Term Outlook For Cryptos The price of Bitcoin and other cryptocurrencies has become increasingly correlated with the direction of equities (Chart 11). As we noted in our first report of the new year, average returns for the S&P 500 in January have been negative since 2000. This year has been especially trying given the rapid ascent in bond yields. Our end-2022 target for the US 10-year Treasury yield is 2.25%. Hence, while we expect yields to rise over the remainder of the year, the process should be a lot more gradual than over the past few weeks. Equities often experience a period of indigestion when yields rise sharply. However, as we stressed last week, stocks typically rebound as long as yields do not end up rising to prohibitive levels. The bull-bear spread in this week’s AAII poll fell back to its pandemic lows, a positive contrarian indicator for stocks (Chart 12). With global growth still firmly above trend, corporate earnings should rise by enough to propel stocks into positive territory for the year. A rebound in stock prices, in turn, could give cryptocurrencies a temporary lift. Chart 11Cryptocurrency Prices Have Become Increasingly Correlated With Stocks
Cryptocurrency Prices Have Become Increasingly Correlated With Stocks
Cryptocurrency Prices Have Become Increasingly Correlated With Stocks
Chart 12The Bull-Bear Ratio Is Back To Its Pandemic Lows
The Bull-Bear Ratio Is Back To Its Pandemic Lows
The Bull-Bear Ratio Is Back To Its Pandemic Lows
Nevertheless, the long-term outlook for cryptocurrencies remains daunting. In most cases, anything that cryptocurrencies can do, the existing financial system can do better. Many of the most hyped blockchain applications, from DeFi to NFTs, will turn out to be duds. Meanwhile, concerns that cryptocurrencies are harming the environment, contributing to crime, and enriching a small group of early investors at the expense of everyone else will lead to increased regulatory scrutiny. Chart 13New Money Versus Old Money
New Money Versus Old Money
New Money Versus Old Money
The prices of the most popular cryptocurrencies do not reflect this eventuality. Even after falling 32% from its highs, the aggregate market capitalization of cryptocurrencies is still only slightly less than the value of the entire stock of US dollars in circulation (Chart 13). Our long-term target for Bitcoin is $5,000. Investors looking to hedge their risks should consider going long Cardano, Solana, and Polkadot (three up-and-coming “proof of stake” coins) versus Bitcoin, Litecoin, and Doge (three doomed “proof of work” coins). Peter Berezin Chief Global Strategist peterb@bcaresearch.com Footnotes 1 One way that holders of fiat money could suffer is if the presence of cryptocurrencies reduced the demand for dollars, euros, and other central bank issued currencies. If that were to happen, inflation would rise as people sought to dispose of unwanted fiat currency by buying goods and services. Alternatively, if central banks wanted to constrain inflation, they would have to shrink the money supply by selling income-generating assets. Either way, the public would be worse off. 2 For instance, consider Alice and Bob. Both wish to have a certain amount of exposure to ETH in their investment portfolios. Suppose Bob uses some of his ETH to buy an item from the “Dopey Duck” collection that Alice has just minted. If Bob regards his NFT as a substitute for the ETH he previously held, he will not want to buy more ETH to replace the ETH he lost. In contrast, Alice will end up with more ETH than she previously owned, and hence, will need to sell some of it. All things equal, this will lead to a lower price for ETH. Global Investment Strategy View Matrix
Image
Special Trade Recommendations Current MacroQuant Model Scores
Image
Highlights Our top five “black swan” risks for 2022: Social unrest in China; Russian invasion of all of Ukraine; unilateral Israeli strikes on Iran; a cyber attack that goes kinetic; and a failure of OPEC 2.0. Too early to buy the dip on Russian assets: President Biden says Putin will probably “move in” and re-invade Ukraine, Russian embassy staff have been evacuating Ukraine, the US and UK have been providing more arms to Ukraine, and the US is warning of a semiconductor embargo against Russia. Talks resume in Geneva on Friday. Tactically investors should take some risk off the table, especially if linked to Russia and Europe. Stay short the Russian ruble and EM Europe; stay short the Chinese renminbi and Taiwanese dollar; stay long cyber security stocks; and be prepared for oil volatility. Convert tactical long equity trades to relative trades: long large caps versus small caps, long defensives versus cyclicals, and long Japanese industrials versus German industrials. Feature Chart 1Recession Probability And Yield Curve
Recession Probability And Yield Curve
Recession Probability And Yield Curve
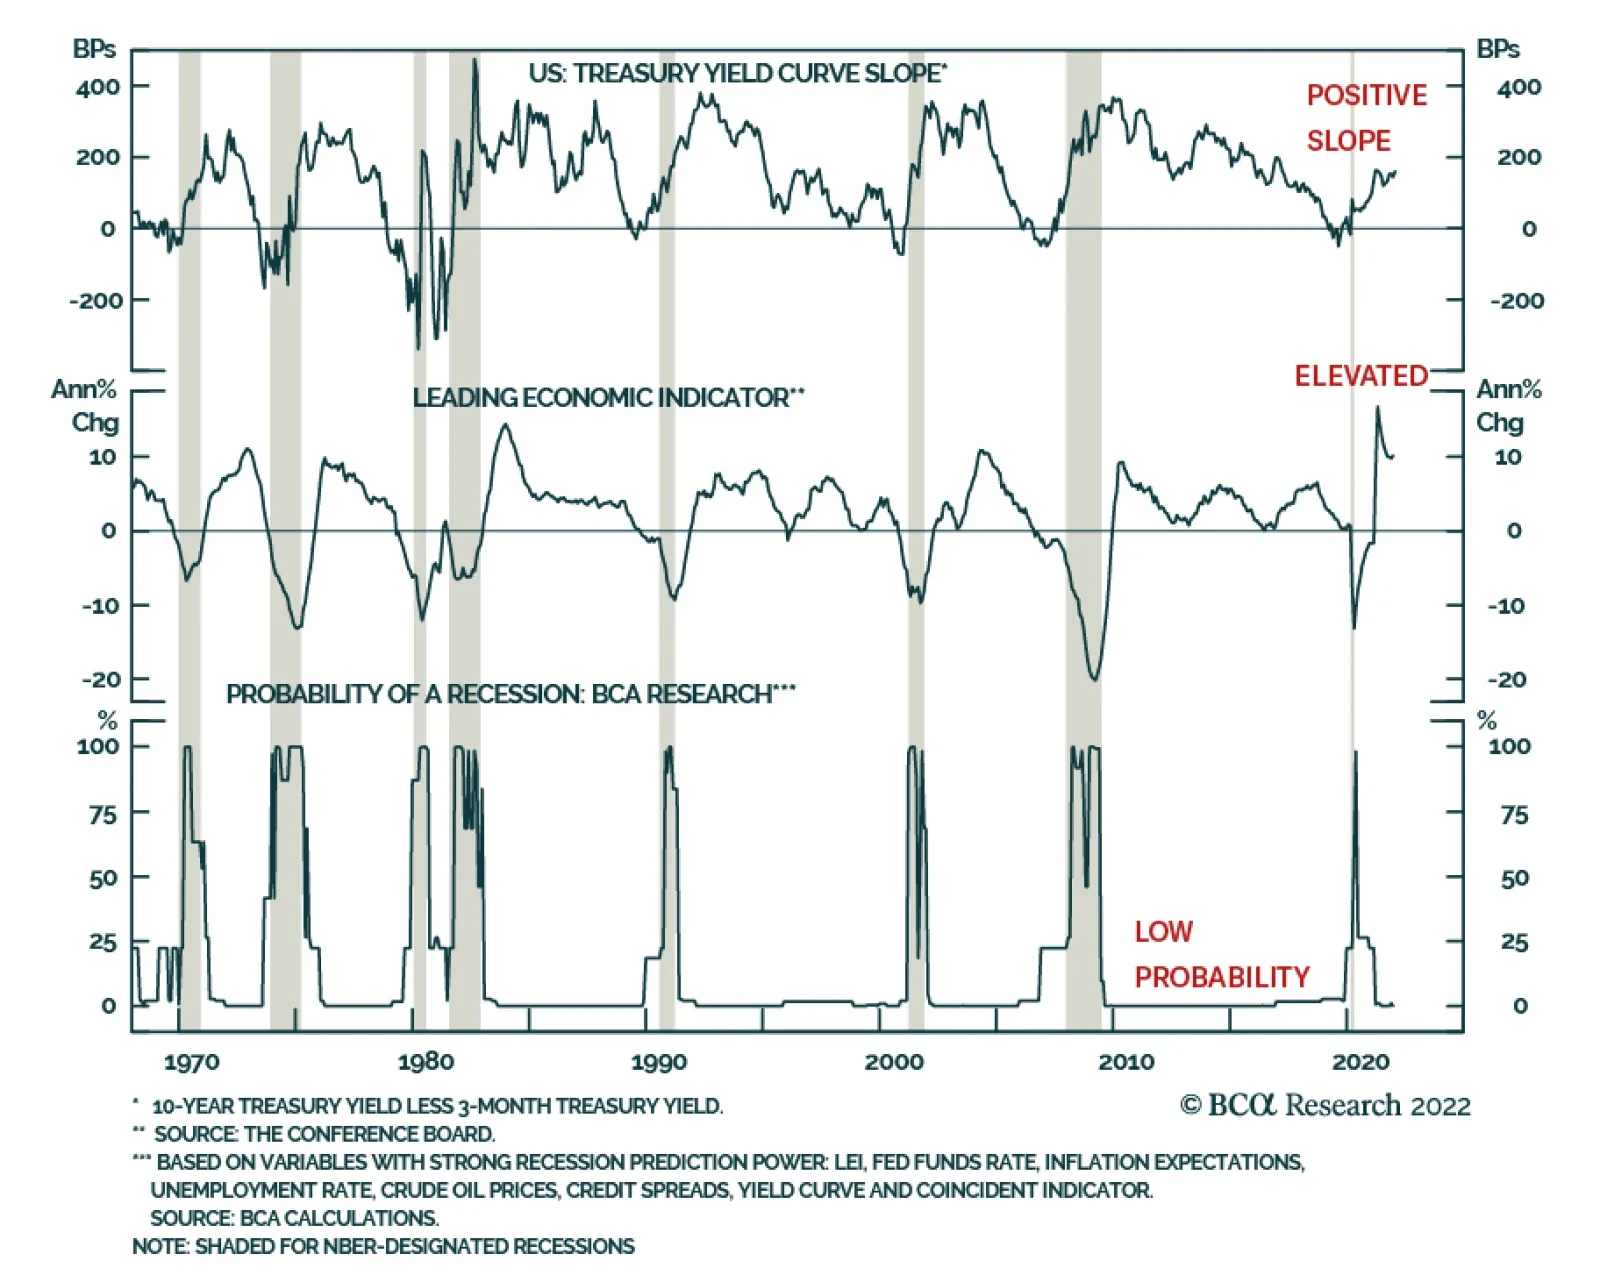
The 2/10-year yield curve is flattening and now stands at 79 bps, while the implied probability of a recession over the next 12 months troughed at 5.9% in April 2021, and as of December 2021 stood at 7.7% (Chart 1). Apparently stagflation and recession are too high of a probability to constitute a “black swan” risk for this year. Black swans are not only high impact but also low probability. In this year’s annual “Five Black Swan” report, the last of our 2022 outlook series, we concentrate on impactful but unlikely events. These black swans emerge directly from the existing themes and trends in our research – they are not plucked at random. The key regions are highlighted in Map 1.
Chart
Black Swan #1: Major Social Unrest Erupts In China China’s financial problems are front and center risks for investors this year. They qualify as a “Gray Rhino” rather than “Black Swan” risk.1 It is entirely probable that China’s financial and property sector distress will negatively impact Chinese and global financial markets in 2022. What investors are not expecting is an eruption of social unrest in China that fouls up the twentieth national party congress this fall and calls into question the Communist Party’s official narrative that it is handling the pandemic and the underlying economic transition smoothly. Social unrest is a major risk around the world in the face of the new bout of inflation. Most of the democracies have already changed governments since the pandemic began, recapitalizing their political systems, but major emerging markets – Russia, India, Turkey, Brazil – have not done so. They have seen steep losses of popular support for both political leaders and ruling parties. There is little opinion polling from China and people who are surveyed cannot speak openly. It is possible that the government’s support has risen given its minimization of deaths from the pandemic. But it is also possible that it has not. Beijing’s policies over the past few years have had a negative impact on the country’s business elite and foreign relations. There are disgruntled factions within China, though the current administration has a tight grip over the main organs of power. Since President Xi is trying to clinch his personal rule this fall, sending China down a path of autocracy that proved disastrous under Chairman Mao Zedong, it is possible he will face surprise resistance. China’s economic growth is decelerating, clocking in at a 4.0% quarter-on-quarter growth rate at the end of last year. While authorities are easing policy to secure the recovery, there is a danger of insufficient support. Private sentiment will remain gloomy, as reflected by weak money velocity and a low propensity to spend among both businesses and households (Chart 2). The government will continue to be repressive in the lead up to the political reshuffle. At least for the first half of the year the economy will remain troubled. Structurally China is ripe for social unrest. It suffers from high income inequality and low social mobility, comparable to the US and Brazil, which are both struggling with political upheaval (Chart 3). Chart 2China's Private Sector Still Depressed
China's Private Sector Still Depressed
China's Private Sector Still Depressed
Chart 3
In addition China is keeping a stranglehold over Covid-19. This “Zero Covid” policy minimizes deaths but suppresses economic activity. Strict policy has also left the population with a very low level of natural immunity and the new Omicron variant is even more contagious than other variants. Hence the regime is highly likely to double down to prevent an explosive outbreak. The service side of the economy will continue to suffer if strict lockdowns are maintained, exacerbating household and business financial difficulties (Chart 4). Yet in other countries around the world, government decisions to return to lockdowns have sparked unrest. Chart 4Zero Covid Policy: Not Sustainable Beyond 2022
Zero Covid Policy: Not Sustainable Beyond 2022
Zero Covid Policy: Not Sustainable Beyond 2022
China’s “Misery Index” (unemployment plus inflation) is rising sharply. While misery is ostensibly lower than that of other emerging markets, China’s unemployment data is widely known to be unreliable. If we take a worst-case scenario, looking at youth unemployment and fuel prices, misery is a lot higher (Chart 5). The youth, who are having the hardest time finding jobs, are also the most likely to protest if conditions become intolerable (Chart 6). Of course, if social unrest is limited to students, it will lack support among the wider populace. But it is inflation, not youth activism, that is the reason for China’s authorities to be concerned, as inflation is a generalized problem that affects workers as well as students. Chart 5China's Misery Index Is Higher Than It Looks
China's Misery Index Is Higher Than It Looks
China's Misery Index Is Higher Than It Looks
Chart 6China's Troubled Youth
China's Troubled Youth
China's Troubled Youth
Why would protesters stick their necks out knowing that the Communist Party will react ferociously to any sign of instability during President Xi Jinping’s political reshuffle? True, mainland Chinese do not have the propensity to political activism that flared up in protests in Hong Kong in recent years. Also the police state will move rapidly to repress any unrest. Yet the entire focus of Xi Jinping’s administration, since 2012, has been the restoration of political legitimacy and prevention of popular discontent. Xi has cracked down on corruption, pollution, housing prices, education prices, and has announced his “Common Prosperity” agenda to placate the low and middle classes.2 The regime has also cracked down on the media, social media, civil society, and ideological dissent to prevent political opposition from taking root. If the government were not concerned about social instability, it would not have been adopting these policies. Disease, often accompanied by famines or riots, has played a role in the downfall of six out of ten dynasties, so Beijing will not be taking risks for granted (Table 1). Table 1Disease And Downfall Of Chinese Dynasties
Five Black Swans For 2022
Five Black Swans For 2022
Social instability would have a major impact as it would affect China’s stability and global investor sentiment toward China. Western democracies would penalize China for violations of human rights, leaving China even more isolated. Bottom Line: Investors should stay short the renminbi and neutral Chinese equities. Foreign investors should steer clear of Chinese bonds in the event of US sanctions. After the party congress this fall there will be an opportunity to reassess whether Xi Jinping will “let a hundred flowers bloom,” thus improving the internal and external political and investment environment, but this is not at all clear today. Black Swan #2: Russia Invades All (Not Just Part) Of Ukraine US-Russia relations are on the verge of total collapse and Russian equities have sold off, in line with our bearish recommendations in reports over the past two years. Russia’s threat of re-invading Ukraine is credible. Western nations are still wishy-washy about the counter-threat of economic sanctions, judging by German Chancellor Olaf Scholz’s latest comments, and none are claiming they will go to war to defend Ukraine.3 Russia is looking to remove the threat of Ukraine integrating militarily and economically with the West. The US and UK are providing Ukraine with defense weaponry even as Russia specifically demands that they cease to do so. President Putin may choose short-term economic pain for long-term security gain. The consensus view is that if Russia does invade, it will undertake a limited invasion. But what if Russia invades all of Ukraine? To be clear, a full invasion is unlikely because it would be far more difficult and costly for Russia. It would go against Putin’s strategy of calculated risk and limited conflict. Table 2 compares Russia and Ukraine in size and strength, alongside a comparison of the US and Iraq in 2002. This is not a bad comparison given that Ukraine’s and Iraq’s land area and active military personnel are comparable. Table 2Russia-Ukraine Balance Of Power 2022 Compared To US-Iraq 2002
Five Black Swans For 2022
Five Black Swans For 2022
Russia would be biting off a much bigger challenge than the US did. Ukraine’s prime age population is 2.5 times larger than Iraq’s in 2002, and its military expenditure is three times bigger. The US GDP and military spending were 150 and 250 times bigger than Iraq’s, while Russia’s GDP and military spending are about ten times bigger than Ukraine’s today. Iraq was not vital to American national security, whereas Ukraine is vital to Russia; Russia has more at stake and is willing to take greater risks. But Ukraine is in better shape to resist Russian occupation than Iraq was to resist American. The point is that the US invasion went smoothly at first, then got bogged down in insurgency, and ultimately backfired both in political and geopolitical terms. Russia would be undertaking a massive expense of blood and treasure that seems out of proportion with its goal, which is to neutralize Ukraine’s potential to become a western defense ally and host of “military infrastructure.” However, there are drawbacks to partial invasion. The remainder of the Ukrainian state would be unified and mobilized, capable of integrating with the western world, and willing to support a permanent insurgency against Russian troops in eastern Ukraine. Russia has forces in Belarus, Crimea, and the Black Sea, as well as on Ukraine’s eastern border, giving rise to fears that Russia could attempt a three-pronged invasion of the whole country. In short, it is conceivable that Russian leaders could make the Soviet mistake of overreaching in the military aims, or that a war in eastern Ukraine could inadvertently expand into the west. If Russia tries to conquer all of Ukraine, the global impact will be massive. A war of this size on the European continent for the first time since World War II would shake governments and populations to their bones. The borders with Poland, Romania, the Baltic states, Slovakia, Hungary, Finland and the Black Sea area would become militarized (Map 2).
Chart
NATO actions to secure its members and fortify their borders would exacerbate tensions with Russia and fan fears of a wider war. Trade flows would become subject to commerce destruction, affecting even neutral nations, including in the Black Sea. Energy supplies would tighten further, sending Russia and probably Europe into recession. The disruption to business and travel across eastern Europe would be deep and lasting, not only due to sanctions but also due to a deep risk-aversion that would affect foreign investors in the former Soviet Union and former Warsaw Pact. Germany would be forced to quit sitting on the fence, as it would be pressured by the US and the rest of Europe to stand shoulder to shoulder in the face of such aggression. Finland and Sweden would be much more likely to join NATO, exacerbating Russia’s security fears. Russia would suffer a drastic loss of trade, resulting in recession, and its currency collapse would feed inflation (Chart 7). Chart 7Inflation Poses Long-Term Threat To Putin Regime
Inflation Poses Long-Term Threat To Putin Regime
Inflation Poses Long-Term Threat To Putin Regime
Ultimately the consequences would be negative for the Putin regime and Russia as a result of recession and international isolation. But in the short run the Russian people would rally around the flag and support a war designed to prevent NATO from stationing missiles on their doorstep. And their isolation would not be total, as they would strengthen ties with China and conduct trade via proxy states in the former Soviet Union. Bottom Line: A full-scale invasion of all of Ukraine is highly unlikely because it would be so costly for Russia in military, economic, and political terms. But the probability is not zero, especially because a partial re-invasion could lead to a larger war. While global investors would react in a moderate risk-off matter to a limited war in eastern Ukraine, a full-scale war would trigger a massive global flight to safety as it would call into question the entire post-WWII peace regime in Europe. Black Swan #3: Israel Attacks Iran The “bull market in Iran tensions” continues as there is not yet a replacement for the 2015 nuclear deal that the US abrogated. Our 2022 forecast that the UAE would get caught in the crossfire was confirmed on January 17 when Iran-backed Houthi rebels expanded their range of operations and struck Abu Dhabi (Map 3). The secret war is escalating and US-led diplomacy is faltering.
Chart
Iran is not going to give up its nuclear program. North Korea achieved nuclear arms and greater military security and is now developing first and second strike capabilities. Meanwhile Ukraine, which faces another Russian invasion, exemplifies what happens to regimes that give up nuclear arms (as do Libya and Iraq). Iran appears to be choosing the North Korean route. While we cannot rule out a minor agreement between President Biden and Iranian President Ebrahim Raisi, we can rule out a substantial deal that halts Iran’s nuclear and missile progress. Here’s why: Any day now Iran could reach nuclear “breakout capacity,” with enough highly enriched uranium to construct a nuclear device (Table 3).4 Table 3Iran’s Violations Of 2015 Nuclear Deal Since US Exit
Five Black Swans For 2022
Five Black Swans For 2022
Within Iran’s government, the foreign policy doves have been humiliated and kicked out of office while the hawks are fully in control. No meaningful agreement can be reached before 2024 because of the risk that the US will change ruling parties again and renege on any promises. Iran is highly incentivized to make rapid progress on its nuclear program now. The US will not be able to lead the P5+1 coalition to force Iran to halt its program because of its ongoing struggles with Russia and China. China is striking long-term cooperation deals with Iran. Israel has a well-established record of taking unilateral action, specifically against regional nuclear programs, known as the “Begin Doctrine.”5 Israel’s threats are credible on this front, although Iran is a much greater operational challenge than Iraq or Syria. Iran’s timeline from nuclear breakout to deliverable nuclear weapon is 12-24 months.6 Iran’s missile program is advanced. Missile programs cannot be monitored as easily as nuclear activity, so foreign powers base the threshold on nuclear capability rather than missile capability. Iran had a strong incentive to move slowly on its nuclear and missile programs in earlier years, to prevent US and Israeli military interference. But as it approaches breakout capacity it has an incentive to accelerate its tempo to a mad dash to achieve nuclear weaponization before the US or Israel can stop it. Now that time may have come. The Biden administration is afraid of higher oil prices and Israeli domestic politics are more divided and risk-averse than before. And yet Iran’s window might close in 2025, as the US could turn aggressive again depending on the outcome of the 2024 election. Hence Iran has an incentive to make its dash now. The US and Israel will restate their red lines against Iranian nuclear weaponization and brandish their military options this year. But the Biden administration will be risk-averse since it does not want to instigate an oil shock in an election year. Israel is more likely than the US to react quickly and forcefully since it is in greatest danger if Iran surprises the world with rapid weaponization. Here are the known constraints on unilateral Israeli military action: Limited Israeli military capability: Israel would have to commit a large number of aircraft, leaving its home front exposed, and even with US “bunker buster” bombs it may not penetrate the underground Fordow nuclear facility.7 Limited Israeli domestic support: The Israeli public is divided on whether to attack Iran. The post-Netanyahu government recently came around to endorsing the US’s attempt to renegotiate the nuclear deal. Limited US support: Washington opposes Israeli unilateralism that could entangle the US into a war. Israel cannot afford to alienate the US, which is its primary security guarantor. Iranian instability: The Iranian regime is under economic distress due to “maximum pressure” sanctions. It is vulnerable to social unrest, not least because of its large youth population. These constraints have been vitiated in various ways, which is why we raise this Israeli unilateralism as a black swan risk: Where there’s a will, there’s a way: If Israel believes its existence will be threatened, it will be willing to take much greater operational risks. It has already shown some ability to set back Iran's centrifuge program beyond the expected.8 Israeli opinion will harden if Iran breaks out: If Iran reaches nuclear breakout or tests a nuclear device, Israeli opinion will harden in favor of military strikes. Prime Minister Naftali Bennett has an incentive to take hawkish actions before he hands the reins of government over to a partner in his ruling coalition as part of a power-sharing agreement. The ruling coalition is so weak that a collapse cannot be ruled out. US opposition could weaken: Biden will have to explore military options if talks fail and Iran reaches nuclear breakout capacity. Once the midterms are over, Israel may have even more freedom to act, while a gridlocked Biden may be looking to shift his focus to foreign policy. Iranian stability: Iran’s social instability has not resulted in massive unrest or regime fracture despite years of western sanctions and a global recession/pandemic. Yet now energy prices are rising and Iran has less reason to believe sanction regimes will be watertight. From Israeli’s point of view, even regime change in Iran would not remove the nuclear threat once nuclear weapons are obtained. Finally, while Israel cannot guarantee that military strikes would successfully cripple Iran’s nuclear program and prevent weaponization, Israel cannot afford not to try. It would be a worse outcome to stand idly by while Iran gets a nuclear weapon than to attack and fail to set that program back. Hence the likeliest outcome over the long run is that Iran pursues a nuclear weapon and Israel attacks to try to stop it, even if that attack is likely to fail (Diagram 1). Diagram 1Game Theory: Will Israel Attack Iran?
Five Black Swans For 2022
Five Black Swans For 2022
Bottom Line: A unilateral Israeli strike is unlikely but would have a massive impact, as 21% of global oil and 26% of natural gas flows through the Strait of Hormuz, and conflict could disrupt regional energy production and/or block passage through the strait itself. Black Swan #4: Cyber Attacks Spill Into Real World Investors are very aware of cyber security risks – it holds a respectable though not commanding position in the ranks of likely crisis events (Table 4). Our concern is that a cyber attack could spill over into the real world, impairing critical infrastructure, supply chains, and/or prompting military retaliation. Table 4Cyber Events Underrated In Consensus View Of Global Risks
Five Black Swans For 2022
Five Black Swans For 2022
Russian attacks on US critical infrastructure by means of ransomware gangs disrupted a US fuel pipeline, meat-packing plant, and other critical infrastructure in 2021. Since then the two countries have engaged in negotiations over cyber security. The Russian Federal Security Bureau has cracked down on one of the most prominent gangs, REvil, in a sign that the US and Russia are still negotiating despite the showdown over Ukraine.9 Yet a re-invasion of Ukraine would shatter any hope of cooperation in the cyber realm or elsewhere. Russia is already using cyberattacks against Ukraine and these activities could expand to Ukraine’s partners if the military conflict expands. Should the US and EU impose sweeping sanctions that damage Russia’s economy, Russia could retaliate, not only by tightening energy supply but also by cyber attacks. Any NATO partners or allies would be vulnerable, though some states will be more reactive than others. Interference in the French election, for example, would be incendiary. The key question is: if Russia strikes NATO states with damaging cyber attacks, at what point would it trigger Article V, the mutual defense clause? There are no established codes of conduct or red lines in cyber space, so the world will have to learn each nation’s limits via confrontation and retaliation. Similar cyber risks could emerge from other conflicts. China is probably not ready to invade Taiwan but it has an interest in imposing economic costs on the island ahead of this fall’s midterm elections. Taiwan’s critical role in the semiconductor supply chain means that disruptions to production would have a global impact. Israel and the US have already used cyber capabilities to attack Iran and set back its nuclear program. These capabilities will be necessary as Iran approaches breakout capacity. Yet Iran could retaliate in a way that disrupts oil supplies. North Korea began a new cycle of provocations last September, accelerated missile tests over the past four months, and is dissatisfied with the unfinished diplomatic business of the Trump administration. In the wake of the last global crisis, 2010, it staged multiple military attacks against South Korea. South Korea may be vulnerable due to its presidential elections in May. The semiconductor or electronics supply chain could be interrupted here as well as in Taiwan. Bottom Line: There is no code of conduct in cyber space. As geopolitical tensions rise, and nations test the limits of their cyber capabilities, there is potential for critical infrastructure to be impaired. This could exacerbate supply chain kinks or provoke kinetic responses from victim nations. Black Swan #5: OPEC 2.0 Falls Apart The basis of the OPEC 2.0 cartel is Russian cooperation with Saudi Arabia to control oil supply and manage the forward price curve. Backwardation, when short-term prices are higher than long-term, is ideal for these countries since they fear that long-term prices will fall. In a world where Moscow and Riyadh both face competition from US shale producers as well as the green energy revolution, cooperation makes sense. Yet the two sides do not trust each other. Cooperation broke down both in 2014 and 2020, sending oil prices plunging. Falling global demand ignited a scramble for market share. Interestingly, Russian military invasions have signaled peak oil price in 1979, 2008, and 2014. Russia, like other petro-states, has greater room for maneuver when oil revenues are pouring in. But high prices also incentivize production, disincentivize cartel discipline, and trigger reductions in global demand (Chart 8). Chart 8Russian Invasions And Oil Price Crashes
Russian Invasions And Oil Price Crashes
Russian Invasions And Oil Price Crashes
Broadly speaking, Saudi oil production rose modestly during times of Russian military adventures, while overall OPEC production was flat or down, and Russian/Soviet production went up (Chart 9). Chart 9Saudi And OPEC Oil Production During Russian Military Adventures
Saudi And OPEC Oil Production During Russian Military Adventures
Saudi And OPEC Oil Production During Russian Military Adventures
Since 2020, we have held that OPEC 2.0 would continue operating but that the biggest risk would come in the form of a renewed US-Iran nuclear deal that freed up Iranian oil exports. In 2014, the Saudis increased production in the face of the US shale threat as well as the Iranian threat. This scenario is still possible in 2022 but it has become a low-probability outcome. Even aside from the Iran dynamic, there is some probability that Russo-Saudi cooperation breaks down as global growth decelerates and new oil supply comes online. Bottom Line: The world’s inflation expectations are elevated and closely linked to oil prices. Yet oil prices hinge on an uneasy political agreement between Russia and Saudi Arabia that has fallen apart twice before. If Russia invades Ukraine, or if US withdraws sanctions on Iran, for example, then Saudi Arabia could make a bid to expand its market share and trigger price declines in the process. Two Bonus Black Swans: Turkey And Venezuela Turkey lashes out: Our Turkish Political Capital Index shows deterioration for President Recep Erdogan’s political capital across a range of variables (Table 5). With geopolitical pressures increasing, and domestic politics heating up ahead of the 2023 elections, Erdogan’s behavior will become even more erratic. His foreign policy could become aggressive, keeping the lira under pressure and/or weighing on European assets. Table 5Turkey: Erdogan’s Political Capital Wearing Thin
Five Black Swans For 2022
Five Black Swans For 2022
Venezuela’s Maduro falls from power: Venezuelan regime changes often follow from military coups. These coups do not only happen when oil prices collapse – sometimes the army officers wait to be sure prices have recovered. Coup-throwers want strong oil revenues to support their new rule. An unexpected change of regimes would affect the oil market due to this country’s giant reserves. Bottom Line: Turkey’s political instability could result in foreign aggression, while Venezuela’s regime could collapse despite the oil price recovery. Investment Takeaways We are booking profits on our tactical long trades on large caps and defensive sectors. We will convert these to relative trades: long large caps over small caps, and long defensives over cyclicals. We also recommend converting our tactical long Japan trade into long Japanese industrials / short German industrials equities. If US-Russia diplomacy averts a war we will reconsider. Matt Gertken Vice President Geopolitical Strategy mattg@bcaresearch.com Footnotes 1 “Gray Rhino” is a term coined by author Michele Wucker to describe large and probable risks that people neglect or avoid. For more, see thegrayrhino.com. 2 Xi Jinping recently characterized the “common prosperity” agenda as follows: “China has made it clear that we strive for more visible and substantive progress in the well-rounded development of individuals and the common prosperity of the entire population. We are working hard on all fronts to deliver this goal. The common prosperity we desire is not egalitarianism. To use an analogy, we will first make the pie bigger, and then divide it properly through reasonable institutional arrangements. As a rising tide lifts all boats, everyone will get a fair share from development, and development gains will benefit all our people in a more substantial and equitable way.” See World Economic Forum, “President Xi Jinping’s message to The Davos Agenda in full,” January 17, 2022, weforum.org. 3 Chancellor Scholz, when asked whether Germany would avoid using the Nord Stream II pipeline if Russia re-invaded Ukraine, said, "it is clear that there will be a high cost and that all this will have to be discussed if there is a military intervention against Ukraine.” He was speaking with NATO Secretary-General Jens Stoltenberg. See Hans Von Der Burchard, “Scholz: Germany will discuss Nord Stream 2 penalties if Russia attacks Ukraine,” Politico, January 18, 2022, politico.eu. 4 For the Begin Doctrine, see Meir Y. Soloveichik, “The Miracle of Osirak,” Commentary, April 2021, commentary.org. 5 The estimate of 12-24 months to mount a nuclear warhead on a missile has been cited by various credible sources, including David Albright and Sarah Burkhard, “Highlights of Iran’s Perilous Pursuit of Nuclear Weapons,” Institute for Science and International Security, August 24, 2021, isis-online.org, and Eric Brewer and Nicholas L. Miller, “A Redline for Iran?” Foreign Affairs, December 23, 2021, foreignaffairs.com. 6 See Edieal J. Pinker, Joseph Szmerekovsky, and Vera Tilson, “Technical Note – Managing a Secret Project,” Operations Research, February 5, 2013, pubsonline.informs.org, as well as “What Can Game Theory Tell Us About Iran’s Nuclear Intentions?” Yale Insights, March 17, 2015, insights.som.yale.edu. 7 See Josef Joffe, “Increasingly Isolated, Israel Must Rely On Nuclear Deterrence,” Strategika 35 (September 2016), Hoover Institution, hoover.org. 8 The sabotage of the Iran Centrifuge Assembly Center at the Natanz nuclear facility in July 2020 “set back Iran’s centrifuge program significantly and continues to do so,” according to David Albright, Sarah Burkhard, and John Hannah, “Iran’s Natanz Tunnel Complex: Deeper, Larger Than Expected,” Institute for Science and International Security, January 13, 2022, isis-online.org. For a recent positive case regarding Israel’s capabilities, see Mitchell Bard, “Military Options Against Iran,” Jewish Virtual Library, American-Israeli Cooperative Enterprise, January 2022, jewishvirtuallibrary.org. 9 For the FSB and REvil, see Chris Galford, “Russian FSB arrests members of REvil ransomware gang following attacks on U.S. infrastructure,” Homeland Preparedness News, January 18, 2022, homelandprepnews.com. For the Colonial Pipeline and JBS attacks, and other ransomware attacks, see Jonathan W. Welburn and Quentin E. Hodgson, “How the United States Can Deter Ransomware Attacks,” RAND Blog, August 9, 2021, rand.org. Strategic Themes Open Tactical Positions (0-6 Months) Open Cyclical Recommendations (6-18 Months)