Equities

Highlights On US inflation and the Fed: If the Fed adheres to its mandate, it has no choice but to hike rates until core inflation drops toward 2% (from its current level above 4%). Yet, share prices will sell off before inflation converges toward the Fed’s target. On US TIPS yields: Rising TIPS yields will depress share prices in the richly valued equity markets like the US, support the greenback, and curtail portfolio flows into EM for a period of time. On China: Despite stimulus, China’s business cycle will continue disappointing over the near-term. Besides, a bottom in money/credit indicators does not always herald an imminent and sustainable equity rally. On financial market divergences: Major selloffs evolve in phases resembling domino effect-like patterns. In contrast, corrections are abrupt, and the majority of markets drop concurrently. Hence, the nature of current market dynamics is more consistent with a major selloff than a short-term correction. On regional allocation within a global equity portfolio: Overweight the euro area and Japan, underweight the US and EM. Feature Ms. Mea is a long-time BCA client and an avid follower of the Emerging Markets Strategy (EMS) service. Since 2017, I have been meeting with her twice a year to exchange thoughts on the global macro environment, to discuss the nuances of our views and to elaborate on investment strategy. We always publish our conversations for the benefit of all EMS clients. This virtual meeting took place earlier this week. Chart 1A Technical Breakout Is In US Bond Yields
A Technical Breakout Is In US Bond Yields
A Technical Breakout Is In US Bond Yields
Ms. Mea: It has been two years since we last met in person. I did not imagine that world travel would stay so depressed for so long when the pandemic began two years ago. I have also been surprised by the recent behavior of financial markets. There have been divergences that I cannot reconcile, such as the woes in China’s real estate sector and resilient commodity prices, the diverging performance of the S&P 500, US small caps and a significant portion of NASDAQ-listed stocks. I will ask you about these later. But let’s start with your main macro themes. Since early last year, you have been advocating two macro themes: (1) China’s slowdown; and (2) rising and non-transitory US inflation. They were controversial a year ago but have now become widely accepted in the investment community. Financial markets have moved a great deal to reflect these macro themes. Don’t you think financial markets have already fully priced in these macro trends? Answer: You are right that these narratives have become well known and financial markets have been moving to price in these developments. However, our bias is that these themes are not yet fully priced in and these macro forces will continue to impact financial markets over the near term. Let’s first discuss US inflation and interest rate moves. Chart 1 illustrates that US government bond yields have broken above major resistance levels. Such a breakout technically entails higher yields. Odds are that US long-term bond yields will move up by another 50 basis points in the months ahead before they pause or reverse. The fundamental justification for higher US bond yields is as follows: The inflation genie is out of the bottle in the US. If the Fed adheres to its inflation mandate, it has no choice but to hike rates until core inflation drops toward 2%. In December, trimmed-mean CPI and median CPI printed 4.8% and 3.8% respectively, well above the Fed’s preferred range of 2-2.25% for core inflation (Chart 2). Critically, these inflation measures are not impacted by volatile components. These measures strip out outliers like used and new car prices, auto parts, as well as energy and food. The core CPI and PCE inflation measures will drop this year but super core inflation will remain north of 3%, well above the Fed’s preferred range. Importantly, a wage inflation spiral is already underway in the US. Employees have experienced substantial negative wage growth in real terms in the past 12 months. Labor shortages are prevalent, and the employee quit rate is very high. Employees are demanding very high wage growth and employers will have little choice but to meet these demands (Chart 3). Chart 2US Super Core Inflation Suggests Broad-Based Inflationary Pressures
US Super Core Inflation Suggests Broad=Based Inflationary Pressures
US Super Core Inflation Suggests Broad=Based Inflationary Pressures
Chart 3US Wages Will Be Accelerating
US Wages Will Be Accelerating
US Wages Will Be Accelerating
Chart 4Rising TIPS Yields = Equity Multiples Comparison
Rising TIPS Yields = Equity Multiples Comparison
Rising TIPS Yields = Equity Multiples Comparison
As a result, the only way to bring down core inflation toward its preferred target range is for the Fed to slow the economy down and curb employment and wage gains. Yet before core inflation converges to the Fed’s target, risk assets will sell off first. Practically, the Fed will talk hawkish and hike until something breaks. The breaking point will be a major selloff in US share prices. US equities have been priced to perfection on the assumption that US interest rates will remain low for many years. As interest rate expectations rise further, US equity multiples are under pressure (Chart 4). Ms. Mea: The recent rise in US bond yields has been largely driven by the real component (TIPS yields), not inflation breakevens. That would usually imply improving US growth prospects. Yet US stocks have corrected as TIPS yields rose. How do you explain this and what should investors expect going forward? Answer: Indeed, the latest rise in US bonds yields is primarily driven by increasing TIPS yields, not inflation breakevens (Chart 5) TIPS yields have not been driven by economic growth expectations in the past couple of years. TIPS yields are breaking out and more upside is likely for reasons unrelated to US economic growth: The Fed’s rhetoric and guidance. TIPS yields typically move with 5-year/5-year forward yields, i.e., expectations for US interest rates in the long run (Chart 6). One of reasons why forward interest rates and TIPS yields have been low is the Fed’s commitment to keep interest rates extremely depressed for so long. As the Fed’s rhetoric has recently changed, so are interest rate expectations and TIPS yields. Given that core inflation will not drop to the Fed’s target range any time soon, the Fed will likely escalate its hawkish rhetoric. Hence, TIPS yields will keep rising, until something breaks. Chart 5US Tips Yields Have Broken Out After A Base Formation
US Tips Yields Have Broken Out After A Base Formation
US Tips Yields Have Broken Out After A Base Formation
Chart 6US TIPS Yields More With Long-Term Interest Rate Expectations
US TIPS Yields More With Long-Term Interest Rate Expectations
US TIPS Yields More With Long-Term Interest Rate Expectations
TIPS demand/supply and momentum. The TIPS market is relatively small, and it has been rigged by the Fed in the past two years or so. As a part of its QE program, the Fed has been buying a large share of TIPS, and it now owns 22% of this market. As a result, TIPS yields have fallen irrespective of economic growth dynamics. As the QE program ends, the Fed will stop purchasing TIPS. There has also been a rush into TIPS by institutional investors. In a quest for inflation protection when the Fed was complacent about inflation, investors have been opting for TIPS. This has also depressed TIPS yields. As the US central bank sounds more hawkish, investors’ demand for inflation protection will likely diminish. In addition, TIPS prices have recently plunged dramatically. Large losses could prompt further liquidation by investors pushing TIPS yields much higher. All of the above and the fact that TIPS yields remain negative suggest that they will continue rising in the coming months. Chart 7Rising TIPS Yields Warrant A Stronger US Dollar
Rising TIPS Yields Warrant A Stronger US Dollar
Rising TIPS Yields Warrant A Stronger US Dollar
Ms. Mea: Your point that TIPS yields will continue rising in the months ahead irrespective of US inflation and growth dynamics is interesting. So, what are the implications of rising US bond yields, especially TIPS yields, on various financial markets? Answer: Falling/low TIPS yields have benefited long duration plays like US stocks, and especially US growth stocks. Declining TIPS yields were a drag on the US dollar (Chart 7). Finally, they also prompted portfolio capital flows to EM. Consistently, rising TIPS yields will depress share prices in the richly valued equity markets like the US (Chart 4, above) support the greenback, and curtail portfolio flows into EM for a period of time. Ms. Mea: But aren’t US share prices positively correlated with US interest rates? Answer: Not always. Chart 8 illustrates that the correlation between the S&P 500 and US Treasury yields varied over time. Prior to the mid-1960s, it was positive. From 1966 until 1997, US equity prices were negatively correlated with US Treasury yields. Since 1997, US share prices have been positively correlated with US government bond yields (Chart 8, top panel). Chart 8US Stock-Bond Correlation: A Paradigm Shift In 2022?
US Stock-Bond Correlation: A Paradigm Shift In 2022?
US Stock-Bond Correlation: A Paradigm Shift In 2022?
Chart 9Early 2020s = Late 1960s?
Early 2020s = Late 1960s?
Early 2020s = Late 1960s?
We believe US markets are now undergoing a major paradigm shift in the stock prices-bond yields correlation. The latter is about to turn negative like it did in the second half of the 1960s. In the mid-1960s, the reason why the stock-to-bond yields correlation turned negative was because US core inflation surged well above 2% in 1966 (Chart 8, bottom panel). This marked a paradigm shift in the relationship between equity prices and US Treasury yields. The same is happening now. As we wrote a year ago in our Special Report titled A Paradigm Shift In The Stock-Bond Relationship, the proper roadmap for the US stock-to-bond correlation is not the last 10 or 20 years, but the second half of the 1960s. After US core CPI surged substantially above 2%, the S&P 500 became negatively correlated with US Treasury yields (Chart 9). Ms. Mea: Let’s now turn to emerging markets. How will EM financial markets perform amid rising US bonds yields? Also, which US yields matter most for EM financial markets, US Treasury yields or TIPS? Answer: Neither US Treasury yields nor TIPS yields have a stable correlation with EM stock prices. Correlations between US nominal bond yields, EM currencies and EM domestic bond yields vary over time. However, US TIPS yields exhibit a reasonably strong positive correlation with mainstream EM local bond yields and the US dollar's exchange rate versus EM currencies (Chart 10). Mainstream EM includes 16 markets but excludes China, Korea and Taiwan. Hence, as US TIPS yields move up, it is reasonable to expect the US dollar to strengthen against mainstream EM currencies and their local bond yields to rise (Chart 10). Currency depreciation and rising domestic bond yields will prove to be toxic for the share prices of these mainstream emerging markets. To sum up, rising US TIPS yields will jeopardize the performance of EM equities, currencies, local rates and credit markets. Ms. Mea: Aren’t many EMs better prepared for rising US nominal/real yields than they were in 2013? Answer: Yes, they are: many EM countries that were running large current account deficits in 2013 now have current account surpluses or small deficits (Chart 11, top panel). Besides, mainstream EMs ramped up their foreign currency debt in the years preceding 2013 while their foreign debt has changed little in the past 6-7 years (Chart 11, bottom panel). Chart 10Rising TIPS Yields Are A Risk To EM Domestic Bonds
Rising TIPS Yields Are A Risk To EM Domestic Bonds
Rising TIPS Yields Are A Risk To EM Domestic Bonds
Chart 11Mainstream EM: Less Vulnerable To The Fed Now Than in 2013
Mainstream EM: Less Vulnerable To The Fed Now Than in 2013
Mainstream EM: Less Vulnerable To The Fed Now Than in 2013
Table 1Current Account Balances In Individual EM Countries
Conversation With Ms. Mea: US Inflation Redux, TIPS And Implications For EM
Conversation With Ms. Mea: US Inflation Redux, TIPS And Implications For EM
Table 1 illustrates the current account balance in individual developing countries. Further, the share of foreign investor holdings in EM local currency bonds has declined a great deal in the past 2 years (Table 2). Finally, many mainstream EM central banks have hiked rates aggressively and their local bond yields have already risen considerably in the past 12 months. These also provide some protection against fixed-income portfolio capital outflows. All in all, vulnerability from foreign portfolio capital outflows in EM is much lower than it was in 2013. Nevertheless, EM financial markets will not remain unscathed if US rates march higher, the US dollar rallies and US stocks wobble. Based on the parameters displayed in Tables 1 and 2, the most vulnerable countries among mainstream EMs are Peru, Colombia, Chile and Egypt. Table 2Foreign Ownership Of Domestic Bonds: January 2022 Versus October 2019
Conversation With Ms. Mea: US Inflation Redux, TIPS And Implications For EM
Conversation With Ms. Mea: US Inflation Redux, TIPS And Implications For EM
Chart 12China"s Construction Cycle In Perspective
China"s Construction Cycle In Perspective
China"s Construction Cycle In Perspective
Ms. Mea: Let’s now move to your second theme - China’s slowdown. This is well known and arguably priced in financial markets. Importantly, policymakers have been ratcheting up stimulus. Don’t you think now is the time to upgrade the stance on Chinese stocks and China-related plays? Answer: Despite the new round of stimulus, China’s business cycle will continue disappointing over the near-term. As we wrote in last week’s report titled Chinese Equities: Valuations and Profits, Chinese corporate earnings are set to contract in the next 6 months. This means that the risk-reward profile of Chinese stocks in absolute terms is not yet attractive. Importantly, even though property market woes are well known and housing sales and starts have collapsed, housing construction activity has remained resilient (Chart 12). The bottom panel of Chart 12 demonstrates rising completions, which is one of reasons why raw materials prices have been resilient. However, new funding for property developers has dried up and they will be forced to scale back completions/construction activity. Historically, EM non-TMT share prices lagged the turning points in China’s money/credit impulses by several months (Chart 13). Even though the money/credit cycle is now bottoming, a buying opportunity in stocks will likely transpire in a few months. In brief, a tentative bottom in money/credit indicators does not always herald an imminent and sustainable equity rally. Chart 13China"s Credit Cycle And EM Non-TMT Stocks
China"s Credit Cycle And EM Non-TMT Stocks
China"s Credit Cycle And EM Non-TMT Stocks
Ms. Mea: Another topic I wanted to discuss today is divergences in global financial markets. Some equity markets have already fallen significantly, while the S&P 500 index as well as a couple of individual EM equity bourses (India, Taiwan and Mexico) have been firm. There have been massive divergences within the US equity market in general and the NASDAQ index in particular. Besides, EM high-yield corporate spreads have widened but EM investment grade corporate spreads remain tight. Finally, commodity prices have remained firm despite both China’s slowdown and US dollar strength. How should investors interpret these divergences? Answer: Such divergences in financial markets often occur during major selloffs. Notable financial market downturns evolve in phases resembling domino effect-like patterns, where some markets lead while others lag. In contrast, corrections are abrupt, and the majority of markets drop concurrently. For example, the EM crises in 1997-98 did not occur simultaneously across all EM countries. It began in July 1997 with Thailand, then spread to Korea, Malaysia and Indonesia, and finally to the rest of Asia. By August 1998, Russian financial markets had collapsed, triggering the Long-Term Capital Management (LTCM) debacle. The last leg of the crisis appeared in Brazil and culminated in the real's devaluation in January 1999. Chart 14Domino Effect In 2007-08
Domino Effect In 2007-08
Domino Effect In 2007-08
Similarly, the US financial/credit crisis in 2007-08 commenced with the selloff in sub-prime securities in March 2007. Corporate spreads began widening, and bank share prices rolled over in June 2007. Next, the S&P 500 and EM stocks peaked in October 2007 (Chart 14). Despite these developments, commodity prices and EM currencies continued to rally until the summer of 2008 when they finally collapsed in the second half of that year (Chart 14, bottom panel). There was a domino effect in financial markets in both the 2015 and 2018 turbulences. Initially, the selloffs started in the weakest links while other parts were holding up. Then, the selloff spread to all without exception. For example, in 2018, US share prices and high-yield credit spreads were doing quite well until October 2018. Then, a broad-based selloff transpired in the fourth quarter of 2018. Just as chains break at their weakest links, financial market selloffs begin in the most susceptible sectors. Overpriced US stocks with little or no profits and currencies with zero or negative interest rates have been most vulnerable to rising US interest rates. That is why these segments have sold off first in response to rising US nominal and real rates. Our hunch is that the selloff in global markets due to rising US interest rates will broaden in the coming months. This does not mean that global stocks on the verge of a major bear market, but a double-digit drop in global share prices is likely. The last asset class standing will be commodity prices. These will likely be the last affected by rising US interest rates because many investors buy commodities as an inflation hedge. Besides, oil prices have also been supported by the geopolitical tensions around Ukraine and Iran. It might take investor concerns about the US economy and a slowdown in global manufacturing to trigger a relapse in commodity prices. Chart 15Rising TIPS Yields = European Equities Outperforming US Ones
Rising TIPS Yields = European Equities Outperforming US Ones
Rising TIPS Yields = European Equities Outperforming US Ones
Ms. Mea: What investment strategy do you recommend in the coming months? Answer: As US interest rates continue rising and China’s recovery fails to transpire immediately, EM financial markets remain at risk. Therefore, we recommend a defensive stance for absolute return investors in EM equity and fixed income. We are also continuing to short a basket of EM currencies versus the US dollar. As for global equity regional allocation, the outlook for EM performance is less certain than it was in the past 12 months. Clearly, rising US/DM interest rates herald US equity underperformance versus other DM markets, like the euro area and Japan (Chart 15). The basis is that non-US equities are not as expensive as US ones and, hence, are less vulnerable to rising interest rates. Chart 16EM Relative Equity Performance Is Correlated With The USD, Not US Bond Yields
EM Relative Equity Performance Is Correlated With The USD, Not US Bond Yields
EM Relative Equity Performance Is Correlated With The USD, Not US Bond Yields
Whether EM outperforms or not is mainly contingent on the US dollar, rather than US bond yields. The top panel of Chart 16 demonstrates that EM relative equity performance against DM has a low correlation with US bond yields. Yet, EM equities will underperform their DM peers if the USD strengthens (the greenback is shown inverted on the bottom panel of Chart 16). However, if the greenback depreciates, EM will certainly outperform the US in both equity and the fixed income space. Putting it all together, asset allocators should overweight the euro area and Japan, and underweight the US and EM in a global equity portfolio. Ms. Mea: What about EM local bonds and EM credit markets? Answer: EM credit spreads will widen, and EM local yields will not drop as US bond yields head higher and EM exchange rates depreciate. We continue to recommend investors underweight EM credit versus US corporate credit, quality adjusted. As for local rates, we largely remain on the sidelines of this asset class. Our current recommendations are as follows: receiving 10-year rates in China and Malaysia, paying Czech 10-year rates and betting on 10/1-year yield curve inversions in Mexico and Russia. For a detailed list of our country recommendations for equities, credit, domestic bonds and currencies, please refer to Open Position Tables below. Arthur Budaghyan Chief Emerging Markets Strategist arthurb@bcaresearch.com
Image
Image
The shift in Chinese policymakers’ stance towards policy easing is thus far not enough to trigger a rebound in the Chinese economy. Policy stimulus affects domestic economic conditions with a lag and the profit outlook remains bleak. Our Emerging Markets…
Highlights We reformatted and added three sections to our existing trade tables: strategic themes, cyclical asset allocations and tactical investment recommendations. An extensive audit of our current trade book shows that our country and sector allocation recommendations have been successful. Of the eight open trades in our book, six have so far generated positive returns. We now recommend closing three out of the eight positions, based on a review of the original basis and subsequent performance of our trades. We have also added one cyclical and two tactical trades. We will look for opportunities to propose new trades to our book in the coming months. Feature In this week's report, we introduce our newly formatted trade tables (on Page 15), which include the following: Strategic themes (structural views beyond 18 months) Cyclical asset allocations within Chinese financial markets (in the next 6 to 18 months) Tactical trades (investment recommendations for the next 0 to 6 months) We revisited the original basis and subsequent performance of our open trades as part of an audit of our trade book. We maintain five of the eight trades and will add one cyclical and two tactical trades. Our new features and the rationale for retaining or closing each trade are presented below. Strategic Themes The new Strategic Themes section now includes the following market relevant structural forces: President Xi Jinping’s “common prosperity” policy initiative, which is intended to narrow the nation’s wealth gap; a demographic shift of a shrinking population by 2025; and secular disputes between the US and China (Table 1). Table 1
Introducing New Trade Tables
Introducing New Trade Tables
These structural aspects will have a macro impact on China’s policy landscape, economy and financial markets. Investors should consider whether the themes point toward a reflationary policy bias; whether they will have a medium- to long-term effect on corporate earnings; and whether these themes will, on a structural basis, warrant higher/lower risk premiums for owning Chinese stocks. Cyclical Equity Index Allocation Recommendations (Relative To MSCI All Country World) Table 2 is a summary of our cyclical recommendations for Greater China equity indexes. We recommend the following equity index allocations within a global equity portfolio, for the next 6 to 18 months: Table 2
Introducing New Trade Tables
Introducing New Trade Tables
Underweight MSCI China (Chinese investable stocks). Underweight MSCI China A Onshore (Chinese onshore or A-share stocks). Neutral stance on MSCI Hong Kong Index. Overweight MSCI Taiwan Index. Chart 1Chinese Stocks Substantially Underperformed Global Equities
Chinese Stocks Substantially Underperformed Global Equities
Chinese Stocks Substantially Underperformed Global Equities
Our recommendation to underweight MSCI China Index and MSCI China A Onshore Index were extremely successful in 2021 (Chart 1). We will continue to maintain an underweight stance for the time being, based on our concern that the current policy easing measures will be insufficient to revive China’s slowing economy. We expect policy stimulus to step up in the coming months and economic growth to start improving by mid-2022. However, corporate profits are set to disappoint in the first half of the year. This implies that Chinese share prices will remain volatile with substantial downside risks. Chinese investable stocks are in oversold territory and will likely rebound in the near term in both absolute and relative terms (discussed in the Tactical Recommendations section on Page 14) (Chart 2). Nonetheless, on a cyclical basis, they face challenges both from the impact of a slowing economy on earnings growth and ongoing regulatory and geopolitical risks. Our model suggests high odds (70%) of a considerable earnings contraction in Chinese investable stocks in the next 6 to 12 months. We recommend investors upgrade their allocation to the MSCI Hong Kong Index from underweight to neutral within a global equity portfolio. The MSCI Hong Kong equity index appears to be very cheap compared with global equities (Chart 3). Chart 2Chinese Investable Stocks Are Oversold
Chinese Investable Stocks Are Oversold
Chinese Investable Stocks Are Oversold
Chart 3MSCI HK Equities Are Cheap
MSCI HK Equities Are Cheap
MSCI HK Equities Are Cheap
The MSCI Hong Kong equity index includes Hong Kong-domiciled companies and not mainland issuers listed in Hong Kong. Rising US Treasury yields will be a headwind to Hong Kong-domiciled company stock performance because the HKD is pegged to the USD and therefore Hong Kong bond yields tend to follow the direction of bond yields in the US. Chart 4MSCI HK Index Is Defensive In Nature
MSCI HK Index Is Defensive In Nature
MSCI HK Index Is Defensive In Nature
However, an offsetting factor is that due to composition changes over time, the MSCI Hong Kong equity index has become much more defensive and tends to perform better than the emerging Asian and EM equity benchmarks during turbulent times (Chart 4). The weight of insurance companies and diversified financials account for over 40% of the MSCI Hong Kong Index, compared with property stocks, which take up 20% of the equity market cap. The insurance and diversified financials subsectors are less vulnerable to escalating short-term interest rates compared with property stocks. During risk-off phases, the defensive nature in the MSCI Hong Kong Index will support its performance relative to the some of the more industrial- and tech-heavy EM and global equity indexes. We maintain an overweight stance on the MSCI Taiwan Index relative to global equities. The trade (see discussion in the Cyclical Equity And Sector Trades section) has brought an impressive 40% rate of return since its inception in 2019. Cyclical Recommended Asset Allocation (Within Chinese Onshore Assets)
Image
We recommend an underweight position in equities in China’s onshore multi-asset portfolios (Table 3). Chinese onshore stocks are not cheap and will likely underperform onshore government bonds as the economy struggles to regain its footing. Chart 5Total Returns In Chinese Onshore Stocks Have Barely Kept Up With Onshore GB
Total Returns In Chinese Onshore Stocks Have Barely Kept Up With Onshore GB
Total Returns In Chinese Onshore Stocks Have Barely Kept Up With Onshore GB
Chart 5 shows that in the past decade total returns in Chinese onshore stocks have barely kept up with that in onshore long-duration government bonds. During policy easing cycles Chinese onshore stocks generated positive excess returns over government bonds, however, the outperformance has been extremely volatile and very brief. Given that we do not expect Beijing to allow a significant overshoot in stimulus this year, there is a good chance that the returns in Chinese onshore stocks will underperform onshore government bonds. Cyclical Equity And Sector Trades Our rationale for retaining or closing each trade is described below. Chart 6Chinese Onshore Stocks Outperformance Has Been Passive
Chinese Onshore Stocks Outperformance Has Been Passive
Chinese Onshore Stocks Outperformance Has Been Passive
Long China A-Shares/Short Chinese Investable Stocks (Maintain) We initiated this trade in March 2021. The recommendation has been our most successful trade, generating a 40+% return since then (Chart 6). China’s internet platform giants have a large weight in the MSCI Investable index and they remain vulnerable (Chart 7). Although China’s antitrust regulations may have passed the peak of intensity, they will not be rolled back and multiple compression in these stocks will likely continue in 2022. In contrast, the A-share index is heavily weighted in value stocks. The trade is in line with our view that the global investment backdrop has shifted in favor of global value versus growth stocks due to an above-trend US expansion and climbing US bond yields in the next 6 to 12 months. The relative ratio between China A-shares and investable stocks is overbought and will likely pull back in the near term (Chart 8). However, the cyclical and structural outlook continues to favor onshore stocks versus the investable universe. Chart 7Sizable Underperformance In Investable Consumer Discretionary Stocks
Sizable Underperformance In Investable Consumer Discretionary Stocks
Sizable Underperformance In Investable Consumer Discretionary Stocks
Chart 8A Near-Term Pullback In Relative Ratio Is Likely
A Near-Term Pullback In Relative Ratio Is Likely
A Near-Term Pullback In Relative Ratio Is Likely
Long CSI500/Short Broad A-Share Market (Maintain) The CSI500 index, which comprises 500 SMID-cap companies, has outperformed the broad A-share market by 32% since mid-February (Chart 9). We think the outperformance in SMID stocks has not fully run its course. Historically, SMID-caps tend to outperform large caps in the late phase of an economic recovery and the valuation premia in small cap stocks remains near decade lows (Chart 10). In addition, the government’s increasing efforts to support small- and medium-sized corporates will help to shore up confidence in those companies. Therefore, SMID will probably continue to outperform large cap stocks this year. Chart 9A Low Valuation Premia And More Policy Support Will Help Lift Prices Of SMID-Caps
A Low Valuation Premia And More Policy Support Will Help Lift Prices Of SMID-Caps
A Low Valuation Premia And More Policy Support Will Help Lift Prices Of SMID-Caps
Chart 10SMID-Caps Tend To Outperform Large-Caps In Late Business Cycle
SMID-Caps Tend To Outperform Large-Caps In Late Business Cycle
SMID-Caps Tend To Outperform Large-Caps In Late Business Cycle
Long MSCI Taiwan Index/Short MSCI All Country World (Maintain) The MSCI Taiwan equity index has consistently outperformed global equities since mid-2019, mostly driven by the rally in Taiwanese semiconductor stocks. Global chip supply shortages since the COVID pandemic have further boosted the sector’s outperformance (Chart 11). Furthermore, Chart 12 highlights improvements in the cyclical case for Taiwanese stocks as an aggregate. Panels 1 & 2 show an uptick in the new export orders component of Taiwanese manufacturing PMI. The new export orders component has historically coincided with both Taiwanese exports to China and the relative Taiwanese manufacturing PMI on a cyclical basis. As such, the economic fundamentals also support a continued outperformance in Taiwanese stocks. Chart 11A Great Run In MSCI Taiwan Equity Index And Semis
A Great Run In MSCI Taiwan Equity Index And Semis
A Great Run In MSCI Taiwan Equity Index And Semis
Chart 12Exports To China, 12-Month Forward EPS, And Relative Stock Prices: All Likely To Improve
Exports To China, 12-Month Forward EPS, And Relative Stock Prices: All Likely To Improve
Exports To China, 12-Month Forward EPS, And Relative Stock Prices: All Likely To Improve
Long Chinese Onshore Industrial Stocks/Short MSCI China A Index (Maintain) This trade, initiated in September last year, has brought a slightly positive return as of today. Our view was based on improving manufacturing investment and policy support for the sector, even though China’s business cycle had already peaked. Chart 13China Onshore Industrials Closely Track Economic Fundamentals
China Onshore Industrials Closely Track Economic Fundamentals
China Onshore Industrials Closely Track Economic Fundamentals
While we maintain the trade for now, we will monitor credit growth in Q1 to assess whether to close the trade. The sector’s performance is highly correlated with our BCA China Activity Index and the Li Keqiang Leading Indicator (Chart 13). A bottoming in both indicators in mid-2022 would suggest that investors should maintain the trade. The caveat, however, is that the sector’s valuations have already become extreme, indicating that the bar may be higher for the sector to outperform even when economic fundamentals improve in 2H22. We will watch for signs of an overshoot in stimulus in the coming three to six months. Conversely, credit growth in Q1 that is at or below expectations will warrant closing this trade. Long Domestic Semiconductor Sector/Short Global Semiconductor Benchmark (Close) Replace with: Long Domestic Semiconductor Sector/Short MSCI China A Onshore The trade has been our biggest loser since its inception in August 2020. Although Chinese onshore semiconductor stocks outperformed the broad A-share market by a large margin, they have underperformed their global peers (Chart 14). Thus, we are closing the trade and replacing it with long Chinese onshore semis relative to the broad A-share market. We remain bullish on Chinese semi stocks, on both a structural and cyclical basis. Secular pressures from the US and the West to curb the advancement of Chinese technology will encourage China’s authorities to double down on supporting state-led technology programs. Moreover, prices of Chinese onshore semis have plummeted since November last year, bringing their lofty valuations closer to long-term trend and providing a better cyclical risk-reward profiles for these stocks (Chart 15). Chart 14Chinese Onshore Semis Underperformed Global...
Chinese Onshore Semis Underperformed Global...
Chinese Onshore Semis Underperformed Global...
Chart 15...But Outperformed Domestic Broad Market
...But Outperformed Domestic Broad Market
...But Outperformed Domestic Broad Market
Long Domestic Consumer Discretionary/Short Broad A-Share Market (Close) Chart 16A Trend Reversal In Chinese Onshore Consumer Discretionary Stocks Performance
A Trend Reversal In Chinese Onshore Consumer Discretionary Stocks Performance
A Trend Reversal In Chinese Onshore Consumer Discretionary Stocks Performance
We placed the trade in May 2020 when China’s economy and household discretionary consumption showed a strong rebound from the deep slump in Q1 2020. As strength waned in the country’s domestic demand for housing, housing-related durable goods and automobiles, the sector’s relative performance also started to dwindle from its peak in the fall of last year (Chart 16). Going forward, even though China’s economy will start to improve on a cyclical basis, domestic consumer discretionary sector will face non-trivial headwinds. The performance of its subsectors, such as hotels, restaurants, and services, will remain subdued due to China’s zero tolerance COVID policy that leads to frequent lockdowns and travel restrictions (Chart 17). Moreover, the internet and direct-marketing retail subsectors are facing tighter regulations, which lowers the sector’s profitability and valuations (Chart 18). Chart 17Domestic COVID Flareups Pose Significant Threat To Chinese Consumer Services Sector Performance
Domestic COVID Flareups Pose Significant Threat To Chinese Consumer Services Sector Performance
Domestic COVID Flareups Pose Significant Threat To Chinese Consumer Services Sector Performance
Chart 18Online Retailing Also Faces Regylatory Pressures
Online Retailing Also Faces Regylatory Pressures
Online Retailing Also Faces Regylatory Pressures
Short Hong Kong 10-Year Government Bond/Long US 10-Year Treasury (Maintain) In the past decade, Hong Kong's 10-year government bond yield has been consistently below that of the US, even though Hong Kong has an exchange rate pegged to the US dollar and its monetary policy is directly tied to that of the US. Chart 19The US-HK Yield Gap Should Widen In The Coming Months
The US-HK Yield Gap Should Widen In The Coming Months
The US-HK Yield Gap Should Widen In The Coming Months
The US-Hong Kong 10-year yield spread has substantially narrowed since early 2020 when the US Fed aggressively cut its policy rate. In the coming 6-12 months, however, the spread will likely widen given that the Fed will start to normalize rates (Chart 19, top panel). Chart 19 (bottom panel) highlights that the relative total return profile of the trade (in unhedged terms) trends higher over time due to the carry advantage. Although cyclically the relative total return will likely reverse to its trend line and argues for a short stance on US Treasury, we think it is too early to close the trade. The USD will likely remain strong in the near term, and we have yet to turn positive on Chinese and Hong Kong assets over a 6 to 18-mont time horizon. Therefore, we maintain this trade until the USD starts to weaken, and foreign investment flows into China and Hong Kong shows sustainable momentum. Long USD-CNH (Close) We are closing this trade, which we initiated in May 2020 when tensions between the US and China were rising. The trade has lost more than 10% since its inception because the RMB exchange rate was boosted in 2021 by China’s record current account surplus, wide interest rate differentials and speculation that tension between the US and China would abate. Chart 20A Weaker USD Will Prevent Sizable RMB Depreciation
A Weaker USD Will Prevent Sizable RMB Depreciation
A Weaker USD Will Prevent Sizable RMB Depreciation
We expect all three favorable conditions supporting the RMB to start reversing in 1H22, suggesting downward pressure on the RMB. However, over a longer period of 6 to 18 months the US dollar also has the potential to trend lower, preventing the RMB from any sizable depreciation (Chart 20). The dollar strength in the past year has been the result of both speculative flows into the US dollar based on rising interest rate expectations and portfolio inflows into the US equity markets. In the next 6 to 18 months, however, our Foreign Exchange Strategist Chester Ntonifor predicts that the dollar could begin a paradigm shift, whereby any actions by the Fed could eventually lead to a weakening of the US dollar. Higher rates than the market expects will initially boost the US dollar, but will also undermine the US equity market leadership, reversing the substantial portfolio inflows from recent years. On the flip side, fewer rate hikes will severely unwind higher rate expectations in the US relative to other developed markets. Chester further predicts that the DXY could touch 98 in the near term but will break below 90 in the next 12-18 months. Tactical Recommendations (0-6 months) We are initiating two tactical trades to go long on the MSCI China Index and MSCI Hong Kong Index relative to global equities. Relative to global stocks, Chinese investable equities are very oversold and offer value. In addition, while US tech stocks are entering a rollercoaster phase due to higher bond yields in the US, Chinese tech stocks will also fall but by a lesser degree because China’s monetary policy cycle is less affected by the Fed’s policy decisions. In other words, Chinese investable stocks may passively outperform global equities. Nonetheless, as noted in our previous reports, Chinese investable stocks face both cyclical and structural challenges. Hence the overweight stance on these stocks is strictly a tactical play rather than a cyclical one. We favor the MSCI Hong Kong Index versus global equities for similar reasons as Chinese investable stocks. The Hong Kong equity index is also technically oversold. Since the composition of the index has become more defensive, it will likely outperform in risk-off phases. In addition, if the US dollar rallies in the near term, share prices of Hong Kong-domiciled companies will materially outperform. Jing Sima China Strategist jings@bcaresearch.com Strategic View Cyclical Recommendations Tactical Recommendations
Euro Area equities underperformed US stocks by 14% in 2021. However, this underperformance has reversed so far this year with Eurozone stocks up relative to US ones. Nevertheless, risks to European equities remain elevated over the near-term. First, Europe’s…
BCA Research’s US Investment Strategy service argues that investors should not read the first rate hike, or even the run-up to it, as a sign to begin reducing exposure. Signal measures of economic activity – hiring, lending, spending and GDP – grow well…
Dear Client, Next week there will be no regular strategy report. Instead, we will hold our quarterly webcast which will discuss the outlook for the European economy and assets in 2022. I look forward to this interaction. Best regards, Mathieu Savary Highlights European and global yields have considerable upside over the coming year, even if inflation peaks in 2022. The post-World War II experience is instructive: massive war-time fiscal and monetary stimulus allowed for an upward re-estimation of the neutral rate as trend nominal growth improved. A similar development is likely to result in an improvement in nominal growth and the neutral rate compared to the post-GFC decade. China and a financial accident outside the US constitute the greatest risks this year to higher yields. European stocks and value stocks will benefit from this rise in yields. Cyclicals in general and industrials in particular are the European sectors most levered to higher yields. Overweight these assets. Defensives will underperform meaningfully if yields rise further. Long Sweden and the Netherlands / Short Switzerland is an appealing trade to bet on higher yields, especially if inflation peaks in 2022. Feature Last week, US Treasury yields finally reached levels that prevailed before the pandemic started. In Europe, German 10-year yields flirted with the symbolic 0% level, rising to their highest reading since May 2019. With the Fed preparing to increase interest rates in March, and global inflation remaining perky, do yields already reflect all the bearish bond news or will they continue to climb higher on a cyclical basis? Moreover, what would be the implications for equity prices of higher yields? BCA expects yields to rise further, for which German Bunds will not be an exception. This process will continue to generate volatility in stock prices, but ultimately, higher equities will prevail. Increasing yields will help European stocks and are strongly associated with an outperformance of cyclical equities. What’s Moving Yields Up? Not all yield increases are created equal. A breakdown of yields helps us understand what investors are pricing in for the future. In the US, the upside in 10-year yields mostly reflects the increase in 5-year yields. This maturity has moved back to levels that prevailed prior to the pandemic, while the 5-year/5-year forward yield remains below its spring 2021 peak (Chart 1, top panel). Moreover, these shifts mirror higher real interest rates, which are rising across maturities, while inflation expectations have been declining in recent weeks or have been flat since mid-2021 on a 5-year/5-year forward basis (Chart 1, middle and bottom panels). This breakdown confirms investors are driving yields higher because they expect more Fed tightening. However, this upgraded view of the Fed’s policy path is limited to the next few years, and long-term policy expectations approximated by the forward rates are not rising as much. In other words, markets do not expect that the Fed will be able to push up interest rates on a long-term basis. In Germany, the breakdown of the most recent shift in yield paints a different picture (Chart 2). As in the US, real yields, not inflation expectations, drove the latest bond selloff. This points toward pricing in an eventual policy tightening in Europe. However, unlike what is happening in the US, 5-year/5-year forward rates are the main force driving yields higher; investors are therefore expecting the ECB to have to follow the Fed later on. Chart 1Near-Term Tightening Is Driving Treasurys
Near-Term Tightening Is Driving Treasurys
Near-Term Tightening Is Driving Treasurys
Chart 2longer-Term Tightening Is Driving Bunds
longer-Term Tightening Is Driving Bunds
longer-Term Tightening Is Driving Bunds
Can the Yield Upside Continue? While BCA’s target for the 10-year Treasury yield in 2022 stands at 2.25% and the Bund yield at 0.25%, the coming two to three years should witness significantly higher yields. The period after World War II offers an interesting historical equivalent. During the War, government spending as a share of GDP exploded, lifting US gross federal debt from 52% of GDP at the dawn of the conflict to 114% at the end of 1945. However, the Fed kept a lid on interest rates during this period to help finance the war effort. T-Bill rates were pegged at 3/8th of a percent and the Fed also capped T-Bond yields at 2.5%. Chart 3The Post WWII Experience
The Post WWII Experience
The Post WWII Experience
As a consequence of this policy effort, the Fed balance sheet increased significantly and continued to do so after the war (Chart 3). The stimulative fiscal and monetary policy, as well as the capacity constraints associated with shifting production from military goods to consumer and capital goods, contributed to an inflation spike to 20% in March 1947. Moreover, the Korean War boosted government spending between 1950 and 1953, resulting in another inflation spike to 9.5% in 1951. The Fed’s cap on yields ended after the March 1951 Treasury-Fed Accord. It was followed by the beginning of a multi-decade uptrend in bond yields, which culminated in 1981 with T-Bond yields above 15% following the inflationary surge of the 1970s. Nonetheless, the yield increase from 2.5% in 1951 to 4% at the end of the 1950s happened after the inflation peak of the Korean War. This original inflection reflected economic vigor and a normalization of the neutral rate after the trauma of the Great Depression. The current situation is not dissimilar. The neutral rate and the market-based estimates of the terminal rate of interest are still very low in the US and in Europe (Chart 4). However, the vast amount of monetary and fiscal stimulus injected in the economy has jolted a recovery. It has also caused a massive wealth transfer to households and the private sector in general that is likely to increase consumption permanently. As a result, growth in the coming decade will be stronger than it was in the past decade, in both the US and Europe. This process will allow the neutral rate to rise over time, which in turn will lift the terminal rate of interest and yields. In this context, even if inflation were to cool in 2022 because some of the supply constraints that marked 2021 dissipate, yields may continue to rise and do so for the remainder of the decade. This is also true in Europe where the household savings rate still towers near 19% of disposable income and may fall by 6% to reach its pre-pandemic levels, as the US experience presages (Chart 5). Chart 4Terminal Rates Proxies Are Too Low
Terminal Rates Proxies Are Too Low
Terminal Rates Proxies Are Too Low
Chart 5European Savings Rate Has Downside
European Savings Rate Has Downside
European Savings Rate Has Downside
A simple modeling exercise confirms that yields will have greater upside over the coming year. Conceptually, yields are anchored by policy rates and the terminal rate, which is somewhere above the neutral rate of interest. One of the key determinants of the nominal neutral rate is the trend growth rate of nominal GDP. While the market cannot know precisely where that growth rate stands, recent experience influences the perception of market participants. Thus, a long-term moving average of nominal GDP growth constitutes a rough proxy of this measure and will relate to investors’ assessment of the neutral rate and the terminal interest rates. Chart 6Bond Yields Are Too Low, Especially If Trend Nominal Growth Picks Up
Bond Yields Are Too Low, Especially If Trend Nominal Growth Picks Up
Bond Yields Are Too Low, Especially If Trend Nominal Growth Picks Up
Using this approach reveals two important bearish forces for bonds. Even after accounting for the slow growth rate of both the US and Eurozone economies over the past ten years, as well as extraordinarily low policy rates, T-Notes and Bunds yields are too low (Chart 6). More importantly, if nominal GDP growth is higher this decade than next, this alone will push up the equilibrium level of yields in Advanced Economies. The upside in yields is not without risks. China is still going through a deflationary shock whereby growth is slowing. As China eases policy, Chinese yields will continue to fall, bucking the global trend (Chart 7). In recent years, Chinese yields have rarely diverged from global yields. If Chinese growth plummets from here, the divergence will not be resolved via higher Chinese yields. However, Chinese authorities do not want growth to collapse. Reports from the State Council suggest an acceleration of the implementation of major spending projects under the 14th Five-year plan and that the credit impulse is trying to bottom. Nonetheless, China remains a risk to monitor closely. The second major risk stems from the intertwined nature of the global financial system. The US economy is able to withstand higher Treasury yields, but is the rest of the world? As Chart 8 highlights, US private debt-servicing costs are low today, as a result of minimal interest rates and the decline in debt loads after the GFC. The same is not true for the G-10 outside the US, let alone EM economies. These differences suggest that the US will be much more resilient to rising yields than the rest of the world. A major financial accident outside the US would prompt a wave of risk aversion that would decrease yields around the world. Chart 7An Unusual Divergence
An Unusual Divergence
An Unusual Divergence
Chart 8Will The Rest Of The World Withstand Higher US Yields?
Will The Rest Of The World Withstand Higher US Yields?
Will The Rest Of The World Withstand Higher US Yields?
Bottom Line: Global yields have much greater upside for the years ahead, even if inflation slows in 2022. While BCA targets 2.25% and 0.25% for, respectively, Treasurys and Bund yields this year, the multi-year upside is much greater as neutral rates are re-adjusted upward. The change will not move in a straight line, but the trend will not be friendly for bondholders. In the near-term, the main culprits preventing higher yields are a further slowdown in China as well as a financial accident outside the US. Investment Implications The most obvious investment implication is that investors should use any pullback in yields to sell duration. As a corollary, investors should maintain an overweight stance on equities relative to bonds. The equity risk premium, especially in Europe, remains elevated, and European dividend yields stand near record highs compared to Bund yields (Chart 9). Moreover, when yields rise because of a higher neutral rate, this also means that the expected long-term growth rate of earnings is firming, which negates some of the adverse impacts on valuations of higher discount rates. Nonetheless, if inflation does not stabilize, the increase in yields could become much more painful for stocks, as the negative correlation between stock prices and bond yields would reassert itself—a possibility we described five weeks ago. A rising neutral rate and terminal rate are also associated with an outperformance of European stocks compared to the US and an outperformance of value stocks over growth stocks in Europe (Chart 10). These relationships reflect the greater procyclicality of European equities and value stocks. Chart 9A Valuation Cushion For Stocks
A Valuation Cushion For Stocks
A Valuation Cushion For Stocks
Chart 10Higher Terminal Rates Favor Europe And Value
Higher Terminal Rates Favor Europe And Value
Higher Terminal Rates Favor Europe And Value
Finally, we looked at the performance of European sectors based on the trend in yields. Table 1 highlights that industrials are the great winner when yields rise, which is a testament to their pro-cyclicality. They beat the market on 3-month, 6-month and 12-month horizons by 1.6%, 2.9% and 5.8%, respectively. The regularity of their benchmark-beating performance is extremely high. When yields rise, financials also see a marked improvement of their relative returns compared to their historical average returns. Surprisingly, so do European tech firms, which reflect the more hardware focus of European tech compared to the US. Table 1Rising Yields & Sector Relative Performance
Implications Of Rising Yields
Implications Of Rising Yields
Table 2 repeats the same exercise, but, this time, we control for the slope of the yield curve, focusing on periods when the yield curve is positively sloped. Again, industrials are the star sector, but other cyclicals such as materials and consumer discretionary also stand out. European tech remains dominated by its cyclical properties, while the outperformance of financials becomes more marked. Table 2Rising Yields & Sector Relative Performance With Postive Yield Curve Slope As A Control Variable
Implications Of Rising Yields
Implications Of Rising Yields
Table 3 looks at the behavior of sectors when yields rise and when the Euro Area PMI Manufacturing improves, which is a scenario we expect for most of 2022 once the winter passes. Industrials win more clearly than materials or consumer discretionary. The European tech sector continues to generate a very strong outperformance, while the excess return of financials firms up as well. This scenario also shows a particularly steep underperformance for all the defensive sectors. Table 3Rising Yields & Sector Relative Performance With Improving Manufacturing PMI As A Control Variable
Implications Of Rising Yields
Implications Of Rising Yields
Table 4 completes the picture, focusing on rising yields when core CPI decelerates, another development we foresee in 2022. Once again, industrials stand out as a result of the extent and regularity of their outperformance. However, under this controlling variable, the performance of materials and consumer discretionary stocks deteriorates significantly. Financials also see a large downgrade to their relative performance. Tech performs best under these circumstances. Here, staples suffer the worst fate, closely followed by utilities and healthcare. Table 4Rising Yields & Sector Relative Performance With Falling Core CPI As A Control Variable
Implications Of Rising Yields
Implications Of Rising Yields
Based on these observations, the highest likelihood scenario is that European cyclicals will outperform defensive equities significantly this year after a period of consolidation since last spring. A more targeted approach would be to overweight industrials and tech at the expense of staples and utilities. Geographically, investors should buy a basket of Swedish (overweight industrials) and Dutch stocks (overweight tech), while selling Swiss stocks (overweight healthcare). Mathieu Savary, Chief European Strategist Mathieu@bcaresearch.com Tactical Recommendations Cyclical Recommendations Structural Recommendations Closed Trades Currency Performance Fixed Income Performance Equity Performance
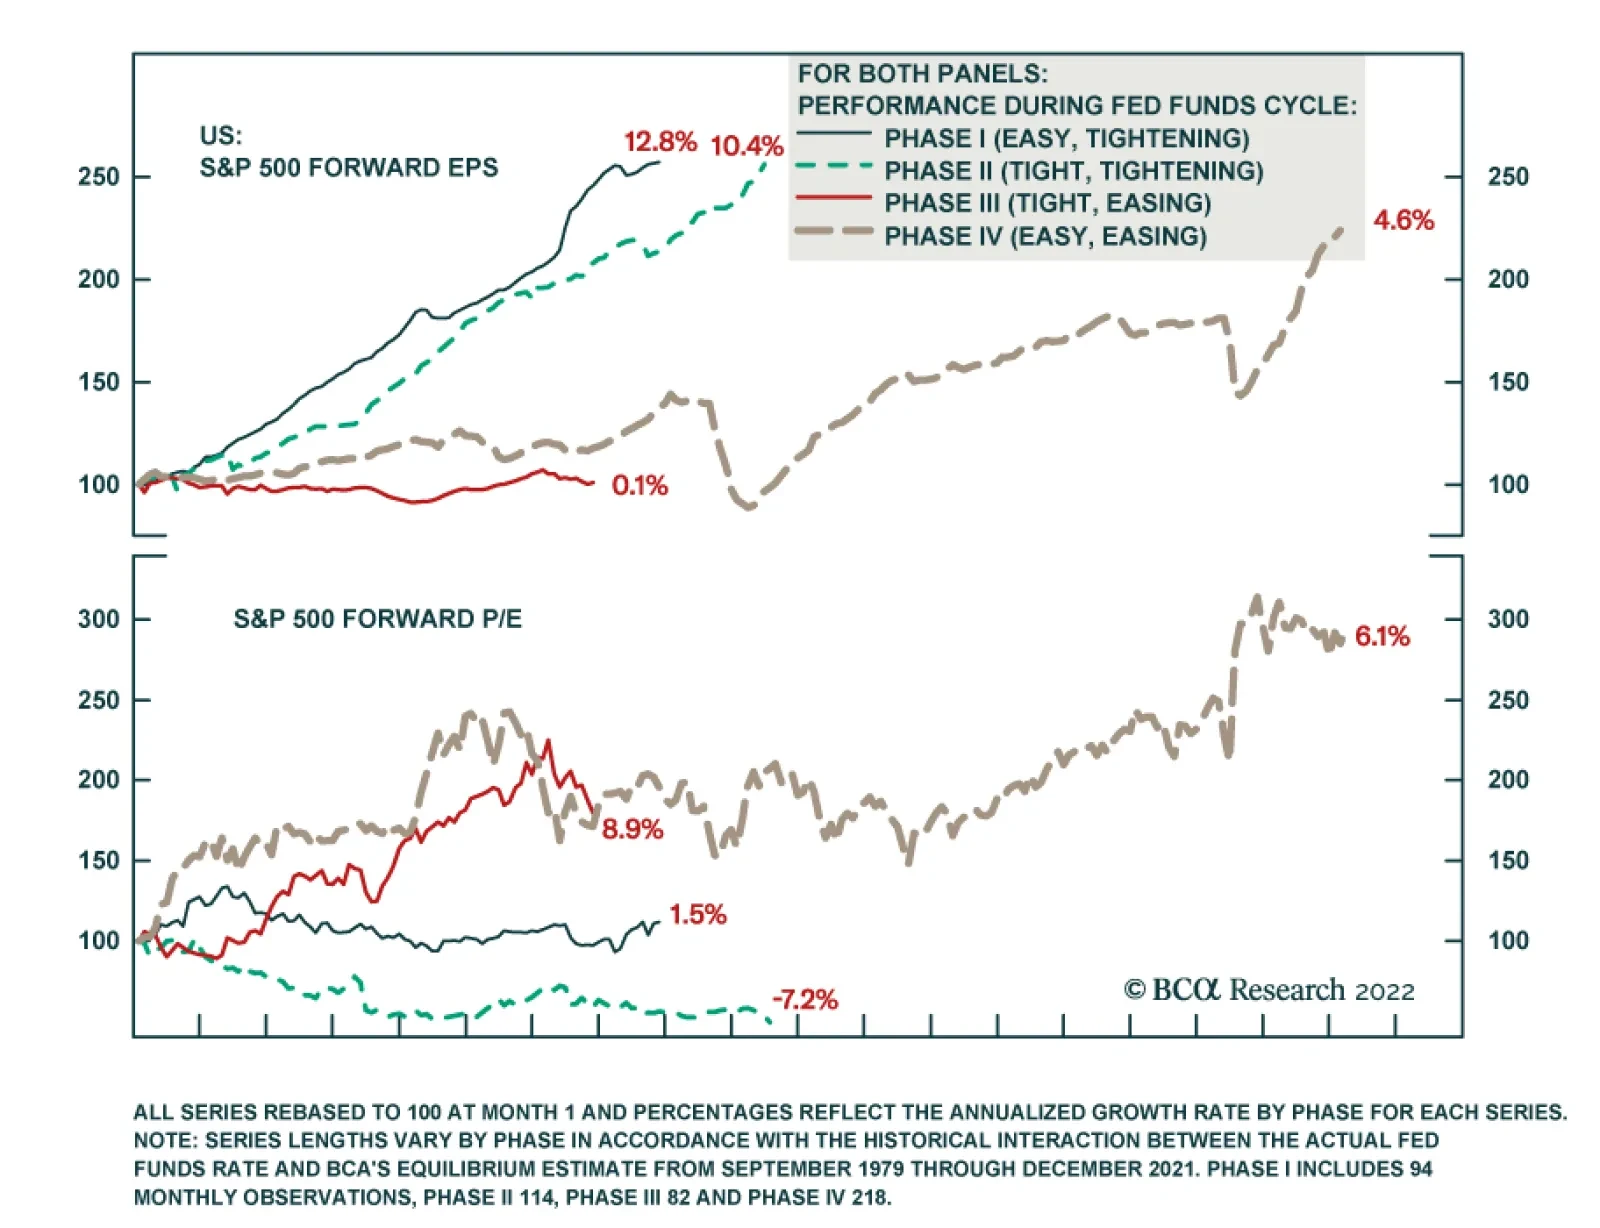
Highlights It’s true that rising rates often precipitate bear markets, but it takes a while, … : We subscribe to the view that expansions are more likely to be murdered by the Fed than die of old age. It’s hard to envision a plausible scenario in which the Fed could hike rates enough in 2022 to kill this one, though, and even the first half of 2023 would be a reach. … because the Fed only seeks to slow the economy when it’s firing on all cylinders: Earnings are typically growing at a rapid clip and risk aversion is a distant memory when the Fed begins the process of draining the punch bowl. The fed funds rate tipping point can only be definitively identified after the fact, but our estimate has an impressive track record: No one knows for sure where the line of demarcation between easy and tight monetary policy lies, but equities have shined when the fed funds rate is below our equilibrium estimate. We do not share the view that Tech stocks are especially vulnerable to higher interest rates: Although it lacks empirical support outside of a small subset of observations, the Tech vulnerability view has spread more widely than the Omicron variant. Feature Last week’s report discussing the equity impact of impending rate hikes elicited a lot of reaction. A discussion with one investor usually has relevance for other investors, so we are sharing a composite of the questions we received, along with our responses. It gives us the chance to elaborate on some points that we did not previously address in full, but our conclusion remains unchanged. History argues that equities have little to fear from an incremental rate hike campaign, and we expect that they will generate sizable positive excess returns above Treasuries and cash over the next twelve months. The Fed, With Rate Hikes, In The Board Room Why shouldn’t investors be concerned about rate hikes when you yourself have said that the Fed precipitates recessions? As the last expansion stretched on for a record length of time, we regularly repeated the line that expansions don’t die of old age, they die because the Fed murders them. It fits well with our tipping point view of rate hikes and we wholly subscribe to it. It is important to bear in mind, however, that the Fed’s tools act much more slowly than the lethal array of objects in the game of Clue. As we highlighted last week, monetary policy acts with long and variable lags and the Fed accordingly tightens it in increments allowing for real-time feedback that might help it tailor its actions to evolving economic conditions. Ex-the pandemic, tight monetary policy has been a necessary, albeit not sufficient, recession condition for the 60 years covered by our equilibrium fed funds rate estimate. Although not every instance when the fed funds rate exceeded its equilibrium level preceded a recession, no recession occurred when the funds rate was below equilibrium (Chart 1). Owing to monetary policy’s lagged effects, however, the recessions didn’t begin until well after the Fed began to tighten policy. On average, each recession arrived 26 months after Phase I kicked off and 12 months after the policy cycle entered Phase II (Table 1). Peak growth occurs in the early stages of rate hikes, while the Fed is merely easing up on the gas; deceleration only ensues in the latter stages, when the Fed pushes down on the brake pedal. Chart 1Rate Hikes Are A Necessary, But Not Sufficient, Recession Condition ...
Rate Hikes Are A Necessary, But Not Sufficient, Recession Condition ...
Rate Hikes Are A Necessary, But Not Sufficient, Recession Condition ...
Table 1... And It Takes A While For The Economy To Feel Their Full Effect
Q&A About Rate Hikes And Stocks
Q&A About Rate Hikes And Stocks
Index P/E Multiples Don’t Collapse Overnight It’s often said that the Fed hikes rates until something breaks. If equities are ultimately going to break in the process, why wouldn’t a prudent investor read the first rate hike, or even the run-up to it, as a sign to begin reducing exposure? We showed last week that signal measures of economic activity – hiring, lending, spending and GDP – grow well above their through-the-cycle pace while the Fed is tightening policy. Corporate earnings do, too, and S&P 500 earnings expectations have risen most rapidly when the Fed is hiking rates, with Phase I growth nearly doubling aggregate growth (Chart 2, middle panel). Earnings gains are vulnerable to dilution from multiple de-rating, but Phase I multiples have been roughly flat in the aggregate (Chart 2, bottom panel). Perhaps investors recognize that equities don’t break until well after the Fed starts hiking rates, or double-digit earnings growth makes them lose sight of the likelihood that they eventually will. Chart 2Our Definitions Of The Phases Must Be Close To The Mark
Our Definitions Of The Phases Must Be Close To The Mark
Our Definitions Of The Phases Must Be Close To The Mark
Based on the empirical record, investors judged by their relative performance should not reduce equity exposure until the rate hiking campaign is well advanced. Phase I has produced the best returns of any phase in the 42 years that earnings expectations have been compiled and missing out on them could be harmful to a professional investor’s career (Chart 2, top panel). Today’s Starting Point Is Unusually Demanding Have equities ever been this expensive at the start of a tightening cycle? History suggests that equities can rally in a “normal” Phase I even after some initial turbulence, but how much scope do they have to rise from current valuation levels? There is unfortunately scarcely any empirical data to address this question. The nine Phase I episodes account for just eight years of the 42-year earnings expectations era and several of them are very short (Table 2). The one instance when forward multiples were at or above today’s levels, from June through October of 1999, they were able to hold their ground, falling less than a half of a multiple point, or 1.5%. Earnings expectations grew by 6.3% over that period, allowing the S&P 500 to advance at the rate of about 1% per month, in line with its overall Phase I performance since 1979. Table 2Multiples Have Held Their Ground In Phase I
Q&A About Rate Hikes And Stocks
Q&A About Rate Hikes And Stocks
Empirically, however, robust growth in earnings expectations is the basis for overweighting stocks in Phase I, not multiple expansion. We do not expect re-rating as the Fed pushes the funds rate toward its equilibrium level, and we are alert to the certainty that stocks will de-rate sometime in the future if forward multiples are still subject to mean reversion. History shows it won’t necessarily happen in Phase I, though, and TINA may stave it off while there is a dearth of non-equity options offering positive prospective real returns. Disclaimer (BCA Is Human, Too) How can you be certain that your estimate of the equilibrium rate is accurate? We are not certain at all about the level of the equilibrium rate, and nothing we’ve ever written or said should be construed as implying that we are. As we’ve said many times before, the equilibrium rate is a concept. It cannot be directly observed and our attempts to estimate it are no more than our best effort to gain a sense of where the tipping point for financial markets and the economy might be. Our current 3.25% estimate likely sounds quite high, but we take the estimates at any given point in time with a grain of salt. We are not so full of ourselves that we believe we can pin down an amorphous concept to two decimal places in real time, and we have found that thinking of the point estimate as falling within a plausible range is the best way to proceed. Right now, the US Investment Strategy team views the equilibrium rate as somewhere around 2.5% or higher. That’s all the precision we need to assert with high conviction that monetary policy is accommodative and will remain so for all of 2022 and much, if not all, of 2023. For all the inherent uncertainty of attempts to quantify the equilibrium rate, however, the sharp disparity in equity performance across easy and tight monetary policy settings suggests that we’re on the right track. We’re further encouraged by the clear distinctions in earnings and multiples growth across phases (Figure 1), which suggest that monetary policy settings exert a persistent influence on fundamentals and investor appetites. Given that equities have flourished when policy is easy, overweighting stocks in multi-asset portfolios should contribute to outperformance over the next twelve months. Monetary policy settings are not the be-all and the end-all, but we have found that they offer a very useful default guide to asset allocation.
Chart
Fooled By Randomness? The results have been robust over a lengthy period, but how do you know they’re not random? Why does the relationship you’ve cited work? We are convinced that the observed strong-growth/tighter-policy, tepid-growth/easier-policy relationship has a durable structural foundation. The through line is the fact that monetary policy is a blunt instrument that works with indeterminate lags. Its limitations influence the way the Fed deploys it and impose a predictable pattern on its economic and market impacts. The Fed is not quite the meddler that its Libertarian-minded critics make it out to be, hovering over the economy in a continuous effort to fine-tune it. Instead, it acts on a limited basis to ensure that the harms embedded in cyclical extremes do not prevent the economy from reaching its long-run potential. It deploys accommodative measures during recessions to keep hysteresis from turning a cyclical soft patch into a structural albatross and restrictive measures during high-revving expansions to keep the inflation genie from getting out of the bottle. The Fed does not want to root out green shoots before they can take hold, so it does not begin Phase I, or assiduously pursue it, until it is certain that the economy can withstand higher rates, especially while (lagging) inflation readings are tame (Chart 3). It therefore launches tightening cycles with a predictable bias to err on the side of being too easy. Chart 3Inflation Is A Lagging Indicator, ...
Inflation Is A Lagging Indicator, ...
Inflation Is A Lagging Indicator, ...
That bias allows the economy to gather momentum in Phase I, in line with cyclical peaks in activity and earnings growth, and outsized equity and credit returns. Left unchecked, the momentum could produce higher inflation, and the Fed is typically compelled to dial up intervention to counter it. Wielding a blunt instrument that works with a lag, however, the Fed is at risk of going too far, and Phase II hikes often induce a recession. Investors sniff out the looming downturn and de-rate equities. By the time the Fed reverses field and initiates a new easing campaign (Phase III), earnings growth has stalled out and measured inflation is peaking (Table 3). Equities mark time and credit spreads widen until, with a slowdown plainly evident and measured inflation sliding, the Fed shifts to full-on accommodation (Phase IV). It maintains market-friendly settings until the economy begins to look too strong, upon which it intervenes to hold it back, kicking off a new policy cycle. Table 3... Managed With Policy That Works With A Lag
Q&A About Rate Hikes And Stocks
Q&A About Rate Hikes And Stocks
As we showed last week, the direct relationship between activity and rates is immediately apparent in the real economy. Robust activity translates to robust earnings growth, but it is possible that equity multiples will behave differently in the approaching fed funds rate cycle than they have in the past. Although we expect that TINA will protect equities from meaningful de-rating pressure this year, investors should not lose sight of the fact that the earnings estimate era began with the S&P 500’s forward P/E multiple at 7. That rock-bottom starting point paved the way for an annualized 2.6% valuation increase over the last 42 years, but it cannot continue indefinitely, if at all. We are confident that multiples will continue to fare better when the Fed is cutting rates than when it is hiking them, but the cutting tailwinds will likely weaken going forward, while the hiking headwinds will stiffen. Don’t Believe The Hype Tech stocks are especially vulnerable to higher interest rates and the fate of US indexes is intimately bound up with them. Aren’t you dismissing the threat from higher rates a little too easily? The Tech sector’s outsized presence in the S&P 500 has surely contributed to market anxieties over looming rate hikes. We are firmly of the view, however, that popular concerns over Tech stocks’ interest rate vulnerability are way overdone. The idea that their back-loaded earnings profile makes them acutely vulnerable to a higher discount rate in the manner of long duration bonds ignores the fact that their future cash flows are not fixed. Unlike bonds, their owners' claims on earnings ebb and flow as rates rise and fall in line with economic conditions. Chart 4Relative Tech Multiples Have Mostly Moved With Rates, Not Against Them
Relative Tech Multiples Have Mostly Moved With Rates, Not Against Them
Relative Tech Multiples Have Mostly Moved With Rates, Not Against Them
Chart 5
We recently devoted a Special Report to pushing back against the idea that Tech stocks are hostage to interest rates. In it, we argued that a stock’s price can be viewed as the product of its earnings per share and its P/E ratio. The biggest Tech companies’ earnings have a low interest rate sensitivity because they have little debt and do not sell big-ticket items that their customers have to finance, so the purported inverse relationship between Tech stocks’ relative performance and interest rates must be a function of relative P/E multiple changes. Relative Tech multiples and interest rates consistently moved together in the ten years through 2018, however, and were only sporadically negatively correlated over the last three years (Chart 4). Duration is essential for describing the sensitivity of risk-free bond returns to changes in interest rates, but it is an uncomfortable fit with equities. Treasuries exhibit a nearly perfect inverse correlation with changes in interest rates (Chart 5, top panel), but the cash flow uncertainty introduced by even the modest credit risk associated with investment grade corporate bonds reduces the correlation considerably (Chart 5, second panel). Interest rates’ impact on equities is even more attenuated. The S&P 500 is only weakly – and positively – correlated with rates (Chart 5, third panel), just like its Tech sector constituents (Chart 5, bottom panel). Doug Peta, CFA Chief US Investment Strategist dougp@bcaresearch.com
US mortgage rates have been soaring since the beginning of the year alongside Treasury yields. They are now at a pandemic high. In general, rising mortgage rates are a negative development for the US housing market as higher home loan borrowing costs weigh…
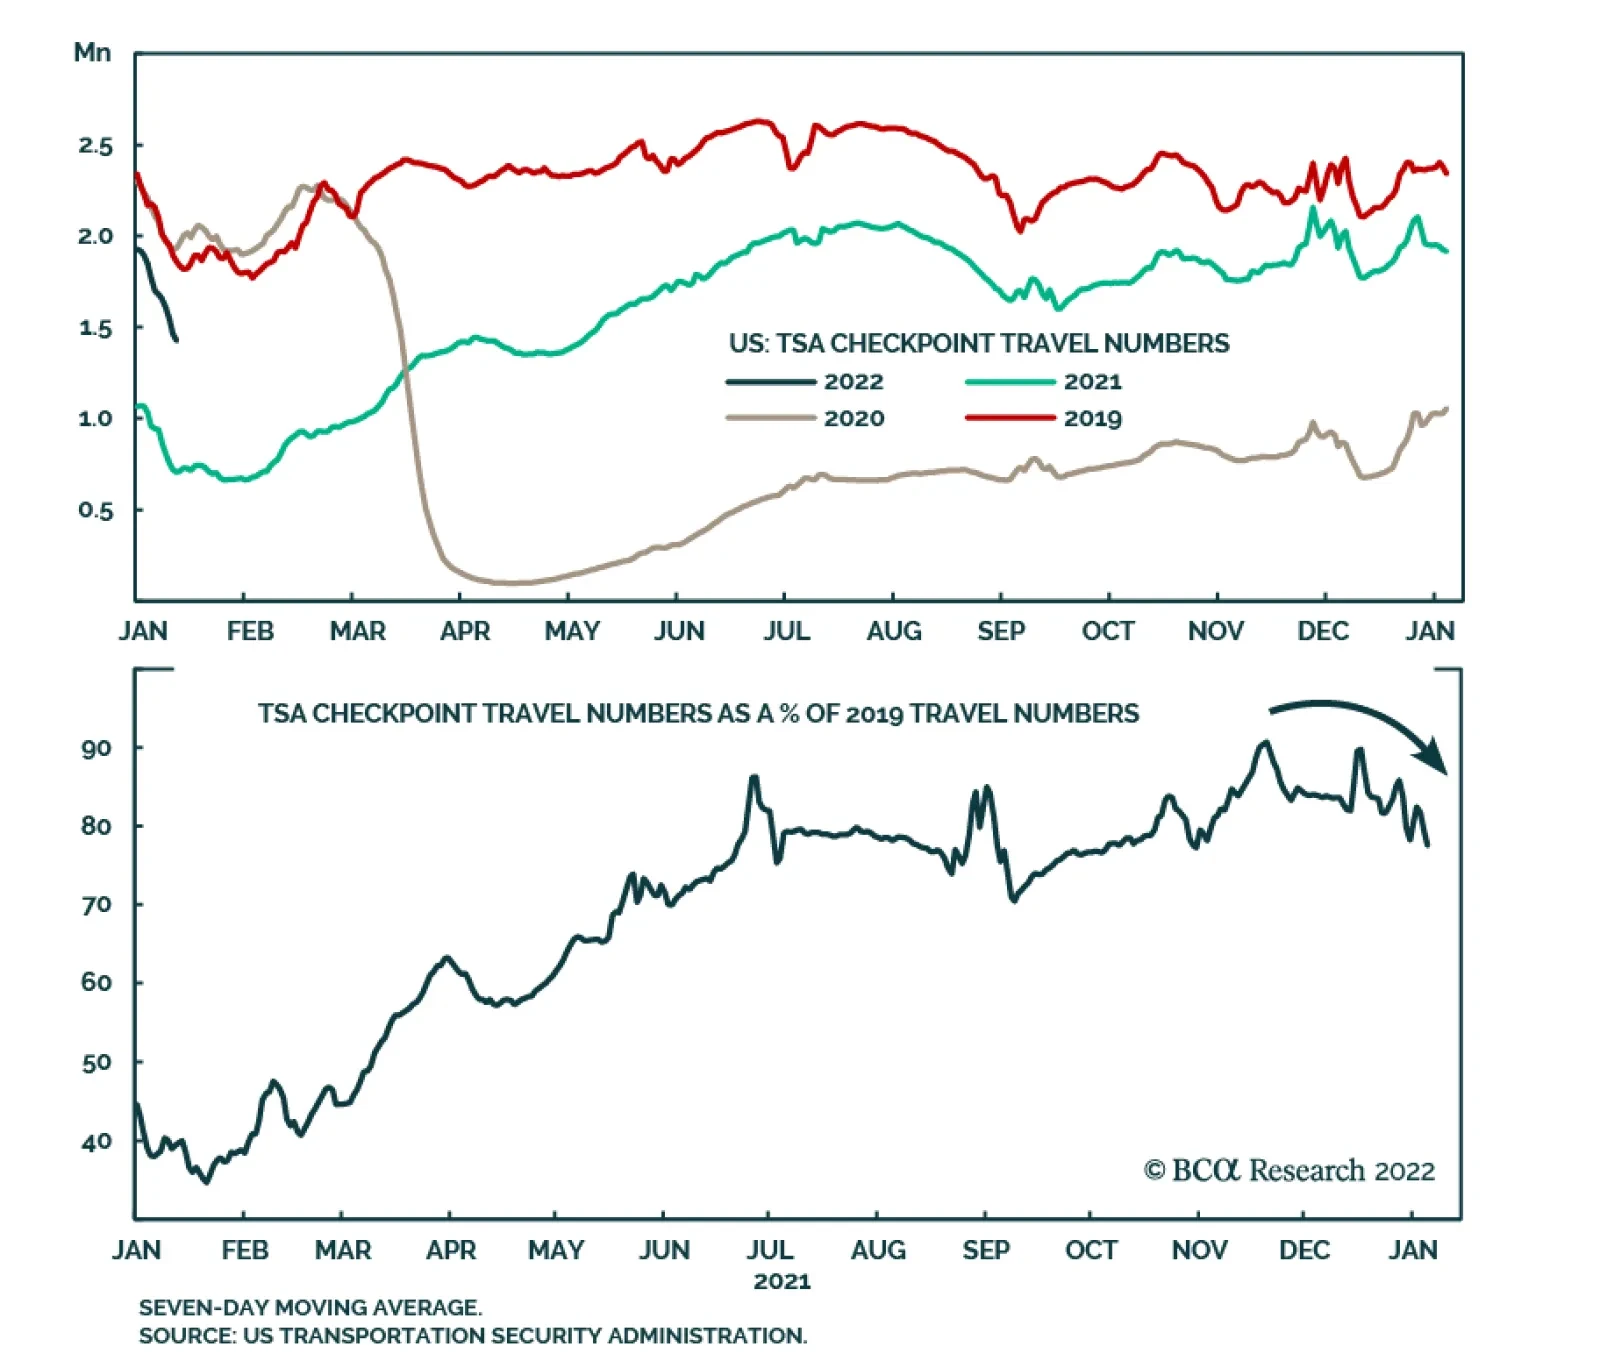
Data from the US Transportation Security Administration (TSA) indicate that the latest surge in COVID-19 cases has weighed down on US travel. The number of travelers screened at TSA checkpoints in US airports increased markedly over the past year. At the…
Highlights Chinese stocks are currently trading close to their fair value in absolute terms. When equity valuations are neutral, the direction of the next move in stocks depends on the profit outlook. Chinese corporate earnings are set to contract in the next six months. This means that the risk-reward profile of Chinese stocks in absolute terms is not yet attractive. Historically, share prices lagged the turning points in China’s money/credit impulses by several months. Even though the money/credit cycle is now bottoming, a buying opportunity in stocks will likely transpire in the coming months at a lower level. Relative to EM and global stocks, Chinese equities offer value. Hence, their relative performance will likely enter a rollercoaster phase. The secular outlook for corporate profitability among listed Chinese companies remains uninspiring. Hence, a structural re-rating of China stock indexes is unlikely. Feature With Chinese share prices down considerably in the past 12 months, a pertinent question is whether they offer an attractive entry point. Dissecting both valuations and the corporate earnings outlook are the key to getting the cyclical view right. This report aims to do this for both the MSCI Investable and MSCI A-share equity indexes. Our conclusion is as follows: in absolute terms, the Chinese MSCI Investable and A-share indexes have neutral valuations. Yet, the risk window for share prices remains open because corporate profits are set to contract. Also, bottoms and peaks in the money/credit cycle lead share prices by several months as illustrated in Chart 1. Hence, a tentative bottom in money/credit indicators does not always herald an imminent and sustainable equity rally.
China: Lead-Lag Relationship Between Share Prices And Money/Credit Cycles Varies
China: Lead-Lag Relationship Between Share Prices And Money/Credit Cycles Varies
Valuations
Chinese Equity Valuation in Absolute Terms
Chinese Equity Valuation in Absolute Terms
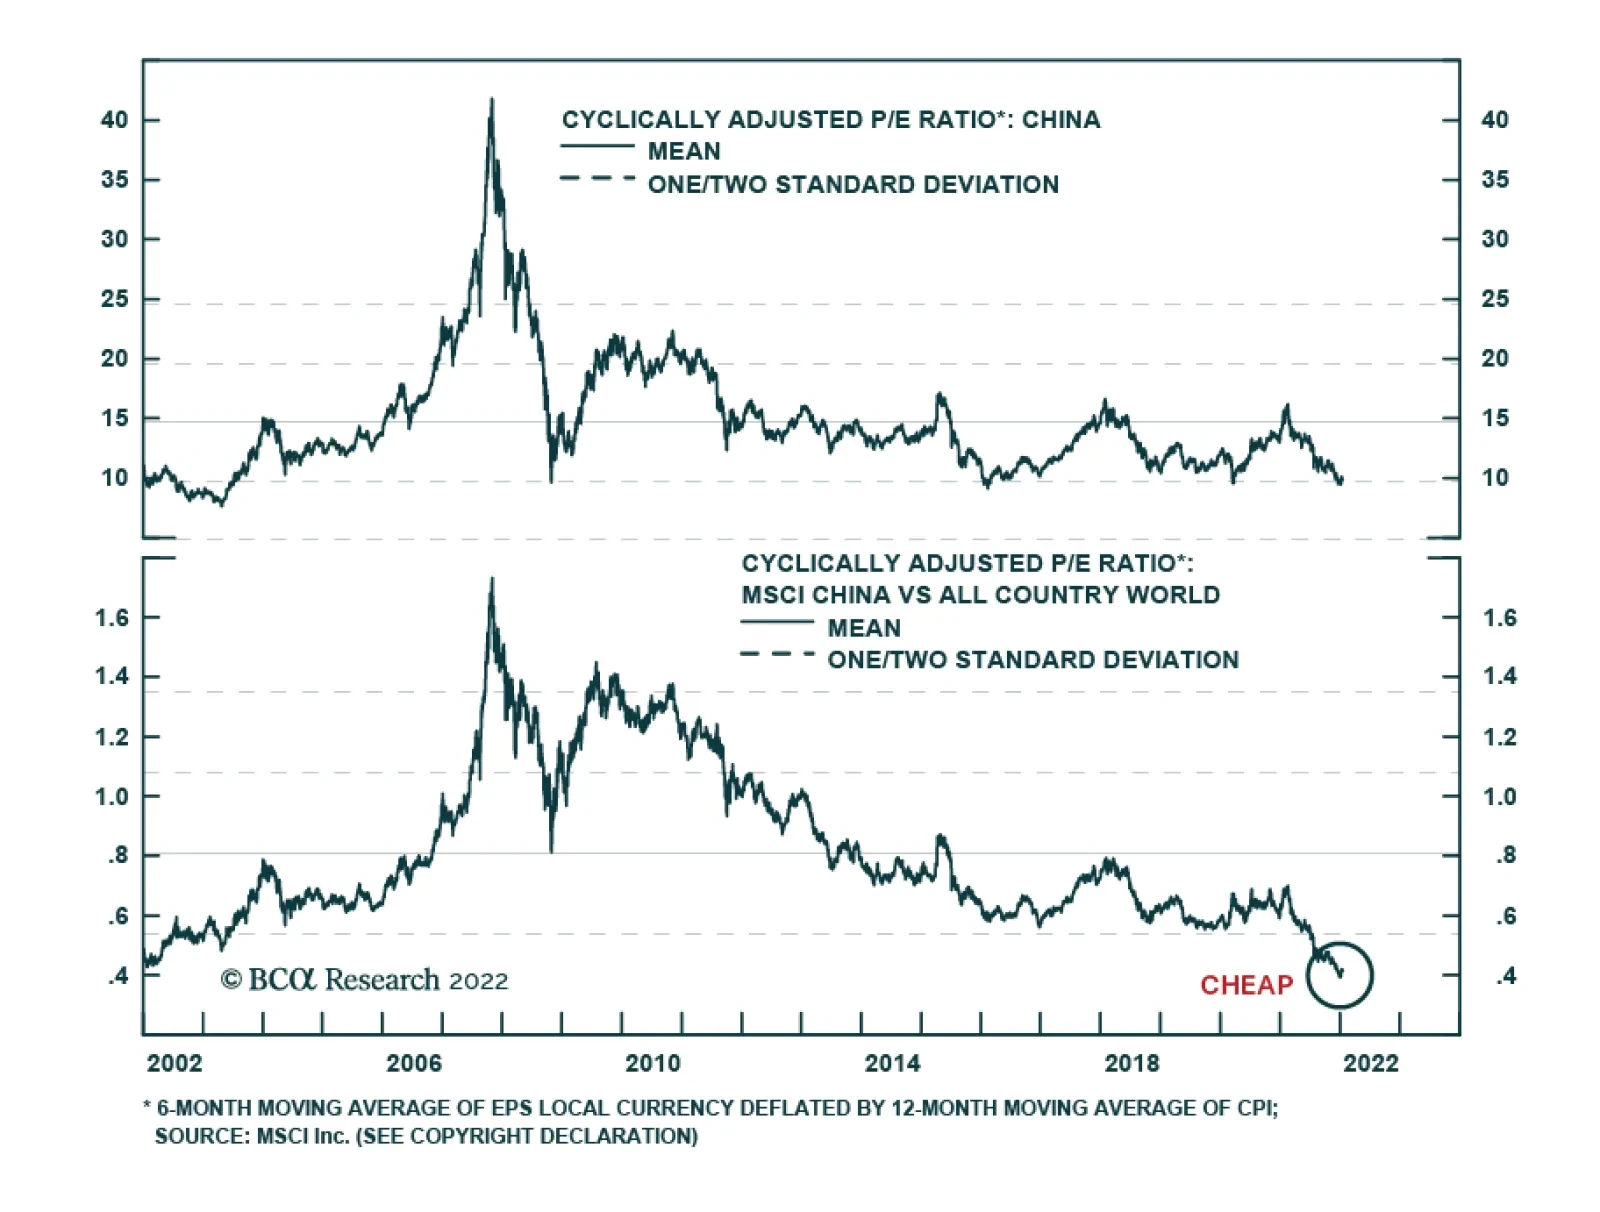
Chinese equity valuations are by and large neutral. Specifically: 1. According to our aggregate composite valuation indicators, onshore A shares are fairly valued while the MSCI Investable index is slightly above its historical mean (Chart 2). This aggregate composite valuation indicator for both equity indexes is composed of three components: based on (1) median multiples; (2) 20% trimmed-mean multiples; and (3) equal-weighted multiples. The latter uses equal weights rather than market cap weights for sub-sectors in the calculation. In turn, each component is constructed using the averages of the trailing P/E, forward P/E, price-to-cash earnings,1 price-to-book value (PBV) and price-to-dividend ratios. The 20%-trimmed mean excludes the top 10% and the bottom 10% of sub-sectors, i.e., it removes outliers. 2. We have also calculated a cyclically adjusted P/E (CAPE) ratio for both A shares and MSCI Investable stocks. The CAPE ratio for A shares is slightly below its historical mean (Chart 3), and the one for the MSCI Investable index is one standard deviation below its mean (Chart 4).
China A-shares: CAPE Ratio
China A-shares: CAPE Ratio
Chinese MSCI Investable Stocks: CAPE Ratio
Chinese MSCI Investable Stocks: CAPE Ratio
The idea behind the CAPE model is to remove the cyclicality of corporate profits when computing the P/E ratio. The CAPE model gauges stock valuations under the assumption that real (inflation-adjusted) EPS converges to its trend line. Importantly, the CAPE ratio is a structural valuation model, i.e., it works over the long run. Only investors with a time horizon greater than 3-5 years should use CAPE in their investment decisions. Below, we discuss the risks to Chinese corporate profits from both cyclical and structural viewpoints. We contend that a low CAPE ratio might not be unreasonable for listed Chinese companies, as their profitability has deteriorated over the past 10-12 years and their secular profit outlook is very uncertain. 3. The equity risk premium incorporates interest rates into valuations. We computed the equity risk premium by subtracting Chinese onshore government bond yields in real terms (deflated by headline CPI) from the trailing earnings yield of stocks. Chart 5 demonstrates that the equity risk premiums for A shares and investable stocks are near their historical mean, signifying neutral Chinese equity valuations at present. Relative to DM and EM equities, Chinese valuations appear to be attractive as Chinese share prices have massively underperformed their EM and DM peers in the past 12 months (Chart 6).
Equity Risk Premium For China
Equity Risk Premium For China
Chinese Equity Valuations Relative To EM And DM
Chinese Equity Valuations Relative To EM And DM
Bottom Line: Chinese equity valuations are by and large neutral in absolute terms. When equity valuations are neutral, the next move in share prices depends on the profit outlook. If profits expand/contract, stocks will rally/sell off. Corporate Earnings: The Cyclical Outlook Chinese corporate profits are set to contract in this downturn. Chart 7 shows that Chinese aggregate industrial profits will shrink by single digits in the next nine months from a year ago. This model is based on a regression of aggregate industrial profits on China’s credit impulse. A similar model that regresses A-share non-financial companies’ net profits on narrow money (M1) growth is also pointing to a roughly 5% corporate earnings contraction in the months ahead (Chart 8).
China: Industrial Profits Will Post A Single Digit Contraction
China: Industrial Profits Will Post A Single Digit Contraction
Chinese A-share Profits Will Shrink In Mid-2022
Chinese A-share Profits Will Shrink In Mid-2022
Is government stimulus sufficient to produce a recovery in the business cycle and in company earnings? So far, government stimulus has been insufficient to produce a meaningful recovery in H1 2022. In particular, the changes in the excess reserve ratio lead the credit impulse by six months, and the latter signifies only a stabilization, but not a meaningful improvement in the credit impulse prior to May 2022 (Chart 9). Given that the credit impulse leads industrial companies’ earnings by about nine months (please refer to Chart 7 above), odds are that corporate profits will not bottom until H2 2022. As for service industries, online retail sales of goods and services remain weak, reflecting sluggish household income growth (Chart 10).
Liquidity Is Pointing To Stabilization But Not A Surge in The Credit Impluse
Liquidity Is Pointing To Stabilization But Not A Surge in The Credit Impluse
China: Internet Sales Are Disappointing
China: Internet Sales Are Disappointing
There has also been another factor weighing on China’s business cycle – a declining marginal propensity to spend among both households and companies (Chart 11). The marginal propensity to spend depends on sentiment and confidence among consumers and companies. A declining propensity to spend will dampen the positive effects from government stimulus. Notably, there has been a dramatic profit divergence in industrial sectors. Commodity-producing sectors – metals and mining, steel, energy and coal – have posted an earnings windfall. In contrast, industries consuming commodities – machinery, construction materials, autos, IT and food/beverages – have seen their profits plunge (Chart 12).
Dramatic Profit Divergence Between Commodity Producers And Users
Dramatic Profit Divergence Between Commodity Producers And Users
China: The Marginal Propensity To Spend Is Declining
China: The Marginal Propensity To Spend Is Declining
Chinese Imports Of Key Commodities Have Shrunk Drastically
Chinese Imports Of Key Commodities Have Shrunk Drastically
The reason for this industrial earnings dichotomy is that commodity prices have not fallen despite the weakness in China’s business cycle and its commodity imports (Chart 13). Critically, commodity users have not been able to pass on higher input costs to their customers due to weak demand. Consequently, commodity users have experienced a drastic profit margin squeeze and their earnings have plummeted. If commodity prices drop meaningfully, the profit divergence between these two groups of industrial enterprises will narrow. Yet, it will not improve the level of overall industrial profits in China. The rationale is that in the past six months, industrial profits of commodity users have accounted for 20% of aggregate industrial profits, while those of commodity producers have accounted for 80%. This reinforces the importance of commodity prices in driving China’s industrial profit cycles. Our view on commodity prices is as follows: Commodity prices have so far ignored China’s slowdown. However, the Fed’s tightening and the US dollar’s persistent strength amid the lack of a meaningful recovery in the Chinese business cycle will eventually produce a drawdown in resource prices in the coming months, as we discussed in last week’s report. Bottom Line: As policy stimulus gets more aggressive, China’s growth and corporate earnings will recover in H2. Yet, in H1 corporate profits are set to disappoint. This implies that Chinese share prices will remain in a risk window for now. Corporate Profitability: The Structural Outlook Investors reward companies with high or rising return on equity by bidding up their equity multiples, and vice versa. One of the main reasons why the structural valuation measures for Chinese equity indexes (like the CAPE ratio) have declined in the past 10 years is worsening corporate profitability. Specifically, the return on assets (RoA) and the return on equity (RoE) for non-financial companies included in the MSCI A-share and Investable indexes have been falling since 2011 (Chart 14, top and middle panels). Periodic government stimulus improved corporate profitability temporarily. Yet, as stimulus waned, corporate profitability deteriorated. Consistently, Chinese investable non-TMT stocks have produced zero price appreciation in absolute terms since 2011 (Chart 14, bottom panel). In the past 10 years, there has been a structural deterioration in the financial performance metrics of industrial companies. Their RoE and RoA have fallen as have turnover in account assets (sales/assets), inventory (sales/inventory) and account receivables (sales/account receivables) (Chart 15). It is unclear if this secular trend of deteriorating corporate financial performance will reverse if authorities repeatedly rescue the economy by unleashing large stimulus.
Worsening Profitability Has Been Behind Poor Equity Returns in China
Worsening Profitability Has Been Behind Poor Equity Returns in China
Chinese Industrial Companies: Structural Deterioration in Financial Performance
Chinese Industrial Companies: Structural Deterioration in Financial Performance
As for technology/internet/platform companies, we maintain that the regulatory changes affecting Chinese internet stocks are structural rather than cyclical in nature. There could be periods when the pace of regulatory clampdown eases, but these regulations will not be rolled back in any meaningful way. Authorities will cap these companies’ profitability like regulators do with monopolies and oligopolies, which heralds a lower return on equity and low multiples. For very different reasons, US and Chinese authorities do not want Chinese companies to be listed in the US. And when Chinese and US authorities do not want to see some of these stocks listed in the US, they will not be. Odds are rising that a few of them might be delisted in the coming years. In such a scenario, many US institutional investors will likely offload their holdings of these companies. Finally, Chinese bank stocks are cheap for a reason. They have not recognized a massive amount of non-performing loans and have not provisioned for them. Going forward, another roadblock to shareholders of Chinese stocks is the common prosperity policies that the Chinese government has championed. These policies will redistribute income away from shareholders to the general population. Chart 16 illustrates the share of labor compensation has been rising since 2011 while the share of profits has been declining. Not surprisingly, Chinese investable non-TMT stocks have been doing very poorly since 2011 (Chart 14, bottom panel).
National Income Composition: Labor"s Share Will Continue Rising
National Income Composition: Labor"s Share Will Continue Rising
The common prosperity policies will only reinforce the existing trend of a rising share of labor compensation at the expense of shareholders in the coming years. This bodes ill for structural profitability and justifies low equity multiples. In short, a low CAPE ratio for Chinese stocks might not be out of line with such a downbeat secular outlook. Bottom Line: Even if there have been – and still will be – great companies in China that deliver phenomenal performance, their shareholders might not be in a position to reap the benefits of such solid performance. In short, the structural outlook for profitability among listed companies remains uncertain. Investment Recommendations
Our Recommendations For Chinese Equity Investors
Our Recommendations For Chinese Equity Investors
Chinese stocks, especially investable ones, are oversold and might rebound in the very near term in absolute terms. However, the three-to-six-month outlook for absolute performance remains poor. Relative to EM and global stocks, Chinese equities are very oversold and offer value. Hence, their relative performance will likely enter a rollercoaster phase. Onshore Chinese stocks will underperform onshore government bonds. Within the Chinese equity universe, we have been recommending the following strategies and they remain intact: Long A shares/short MSCI Investable index since March 4, 2021 (Chart 17, top panel). This relative ratio is overbought and will likely pull back in the near term. However, the cyclical and structural outlook continues to favor onshore stocks versus the investable universe. Short Chinese investable value stocks/long global value stocks since November 26, 2020 (Chart 17, middle panel). This strategy remains intact. Short onshore and investable property stocks versus their respective benchmarks since May 9, 2019 (Chart 17, bottom panel). The woes of property developers are not over. Please refer to our Special Report on the Chinese property market. Long large banks/short medium and small listed banks since October 2016. Small and medium banks are exposed to the continuous woes in the property market much more than the large ones. Also, their profitability will be more negatively affected by the retrenchment in shadow banking activities. Arthur Budaghyan Chief Emerging Markets Strategist arthurb@bcaresearch.com Footnotes 1 MSCI defines cash earnings as earnings per share including depreciation and amortization as reported by the company.