Equities

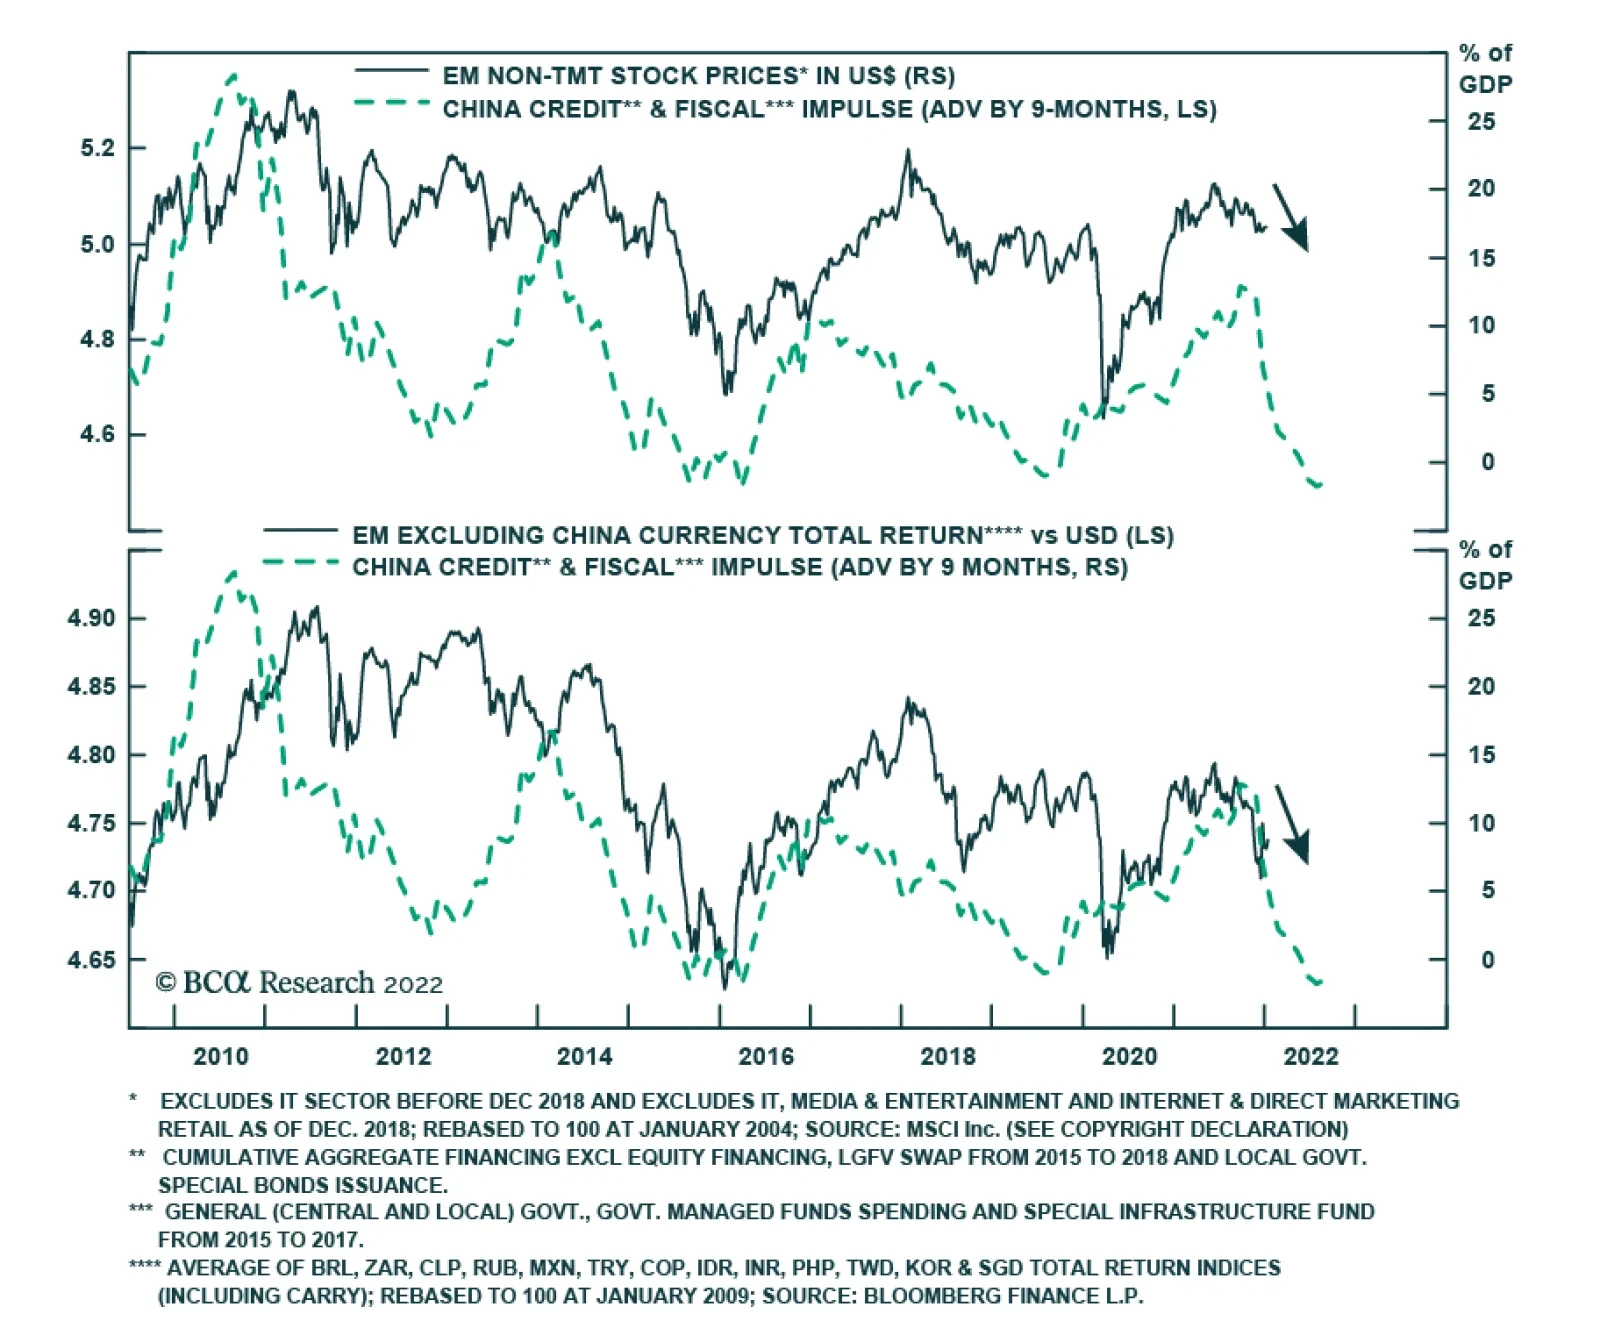
Highlights Chinese stocks are currently trading close to their fair value in absolute terms. When equity valuations are neutral, the direction of the next move in stocks depends on the profit outlook. Chinese corporate earnings are set to contract in the next six months. This means that the risk-reward profile of Chinese stocks in absolute terms is not yet attractive. Historically, share prices lagged the turning points in China’s money/credit impulses by several months. Even though the money/credit cycle is now bottoming, a buying opportunity in stocks will likely transpire in the coming months at a lower level. Relative to EM and global stocks, Chinese equities offer value. Hence, their relative performance will likely enter a rollercoaster phase. The secular outlook for corporate profitability among listed Chinese companies remains uninspiring. Hence, a structural re-rating of China stock indexes is unlikely. Feature With Chinese share prices down considerably in the past 12 months, a pertinent question is whether they offer an attractive entry point. Dissecting both valuations and the corporate earnings outlook are the key to getting the cyclical view right. This report aims to do this for both the MSCI Investable and MSCI A-share equity indexes. Our conclusion is as follows: in absolute terms, the Chinese MSCI Investable and A-share indexes have neutral valuations. Yet, the risk window for share prices remains open because corporate profits are set to contract. Also, bottoms and peaks in the money/credit cycle lead share prices by several months as illustrated in Chart 1. Hence, a tentative bottom in money/credit indicators does not always herald an imminent and sustainable equity rally. Chart 1China: Lead-Lag Relationship Between Share Prices And Money/Credit Cycles Varies
China: Lead-Lag Relationship Between Share Prices And Money/Credit Cycles Varies
China: Lead-Lag Relationship Between Share Prices And Money/Credit Cycles Varies
Valuations Chart 2Chinese Equity Valuation in Absolute Terms
Chinese Equity Valuation in Absolute Terms
Chinese Equity Valuation in Absolute Terms
Chinese equity valuations are by and large neutral. Specifically: 1. According to our aggregate composite valuation indicators, onshore A shares are fairly valued while the MSCI Investable index is slightly above its historical mean (Chart 2). This aggregate composite valuation indicator for both equity indexes is composed of three components: based on (1) median multiples; (2) 20% trimmed-mean multiples; and (3) equal-weighted multiples. The latter uses equal weights rather than market cap weights for sub-sectors in the calculation. In turn, each component is constructed using the averages of the trailing P/E, forward P/E, price-to-cash earnings,1 price-to-book value (PBV) and price-to-dividend ratios. The 20%-trimmed mean excludes the top 10% and the bottom 10% of sub-sectors, i.e., it removes outliers. 2. We have also calculated a cyclically adjusted P/E (CAPE) ratio for both A shares and MSCI Investable stocks. The CAPE ratio for A shares is slightly below its historical mean (Chart 3), and the one for the MSCI Investable index is one standard deviation below its mean (Chart 4). Chart 3China A-Shares: CAPE Ratio
China A-shares: CAPE Ratio
China A-shares: CAPE Ratio
Chart 4Chinese MSCI Investable Stocks: CAPE Ratio
Chinese MSCI Investable Stocks: CAPE Ratio
Chinese MSCI Investable Stocks: CAPE Ratio
The idea behind the CAPE model is to remove the cyclicality of corporate profits when computing the P/E ratio. The CAPE model gauges stock valuations under the assumption that real (inflation-adjusted) EPS converges to its trend line. Importantly, the CAPE ratio is a structural valuation model, i.e., it works over the long run. Only investors with a time horizon greater than 3-5 years should use CAPE in their investment decisions. Below, we discuss the risks to Chinese corporate profits from both cyclical and structural viewpoints. We contend that a low CAPE ratio might not be unreasonable for listed Chinese companies, as their profitability has deteriorated over the past 10-12 years and their secular profit outlook is very uncertain. 3. The equity risk premium incorporates interest rates into valuations. We computed the equity risk premium by subtracting Chinese onshore government bond yields in real terms (deflated by headline CPI) from the trailing earnings yield of stocks. Chart 5 demonstrates that the equity risk premiums for A shares and investable stocks are near their historical mean, signifying neutral Chinese equity valuations at present. Relative to DM and EM equities, Chinese valuations appear to be attractive as Chinese share prices have massively underperformed their EM and DM peers in the past 12 months (Chart 6). Chart 5Equity Risk Premium For China
Equity Risk Premium For China
Equity Risk Premium For China
Chart 6Chinese Equity Valuations Relative To EM And DM
Chinese Equity Valuations Relative To EM And DM
Chinese Equity Valuations Relative To EM And DM
Bottom Line: Chinese equity valuations are by and large neutral in absolute terms. When equity valuations are neutral, the next move in share prices depends on the profit outlook. If profits expand/contract, stocks will rally/sell off. Corporate Earnings: The Cyclical Outlook Chinese corporate profits are set to contract in this downturn. Chart 7 shows that Chinese aggregate industrial profits will shrink by single digits in the next nine months from a year ago. This model is based on a regression of aggregate industrial profits on China’s credit impulse. A similar model that regresses A-share non-financial companies’ net profits on narrow money (M1) growth is also pointing to a roughly 5% corporate earnings contraction in the months ahead (Chart 8). Chart 7China: Industrial Profits Will Post A Single Digit Contraction
China: Industrial Profits Will Post A Single Digit Contraction
China: Industrial Profits Will Post A Single Digit Contraction
Chart 8Chinese A-Share Profits Will Shrink In Mid-2022
Chinese A-share Profits Will Shrink In Mid-2022
Chinese A-share Profits Will Shrink In Mid-2022
Is government stimulus sufficient to produce a recovery in the business cycle and in company earnings? So far, government stimulus has been insufficient to produce a meaningful recovery in H1 2022. In particular, the changes in the excess reserve ratio lead the credit impulse by six months, and the latter signifies only a stabilization, but not a meaningful improvement in the credit impulse prior to May 2022 (Chart 9). Given that the credit impulse leads industrial companies’ earnings by about nine months (please refer to Chart 7 above), odds are that corporate profits will not bottom until H2 2022. As for service industries, online retail sales of goods and services remain weak, reflecting sluggish household income growth (Chart 10). Chart 9Liquidity Is Pointing To Stabilization But Not A Surge in The Credit Impulse
Liquidity Is Pointing To Stabilization But Not A Surge in The Credit Impluse
Liquidity Is Pointing To Stabilization But Not A Surge in The Credit Impluse
Chart 10China: Internet Sales Are Disappointing
China: Internet Sales Are Disappointing
China: Internet Sales Are Disappointing
There has also been another factor weighing on China’s business cycle – a declining marginal propensity to spend among both households and companies (Chart 11). The marginal propensity to spend depends on sentiment and confidence among consumers and companies. A declining propensity to spend will dampen the positive effects from government stimulus. Notably, there has been a dramatic profit divergence in industrial sectors. Commodity-producing sectors – metals and mining, steel, energy and coal – have posted an earnings windfall. In contrast, industries consuming commodities – machinery, construction materials, autos, IT and food/beverages – have seen their profits plunge (Chart 12). Chart 12Dramatic Profit Divergence Between Commodity Producers And Users
Dramatic Profit Divergence Between Commodity Producers And Users
Dramatic Profit Divergence Between Commodity Producers And Users
Chart 11China: The Marginal Propensity To Spend Is Declining
China: The Marginal Propensity To Spend Is Declining
China: The Marginal Propensity To Spend Is Declining
Chart 13Chinese Imports Of Key Commodities Have Shrunk Drastically
Chinese Imports Of Key Commodities Have Shrunk Drastically
Chinese Imports Of Key Commodities Have Shrunk Drastically
The reason for this industrial earnings dichotomy is that commodity prices have not fallen despite the weakness in China’s business cycle and its commodity imports (Chart 13). Critically, commodity users have not been able to pass on higher input costs to their customers due to weak demand. Consequently, commodity users have experienced a drastic profit margin squeeze and their earnings have plummeted. If commodity prices drop meaningfully, the profit divergence between these two groups of industrial enterprises will narrow. Yet, it will not improve the level of overall industrial profits in China. The rationale is that in the past six months, industrial profits of commodity users have accounted for 20% of aggregate industrial profits, while those of commodity producers have accounted for 80%. This reinforces the importance of commodity prices in driving China’s industrial profit cycles. Our view on commodity prices is as follows: Commodity prices have so far ignored China’s slowdown. However, the Fed’s tightening and the US dollar’s persistent strength amid the lack of a meaningful recovery in the Chinese business cycle will eventually produce a drawdown in resource prices in the coming months, as we discussed in last week’s report. Bottom Line: As policy stimulus gets more aggressive, China’s growth and corporate earnings will recover in H2. Yet, in H1 corporate profits are set to disappoint. This implies that Chinese share prices will remain in a risk window for now. Corporate Profitability: The Structural Outlook Investors reward companies with high or rising return on equity by bidding up their equity multiples, and vice versa. One of the main reasons why the structural valuation measures for Chinese equity indexes (like the CAPE ratio) have declined in the past 10 years is worsening corporate profitability. Specifically, the return on assets (RoA) and the return on equity (RoE) for non-financial companies included in the MSCI A-share and Investable indexes have been falling since 2011 (Chart 14, top and middle panels). Periodic government stimulus improved corporate profitability temporarily. Yet, as stimulus waned, corporate profitability deteriorated. Consistently, Chinese investable non-TMT stocks have produced zero price appreciation in absolute terms since 2011 (Chart 14, bottom panel). In the past 10 years, there has been a structural deterioration in the financial performance metrics of industrial companies. Their RoE and RoA have fallen as have turnover in account assets (sales/assets), inventory (sales/inventory) and account receivables (sales/account receivables) (Chart 15). It is unclear if this secular trend of deteriorating corporate financial performance will reverse if authorities repeatedly rescue the economy by unleashing large stimulus. Chart 14Worsening Profitability Has Been Behind Poor Equity Returns in China
Worsening Profitability Has Been Behind Poor Equity Returns in China
Worsening Profitability Has Been Behind Poor Equity Returns in China
Chart 15Chinese Industrial Companies: Structural Deterioration in Financial Performance
Chinese Industrial Companies: Structural Deterioration in Financial Performance
Chinese Industrial Companies: Structural Deterioration in Financial Performance
As for technology/internet/platform companies, we maintain that the regulatory changes affecting Chinese internet stocks are structural rather than cyclical in nature. There could be periods when the pace of regulatory clampdown eases, but these regulations will not be rolled back in any meaningful way. Authorities will cap these companies’ profitability like regulators do with monopolies and oligopolies, which heralds a lower return on equity and low multiples. For very different reasons, US and Chinese authorities do not want Chinese companies to be listed in the US. And when Chinese and US authorities do not want to see some of these stocks listed in the US, they will not be. Odds are rising that a few of them might be delisted in the coming years. In such a scenario, many US institutional investors will likely offload their holdings of these companies. Finally, Chinese bank stocks are cheap for a reason. They have not recognized a massive amount of non-performing loans and have not provisioned for them. Going forward, another roadblock to shareholders of Chinese stocks is the common prosperity policies that the Chinese government has championed. These policies will redistribute income away from shareholders to the general population. Chart 16 illustrates the share of labor compensation has been rising since 2011 while the share of profits has been declining. Not surprisingly, Chinese investable non-TMT stocks have been doing very poorly since 2011 (Chart 14, bottom panel). Chart 16National Income Composition: Labor’s Share Will Continue Rising
National Income Composition: Labor"s Share Will Continue Rising
National Income Composition: Labor"s Share Will Continue Rising
The common prosperity policies will only reinforce the existing trend of a rising share of labor compensation at the expense of shareholders in the coming years. This bodes ill for structural profitability and justifies low equity multiples. In short, a low CAPE ratio for Chinese stocks might not be out of line with such a downbeat secular outlook. Bottom Line: Even if there have been – and still will be – great companies in China that deliver phenomenal performance, their shareholders might not be in a position to reap the benefits of such solid performance. In short, the structural outlook for profitability among listed companies remains uncertain. Investment Recommendations Chart 17Our Recommendations For Chinese Equity Investors
Our Recommendations For Chinese Equity Investors
Our Recommendations For Chinese Equity Investors
Chinese stocks, especially investable ones, are oversold and might rebound in the very near term in absolute terms. However, the three-to-six-month outlook for absolute performance remains poor. Relative to EM and global stocks, Chinese equities are very oversold and offer value. Hence, their relative performance will likely enter a rollercoaster phase. Onshore Chinese stocks will underperform onshore government bonds. Within the Chinese equity universe, we have been recommending the following strategies and they remain intact: Long A shares/short MSCI Investable index since March 4, 2021 (Chart 17, top panel). This relative ratio is overbought and will likely pull back in the near term. However, the cyclical and structural outlook continues to favor onshore stocks versus the investable universe. Short Chinese investable value stocks/long global value stocks since November 26, 2020 (Chart 17, middle panel). This strategy remains intact. Short onshore and investable property stocks versus their respective benchmarks since May 9, 2019 (Chart 17, bottom panel). The woes of property developers are not over. Please refer to our Special Report on the Chinese property market. Long large banks/short medium and small listed banks since October 2016. Small and medium banks are exposed to the continuous woes in the property market much more than the large ones. Also, their profitability will be more negatively affected by the retrenchment in shadow banking activities. Arthur Budaghyan Chief Emerging Markets Strategist arthurb@bcaresearch.com Footnotes 1 MSCI defines cash earnings as earnings per share including depreciation and amortization as reported by the company.
Highlights We introduce a novel concept called the ‘wealth impulse’, which describes the counterintuitive relationship between wealth and economic growth. To the extent that GDP growth is impacted by wealth, the impact comes not from the level of wealth or from the change in wealth, but from the change in the increase in wealth – which we define as the wealth impulse. The global wealth impulse has entered a downcycle, which tends to last 1-2 years. Previous downcycles in the wealth impulse in 2010-11, 2013-14, and 2018-19 all coincided with US economic growth falling to, or remaining at, below-trend. A similar pattern could emerge through 2022-23. Previous downcycles in the wealth impulse also coincided with strong down-legs in the 30-year T-bond yield. This supports our view that while the long bond yield could rise by a further 40-50 bps, the recent spike in yields is simply a tactical countertrend move within a broader structural downtrend, which remains intact. Fractal trading watchlist: Bitcoin, the euro, EUR/CZK, semiconductors, and Polish 10-year bonds. Feature Feature ChartThe 'Wealth Impulse' Has Peaked
The 'Wealth Impulse' Has Peaked
The 'Wealth Impulse' Has Peaked
The post-pandemic synchronized boom in global house prices and global stock markets has caused an unprecedented windfall in household wealth. Albeit, it is a windfall that is highly concentrated in the top fraction of the world’s households. Many commentators claim that this unprecedented wealth windfall will boost economic growth in 2022-23 through the so-called ‘wealth effect’. However, these claims belie a basic misunderstanding about how wealth impacts economic growth. In this short Special Report, we introduce a novel concept called the ‘wealth impulse’, which describes the true relationship between wealth and economic growth. Using this concept of the wealth impulse we explain why, somewhat counterintuitively, wealth will be a headwind rather than a tailwind to growth in 2022-23 (Chart I-1). It Is The ‘Impulse’ Of Wealth That Drives Growth, And The Impulse Has Peaked In accounting terms, wealth is a stock. By contrast, GDP is a change in a stock, or flow, meaning that GDP growth is a change in a flow. It follows that, to the extent that GDP growth is impacted by wealth, it must also come from the change in the flow of wealth: in other words, not from the level of wealth and not from the change in wealth, but from the change in the increase in wealth. We define this as the ‘wealth impulse’ (Charts 1-2-Chart 1-5) Chart I-2The Level Of Real Estate Wealth Has Surged…
The Level Of Real Estate Wealth Has Surged...
The Level Of Real Estate Wealth Has Surged...
Chart I-3…But The Impulse Is Fading
...But The Impulse Is Fading
...But The Impulse Is Fading
Chart I-4The Level Of Stock Market Wealth Has Surged…
The Level Of Stock Market Wealth Has Surged...
The Level Of Stock Market Wealth Has Surged...
Chart I-5...But The Impulse Is Fading
...But The Impulse Is Fading
...But The Impulse Is Fading
To be clear, your stock of wealth will also generate a flow through dividends, rents, and interest income. And the higher the level of your wealth, the larger this flow will be – Bill Gate’s flow is much larger than Joe Sixpack’s flow. But given that these income flows are dwarfed by the capital gains flows, they will play second fiddle for all-important spending growth. If all of this sounds somewhat convoluted, let’s illuminate the concept with a simple example. Say that your starting wealth of $1000 increased by $100 in 2020, and by another $100 in 2021. In this case, you have effectively gained a constant additional ‘capital gain’ flow to your income flow. Let’s say you spent a constant tenth of these capital gain flows. What would be the growth in your spending? The counterintuitive answer is zero. As there is no change in these capital gain flows, the wealth impulse would be zero, and there would be no growth in your spending: it would be $10 in 2020 and $10 in 2021. To get economic growth from the wealth effect, the increase in your wealth in 2021 would have to be greater than the $100 increase in 2020. Let’s say the increase was $150. In this case, the wealth impulse would be 50 percent and your spending would grow from $10 to $15.1 Now let’s say that after this $150 increase in 2021, your wealth increased by $200 in 2022. Given that the 2022 increase was greater than the 2021 increase, the wealth impulse would be positive, and your spending would grow. But what about the rate of growth? The counterintuitive answer is that economic growth would slow, because the wealth impulse has declined to 33 percent (200/150) in 2022 from 50 percent (150/100) in 2021. To the extent that GDP growth is impacted by wealth, it must come from the change in the increase in wealth, which we define as the ‘wealth impulse’. Finally, let’s say that your wealth increased by a further $150 in 2023. In this case, the wealth impulse would turn negative, to -25 percent (150/200). The counterintuitive thing is that, despite an increase in wealth, your spending would contract. In fact, this is precisely what is happening in the real world. The wealth impulse peaked in the second half of 2021, and has entered a downcycle. Significantly, downcycles in the wealth impulse tend to last 1-2 years, and end up in deeply negative territory. Hence, contrary to what the commentators are claiming, the ‘wealth effect’ tailwind to growth is already fading, and is highly likely to become a headwind through 2022-23. Creating A Composite Wealth Impulse By far the largest component of household wealth is real estate, meaning the value of our homes. Significantly, through the past decade, global real estate prices have become highly synchronized and correlated. Hence, we can derive a real estate wealth impulse from a reliable monthly US house price index, such as the S&P/Case-Shiller Home Price Index. One rejoinder is that real estate wealth should be measured net of the mortgage debt that is owed on our homes. However, as the wealth impulse is a change of a change in wealth, and the mortgage debt changes very slowly, it does not really matter whether we calculate the impulse from gross or net real estate wealth. Either way, the impulse is fading. The wealth impulse peaked in the second half of 2021, and has entered a downcycle. The other significant component of household wealth comes from the exposure to equities. Hence, we can derive an equity wealth impulse using a broad equity index such as the MSCI All Country World. Significantly, the equity wealth impulse also peaked in 2021 and has already fallen to zero. We can then create a ‘composite’ wealth impulse which combines real estate and equities in the three to one proportion that households hold these two main assets. Unsurprisingly, this composite wealth impulse is also fading fast (Chart I-6). Chart I-6The Composite Wealth Impulse Has Peaked
The Composite Wealth Impulse Has Peaked
The Composite Wealth Impulse Has Peaked
One final issue relates to the periodicity of calculating the wealth impulse. All the analysis so far has related to the 1-year impulse: that is, the 1-year change in the 1-year increase in wealth. This periodicity should match the time that it takes for wealth changes to impact household behaviour. Based on theoretical and empirical evidence, the optimal periodicity is indeed around a year – especially as we also assess the change in our incomes and taxes over a year. But what if households react faster to the change in their wealth? We can address this by looking at the 6-month wealth impulse: that is, the 6-month change in the 6-month increase in wealth. These 6-month impulses for both real estate wealth and composite wealth are already deeply in negative territory (Chart I-7 and Chart I-8). Chart I-7The 6-Month Real Estate Wealth Impulse Has Turned Negative
The 6-Month Real Estate Wealth Impulse Has Turned Negative
The 6-Month Real Estate Wealth Impulse Has Turned Negative
Chart I-8The 6-Month Composite Wealth Impulse Has Turned Negative
The 6-Month Composite Wealth Impulse Has Turned Negative
The 6-Month Composite Wealth Impulse Has Turned Negative
What Does A Wealth Impulse Downcycle Mean? There are several drivers of economic growth and the wealth impulse is a marginal player amongst these drivers. Still, while the wealth impulse may not be the overarching cause of growth, it does have the potential to amplify the growth cycle in either direction. Downcycles in the wealth impulse have coincided with strong down-legs in the 30-year T-bond yield. In this regard, it is notable that in the post-GFC era, upcycles in the wealth impulse have coincided with accelerations in US economic growth. Whereas downcycles in the wealth impulse through 2010-11, 2013-14, and 2018-19 have all coincided with growth falling to, or remaining at, below-trend. A similar pattern could emerge through 2022-23, in stark contrast to what many commentators are predicting (Chart I-9). Chart I-9Wealth Impulse Downcycles Coincide With Fading Or Sub-Par Growth
Wealth Impulse Downcycles Coincide With Fading Or Sub-Par Growth
Wealth Impulse Downcycles Coincide With Fading Or Sub-Par Growth
Unsurprisingly, the post-GFC downcycles in the wealth impulse have also coincided with strong down-legs in the 30-year T-bond yield. This supports our view that while the long bond yield could rise by a further 40-50 bps, the recent spike in yields is simply a tactical countertrend move. The broader structural downtrend in the long bond yield remains intact (Chart I-10). Chart I-10Wealth Impulse Downcycles Coincide With Down-Legs In The 30-Year T-Bond Yield
Wealth Impulse Downcycles Coincide With Down-Legs In The 30-Year T-Bond Yield
Wealth Impulse Downcycles Coincide With Down-Legs In The 30-Year T-Bond Yield
Fractal Trading Watchlist From this week, we are pleased to introduce a new section: a fractal trading ‘watchlist’, which will highlight investments that are approaching, but not yet at, points of fractal fragility that presage upcoming turning points. This will help to prepare future trades. In the starting watchlist, we highlight potential upcoming buying opportunities for bitcoin, the trade-weighted euro, and EUR/CZK, and an upcoming selling opportunity for semiconductors versus technology. Catching our eye this week though is the very aggressive sell-off in Polish government bonds relative to their peers. Inflation has surged everywhere, including in Poland, but the inflation rate in Poland remains below that in the US. This means that the massive underperformance of Polish bonds seems overdone, confirmed by an extremely fragile 260-day fractal structure (Chart I-11). Chart I-11The Underperformance Of Polish Bonds Is Overdone
The Underperformance Of Polish Bonds Is Overdone
The Underperformance Of Polish Bonds Is Overdone
Accordingly, the recommended trade would be to overweight Polish 10-year bonds versus US 10-year T-bond (or German 10-year bunds), setting the profit-target and symmetrical stop-loss at 8 percent. Fractal Trading Watch List
Fractal Trading Watch List
Fractal Trading Watch List
Fractal Trading Watch List
Fractal Trading Watch List
Fractal Trading Watch List
Fractal Trading Watch List
Fractal Trading Watch List
Fractal Trading Watch List
Dhaval Joshi Chief Strategist dhaval@bcaresearch.com Footnotes 1 In practice, your income flow might also rise slightly. Assuming a yield of 2 percent on your $1000 initial wealth, and a 10 percent growth rate, your income flows would evolve from $20 to $22 (in 2020) to $24.2 (in 2021), equalling a $2.2 rise in 2021. But these would be dwarfed by the capital gain flows of $100 and $150, equalling a $50 rise in 2021. Admittedly, the propensity to spend income flows is higher than the propensity to spend capital gain flows, but assuming we spend half our income flow versus a tenth of our capital gain flow, the increase in the capital gain flow would still drive the growth in spending ($5 versus $1.1). Fractal Trading System Fractal Trades
Image
6-Month Recommendations Structural Recommendations Closed Fractal Trades Indicators To Watch - Bond Yields Chart II-1Indicators To Watch - Bond Yields - ##br##Euro Area
Indicators To Watch - Bond Yields - Euro Area
Indicators To Watch - Bond Yields - Euro Area
Chart II-2Indicators To Watch - Bond Yields - Europe Ex Euro Area
Indicators To Watch - Bond Yields - Europe Ex Euro Area
Indicators To Watch - Bond Yields - Europe Ex Euro Area
Chart II-3Indicators To Watch - ##br##Bond Yields - Asia
Indicators To Watch - Bond Yields - Asia
Indicators To Watch - Bond Yields - Asia
Chart II-4Indicators To Watch - Bond Yields - Other Developed
Indicators To Watch - Bond Yields - Other Developed
Indicators To Watch - Bond Yields - Other Developed
Indicators To Watch - Interest Rate Expectations Chart II-5Indicators To Watch - Interest Rate Expectations
Indicators To Watch - Interest Rate Expectations
Indicators To Watch - Interest Rate Expectations
Chart II-6Indicators To Watch - Interest Rate Expectations
Indicators To Watch - Interest Rate Expectations
Indicators To Watch - Interest Rate Expectations
Chart II-7Indicators To Watch - Interest Rate Expectations
Indicators To Watch - Interest Rate Expectations
Indicators To Watch - Interest Rate Expectations
Chart II-8Indicators To Watch - Interest Rate Expectations
Indicators To Watch - Interest Rate Expectations
Indicators To Watch - Interest Rate Expectations
Even though policymakers in Beijing are shifting towards a greater emphasis on stabilizing the economy (see Country Focus), our Emerging Markets strategists do not yet recommend investors shift in favor of China plays such as emerging market risk assets. …
Dear Client,In this special issue we present the first commentary for the BCA Research US High-Quality Stock Selection strategy, which represents the next evolution of the Equity Analyzer service.The strategy, constructed exclusively using the Equity Analyzer toolset, provides reliable exposure to high-quality US securities through the BCA Score factor model, while maintaining sector neutrality relative to the US market.Most importantly, the underlying portfolio is now offered through BCA Research Investment Solutions, which provides turn-key and directing-indexing implementations of our quantitative signals. This solution marks the most accurate and practical implementation of our equity factor model to-date.For more information about the strategy, including historical performance metrics, or, to learn how to incorporate this service into your investment process, please contact investmentsolutions@bcaresearch.com.Performance RecapThe US equity market regained its composure in month of December 2021, with investors seeing through the rapidly spreading but seemingly less pathogenic Omicron variant. The US High-Quality strategy (USHQ), which closely tracks movement in the SPDR S&P 500 ETF (SPY, approx. 90% correlation since inception), also had a strong month, with an outperformance of 0.49% relative to SPY.1 Since last quarter, strategy performance has been mostly in line with the US market (Chart 1), with modest downside protection and lower daily return volatility (Table 1), which are typical characteristics of the strategy.
Chart 1
Returning to the most recent month of trading (December 2021), we are reminded that tech and health care continue to have a major influence on total returns given their weight in the US market. The USHQ portfolio was able to gain ground against SPY through outperformance in 8 out of 11 GICS Level 1 sectors, namely in tech and health care (Chart 2). Within SPY, mega-cap symbols continued to provide strong contributions2 with AAPL, TSLA, FB, MA, and UNH leading the pack. Downside impact was muted, with ADBE being the top detractor. The USHQ strategy had solid breadth across constituents, with a few holdings standing out in tech and health care. The top/bottom 10 contributors for the month of December are shown in Table 2A and Table 2B. Table 12021Q4 Statistics*
BCA US High-Quality Stock Selection Strategy
BCA US High-Quality Stock Selection Strategy
Chart 2
Chart
Chart
At the current juncture, US equities are experiencing increased volatility due in part to a hawkish tone from the Federal Reserve. The latest set of FOMC minutes point to a mid-march liftoff date. This comes amid sustained inflationary pressures and a move towards maximum employment in the US. Not surprisingly, the market has corrected slightly against this backdrop. As of end-of-day January 11, 2022, USHQ is down -0.3% MTD vs -1.7% for SPY.Factor BreakdownIn this section we examine the current factor landscape for the USHQ portfolio, SPY, and the broad US equity universe.The current factor exposure for the USHQ portfolio and SPY is shown in Chart 3. It is up to date as of the latest portfolio rebalance (Jan 3, 2021). The methodology is similar to that used by the Factor Analyzer widget on the Equity Analyzer (EA) platform. We define the composite factor exposure as the difference between the portfolio or fund-weighted average factor score and the average score of our stock universe. In this case the stock universe consists of the top 1000 US stocks according to market cap. Composite factor scores are obtained from the EA platform and range from 0% to 100%.The portfolio will tend to have a positive factor exposure on most factors as it holds the top ranking stocks in each sector according to the BCA Score. The factor exposure of SPY will vary from month to month depending on the evolution of the market. In the ideal environment, the strategy should have positive BCA Score exposure relative to the market index. Practically speaking, this provides verification that the strategy is correctly tilted towards the factors we deem important for managing market risk.The values in Chart 4 can be interpreted as the difference between the dark green bars and light green bars in Chart 3. This month, we observe that the valuation gap between the portfolio and SPY has narrowed relative to last month. This was mainly due to a drop in the Value Score of USHQ, which can be explained by a significant price appreciation in the strategy's tech holdings. Increased exposure to Technicals for USHQ and SPY indicate that both are increasingly weighted towards firms with strong momentum over the past 12 months.
Chart 3
Chart 4
When considering the broad US equity universe on an equal-weighted basis, it’s clear that the composite Value factor has experienced a resurgence over the past month (Chart 5). The BCA Score metric has remained robust over the same period, with the core model components outperforming on a long/short basis. The current factor landscape reflects a switch to an environment of rising interest rates, as seen by the movement of the 10-year Treasury yield. Based on a previous study of factor performance in different rate environments, the outlook for Quality factors remains strong, as we are currently in an environment of high3 and rising rates (Chart 6).
Chart 5
Chart 6
Portfolio Constituents SummaryThis section provides information about the latest holdings in the portfolio as of last rebalance (Jan 3, 2021). The current sector composition is shown in Chart 7 with changes since last rebalance shown in parentheses. New positions in the portfolio are shown in Table 3A, and closed positions are shown in Table 3B. Movement of securities in and out of the portfolio is driven primarily by the level of the factor model ranking (BCA Score) at the time of rebalance.
Chart 7
Chart
Chart
Specifically, positions are closed when the BCA Score drops below 70% and the Composite Macro Score is below 75%. The closed positions are replaced with high-ranking securities from the pool of top 1000 US stocks by market capitalization. Rebalancing occurs on the first trading day of each month. The number of securities in the portfolio currently sits at 55, with 5 stocks occupying each of the 11 GICS Level 1 sectors.Footnotes1 Calculated for the latest portfolio intra-rebalance period (2021-12-01 to 2022-01-03) using dividend-adjusted end-of-day pricing.2 Contribution defined as fund or portfolio-weighted return during the given month.3 As determined by our moving average (MA) cross indicators. Rates are considered “high” if the 3-month MA is above the 3-year MA.
Highlights This week we highlight key charts for US Political Strategy themes and views in the New Year. For H1 2022, we maintain a pro-cyclical, risk-on approach. We favor industrials, energy, infrastructure, and cyclicals. Foreign supply kinks will persist due to Omicron. The US Congress will pass one more spending bill as Democrats try to save their skin ahead of the midterm election. Yet other trends are not so inflationary: Fed rate hikes, an 8% of GDP fiscal drag, and a looming return to congressional gridlock. Midterm elections usually see defensive and growth stocks outperform cyclical and value stocks. This is a risk to our view and may require adjustments later this year. Feature This week we offer our updated US Political Strategy chart pack for the new year. Inflation and stagflation are the top concerns. But the Federal Reserve is kicking into gear, with the market now expecting three-to-four interest rate hikes in 2022 alone. We doubt that will come to pass but it is possible and there is no question that a 12-month core PCE print of 4.7% is forcing the Fed to move. Since the mega-stimulus of March 2020, markets have seen a 91% rally in the S&P 500 and a 114% rally in the tech sector. Ultra-low interest rates and stay-at-home policies created a paradise for tech stocks. But the 10-year Treasury yield surged from 1.45% in December, when Omicron emerged and the Fed turned hawkish, to 1.76% today. An inflation-induced pullback and rotation out of tech stocks was to be expected and has been our most consistent sectoral view. Long-term inflation expectations have not taken off, however. Many investors see secular stagnation over the long run – and even in the short run the resilient dollar should work against inflation. Not only will the Fed wind down asset purchases by $30bn a month starting January 2022 and start hiking rates in March, but also the budget deficit is contracting, making for an 8% of GDP fiscal drag in 2022. In addition the market no longer has any confidence that Congress will pass President Biden’s “Build Back Better” plan. We still think a reconciliation bill will pass, albeit in watered down form. But ultimately the looming midterm election will paralyze Congress, as we argued in our 2022 outlook report, “Gridlock Begins Before The Midterms.” Gridlock will ensure that whatever passes only modestly expands the long-term deficit and then that fiscal taps will be turned off in 2023. In the context of Fed hikes, this should reduce fears of inflation later in 2022, though we still see inflation as a persistent long-term problem. If history is any guide, stocks and bond yields will be flattish for most of the year due to election uncertainty. The difference between this year and other midterm years is that the US consumer is in better financial shape and yet foreign supply kinks will persist due to Omicron. The takeaway is to prefer industrials, energy, small caps, and cyclicals, even though we may not maintain these recommendations for the whole year. We are hedging by staying long health care stocks. Omicron: Less Relevant At Home, More Relevant Abroad American economic growth is declining but will likely settle at or above trend (Chart 1A). Money growth, a proxy for stimulus, is also coming off its peaks while credit growth is rising moderately. The long deleveraging of the American consumer since 2008 appears to have come to an end. But it is too soon to say how aggressively Americans will lever back up and whether a new private sector “debt super cycle” will begin (Chart 1B). Chart 1AEconomic Growth Peaked, Will Slow To Trend
Economic Growth Peaked, Will Slow To Trend
Economic Growth Peaked, Will Slow To Trend
Chart 1BEconomic Growth Peaked, Will Slow To Trend
Economic Growth Peaked, Will Slow To Trend
Economic Growth Peaked, Will Slow To Trend
The Omicron variant of COVID-19 will have a modest negative impact early in the year. Hospitalizations are picking up in the wake of a surge in new cases following Christmas gatherings. Only 61% of Americans are fully vaccinated and only 23% have received the booster shot that is most effective against Omicron (Chart 2A & Chart 2B). Yet new deaths from the disease remain subdued and only about a fifth of those hospitalized go to the intensive care unit today.
Chart 2
Chart 2BCOVID-19 Continues But Relevance Wanes
COVID-19 Continues But Relevance Wanes
COVID-19 Continues But Relevance Wanes
Pharmaceuticals, both vaccines and anti-viral medications, are saving the day and Americans are becoming resigned to the likelihood of getting the virus at some point. Social mobility has dropped off since summer 2021 but will boom in the springtime and consumer confidence is already picking back up (Chart 3A & Chart 3B). The Biden administration is not likely to impose unpopular social restrictions during an election year unless a variant is deadlier, more contagious, and resistant to vaccines, which is not the case with Omicron. Chart 3AOmicron Not A Major Setback For Recovery
Omicron Not A Major Setback For Recovery
Omicron Not A Major Setback For Recovery
The resilience of the US will come with persistent inflation in goods given that Omicron will still cause supply disruptions abroad. Not all countries have as effective vaccines when it comes to Omicron – if they maintain tighter social restrictions, prices of imported goods will continue to rise. The Fed cannot resolve foreign bottlenecks. While manufacturing surveys show bottlenecks easing from last year’s highs, foreign supply constraints will remain a problem throughout the year. Chart 3BOmicron Not A Major Setback For Recovery
Omicron Not A Major Setback For Recovery
Omicron Not A Major Setback For Recovery
Buy The Rumor, Sell The News Of “Build Back Better” The Biden administration and Democratic Party are still likely to pass one last blast of fiscal spending – the “Build Back Better” budget reconciliation act, a social welfare bill. The output gap is virtually closed and the economy does not need new demand stimulus. However, the Democratic Party needs a legislative win ahead of the midterm election. Thin majorities in both chambers of Congress enable a single senator to derail the bill. But the bill’s provisions are popular among political independents and especially the Democratic Party’s base, which is lacking in enthusiasm about the election as things stand (Charts 4A & 4B). Moderate Democrats in the Senate are still negotiating: their goal is to chop the plan down to size and pass only the most popular provisions, rather than to sink the president and their own party.
Chart 4
Chart 4
This means the bill’s top-line spending will be further reduced. The final size should fall from the earlier range of $2.5-$4.7 trillion to $2.3 trillion or less. Add a few tax hikes, like the minimum corporate tax, and the deficit impact will be around $600 billion (Table 1). Table 1"You’ve Gotta Pass It To See What’s In It"
Chart Pack: Gridlock Now
Chart Pack: Gridlock Now
Ultimately we cannot have high conviction on the BBB plan because we cannot predict what a single senator will do. That is a matter of intelligence, not macro analysis.
Chart 5
Chart 5
But subjectively we still give 65% odds that the Democratic Party will circle the wagons and pass the bill. The party views itself as surrounded by populism on both its right and left flanks – a failure to compromise will whet the appetites of both the Sanderistas (left-wing populists) and the Trumpists (right-wing populists) (Chart 5A). The Republicans still have a better position in the states, and the states have constitutional control of elections, so establishment Democrats are more terrified than usual of flopping in the midterm elections (Chart 5B). Otherwise the midterms – which are already likely to be bad for the Democrats – will deal a devastating blow. Republicans are recovering in party affiliation and tentatively surpassing Democrats among independent voters (Chart 6A). Biden and the Democrats lashed out at former President Trump and the Republican Party on the anniversary of the January 6, 2020 rebellion, but this tactic will not lift their popularity in polls. Their current polling is not much better than that of Republicans in 2018, when the latter suffered a bruising defeat in the midterms (Chart 6B). Chart 6ADemocrats Need A Win Before The Midterm
Democrats Need A Win Before The Midterm
Democrats Need A Win Before The Midterm
Chart 6
Biden’s legislation would reduce the fiscal drag marginally in fiscal year 2023 but overall the budget deficit will shrink and then lie flat over 2022-24 regardless of what Congress does (Chart 7). New spending would be marginally inflationary over the long run since the budget deficit is expected to expand again beyond fiscal year 2024.
Chart 7
Republicans will not be able to slash the budget until they control both Congress and the White House, but in that case they are likely to prove big spenders as in the past. Populism will persist on all sides: the political establishment will keep trying to use fiscal profligacy to peel voters away from populists, who are even more fiscally profligate. Only an inflation-induced recession will restore some fiscal discipline – and that is a way off. Ultimately the significance of the BBB bill is to verify whether establishment politicians – fiscal authorities – are capable of moderating their spending plans according to the threat of inflation, as Modern Monetary Theory maintains. Otherwise the implication is that polarization and populism will produce fiscal overshoots regardless of near-term inflation, even with the narrowest of possible majorities in Congress. The latter, a BBB fiscal overshoot, is what we expect. If it happens it will probably be received negatively by the equity market, fearing faster Fed rate hikes, and it would add credibility to long-term concerns about inflation, because it would reveal that fiscal authorities are not good at adjusting in real time. The former, a BBB failure and a halt to fiscal spending, would suggest that fiscal extravagance remains a crisis-era phenomenon and will be reined in by Congress after a crisis passes, which is probably positive for equities. It would at least suggest that fiscal authorities will adjust when the facts change. Of course, how investors respond to any legislative outcome will depend on a range of factors. But the takeaway is this: Inflation fears may or may not peak in the short run but they will persist over the long run. The Fed: Focus On The Framework In the wake of the Great Recession the Federal Reserve as an institution – both the Federal Open Market Committee and the Board of Governors – shifted in a more accommodative or dovish direction (Chart 8). The shift culminated in the review of monetary policy strategy in August 2020, which produced average inflation targeting.
Chart 8
In practice the dovish policy shift is apparent in a real Fed funds rate at -4%, the lowest level since the inflationary 1970s under Fed Chair Arthur Burns. But what is more remarkable is the simultaneous surge in the budget deficit, unlike anything since World War II, and unlike anything in peacetime (Chart 9). Chart 9Inflation And Stagflation Risks
Inflation And Stagflation Risks
Inflation And Stagflation Risks
The massive increase in federal debt, from 34% of GDP in 2000 to 75% before COVID-19 and 106% today, acts as a constraint on any future Fed hawkishness (Chart 10). A Fed chair who drives interest rates too high amid high debt levels will cause a recession and force the debt-to-GDP ratio up even higher. Yet the result of low rates is to stimulate indebtedness. While the private debt super cycle has subsided, a public debt super cycle is thriving. Chart 10A Major Check On Fed Hawkishness
A Major Check On Fed Hawkishness
A Major Check On Fed Hawkishness
This brings us to today’s predicament. The Fed’s criteria for raising interest rates have mostly been met: 12-month core PCE inflation is running at 4.7% while the inflation breakeven rate in the Treasury market suggests that inflation is well anchored and likely to persist above the 2% inflation target for some time (Chart 11A). The economy is virtually at “maximum employment” (Table 2) – the Fed has set aside concerns about low labor force participation to focus on the collapsing unemployment rate, which is now within the range at which it will feed inflation (Chart 11B). Chart 11AThe Fed's Criteria For Liftoff
The Fed's Criteria For Liftoff
The Fed's Criteria For Liftoff
Table 2The Fed’s Criteria For Liftoff
Chart Pack: Gridlock Now
Chart Pack: Gridlock Now
Chart 11BThe Fed's Criteria For Liftoff
The Fed's Criteria For Liftoff
The Fed's Criteria For Liftoff
The takeaway is that the Fed is suddenly restoring the credibility of its 2% inflation target, with headline PCE rapidly coming up on the trajectory established in the wake of the Great Recession (Chart 12), as our US bond strategist Ryan Swift has demonstrated. Chart 12Lo And Behold: Debt Monetization Generates Inflation
Lo And Behold: Debt Monetization Generates Inflation
Lo And Behold: Debt Monetization Generates Inflation
The explosion of fiscal spending played a critical role in generating this new trajectory. The combination of monetary and fiscal accommodation has worked wonders. Assuming the BBB passes, Chairman Powell will face even greater pressure to prevent this correction of the inflation trajectory from overshooting and turning into a wage-price spiral. The unexpected risk would be if the BBB bill fails, the Fed hikes aggressively, global growth sputters, the dollar surges, and Republicans retake Congress — then Powell may yet see disinflationary challenges in his term in office. Our sense is that the BBB will pass, reinforcing Powell’s less dovish pivot, and yet the Fed’s framework will not permit too hawkish of a stance, resulting in persistent inflation risks over the long run. Three Strategic Themes In our annual strategic outlook, we highlighted three structural or strategic themes that are not beholden to the 12-month forecasting period: 1. Rise Of Millennials And Generation Z: The sharp drop in labor force participation will gradually mend in the wake of the crisis but the aging of the population ensures that the general trend will decline over time as the dependency ratio rises (Chart 13A). Chart 13AStrategic Theme #1: Rise Of Millennials/Gen Z
Strategic Theme #1: Rise Of Millennials/Gen Z
Strategic Theme #1: Rise Of Millennials/Gen Z
Chart 13
Politically the millennials and younger generations are gaining clout over time, although their partisan identity will also evolve as they mature and gain a greater stake in the economy and become asset owners (Chart 13B). 2. Peak Polarization: US political polarization stands at historic highs and will likely remain so over the 2022-24 political cycle (Chart 14A). Polarization coincides with the transformation of society amid falling bond yields and technological revolution (Chart 14B). Chart 14AStrategic Theme #2: Peak Polarization
Strategic Theme #2: Peak Polarization
Strategic Theme #2: Peak Polarization
Chart 14BStrategic Theme #2: Peak Polarization
Strategic Theme #2: Peak Polarization
Strategic Theme #2: Peak Polarization
The pandemic era has been especially polarized due to the 2020 election and controversies over vaccination (Chart 15).
Chart 15
Domestic terrorism of whatever stripe is possible (Chart 16). But any historic incidents will generate a majority opposed to political violence. Chart 16Risk Of Domestic Terrorism
Risk Of Domestic Terrorism
Risk Of Domestic Terrorism
True, former President Trump is still likely to run on the Republican ticket, which will ensure that polarization remains elevated (Diagram 1). However, US elections hinge on structural factors, not individuals. Diagram 1GOP 2024 Is Up To Trump
Chart Pack: Gridlock Now
Chart Pack: Gridlock Now
So far structural factors point to policy continuity: not only are Democrats still slated to retain the White House, but President Biden has coopted many of Trump’s key policies, including infrastructure, protectionism, and big budget deficits (Chart 17). If Democrats falter, Trump’s policies will be reaffirmed. The implication is that a new national policy consensus is taking shape beneath the surface.
Chart 17
3. Limited “Big Government”: Americans have been turning away from “small government” and toward “big government” since the 1990s. Voters no longer worry so much about budget discipline and instead look for the “visible hand” of government to support the economy (Charts 18A & 18B).
Chart 18
Chart 18
Both domestic populism and geopolitical challenges encourage this shift. Industrial policy and domestic manufacturing are making a comeback (Table 3). Table 3Strategic Theme #3: Limited “Big Government”
Chart Pack: Gridlock Now
Chart Pack: Gridlock Now
With extremely robust fiscal policy, the US has avoided the policy mistake of the period after the Global Financial Crisis, when premature fiscal tightening undermined the economic recovery (Chart 19). Policy uncertainty will increase as gridlock returns to Congress and fiscal policy will be frozen. But investors need not fear a slide back into deflation. The Republican Party’s populist base may prevent more Democratic social spending but they will not be able to repeal what is done. Chart 19Even With Looming Gridlock, The US Is Far From Tightening Fiscal Policy Too Soon This Time
Even With Looming Gridlock, The US Is Far From Tightening Fiscal Policy Too Soon This Time
Even With Looming Gridlock, The US Is Far From Tightening Fiscal Policy Too Soon This Time
Three Key Views For 2022 The key views for the 12-month period are connected with the above but of a more short-term or cyclical duration: 1. From Single-Party Rule To Gridlock: Republicans are highly likely to win back control of the House of Representatives and likely the Senate (Charts 20A & 20B). President Biden’s approval rating suggests that Democrats could lose 40 seats in the House (Chart 21) and three in the Senate (Chart 22), whereas they only need to lose five and one to lose control. Our quantitative Senate election model shows an even split but the model’s trend favors Republicans, as does the political cycle and partisan enthusiasm (Chart 23).
Chart 20
Chart 20
Chart 21
Chart 22
Chart 23
2. From Legislative To Executive Power: Biden may still pass one more spending bill but otherwise the legislature will be frozen. Democrats will not succeed in ramming legislation through by abolishing the Senate filibuster. Biden will turn to executive decree, where he is already on track to make a historic increase in regulation, which will increase concerns among small business (Chart 24A & Chart 24B). Anti-trust laws are unlikely to be overhauled and Democrats will struggle to bring back the tough anti-trust posture of the 1900s-1950s without new legislation, meaning that Big Tech faces a bigger threat from inflation than regulation (Table 4). The green transition will continue but primarily in the form of any subsidies passed in the reconciliation bill, rather than new taxes or any carbon pricing scheme (Chart 25A & Chart 25B). Chart 24AKey View #2: From Legislative To Executive Power
Key View #2: From Legislative To Executive Power
Key View #2: From Legislative To Executive Power
Chart 24
Table 4Key View #2: From Legislative To Executive Power
Chart Pack: Gridlock Now
Chart Pack: Gridlock Now
Chart 25
Chart 25BGreen Energy: Subsidies But No Carbon Tax
Green Energy: Subsidies But No Carbon Tax
Green Energy: Subsidies But No Carbon Tax
3. From Domestic To Foreign Policy Risks: Biden faces a slew of foreign policy and external risks that could damage the Democrats in the midterms. The surge in illegal immigration on the southern border is truly historic and will have significant policy ramifications over the long run (Chart 26A & Chart 26B). The surge in inflation will force Biden to contend with foreign policy challenges with one hand tied behind his back, since energy supply disruptions could derail his party ahead of the midterm election (Chart 27). While Biden could ease some inflationary pressure via reduced trade tariffs, protectionist impulses will prevail during an election year (Chart 28). Chart 26AKey View #3: External Risks For Biden
Key View #3: External Risks For Biden
Key View #3: External Risks For Biden
Chart 26BKey View #3: External Risks For Biden
Key View #3: External Risks For Biden
Key View #3: External Risks For Biden
Chart 27Foreign Policy Could Hit Prices At Pump
Foreign Policy Could Hit Prices At Pump
Foreign Policy Could Hit Prices At Pump
Chart 28Tariff Relief In 2022? Don't Bet On It
Tariff Relief In 2022? Don't Bet On It
Tariff Relief In 2022? Don't Bet On It
Investment Takeaways The stock market tends to be flat, with risks skewed to the downside, during midterm election years due to policy uncertainty. The same is true for bond yields (Chart 29). Chart 29Stocks And Bond Yields Trend Lower Before Midterms ...
Stocks And Bond Yields Trend Lower Before Midterms ...
Stocks And Bond Yields Trend Lower Before Midterms ...
When united or single-party governments approach midterms, stocks tend to perform worse than for divided governments in midterm years, while bond yields tend to be a bit higher (Chart 30). This trend is supercharged in 2022 due to the inflationary effects of the pandemic. Chart 30... But United Govts See Higher Bond Yields And Weaker Stocks ...
... But United Govts See Higher Bond Yields And Weaker Stocks ...
... But United Govts See Higher Bond Yields And Weaker Stocks ...
Assuming Republicans regain at least the House, the US will transition from united to divided government (gridlock). In previous such transitions, stocks tend to perform in line with the average for a midterm election year, but bond yields skew higher – reinforcing the previous point (Chart 31). Chart 31... Shift From United To Divided Govt Implies Higher Bond Yields Than Otherwise
... Shift From United To Divided Govt Implies Higher Bond Yields Than Otherwise
... Shift From United To Divided Govt Implies Higher Bond Yields Than Otherwise
We will update our US Sector Political Risk Matrix to bring it better into line with our views, particularly in light of Table 5 below regarding sector relative performance during midterm election years. Normally defensives and growth stocks outperform in midterm years, Table 5ConDisc, Tech, Health Do Best During Midterms …But Waning Pandemic Makes An Exception
Chart Pack: Gridlock Now
Chart Pack: Gridlock Now
while cyclicals and value stocks underperform, but 2022 looks to be different due to inflation. Still over the course of the year we would expect the historic trend to reassert itself. Investors should favor cyclicals even though they probably cannot outperform defensives for much longer (Chart 32A). We recommend health care stocks as a hedge given that the dollar should still be resilient this year, Fed hikes should moderate inflation expectations, and midterm policy uncertainty will eventually weigh on risk appetite (Chart 32B). Chart 32AFavor Cyclicals, Though They May Not Outperform Defensives Much Longer
Favor Cyclicals, Though They May Not Outperform Defensives Much Longer
Favor Cyclicals, Though They May Not Outperform Defensives Much Longer
Chart 32BLong Health Care As Hedge
Long Health Care As Hedge
Long Health Care As Hedge
Value stocks are forming a bottom relative to growth stocks, although this trend is less clear in the US, especially among US large caps, than it is abroad (Chart 33). We favor value over growth on a cyclical basis but midterm election uncertainties will pull the other way, making for a choppy bottom. Chart 33Favor Value And Small Caps, Though Bottom Formation Remains Choppy
Favor Value And Small Caps, Though Bottom Formation Remains Choppy
Favor Value And Small Caps, Though Bottom Formation Remains Choppy
The same process is visible on a sector basis, where energy and materials continue to outperform tech (Chart 34A). We recommend staying long energy on a cyclical basis, though its outperformance against tech could abate later in 2022. Infrastructure stocks – such as building and construction materials – also continue to outperform. Since Biden’s honeymoon period ended, the outperformance is largely relative to tech rather than the S&P as a whole. We still favor infrastructure stocks as the fiscal policy theme will continue even beyond the current legislation, which will barely start to be implemented in 2022 (Chart 34B). Chart 34AFavor Energy, Materials, And Infrastructure Versus Tech
Favor Energy, Materials, And Infrastructure Versus Tech
Favor Energy, Materials, And Infrastructure Versus Tech
Chart 34BFavor Energy, Materials, And Infrastructure Versus Tech
Favor Energy, Materials, And Infrastructure Versus Tech
Favor Energy, Materials, And Infrastructure Versus Tech
Matt Gertken Vice President Geopolitical Strategy mattg@bcaresearch.com Strategic View Open Tactical Positions (0-6 Months) Open Cyclical Recommendations (6-18 Months)
Image
Image
Image
Image
Image
Image
Image
Ultra stimulative policies at the onset of the pandemic supported the impressive rally in equities. However, equity market breadth has been deteriorating since early last year which indicates that fewer and fewer stocks are participating in the rally. The…
Highlights The markets are already looking past Omicron. Now they have new worries – the Fed battling inflation. In the past, the Fed moved because of confidence that strong economic growth can withstand rates normalization. This time around, the Fed’s hand is forced by inflation, which is no longer deemed “transitory”. So far, fear of an inflation-induced tightening cycle manifests in expectations of a steeper trajectory for rates, and violent and indiscriminate rotation out of the tech names. Companies have set aside record amounts of cash for wage increases. This is sure to cut into corporate profitability and validates our thesis that peak margins are in the rear-view window. Supply bottlenecks are easing, so is the ISM activity index, which we interpret as a normalization. When it comes to our style recommendations, we continue preferring small caps over large caps on the back of attractive valuations and favorable economic backdrop. Today, we also upgrade Value / Growth from neutral to OW - rising rates are a tailwind for Value. Recommended Allocation
US Equity Chart Pack
US Equity Chart Pack
Feature December was a good month for equities (Chart 1). While the beginning of the month was marred by turbulence, induced by the arrival of Omicron, and the Fed shifting to a more hawkish stance, Santa Claus did deliver a rally to close the month, with the S&P 500 rising by 6% and lifting its 2021 gains to an impressive 27%. But 2021 was a wild year for active investors, as only 15% of funds and strategies outperformed the S&P 500. Hence, many investors had to watch the S&P 500 gains from the sidelines: The year was characterized by rotation across sectors and styles. December brought about a sell-off in the most speculative names in the equity market (EEM, IWM, ARKK, BTC, IPO), which has continued unabated into January: The Fed’s imminent monetary tightening is a culprit. Capital has also rotated away from Cyclicals and towards Defensives (the MSCI Cyclicals / Defensive ratio was down 7% in December). However, Cyclicals are starting to rebound from the Omicron slump.
Chart 1
Overarching Macroeconomic Themes Omicron or “Omicold”? Either Way, The US Market Is Looking Past It… Little was known about the Omicron variant when it took us all by surprise at the end of November. Fortunately, an expectation that this variant is more contagious but less virulent has come to pass: While the number of cases has surged (nearly, every family I know in the tri-state area has had it by now), the number of hospitalizations has remained contained (Chart 2). The economic damage, at least in the US, has been minor, and mostly due to people being away from work sick or quarantined. It also appears that this COVID wave is close to a peak, which explains the recent outperformance of Cyclicals (Chart 3): The markets are already looking past Omicron. Now they have new worries – the Fed battling inflation. Chart 2Omicron Wave Is Close To A Peak...
Omicron Wave Is Close To A Peak...
Omicron Wave Is Close To A Peak...
Chart 3...And Cyclicals Are Rebounding
...And Cyclicals Are Rebounding
...And Cyclicals Are Rebounding
Inflation Is Forcing The Fed’s Hand Into An Aggressive Tightening Cycle Fed rate hikes are now all but certain: The market is pricing in four rate hikes in 2022 with a probability of nearly 90% (Chart 4), a noticeable increase from the three rate hikes expected in December 2021. The Fed’s December meeting minutes indicate that the first rate hike may come as soon as March. What is different this time is the inflation backdrop: In the past, the Fed moved because of confidence that strong economic growth can withstand rates normalization. This time around, the Fed’s hand is forced by inflation, which is no longer deemed “transitory”. The Fed is raising rates to squish growth to tame inflation, giving rate rises a different context: The Fed is behind the curve, and while in the past the stock market took rate hikes in its stride (after a short-lived slump in performance), now market reaction may be much more negative. So far, fear of an inflation-induced tightening cycle manifests in expectations of a steeper trajectory for rates (Chart 5), and violent and indiscriminate rotation out of the tech names. Chart 4Market Is Expecting Four Hikes In 2022
Market Is Expecting Four Hikes In 2022
Market Is Expecting Four Hikes In 2022
Chart 5Rates Made A Vertical Move
Rates Made A Vertical Move
Rates Made A Vertical Move
More Wage Raises Are On The Way – A Headwind To Corporate Profitability According to the NIPA, wages constitute about 50% of sales of US companies. Over the past year, nominal wages increased by 5.8% but still could not keep up with rising prices – real wage growth is running at -2.3% (Chart 6). Considering that in 2021 only a minor share of workers got raises – those rejoining the workforce, starting a new job, or members of a few labor unions, the majority of Americans have had no change in income and have been bewildered by prices in the supermarkets. As the new calendar year rolls on, many of these workers will negotiate their salaries to get inflation adjustments (Chart 7). In fact, according to the WSJ, companies have set aside record amounts of cash for wage increases. This is sure to cut into corporate profitability and validates our thesis that peak margins are in the rearview window. Chart 6Wages Are Not Keeping Up With Inflation
Wages Are Not Keeping Up With Inflation
Wages Are Not Keeping Up With Inflation
Chart 7Wage-Price Spiral?
Wage-Price Spiral?
Wage-Price Spiral?
Another concern is a wage-price spiral, leading to rampant inflation, making the Fed’s job harder, and calling for more aggressive monetary tightening, striking a blow to the stock market. Supply Bottlenecks Are Easing, So Is The ISM Activity Index The ISM Manufacturing index has turned from 64.7 to 58.7 (Chart 8A). Part of the decline in the top-line numbers is due to the resolution of supply-chain bottlenecks: The ISM Supplier Index has fallen from 78.6 to 64.9 (Chart 8B), indicating a reduction in delivery times. On the other hand, the New Orders index has also declined from 68 to 60.4, suggesting that bottlenecks are clearing thanks to the reduction in business activity, which we interpret as a normalization. Of course, zero-tolerance to COVID policy in China and other countries may lead to new production and shipping delays, and another leg up for the inflation readings. Chart 8AISM PMI Has Turned...
ISM PMI Has Turned...
ISM PMI Has Turned...
Chart 8BAnd Not Only Because Of Shorter Delivery Times
And Not Only Because Of Shorter Delivery Times
And Not Only Because Of Shorter Delivery Times
Styles Comments Small Vs. Large Cap: Sticking To Our Overweight In Small Valuations: Small caps are cheap and unloved, trading at 16x forward earnings with a 25% discount to Large. The BCA Valuation Indicator for Small vs. Large is standing more than two standard deviations below its long-term average. Profitability: Since 2019, Small has delivered 47% annualized profit growth compared to 14% from Large. The small companies have demonstrated resilience and successfully navigated the economic landscape, plagued with supply bottlenecks, labor shortages, and surging prices (Chart 9A). Small-cap margins have exceeded the historical average and have likely peaked, just like the margins of their larger brethren. According to the NFIB Small Business Survey, a core concern is inflation, but 54% of small companies intend to raise prices, passing on costs to customers. Like all other American companies, they experience labor shortages and are planning to raise wages too. On balance, we believe that small caps will remain profitable and their earnings will continue to grow, albeit at a slower pace, i.e., at 15% (Chart 9B), which is significantly less than 88% in 2021, but more than the 10% growth expected of larger companies. Chart 9ASmall Businesses Are Worried About Inflation And Are Raising Prices
Small Businesses Are Worried About Inflation And Are Raising Prices
Small Businesses Are Worried About Inflation And Are Raising Prices
Chart 9BEarnings Growth Expectations Have Normalized
Earnings Growth Expectations Have Normalized
Earnings Growth Expectations Have Normalized
Macroeconomic Backdrop: Historically, small caps have outperformed large caps in the environment of rising rates (Chart 10), because of higher allocations to Cyclicals, such as Financials and Industrials. Also, while rising rates take the froth off the high-flying growth stocks, smaller companies are cheap and have moderate growth expectations. Overweight Small vs. Large: Attractive valuations and fundamentals, and a high likelihood to perform well when rates are rising, make overweighting Small vs Large an attractive proposition.
Chart 10
Risks: While we stay with the call, there are a few caveats: Small caps’ margins are narrow, and continued cost pressures, especially surging labor costs, have the potential to dent their profitability. Further, while empirical analysis indicates that Small outperforms during the rate-hiking cycle, we are concerned that surging inflation may render this analysis less useful – can this time really be different? Growth Vs. Value: Shifting Towards Value Valuations: Over the course of 2021, Growth outperformed Value by 23% (trough to peak), and by 5% over just the last 26 weeks. As a result of such a strong run, Growth has become very expensive, trading at 29x forward multiples, which is which is a 70% premium to Value (which is trading at 17x). The Growth/Value BCA Valuation Indicator corrected below the 2 standard deviation mark and is mean reverting. Profitability: Despite significant valuation discrepancy between Growth and Value, both asset classes are set to deliver roughly the same earnings growth over the next year, suggesting that the premium for Quality and Growth may be excessive (Chart 11A). Macroeconomic Backdrop: Since the beginning of the pandemic, performance of Value vs. Growth has been strongly linked to the direction of change in yields (Chart 11B). Growth is overweight long-duration Technology stocks, while Value is highly exposed to Financials, which appear to thrive in the environment of rising rates. Chart 11AGrowth Expectation Are Similar, But Value Is Cheaper
Growth Expectation Are Similar, But Value Is Cheaper
Growth Expectation Are Similar, But Value Is Cheaper
Chart 11BRising Rates Are A Tailwind For Value
Rising Rates Are A Tailwind For Value
Rising Rates Are A Tailwind For Value
Overweight Value: As we stated in our 2022 Outlook, “Our neutral position [in Growth vs. Value] will be a great launching pad towards overweighting value stocks at the first whiff of rising long rates.” Now, with rate hikes drawing nearer and Omicron peaking, we are changing our neutral allocation to a cyclical overweight in Value, and underweight in Growth. Valuations and the macroeconomic backdrop are at the core of the call. Risks: We may be early with our presumption that Omicron is just an uber-contagious “Omicold” – hospitalizations may still surge, while global lockdowns may cause much economic damage. In that case, rates may remain range-bound, while the Fed may delay rate hikes. Then Growth would be bound to outperform Value. Irene Tunkel Chief Strategist, US Equity Strategy irene.tunkel@bcaresearch.com S&P 500 Chart 12Macroeconomic Backdrop
Macroeconomic Backdrop
Macroeconomic Backdrop
Chart 13Profitability
Profitability
Profitability
Chart 14Valuations And Technicals
Valuations And Technicals
Valuations And Technicals
Chart 15Uses Of Cash
Uses Of Cash
Uses Of Cash
Cyclicals Vs Defensives Chart 16Macroeconomic Backdrop
Macroeconomic Backdrop
Macroeconomic Backdrop
Chart 17Profitability
Profitability
Profitability
Chart 18Valuation And Technicals
Valuation And Technicals
Valuation And Technicals
Chart 19Uses Of Cash
Uses Of Cash
Uses Of Cash
Growth Vs Value Chart 20Macroeconomic Backdrop
Macroeconomic Backdrop
Macroeconomic Backdrop
Chart 21Profitability
Profitability
Profitability
Chart 22Valuations And Technicals
Valuations And Technicals
Valuations And Technicals
Chart 23Uses Of Cash
Uses Of Cash
Uses Of Cash
Small Vs Large Chart 24Macroeconomic Backdrop
Macroeconomic Backdrop
Macroeconomic Backdrop
Chart 25Profitability
Profitability
Profitability
Chart 26Valuations and Technicals
Valuations and Technicals
Valuations and Technicals
Chart 27Uses Of Cash
Uses Of Cash
Uses Of Cash
Image
Image
Recommended Allocation Footnotes .
Highlights European economic activity will suffer in Q1 from both the Omicron wave and elevated natural gas prices. The Omicron wave will fade quickly and its impact on growth will be short lived. The biggest economic risk related to Omicron is inflation. Inflation is being caused by supply disruptions, a function of China’s zero-tolerance policy toward COVID. An ebbing of COVID will allow cyclicals to breakout relative to defensive equities in the second quarter. Buy banks / sell tech. For the remainder of the winter, European electricity will remain expensive because of elevated natural gas prices. This process creates a drag on growth and prevents the euro from recovering. European PMIs have not yet bottomed; however, they will do so in Q2. While French and UK economic activity has led Europe in recent months, Germany and the Netherlands are likely to continue to lag as the Omicron variant is only starting there. Italian and Spanish spreads have limited upside under these circumstances. Feature At the end of 2021, the European economy was hit by a spike in COVID-19 infections and another surge in natural gas prices. These shocks will continue to affect activity in the first few months of 2022. Understanding the evolution of these shocks will help investors find attractive entry points for the dominant trend that will play out for the remainder of the year. Omicron Spikes Chart 1Omicron Is Different
Omicron Is Different
Omicron Is Different
COVID-19 cases are once again spiking across Europe because of the highly contagious Omicron variant. As Chart 1 shows, cases in the UK, France, Spain, and Italy have now eclipsed previous peaks. Cases in Germany and the Netherlands have declined recently, but this improvement reflects the ebbing Delta wave. These two countries are likely to follow the path of their European neighbors in relation to the Omicron variant. The Omicron wave will not have a lasting impact on European economic activity despite its frightening scale. Hospitalizations are rising, but they remain far from levels implied by the number of active cases in France, the UK, and Spain (Chart 1, third panel). Additionally, hospitalizations spans are shorter because the infection seems to be less virulent. Recent data out of France indicates that COVID-induced admissions in ICU are now around 18% with a median length of stay of three days, compared to roughly 30% and seven days in the previous waves. This more positive health outcome also reflects the benefit of elevated vaccination rates in the region. The evolution of the Omicron wave in South Africa also points toward a rapid turnaround of the COVID situation in Europe. Gauteng Province, where Omicron first became dominant, witnessed a sharp rise in new cases that declined less than four weeks after the outbreak began (Chart 1, bottom panel). The number of cases there thus seems to have reached its apex already. There are limited reasons to expect a different trajectory for the Omicron wave in Europe. This wave is also affecting individual behavior. Rules are now being developed to impose vaccinations on swath of the recalcitrant population in Italy and Austria, and the French president is openly defying anti-vaxxers by further limiting their daily lives. Vaccination rates are increasing and booster campaigns have rolled out successfully, as the UK illustrates. Finally, anti-viral drugs such as Pfizer Paxlovid will further limit the severity of infections of contaminated individuals. This background implies that the likelihood is low for long-lasting, severe lockdowns, such as those that prevailed in 2020 and in early 2021. As a result, the impact of the Omicron wave on economic activity and the labor market will be temporary and will wane before the end of Q1 2022. Chart 2Cyclicals Will Breakout... Eventually
Cyclicals Will Breakout... Eventually
Cyclicals Will Breakout... Eventually
Financial markets have already adopted this view, as evidenced by European equities that rallied smartly through December—until the release of the Fed’s minutes last week spooked investors. We are inclined to agree with investors and look beyond the impact of COVID at the index level. Nonetheless, as long as the wave remains in place and economic activity bears its footprint, cyclicals will not break out relative to defensives (Chart 2). Omicron, however, is not without risks. China’s commitment to its zero-tolerance policy toward COVID-19 remains firmly in place, which may prove inflationary for the global economy. Entire cities such as Xi’an and Yuzhou have been pushed into lockdowns, and, if Omicron spreads further, more cities will suffer the same fate. If it is sufficiently widespread, then this process will produce global supply-chain bottlenecks again and renew pricing pressures, especially if it expands to Chinese port cities. Investment Implications The first relevant market implication of a transitory Omicron shock is that, despite its violence and breadth, global markets will avoid a severe sell-off caused by plunging economic activity. As a corollary, cyclical stocks may continue to consolidate in the near-term against their defensive counterparts, but a breakout by the middle of 2022 remains highly likely. Chart 3Utilities Hate Ebbing Waves
Utilities Hate Ebbing Waves
Utilities Hate Ebbing Waves
Tactical traders will also soon benefit from a short-term investment opportunity. Utilities have been outperforming in recent weeks as investors bid up defensive plays. However, the pattern of previous waves indicates that, as soon as this wave of cases peaks, utilities stocks will suffer a significant period of underperformance (Chart 3). Thus, short-term investors should sell European utilities once the seven days moving average of new cases peaks in the UK. Chart 4Banks To Outperform Tech
Banks To Outperform Tech
Banks To Outperform Tech
The environment is also likely to remain favorable for banks relative to tech stocks in Europe. The recently released Fed minutes revealed that the FOMC has a strong hawkish bias and that the March meeting will be a live one. It also showed that, if Omicron proved to be inflationary because of its impact on supply chains, the Fed might be even more inclined to raise interest rates and cut its balance sheet size. Thus, a transitory Omicron shock to growth that is likely to have inflationary effects will contribute to higher yields. This will hurt tech stocks relative to banks, especially as European banks forward earnings are rising relative to the tech sector and their relative valuations are extremely favorable (Chart 4). Bottom Line: The number of COVID-19 cases in Europe is spiking rapidly, but we do not expect lengthy lockdowns to become the norm. As a result, the shock to growth caused by the Omicron variant will be ephemeral. Nonetheless, China’s health policy response points to some inflationary risks caused by supply bottlenecks. Investors should expect European markets to continue to take Omicron in stride and cyclicals to breakout later this year. Utilities are soon to be sold relative to the broad market and European banks will benefit at the expense of tech stocks. Natural Gas Remains The Euro’s Foe Chart 5Natural Gas Prices Are High And Volatile
Natural Gas Prices Are High And Volatile
Natural Gas Prices Are High And Volatile
Dynamics in the European natural gas market remain a major risk for European economic activity and European currencies over the course of the first quarter of 2022. Natural gas prices on the Title Transfer Facility in the Netherlands spiked to a record close of EUR181/MWh on December 21, 2021, as tensions with Russia rose in Ukraine. Since then, Dutch natural gas prices—the continental European benchmark—have declined by 46% (Chart 5). The following combination of factors explains this sharp retrenchment: Europe, France, and Germany in particular have enjoyed exceptionally clement weather in recent days, stifling demand for heat and electricity. 11 LNG tankers from the US have been rerouted toward Europe, accounting for 800,000 tonnes of natural gas. Tensions between Russia and the West have eased somewhat. Despite this recent decline in the price of natural gas, it remains at elevated levels. BCA’s commodity and energy strategy team expects its volatility to stay high over the remaining winter months. First, Asia is not sitting on its hands as LNG shipments shift toward Europe. Instead, a bidding war is starting in order to attract liquefied gas to the East. Second, Europe’s winter is far from over, which means that demand-boosting cold fronts are still likely. Finally, Russia is sending gas back to its territory to fulfil its own domestic needs (and probably to continue to put pressure on European nations). Chart 6European Electricity Is Dear
European Electricity Is Dear
European Electricity Is Dear
The continuation of elevated European natural gas prices and the potential for further upsides of volatility remain headwinds to European economic activity this winter, ones we deem comparable to Omicron. The main impact is via electricity prices. As Chart 6 highlights, they are still extremely high in France, Germany, and Spain. The continued surge in the price of CO2 emission quotas is increasing the pressure on electricity prices, as will the upcoming maintenance of many nuclear power plants in France. Gas consumption is contracting on a year-on-year basis in major European markets (Chart 7). This development indicates that elevated natural gas prices are already creating a supply shock to activity and sapping discretionary disposable income from households. The recent decline in European consumer confidence, despite strong employment numbers and growing net worth, confirms that households are feeling the pinch from elevated electricity and natural gas prices (Chart 8). Chart 8Consumers Feel The Pinch
Consumers Feel The Pinch
Consumers Feel The Pinch
Chart 7Gap Consumption Is Slowing
Gap Consumption Is Slowing
Gap Consumption Is Slowing
High natural gas and electricity prices also create further inflation risks for Europe. The recent spikes to 23.7% in PPI inflation and to 5% for headline CPI inflation show the effect of high-energy costs. Instead, a genuine threat would emerge if household inflation expectations followed energy prices, which could in turn trigger a wage-price spiral in Europe. We are not there yet, but the longer natural gas and electricity prices rise, the greater the likelihood of this scenario. Investment Implications The principal consequence of the strength of the European natural gas market is its euro-bearish impact. The tax on European growth is high, which delays the willingness of the ECB to remove monetary accommodation in a meaningful way. On the western shore of the Atlantic, the Fed is poised to pull the trigger soon and is now discussing a decrease in the size of its balance sheet, something the ECB is nowhere near ready to do. Consequently, although EUR/USD may be cheap and oversold on a cyclical basis, a turnaround is unlikely as long as electricity prices remain this elevated. Chart 9EUR/USD near An Existential Level
EUR/USD near An Existential Level
EUR/USD near An Existential Level
Bottom Line: European natural gas prices may have come off their Christmas boil, but they remain elevated and will likely experience major bouts of upside volatility over the remainder of the winter. Hence, the drag on growth stemming from demanding electricity prices remains intact, which negatively affects consumer confidence. The euro cannot rally meaningfully until natural gas prices mean-revert, especially as the Fed ramps up its hawkishness. A re-test of EUR/USD long-term trendline around 1.10 is likely before the end of Q1 (Chart 9). The Evolution Of European PMIs European manufacturing activity remains below its June peak, but it has surprised many observers by how well it is withstanding the various shocks hitting the continent. Despite this encouraging behavior, it may take a few more months before the PMIs find a floor. The following three factors best explain why European manufacturing activity will decelerate further: The Chinese economic slowdown is not over. Credit growth is improving, but much of this comes from increasing purchases of banker’s acceptances by financial institutions, which does not in turn provide credit to the economy. Thus, European exports to China and EM will remain on the backfoot. The Omicron crisis remains intact and natural gas remains a drag, as previously discussed. Chart 10Manufacturing Deceleration Will End In Q2
Manufacturing Deceleration Will End In Q2
Manufacturing Deceleration Will End In Q2
The evolution of the Sentix Global Investor Survey and the ZEW survey, which are a very reliable forecaster of the Manufacturing PMI, points to more economic weakness in Q1 2022 (Chart 10). While these forces will hurt growth in the near term, they also suggest that this deceleration is long in the tooth and that activity will firm anew during the second quarter of the year. The gap between the expectation and current activity components of the Sentix Global Index Survey and the ZEW survey have already bottomed. Moreover, both Omicron and natural gas crises will ebb as winter passes. Finally, Chinese authorities will not let growth collapse and will likely generate a small pickup in activity after the Chinese New Year. Already, the PBoC has ramped up its liquidity injections and Premier Li Keqiang recently highlighted potential tax cuts and support for the corporate sector to help Q1 and Q2 domestic activity. Looking at European countries individually shows that current economic conditions are disparate and largely reflect the different impacts of both Omicron and natural gas prices. To judge economic conditions, we expand the Rotation Methodology introduced two months ago.1 Instead of analyzing financial assets, we examine manufacturing PMIs through this lens, looking at the evolution of the level and momentum of each country’s manufacturing PMIs compared to the overall European level. This approach reveals the following over the past six months (Chart 11):
Chart 11
France experienced the greatest relative improvement, moving from a Lagging economy to the Leading economy in Europe. France benefits from limited lockdowns, from the large role of nuclear power in electricity generation, and from its diminished exposure to China’s slowdown compared to Germany. This economic performance explains why French equities have recently performed so much better than sectoral biases would have justified. The UK economy remains in the Leading quadrant despite the ferocity with which the Omicron wave has overtaken the nation. This paradox reflects the health policy chosen by Downing Street, emphasizing voluntary isolation and investing heavily in booster shots. Relative to that of the rest of Europe, Italy’s and Spain’s PMIs are still elevated, but they are losing momentum, which is pulling these two countries into the Weakening quadrant. The Netherlands suffered the greatest decrease in activity, dropping from the Leading quadrant to the Lagging one. The Netherlands is under a severe lockdown to combat the Delta wave. The situation is unlikely to improve meaningfully any time soon as the Omicron wave is starting there. Germany is trying to stage a recovery, moving from the Lagging quadrant into the Improving one. However, we worry that this will not work out and that Germany will shift back into the Lagging quadrant as the government prepares to crackdown further on COVID because the Omicron variant is starting to hit the country. Investment Implications Chart 12Peripheral Spreads To Stay Contained
Peripheral Spreads To Stay Contained
Peripheral Spreads To Stay Contained
The continuation of the weakness observed in Germany and the Netherlands will force the ECB to remain more dovish than implied by the inflation rate. As a result, Spanish and Italian bond spreads are unlikely to move anywhere close to the levels recorded in the spring of 2020 (Chart 12), especially as their respective economies outperform those of Germany and the Netherlands. Mathieu Savary, Chief European Strategist Mathieu@bcaresearch.com Footnotes 1 The “Leading” (“Lagging”) quadrant denotes countries with PMIs performing better (worse) than the benchmark, the European manufacturing PMI, with strengthening (weakening) momentum. The “Improving” (“Weakening”) quadrant denotes countries with PMIs that are performing worse (better) than the benchmark, with strengthening (weakening) momentum. Tactical Recommendations Cyclical Recommendations Structural Recommendations Closed Trades Currency Performance Fixed Income Performance Equity Performance
Highlights The prospect of Fed rate hikes seems to be weighing on 2022 equity return expectations, … : Financial media outlets have been sounding the alarm about the impact of rate hikes on equity returns. … but we think concerned investors are getting ahead of themselves, because monetary policy works with a lag, … : It takes time for changes in the fed funds rate to work their way through the economy. Even if the FOMC initiates a rate hike campaign in March, its effects may not begin to be felt until September or next March. … and the fed funds rate is miles away from becoming restrictive: In inflation-adjusted terms, the entire interest rate structure is incredibly supportive of economic activity. Assuming 4% inflation, the real fed funds rate will still be well below the bottom of its 2013-19 range even if all of the rate hikes investors are currently discounting occur in 2022. We continue to believe that it is too soon to turn defensive in multi-asset portfolios: The bull markets in equities and credit will eventually end, but not while the FOMC is only beginning to unwind maximum monetary accommodation. Feature The release of the minutes from the FOMC’s December meeting momentarily roiled financial markets last week. The minutes had a distinctly hawkish tone, pointing to a mid-March liftoff date and raising the specter of a shrinking Fed balance sheet. The ensuing sell-off dovetailed with rising anxiety in the financial media about the potentially adverse equity market impacts of impending rate hikes. The opening two paragraphs of “The Big Uneasy” article that filled the front page of The New York Times’ Business section on New Year’s Day captured the prevailing tone:1 For two years, the stock market has been largely able to ignore the lived reality of Americans during the pandemic … because of underlying policies that kept it buoyant. Investors can now say goodbye to all that. The body of the article was much more measured, pointing out that a series of rate hikes would eventually slow the economy and could diminish investors’ near-term appetite for equities, before wrapping up with a wildly sensationalist quote. “The nightmare scenario is: The Fed tightens and it doesn’t help,” said Aaron Brown, a former risk manager of AQR Capital Management who now manages his own money and teaches math at [NYU]. Mr. Brown said that if the Fed could not orchestrate a “soft landing” for the economy, things could start to get ugly – fast. And then, he said, the Fed may have to take “very aggressive action like a rate hike to 15 percent, or wage and price controls, like we tried in the ‘70s.” By an equal measure, the Fed’s moves, even if they are moderate, could also cause a sell-off in stocks, corporate bonds and other riskier assets, if investors panic when they realize that the free money that drove their risk-taking to ever greater extremes over the past several years is definitely going away. Dennis Gartman, the longtime writer of a daily newsletter for traders and institutional investors, echoed the theme in an interview with Bloomberg Radio last Monday. The Bloomberg story summarizing the interview was headlined “Gartman Sees Stocks Falling 15% in 2022 on Aggressive Fed Hikes” and hewed to the higher-rates/lower-stocks mantra. “Gartman said … that stocks could trade 10% to 15% lower this year. While [he] has long been calling for a bear market, he said the catalyst for the decline could be the central bank raising interest rates amid a continued rise in inflation. … ‘The advent of a bear market will come when the Fed begins to tighten monetary policy, and that will be later this year. No question.’” We admired The Gartman Letter and subscribe to the Times, but fed funds rate concerns have gotten overdone. In our view, anxiety about the effect of rate hikes on equity returns in 2022 is misplaced on two counts. First, it ignores that monetary policy only impacts the economy with a lag. Second, it fails to distinguish between the level of the fed funds rate and its direction. The economy and the S&P 500 have historically thrived in the early stages of rate-hiking campaigns, meeting their Waterloo only after the level of the fed funds rate becomes restrictive. The Fed Funds Rate Cycle We formulate investment strategy based on our analysis of the cycles that exert the strongest pull on financial markets: the business cycle, the credit cycle and the monetary policy cycle. As applied to US markets, we have found that the monetary policy cycle has the most reliably meaningful impact. As shown in Figure 1, we decompose the cycle into four phases based on whether the FOMC is hiking (the left half of the curve) or cutting (the right half) rates and the position of the fed funds rate relative to our estimate of its equilibrium level (the dashed horizontal line). We deem policy to be accommodative when the funds rate is below equilibrium and restrictive when it is above equilibrium.
Chart
We like to describe equilibrium as the fed funds rate that neither encourages nor discourages economic activity. The equilibrium rate is a concept and cannot be directly observed; though our estimate represents our best efforts, we recognize that no one can always pinpoint it in real time. We nonetheless take heart from the sharp divide in S&P 500 returns across periods that we have designated as easy or tight. As we show for the first time in this report, growth in key economic indicators aligns consistently with the progression of the funds rate cycle, supporting the investment conclusion that the approaching rate-hiking phase will be favorable for risk assets. Monetary Policy Works With A Lag The idea that monetary policy affects the economy with long and variable lags, first advanced by Milton Friedman in the late fifties, is universally accepted. To test the proposition within our policy cycle framework, we mapped growth in nonfarm payrolls, aggregate bank lending, consumption and GDP across rate cycle phases over the last 60 years. All series grew at their fastest rate in Phase I, when the Fed is tightening policy but has not yet made it tight. They continued to grow faster than their through-the-cycle pace, even when adjusted for inflation, in Phase II, when the Fed continues to hike the funds rate beyond its equilibrium level. Growth in Phases III and IV, when the Fed is easing policy to stimulate the economy, is markedly slower across all metrics than it is when the Fed is tightening. Chart 1 shows each indicator’s phase-by-phase performance in its own panel, with growth in early tightening Phase I (the solid black line) and late tightening Phase II (the dashed green line) easily surpassing early easing Phase III (the solid gray line) and late easing Phase IV (the dashed red line). Chart 1It Takes A While To Turn A Battleship, Especially When The Rudder Moves With Long And Variable Lags
It Takes A While To Turn A Battleship, Especially When The Rudder Moves With Long And Variable Lags
It Takes A While To Turn A Battleship, Especially When The Rudder Moves With Long And Variable Lags
Table 1 fleshes out the results, reporting each metric’s compound annual growth rate (CAGR) across the phases and compiling the CAGRs when the Fed is hiking rates and when it's cutting them. It also presents the nominal growth rates for lending, consumption and GDP, which are not shown in the chart. We view the results as forcefully supporting the long-and-variable view, especially as the FOMC deliberately moves at an incremental pace so as not to act like Friedman’s fool in the shower.2 Given that Phase II growth is comfortably above trend for every metric, it appears that Phase I would have to move at hyperspeed to hobble the economy at any point over the next year-plus. Table 1Phase I Is The Economy's Growth Sweet Spot
The Difference Between Tightening And Tight
The Difference Between Tightening And Tight
The Starting Point Matters, Too The economy should also be insulated from the adverse effects of reduced accommodation by virtue of its current level of support. The real fed funds rate is way below its financial crisis lows (Chart 2, top panel), along with the real 10-year Treasury yield (Chart 2, bottom panel). Both rates have steadily declined over the last 40 years' complete peak-to-peak cycles, in line with the US economy’s declining potential growth. Falling inflation has further contributed to a decline in the nominal equilibrium rate, as per the actual fed funds rate and our in-house estimate (Chart 3). Chart 2Real Rates Have A Long, Long Way To Go To Become Restrictive
Real Rates Have A Long, Long Way To Go To Become Restrictive
Real Rates Have A Long, Long Way To Go To Become Restrictive
Chart 3Interest Rates May Have More Headroom Than Markets Think
Interest Rates May Have More Headroom Than Markets Think
Interest Rates May Have More Headroom Than Markets Think
Our estimate bottomed well before the onset of the pandemic, however, and we would argue that the economy currently has far less need for monetary policy support than it did in the aftermath of the crisis. While the financial system reeled, Congress provided stingy fiscal support before taking it back like Lucy pulling the football away from Charlie Brown. In contrast, the US now has a surfeit of fiscal support and even WeWork founder Adam Neumann has ready access to capital. The upshot is that the rates tipping point is miles away and we doubt the Fed can cover that much ground in the space of one year. For Equities, Level Trumps Direction The level, not the direction, of the fed funds rate has driven US equity performance over the 60-year period covered by our equilibrium estimate. The S&P 500 has eked out a 0.4% nominal annualized return across the aggregate 19 years that policy has been tight, by our reckoning, while advancing 10.6% annually over the accumulated 41 years when it has been easy (Table 2). Easy policy’s ten-percentage-point advantage over tight policy leaves cutting rates’ four-point edge over hiking rates in the dust. Table 2Easy Policy Settings Yield An Extra 10 Percentage Points Of Nominal Returns, ...
The Difference Between Tightening And Tight
The Difference Between Tightening And Tight
Table 3... And An Extra 11.5 After Adjusting For Inflation
The Difference Between Tightening And Tight
The Difference Between Tightening And Tight
The easy/tight disparity widens to eleven-and-a-half percentage points when nominal returns are adjusted for inflation. In Phases I and IV, when the fed funds rate is below our estimate of equilibrium, the S&P 500 has generated robust 7.1% real annualized returns while shedding 4.4% in Phases II and III, when the funds rate exceeds our equilibrium estimate (Table 3). Stocks do better on a real basis when the Fed is cutting rates, just as they do on a nominal basis, but the spread is narrower. The level of rates is the key dividing line, not their direction. Investment Implications The empirical record overwhelmingly supports the idea that early-stage rate hikes will not stifle growth or prevent equities from generating ample positive excess returns over Treasuries and cash. Against a backdrop of high and soaring inflation that the economy has only faced twice in the last 50 years (Chart 4), however, it is worth considering whether this time could be different. Whereas most recent rate hike campaigns have patiently aimed to prevent potential inflation pressures from taking root in a robust economy, this one might require the Fed to move urgently to get the genie back in the bottle. Chart 4Be Careful What You Wish For, Central Bankers
Be Careful What You Wish For, Central Bankers
Be Careful What You Wish For, Central Bankers
The potential for urgent rather than incremental action could turn the prevailing positive correlation between stock prices and interest rates negative, as our Chief Emerging Markets Strategist Arthur Budaghyan has warned. If inflation worries choke off animal spirits, multiple de-rating could more than offset typical Phase I earnings gains, sending stocks lower. Although we do not expect multiple contraction in 2022 given the dearth of asset classes with positive expected real returns, we see it as one of the major threats to our risk-friendly positioning. We will be watching out for it, along with adverse pandemic surprises and the possibility that consumption could disappoint, though we will stick with our constructive positioning in the meantime. Doug Peta, CFA Chief US Investment Strategist dougp@bcaresearch.com Footnotes 1 "Fed’s Moves in 2022 Could End the Stock Market’s Pandemic Run", The New York Times (nytimes.com). Accessed January 3, 2022. 2 Friedman likened central banks to a person who excessively turns the hot or the cold tap in the shower when the water temperature does not change immediately, only to shock him/herself once the lag between action and effect closes.
Highlights In this week’s report we update our Chart Pack, updating familiar charts that underscore our strategic themes and cyclical/tactical views. Social unrest in Kazakhstan points to two of our strategic themes: great power struggle and populism/nationalism. A sneak preview of our Black Swan risks for the year: Iran crisis, Russian aggression, and a massive cyber attack. Recent market moves reinforce the BCA House View that investors will rotate out of US growth stocks and into global cyclicals and value plays. We are sticking with our current tactical and cyclical views and trades. Feature Since releasing our key views for 2022, bond yields have surged, tech shares have sold off, and social unrest has erupted in Central Asia. These developments have both structural and cyclical drivers and are broadly supportive of our investment strategy. First, a brief word about Kazakhstan. The surge in unrest this week is a new and urgent example of one of our strategic themes: populism and nationalism. Long-accumulating Kazakh nationalism is blowing up and forcing the autocratic regime to complete an unfinished political leadership transition that began three years ago. Russia is now forced to intervene militarily to maintain stability in this important satellite state. If instability is prolonged, Russia will be weakened in its high-stakes standoff against the United States and the West over Ukraine. China’s interest in Kazakhstan is also threatened by the change in political orientation there. We will provide a full report on this topic soon but for now the investment implication is to stay short Russian equities. In the rest of this report we offer our newly revised chart book for investors to consider as they gird for a year that promises to be anything but dull. The purpose of the chart book is to update a succinct series of charts that underpin our key themes and views. Many of these charts will be familiar to regular readers but here they are updated with some notable points highlighted in the text. A Waning Pandemic And Global Growth Falling To Trend The Omicron variant of COVID-19 is causing a surge of new cases and hospitalizations around the world, which will weigh on economic activity in the first quarter. However, this variant does not appear to be a game changer. While it is highly contagious, not as many people who go to the hospital end up in the intensive care unit (Chart 1).
Chart 1
China is in a difficult predicament that will continue to constrict the global supply side of the economy. Chinese authorities maintain a “zero COVID” policy that emphasizes draconian social restrictions to suppress COVID cases and deaths to minimal levels (Chart 2A).
Chart 2
Chart 2
But Chinese-made vaccines are not as effective as western alternatives, particularly against Omicron, as discussed in our flagship Bank Credit Analyst. Hence China cannot open its economy without risking a disastrous wave of infections. When China shuts down activity, as at the Yantian port last spring, the rest of the world suffers higher costs for goods (Chart 2B). Chart 3Global Growth Will Fall Back To Trend
Global Growth Will Fall Back To Trend
Global Growth Will Fall Back To Trend
Global economic growth is decelerating from the peaks of the extreme rebound (Chart 3). The historic fiscal stimulus of 2020 (Chart 4A) is giving way to negative fiscal thrust, or a decline in budget deficits, that will take away from growth (Chart 4B).
Chart 4
Chart 4
Chart 5Inflation Will Moderate But Remain A Long-Term Risk
Inflation Will Moderate But Remain A Long-Term Risk
Inflation Will Moderate But Remain A Long-Term Risk
Yet a recession is not the likeliest scenario since growth is expected to stabilize given the resumption of activity across the world due to an improved ability to live with the virus. The Federal Reserve is considering hiking interest rates faster than the market had expected given that the unemployment rate is collapsing and core inflation is surging. The persistence of the pandemic’s supply disruptions adds to concerns. At the same time, a wage-price spiral is not yet taking shape, as our bond strategist Ryan Swift shows. Productivity is growing faster than real wages and long-term inflation expectations remain within reasonable ranges, at least for now (Chart 5). Three Strategic Themes In our annual outlook (“2022 Key Views: The Gathering Storm”) we revised our long-term mega themes: 1. Great Power Struggle The US’s relative decline as a share of global geopolitical power, despite a brief respite last year, is indicated in Charts 6-8.
Chart 6
Chart 7
Chart 7
Chart 8America's Global Role Persists (If Lessened)
America's Global Role Persists (If Lessened)
America's Global Role Persists (If Lessened)
2. Hypo-Globalization An ongoing globalization process, yet one that falls short of potential, is shown in Charts 9-10. A tentative improvement in our multi-century globalization chart is misleading – it is due to lack of data reporting by several countries, which artificially suppresses the denominator. Chart 9Hypo-Globalization And Hegemonic Instability
Hypo-Globalization And Hegemonic Instability
Hypo-Globalization And Hegemonic Instability
Chart 10AFrom 'Hyper-Globalization' To Hypo-Globalization
From 'Hyper-Globalization' To Hypo-Globalization
From 'Hyper-Globalization' To Hypo-Globalization
While trade sharply rebounded from the pandemic, the global policy setting is now averse to ever-deeper dependency on international trade. Chart 10BFrom 'Hyper-Globalization' To Hypo-Globalization
From 'Hyper-Globalization' To Hypo-Globalization
From 'Hyper-Globalization' To Hypo-Globalization
3. Populism and Nationalism The post-pandemic cycle will see these structural trends reaffirmed. Charts 11-12 shows a rising Misery Index, or sum of unemployment and inflation, a source of political turmoil that will both reflect and feed these trends. Chart 11Misery Indexes Signal More Unrest, Populism, And Nationalism
Misery Indexes Signal More Unrest, Populism, And Nationalism
Misery Indexes Signal More Unrest, Populism, And Nationalism
Chart 12EM Populism/Nationalism Threatens Negative Surprises In 2022
EM Populism/Nationalism Threatens Negative Surprises In 2022
EM Populism/Nationalism Threatens Negative Surprises In 2022
Chart 12 highlights major markets that have local or nationwide elections in 2022-23, where policy fluctuations are already occurring with various investment implications. We are tactically bullish on South Korea and Brazil, strategically but not tactically bullish on India, and bearish on Turkey. Russia’s domestic sociopolitical problems are not all that different from Kazakhstan’s and its response may be outwardly aggressive, so we are bearish. Three Key Views For 2022 Our annual outlook also outlined three key views for this year: 1. China’s Reversion To Autocracy The government will ease policy to secure the economic recovery so that President Xi Jinping can clinch his personal rule for at a critical Communist Party personnel reshuffle this fall (Chart 13). Chart 13China Will Easy Policy Ahead Of Political Reversion To Autocracy
China Will Easy Policy Ahead Of Political Reversion To Autocracy
China Will Easy Policy Ahead Of Political Reversion To Autocracy
A stabilization of Chinese demand in 2022 will be positive for commodities, cyclical equity sectors, and emerging markets.
Chart 14
Chart 14
Policy easing will not lead to a sustainable rally in Chinese equities, as internal and external political risks remain high (Charts 14A & 14B). A “fourth Taiwan Strait Crisis” is likely in the short run while a military conflict is not unlikely over the long run. 2. America’s Policy Insularity The Biden administration is focused on domestic legislation and the midterm elections, due November 8, 2022. Biden’s approval rating has deteriorated further, putting the Democrats in line for a loss of around 40 seats in the House and four seats in the Senate, judging by historic patterns (Chart 15). But our sense is that the Senate is still in play – Democrats probably will not lose four Senate seats – but they are likely to lose control of both chambers as things stand.
Chart 15
However, the Democrats still have a subjective 65% chance of passing a partisan budget reconciliation bill, which would be a badly needed victory. The “Build Back Better” plan would include a minimum corporate tax and various social programs. Another round of fiscal reflation would reinforce the Federal Reserve’s less dovish pivot. Chart 16US Still At Peak Polarization
US Still At Peak Polarization
US Still At Peak Polarization
Polarization will remain at historic peaks leading up to the election, as the Democrats will need “wedge issues” to drive enthusiasm among their popular base in the face of Republican enthusiasm. For decades polarization has correlated with falling Treasury yields and US tech sector equity outperformance (Chart 16). Midterm election years tend to see flat equity performance and falling yields, albeit with yields higher when a single party controls government, as is the case this year. 3. Petro-State Leverage Globally, commodity markets continue to tighten on the supply side. Our Commodity & Energy Strategist Bob Ryan outlines the situation admirably: The supply side is tightening in oil markets, where OPEC 2.0 producers have been unable to restore output under their agreement to return 400,000 barrels per day each month since August 2021. It is true in base metals, where the energy crisis in Europe and Asia are constricting supplies, particularly in copper. And it is true in agricultural commodities, where high natural gas prices are driving fertilizer prices higher, which will push food prices up this year. Demand for these commodities will increase as Omicron becomes the dominant COVID-19 strain, keeping consumption above production, particularly in oil. These are long-term trends. Oil and natural gas markets will probably remain tight throughout the decade, as will base metal markets. This is going to put enormous stress on the global energy transition to renewable energy over the next 10 years. The ascendance of left-of-center political parties in critical base-metal exporting states, and rising ESG initiatives, will increase costs for energy and metals producers; and global climate activism in boardrooms and courtrooms will push costs higher as well. Higher prices will be necessary to recover these cost increases. In this context, energy producers gain geopolitical leverage. Their treasuries become flush with cash and they see an opportunity to pursue foreign policy objectives. Conflicts involving oil producers are more likely when oil prices are swinging up (Chart 17).
Chart 17
This trend is on display in Russia’s dispute with the West, where Europe is struggling with a surge in natural gas prices due to Russian supply constraints that weaken its resolve in the showdown over Ukraine (Chart 18, top panel). Chart 18Energy Prices: Biden's And Europe's Problem
Energy Prices: Biden's And Europe's Problem
Energy Prices: Biden's And Europe's Problem
Yet even in the energy-independent US, the Biden administration is wary of pursuing policies against Russia or Iran that would ignite a bigger spike in prices at the pump during an election year (Chart 18, bottom panel). Biden will have to attend to foreign policy this year but will be defensive. Petro-states are not immune to domestic problems, including social unrest. Many of them are poor, unequal, misgoverned, and suffering from inflation. Iran is a prime example. Yet Iran has not collapsed under sanctions so far, the world is recovering, and Tehran has the advantage in its negotiations with the US because it can stage attacks across the Middle East, including the Persian Gulf and Strait of Hormuz. Military incidents could drive oil prices into politically punitive territory. Three Black Swans For 2022 This brings us to three “Black Swans” or low-probability, high-impact events for 2022. We will publish our regular annual report on this year’s black swans soon. For now we offer a sneak preview: 1. Iran Crisis In Middle East The fear of being abandoned by the US has kept Israel from acting unilaterally so far (Chart 19A).
Chart 19
Chart 19
But an attack is not impossible if Iran reaches “breakout” levels of highly enriched uranium – and the global impact of an attack could be catastrophic (Chart 19B). The news media have been conspicuously quiet about Iran. Taken together, this scenario is pretty much the definition of a black swan. 2. Russian Aggression Abroad There is a 50% chance that Russia will stage a limited re-invasion of Ukraine to secure its control of territory in the east or along the Black Sea coast. Chart 20Black Swan #2: Russian Aggression Abroad
Black Swan #2: Russian Aggression Abroad
Black Swan #2: Russian Aggression Abroad
Within this risk, there is a small chance (less than 5%) that Russia would invade all of Ukraine. We do not expect this and neither do other analysts. The total conquest of Ukraine is unlikely when Russia’s domestic conditions are weak and it faces so much unrest in other parts of its sphere of influence (including Belarus and Kazakhstan). As we go to press, Russia is staging a military intervention in Kazakhstan, which could expand. Kazakhstan could create a way for Russia to avoid its self-induced pressure to take military action against Ukraine. But most likely Russia and Kazakhstan will quell the unrest, enabling Russia to sustain the threat of a partial re-invasion of Ukraine. Putin’s low approval rating often triggers new foreign adventures and financial markets are pricing higher risks (Chart 20). 3. Massive Cyber Attack Amid the pandemic and inflation surge, investors have forgotten about the huge risks facing businesses and individuals from their extreme dependency on remote work and digital services. A cyber war is also raging behind the scenes. So far it has not spilled into the physical realm. Yet Russia-based ransomware attacks in 2021 showed that vital US infrastructure is vulnerable. Cyber stocks have topped out amid the recent tech selloff (Chart 21A). But the global average cost of data breaches is skyrocketing. Governments are devoting more resources to network security and cyber-security (Chart 21B), which should be positive for earnings. Chart 21ABlack Swan #3: Massive Cyber Attack
Black Swan #3: Massive Cyber Attack
Black Swan #3: Massive Cyber Attack
Chart 21BBlack Swan #3: Massive Cyber Attack
Black Swan #3: Massive Cyber Attack
Black Swan #3: Massive Cyber Attack
Investment Takeaways The revised Geopolitical Risk Index does not show as pronounced of an uptrend as the version published last year but it is still higher than in the late 1990s (Chart 22). Our reading of all available evidence points to rising geopolitical risk – at least until the current challenge to US global supremacy leads to a new equilibrium.
Chart 22
Global policy uncertainty is also rising on a secular basis and maintaining its correlation with the trade-weighted dollar, which has rebounded despite the global growth recovery and rise in inflation (Chart 23). We remain neutral on the dollar. Chart 23A Secular Rise In Global Uncertainty
A Secular Rise In Global Uncertainty
A Secular Rise In Global Uncertainty
Gold has fallen from its peaks during the onset of the pandemic and real rates suggest it will fall further. But we hold it as a hedge against geopolitical risk as well as inflation (Chart 24). Chart 24Stay Long Gold As Hedge Against Geopolitical Crisis As Well As Inflation
Stay Long Gold As Hedge Against Geopolitical Crisis As Well As Inflation
Stay Long Gold As Hedge Against Geopolitical Crisis As Well As Inflation
The evidence is inconclusive about whether global investors will rotate away from US assets this year. The US share of global equity capitalization is stretched. Long-dated Treasuries will eventually reflect higher inflation expectations (Chart 25). Chart 25No Substitute For The USA Yet
No Substitute For The USA Yet
No Substitute For The USA Yet
Chart 26Waiting For Rotation
Waiting For Rotation
Waiting For Rotation
US equity outperformance continues unabated and emerging market equities are still underperforming their developed peers (Chart 26). Cyclically investors should take the opposite side of these trends but not tactically. The renminbi is tentatively peaking against both the dollar and euro. As expected, China’s policymakers are shifting toward preserving economic stability (Chart 27). Stabilization may require a weaker renminbi, though producer price inflation is also a factor for the People’s Bank to consider. Chart 27Strategically Short Renminbi And Taiwanese Dollar
Strategically Short Renminbi And Taiwanese Dollar
Strategically Short Renminbi And Taiwanese Dollar
Taiwanese stocks continue to outperform Korean stocks (to our chagrin) but they have not broken above previous peaks relative to global equities. Nor has the Taiwanese dollar broken above previous peaks versus the greenback (Chart 28). So far Taiwan has avoided the fate of semiconductor stocks, which have sold off. This situation presents a buying opportunity for semi stocks but we remain short Taiwan as a bourse because it is central to US-China strategic conflict. Chart 28Strategically Short Taiwan
Strategically Short Taiwan
Strategically Short Taiwan
Chart 29Strategically Short Russia And EM Europe
Strategically Short Russia And EM Europe
Strategically Short Russia And EM Europe
Chart 30Safe Havens Look Attractive
Safe Havens Look Attractive
Safe Havens Look Attractive
Russia and eastern European assets continue to underperform developed market peers as geopolitical risks mount across the former Soviet Union (Chart 29). Russia’s negotiations with the US, NATO, and the EU in January will help us to gauge whether tensions will break out to new highs. Assuming Russia succeeds in quashing Kazakh unrest, it will be necessary for the US to offer concessions to Russia to prevent the Ukraine showdown from worsening Europe’s energy crisis. Safe havens caught a bid in early 2021 and have not yet broken down. Our geopolitical views support building up safe-haven positions (Chart 30). Presumably one should favor global cyclical equities as the pandemic wanes and global growth stabilizes. But cyclicals are struggling to outperform defensives (Chart 31A). Chart 31AFavor Cyclicals On China's Stabilization
Favor Cyclicals On China's Stabilization
Favor Cyclicals On China's Stabilization
Chart 31BFavor Cyclicals On China's Stabilization
Favor Cyclicals On China's Stabilization
Favor Cyclicals On China's Stabilization
China’s policy easing is positive in this regard, although the new wave of fiscal-and-credit support is only just beginning and financial markets will remain skeptical until the dovish policy pivot is borne out in hard data (Chart 31B). Global value stocks have ticked up again versus growth stocks, suggesting that the choppy process of bottom formation continues (Charts 32A & 32B). Chart 32AValue’s Choppy Bottom Versus Growth Stocks
Value's Choppy Bottom Versus Growth Stocks
Value's Choppy Bottom Versus Growth Stocks
Chart 32BValue’s Choppy Bottom Versus Growth Stocks
Value's Choppy Bottom Versus Growth Stocks
Value's Choppy Bottom Versus Growth Stocks
Matt Gertken Vice President Geopolitical Strategy mattg@bcaresearch.com Strategic Themes Open Tactical Positions (0-6 Months) Open Cyclical Recommendations (6-18 Months)