Equities

Highlights Global equities are poised to deliver mid-to-high single-digit returns this year, with the outlook turning bleaker in 2023 and beyond. Non-US markets are likely to outperform. We examine the four pillars that have historically underpinned stock market performance. Pillar 1: Technically, the outlook for equities is modestly bullish, as investor sentiment is nowhere near as optimistic as it usually gets near market tops. Pillar 2: The outlook for economic growth and corporate earnings is modestly bullish as well. While global growth is slowing, it will remain solidly above trend in 2022. Pillar 3: Monetary and financial conditions are neutral. The Fed and a number of other central banks are set to raise rates and begin unwinding asset purchases this year. However, monetary policy will remain highly accommodative well into 2023. Pillar 4: Valuations are bearish in the US and neutral elsewhere. Investors should avoid tech stocks in 2022, focusing instead on banks and deep cyclicals, which are more attractively priced. The Bedrock For Equities In assessing the outlook for the stock market, our research has focused on four pillars: 1) Sentiment and other technical factors, which are most pertinent for stocks over short-term horizons of about three months; 2) cyclical fluctuations in economic growth and corporate earnings, which tend to dictate the path for stocks over medium-term horizons of about 12 months; 3) monetary and financial conditions, which are also most relevant over medium-term horizons; and finally 4) valuations, which tend to drive stocks over the long run. In this report, we examine all four pillars, concluding that global equities are likely to deliver mid-to-high single-digit returns this year, with the outlook turning bleaker in 2023 and beyond. Pillar 1: Sentiment And Other Technical Factors (Modestly Bullish) Chart 1US Equities: Breadth Is A Concern
US Equities: Breadth Is A Concern
US Equities: Breadth Is A Concern
Scaling The Wall Of Worry Stocks started the year on a high note, before tumbling on Wednesday following the release of the Fed minutes. Market breadth going into the year was quite poor. Even as the S&P 500 hit a record high on Tuesday, only 57% of NYSE stocks and 38% of NASDAQ stocks were trading above their 200-day moving averages compared to over 90% at the start of 2021 (Chart 1). The US stock market had become increasingly supported by a handful of mega-cap tech stocks, a potentially dangerous situation in an environment where bond yields are rising and stay-at-home restrictions are apt to ease (more on this later). That said, market tops often occur when sentiment reaches euphoric levels. That was not the case going into 2022 and it is certainly not the case after this week's sell-off. The number of bears exceeded the number of bulls in the AAII survey this week and in six of the past seven weeks (Chart 2). The share of financial advisors registering a bullish bias declined by 25 percentage points over the course of 2021 in the Investors Intelligence poll. Option pricing is far from complacent. The VIX stands at 19.6, above its post-GFC median of 16.7. According to the Minneapolis Fed’s market-based probabilities model, the market was discounting a slightly negative 12-month return for the S&P 500 as of end-2021, with a 3.6 percentage-point larger chance of a 20% decline in the index than a 20% increase (Chart 3). Chart 3Option Pricing Is Not Pointing To Elevated Complacency
Option Pricing Is Not Pointing To Elevated Complacency
Option Pricing Is Not Pointing To Elevated Complacency
Chart 2Sentiment Is Not Exceptionally Bullish, Despite The S&P 500 Trading Close To All-Time Highs
Sentiment Is Not Exceptionally Bullish, Despite The S&P 500 Trading Close To All-Time Highs
Sentiment Is Not Exceptionally Bullish, Despite The S&P 500 Trading Close To All-Time Highs
Equities do best when sentiment is bearish but improving (Chart 4). With bulls in short supply, stocks can continue to climb the proverbial wall of worry. Whither The January Effect? Historically, stocks have fared better between October and April than between May and September (Chart 5). One caveat is that the January effect, which often saw stocks rally at the start of the year, has disappeared. In fact, the S&P 500 has fallen in January by an average annualized rate of 5.2% since 2000 (Table 1). Other less well-known calendar effects – such as the tendency for stocks to underperform on Mondays but outperform on the first trading day of each month – have persisted, however.
Chart 4
Chart 5
Table 1Calendar Effects
The Four Pillars Of The Stock Market
The Four Pillars Of The Stock Market
Bottom Line: January trading may be choppy, but stocks should rise over the next few months as more bears join the bullish camp. Last year’s losers are likely to outperform last year’s winners. Pillar 2: Economic Growth And Corporate Earnings (Modestly Bullish) Economic Growth And Earnings: Joined At The Hip The business cycle is the most important driver of stocks over medium-term horizons of about 12 months. The reason is evident in Chart 6: Corporate earnings tend to track key business cycle indicators such as the ISM manufacturing index, industrial production, business sales, and global trade. Chart 6The Business Cycle Is The Most Important Driver Of Stocks Over Medium-Term Horizons
The Business Cycle Is The Most Important Driver Of Stocks Over Medium-Term Horizons
The Business Cycle Is The Most Important Driver Of Stocks Over Medium-Term Horizons
Chart 7PMIs Signaling Above-Trend Growth
PMIs Signaling Above-Trend Growth
PMIs Signaling Above-Trend Growth
Global growth peaked in 2021 but should stay solidly above trend in 2022. Both the service and manufacturing PMIs remain in expansionary territory (Chart 7). The forward-looking new orders component of the ISM exceeded 60 for the second straight month in December. The Bloomberg consensus is for real GDP to rise by 3.9% in the G7 in 2022, well above the OECD’s estimate of trend G7 growth of 1.4% (Chart 8). Global earnings are expected to increase by 7.1%, rising 7.5% in the US and 6.7% abroad (Chart 9). Our sense is that both economic growth and earnings will surprise to the upside in 2022. Chart 9Analysts Expect Single-Digit Earnings Growth
Analysts Expect Single-Digit Earnings Growth
Analysts Expect Single-Digit Earnings Growth
Chart 8
Plenty Of Pent-Up Demand For Both Consumer And Capital Goods US households are sitting on $2.3 trillion in excess savings (Chart 10). Around half of these savings will be spent over the next few years, helping to drive demand. Households in the other major advanced economies have also buttressed their balance sheets. Chart 10Plenty Of Pent-Up Demand
Plenty Of Pent-Up Demand
Plenty Of Pent-Up Demand
After two decades of subdued corporate investment, capital goods orders have soared. This bodes well for capex in 2022. Inventories remain at rock-bottom levels, which implies that output will need to exceed spending for the foreseeable future (Chart 11). On the residential housing side, both the US homeowner vacancy rate and the inventory of homes for sale are near multi-decade lows. Building permits are 11% above pre-pandemic levels (Chart 12). Chart 11Business Investment Should Be Strong In 2022
Business Investment Should Be Strong In 2022
Business Investment Should Be Strong In 2022
Chart 12Residential Construction Will Remain Well Supported
Residential Construction Will Remain Well Supported
Residential Construction Will Remain Well Supported
Chart 13China's Credit Impulse Has Bottomed
China's Credit Impulse Has Bottomed
China's Credit Impulse Has Bottomed
Chinese Growth To Rebound, Europe To Benefit From Lower Natural Gas Prices Chinese credit growth decelerated last year. However, the 6-month credit impulse has bottomed, and the 12-month impulse is sure to follow (Chart 13). Chinese coal prices have collapsed following the government’s decision to instruct 170 mines to expand capacity (Chart 14). China generates 63% of its electricity from coal. Lower energy prices and increased stimulus should support Chinese industrial activity in 2022. Like China, Europe will benefit from lower energy costs. Natural gas prices have fallen by nearly 50% from their peak on December 21st. A shrinking energy bill will support the euro (Chart 15). Chart 14Coal Prices Are Renormalizing In China
Coal Prices Are Renormalizing In China
Coal Prices Are Renormalizing In China
Chart 15A Shrinking Energy Bill Will Support The Euro
A Shrinking Energy Bill Will Support The Euro
A Shrinking Energy Bill Will Support The Euro
Chart 16
Omicron Or Omicold? While the Omicron wave has led to an unprecedented spike in new cases across many countries, the economic fallout will be limited. The new variant is more contagious but significantly less lethal than previous ones. In South Africa, it blew through the population without triggering a major increase in mortality (Chart 16). Preliminary data suggest that exposure to Omicron confers at least partial immunity against Delta. The general tendency is for viral strains to become less lethal over time. After all, a virus that kills its host also kills itself. Given that Omicron is crowding out more dangerous strains such as Delta, any future variant is likely to emanate from Omicron; and odds are this new variant will be even milder than Omicron. Meanwhile, new antiviral drugs are starting to hit the market. Pfizer claims that its new drug, Paxlovid, cuts the risk of hospitalization by almost 90% if taken within five days from the onset of symptoms. Bottom Line: While global growth has peaked and the pandemic remains a risk, growth should stay well above trend in the major economies in 2022, fueling further gains in corporate earnings and equity prices. Pillar 3: Monetary And Financial Factors (Neutral) Chart 17The Overall Stance Of Monetary Policy Will Not Return To Pre-Pandemic Levels For At Least Another 12 Months
The Overall Stance Of Monetary Policy Will Not Return To Pre-Pandemic Levels For At Least Another 12 Months
The Overall Stance Of Monetary Policy Will Not Return To Pre-Pandemic Levels For At Least Another 12 Months
Tighter But Not Tight Monetary and financial factors help govern the direction of equity prices both because they influence economic growth and also because they affect the earnings multiple at which stocks trade. There is little doubt that a number of central banks, including the Federal Reserve, are looking to dial back monetary stimulus. However, there is a big difference between tighter monetary policy and tight policy. Even if the FOMC were to raise rates three times in 2022, as the market is currently discounting, the fed funds rate would still be half of what it was on the eve of the pandemic (Chart 17). Likewise, even if the Fed were to allow maturing assets to run off in the middle of this year, as the minutes of the December FOMC meeting suggest is likely, the size of the Fed’s balance sheet will probably not return to pre-pandemic levels until the second half of this decade. A Higher Neutral Rate We have argued in the past that the neutral rate of interest in the US is higher than widely believed. This implies that the overall stance of monetary policy remains exceptionally stimulative. Historically, stocks have shrugged off rising bond yields, as long as yields did not increase to prohibitively high levels (Table 2). Table 2As Long As Bond Yields Don’t Rise Into Restrictive Territory, Stocks Will Recover
The Four Pillars Of The Stock Market
The Four Pillars Of The Stock Market
If the neutral rate ends up being higher than the Fed supposes, the danger is that monetary policy will stay too loose for too long. The question is one of timing. The good news is that inflation should recede in the US in 2022, as supply-chain bottlenecks ease and spending shifts back from goods to services. The bad news is that the respite from inflation will not last. As discussed in Section II of our recently-published 2022 Strategy Outlook, inflation will resume its upward trajectory in mid-2023 on the back of a tightening labor market and a budding price-wage spiral. This second inflationary wave could force the Fed to turn much more aggressive, spelling the end of the equity bull market. Bottom Line: While the Fed is gearing up to raise rates and trim the size of its balance sheet, monetary policy in the US and in other major economies will remain highly accommodative in 2022. US policy could turn more restrictive in 2023 as a second wave of inflation forces a more aggressive response from the Fed. Pillar 4: Valuations (Bearish In The US; Neutral Elsewhere) US Stocks Are Looking Pricey… While valuations are a poor timing tool in the short run, they are an excellent forecaster of stock prices in the long run. Chart 18 shows that the Shiller PE ratio has reliably predicted the 10-year return on equities. Today, the Shiller PE is consistent with total real returns of close to zero over the next decade.
Chart 18
Investors’ allocation to stocks has also predicted the direction of equity prices (Chart 19). According to the Federal Reserve, US households held a record high 41% of their financial assets in equities as of the third quarter of 2021. If history is any guide, this would also correspond to near-zero long-term returns on stocks. Chart 19Valuations Matter For Long-Term Returns (II)
Valuations Matter For Long-Term Returns (II)
Valuations Matter For Long-Term Returns (II)
… But There Is More Value Abroad Valuations outside the US are more reasonable. Whereas US stocks trade at a Shiller PE ratio of 37, non-US stocks trade at 20-times their 10-year average earnings. Other valuation measures such as price-to-book, price-to-sales, and dividend yield tell a similar story (Chart 20). Chart 20AUS Stocks Are Trading At A Significant Premium To Their Non-US Peers (I)
US Stocks Are Trading At A Significant Premium To Their Non-US Peers (I)
US Stocks Are Trading At A Significant Premium To Their Non-US Peers (I)
Chart 20BUS Stocks Are Trading At A Significant Premium To Their Non-US Peers (II)
US Stocks Are Trading At A Significant Premium To Their Non-US Peers (II)
US Stocks Are Trading At A Significant Premium To Their Non-US Peers (II)
Cyclicals And Banks Overrepresented Abroad Our preferred sector skew for 2022 favors non-US equities. Increased capital spending in developed economies and incremental Chinese stimulus should boost industrial stocks and other deep cyclicals, which are overrepresented outside the US (Table 3). Banks are also heavily weighted in overseas markets; they should also do well in response to faster-than-expected growth and rising bond yields (Chart 21). Table 3Deep Cyclicals And Financials Are Overrepresented Outside The US
The Four Pillars Of The Stock Market
The Four Pillars Of The Stock Market
Chart 21Rising Bond Yields Will Help Bank Shares
Rising Bond Yields Will Help Bank Shares
Rising Bond Yields Will Help Bank Shares
Bottom Line: Valuations are more appealing outside the US, and with deep cyclicals and banks set to outperform tech over the coming months, overseas markets are the place to be in 2022. Peter Berezin Chief Global Strategist peterb@bcaresearch.com Global Investment Strategy View Matrix
Image
Special Trade Recommendations
Image
Current MacroQuant Model Scores
Image
The December FOMC meeting minutes reinforced the Fed’s hawkish pivot and sent a chill down Wall Street on Wednesday. Unsurprisingly, the equity selloff was led by long-duration, interest rate sensitive sectors. The question facing investors going forward is…
Highlights For the time being, US core inflation will not drop anywhere close to the Fed’s target range. The Fed will continue tightening until something breaks. US bond yields and the US dollar are heading higher. The S&P500 will need to drop meaningfully for the Fed to stop tightening. The Fed’s tightening and the US dollar’s persistent strength amid the lack of recovery in the Chinese business cycle will eventually produce a drawdown in commodity prices in the coming months. Absolute-return investors should stay defensive on EM risk assets and asset allocators should continue to underweight EM versus DM in global equity and credit portfolios. Feature We are starting the year with a review of a few macro pillars of our view that will shape global financial markets in the coming months. US Core Inflation Will Prove Sticky… Chart 1Average Of All Core US Inflation Measures
Average Of All Core US Inflation Measures
Average Of All Core US Inflation Measures
The average of seven various US core inflation measures – core CPI, core PCE, trimmed-mean CPI, median CPI, sticky core CPI, trimmed-mean PCE and market-based core PCE – has surged to 4% (Chart 1). Although the core inflation rate could decline in 2022 as supply bottlenecks ease and base effects become more favorable, it is unlikely to drop below 3%. Instead, it will remain well above the Fed’s inflation target. If the Fed adheres to its mandate, it will have to hike rates until inflation heads toward 2%. US core inflation will not drop toward 2% unless the economy slows materially. Consumer and business inflation expectations have risen substantially. US consumer inflation expectations for one and three years ahead have risen to 4-6%, and US non-farm businesses have been able to raise prices by 4.5% y/y in Q3 (Chart 2). We can say the genie – inflation and inflation expectations – is out of bottle and it will be hard to put it back in. Importantly, labor market shortages will persist, and employee wage demand will be strong. Employees’ current wage growth expectations are based on their inflation expectations in the next one to three years, not the next decade. Even though longer term inflation expectations remain somewhat muted, they will not prevent high wage growth. Critically, inflation has “eaten” into employee income: real wage growth – adjusted for headline consumer price inflation – has been negative in 2021 (Chart 3). Consistently, employees know their compensation has lagged inflation and will be demanding significant wage hikes in 2022. Chart 3Inflation Is "Eating" Into Wages In The US
Inflation Is "Eating" Into Wages In The US
Inflation Is "Eating" Into Wages In The US
Chart 2US Inflation Expectations Have Risen Sharply
US Inflation Expectations Have Risen Sharply
US Inflation Expectations Have Risen Sharply
In short, a wage-price spiral of moderate proportions is unfolding. Given tight labor market conditions, businesses will have no choice but raise wages considerably and then try to pass the higher costs on to their consumers. … Prompting Higher US Bond Yields … Despite the surge in core inflation to a 30-plus year high, US bond yields have remained low. The long end of the US yield curve has continued to be suppressed even as the market participants raised their rate hike expectations. Not only has the expected terminal Fed funds target rate not risen much, but also the bond term premium has remained negative. The bond term premium is akin to the equity risk premium. Pronounced uncertainty about the US inflation outlook as well as elevated bond volatility warrant a higher bond term premium (Chart 4). … Which Will Push The US Dollar Higher… Rising US interest rate expectations will lead to a stronger greenback. Our US Dollar Liquidity Indicator points to continued firmness in the broad trade-weighted US dollar ( the latter is shown inverted in this chart) (Chart 5). Chart 5US Dollar Liquidity And The US Dollar
US Dollar Liquidity And The US Dollar
US Dollar Liquidity And The US Dollar
Chart 4Inflation Uncertainty And High Bond Volitility Herald A Higher Term Premium
Inflation Uncertainty And High Bond Volitility Herald A Higher Term Premium
Inflation Uncertainty And High Bond Volitility Herald A Higher Term Premium
Our framework for the relationship between currencies and their interest rates is as follows: Scenario 1: When inflation is high or rising fast, the central bank is willing to hike rates and the economy can withstand higher borrowing costs, the currency will appreciate. Scenario 2: When inflation is high or rising fast and the central bank is unwilling to hike rates, the currency will depreciate. This is the case when the central bank falls behind the curve. Scenario 3: When the central bank is tightening but the economy cannot handle higher borrowing costs, the currency will depreciate. The US economy is presently able to handle higher interest rates. Hence, the US dollar is currently driven by the dynamics described in Scenario 1, i.e., rising interest rates will support the greenback. Chart 6US Household Finances Are Healthy
US Household Finances Are Healthy
US Household Finances Are Healthy
Our rationale is that US interest rate sensitive sectors like housing and car sales have been restrained by supply shortages – not weak demand. In fact, there is large pent-up demand for both housing and autos and a reasonable rise in borrowing costs will not thwart this demand. Besides, US household debt and debt servicing costs have declined substantially in the past 10 years (Chart 6). US households are no longer highly indebted. This development – along with robust wage gains – will allow households to borrow more and service their debt. Finally, unlike in many other Anglo-Saxon countries, in the US it is long-term rates – rather than short ones – that matter for household debt servicing. Mortgages make up 70% of household debt in the US and the mortgage rate is tied to the 30-year bond yield. In many other advanced and emerging economies, mortgage rates are more influenced by the central bank policy rate than long-term bond yields. As a result, the US economy will be able to endure monetary tightening by the Fed better than other developed and emerging economies can handle rate hikes from their central banks. Specifically, mainstream EM economies (EM ex-China, Korea and Taiwan) will slow markedly as and if their central banks hike rates further (Chart 7). There is, however, a caveat: Even though Main Street America will be able to withstand a reasonable amount of rate hikes, Wall Street might not be able ride out these rate hikes. The difference is the starting point – US equity valuations are very high. … And Will Herald A US Equity Correction And Sector Rotation The spike in US core inflation is likely to engender a negative correlation between US share prices and bond yields, as was the case in 1966. We first made this argument in last year’s Special Report titled A Paradigm Shift In The Stock-Bond Relationship (Chart 8). Chart 7Mainstream EM: Monetary Tightening Will Dampen Growth
Mainstream EM: Monetary Tightening Will Dampen Growth
Mainstream EM: Monetary Tightening Will Dampen Growth
Chart 8S&P500 And Bond Yields Correlation Will Turn Negative
S&P500 And Bond Yields Correlation Will Turn Negative
S&P500 And Bond Yields Correlation Will Turn Negative
The current episode in the US is akin to the second half of the 1960s when US core inflation and bond yields rose after decades of lingering at very low levels. Starting in 1966, US share prices became negatively correlated with US Treasury yields (Chart 9 – bond yields are shown inverted). Going forward, the S&P 500 will often take its cue from US bond yields: stocks will rally when bond yields decline, and tumble when bond yields rise. Given that we expect US Treasury yields to rise in the coming months (10-year yields will move well above 2%), the S&P 500 is likely to correct. The key risk to this view is the massive amount of cash on the sidelines, and widespread investor willingness to buy any dip in US equities. The absolute level of US retail money market funds currently stands at a formidable $1 trillion (Chart 10, top panel). However, this just represents a mere 2% of the US equity market cap (Chart 10, bottom panel). Hence, if institutional investors begin selling stocks, retail investors might not be able to support the market. Chart 9Early 2020s = Late 1960s?
Early 2020s = Late 1960s?
Early 2020s = Late 1960s?
Chart 10Cash on Sidelines: A Lot Or Not So Much?
Cash on Sidelines: A Lot Or Not So Much?
Cash on Sidelines: A Lot Or Not So Much?
Chart 11EM Relative Equity Performance Is Correlated With The USD, Not Bond Yields
EM Relative Equity Performance Is Correlated With The USD, Not Bond Yields
EM Relative Equity Performance Is Correlated With The USD, Not Bond Yields
Furthermore, rising US bond yields will cause US value stocks to outperform US growth stocks. Will EM stocks outperform US or DM ones as US bond yields rise? The top panel of Chart 11 illustrates that there has been no stable correlation between US bond yields and EM versus DM relative equity performance. Yet, there is a strong relationship between EM relative equity performance and the US dollar (Chart 11, bottom panel). If the broad trade-weighted US dollar rallies, EM stocks will underperform their DM counterparts (the greenback is shown inverted in the bottom panel of Chart 11). A sell-off in US stocks and bonds and the greenback’s rally will tighten US financial conditions considerably. The Fed is putting a lot of weight on financial conditions, especially when they are becoming restrictive. As US financial conditions tighten, the Fed will likely pivot, i.e., soften its hawkish stance. The Fed would likely argue that tight financial conditions will slow growth, which will in turn bring down inflation. Such a Fed pivot will potentially mark the end of a US dollar rally, enable American share prices to rise again, and EM stocks to start outperforming. However, we are not there yet. Bottom Line: For the time being, US core inflation will not drop anywhere close to the Fed’s target range. Hence, the Fed will continue tightening until something breaks. It will take a meaningful drop in the S&P500 (~20%) to make the Fed stop tightening. Commodity Prices Commodity prices have been caught between two opposing forces: US inflation and China’s slowdown. Worries about US inflation have made investors buy inflation hedges, and commodities are traditionally viewed as an inflation hedge. Yet, there is a caveat: Inflation is proliferating in the US but not in China. On the contrary, Chinese imports of key commodities contracted dramatically in H2 2021 (Chart 12). We are surprised that commodity prices have been so resilient despite shrinking Chinese commodity imports. Our sense is that commodity prices have been held up by two forces: strong global manufacturing activity and financial demand from investors. As for the green revolution, we believe it will be a major bullish force for select commodities in a couple of years. At the moment, however, it is not large enough to offset the slowdown in the Chinese economy. It might take investor concerns about US demand and/or a slowdown in global manufacturing to trigger a relapse in commodity prices. Rising US interest rates and a continued dollar rally will eventually result in a meaningful drawdown in commodity prices. Chart 13 demonstrates that the declines in the Swedish manufacturing PMI new orders-to-inventory ratio and the Swedish krona/Swiss franc cross rate point to downside risks in raw materials prices. Chart 12Chinese Imports Of Key Commodities Have Shrunk
Chinese Imports Of Key Commodities Have Shrunk
Chinese Imports Of Key Commodities Have Shrunk
Chart 13A Red Flag For Commodities From Industrial Sweden
A Red Flag For Commodities From Industrial Sweden
A Red Flag For Commodities From Industrial Sweden
Bottom Line: Commodity prices have so far ignored China’s slowdown. However, the Fed’s tightening and the US dollar’s persistent strength amid the lack of recovery in the Chinese business cycle will eventually produce a drawdown in resource prices in the coming months. Investment Strategy For EM Chart 14EM Equities: No Profit Growth, No Bull Market
EM Equities: No Profit Growth, No Bull Market
EM Equities: No Profit Growth, No Bull Market
EM share prices have been falling in absolute terms despite the strength in the S&P 500. The EM equity index will drop further due to the dismal EM profit outlook and the continued de-rating of Chinese TMT stocks. In absolute terms, the EM equity index is at the same level as it was in 2011 because EM EPS in USD has not expanded at all since 2011 (Chart 14). Investors are reluctant to pay high multiples for EM companies because they have produced zero earnings growth over the past 10 years. Besides, higher US bond yields and continued strength in the US dollar will lead to higher EM sovereign and corporate bond yields. EM non-TMT share prices typically wobble when EM US dollar borrowing costs rise (Chart 15). Chart 15Rising EM USD Borrowing Costs Are Bearish For EM Non-TMT Stocks
Rising EM USD Borrowing Costs Are Bearish For EM Non-TMT Stocks
Rising EM USD Borrowing Costs Are Bearish For EM Non-TMT Stocks
We continue to recommend underweighting EM in a global equity portfolio. EM always underperforms DM when the greenback rallies. We maintain our short positions in a basket of EM currencies versus the US dollar. Rising US bond yields and a firm greenback will continue weighing on EM fixed income markets – both local currency and US dollar ones. Fixed-income investors should favor US corporate credit over EM corporate and sovereign credit, quality adjusted. In local rates, we are betting on yield curve inversion in Russia and Mexico, receiving rates in China and Malaysia and paying rates in the Czech Republic. For the full list of our fixed-income, currency and equity recommendations, please refer to the tables below. These are also available on our website. Arthur Budaghyan Chief Emerging Markets Strategist arthurb@bcaresearch.com Equities Recommendations Currencies, Credit And Fixed-Income Recommendations
Highlights Demand in the major economies remains well below its pre-pandemic trend. Meaning that relative to potential output, demand is lukewarm, at best. Inflation is hot, not because of strong overall demand, but because of the surging demand for goods. If the spending on goods cools, then inflation will also cool. We expect this ‘good’ resolution of inflation to unfold, because there are only so many goods that any person can buy. Underweight personal goods versus consumer services. Bond yields have the scope to rise by just 50-100 bps before pulling the bottom out of the $300 trillion global real estate market and the $100 trillion global equity market. Long-term investors should continue to own US T-bonds and focus their equity investments in long-duration (growth) stocks, sectors, and stock markets… …because the ultimate low in bond yields is yet to come. Feature Chart of the WeekWill Bond Yields Stay Chilled With Inflation So Hot?
Will Bond Yields Stay Chilled With Inflation So Hot?
Will Bond Yields Stay Chilled With Inflation So Hot?
2022 begins with an investment conundrum. Why have long bond yields been so chilled when inflation is running so hot? (Chart I-1) While US and UK inflation have ripped to 6.9 percent and 5.1 percent respectively, the 30-year T-bond yield and 30-year gilt yield remain a relative oasis of calm – standing at 2.1 percent and 1.2 percent respectively. 10-year yields have also stayed relatively calm. Moreover, as long-duration bonds set the valuations of long-duration stocks, a calm bond market has meant a calm stock market. What can explain this apparent conundrum of chilled yields in the face of the hottest inflation in a generation? Long Bond Yields Are Tracking Demand, Not Inflation Chart I-2 answers the conundrum. The long bond yield is taking its cue not from hot inflation, but from economic demand, which is far from overheating. Quite the contrary, US real GDP and consumption are struggling to reach their pre-pandemic trends. Meanwhile, UK real GDP languishes 5 percent below its pre-pandemic trend (Chart I-3), and other major economies tell similar stories. Chart I-2Long Bond Yields Are Tracking Demand
Long Bond Yields Are Tracking Demand
Long Bond Yields Are Tracking Demand
Chart I-3Demand Is Lukewarm, At Best
Demand Is Lukewarm, At Best
Demand Is Lukewarm, At Best
Some people mistake the strong economic growth in recent quarters for overheating demand. In fact, this robust growth is just the natural snap-back after the pandemic induced collapse in early-2020. Meaning that the strong growth is unsustainable, just as the bounce that a ball experiences after a big drop is unsustainable. Demand in the major economies remains well below its pre-pandemic trend. To repeat, demand in the major economies remains well below its pre-pandemic trend. As this pre-pandemic trend is a good gauge of potential output, economic demand is lukewarm, at best. And this explains why long bond yields have remained chilled. Inflation Is Tracking The Displacement Of Demand Yet solving the first conundrum simply raises a second conundrum. If overall demand is lukewarm, then why is inflation so hot? (Chart I-4). The answer is that inflation is being fuelled by the displacement of demand into goods from services (Chart I-5). Chart I-4Hot Inflation Is Not Reflecting Lukewarm Overall Demand
Hot Inflation Is Not Reflecting Lukewarm Overall Demand
Hot Inflation Is Not Reflecting Lukewarm Overall Demand
Chart I-5Hot Inflation Is Reflecting The Hot Demand For Goods
Hot Inflation Is Reflecting The Hot Demand For Goods
Hot Inflation Is Reflecting The Hot Demand For Goods
If a dollar spent on goods is displaced from a dollar spent on services, then overall demand will be unchanged. However, what happens to the overall price level depends on the relative price elasticities of demand for goods and services. If the price elasticities are the same, then overall prices will also be unchanged, because a higher price for goods will be exactly countered by a lower price for services. But if the price elasticities are very different, then overall prices can rise sharply because the higher price for goods will dominate overall inflation. All of which solves our second conundrum. Spending on services that require close contact with strangers – using public transport, going to the dentist, cinema, or recreational activities that involve crowds – are suffering severe shortfalls compared to pre-pandemic times. Some people say that this is due to supply shortages, yet the trains and buses are running empty and there is no shortage of dentists, cinema seats, or even (English) Premier League tickets. Indeed, the Premier League team that I support (which I will not name) has been sending me begging emails to attend matches! Surging inflation is no longer a reliable reflection of overall demand. If somebody doesn’t use public transport, or go to the cinema or crowded events because he is worried about the health risk, then lowering the price will not lure that person back. In fact, the person might interpret the lower price as a signal of greater risk, and might become more averse. In other words, the price elasticity of demand for certain services has flipped from its usual negative to zero, or even positive. This creates a major problem for central banks, because if the price elasticity of services demand has changed, then surging inflation is no longer a reliable reflection of overall demand, which remains below its potential. Instead, surging inflation is largely reflecting the surging demand for goods. Two Ways That Inflation Can Resolve: One Good, One Bad It follows that if the spending on goods cools, then inflation will also cool. We expect this ‘good’ resolution of inflation to unfold, because there are only so many goods that any person can buy. Durables, by their very definition, last a long time. Even clothes and shoes, though classified as nondurables, are in fact quite durable. Meaning that are only so many cars, iPhone 13s, gadgets, clothes and shoes that any person can own before reaching saturation. We recommend that equity investors play this inevitable normalisation by underweighting personal goods versus consumer services. Still, the resolution of inflation could also take a ‘bad’ form. If inflation persisted, then bond yields could lose their chill as they flipped their focus from lukewarm demand to hot inflation. Given that long-duration bonds set the valuations of long-duration stocks, and given that stock valuations are already stretched versus bonds, this would quickly inflict pain on stock investors (Chart I-6). Chart I-6The US Stock Market = The 30-Year T-Bond Price Multiplied By Profits
The US Stock Market = The 30-Year T-Bond Price Multiplied By Profits
The US Stock Market = The 30-Year T-Bond Price Multiplied By Profits
More significantly, it would also quickly inflict pain on the all-important real estate market. Through the past ten years, world prime residential prices are up by 70 percent while rents are up by just 25 percent1 (Chart I-7). Meaning that the bulk of the increase in global real estate prices is due to skyrocketing valuations. The culprit is the structural collapse in global bond yields (Chart I-8). Chart I-7The Bulk Of The Increase In Global Real Estate Prices Is Due To Valuation Expansion…
The Bulk Of The Increase In Global Real Estate Prices Is Due To Valuation Expansion...
The Bulk Of The Increase In Global Real Estate Prices Is Due To Valuation Expansion...
Chart I-8…And The Culprit For The Richest Ever Valuation Of Global Real Estate Is The Structural Collapse In Global Bond Yields
...And The Culprit For The Richest Ever Valuation Of Global Real Estate Is The Structural Collapse In Global Bond Yields
...And The Culprit For The Richest Ever Valuation Of Global Real Estate Is The Structural Collapse In Global Bond Yields
This means that bond yields have the scope to rise by just 50-100 bps before pulling the bottom out of the $300 trillion global real estate market. Given that this dwarfs the $90 trillion global economy, the massive deflationary backlash would annihilate any lingering inflation. Some people counter that in an inflationary shock, stocks and property – as the ultimate real assets – ought to perform well even as bond yields rise. However, when valuations start off stretched as now, the initial intense headwind from deflating valuations would obliterate the tailwind from inflating incomes. The scope for higher bond yields is limited by the fragility of stock market and real estate valuations. With the scope for higher yields limited by the fragility of stock market and real estate valuations, and with the ultimate low in yields yet to come, long-term investors should continue to own US T-bonds. And they should focus their equity investments in long-duration (growth) stocks, sectors, and stock markets. Fractal Trading Update Owing to the holidays, we are waiting until next week to initiate new trades. We will also add a new feature – a ‘watch list’ of investments that are approaching potential turning points, but are not yet at peak fragility. We believe that this enhancement will help to prepare future trades. Stay tuned. Dhaval Joshi Chief Strategist dhaval@bcaresearch.com Footnotes 1 Based on Savills Prime Index: World Cities – Capital Values, and World Cities – Rents and Yields, June 2011 through June 2021. Fractal Trading System Fractal Trades
Image
6-Month Recommendations Structural Recommendations Closed Fractal Trades Indicators To Watch - Bond Yields Chart II-1Indicators To Watch - Bond Yields - ##br##Euro Area
Indicators To Watch - Bond Yields - Euro Area
Indicators To Watch - Bond Yields - Euro Area
Chart II-2Indicators To Watch - Bond Yields - Europe Ex Euro Area
Indicators To Watch - Bond Yields - Europe Ex Euro Area
Indicators To Watch - Bond Yields - Europe Ex Euro Area
Chart II-3Indicators To Watch - Bond Yields - ##br##Asia
Indicators To Watch - Bond Yields - Asia
Indicators To Watch - Bond Yields - Asia
Chart II-4Indicators To Watch - Bond Yields - Other Developed
Indicators To Watch - Bond Yields - Other Developed
Indicators To Watch - Bond Yields - Other Developed
Indicators To Watch - Interest Rate Expectations Chart II-5Indicators To Watch - Interest Rate Expectations
Indicators To Watch - Interest Rate Expectations
Indicators To Watch - Interest Rate Expectations
Chart II-6Indicators To Watch - Interest Rate Expectations
Indicators To Watch - Interest Rate Expectations
Indicators To Watch - Interest Rate Expectations
Chart II-7Indicators To Watch - Interest Rate Expectations
Indicators To Watch - Interest Rate Expectations
Indicators To Watch - Interest Rate Expectations
Chart II-8Indicators To Watch - Interest Rate Expectations
Indicators To Watch - Interest Rate Expectations
Indicators To Watch - Interest Rate Expectations
Highlights The bull run in Vietnamese stocks is due for a pause as the weakness in overall EM markets spreads to this bourse. Household consumption will stay constrained as new COVID-19 cases remain high and fiscal and monetary stimulus remain absent. Social distancing measures and related supply disruptions have hobbled labor-intensive manufacturing and exports thereof. Vietnam is facing saturation or stagnation in two of its major exports: electronics and phones. The country needs to find a new high value-added export sector to which to transition to maintain large trade surpluses. Vietnam’s longer-term structural outlook remains bright. The country is set to gain further global export market share due to strong productivity gains and competitive unit labor costs. Absolute-return investors should book profits on their Vietnamese holdings for now and wait for a better entry point. Asset allocators, however, should continue to overweight this bourse in overall EM, emerging Asia or frontier market equity portfolios. Feature Vietnamese stocks have surged to new highs in absolute terms and have outperformed their frontier and emerging market peers since spring 2020 (Chart 1). Can the bull run continue into the new year? We advise caution. Vietnamese stocks may be in for a period of weakness in absolute terms. The reason is a negative outlook on EM markets: a drop in EM stock prices is typically followed by one in Vietnamese stock prices (Chart 2). Chart 2Weakness In EM Markets Typically Spreads To Vietnamese Stocks Too
Weakness In EM Markets Typically Spreads To Vietnamese Stocks Too
Weakness In EM Markets Typically Spreads To Vietnamese Stocks Too
Chart 1The Bull Run In Vietnamese Stocks May Be Due For A Pause
The Bull Run In Vietnamese Stocks May Be Due For A Pause
The Bull Run In Vietnamese Stocks May Be Due For A Pause
In addition, Vietnam’s exports, the mainstay of this market, are likely to face some headwinds in the months ahead. Absolute-return investors therefore would do well to book profits now and wait for a better entry point to this bourse later in the year. That said, the longer-term outlook of this economy remains bright, and that will help boost this market beyond any near-term jitters. Robust fundamentals should also ensure continued outperformance relative to overall EM stocks. We recommend that investors stay overweight Vietnam in EM and emerging Asian equity portfolios. Battered Consumption The surge in daily new cases since August last year forced Vietnam to implement stringent lockdowns and social distancing measures. A consequence of these measures was a free fall in Vietnam’s household consumption. Both retail sales and car sales plummeted to levels not seen since 2016 before recovering recently (Chart 3). This caused the economy to shrink by over 6% in real terms in the third quarter last year – the first-ever contraction in decades. Now, with the new, highly infectious Omicron variant spreading fast, the number of daily new cases and deaths remains stubbornly high – despite many of the lockdown measures still in place (Chart 4). It is therefore far from clear when normal economic activity will resume. Incidentally, 57% of Vietnamese people have been fully vaccinated so far. Chart 4Rising Omicron Cases May Hobble Economic Activity Again
Rising Omicron Cases May Hobble Economic Activity Again
Rising Omicron Cases May Hobble Economic Activity Again
Chart 3The Surge In The Delta Variant Last Year Severely Hurt Vietnamese Household Consumption
The Surge In The Delta Variant Last Year Severely Hurt Vietnamese Household Consumption
The Surge In The Delta Variant Last Year Severely Hurt Vietnamese Household Consumption
Notably, despite the weak economy, there has not been any meaningful policy stimulus in recent months. Fiscal policy has remained very tight. Government spending, excluding interest and principal payments, has contracted by 4.5%. The 2022 budget proposals envisage only a 2% rise in total nominal fiscal expenditure. The central bank, for its part, has also not announced any new easing measures in the recent past. Lacking fiscal and monetary support, domestic consumption and therefore overall growth will remain somewhat constrained going forward. Supply Disruptions While domestic consumption is a concern, a more investor-relevant issue in Vietnam is the pandemic’s negative impact on the country’s manufacturing/export sector. This is because, unlike household consumption, manufacturing activity and manufacturing exports have a strong bearing on the country’s stock prices. The reason is that developing market stocks in general are driven by global trade cycles. And since Vietnam’s total trade amounts to almost twice as much as the country’s GDP, the ebbs and flows in the former have an outsized impact on the domestic economy, and by extension, on the stock market (Chart 5). The surge in new cases since August created severe hindrances in the manufacturing/export sector supply chains and labor availability. In the clothing and textile industry, almost a third of the sector’s three million employees quit jobs, or stayed away from work with or without pay, as per Vietnam Textile & Apparel Association, an industry body.1The lack of labor coupled with bottlenecks in logistics have led to a sharp drop in Vietnam’s textile and garment exports (Chart 6, top panel). Chart 6Garment Exports Are Badly Hit, While Phone Exports Are Facing Stagnation
Garment Exports Are Badly Hit, While Phone Exports Are Facing Stagnation
Garment Exports Are Badly Hit, While Phone Exports Are Facing Stagnation
Chart 5Vietnamese Stocks Are Highly Leveraged To Export Growth
Vietnamese Stocks Are Highly Leveraged To Export Growth
Vietnamese Stocks Are Highly Leveraged To Export Growth
Due to hobbled production, manufacturing inventories have piled up (Chart 7). It is estimated that most of this large inventory is comprised of raw materials and intermediate goods. If so, that will discourage local raw material/intermediate goods production in the months to come. Chart 7The Pandemic Is Hampering Shipments While Inventories Are Piling Up
The Pandemic Is Hampering Shipments While Inventories Are Piling Up
The Pandemic Is Hampering Shipments While Inventories Are Piling Up
In sum, it’s far from clear that a rapid revival in manufacturing production and exports is in the cards amid the ongoing Omicron surge. This will remain a headwind for Vietnamese stock prices. Exports Outlook Despite the setback in the textile sector, the country’s overall exports held up quite well last year. That’s because the slack was more than made up by the booming computer and electronics exports. This is thanks to the massive demand surge in those goods in past two years due to the global work-from-home phenomenon (Chart 6, top panel). However, going forward, odds are that global demand for these items will abate as saturation sets in. This will slow the growth rate in Vietnam’s computer and electronic exports. Incidentally, Vietnam’s single largest export items, phones and spare parts, are also showing signs of stagnation. In absolute dollar terms, they have been flattish since early 2018. Phone production volumes have remained at the same level as in 2015 (Chart 6, bottom panel). With mobile phone penetration in all major economies is already quite high, phone exports certainly cannot propel Vietnam’s exports as strongly as in the past decade. If this is the case, it can have a meaningful negative impact not only on Vietnam’s exports, but also on its trade balance, and by extension, its current account balance. The reason for this is that phones and spare parts have probably been the most value-added item among Vietnamese exports. The difference between the export revenues they earned and the import cost of the components has been much higher and has risen more sharply than in any other major export items (Chart 8, top and middle panels). This helped the country rack up rising trade surpluses. In the absence of net export revenues from phones and spare parts, Vietnam’s trade and current account balance would be deeply negative (Chart 8, bottom panel). Given that phones are no longer the sunrise sector worldwide, the country needs to find and move to some other high value-added sector to maintain its wide trade surplus. As of now, it’s not clear that this is happening. In the past two years, the number of newly approved manufacturing FDI projects have fallen to decade-low levels. The dollar value of approved manufacturing FDI projects has also fallen in tandem (Chart 9, top panel). In fact, overall FDI approvals have also fallen – suggesting actual FDI inflows might weaken in the months ahead (Chart 9, bottom panel). Chart 8Net Phone Exports Had Been Crucial To Vietnam's Large Trade Surpluses
Net Phone Exports Had Been Crucial To Vietnam's Large Trade Surpluses
Net Phone Exports Had Been Crucial To Vietnam's Large Trade Surpluses
Chart 9FDI Inflows Into Vietnam Might Recede In The Coming Months
FDI Inflows Into Vietnam Might Recede In The Coming Months
FDI Inflows Into Vietnam Might Recede In The Coming Months
Until Vietnam finds a new high value-added export sector to which to transition, its stagnating phone and electronics exports mean that overall export growth is set to take a breather. Finally, one external tailwind for Vietnam since 2018 has been the trade war between the US and China. Because the two largest economies put various tariff and non-tariff barriers on each other, it allowed Vietnam to double its share of imports to the US in just three years (Chart 10). Vietnamese exports also clearly benefit when the dong weakens vis-à-vis the Chinese yuan. The fact that the Chinese authorities have allowed the yuan to be one of the strongest currencies over the past year has helped Vietnamese exports. In the future, however, decelerating growth in China may prompt the PBOC to seek a weaker yuan. If so, that could be another headwind to Vietnamese exports (Chart 11). Chart 11The Tailwind From A Weak Dong Versus The Chinese Yuan May Diminish This Year, Hurting Exports
The Tailwind From A Weak Dong Versus The Chinese Yuan May Diminish This Year, Hurting Exports
The Tailwind From A Weak Dong Versus The Chinese Yuan May Diminish This Year, Hurting Exports
Chart 10Vietnamese Exports Benefitted Immensely From The US-China Trade War
Vietnamese Exports Benefitted Immensely From The US-China Trade War
Vietnamese Exports Benefitted Immensely From The US-China Trade War
In sum, Vietnamese exports could well see a period of weakness in the coming months. That is usually a harbinger of weaker Vietnamese stock prices in absolute terms (Chart 5, above). Structurally Sound Despite our near-term cautious outlook on Vietnamese stocks, we have a positive view on the country’s structural prospects. The country’s fundamentals remain robust and that will help propel this market beyond any near-term weakness: Vietnam has boosted capital spending in the past few years to reach an impressive 32% of GDP, among the highest in the developing world (Chart 12, top panel). This has helped raise the economy’s productive capacity. Consistently, Vietnam’s labor productivity gains have been superior to most developing countries (Chart 12, bottom panel). The country’s wage growth has been relatively lower than those of China and Bangladesh, its two main export competitors (Chart 13, top panel). Chart 12Vietnam's Capital Spending And Labor Productivity Remains Among The Highest In EM
Vietnam's Capital Spending And Labor Productivity Remains Among The Highest In EM
Vietnam's Capital Spending And Labor Productivity Remains Among The Highest In EM
Chart 13Competitive Unit Labor Costs Are Helping Vietnam Rapidly Grab Global Market Share
Competitive Unit Labor Costs Are Helping Vietnam Rapidly Grab Global Market Share
Competitive Unit Labor Costs Are Helping Vietnam Rapidly Grab Global Market Share
Stronger productivity gains coupled with relatively muted wage growth is helping keep Vietnamese unit labor costs lower than its competitors. This is boosting its competitiveness; and not only helping grab an ever higher global market share, but also doing so at a faster clip than even China and Bangladesh (Chart 13, bottom panel). The country is also well placed to take advantage of its competitive unit labor costs. It has entered into a number of free trade agreements (FTA) with many countries and regions, the latest of which is the RCEP agreement – comprising ASEAN, China, Japan, South Korea, Australia, and New Zealand – which kicked in this January. These FTAs have eliminated export import tariffs for hundreds of items. Vietnam is likely to be a major beneficiary of these treaties in the medium to long term, given its rising competitiveness. Given the already available infrastructure and labor and its competitive edge in manufacturing, Vietnam is also set to be the major recipient of the firms relocating away from China. This will further boost its longer-term prospects as exports will continue to generate solid income growth. Overall, real income per capita in Vietnam will continue rising at a rapid rate, outpacing that of most emerging economies. Investment Conclusions Chart 14Vietnamese Stock Valuations Are Not Attractive Now
Vietnamese Stock Valuations Are Not attractive Now
Vietnamese Stock Valuations Are Not attractive Now
Since the country’s exports will likely decelerate in the coming months, its share prices will also likely correct. In addition, the ongoing sell-off in EM risk assets has further to run, as explained in our last report, EM: A Perfect Storm. This is a harbinger of weaker Vietnamese stock prices. What’s more, a sell-off in EM risk assets is often associated with a considerable decline in capital inflows into Vietnam – as was the case in 2015 and 2018. Those periods were negative for Vietnamese stocks as well. Finally, valuations are not attractive either. Trailing P/E and P/Book ratios of Vietnamese stocks are much higher (21 and 3.6, respectively) compared to those of EM (14 and 1.9) and frontier market (15.5 and 2.3) stocks (Chart 14). Putting it all together, absolute-return investors should book profits on their Vietnam holdings and wait for a better entry point. Asset allocators, however, should continue to maintain their overweight positions on Vietnamese stocks, in EM, emerging Asia or frontier market equity portfolios. Rajeeb Pramanik Senior EM Strategist rajeeb.pramanik@bcaresearch.com Footnotes 1 Please refer to “Vietnam garment exports hit hard by labor shortage, disrupted supply chains, and swelled freight fares” on Textile Today Bangladesh.
Highlights December’s PMI and our market-based China growth indicator improved slightly, but the underlying data send a mixed signal about the country’s business cycle and do not give a green light for cyclically overweighting Chinese stocks. Our research suggests that the odds of an earnings contraction for Chinese investable stocks over the coming year are high. In previous cycles, stocks only bottomed when the earnings adjustment process was well underway. In the next one to three months, investors may bid up Chinese stocks for their relatively cheap valuations and in expectation of further policy easing. A tactical rebound in Chinese stocks (in both the domestic and investable markets) in absolute terms is likely. However, we think it is premature to switch to an outright overweight stance on Chinese versus global stocks over the coming 6-12 months. Feature Chart 1Chinese Stocks Underperformed Global Markets In 2021
Chinese Stocks Underperformed Global Markets In 2021
Chinese Stocks Underperformed Global Markets In 2021
Chinese stocks underperformed global equities last year. In particular, Chinese investable stocks were among the worst performing major equity indices last year, ending 2021 with a 23% loss (Chart 1). Lately China’s macro policies have begun to refocus on supporting the economy, and investors have been asking whether cheaper valuations in Chinese equities warrant an overweight stance versus global stocks. We think a tactical rally in Chinese stocks is likely, as investors may bid up the market in expectation of more stimulus. The Chinese offshore market remains deeply oversold in relative terms, and further easing in policy in the coming few weeks may significantly improve global investor sentiment towards the country’s bourse. However, we maintain our view that a legitimate improvement in domestic fundamentals is needed before we recommend investors to upgrade their cyclical equity allocation to China. Mixed Signals Over the past several weeks, we focused heavily on China’s cyclical economic conditions, and whether any “green shoots” are evident from the key indicators that we track. The official PMIs and our high-frequency, market-based growth indicator both improved slightly in December, but their underlying components point to continued weakness in the old economy sectors. Hence, for now, we regard the marginal improvement in these indicators as a mixed signal rather than a green light for upgrading Chinese stocks on a cyclical basis. The official PMI manufacturing index inched up to 50.3 in December from 50.1 in November. While the proxy for domestic demand – measured by the new orders component subtracting the new export orders – ticked up slightly last month, the overall new orders subindex remains below the 50 threshold (Chart 2). In addition, both new orders and business activity in the construction PMI subindex fell sharply in December, due to sluggish infrastructure activity as well as a significant drag from the housing sector (Chart 3). Chart 2Manufacturing New Orders Remain In Contraction
Manufacturing New Orders Remain In Contraction
Manufacturing New Orders Remain In Contraction
Chart 3Construction PMI Fell Sharply In December
Construction PMI Fell Sharply In December
Construction PMI Fell Sharply In December
Chart 4Largely Driven By Commodity-Related Components
Largely Driven By Commodity-Related Components
Largely Driven By Commodity-Related Components
Our market-based China growth indicator also rose slightly in December, although it remains in contraction. Chart 4 presents this growth indicator, its four asset class subcomponents, and the range between the strongest and weakest components. The chart shows that the recent rise in the indicator is not uniform. While most of the individual components have improved over the past month, a rise in metal prices and commodity-related equity and currency prices have accounted for most of the gains. As highlighted in China’s November and December PMIs, we think the improvement in the commodity component of the growth indicator reflects an easing in production-side constraints, rather than a sustained rebound in demand. Bottom Line: Data released recently point to a mixed picture regarding China’s economic fundamentals. It is premature to conclude that the current policy easing measures will suffice in reviving China’s slowing economy. The Negative Factors Impacting Cyclical Outlook There are two negative factors impacting our outlook for Chinese stocks. One is the effect of a slowing domestic economy on earnings; our model suggests that the odds of an earnings contraction over the coming year are high. The other negative factor is the ongoing regulatory and secular geopolitical risks on Chinese offshore-market stocks. Chart 5 presents the odds of a serious earnings contraction over the coming 12 months (defined as earnings growth falling below -5%). The chart shows that the model successfully warned of the three major earnings contractions over the past decade. Crucially, the odds of a major contraction did not rise above the 50% mark in 2012, when investable earnings growth decelerated significantly and fell briefly into negative territory. The current message from the model is clear: the odds of a significant earnings contraction over the coming 12 months are as high as 70%, implying that the deceleration in 12-month trailing earnings growth shown in the bottom panel of Chart 5 is likely to continue. In addition to the elevated risks of an earnings contraction, regulatory and geopolitical risks remain a major challenge for Chinese companies listed in the offshore equity markets (Chart 6). Big tech names like Alibaba, Tencent, and Meituan still face regulatory pressures from authorities. Last week, Beijing further tightened scrutiny of overseas equity sales by unveiling regulations that bar Chinese companies in sensitive industries from receiving foreign investment. Chart 5Our Model Implies High Odds Of An Earnings Contraction
Our Model Implies High Odds Of An Earnings Contraction
Our Model Implies High Odds Of An Earnings Contraction
Chart 6Chinese Investable Stocks Continue Facing Regulatory And Geopolitical Risks
Chinese Investable Stocks Continue Facing Regulatory And Geopolitical Risks
Chinese Investable Stocks Continue Facing Regulatory And Geopolitical Risks
Pressures from both Chinese and US regulators will continue to push Chinese firms to depart from US stock exchanges. The disputes between the US and China, which in our US Geopolitical Strategy's view are deep and structural, will likely culminate in the months leading up to the 20th National Party Congress in China and the mid-term election in the US in the fall of 2022. It is true that the delisted Chinese firms will likely migrate to Hong Kong, and in theory should offer global investors the same returns. However, we argue that as the delisted companies fail to comply with transnational disclosure standards and financial audit regulations mandated by the US Securities and Exchange Commission (SEC), global investors will demand higher risk premiums (and hence lower valuations) to own Chinese investable stocks. In the next two to three months, it is possible that investors may bid up Chinese stocks in expectation of further policy loosening. Since data on the real economic activity in the first two months of the year will not be released until March, investors will likely focus on credit, monetary, and trade data. However, we caution against moving to an overweight stance towards Chinese stocks for investors with time horizon of 6 to 12 months. While easier macro policies are certainly welcome, we remain skeptical that: a) the existing policy support is enough to revive China’s economy; and b) Chinese policymakers will provide aggressive stimulus and allow a major acceleration in credit growth for the entire year of 2022. Bottom Line: While in the near term, investors may find Chinese stocks attractive due to cheap valuations and expectations of further stimulus, Chinese stocks face challenges both from the impact of a slowing economy on earnings growth and ongoing regulatory and geopolitical risks. Investment Conclusions Chinese stocks in both the onshore and offshore markets have cheapened relative to global equities. However, in absolute terms Chinese stocks are not unduly cheap and their valuations are higher than in both 2015/16 and 2018/19 (Chart 7). In previous cycles, Chinese stock prices bottomed when the earnings adjustment process was well underway or near the end of the process. Chart 8 presents some perspective on when investors are likely to anticipate an eventual bottom in stock prices, if an earnings contraction does indeed occur. The chart shows the level of 12-month forward earnings for investable and domestic stocks, and circles at what point share prices bottomed during the previous cycles. Chart 8The Forward Earnings Adjustment Process Has Just Started
The Forward Earnings Adjustment Process Has Just Started
The Forward Earnings Adjustment Process Has Just Started
Chart 7Chinese Onshore Stocks Are Not Cheap In Absolute Terms
Chinese Onshore Stocks Are Not Cheap In Absolute Terms
Chinese Onshore Stocks Are Not Cheap In Absolute Terms
The chart shows that onshore equities bottomed roughly halfway through the earnings adjustment process, whereas the investable market bottomed almost at the end of the process. The chart also shows that this adjustment process has barely begun in the current cycle, which argues against a cyclically overweight stance towards Chinese stocks. Jing Sima China Strategist jings@bcaresearch.com Equity Sector Recommendations Cyclical Investment Stance
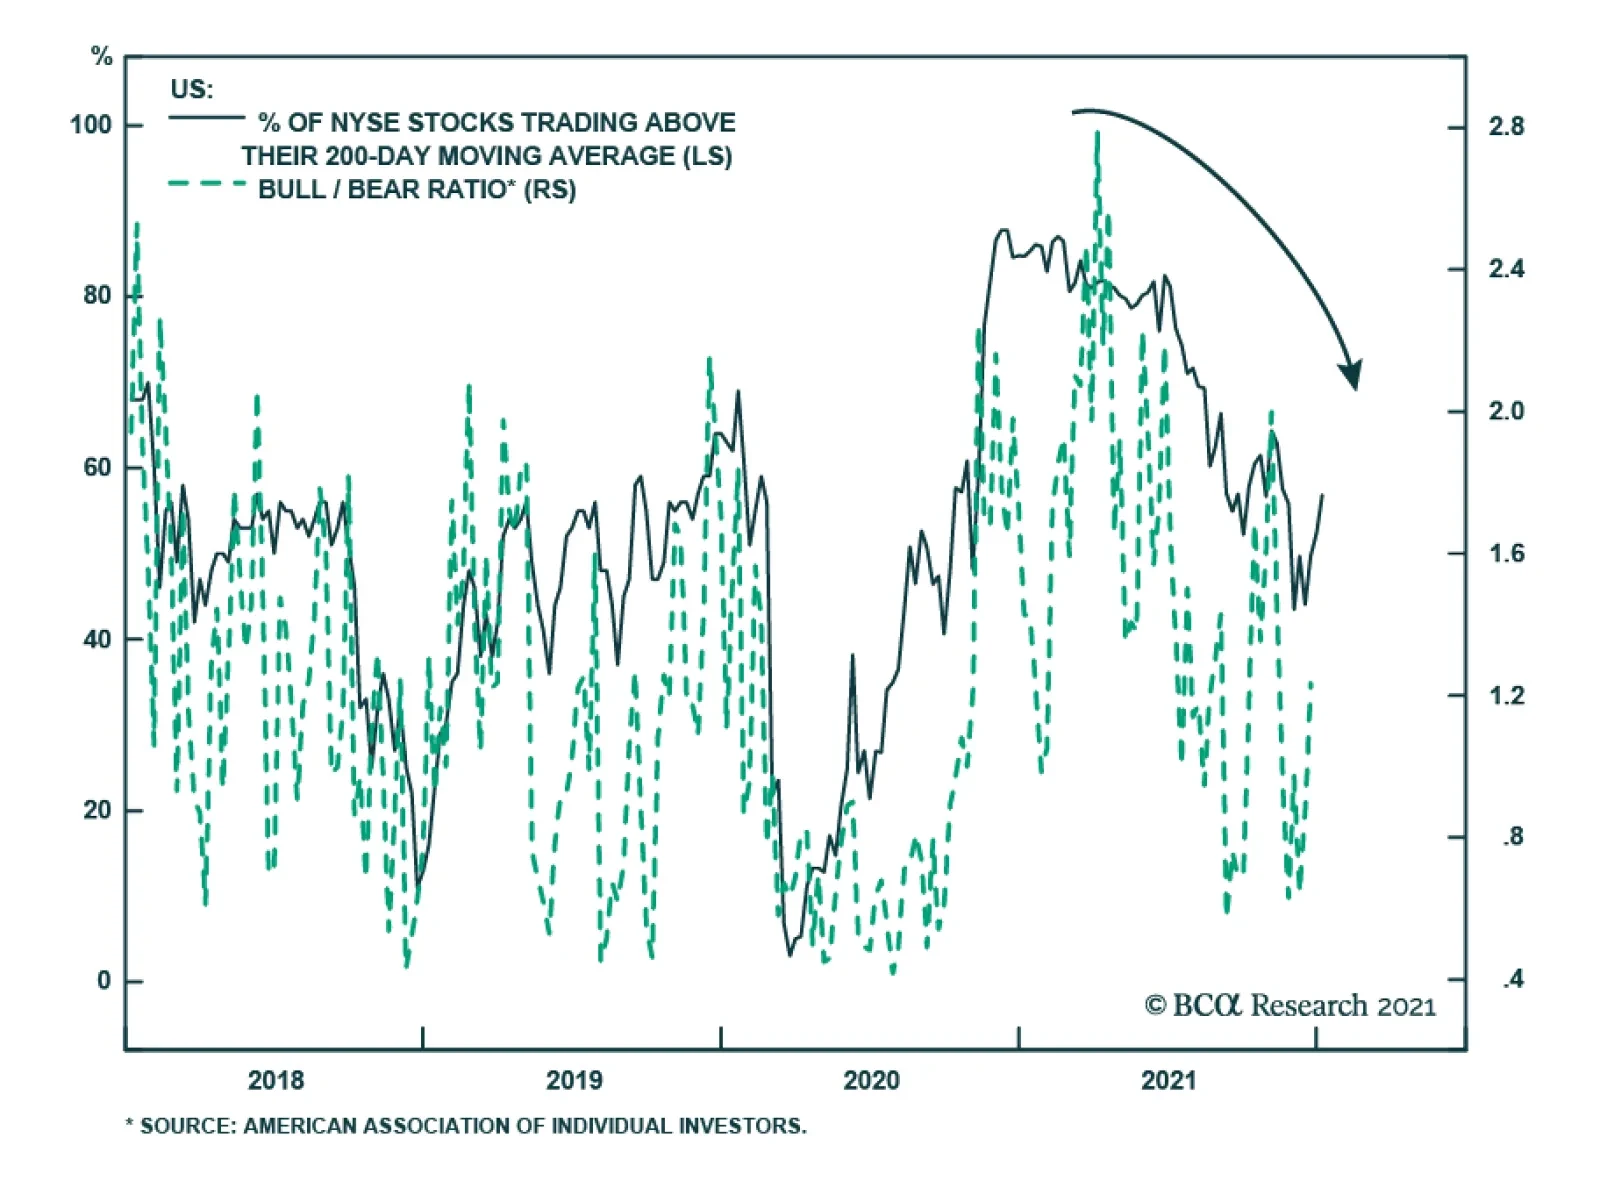
The share of US stocks trading above their 200-day moving average fell significantly over the course of 2021. They started the year at 84.68% and ended it at 52.47%. This decline indicates that equity market breadth has narrowed. Narrow breadth means that…
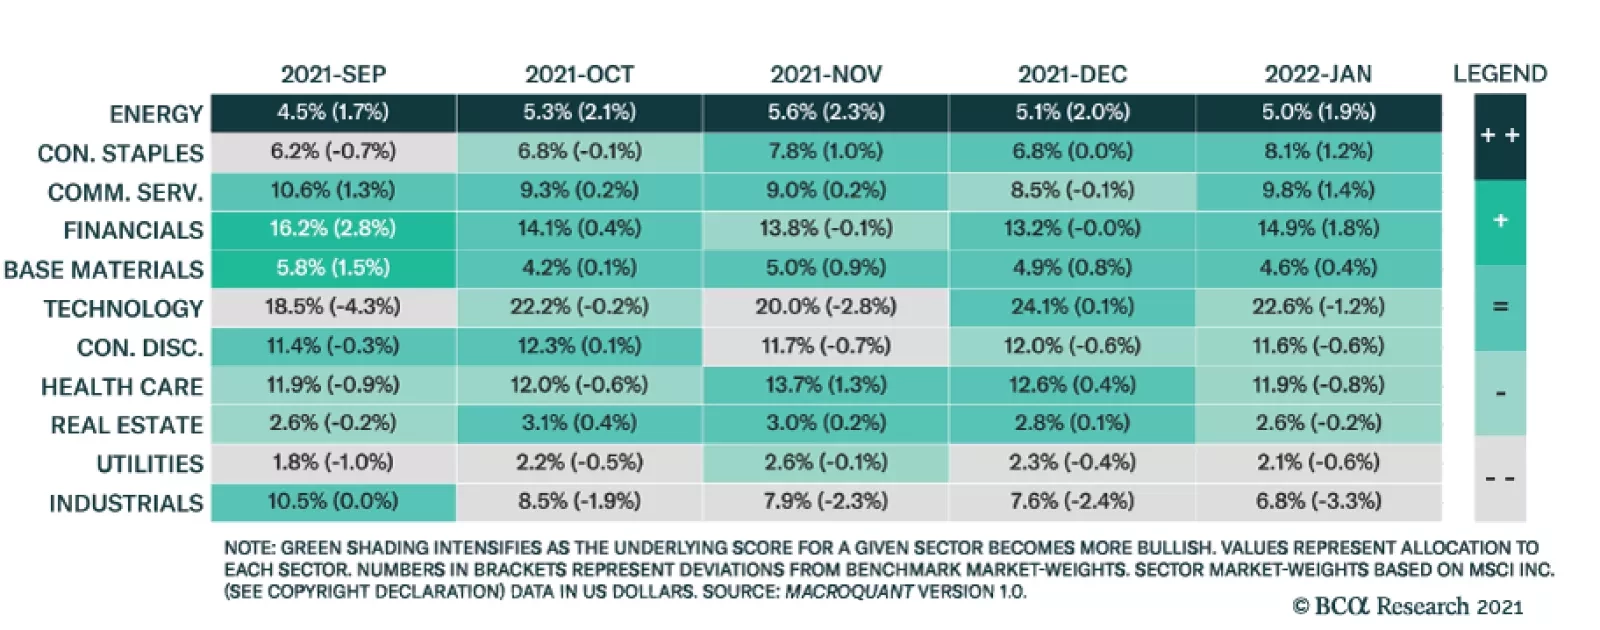
BCA Research’s Global Investment Strategy service’s MacroQuant model remains bullish on risk assets. Within the equity universe, the model is relatively neutral in its sector positioning. Model: The sector model takes into consideration sector…
Image
We have entered a new phase of the cycle, with central banks in most developed markets turning more hawkish (the Bank of England surprisingly hiking in December, and the Fed signaling three rate hikes for 2022). How much does this matter for equities and other risk assets? Our view is that, as long as economic growth continues to be strong (and we think it will), and provided that central banks don’t overdo the tightening (and, with inflation likely to come down this year, we think excess tightening is unlikely), the hawkish turn might temporarily raise volatility and cause the occasional correction, but it does not undermine the case for equities to outperform bonds over the next 12 months. We remain overweight global equities. Economic growth is likely to continue to be well above trend for the next year or two (Chart 1), driven by (1) consumers spending some of the $5 trillion of excess savings they have accumulated in the G10 economies, (2) the unprecedented wealth effect from recent stock and house price rises (Chart 2), and (3) strong capex as companies strive to increase capacity to meet the consumer demand (Chart 3). The upsurge in Covid cases in December (Chart 4) will undoubtedly slow growth temporarily. But the signs are that the now-prevalent Omicron variant is mild, and its rapid spread could help the developed world achieve “herd immunity” thanks to widespread vaccination and natural immunity, though emerging countries – especially China – may continue to struggle. Chart 1Growth Will Continue To Be Above Trend
Growth Will Continue To Be Above Trend
Growth Will Continue To Be Above Trend
Chart 2Growth Will Be Boosted By The Wealth Effect...
Growth Will Be Boosted By The Wealth Effect...
Growth Will Be Boosted By The Wealth Effect...
Chart 3...And Capex To Increase Production
...And Capex To Increase Production
...And Capex To Increase Production
With US growth very strong – the Atlanta Fed Nowcast suggests Q4 QoQ annualized real GDP growth was 7.6% – and core PCE inflation 4.1%, it is hardly surprising that the Fed wants to accelerate the rate at which it withdraws accommodation. The FOMC dots, which see three rate hikes this year and another three in 2023, are unexceptional and close to what the futures market has already been (and still is) pricing in (Chart 5). Chart 4Covid Cases Not Leading to Hospitalizations And Deaths
Covid Cases Not Leading to Hospitalizations And Deaths
Covid Cases Not Leading to Hospitalizations And Deaths
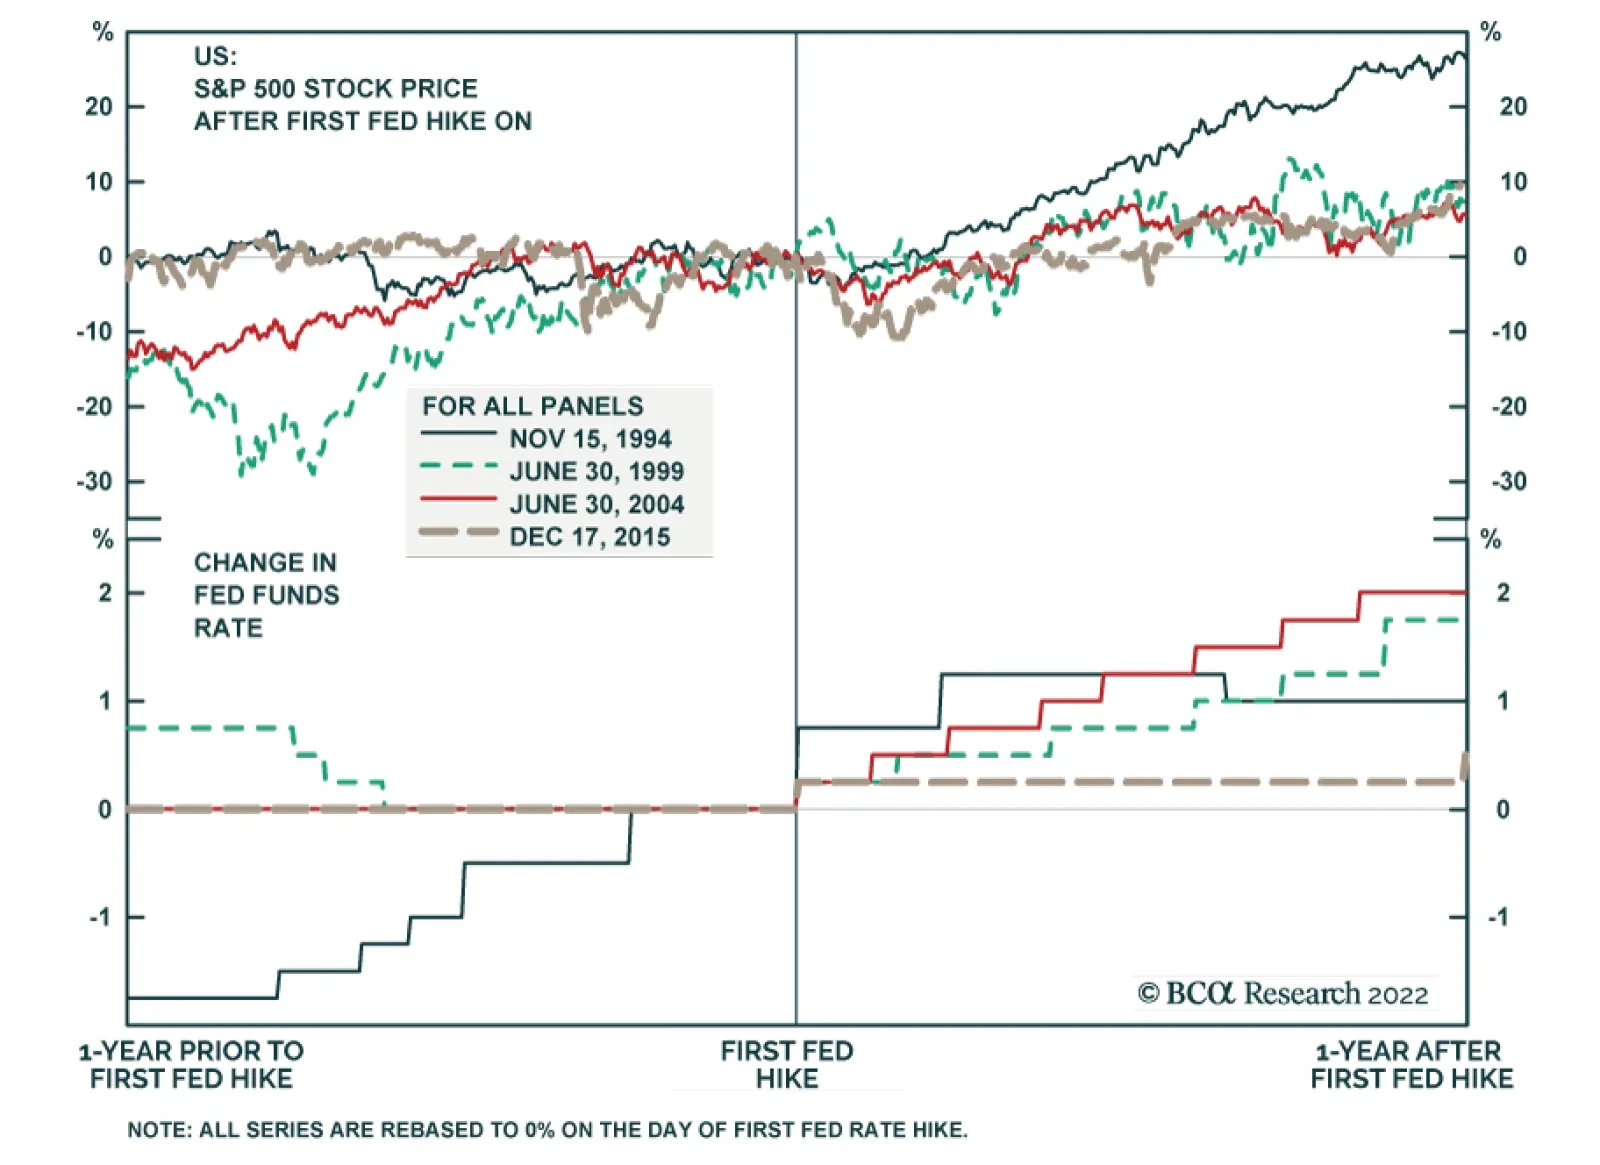
Chart 6Fed Hikes Have Usually Caused Only A Short-Lived Selloff
Fed Hikes Have Usually Caused Only A Short-Lived Selloff
Fed Hikes Have Usually Caused Only A Short-Lived Selloff
Chart 5The Futures Market Is In Line With The FOMC Dots
The Futures Market Is In Line With The FOMC Dots
The Futures Market Is In Line With The FOMC Dots
In the past, the first Fed hike in a cycle has often triggered a mild short-term sell off in stocks (the timing depending on how well the hike was flagged in advance), but the equity market digested the news rapidly, quickly resuming its upward trend as the Fed continued to tighten (Chart 6). The same was true around the tapering and end of asset purchases in 2013-17 (Chart 7). All that depends, though, on whether the Fed is rushed into further rate hikes because inflation surprises even more to the upside. Our view remains that inflation will decline this year. The high inflation prints we are seeing now are mostly the result of exceptional demand for consumer manufactured goods, which the supply side has temporarily been unable to fulfil, causing shortages. This can be seen in the very different pattern of goods and services inflation (Chart 8). As we have argued previously, the supply response is now kicking in for key inputs into manufactured goods, such as semiconductors and shipping and, with demand likely to shift to services this year as the pandemic fades, this should bring inflation down. Chart 7Tapering Didn't Much Affect Stocks Either
Tapering Didn't Much Affect Stocks Either
Tapering Didn't Much Affect Stocks Either
Chart 8Inflation Probably Will Decline This Year
Inflation Probably Will Decline This Year
Inflation Probably Will Decline This Year
That said, the year-on-year inflation number will continue to look scary for some time, even if month-on-month inflation settles back to its pre-pandemic level of 0.2% (Chart 9). The consensus average forecast of 3.3% core PCE inflation in 2022 is factoring in monthly inflation around this level. The risks to inflation remain to the upside, particularly if wages respond to higher prices (US wage growth is currently 4-6%, significantly lagging behind price inflation – Chart 10), causing companies to raise prices further, triggering a price-wage spiral. Chart 9Year-On-Year Inflation Will Remain High
Year-On-Year Inflation Will Remain High
Year-On-Year Inflation Will Remain High
Chart 10Risk Of A Price-Wage Spiral?
Risk Of A Price-Wage Spiral?
Risk Of A Price-Wage Spiral?
All this suggests a year of significant volatility and uncertainty. The US stock market has not seen a correction (a drop of more than 10%) in this cycle, and there were no drawdowns last year of more than 5% (Chart 11). This is unusual: There were six 10%-plus corrections in the 2009-2019 bull market. The US equity rally is also looking increasingly narrow, with the run-up to a record-high in December driven by just a few large-cap growth stocks (Chart 12). This – and pricey valuations – makes it vulnerable and, as a hedge to downside risks, we continue to recommend an overweight in cash (rather than government bonds, which offer very asymmetrical returns, with significant downside in the event that inflation proves to be stubborn). Chart 11Where Have All The Corrections Gone?
Where Have All The Corrections Gone?
Where Have All The Corrections Gone?
Chart 12Stock Market Has Got Very Narrow
Stock Market Has Got Very Narrow
Stock Market Has Got Very Narrow
The other policy focus remains China. The authorities’ recent cut of the banks’ reserve ratio and more dovish talk does suggest that they are now concerned about how weak growth has become (Chart 13). A slight loosening of monetary policy has probably caused credit growth to bottom (Chart 14). However, our China strategists argue that the easing is likely to be only moderate since policymakers want to continue with structural reforms, such as reducing debt. The next few months may resemble early 2019 when the PBOC engineered a brief injection of liquidity which lasted only a few months. Moreover, the slump in the property market has not run its course (Chart 15), and this will hamper the authorities’ ability to accelerate infrastructure spending, much of which is financed by local governments’ property sales. Even if Chinese credit growth and the property market do pick up a little, the economy – and indeed commodity prices – will not bottom for another 6-9 months (Chart 16). But, when this happens, it would be a signal to turn more risk-on and bullish on cyclical countries and sectors, such as Emerging Markets, Europe, and Value stocks. Chart 13Chinese Data Looks Very Poor
Chinese Data Looks Very Poor
Chinese Data Looks Very Poor
Chart 14Is Credit Growth Now Bottoming?
Is Credit Growth Now Bottoming?
Is Credit Growth Now Bottoming?
Chart 15Slump In China Property Is Not Over
Slump In China Property Is Not Over
Slump In China Property Is Not Over
Chart 16It Will Take A While For Commodity Prices To Pick Up
It Will Take A While For Commodity Prices To Pick Up
It Will Take A While For Commodity Prices To Pick Up
Equities: While we remain overweight equities, returns this year will be only modest. Returns in 2020 were driven by multiple expansion, and last year by strong margin expansion (Chart 17), as often happens in Years 1 and 2 of a bull market. But this year, while sales growth should remain strong, BCA Research’s US equity strategists’ model points to a small decline in margins, which are at a record high (Chart 18). The PE multiple is likely to fall further too, as it usually does when the Fed is hiking. Even with buybacks and dividends, this amounts to a total return from US equities of only about 8%. Chart 17What Can Drive Returns In 2022?
What Can Drive Returns In 2022?
What Can Drive Returns In 2022?
Chart 18Margins Likely To Slip From Record High
Margins Likely To Slip From Record High
Margins Likely To Slip From Record High
Chart 19Europe Is More Sensitive To China Slowing...
Europe Is More Sensitive To China Slowing...
Europe Is More Sensitive To China Slowing...
Nonetheless, we continue to prefer the US to other developed markets. Europe is more sensitive to the slowdown in China (Chart 19) and tends to underperform when global growth is slowing and is concentrated in services. Neither is it notably cheap versus the US relative to history (Chart 20). Emerging Markets face multiple headwinds, from the slowdown in China, to rampant inflation that is forcing central banks to hike aggressively (Brazil, for example has raised rates to 9.25% from 2% since April even in the face of weak growth and continuing risks from Covid). Chart 20...And Not Particularly Cheap
...And Not Particularly Cheap
...And Not Particularly Cheap
Chart 22US Treasurys Are Attractive to Europeans And Japanese
US Treasurys Are Attractive to Europeans And Japanese
US Treasurys Are Attractive to Europeans And Japanese
Chart 21Long Rates Low Given Fed Signaling
Long Rates Low Given Fed Signaling
Long Rates Low Given Fed Signaling
Fixed Income: Long-term rates are surprisingly low, given the hawkish pivot of the Fed and other central banks (Chart 21). One explanation Fed chair Powell has given is the attractiveness of US Treasurys, after FX hedges, to European and Japanese investors (Chart 22). He is correct about this, but the advantage will wane as the Fed raises rates (while the ECB and BOJ don’t). We continue to forecast the 10-year Treasury yield to rise to 2-2.25% by the time of the first Fed hike. We are underweight duration and expect a moderate steepening of the yield curve. TIPs look richly valued, especially at the short end. We are neutral on US TIPs, where 10-years at least represent a hedge against tail-risk inflation. Inflation-linked bonds in the euro zone are particularly unattractive now (Chart 23). Chart 23Breakevens Already Pricing In A Lot Of Inflation
Breakevens Already Pricing In A Lot Of Inflation
Breakevens Already Pricing In A Lot Of Inflation
Chart 24
In credit, we continue to see value in riskier high-yield bonds, where US B- and Caa-rated names are trading at breakeven spreads close to historic averages (Chart 24). Our global fixed-income strategists have also recently turned more positive on US dollar-denominated EM debt, which offers a decent spread pickup versus US corporate debt of the same credit rating and maturity (Chart 25). Currencies: Relative monetary policy between the US and Europe and Japan could mean some further upside for the dollar over the next few months (Chart 26). However, the dollar is expensive relative to fair value, long-dollar is an increasingly crowded trade and, in the second half of the year, a rebound in China would boost growth in Europe and Emerging Markets, which would be positive for commodity currencies. Bearing that in mind, we remain neutral on the USD. Chart 25...As Are Some EM Dollar Bonds
...As Are Some EM Dollar Bonds
...As Are Some EM Dollar Bonds
Chart 26Dollar To Rise On More Hawkish Fed?
Dollar To Rise On More Hawkish Fed?
Dollar To Rise On More Hawkish Fed?
Chart 28Gold Is Vulnerable To Rising Real Rates
Gold Is Vulnerable To Rising Real Rates
Gold Is Vulnerable To Rising Real Rates
Chart 27
Commodities: Metals prices are likely to suffer further in the first half of the year, as China’s growth continues to slow. This would suggest a further decline in the equity Materials sector. Nonetheless, we continue to have a neutral on commodities as an asset class because of the positive long-term story: Demand for metals for use in alternative energy is not being met by increased supply because investor pressure is stymying capex in the mining sector (Chart 27). It makes sense to have long-term exposure to metals such as copper and lithium which are used in electric vehicles. The oil price is mostly determined currently by Saudi supply. Our energy strategists forecast Brent oil to average $78.50 in 2022 and $80 in 2023, roughly the same as the current spot price. We remain neutral on gold: The bullion is not particularly attractively valued currently and will suffer if, as we expect, real long-term rates rise (Chart 28). Garry Evans, Senior Vice President Global Asset Allocation garry@bcaresearch.com Recommended Asset Allocation
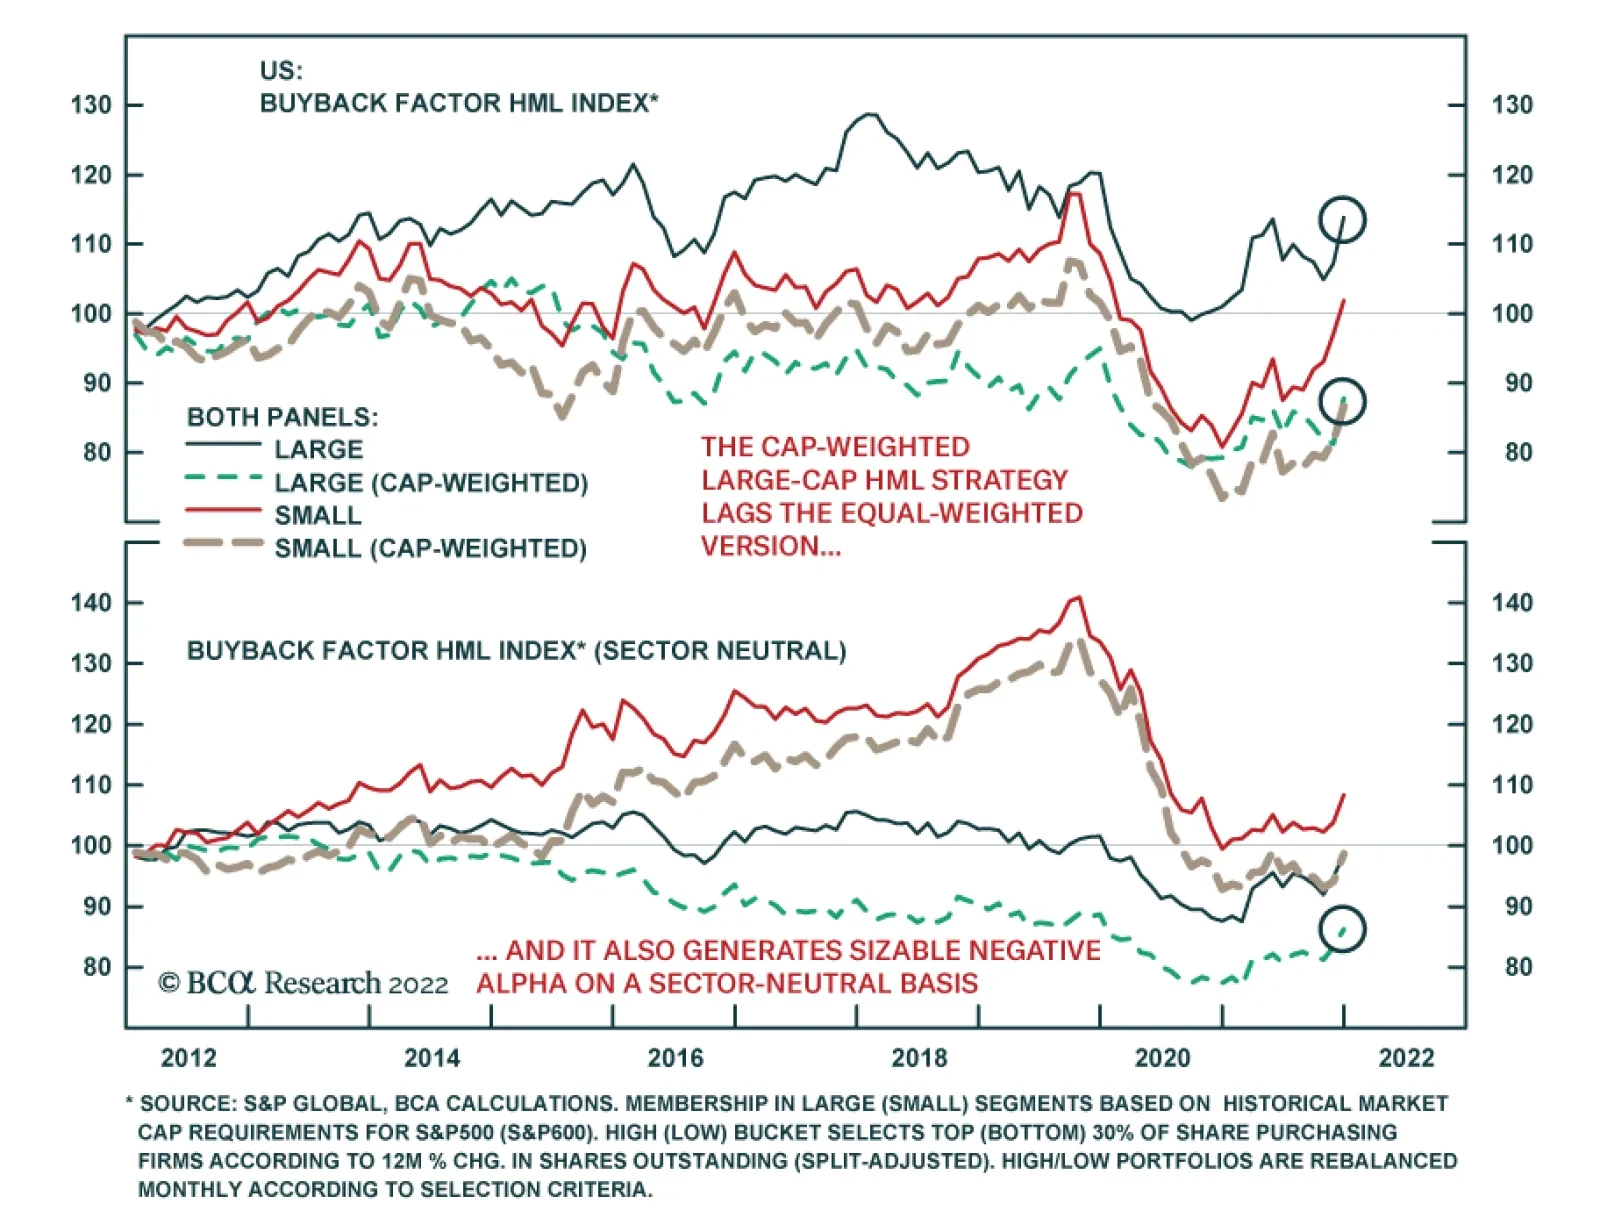
BCA Research’s US Investment Strategy service concludes that the experience of the last ten years fails to support the widely held view that stock buybacks boost share prices. The team backtested a zero-net-exposure strategy of buying stocks in a High…