Equities

Highlights Elected officials’ antipathy for buybacks is unfounded, … : For the companies that are the primary drivers of buyback activity, returning cash to shareholders is more likely to have a positive impact on employment and investment than retaining it. … and the idea that they boost stock returns may be, as well, … : Over the last ten years, a cap-weighted bucket of large-cap stocks that most reduced their share counts underperformed the bucket that most increased their share counts by 2% annually. … especially within the Tech sector, which has most enthusiastically executed them: Despite the success of Apple, which has seen its market cap soar since embarking on a deliberate strategy to shrink its shares outstanding, a strategy buying Tech’s biggest net reducers and selling its biggest net issuers would have generated sizable negative alpha over the last ten years. The problem is the relative profile of net buyers and net issuers: In general, companies that consistently buy back their own stock are mature companies that cannot earn an accretive return by redeploying the capital their incumbent business generates. Net issuers, on the other hand, are often young companies seeking fresh capital to realize their abundant growth opportunities. The next year is likely to see a pickup of share buybacks nonetheless, … : Our US Equity Strategy service’s Cash Yield Prediction Model points to increased buyback activity in 2022. … as management teams are wedded to them and buying back stock is the best use of capital for the mature companies executing them: Better to return cash to shareholders than to enter new business lines beyond the company’s area of expertise or embark on dubious acquisitions, even in the face of a potential 1% surtax. Feature Dear Client, This Special Report is the final US Investment Strategy publication for 2021. We will return with our first 2022 publication on Monday, January 10th. We wish everyone safe travels and a happy and healthy holiday season. Doug Peta Chief US Investment Strategist In Capitol Hill’s current polarized state, stock buybacks are in select company with the tech giants and China as issues that unite solons on both sides of the aisle. They are also a hot-button issue for some investors, who see them as telltale signs of a market kept aloft by sleight of hand. Although we do not think they’re worth getting worked up over – they do not promote the misallocation of capital and they may not actually boost stock prices – they come up repeatedly in client discussions and are likely to remain a feature of the landscape even if they are eventually subjected to a modest federal surtax. We have therefore joined with the BCA Equity Analyzer team to pore over its bottom-up database for insights into the buyback phenomenon. After ranking nearly 600 stocks in our large-cap universe in order of their rolling 12-month percentage change in shares outstanding across the last ten years, we were surprised to discover that the companies that most reduced their share count underperformed the companies that most grew it. We were also surprised to find that Tech was by far the worst performer among the six sectors with negative net issuance. Ultimately, the performance story seemed to boil down to Growth stocks’ extended recent edge over Value stocks. We present the data, our interpretation of it, and some future investment implications in this Special Report. Buybacks’ Bad Rap From Capitol Hill to the White House, prominent Washington voices bemoan buybacks. In a February 2019 New York Times opinion piece,1 Senators Sanders (I-VT) and Schumer (D-NY) argued that equity buybacks divert resources from productive investment in the narrow interest of boosting share prices for the benefit of shareholders and corporate executives. To counter the increasing popularity of buybacks, they proposed legislation that would permit buybacks only after several preconditions for investing in workers and communities had been met. Echoing their concerns, the White House's framework for the Build Back Better bill included a 1% surcharge on stock buybacks, “which corporate executives too often use to enrich themselves rather than investing in workers and growing the economy.” Buybacks’ opponents may mean well, but they seem to be missing an essential point: by and large, the companies that buy back their own stock lack enough attractive investment opportunities to absorb the cash their operations generate. Companies with more opportunities than cash don’t buy back stock; they issue it (and/or borrow) to get the capital to pursue them. The simple generalization that large, mature companies buy back shares while small, growing companies issue new ones is borne out by rolling 12-month percentage changes in shares outstanding by large-cap and small-cap companies (Chart 1). Chart 1The Smallest Companies Sell Stock; The Largest Buy It Back
The Smallest Companies Sell Stock; The Largest Buy It Back
The Smallest Companies Sell Stock; The Largest Buy It Back
On an equal-weighted basis, large-cap companies’ rolling share count was flat to modestly down for ten years before the pandemic drove net issuance. Adjusting for market cap, rolling net issuance has been uninterruptedly negative, shrinking by more than 2% per year, on average. The equally weighted small-cap population has been a net issuer to the tune of about 4% annually, with the biggest small-caps issuing even more, pushing the cap-weighted annual average to north of 6%. The bottom line is that large-cap companies in the aggregate have been modestly trimming their share counts, with the biggest companies retiring more than 2% of their shares each year, while small-cap companies are serial issuers, led by their largest (and presumably most bankable) constituents. We are investors serving investors, not policymakers, academics or editorial columnists charged with developing and evaluating public policy. Our mandate is bullish or bearish, not good or bad. We point out the flaws in the prevailing criticism of buybacks simply to make the point that buybacks are not an impediment to productive investment and that no one should therefore expect that productivity and income will rise if legislators or regulators restrict them. On the contrary, since we believe that buybacks represent an efficient allocation of capital, we would expect that successful attempts to limit them will hold back growth at the margin. The Buyback Calculus A company that buys back more of its shares than it issues reduces its share count. All else equal, a company with fewer shares outstanding will report greater earnings per share and a higher return on equity. Increased earnings per share (EPS) does not necessarily ensure a higher share price; if a company’s P/E multiple declines by more than EPS rises, its price will fall. Distributing retained earnings to shareholders reduces a company’s capital buffer against shocks and limits its ability to fund investment internally, but companies that embark on the most ambitious buyback campaigns likely face limited investment opportunities and have much more of a buffer than they could conceivably require. Revealed preferences suggest that management teams like buybacks. They have every interest in getting share prices higher to maximize the value of their own compensation, which typically contains an equity component that accounts for an increasing share of total compensation the more they rise in the company’s hierarchy. It is unclear, however, just how much their attachment to buybacks is founded on an expectation that buying back stock will boost its price. The opportunity to extend their tenure by pursuing a shareholder-friendly policy may well offer a stronger incentive. Do Buybacks Boost Share Prices? Returning cash to shareholders is widely perceived as good corporate governance. It increases the effective near-term yield on an equity investment and denies management the cash to pursue dubious expansion schemes or squander capital on lavish perquisites. It facilitates the reallocation of capital away from cash cows to more productive uses. Buybacks are squarely beneficial in theory, but are they good for investors in practice? (Please see the Box for a description of the methodology we followed to answer the empirical question.) Box: Performance Calculation Methodology After separating stocks into large- and small-cap categories based on Standard & Poor’s market cap parameters for inclusion in the S&P 500 and the SmallCap 600 indexes, we ranked the constituents in each category in reverse order of their rolling 12-month percentage change in shares outstanding at the end of each month from 2011 through 2021. We then placed the top three deciles (the biggest reducers of their share counts) into the High Buybacks bucket and the bottom three deciles (the biggest net issuers) into the Low Buybacks bucket. We used the buckets to backtest a zero-net-exposure strategy of buying the stocks in the High bucket with the proceeds from shorting the stocks in the Low bucket, calling it the High-Minus-Low (“HML”) strategy. We computed two sets of HML results for the large-cap and small-cap universes. The first populated the buckets without regard for sector representation (“sector-agnostic”) and the second populated the buckets in line with the sector composition of the S&P 500 and SmallCap 600 Indexes (“sector-neutral”). We also track equal-weighted and cap-weighted versions of each HML bucket to gain a sense of performance differences between constituents by size. The experience of the last ten years fails to support the widely held view that stock buybacks boost share prices. Following a zero-net-exposure strategy of owning the top three deciles of large-cap companies ranked by the rolling 12-month percentage reduction of shares outstanding and shorting the bottom three deciles generated a modest positive annual return above 1% (Chart 2). Small caps merely broke even, largely because their biggest share reducers sharply underperformed in the first year of the pandemic. On a cap-weighted basis, however, the large-cap strategy generated a negative annual return a little over 1% during the period, indicating that the largest companies pursuing buyback programs lagged their net issuer counterparts. For small caps, the cap-weighted strategy also lagged the equal-weighted strategy, albeit by a smaller margin. Chart 2Buybacks May Help A Company's Stock Price At The Margin ...
Buybacks May Help A Company's Stock Price At The Margin ...
Buybacks May Help A Company's Stock Price At The Margin ...
On a sector-neutral basis, the large-cap HML strategy roundly disappointed. The equal-weighted version was never able to do much more than break even, slipping into the red when COVID arrived, while the cap-weighted version continuously lagged it, shedding about 1.5% annually (Chart 3). Though it was hit hard by the pandemic, the equal-weighted small-cap HML strategy managed to generate about 1% annually, and boasted a 3.5% annualized return for the eight years through 2019. Chart 3... But They Are Not An Exploitable Factor
... But They Are Not An Exploitable Factor
... But They Are Not An Exploitable Factor
Drilling down to the sector level offers some additional insights. While changes in shares outstanding vary across large-cap sectors, with six sectors reducing their shares outstanding and five expanding them, every small-cap sector has been a net issuer in every single year, ex-Discretionaries and Industrials in 2019 (Chart 4). Relative sector capital needs are largely consistent regardless of market cap, however, with REITs, which distribute all their income to preserve their tax-free status, unable to expand without raising cash in the capital markets, and Utilities, Energy and traditional Telecom Services being capital-intensive industries (Table 1). Many Tech niches are capital-light, and established Industrials and Consumer businesses often throw off cash.
Chart 4
Table 1Sector Appetite For Capital Is Consistent Across The S&P 500 And The SmallCap 600
Stock Buybacks – Much Ado About Nothing
Stock Buybacks – Much Ado About Nothing
There is less large- and small-cap commonality in HML relative sector performance than in relative sector issuance. Away from Real Estate, Tech and Discretionaries, small-cap HML sector strategies generated aggregate positive returns, led by Communication Services and Energy (Chart 5). For the large caps, most HML sector strategies produced negative alpha, though the four winners and the one modest loser (Financials) are among the six sectors that have net retired shares outstanding since 2012. Tech is the conspicuous exception, with its HML strategy yielding annualized losses exceeding 3%, contrasting with the sector’s enthusiastic buyback embrace.
Chart 5
The Corporate Life Cycle Surprising as they may be on their face, negative cap-weighted ten-year HML returns do not mean that buybacks are counterproductive. We simply think they illustrate that net issuance activity follows from a company’s position in the corporate life cycle (Figure 1). Investors have prized growth in the aftermath of the global financial crisis, and the companies with the best growth prospects are often younger companies just beginning to tap their addressable markets. They have a long pathway of market share capture ahead of them and need to raise capital to begin traveling it. Many of these strong growers populate the Low basket, especially in the Tech sector.
Chart
Companies that return cash to their owners via share repurchases are often more mature. Their operations are comfortably profitable and generate more than enough cash to sustain them. They have already captured all the market share they’re likely to gain in their primary business and may not have an outlet for its proceeds in a space in which they have a plausible competitive advantage. Lacking a clear path to bettering the returns from their main operations, they have been steadily accumulating cash for a long time.
Chart
Through the lens of the Boston Consulting Group’s (BCG) growth share matrix,2 a successful business in the Maturity stage of the business life cycle is known as a Cash Cow. Cash Cows have gained considerable market share in their industry, affording them a competitive advantage based on scale, brand and experience, but little scope for growth because they have saturated a market that is itself mature (Figure 2). BCG advises management teams with a portfolio of business lines to milk Cash Cows for capital to reinvest in high-share, high-growth-potential Stars or low-share, high-growth-potential Question Marks that could be developed into Stars. In the public markets, a mature large-cap company that retains its excess capital impedes its owners’ ability to redeploy that capital to faster growing investments, subverting the overall economy’s ability to redirect capital to its best uses. Walmart, Twentieth-Century Growth Darling Walmart fits the business life cycle framework to a T and has evolved into a textbook Cash Cow. It is a dominant player that executed its initial strategy so well that it has maxed out its share in the declining/stagnating brick-and-mortar retail industry. Its international attempts to replicate its domestic success have uniformly failed to gain traction, and it currently operates in fewer major foreign countries than it's exited. Given Walmart’s star-crossed international experience and the dismal history of large corporate combinations, returning cash may be the optimal use of shareholder capital. Walmart began life as a public company in fiscal 1971 squarely in the Growth phase. It was profitable from the start and grew annual revenues by at least 25% for every one of its first 23 years of public ownership (Chart 6, top panel). It was a modest issuer of shares during its Growth phase, conducting just one secondary common stock offering 12 years after its IPO and otherwise limiting growth in shares outstanding to acquisitions, management incentive awards and conversions of debt and preferred stock. Chart 6From Young Turk To Respected Elder
From Young Turk To Respected Elder
From Young Turk To Respected Elder
Table 2From Growth To Maturity At Walmart
Stock Buybacks – Much Ado About Nothing
Stock Buybacks – Much Ado About Nothing
Once its revenue growth slipped into the low double-digits in the late nineties, it began retiring its shares at a deliberate pace (Table 2). That retirement inaugurated a ramping up of Walmart’s annual payout ratio (Chart 6, bottom panel) and cash yield (dividend yield plus buyback yield), underlining its transition from Growth to Maturity. Walmart’s 2010 admission into the S&P 500 Pure Value Index marked its ripening into full maturity, and it has been a Pure Value fixture since 2013. Today’s stolid icon is a far cry from the ambitious disruptor on display in its 1980 Annual Report: Subsequent to year end, your Company’s directors authorized [a one-third] increase in the annual dividend[.] This continues your Company’s approach of distributing a portion of profits to our shareholders and utilizing the balance to fund our aggressive expansion program. [T]he decade of the ’70’s … has been a tremendous growth period for your Company. In January 1970, we … had 32 stores …, comprising less than a million square feet of retail space. In the next ten years, we added 258 … stores, … constructed and opened three new distribution facilities, and increased our retail space to 12.6 million square feet. During that same period of time, we increased our sales and earnings at an annual compounded rate well in excess of 40 percent. Reflecting upon the progress we have made in the ‘70’s makes it apparent that there is even more opportunity in the ‘80’s for your Company, and we are better positioned to maximize our opportunities … than ever before. The Exception That Proves The Rule Apple has shined so far in the twenty-first century much like Walmart did in the latter stages of the twentieth, growing its revenues and net income at compound annual rates exceeding 20% and 25%, respectively. Unlike Walmart, however, Apple hasn’t required a steady stream of capital to grow. While Walmart had to plow its earnings right back into the business to fund the acquisition and buildout of property to create stores, warehouses and distribution centers, Apple has simply had to make incremental improvements to its music players, phones and tablets while shoring up the moats around its virtual app and music marketplaces. As a result, cash and retained earnings began silting up on Apple’s balance sheet, lying fallow in short-term marketable securities and crimping a range of return metrics. Table 3Apple's Long Road To "Net Cash Neutral"
Stock Buybacks – Much Ado About Nothing
Stock Buybacks – Much Ado About Nothing
Beginning in its 2013 fiscal year, Apple embarked on a lengthy strategy of returning that cash to shareholders, buying back stock at a rate that has allowed it to reduce its shares outstanding by 37.5% in the space of nine years (Table 3). It has reduced its retained earnings by more than $90 billion over that span and is on course to wipe them out completely in the fiscal year ending next September. Equity issuance in the form of incentive compensation augments Apple’s capital by about $5 billion per year, but if it continues to distribute more than 100% of its annual earnings in the form of dividends and repurchases, it could wipe out the rest of its recorded equity capital as well. Does this mean Apple is in danger of sliding into insolvency? Not in the least. The value of its assets dramatically exceeds the value of its liabilities, as evidenced by its nearly $3 trillion market cap and the top AAA credit rating Moody’s awarded it this week. Its reported book value is artificially suppressed by generally accepted accounting principles’ inability to value organically developed intellectual property (IP). Apple’s book value and that of other companies that generate similar IP, or benefit from internally generated moats, are dramatically undervalued. Takeaways For now, Apple is an anomaly when it comes to aggressively returning cash to shareholders while it is still in the Growth stage of its life cycle. Returning cash is typically the province of mature companies with steady operations that are unlikely to grow. It is generally good for the economy when those companies return excess cash to shareholders, freeing it up for more productive uses. If lawmakers or regulators manage to restrict the flow of capital from cash-cow companies to potential stars, we should expect activity to slow at the margin, not quicken. The experience of the last ten years suggests that companies that shrink their share counts do not outperform their counterparts that expand them. The trading strategy of shorting the biggest net share issuers to purchase the biggest net share reducers has produced negative returns. It is unclear if shareholders of companies who cannot redeploy their internally generated capital to augment the returns from their primary operations would be better served if their manager-agents retained the capital, though we suspect they would not. It seems inevitable that manager-agents with access to too much capital will eventually get into mischief. Table 4It Makes Sense That Insurers Would Buy Their Own Cheap Stock ...
Stock Buybacks – Much Ado About Nothing
Stock Buybacks – Much Ado About Nothing
Chart 7... But No One Else Seems To Want To
... But No One Else Seems To Want To
... But No One Else Seems To Want To
If buying back stock represents good corporate stewardship at mature companies, their shareholders should someday be rewarded for it. Given that the companies most suited to buying back stock tend to fit in the Value style box, the zero-net-exposure HML strategy may continue to accrue losses. Apple remains an outlier among Growth companies as an avid buyer of its stock; much more common are the S&P 500 Life and Multi-Line Insurer sub-industry groups, without which the S&P 500 Pure Value Index would have a hard time reaching a quorum (Table 4). Their constituents have assiduously bought back their stock over the last ten years, albeit to no relative avail (Chart 7). However, they should be better positioned once Value returns to favor and rising interest rates make investing their cash flow a more attractive proposition. Doug Peta, CFA Chief US Investment Strategist dougp@bcaresearch.com Footnotes 1 Opinion | Schumer and Sanders: Limit Corporate Stock Buybacks - The New York Times (nytimes.com) Accessed December 17, 2021. 2 https://www.bcg.com/about/overview/our-history/growth-share-matrix Accessed December 19, 2021.
Dear Client, This month’s Special Report is a guest piece by Doug Peta, BCA Research’s Chief US Investment Strategist. Doug’s report examines the impact of US stock buybacks using a median bottom-up approach, and presents a different perspective of the value vs. growth distribution of buybacks than we did in our October Section 2. I trust you will find his report interesting and insightful. Jonathan LaBerge, CFA The Bank Credit Analyst Elected officials’ antipathy for buybacks is unfounded, … : For the companies that are the primary drivers of buyback activity, returning cash to shareholders is more likely to have a positive impact on employment and investment than retaining it. and the idea that they boost stock returns may be, as well, … : Over the last ten years, a cap-weighted bucket of large-cap stocks that most reduced their share counts underperformed the bucket that most increased their share counts by 2% annually. especially within the Tech sector, which has most enthusiastically executed them: Despite the success of Apple, which has seen its market cap soar since embarking on a deliberate strategy to shrink its shares outstanding, a strategy buying Tech’s biggest net reducers and selling its biggest net issuers would have generated sizable negative alpha over the last ten years. The problem is the relative profile of net buyers and net issuers: In general, companies that consistently buy back their own stock are mature companies that cannot earn an accretive return by redeploying the capital their incumbent business generates. Net issuers, on the other hand, are often young companies seeking fresh capital to realize their abundant growth opportunities. The next year is likely to see a pickup of share buybacks nonetheless, … : Our US Equity Strategy service’s Cash Yield Prediction Model points to increased buyback activity in 2022. … as management teams are wedded to them and buying back stock is the best use of capital for the mature companies executing them: Better to return cash to shareholders than to enter new business lines beyond the company’s area of expertise or embark on dubious acquisitions, even in the face of a potential 1% surtax. In Capitol Hill’s current polarized state, stock buybacks are in select company with the tech giants and China as issues that unite solons on both sides of the aisle. They are also a hot-button issue for some investors, who see them as telltale signs of a market kept aloft by sleight of hand. Although we do not think they’re worth getting worked up over – they do not promote the misallocation of capital and they may not actually boost stock prices – they come up repeatedly in client discussions and are likely to remain a feature of the landscape even if they are eventually subjected to a modest federal surtax. We have therefore joined with the BCA Equity Analyzer team to pore over its bottom-up database for insights into the buyback phenomenon. After ranking nearly 600 stocks in our large-cap universe in order of their rolling 12-month percentage change in shares outstanding across the last ten years, we were surprised to discover that the companies that most reduced their share count underperformed the companies that most grew it. We were also surprised to find that Tech was by far the worst performer among the six sectors with negative net issuance. Ultimately, the performance story seemed to boil down to Growth stocks’ extended recent edge over Value stocks. We present the data, our interpretation of it, and some future investment implications in this Special Report. Buybacks’ Bad Rap From Capitol Hill to the White House, prominent Washington voices bemoan buybacks. In a February 2019 New York Times opinion piece,1 Senators Sanders (I-VT) and Schumer (D-NY) argued that equity buybacks divert resources from productive investment in the narrow interest of boosting share prices for the benefit of shareholders and corporate executives. To counter the increasing popularity of buybacks, they proposed legislation that would permit buybacks only after several preconditions for investing in workers and communities had been met. Echoing their concerns, the White House's framework for the Build Back Better bill included a 1% surcharge on stock buybacks, “which corporate executives too often use to enrich themselves rather than investing in workers and growing the economy.” Chart II-1The Smallest Companies Sell Stock; The Largest Buy It Back
The Smallest Companies Sell Stock; The Largest Buy It Back
The Smallest Companies Sell Stock; The Largest Buy It Back
Buybacks’ opponents may mean well, but they seem to be missing an essential point: by and large, the companies that buy back their own stock lack enough attractive investment opportunities to absorb the cash their operations generate. Companies with more opportunities than cash don’t buy back stock; they issue it (and/or borrow) to get the capital to pursue them. The simple generalization that large, mature companies buy back shares while small, growing companies issue new ones is borne out by rolling 12-month percentage changes in shares outstanding by large-cap and small-cap companies (Chart II-1). On an equal-weighted basis, large-cap companies’ rolling share count was flat to modestly down for ten years before the pandemic drove net issuance. Adjusting for market cap, rolling net issuance has been uninterruptedly negative, shrinking by more than 2% per year, on average. The equally weighted small-cap population has been a net issuer to the tune of about 4% annually, with the biggest small-caps issuing even more, pushing the cap-weighted annual average to north of 6%. The bottom line is that large-cap companies in the aggregate have been modestly trimming their share counts, with the biggest companies retiring more than 2% of their shares each year, while small-cap companies are serial issuers, led by their largest (and presumably most bankable) constituents. We are investors serving investors, not policymakers, academics or editorial columnists charged with developing and evaluating public policy. Our mandate is bullish or bearish, not good or bad. We point out the flaws in the prevailing criticism of buybacks simply to make the point that buybacks are not an impediment to productive investment and that no one should therefore expect that productivity and income will rise if legislators or regulators restrict them. On the contrary, since we believe that buybacks represent an efficient allocation of capital, we would expect that successful attempts to limit them will hold back growth at the margin. The Buyback Calculus A company that buys back more of its shares than it issues reduces its share count. All else equal, a company with fewer shares outstanding will report greater earnings per share and a higher return on equity. Increased earnings per share (EPS) does not necessarily ensure a higher share price; if a company’s P/E multiple declines by more than EPS rises, its price will fall. Distributing retained earnings to shareholders reduces a company’s capital buffer against shocks and limits its ability to fund investment internally, but companies that embark on the most ambitious buyback campaigns likely face limited investment opportunities and have much more of a buffer than they could conceivably require. Revealed preferences suggest that management teams like buybacks. They have every interest in getting share prices higher to maximize the value of their own compensation, which typically contains an equity component that accounts for an increasing share of total compensation the more they rise in the company’s hierarchy. It is unclear, however, just how much their attachment to buybacks is founded on an expectation that buying back stock will boost its price. The opportunity to extend their tenure by pursuing a shareholder-friendly policy may well offer a stronger incentive. Do Buybacks Boost Share Prices? Returning cash to shareholders is widely perceived as good corporate governance. It increases the effective near-term yield on an equity investment and denies management the cash to pursue dubious expansion schemes or squander capital on lavish perquisites. It facilitates the reallocation of capital away from cash cows to more productive uses. Buybacks are squarely beneficial in theory, but are they good for investors in practice? (Please see the Box II-1 for a description of the methodology we followed to answer the empirical question.) Box II-1 Performance Calculation Methodology After separating stocks into large- and small-cap categories based on Standard & Poor’s market cap parameters for inclusion in the S&P 500 and the SmallCap 600 indexes, we ranked the constituents in each category in reverse order of their rolling 12-month percentage change in shares outstanding at the end of each month from 2011 through 2021. We then placed the top three deciles (the biggest reducers of their share counts) into the High Buybacks bucket and the bottom three deciles (the biggest net issuers) into the Low Buybacks bucket. We used the buckets to backtest a zero-net-exposure strategy of buying the stocks in the High bucket with the proceeds from shorting the stocks in the Low bucket, calling it the High-Minus-Low (“HML”) strategy. We computed two sets of HML results for the large-cap and small-cap universes. The first populated the buckets without regard for sector representation (“sector-agnostic”) and the second populated the buckets in line with the sector composition of the S&P 500 and SmallCap 600 Indexes (“sector-neutral”). We also track equal-weighted and cap-weighted versions of each HML bucket to gain a sense of performance differences between constituents by size. The experience of the last ten years fails to support the widely held view that stock buybacks boost share prices. Following a zero-net-exposure strategy of owning the top three deciles of large-cap companies ranked by the rolling 12-month percentage reduction of shares outstanding and shorting the bottom three deciles generated a modest positive annual return above 1% (Chart II-2). Small caps merely broke even, largely because their biggest share reducers sharply underperformed in Year 1 of the pandemic. On a cap-weighted basis, however, the large-cap strategy generated a negative annual return a little over 1% during the period, indicating that the largest companies pursuing buyback programs lagged their net issuer counterparts. For small caps, the cap-weighted strategy also lagged the equal-weighted strategy, albeit by a smaller margin. On a sector-neutral basis, the large-cap HML strategy roundly disappointed. The equal-weighted version was never able to do much more than break even, slipping into the red when COVID arrived, while the cap-weighted version continuously lagged it, shedding about 1.5% annually (Chart II-3). Though it was hit hard by the pandemic, the equal-weighted small-cap HML strategy managed to generate about 1% annually, and boasted a 3.5% annualized return for the eight years through 2019. Chart II-2Buybacks May Help A Company's Stock Price At The Margin ...
Buybacks May Help A Company's Stock Price At The Margin ...
Buybacks May Help A Company's Stock Price At The Margin ...
Chart II-3... But They Are Not An Exploitable Factor
... But They Are Not An Exploitable Factor
... But They Are Not An Exploitable Factor
Drilling down to the sector level offers some additional insights. While changes in shares outstanding vary across large-cap sectors, with six sectors reducing their shares outstanding and five expanding them, every small-cap sector has been a net issuer in every single year, ex-Discretionaries and Industrials in 2019 (Chart II-4). Relative sector capital needs are largely consistent regardless of market cap, however, with REITs, which distribute all their income to preserve their tax-free status, unable to expand without raising cash in the capital markets, and Utilities, Energy and traditional Telecom Services being capital-intensive industries (Table II-1). Many Tech niches are capital-light, and established Industrials and Consumer businesses often throw off cash.
Chart II-4
Chart II-
There is less large- and small-cap commonality in HML relative sector performance than in relative sector issuance. Away from Real Estate, Tech and Discretionaries, small-cap HML sector strategies generated aggregate positive returns, led by Communication Services and Energy (Chart II-5). For the large caps, most HML sector strategies produced negative alpha, though the four winners and the one modest loser (Financials) are among the six sectors that have net retired shares outstanding since 2012. Tech is the conspicuous exception, with its HML strategy yielding annualized losses exceeding 3%, contrasting with the sector’s enthusiastic buyback embrace.
Chart II-5
The Corporate Life Cycle Surprising as they may be on their face, negative cap-weighted ten-year HML returns do not mean that buybacks are counterproductive. We simply think they illustrate that net issuance activity follows from a company’s position in the corporate life cycle (Figure II-1). Investors have prized growth in the aftermath of the global financial crisis, and the companies with the best growth prospects are often younger companies just beginning to tap their addressable markets. They have a long pathway of market share capture ahead of them and need to raise capital to begin traveling it. Many of these strong growers populate the Low basket, especially in the Tech sector.
Chart II-
Chart II-
Companies that return cash to their owners via share repurchases are often more mature. Their operations are comfortably profitable and generate more than enough cash to sustain them. They have already captured all the market share they’re likely to gain in their primary business and may not have an outlet for its proceeds in a space in which they have a plausible competitive advantage. Lacking a clear path to bettering the returns from their main operations, they have been steadily accumulating cash for a long time. Through the lens of the Boston Consulting Group’s (BCG) growth share matrix,2 a successful business in the Maturity stage of the business life cycle is known as a Cash Cow. Cash Cows have gained considerable market share in their industry, affording them a competitive advantage based on scale, brand and experience, but little scope for growth because they have saturated a market that is itself mature (Figure II-2). BCG advises management teams with a portfolio of business lines to milk Cash Cows for capital to reinvest in high-share, high-growth-potential Stars or low-share, high-growth-potential Question Marks that could be developed into Stars. In the public markets, a mature large-cap company that retains its excess capital impedes its owners’ ability to redeploy that capital to faster growing investments, subverting the overall economy’s ability to redirect capital to its best uses. Walmart, Twentieth-Century Growth Darling Chart II-6From Young Turk To Respected Elder
From Young Turk To Respected Elder
From Young Turk To Respected Elder
Walmart fits the business life cycle framework to a T and has evolved into a textbook Cash Cow. It is a dominant player that executed its initial strategy so well that it has maxed out its share in the declining/stagnating brick-and-mortar retail industry. Its international attempts to replicate its domestic success have uniformly failed to gain traction, and it currently operates in fewer major countries than it's exited. Given Walmart’s star-crossed international experience and the dismal history of large corporate combinations, returning cash may be the optimal use of shareholder capital. Walmart began life as a public company in fiscal 1971 squarely in the Growth phase. It was profitable from the start and grew annual revenues by at least 25% for every one of its first 23 years of public ownership (Chart II-6, top panel). It was a modest issuer of shares during its Growth phase, conducting just one secondary common stock offering 12 years after its IPO and otherwise limiting growth in shares outstanding to acquisitions, management incentive awards and debt and preferred stock conversions. Once its revenue growth slipped into the low double-digits in the late nineties, it began retiring its shares at a deliberate pace (Table II-2). That retirement inaugurated a ramping up of Walmart’s annual payout ratio (Chart II-6, bottom panel) and cash yield (dividend yield plus buyback yield), underlining its transition from Growth to Maturity. Walmart’s 2010 admission into the S&P 500 Pure Value Index marked its ripening into full maturity, and it has been a Pure Value fixture since 2013. Today’s stolid icon is a far cry from the ambitious disruptor on display in its 1980 Annual Report:
Chart II-
Subsequent to year end, your Company’s directors authorized [a one-third] increase in the annual dividend[.] This continues your Company’s approach of distributing a portion of profits to our shareholders and utilizing the balance to fund our aggressive expansion program. [T]he decade of the ’70’s … has been a tremendous growth period for your Company. In January 1970, we … had 32 stores …, comprising less than a million square feet of retail space. In the next ten years, we added 258 … stores, … constructed and opened three new distribution facilities, and increased our retail space to 12.6 million square feet. During that same period of time, we increased our sales and earnings at an annual compounded rate well in excess of 40 percent. Reflecting upon the progress we have made in the ‘70’s makes it apparent that there is even more opportunity in the ‘80’s for your Company, and we are better positioned to maximize our opportunities … than ever before. The Exception That Proves The Rule Apple has shined so far in the twenty-first century much like Walmart did in the latter stages of the twentieth, growing its revenues and net income at compound annual rates exceeding 20% and 25%, respectively. Unlike Walmart, however, Apple hasn’t required a steady stream of capital to grow. While Walmart had to plow its earnings right back into the business to fund the acquisition and buildout of property to create stores, warehouses and distribution centers, Apple has simply had to make incremental improvements to its music players, phones and tablets while shoring up the moats around its virtual app and music marketplaces. As a result, cash and retained earnings began silting up on Apple’s balance sheet, lying fallow in short-term marketable securities and crimping a range of return metrics.
Chart II-
Beginning in its 2013 fiscal year, Apple embarked on a lengthy strategy of returning that cash to shareholders, buying back stock at a rate that has allowed it to reduce its shares outstanding by 37.5% in the space of nine years (Table II-3). It has reduced its retained earnings by more than $90 billion over that span and is on course to wipe them out completely in the fiscal year ending next September. Equity issuance in the form of incentive compensation augments Apple’s capital by about $5 billion per year, but if it continues to distribute more than 100% of its annual earnings in the form of dividends and repurchases, it could wipe out the rest of its recorded equity capital as well. Does this mean Apple is in danger of sliding into insolvency? Not in the least. The value of its assets dramatically exceeds the value of its liabilities, as evidenced by its nearly $3 trillion market cap and the top AAA credit rating Moody’s awarded it this week. Its reported book value is artificially suppressed by generally accepted accounting principles’ inability to value organically developed intellectual property (IP). Apple’s book value and that of other companies that generate similar IP, or benefit from internally generated moats, are dramatically undervalued. Takeaways For now, Apple is an anomaly when it comes to aggressively returning cash to shareholders while it is still in the Growth stage of its life cycle. Returning cash is typically the province of mature companies with steady operations that are unlikely to grow. It is generally good for the economy when those companies return excess cash to shareholders, freeing it up for more productive uses. If lawmakers or regulators manage to restrict the flow of capital from cash-cow companies to potential stars, we should expect activity to slow at the margin, not quicken. The experience of the last ten years suggests that companies that shrink their share counts do not outperform their counterparts that expand them. The trading strategy of shorting the biggest net share issuers to purchase the biggest net share reducers has produced negative returns. It is unclear if shareholders of companies who cannot redeploy their internally generated capital to augment the returns from their primary operations would be better served if their manager-agents retained the capital, though we suspect they would not. It seems inevitable that manager-agents with access to too much capital will eventually get into mischief. If buying back stock represents good corporate stewardship at mature companies, their shareholders should someday be rewarded for it. Given that the companies most suited to buying back stock tend to fit in the Value style box, the zero-net-exposure HML strategy may continue to accrue losses. Apple remains an outlier among Growth companies as an avid buyer of its stock; much more common are the S&P 500 Life and Multi-Line Insurer sub-industry groups, without which the S&P 500 Pure Value Index would have a hard time reaching a quorum (Table II-4). Their constituents have assiduously bought back their stock over the last ten years, albeit to no relative avail (Chart II-7). However, they should be better positioned once Value returns to favor and rising interest rates make investing their cash flow a more attractive proposition.
Chart II-
Chart II-7... But No One Else Seems To Want To
... But No One Else Seems To Want To
... But No One Else Seems To Want To
Doug Peta, CFA Chief US Investment Strategist Footnotes 1 Opinion | Schumer and Sanders: Limit Corporate Stock Buybacks - The New York Times (nytimes.com) Accessed December 17, 2021. 2 https://www.bcg.com/about/overview/our-history/growth-share-matrix Accessed December 19, 2021.
As 2021 draws to a close, we thank you for your ongoing readership and support. We wish you and your loved ones a happy holiday season and all the best for a healthy and prosperous 2022. Highlights Over the coming three months, the odds are high that the Omicron variant of COVID-19 will disrupt economic activity in advanced economies, but the magnitude of the disruption will be heavily determined by the variant’s capacity to produce severe illness. For now, we remain of the view that the pandemic will recede in importance over the course of the next year. Relative to the assessment that we published in our 2022 Outlook report, the Omicron variant of COVID-19 has modestly raised the odds of a stagflationary outcome next year. Our base case view of above-trend growth and above-target inflation remains the most likely scenario for 2022. We do not think that the actual risk of a recession has risen significantly since we published our annual outlook, but we can envision a scenario in which Fed tightening causes investors to become fearful of a recession. The true risk of a monetary policy-induced recession over the coming 12-18 months will only rise if long-dated inflation expectations break above the range that prevailed prior to the Global Financial Crisis. Beyond 2022, the main risk to financial markets is that investors raise their longer-term interest rate expectations closer to the trend rate of economic growth. This would not be bad news for real economic activity, but it would imply meaningfully lower prices for financial assets that have benefited from low interest rates. We continue to advise that investors position themselves in line with the investment recommendations that we presented in our Outlook report. Over the coming year, investors should watch for the following when deciding whether to reduce exposure to risky assets: a breakout in long-dated inflation expectations, a significant flattening in the yield curve, or a rise in 5-year, 5-year forward US Treasury yields above 2.5%. Feature Our recently published 2022 Outlook report laid out the main macroeconomic themes that we see driving markets next year, as well as our cyclical investment recommendations.1 In this month’s report, we discuss the most relevant risks to our base case view in more depth, and update our fixed-income view in the wake of the December FOMC meeting. The Near-Term Risks Chart I-1DM Policymakers Are Afraid That Omicron Will Overwhelm The Medical System
DM Policymakers Are Afraid That Omicron Will Overwhelm The Medical System
DM Policymakers Are Afraid That Omicron Will Overwhelm The Medical System
Over the coming 0-3 months, the greatest risks to economic growth stem from the likely impact of the Omicron variant of COVID-19 on the medical system and the evolution of Europe’s energy crisis. News about the Omicron variant emerged just a few days prior to the publication of our annual outlook, and considerable uncertainty remains about its impact. Some early evidence suggests that the variant causes less severe disease, with a recent press release from South Africa’s largest private health insurance administrator suggesting that the risk of hospital admission was 29 percent lower for adults with the Omicron variant after adjusting for age, sex, underlying health conditions, and vaccine status. More recent studies from South Africa have suggested a much larger reduction in the severity of disease,2 but it is not yet clear whether these findings are applicable to advanced economies,given South Africa’s more recent vaccination campaign and higher proportion of a previously infected population. If Omicron turns out to result in 30 percent less hospitalizations, that only reduces the net impact on the medical system if the Omicron variant is no more than 1.5x as transmissible as the Delta variant. The sheer speed at which Omicron is spreading suggests it is far more contagious than this, the result in part to its ability to evade two-dose immunity. The potential for Omicron to quickly overwhelm available health system resources has alarmed authorities in several advanced economies, especially given that cases and hospitalizations have already trended higher in several countries even while Delta remained the dominant variant (Chart I-1). Additional restrictions on economic activity in the DM world appear to be likely over the coming weeks, and may be in effect until booster doses have been fully administered and/or Pfizer’s drug Paxlovid becomes widely available. For Europe, a worsening of the COVID situation has the potential to exacerbate the economic impact of the region’s ongoing energy crisis. Chart I-2 highlights that European natural gas prices have again exploded, reaching a new high that is fourteen times its pre-pandemic level. We noted in our Outlook report that European natural gas in storage is well below that of previous years, and Chart I-3 highlights that the gap in stored gas relative to previous years persists. This is occurring despite roughly average temperatures in central Europe over the past month (Chart I-4), underscoring that, barring atypically warmer temperatures, European natural gas prices are likely to remain elevated throughout the winter. Chart I-2Another Explosion In European Natural Gas Prices
Another Explosion In European Natural Gas Prices
Another Explosion In European Natural Gas Prices
Chart I-3
Chart I-5For Europe, COVID Is More Of A Problem Than Natural Gas Prices
For Europe, COVID Is More Of A Problem Than Natural Gas Prices
For Europe, COVID Is More Of A Problem Than Natural Gas Prices
Chart I-4
For now, it appears that the rise in COVID cases is having a more pronounced effect on the European economy than the energy price situation. Chart I-5 highlights that the flash December euro area manufacturing PMI fell only modestly, and that Germany’s manufacturing PMI actually rose in December. By contrast, the euro area services PMI fell over two points, reflecting the toll that recent pandemic control measures have taken on non-goods producing activity. Over the coming three months, the odds are high that the Omicron variant will disrupt economic activity in advanced economies to some degree, but the magnitude of the disruption will be heavily determined by the variant’s capacity to produce severe illness. Investors will have more information on hand in a few weeks by which to judge the extent of this risk. We will provide an update to our own assessment in our February report. Risks Over The Next Year In our Outlook report, we assigned a 60% chance to an above-trend growth and above-target inflation scenario next year, a 30% chance to a “stagflation-lite” scenario of growth at or below potential and inflation well above target, and a 10% chance of a recession. We present below our assessment of the risk that one of the latter two scenarios occurs in 2022. The Risk Of “Stagflation-Lite” Chart I-6Aside From Europe's Energy Crisis, Supply-Side Constraints Are Slowly Easing
Aside From Europe's Energy Crisis, Supply-Side Constraints Are Slowly Easing
Aside From Europe's Energy Crisis, Supply-Side Constraints Are Slowly Easing
The Omicron variant of COVID-19 has modestly raised the odds of a stagflationary outcome next year. Over the past few months, supply-side pressures have been modestly improving outside of Europe. Chart I-6 presents our new BCA Supply-Side Pressure Indicator, which measures the impact of supply-side restrictions across four categories: energy prices, shipping costs, the semiconductor shortage impact on automobile production, and labor availability. When we include all eleven components, the index has been trending higher of late, but trending flat-to-down after excluding European natural gas prices. While Omicron has the potential to reduce energy price pressure outside of Europe, it has the strong potential to cause a further increase in global shipping costs and postpone US labor market normalization. On the shipping cost front, we noted in our Outlook report that supply-side effects have been a significant driver of higher costs this year. The large rise in China/US shipping costs since late-June has been seemingly caused by the one-month closure of the Port of Yantian that began in late-May. While China has made enormous progress in vaccinating its population over the course of the year, and has prioritized the vaccination of workers in key industries, recent reports suggest that the Sinovac vaccine provides essentially no protection against contracting the Omicron variant of COVID-19. It is possible that Sinovac will offer protection against severe illness, but in terms of preventing transmission of the disease, Omicron has essentially returned China’s vaccination campaign back to square one. Chart I-7Further Price Increases May Seriously Slow Goods Spending
Further Price Increases May Seriously Slow Goods Spending
Further Price Increases May Seriously Slow Goods Spending
That fact alone makes it almost certain that China will maintain its zero-tolerance COVID policy for most of 2022, which significantly raises the risk of additional factory and port shutdowns – and thus even higher shipping costs and imported goods prices. One optimistic point is that these shutdowns are more likely to occur in mainland China than in Taiwan Province or Malaysia, two key semiconductor exporters. This is because these two regions have distributed doses of Pfizer’s vaccine, and thus presumably have the ability to provide three-dose mRNA protection to workers in crucial exporting industries (should policymakers choose to do so). Still, US consumer goods prices would clearly be impacted by even higher shipping costs, which would likely have the combined effect of slowing growth and raising prices. Chart I-7 highlights that the recent sharp deterioration in US households’ willingness to buy durable goods has been closely linked to higher goods prices, arguing that goods spending may slow meaningfully if prices rise further alongside renewed weakness in services spending. Omicron’s contagiousness may also exacerbate the ongoing US labor shortage. The shortage has occurred because of a surge in the number of retirees, difficult working conditions in several industries, and increased childcare requirements during the pandemic. The increase in the number of retirees has not happened for structural reasons; it has been driven by a sharp slowdown in the number of older Americans shifting from “retired” to “in the labor force”, which has occurred because of health concerns. None of these factors are likely to improve meaningfully while Omicron is raging, suggesting that services prices are likely to remain elevated or accelerate further even if services spending falls anew.
Chart I-8
To conclude on this point, we estimate that the odds of a stagflation-lite scenario have risen to 35% (from 30%), and the odds of our base-case scenario of above-trend growth and above-target inflation have fallen to 55% (Chart I-8). Still, our base-case view remains the most probable outcome, given that we do not believe the odds of a recession next year have risen. The Risk Of Recession We do not think that the actual risk of a recession has risen significantly since we published our annual outlook, but we can envision a scenario in which Fed tightening causes investors to become fearful of a recession. Such a scenario would have a material impact on cyclical investment strategy, and thus warrants a discussion. Following the December FOMC meeting, BCA’s baseline expectation is that a first Fed hike will occur in June 2022 and that rate increases will proceed at a pace of 25 basis points per quarter through the end of the year. BCA’s house view on this question is now in line with the view of The Bank Credit Analyst service, which published in a September Special Report that the Fed could hit its maximum employment objective as early as next summer.3 The Fed’s shift implies that the 2-year yield should rise to 1.85%, and the 10-year yield to 2.35%, by the end of next year (Chart I-9). Chart I-9A More Hawkish Fed Means A 2.35% 10-Year Yield Next Year
A More Hawkish Fed Means A 2.35% 10-Year Yield Next Year
A More Hawkish Fed Means A 2.35% 10-Year Yield Next Year
We doubt that US monetary policy will become economically restrictive next year. If the Omicron variant of COVID-19 causes a serious slowdown in economic activity, the Fed will ramp down its expectations for rate hikes. And if the Fed meets our baseline expectations for hikes next year in the context of above-trend economic growth, we do not believe that a 2.35% 10-year Treasury yield will be, in any way, limiting for economic activity. However, investors do not agree with our view about the boundary between easy and tight monetary policy, and may begin to fear a recession in response to Fed tightening next year. We noted in our Outlook report that we believe the neutral rate of interest (“R-star”) is likely higher that investors believe, but the fact remains that the Fed and market participants have judged, with deep conviction, that the neutral rate remains very low relative to the potential growth rate of the economy. Chart I-10 presents the fair value path of the 2-year Treasury yield based on our expectations for the Fed funds rate, alongside the actual 10-year Treasury yield. The chart highlights that the 2/10 yield curve could flatten significantly or even invert in the second half of 2022 if long-maturity yields rise only modestly in response to Fed tightening, which could occur if investors focus on the view that the neutral rate of interest is low and that Fed rate hikes will not prove to be sustainable. Based on two different measures of the yield curve, fixed-income investors believe that the current economic expansion is already 50-60% complete (Chart I-11), implying a recession at some point in the first half of 2023. Chart I-10The US Yield Curve Could Invert Next Year If Long-Maturity Yields Rise Only Marginally
The US Yield Curve Could Invert Next Year If Long-Maturity Yields Rise Only Marginally
The US Yield Curve Could Invert Next Year If Long-Maturity Yields Rise Only Marginally
Chart I-11More Than Half Of The Economic Expansion Has Already Occurred, According To The Yield Curve
More Than Half Of The Economic Expansion Has Already Occurred, According To The Yield Curve
More Than Half Of The Economic Expansion Has Already Occurred, According To The Yield Curve
Chart I-12A Serious Flattening In The Yield Curve Could Unnerve Stocks
A Serious Flattening In The Yield Curve Could Unnerve Stocks
A Serious Flattening In The Yield Curve Could Unnerve Stocks
If the yield curve were to flirt with inversion and investors began to price in the potential for a recession, it would cause significant financial market turmoil regardless of whether the risk of recession is real or not. Chart I-12 highlights that the S&P 500 fell 20% in late 2018 as the 2/10 yield curve flattened towards 20 basis points, in response to the economic impact of the China-US Trade War and the global impact of US tariffs on the auto industry. So it is possible that a “recessionary narrative” negatively impacts risky asset prices in the second half of 2022, even if an actual recession is ultimately avoided. Based on this, we would be much more inclined to reduce our recommended exposure to equities if the US 2/10 yield curve were to flatten below 30 basis points next year. In our view, the risk of a monetary policy-induced recession over the coming 12-18 months will only legitimately rise if long-dated inflation expectations break above the range that prevailed prior to the Global Financial Crisis. We noted in our Outlook report that this has not yet occurred for either household or market-based expectations, although it is a risk that cannot be ruled out. The odds of a breakout in long-dated inflation expectations will rise the longer that actual inflation remains elevated, and our inflation probability model suggests that core PCE inflation will remain well above 3% next year and potentially above 4% – although Chart I-13 highlights that the odds of the latter are falling. Chart I-13US Core Inflation Will Remain Well Above Target Next Year
US Core Inflation Will Remain Well Above Target Next Year
US Core Inflation Will Remain Well Above Target Next Year
A dangerous breakout in inflation expectations would raise the risk of a recession because of the Fed’s awareness of the “sacrifice ratio”, a very important economic concept that has been mostly irrelevant for the past 25 years. The sacrifice ratio is an estimate of the amount of output or employment that must be given up in order to reduce inflation by one percentage point. Table I-1 highlights some academic estimates of the sacrifice ratio, which have typically varied between 2-4% in output terms. For comparison purposes, real GDP has typically fallen no more than 2% on a year-over-year basis during most post-war US recessions. Real GDP growth fell 4% year-over-year in 2009, highlighting that the cost of reducing the rate of inflation by 1 percentage point is effectively a severe recession.
Chart I-
In his Senate testimony in late-November, Fed Chair Jay Powell noted that persistently high inflation threatens the economic recovery. He also implied that to reach its maximum employment goal, the Fed may need to act pre-emptively to tame inflation. This was implicit recognition of the sacrifice ratio, and should be seen as an expression of the Fed’s desire to avoid a scenario in which persistently high inflation causes inflation expectations to become unanchored (to the upside), as it would force the Fed to sacrifice economic activity in order to ensure price stability. By acting earlier to normalize monetary policy, the Fed hopes to keep inflation expectations well contained. Chart I-14Long-Dated Market-Based Inflation Expectations Are Not Out Of Control
Long-Dated Market-Based Inflation Expectations Are Not Out Of Control
Long-Dated Market-Based Inflation Expectations Are Not Out Of Control
For now, we see no signs that the Fed will fail to keep inflation expectations from rising dangerously. Chart I-14 highlights that long-dated market expectations for inflation have been falling over the past two months, and are essentially at the same level that they were on average in 2018. Given this, we maintain the 10% odds of recession that we presented in our Outlook report, although investors will need to monitor inflation expectations closely over the coming year to judge whether the risks of a monetary policy-induced recession are indeed rising. Risks Beyond The Next Year Beyond 2022, the main risk to risky asset prices is probably not overly tight monetary policy. Instead, the risk is that investors will come to the conclusion that the Fed funds rate will ultimately end up rising above what the Fed is currently projecting, and that the economy will be capable of tolerating interest rates that are closer to the prevailing rate of economic growth. This would not be bad news for real economic activity, but it would imply meaningfully lower prices for financial assets that have benefited from low interest rates. Chart I-15US Stocks Would Suffer Significant Losses If Interest Rates Rise Towards Potential Growth
US Stocks Would Suffer Significant Losses If Interest Rates Rise Towards Potential Growth
US Stocks Would Suffer Significant Losses If Interest Rates Rise Towards Potential Growth
Chart I-15 drives the point home by comparing the current S&P 500 forward P/E ratio to a “justified” P/E. Here, we calculate the justified P/E using the average ex-ante equity risk premium (ERP) since 1980, and real potential GDP growth as a stand-in for the real risk-free rate of interest. The chart highlights that US stocks would experience a 30% contraction in equity multiples should real long-maturity bond yields approach 2%. A decline in the ERP could potentially reduce losses for equity holders in a higher interest rate scenario, but it is very likely that the net effect would still be negative for stocks. We detailed in our Outlook report why we believe that the neutral rate of interest is higher than most acknowledge. We agree that R-star fell in the US for a time following the Global Financial Crisis (GFC), but we strongly question that it is as low as the Fed and investors believe. The neutral rate of interest fell during the first half of the last economic cycle because of a persistent period of household deleveraging and balance-sheet repair, which was a multi-year consequence of the financial crisis and the insufficient fiscal response to the 2008-09 recession. We highlighted in our Outlook report that US household balance sheets have been repaired, and that the household debt service ratio has fallen to mid-1960s levels. However, Chart I-16 highlights that even the corporate sector, which has leveraged itself significantly over the past decade, has seen its debt service ratio plummet. In a scenario in which long-maturity Treasury yields were to rise to 4%, we estimate that the debt service burden of the nonfinancial corporate sector would rise to its 70th-80th percentile historically. Chart I-16The US Corporate Sector Debt Service Burden Has Room To Rise
The US Corporate Sector Debt Service Burden Has Room To Rise
The US Corporate Sector Debt Service Burden Has Room To Rise
That would be a meaningful increase from current levels, but it would not be unprecedented, and thus would not render a 4% 10-year Treasury yield to be economically unsustainable. In addition, we strongly suspect that corporations would reduce their interest burden in such a scenario by issuing equity to retire debt. That would lower firms’ debt burden and reduce the economic impact of higher interest rates, although it would be additionally negative for equity investors given that this would dilute earnings per share. We argued in our Outlook report that a shift in investor expectations about the neutral rate of interest is unlikely to occur before the Fed begins to normalize monetary policy. Ryan Swift, BCA’s US Bond Strategist, presented further evidence of this perspective in a Special Report earlier this week.4 Ryan highlighted results from a recent academic paper, which showed that the entire decline in the 10-year Treasury yield since 1990 has occurred during three-day windows centered around FOMC meetings (Chart I-17). Ryan argued that this suggests investors change their neutral rate expectations in response to Fed interest rate decisions, rather than in response to independent macroeconomic factors that are distinct from monetary policy action. This argues that a shift in neutral rate expectations is unlikely before the Fed begins to lift interest rates in the middle of the year, and probably not until the Fed has raised rates a few times. We are thus unlikely to recommend that investors reduce their equity exposure in response to this risk until 5-year, 5-year forward Treasury yields break above 2.5% (the Fed’s long-run Fed funds rate projection), which is 80 basis points above current levels (Chart I-18). Chart I-17Fed Rate Decisions Drive Long-Maturity Bond Yields
Fed Rate Decisions Drive Long-Maturity Bond Yields
Fed Rate Decisions Drive Long-Maturity Bond Yields
Chart I-18We Will Consider Selling Stocks If Market-Based Neutral Rate Estimates Exceed 2.5%
We Will Consider Selling Stocks If Market-Based Neutral Rate Estimates Exceed 2.5%
We Will Consider Selling Stocks If Market-Based Neutral Rate Estimates Exceed 2.5%
Investment Conclusions We continue to advise that investors position themselves in line with the investment recommendations that we presented in our Outlook report. Over the following 12-months, we expect the following: Global stocks to outperform bonds Short-duration fixed-income positions to outperform long High-yield corporate bonds to outperform within fixed-income portfolios Value stocks to outperform growth Non-resource cyclicals to outperform defensives Small caps to outperform large A modest rise in commodity prices led by oil A decline in the US dollar However, our discussion of the risks to our views has highlighted three things for investors to monitor next year when deciding whether to reduce exposure to stocks (and risky assets more generally): A breakout in long-dated inflation expectations, as that would likely cause the Fed to raise interest rates more aggressively than it currently projects. A significant flattening in the yield curve, as that would indicate that investors ultimately expect existing Fed rate hike projections to prove recessionary. A rise in 5-year, 5-year forward US Treasury yields above 2.5%, as that would indicate that investors may be upwardly shifting their expectations for the neutral rate of interest. Over the shorter-term, our discussion also underscored that the Omicron variant will likely disrupt economic activity to some degree over the coming three months, and that the risks of a stagflation-lite scenario next year have modestly increased because of the likely maintenance of China’s zero-tolerance COVID policy. We continue to expect that the widespread rollout of booster doses, as well as the progressive availability of effective and safe antiviral drugs, will limit Omicron’s impact on economic activity to the first half of 2022, and that the pandemic will recede in importance next year on average in comparison to 2021. As noted above, this assessment will be monitored continually in response to the release of new information, and we will provide an update in our February report. Jonathan LaBerge, CFA Vice President The Bank Credit Analyst December 23, 2021 Next Report: January 27, 2022 II. Stock Buybacks – Much Ado About Nothing Dear Client, This month’s Special Report is a guest piece by Doug Peta, BCA Research’s Chief US Investment Strategist. Doug’s report examines the impact of US stock buybacks using a median bottom-up approach, and presents a different perspective of the value vs. growth distribution of buybacks than we did in our October Section 2. I trust you will find his report interesting and insightful. Jonathan LaBerge, CFA The Bank Credit Analyst Elected officials’ antipathy for buybacks is unfounded, … : For the companies that are the primary drivers of buyback activity, returning cash to shareholders is more likely to have a positive impact on employment and investment than retaining it. and the idea that they boost stock returns may be, as well, … : Over the last ten years, a cap-weighted bucket of large-cap stocks that most reduced their share counts underperformed the bucket that most increased their share counts by 2% annually. especially within the Tech sector, which has most enthusiastically executed them: Despite the success of Apple, which has seen its market cap soar since embarking on a deliberate strategy to shrink its shares outstanding, a strategy buying Tech’s biggest net reducers and selling its biggest net issuers would have generated sizable negative alpha over the last ten years. The problem is the relative profile of net buyers and net issuers: In general, companies that consistently buy back their own stock are mature companies that cannot earn an accretive return by redeploying the capital their incumbent business generates. Net issuers, on the other hand, are often young companies seeking fresh capital to realize their abundant growth opportunities. The next year is likely to see a pickup of share buybacks nonetheless, … : Our US Equity Strategy service’s Cash Yield Prediction Model points to increased buyback activity in 2022. … as management teams are wedded to them and buying back stock is the best use of capital for the mature companies executing them: Better to return cash to shareholders than to enter new business lines beyond the company’s area of expertise or embark on dubious acquisitions, even in the face of a potential 1% surtax. In Capitol Hill’s current polarized state, stock buybacks are in select company with the tech giants and China as issues that unite solons on both sides of the aisle. They are also a hot-button issue for some investors, who see them as telltale signs of a market kept aloft by sleight of hand. Although we do not think they’re worth getting worked up over – they do not promote the misallocation of capital and they may not actually boost stock prices – they come up repeatedly in client discussions and are likely to remain a feature of the landscape even if they are eventually subjected to a modest federal surtax. We have therefore joined with the BCA Equity Analyzer team to pore over its bottom-up database for insights into the buyback phenomenon. After ranking nearly 600 stocks in our large-cap universe in order of their rolling 12-month percentage change in shares outstanding across the last ten years, we were surprised to discover that the companies that most reduced their share count underperformed the companies that most grew it. We were also surprised to find that Tech was by far the worst performer among the six sectors with negative net issuance. Ultimately, the performance story seemed to boil down to Growth stocks’ extended recent edge over Value stocks. We present the data, our interpretation of it, and some future investment implications in this Special Report. Buybacks’ Bad Rap From Capitol Hill to the White House, prominent Washington voices bemoan buybacks. In a February 2019 New York Times opinion piece,5 Senators Sanders (I-VT) and Schumer (D-NY) argued that equity buybacks divert resources from productive investment in the narrow interest of boosting share prices for the benefit of shareholders and corporate executives. To counter the increasing popularity of buybacks, they proposed legislation that would permit buybacks only after several preconditions for investing in workers and communities had been met. Echoing their concerns, the White House's framework for the Build Back Better bill included a 1% surcharge on stock buybacks, “which corporate executives too often use to enrich themselves rather than investing in workers and growing the economy.” Chart II-1The Smallest Companies Sell Stock; The Largest Buy It Back
The Smallest Companies Sell Stock; The Largest Buy It Back
The Smallest Companies Sell Stock; The Largest Buy It Back
Buybacks’ opponents may mean well, but they seem to be missing an essential point: by and large, the companies that buy back their own stock lack enough attractive investment opportunities to absorb the cash their operations generate. Companies with more opportunities than cash don’t buy back stock; they issue it (and/or borrow) to get the capital to pursue them. The simple generalization that large, mature companies buy back shares while small, growing companies issue new ones is borne out by rolling 12-month percentage changes in shares outstanding by large-cap and small-cap companies (Chart II-1). On an equal-weighted basis, large-cap companies’ rolling share count was flat to modestly down for ten years before the pandemic drove net issuance. Adjusting for market cap, rolling net issuance has been uninterruptedly negative, shrinking by more than 2% per year, on average. The equally weighted small-cap population has been a net issuer to the tune of about 4% annually, with the biggest small-caps issuing even more, pushing the cap-weighted annual average to north of 6%. The bottom line is that large-cap companies in the aggregate have been modestly trimming their share counts, with the biggest companies retiring more than 2% of their shares each year, while small-cap companies are serial issuers, led by their largest (and presumably most bankable) constituents. We are investors serving investors, not policymakers, academics or editorial columnists charged with developing and evaluating public policy. Our mandate is bullish or bearish, not good or bad. We point out the flaws in the prevailing criticism of buybacks simply to make the point that buybacks are not an impediment to productive investment and that no one should therefore expect that productivity and income will rise if legislators or regulators restrict them. On the contrary, since we believe that buybacks represent an efficient allocation of capital, we would expect that successful attempts to limit them will hold back growth at the margin. The Buyback Calculus A company that buys back more of its shares than it issues reduces its share count. All else equal, a company with fewer shares outstanding will report greater earnings per share and a higher return on equity. Increased earnings per share (EPS) does not necessarily ensure a higher share price; if a company’s P/E multiple declines by more than EPS rises, its price will fall. Distributing retained earnings to shareholders reduces a company’s capital buffer against shocks and limits its ability to fund investment internally, but companies that embark on the most ambitious buyback campaigns likely face limited investment opportunities and have much more of a buffer than they could conceivably require. Revealed preferences suggest that management teams like buybacks. They have every interest in getting share prices higher to maximize the value of their own compensation, which typically contains an equity component that accounts for an increasing share of total compensation the more they rise in the company’s hierarchy. It is unclear, however, just how much their attachment to buybacks is founded on an expectation that buying back stock will boost its price. The opportunity to extend their tenure by pursuing a shareholder-friendly policy may well offer a stronger incentive. Do Buybacks Boost Share Prices? Returning cash to shareholders is widely perceived as good corporate governance. It increases the effective near-term yield on an equity investment and denies management the cash to pursue dubious expansion schemes or squander capital on lavish perquisites. It facilitates the reallocation of capital away from cash cows to more productive uses. Buybacks are squarely beneficial in theory, but are they good for investors in practice? (Please see the Box II-1 for a description of the methodology we followed to answer the empirical question.) Box II-1 Performance Calculation Methodology After separating stocks into large- and small-cap categories based on Standard & Poor’s market cap parameters for inclusion in the S&P 500 and the SmallCap 600 indexes, we ranked the constituents in each category in reverse order of their rolling 12-month percentage change in shares outstanding at the end of each month from 2011 through 2021. We then placed the top three deciles (the biggest reducers of their share counts) into the High Buybacks bucket and the bottom three deciles (the biggest net issuers) into the Low Buybacks bucket. We used the buckets to backtest a zero-net-exposure strategy of buying the stocks in the High bucket with the proceeds from shorting the stocks in the Low bucket, calling it the High-Minus-Low (“HML”) strategy. We computed two sets of HML results for the large-cap and small-cap universes. The first populated the buckets without regard for sector representation (“sector-agnostic”) and the second populated the buckets in line with the sector composition of the S&P 500 and SmallCap 600 Indexes (“sector-neutral”). We also track equal-weighted and cap-weighted versions of each HML bucket to gain a sense of performance differences between constituents by size. The experience of the last ten years fails to support the widely held view that stock buybacks boost share prices. Following a zero-net-exposure strategy of owning the top three deciles of large-cap companies ranked by the rolling 12-month percentage reduction of shares outstanding and shorting the bottom three deciles generated a modest positive annual return above 1% (Chart II-2). Small caps merely broke even, largely because their biggest share reducers sharply underperformed in Year 1 of the pandemic. On a cap-weighted basis, however, the large-cap strategy generated a negative annual return a little over 1% during the period, indicating that the largest companies pursuing buyback programs lagged their net issuer counterparts. For small caps, the cap-weighted strategy also lagged the equal-weighted strategy, albeit by a smaller margin. On a sector-neutral basis, the large-cap HML strategy roundly disappointed. The equal-weighted version was never able to do much more than break even, slipping into the red when COVID arrived, while the cap-weighted version continuously lagged it, shedding about 1.5% annually (Chart II-3). Though it was hit hard by the pandemic, the equal-weighted small-cap HML strategy managed to generate about 1% annually, and boasted a 3.5% annualized return for the eight years through 2019. Chart II-2Buybacks May Help A Company's Stock Price At The Margin ...
Buybacks May Help A Company's Stock Price At The Margin ...
Buybacks May Help A Company's Stock Price At The Margin ...
Chart II-3... But They Are Not An Exploitable Factor
... But They Are Not An Exploitable Factor
... But They Are Not An Exploitable Factor
Drilling down to the sector level offers some additional insights. While changes in shares outstanding vary across large-cap sectors, with six sectors reducing their shares outstanding and five expanding them, every small-cap sector has been a net issuer in every single year, ex-Discretionaries and Industrials in 2019 (Chart II-4). Relative sector capital needs are largely consistent regardless of market cap, however, with REITs, which distribute all their income to preserve their tax-free status, unable to expand without raising cash in the capital markets, and Utilities, Energy and traditional Telecom Services being capital-intensive industries (Table II-1). Many Tech niches are capital-light, and established Industrials and Consumer businesses often throw off cash.
Chart II-4
Chart II-
There is less large- and small-cap commonality in HML relative sector performance than in relative sector issuance. Away from Real Estate, Tech and Discretionaries, small-cap HML sector strategies generated aggregate positive returns, led by Communication Services and Energy (Chart II-5). For the large caps, most HML sector strategies produced negative alpha, though the four winners and the one modest loser (Financials) are among the six sectors that have net retired shares outstanding since 2012. Tech is the conspicuous exception, with its HML strategy yielding annualized losses exceeding 3%, contrasting with the sector’s enthusiastic buyback embrace.
Chart II-5
The Corporate Life Cycle Surprising as they may be on their face, negative cap-weighted ten-year HML returns do not mean that buybacks are counterproductive. We simply think they illustrate that net issuance activity follows from a company’s position in the corporate life cycle (Figure II-1). Investors have prized growth in the aftermath of the global financial crisis, and the companies with the best growth prospects are often younger companies just beginning to tap their addressable markets. They have a long pathway of market share capture ahead of them and need to raise capital to begin traveling it. Many of these strong growers populate the Low basket, especially in the Tech sector.
Chart II-
Chart II-
Companies that return cash to their owners via share repurchases are often more mature. Their operations are comfortably profitable and generate more than enough cash to sustain them. They have already captured all the market share they’re likely to gain in their primary business and may not have an outlet for its proceeds in a space in which they have a plausible competitive advantage. Lacking a clear path to bettering the returns from their main operations, they have been steadily accumulating cash for a long time. Through the lens of the Boston Consulting Group’s (BCG) growth share matrix,6 a successful business in the Maturity stage of the business life cycle is known as a Cash Cow. Cash Cows have gained considerable market share in their industry, affording them a competitive advantage based on scale, brand and experience, but little scope for growth because they have saturated a market that is itself mature (Figure II-2). BCG advises management teams with a portfolio of business lines to milk Cash Cows for capital to reinvest in high-share, high-growth-potential Stars or low-share, high-growth-potential Question Marks that could be developed into Stars. In the public markets, a mature large-cap company that retains its excess capital impedes its owners’ ability to redeploy that capital to faster growing investments, subverting the overall economy’s ability to redirect capital to its best uses. Walmart, Twentieth-Century Growth Darling Chart II-6From Young Turk To Respected Elder
From Young Turk To Respected Elder
From Young Turk To Respected Elder
Walmart fits the business life cycle framework to a T and has evolved into a textbook Cash Cow. It is a dominant player that executed its initial strategy so well that it has maxed out its share in the declining/stagnating brick-and-mortar retail industry. Its international attempts to replicate its domestic success have uniformly failed to gain traction, and it currently operates in fewer major countries than it's exited. Given Walmart’s star-crossed international experience and the dismal history of large corporate combinations, returning cash may be the optimal use of shareholder capital. Walmart began life as a public company in fiscal 1971 squarely in the Growth phase. It was profitable from the start and grew annual revenues by at least 25% for every one of its first 23 years of public ownership (Chart II-6, top panel). It was a modest issuer of shares during its Growth phase, conducting just one secondary common stock offering 12 years after its IPO and otherwise limiting growth in shares outstanding to acquisitions, management incentive awards and debt and preferred stock conversions. Once its revenue growth slipped into the low double-digits in the late nineties, it began retiring its shares at a deliberate pace (Table II-2). That retirement inaugurated a ramping up of Walmart’s annual payout ratio (Chart II-6, bottom panel) and cash yield (dividend yield plus buyback yield), underlining its transition from Growth to Maturity. Walmart’s 2010 admission into the S&P 500 Pure Value Index marked its ripening into full maturity, and it has been a Pure Value fixture since 2013. Today’s stolid icon is a far cry from the ambitious disruptor on display in its 1980 Annual Report:
Chart II-
Subsequent to year end, your Company’s directors authorized [a one-third] increase in the annual dividend[.] This continues your Company’s approach of distributing a portion of profits to our shareholders and utilizing the balance to fund our aggressive expansion program. [T]he decade of the ’70’s … has been a tremendous growth period for your Company. In January 1970, we … had 32 stores …, comprising less than a million square feet of retail space. In the next ten years, we added 258 … stores, … constructed and opened three new distribution facilities, and increased our retail space to 12.6 million square feet. During that same period of time, we increased our sales and earnings at an annual compounded rate well in excess of 40 percent. Reflecting upon the progress we have made in the ‘70’s makes it apparent that there is even more opportunity in the ‘80’s for your Company, and we are better positioned to maximize our opportunities … than ever before. The Exception That Proves The Rule Apple has shined so far in the twenty-first century much like Walmart did in the latter stages of the twentieth, growing its revenues and net income at compound annual rates exceeding 20% and 25%, respectively. Unlike Walmart, however, Apple hasn’t required a steady stream of capital to grow. While Walmart had to plow its earnings right back into the business to fund the acquisition and buildout of property to create stores, warehouses and distribution centers, Apple has simply had to make incremental improvements to its music players, phones and tablets while shoring up the moats around its virtual app and music marketplaces. As a result, cash and retained earnings began silting up on Apple’s balance sheet, lying fallow in short-term marketable securities and crimping a range of return metrics.
Chart II-
Beginning in its 2013 fiscal year, Apple embarked on a lengthy strategy of returning that cash to shareholders, buying back stock at a rate that has allowed it to reduce its shares outstanding by 37.5% in the space of nine years (Table II-3). It has reduced its retained earnings by more than $90 billion over that span and is on course to wipe them out completely in the fiscal year ending next September. Equity issuance in the form of incentive compensation augments Apple’s capital by about $5 billion per year, but if it continues to distribute more than 100% of its annual earnings in the form of dividends and repurchases, it could wipe out the rest of its recorded equity capital as well. Does this mean Apple is in danger of sliding into insolvency? Not in the least. The value of its assets dramatically exceeds the value of its liabilities, as evidenced by its nearly $3 trillion market cap and the top AAA credit rating Moody’s awarded it this week. Its reported book value is artificially suppressed by generally accepted accounting principles’ inability to value organically developed intellectual property (IP). Apple’s book value and that of other companies that generate similar IP, or benefit from internally generated moats, are dramatically undervalued. Takeaways For now, Apple is an anomaly when it comes to aggressively returning cash to shareholders while it is still in the Growth stage of its life cycle. Returning cash is typically the province of mature companies with steady operations that are unlikely to grow. It is generally good for the economy when those companies return excess cash to shareholders, freeing it up for more productive uses. If lawmakers or regulators manage to restrict the flow of capital from cash-cow companies to potential stars, we should expect activity to slow at the margin, not quicken. The experience of the last ten years suggests that companies that shrink their share counts do not outperform their counterparts that expand them. The trading strategy of shorting the biggest net share issuers to purchase the biggest net share reducers has produced negative returns. It is unclear if shareholders of companies who cannot redeploy their internally generated capital to augment the returns from their primary operations would be better served if their manager-agents retained the capital, though we suspect they would not. It seems inevitable that manager-agents with access to too much capital will eventually get into mischief. If buying back stock represents good corporate stewardship at mature companies, their shareholders should someday be rewarded for it. Given that the companies most suited to buying back stock tend to fit in the Value style box, the zero-net-exposure HML strategy may continue to accrue losses. Apple remains an outlier among Growth companies as an avid buyer of its stock; much more common are the S&P 500 Life and Multi-Line Insurer sub-industry groups, without which the S&P 500 Pure Value Index would have a hard time reaching a quorum (Table II-4). Their constituents have assiduously bought back their stock over the last ten years, albeit to no relative avail (Chart II-7). However, they should be better positioned once Value returns to favor and rising interest rates make investing their cash flow a more attractive proposition.
Chart II-
Chart II-7... But No One Else Seems To Want To
... But No One Else Seems To Want To
... But No One Else Seems To Want To
Doug Peta, CFA Chief US Investment Strategist III. Indicators And Reference Charts BCA’s equity indicators highlight that the “easy” money from expectations of an eventual end to the pandemic have already been made. Our technical, valuation, and sentiment indicators remain very extended, highlighting that investors should expect positive but modest returns from stocks over the coming 6-12 months. Our monetary indicator has retreated below the boom/bust line, although this mostly reflects the use of producer prices to deflate money growth. In nominal terms, the supply of money continues to grow. Still, the retreat in the indicator over the past year highlights that the monetary policy stance is likely to move in a tighter direction over the coming year, which is in line with the Fed’s recent hawkish shift. Forward equity earnings are pricing in a substantial further rise in earnings per share. Net earnings revisions and net positive earnings surprises are rolling over, but there is no meaningful sign of waning forward earnings momentum. Bottom-up analyst earning expectations remain too high, but stocks are likely to be supported by robust revenue growth over the coming year. Within a global equity portfolio, we continue to recommend that investors position for the underperformance of financial assets that are negatively correlated with long-maturity government bond yields. The US 10-Year Treasury Yield remains well below the fair value implied by a mid-2022 rate hike scenario, underscoring that a move higher over the coming year is quite likely. Commodity prices remain elevated, and our composite technical indicator highlights that they remain overbought. An eventual slowdown in US goods spending, coupled with eventual supply-chain normalization and the absence of a significant reflationary impulse from Chinese policy, could weigh on commodity prices at some point over the coming 6 months. We expect stronger metals prices in the back half of 2022. US and global LEIs remain very elevated but have started to roll over. Our global LEI diffusion index has declined very significantly, but this likely reflects the outsized impact of a few emerging market countries (whose vaccination progress is still lagging). Still-strong leading and coincident indicators underscore that the global demand for goods is robust, and that output is below pre-pandemic levels in most economies because of very weak services spending. The latter will recover significantly at some point over the coming year, as the severity of the pandemic wanes. EQUITIES: Chart III-1US Equity Indicators
US Equity Indicators
US Equity Indicators
Chart III-2Willingness To Pay For Risk
Willingness To Pay For Risk
Willingness To Pay For Risk
Chart III-3US Equity Sentiment Indicators
US Equity Sentiment Indicators
US Equity Sentiment Indicators
Chart III-4US Stock Market Breadth
US Stock Market Breadth
US Stock Market Breadth
Chart III-5US Stock Market Valuation
US Stock Market Valuation
US Stock Market Valuation
Chart III-6US Earnings
US Earnings
US Earnings
Chart III-7Global Stock Market And Earnings: Relative Performance
Global Stock Market And Earnings: Relative Performance
Global Stock Market And Earnings: Relative Performance
Chart III-8Global Stock Market And Earnings: Relative Performance
Global Stock Market And Earnings: Relative Performance
Global Stock Market And Earnings: Relative Performance
FIXED INCOME: Chart III-9US Treasurys And Valuations
US Treasurys And Valuations
US Treasurys And Valuations
Chart III-10Yield Curve Slopes
Yield Curve Slopes
Yield Curve Slopes
Chart III-11Selected US Bond Yields
Selected US Bond Yields
Selected US Bond Yields
Chart III-1210-Year Treasury Yield Components
10-Year Treasury Yield Components
10-Year Treasury Yield Components
Chart III-13US Corporate Bonds And Health Monitor
US Corporate Bonds And Health Monitor
US Corporate Bonds And Health Monitor
Chart III-14Global Bonds: Developed Markets
Global Bonds: Developed Markets
Global Bonds: Developed Markets
Chart III-15Global Bonds: Emerging Markets
Global Bonds: Emerging Markets
Global Bonds: Emerging Markets
CURRENCIES: Chart III-16US Dollar And PPP
US Dollar And PPP
US Dollar And PPP
Chart III-17US Dollar And Indicator
US Dollar And Indicator
US Dollar And Indicator
Chart III-18US Dollar Fundamentals
US Dollar Fundamentals
US Dollar Fundamentals
Chart III-19Japanese Yen Technicals
Japanese Yen Technicals
Japanese Yen Technicals
Chart III-20Euro Technicals
Euro Technicals
Euro Technicals
Chart III-21Euro/Yen Technicals
Euro/Yen Technicals
Euro/Yen Technicals
Chart III-22Euro/Pound Technicals
Euro/Pound Technicals
Euro/Pound Technicals
COMMODITIES: Chart III-23Broad Commodity Indicators
Broad Commodity Indicators
Broad Commodity Indicators
Chart III-24Commodity Prices
Commodity Prices
Commodity Prices
Chart III-25Commodity Prices
Commodity Prices
Commodity Prices
Chart III-26Commodity Sentiment
Commodity Sentiment
Commodity Sentiment
Chart III-27Speculative Positioning
Speculative Positioning
Speculative Positioning
ECONOMY: Chart III-28US And Global Macro Backdrop
US And Global Macro Backdrop
US And Global Macro Backdrop
Chart III-29US Macro Snapshot
US Macro Snapshot
US Macro Snapshot
Chart III-30US Growth Outlook
US Growth Outlook
US Growth Outlook
Chart III-31US Cyclical Spending
US Cyclical Spending
US Cyclical Spending
Chart III-32US Labor Market
US Labor Market
US Labor Market
Chart III-33US Consumption
US Consumption
US Consumption
Chart III-34US Housing
US Housing
US Housing
Chart III-35US Debt And Deleveraging
US Debt And Deleveraging
US Debt And Deleveraging
Chart III-36US Financial Conditions
US Financial Conditions
US Financial Conditions
Chart III-37Global Economic Snapshot: Europe
Global Economic Snapshot: Europe
Global Economic Snapshot: Europe
Chart III-38Global Economic Snapshot: China
Global Economic Snapshot: China
Global Economic Snapshot: China
Jonathan LaBerge, CFA Vice President The Bank Credit Analyst Footnotes 1 Please see The Bank Credit Analyst "OUTLOOK 2022: Peak Inflation – Or Just Getting Started?", dated December 1, 2021, available at bca.bcaresearch.com 2 Early assessment of the clinical severity of the SARS-CoV-2 Omicron variant in South Africa by Wolter et al., medRxiv preprint, December 21, 2021. 3 Please see The Bank Credit Analyst “The Return To Maximum Employment: It May Be Faster Than You Think”, dated August 26, 2021, available at bca.bcaresearch.com 4 Please see US Bond Strategy “The Fed In 2022”, dated December 21, 2021, available at bca.bcaresearch.com 5 Opinion | Schumer and Sanders: Limit Corporate Stock Buybacks - The New York Times (nytimes.com) Accessed December 17, 2021. 6 https://www.bcg.com/about/overview/our-history/growth-share-matrix Accessed December 19, 2021. EQUITIES:FIXED INCOME:CURRENCIES:COMMODITIES:ECONOMY:
Dear Client, Thank you for your continued readership and support this year. This is the last European Investment Strategy report for 2021. In this piece, we review ten charts covering important aspects of the European economy and capital markets. We will resume our regular publishing schedule on January 10th, 2022. The European Investment Strategy team wishes you and your loved ones a wonderful holiday season, and a healthy, happy, and prosperous new year. Best regards, Mathieu Savary Highlights European growth continues to face headwinds as it enters 2022. The ECB will be slow to remove more accommodation than what is implied by the end of the PEPP. Value stocks and Italian equities will enjoy a modest tailwind from rising Bund yields. The lower quality of European stocks creates a long-term headwind versus US benchmarks. The outperformance of European cyclicals relative to defensives will resume and financials will have greater upside. The relative performance of small-cap stocks will soon stabilize, but a weak euro will create a near-term risk. President Emmanuel Macron’s real contender is the center-right candidate Valerie Pécresse, not populists. Feature Chart 1: Wave Dynamics The current wave of COVID-19 infections continues to surge in Europe. As Chart 1 highlights, Austria and the Netherlands just witnessed intense waves that eclipsed those experienced earlier this year. However, these waves are already ebbing because of the containment measures implemented in recent weeks. In these two severely hit nations, hospitalization rates also increased significantly; however, they did not reach the degree experienced in France or the UK in the first half of 2021 (Chart 1, right panel). Chart 1Wave Dynamics
Wave Dynamics I
Wave Dynamics I
Chart 1Wave Dynamics
Wave Dynamics II
Wave Dynamics II
Europe will experience another test in the coming weeks as the highly contagious Omicron variant becomes the dominant COVID-19 strain. However, data from South Africa continues to suggest that this mutation is much less pathogenic than previous variants and will not place as much strain on the healthcare system as potential case counts would indicate. Nonetheless, it is too early to make this prognosis with great confidence. Importantly, even if a small proportion of infected people is hospitalized, a large enough a pool of infections could cause a rupture in the healthcare system. As a result, politicians will likely remain cautious until a larger share of the population receives its booster dose. Hence, Omicron still represents a near-term risk to economic activity, albeit one that will prove ephemeral. Chart 2: The Economy Is Not Out Of The Woods Yet European growth remains highly dependent on the fluctuations of the global economy because exports and capex account for a large share of the continent’s output. Consequently, global economic trends remain paramount when considering the European economic outlook. In the near-term, Europe continues to face headwinds beyond the uncertainty caused by the potential effects of the Omicron variant. Global economic activity, for instance, is likely to face some further near-term headwinds caused by the supply shock typified by elevated commodity prices and bottlenecks (Chart 2). Not only does this shock limit the ability of producers to procure important inputs, but it also increases the costs of production. Historically, this combination results in downward pressure on global manufacturing activity. Chart 2The Economy Is Not Out Of The Woods Yet
The Economy Is Not Out Of The Woods Yet I
The Economy Is Not Out Of The Woods Yet I
Chart 2The Economy Is Not Out Of The Woods Yet
The Economy Is Not Out Of The Woods Yet II
The Economy Is Not Out Of The Woods Yet II
The second problem remains the deceleration in the Chinese economy. Declining credit growth in China results in slower European exports, which also hurts the region’s PMI. The recent Central Economic Work Conference suggests that China is ready to inject more stimulus in its economy, which will help Europe. However, the beginning of 2022 will still witness the lagged impact of previous tightening in credit conditions on European economic indicators. Moreover, BCA’s China Investment Strategy team expects the stimulus to be modest at first and only grow in intensity later. It is unlikely to be as credit-heavy as in the past, which also means it will be less beneficial to Europe. Chart 3: A Careful ECB Last week, the European Central Bank aggressively upgraded its inflation forecast for 2022 and announced the end of the PEPP for March, however, it will increase temporarily the APP program to EUR40bn. Moreover, President Christine Lagarde remains steadfast that the Governing Council will not raise rates in 2022. Our Central Bank Monitor points to the need for tighter policy, yet the ECB continues to adopt a cautious tone, even if the Eurozone HICP inflation has reached 4%—the highest reading in thirteen years. First, the ECB still runs the risk of dislocation in the periphery, where Italian and Spanish spreads may easily explode if monetary accommodation is removed too quickly. Second, European inflationary pressures remain significantly narrower than they are in the US (Chart 3, left panel). Our Eurozone trimmed-mean CPI continues to linger well below core CPI readings, while in the US both measures track each other closely. Third, the decline in energy prices and the ebbing transportation bottlenecks mean that odds are growing that sequential inflation will soon experience an interim peak (Chart 3, right panel). Chart 3A Careful ECB
A Careful ECB I
A Careful ECB I
Chart 3A Careful ECB
A Careful ECB II
A Careful ECB II
This view of the ECB implies that German yields will not rise as much as US yields next year, which BCA’s US Bond Strategy team expects to reach 2.25% by the end of 2022. Moreover, the more tepid pace of the removal of accommodation and the implicit targeting of peripheral bond markets also warrant an overweight position in Italian bonds. Spreads will be volatile, but any move upward will be self-limiting because of their role in the ECB’s reaction function. As a result, investors should continue to pocket the additional income over German paper. Chart 4: A Murky Outlook For The Euro The market continues to test EUR/USD. Any breakdown below 1.1175 is likely to prompt a pronounced down leg toward 1.07-1.08, near the pandemic lows. The euro suffers from three handicaps. First, Europe’s economic links with China are greater than those of the US with China. Consequently, the Chinese economic deceleration hurts European rates of returns more than it hurts those in the US. Second, the acceleration of US inflation is inviting investors to reprice the path of the Fed’s policy rate, which accentuates the upside pressure on the dollar. Finally, the energy crisis is ramping up anew following Germany’s suspension of the approval of the Nord Stream 2 pipeline and the buildup of Russian troops on Ukraine’s borders. Surging European natural gas prices act as a powerful headwind for EUR/USD because they accentuate stagflation risks in the Eurozone (Chart 4, left panel). While these create downside pressures on the euro, the picture is more complex. Our Intermediate-Term Timing Model shows that EUR/USD is one-sigma oversold (Chart 4, right panel). Over the past 20 years, it was more depressed only in 2010 and in early 2015. Such a reading indicates that most of the bad news is already embedded in EUR/USD and that sentiment has become massively negative. Thus, we are not chasing the euro lower, even though we will respect our stop-loss at 1.1175 if it were triggered. Instead, we will look to buy the euro at lower levels in the first quarter of 2021. Chart 4A Murky Outlook For The Euro
A Murky Outlook For The Euro I
A Murky Outlook For The Euro I
Chart 4A Murky Outlook For The Euro
A Murky Outlook For The Euro II
A Murky Outlook For The Euro II
Chart 5: German Yields Are Key To Value Stocks And Italian Equities The performance of European value stocks relative to that of growth stocks continues to exhibit a close relationship with the evolution of German Bund yields (Chart 5, left panel). Value stocks are less sensitive than growth stocks to higher yields because they derive a smaller proportion of their intrinsic value from long-term deferred cash flows; which suffer more from rising discount factors than near-term cash flows. Moreover, value stocks overweight financials, whose profitability increases when yields rise. The same relationship exists between the performance of Italian equities relative to the Eurozone benchmark (Chart 5, right panel). This correlation holds because of Italy’s significant value bias and its large exposure to financials. Chart 5German Yields Are Key To Value Stocks And Italian Equities
German Yields Are Key To Value Stocks And Italian Equities I
German Yields Are Key To Value Stocks And Italian Equities I
Chart 5German Yields Are Key To Value Stocks And Italian Equities
German Yields Are Key To Value Stocks And Italian Equities II
German Yields Are Key To Value Stocks And Italian Equities II
Based on these observations, BCA’s view that German Bund yields will rise toward 0.25% is consistent with a modest outperformance of value and Italian equities in 2022. For a more robust outperformance by value and Italian stocks, the Chinese economy will have to re-accelerate clearly and the dollar will have to fall significantly. However, these two outcomes could take more time to materialize than our bond view. Chart 6: Europe’s Quality Deficit The gyrations in the performance of European equities relative to US stocks continue to be influenced by China’s economic fluctuations. The deterioration in various measures of China’s credit impulse remains consistent with further near-term underperformance of European equities (Chart 6, left panel). Moreover, if Omicron has a significant impact on consumer behavior (via personal choices or government measures), it will once again hurt spending on services and boost the appeal of growth stocks, which Europe underrepresents. These headwinds will not be long lasting. Europe has an opportunity to outperform next year if global yields rise. However, European equity markets continue to suffer from a potent long-term disadvantage relative to those of the US. American benchmarks are composed of higher quality stocks than European ones. As a result of greater market concentration, more innovative applications of research, and the development of greater moats, US stocks generate wider profits margins than European companies and have a higher utilization of their asset base. Consequently, US shares sport significantly higher RoEs and earnings growth than European large-cap names (Chart 6, right panel). Historically, the quality factor has been one of the top performers and is an important contributor to the current strength of growth equities. Thus, even if Europe’s day in the sun arrives before the middle of 2022, it will again be a temporary phenomenon. Chart 6Europe’s Quality Deficit
Europe's Quality Deficit I
Europe's Quality Deficit I
Chart 6Europe’s Quality Deficit
Europe's Quality Deficit II
Europe's Quality Deficit II
Chart 7: Will the Cyclicals Outperformance Resume? For most of 2021, European cyclicals equities have not performed as well against defensive stocks as many investors hoped. In fact, the relative performance of cyclicals is broadly flat since March. Going forward, cyclicals will resume their uptrend against defensive equities and even break out of their range of the past twenty years. From a technical perspective, cyclicals have expunged many of their excesses. By the spring, European cyclicals had become prohibitively expensive compared to their defensive counterparts (Chart 7, left panel). However, their overvaluation has now passed and medium-term momentum measures are not overbought anymore, which creates a much better entry point for cyclical equities. From a fundamental perspective, cyclicals will also enjoy rising yields after being hamstrung by Treasury yields that have moved sideways for more than nine months (Chart 7, right panel). Moreover, the eventual stabilization of the Chinese economy will create an additional tailwind for these stocks. Chart 7Will The Cyclicals Outperformance Resume?
Will the Cyclicals Outperformance Resume? I
Will the Cyclicals Outperformance Resume? I
Chart 7Will The Cyclicals Outperformance Resume?
Will the Cyclicals Outperformance Resume? II
Will the Cyclicals Outperformance Resume? II
The biggest risk to cyclical stocks lies in inflation expectations. Ten-year CPI swaps have stopped increasing despite rising inflation. As the yield curve flattens and long-term segments of the OIS curve invert, markets register their fears that the Fed might tighten too much over the next two years. In other words, markets continue to agonize over the effect of a very low perceived terminal rate. These worries may cause the CPI swaps to decline significantly as the Fed hikes rates next year, creating a headwind for cyclicals. Chart 8: Favor Financials Financials in general and banks in particular have outperformed the European benchmark this year. This trend will persist in 2020. More than the positive impact of higher yields on the profitability of financials justifies this view. One of the key drivers supporting our optimism toward this sector is the continued improvement in the balance-sheet health of the European banking sector (Chart 8, left panel). Capital adequacy ratios remain in an uptrend and NPLs continue to be well-behaved. Meanwhile, both the governments’ liquidity support during the pandemic and the nonfinancial sector’s cash buildup over the past 18 months limit the risk that a brisk rise in insolvencies would threaten the viability of the banking system. European bank lending is also likely to remain superior to that of the post-GFC years. Consumer confidence is still sturdy, despite the recent increase in COVID cases and the tax hike created by rapidly climbing energy prices (Chart 8, right panel). Companies also benefit from an environment of low real rates and limited fiscal austerity. Unsurprisingly, capex intentions are elevated, which should support credit demand from businesses going forward. Chart 8Favor Financials
Favor Financials I
Favor Financials I
Chart 8Favor Financials
Favor Financials II
Favor Financials II
These factors imply that the current large discount embedded in European financials’ valuations remains excessive (even if a smaller discount is still warranted). As long as peripheral spreads do not blow out durably, financials will have scope to outperform further. Banks should also beat insurance companies. Chart 9: Small-Caps Are Nearly There Despite a sideways move followed by a 4% dip, the performance of European small-cap stocks remains in a pronounced uptrend relative to large-cap equities. The recent bout of underperformance is likely to end soon, unless a recession is around the corner. Small-cap stocks are becoming oversold (Chart 9, left panel) and will benefit from their pronounced procyclicality, especially if the recent improvement in global economic surprises continues next year. Moreover, above-trend European growth as well as an ECB that will maintain accommodative monetary conditions will combine to prevent a significant widening in European high-yield spreads, particularly once natural gas prices are turned down after the winter. This process will also help small-cap equities. The biggest risk for the European small-caps’ relative performance is the currency market. The relative performance of small-cap names is still closely correlated to the euro (Chart 9, right panel). As a result, if EUR/USD were to falter in the coming weeks, the underperformance of small-cap stocks could deepen. At the very least, small-cap stocks would languish before resuming their uptrend later in the year. Chart 9Small-Caps Are Nearly There
Small-Caps Are Nearly There I
Small-Caps Are Nearly There I
Chart 9Small-Caps Are Nearly There
Small-Caps Are Nearly There II
Small-Caps Are Nearly There II
Chart 10: A Risk to Macron’s Second Term The emergence of the new populist candidate Éric Zemmour has galvanized the media in recent weeks. However, he is very unlikely to pose a credible threat to French President Emmanuel Macron, unlike center-right candidate Valerie Pécresse, who just won the Les Républicains (LR) primary. In a Special Report published conjointly with our geopolitical strategists last summer, we identified the emergence of a single candidate able to unite the center-right as one of the biggest risks to Macron. As Chart 10 shows, Pécresse has made a comeback in the polls and is now expected to face Macron in the second round. According to an Elabe poll conducted after her victory in the primary, if the second round of the elections were held now, she would beat Macron.
Chart 10
Chart 10
Will Pécresse manage to keep her momentum going until April 2022? First, she has to ensure the center-right remains united behind her. Up until the primaries, the center-right was divided. While she won the primary by a wide margin, her main opponent Éric Ciotti won the first round (25.6%), and Michel Barnier as well as Xavier Bertrand came close behind, with 23.9% and 22.7% respectively. Second, Pécresse must work hard to prevent voters from succumbing to the siren songs of Zemmour and Marine Le Pen, or to lean toward former Prime Minister Phillippe Edouard, a declared supporter of Macron. Investors should ignore Le Pen and Eric Zemmour. The real threat to Macron lies in Valerie Pécresse’s ability to keep the center-right united under her banner. Considering that the center-left does not represent an option and that the far-right is entangled in a tug-of-war, there is a high probability that Pécresse will reach the second round. Footnotes Tactical Recommendations
Europe In Charts
Europe In Charts
Cyclical Recommendations
Europe In Charts
Europe In Charts
Structural Recommendations
Europe In Charts
Europe In Charts
Closed Trades Currency Performance Fixed Income Performance Equity Performance
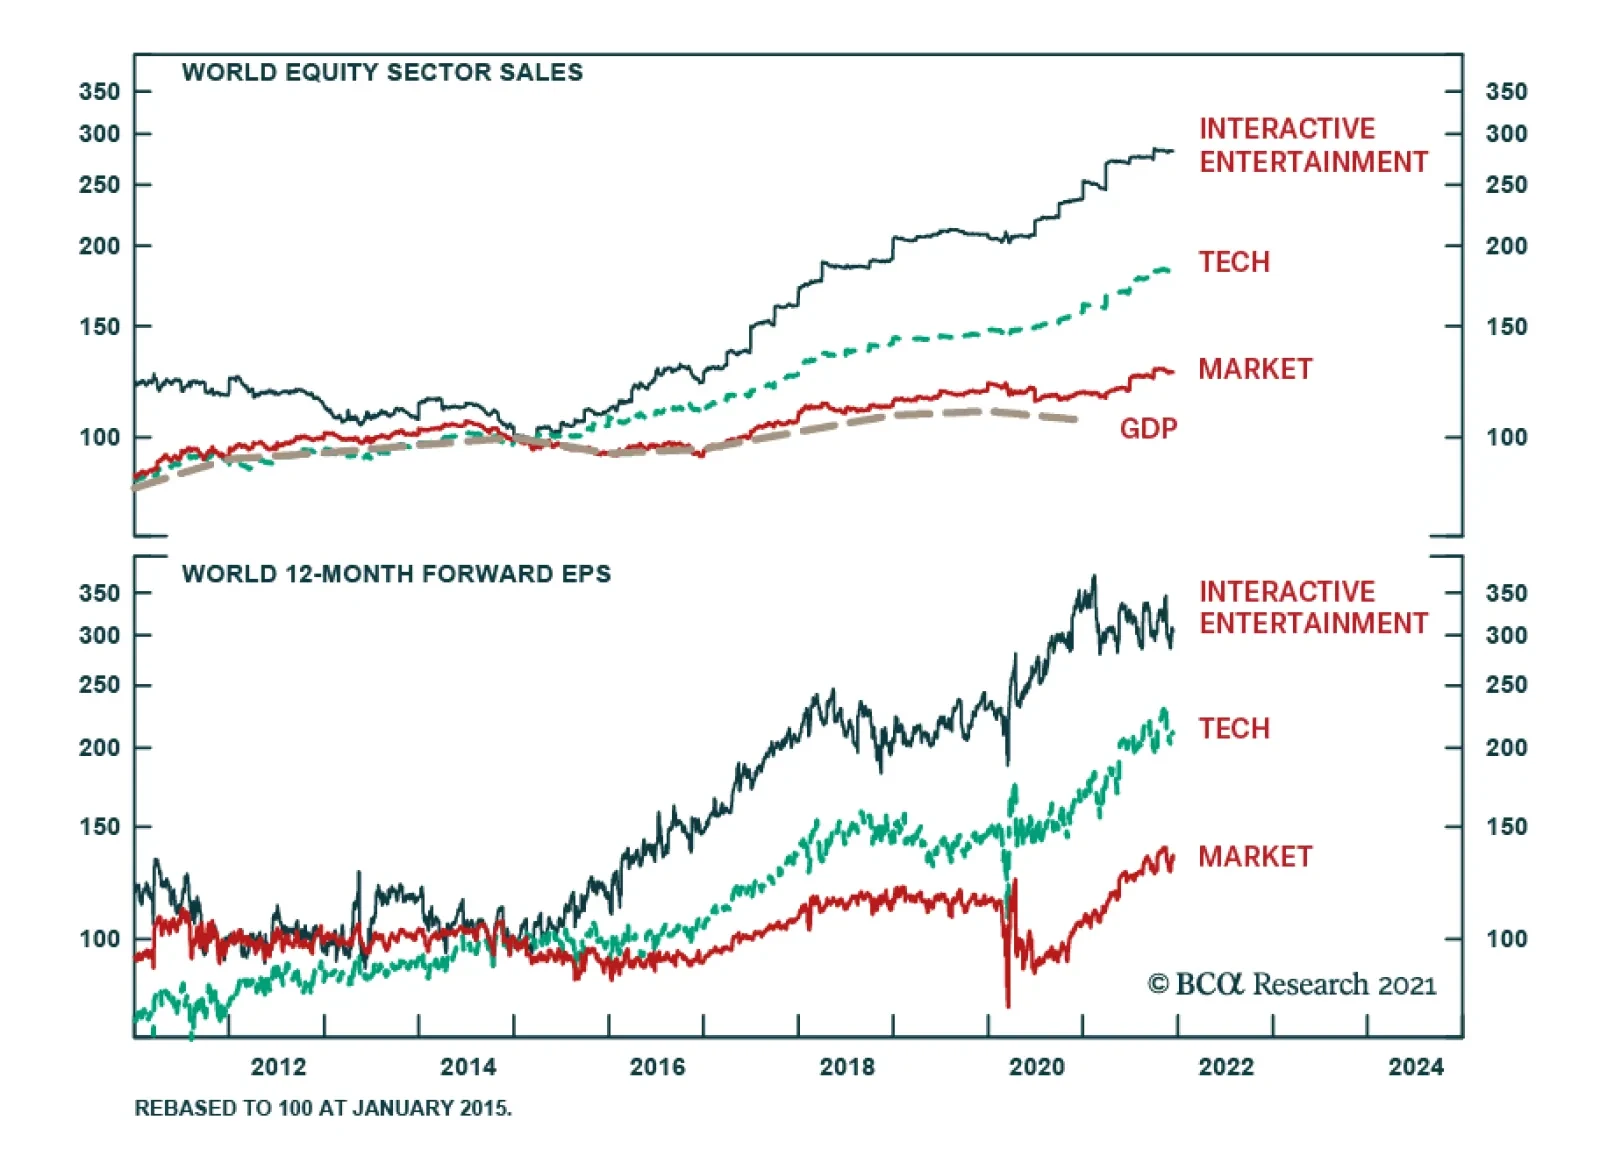
According to BCA Research’s Counterpoint service, this year’s sell-off in the interactive entertainment sector provides a good entry point for long-term investors. In the future, a typical day will be divided into three. A third we will spend sleeping and…
Highlights Long-only investors with a minimum horizon of two years should buy the interactive entertainment sector. Hedge fund investors with a minimum horizon of two years should go long interactive entertainment versus technology. Despite a trebling of sales since 2014, interactive entertainment comprises just 0.2 percent of world GDP, and just 0.3 percent of US consumer spending, providing scope for substantial further growth. Looking ahead, we identify four specific drivers of growth: cloud gaming, e-sports, 5G, and ‘gaming as a service’. After this year’s sell-off, the sector’s relative valuation has fallen below its long-term average. Even more striking, the sector now trades at a record 20 percent discount to the tech sector. Yet we think we can do better than the sector index and reveal our preferred basket of interactive entertainment stocks. Feature In the future, a typical day will be divided into three. A third we will spend sleeping and dreaming; a third we will spend in reality; and a third we will spend in virtual reality. Parents of teenagers may already recognise this pattern, and will certainly do so over the coming holiday season! But many people in their twenties and thirties are also spending more of their time in the virtual world entered through the portal of interactive entertainment (meaning video gaming, and we will use these terms interchangeably throughout this report). Since 2014, interactive entertainment has experienced explosive growth. Since 2014, interactive entertainment has experienced explosive growth. Sales have trebled, outperforming even the tech sector whose sales have doubled, and far outperforming the total stock market’s sales (and global GDP) which are up a sedate 30 percent (Chart I-1 and Chart I-2). Yet despite this explosive growth, interactive entertainment comprises just 0.2 percent of world GDP, and just 0.3 percent of US consumer spending, providing scope for substantial further growth (Chart I-3 and Chart I-4). Chart I-1Since 2014, Interactive Entertainment’s Sales Have Almost Trebled…
Since 2014, Interactive Entertainment's Sales Have Trebled...
Since 2014, Interactive Entertainment's Sales Have Trebled...
Chart I-2…And Its Profits Have More Than ##br##Trebled
...And Its Profits Have Quadrupled
...And Its Profits Have Quadrupled
Chart I-3
Chart I-4…And 0.3 Percent Of US Consumer Spending
...And 0.3 Percent Of US Consumer Spending
...And 0.3 Percent Of US Consumer Spending
Meanwhile, the interactive entertainment sector’s profit margin has also trended higher, to 14 percent. This compares with 16 percent for tech, and around 10 percent for the total stock market (Chart I-5). Chart I-5Interactive Entertainment’s Profit Margin Has Trended Higher
Interactive Entertainment's Profit Margin Has Trended Higher
Interactive Entertainment's Profit Margin Has Trended Higher
The combination of explosive sales growth and higher margins has resulted in spectacular profit growth. Interactive entertainment profits have skyrocketed by 250 percent, outperforming tech profits which are up 150 percent, and far outperforming total stock market profits which are up 50 percent. We expect this strong outperformance in profits to continue. Cloud Gaming, E-Sports, 5G, And ‘Gaming As A Service’ Will Drive Sales Growth Looking ahead, we identify four specific drivers of growth: cloud gaming, e-sports, 5G, and ‘gaming as a service’. Cloud gaming (gaming-on-demand) streams high quality interactive content that is running on remote servers, akin to how remote desktops work. Thereby, gamers can play using just a device and an internet connection. Cloud gaming displaces physical disks, powerful hardware, and the need to download games onto a platform – analogous to how the on-demand streaming of media and entertainment has displaced DVDs and cable TV. Cloud gaming benefits both content developers and players. Developers do not have to worry about piracy, illegal downloads or digital rights management. Players benefit from a high (and equal) server processing power, creating a level-playing field in games. Which brings us nicely to the second driver of growth: e-sports. E-sports refers to competitive video gaming, a sector which is experiencing massive growth. 175 colleges and universities have already become members of the National Association of Collegiate Esports (NACE), offering varsity e-sports programs, and recognizing student gamers through scholarship awards. E-sports are hugely popular not only for their competitive element but also for their opportunity for social engagement, albeit virtually. The third major driver of interactive entertainment profits is the widespread rollout of 5G cellular networks, which makes cloud gaming accessible to mobile devices, rather than just to consoles and PCs. Mobile gaming revenues have become the most powerful engine of growth. This is significant because revenues from mobile gaming have now overtaken the combined revenues from the console and PC platforms. As such, mobile gaming revenues have become the most powerful engine of growth (Chart I-6 and Chart I-7).
Chart I-6
Chart I-7
The fourth driver of profits is the ‘gaming as a service’ (GaaS) revenue model, which is analogous to the software industry’s standard ‘software as a service’ (SaaS) revenue model. Instead of a one-time sale, revenue comes from a continuous stream of in-game sales and subscriptions. For example, Activision Blizzard’s doubling of revenues since 2014 has come mostly from in-game subscriptions. Product sales now comprise less than 30 percent of total revenues (Chart I-8).
Chart I-8
As well as being a major contributor to strong sales growth, GaaS boosts profit margins by lengthening the sales derived from the fixed costs of developing a given game. But Isn’t Video Gaming An Unhealthy Addiction? In 2018, the World Health Organization recognized 'gaming disorder' as an addictive behaviour and has officially defined it in the 11th Revision of the International Classification of Diseases (ICD-11). Then in August this year, the Chinese government imposed harsh restrictions on video gaming for minors. Under-18s can play video games for a maximum of three hours a week, one hour each on Friday, Saturday, and Sunday. These developments beg the question, is the interactive entertainment sector exposed to significant regulatory risks? The crackdown and regulation of illicit activities should be welcomed, not feared. China’s crackdown on video gaming for minors is consistent with its other crackdowns – for example, on cryptocurrencies – that decree that ‘the Chinese government knows what’s best for its people.’ However, libertarian western economies are unlikely to follow suit. In any case, even the World Health Organization concedes that gaming disorder affects only a small proportion of people. Another regulatory issue is so-called ‘gamblification’. Popularly known as loot boxes, or mystery boxes, the contents of some in-game virtual goods are unknown to gamers who purchase them in the hopes of attaining rare items that boast high in-game utility. The features resemble gambling and raise concerns of predatory monetization. Calls for regulatory action refer to gamblification as a contributing cause to gaming disorder. Still, such features are not significant enough in most games to change the structural outlook. A final putative concern is that in-game tradable virtual currencies create a haven for cyber criminals and money launderers. The solution could be know-your-customer (KYC) and anti-money laundering (AML) regulations akin to those in the online gambling/betting industry. Ultimately, just as in the cryptocurrency space, and indeed the internet space, the crackdown and regulation of illicit activities should be welcomed, not feared. As such, it strengthens rather than weakens the structural outlook. The Investment Case This year’s sell-off in the interactive entertainment sector provides a good entry point for long-term investors (Chart I-9). The sell-off was exacerbated by two bits of bad news: first, the revelation of a toxic and sexist workplace culture at Activision Blizzard – since when the company has suffered a wave of bad publicity, numerous resignations, and a 40 percent plunge in its stock price; then, the Chinese crackdown on video gaming for minors. Chart I-9Interactive Entertainment’s Recent Sell-Off Provides A Good Long-Term Entry Point
Interactive Entertainment's Recent Sell-Off Provides A Good Long-Term Entry Point
Interactive Entertainment's Recent Sell-Off Provides A Good Long-Term Entry Point
Both items of bad news seem well discounted. The sector’s relative valuation to the market has fallen below its long-term average. Even more striking, the sector now trades at a record 20 percent discount to the tech sector (Chart I-10 and Chart I-11). Chart I-10Interactive Entertainment Now Trades At A 20 Percent Discount To Technology…
Interactive Entertainment Now Trades At A 20 Percent Discount To Technology...
Interactive Entertainment Now Trades At A 20 Percent Discount To Technology...
Chart I-11…And Its Relative Valuation To The Market Is Below The Long-Term Average
...And Its Relative Valuation To The Market Is Below The Long-Term Average
...And Its Relative Valuation To The Market Is Below The Long-Term Average
Given that the structural outlook for the sector’s sales and profits remains intact, long-only investors with a minimum horizon of two years should buy the interactive entertainment sector (Table I-1). Hedge fund investors with a minimum horizon of two years should go long interactive entertainment versus technology.
Chart I-
Yet we think we can do better than the sector index by filtering out the riskiest stocks, based on overvaluation, commercial risk, and regulatory risk. For example, we exclude the Chinese stocks that are most exposed to the Chinese government crackdown and future whims. Long-only investors with a minimum horizon of two years should buy the interactive entertainment sector. On this basis, our interactive entertainment basket comprises: (Table I-2).
Chart I-
Nintendo Activision Blizzard Electronic Arts Zynga Konami Capcom Square Enix This is the final Counterpoint report of the year. We wish you all a very happy and restful holiday season. Dhaval Joshi Chief Strategist dhaval@bcaresearch.com Mohamed El Shennawy Research Associate mohamede@bcaresearch.com
Image
Almost two years ago, the Fed and other Central Banks (CBs) flooded the market with liquidity in an attempt to help the global economy and the financial sector to battle the pandemic. One of the unintended consequences of the said liquidity flood was a rally in the most speculative parts of the US equity market, such as small caps growth technology stocks, which are akin to lottery tickets and attract a disproportionate share of retail flows. Today, the situation could not be any different with more CBs tightening policy, the Fed discussing an accelerated taper program, and the market pricing in three rate hikes in 2022. Consequently, investors are now shedding their exposure to the most speculative assets with BTC, ARKK, and small caps growth being in an outright bear market. Given that we are still in the early innings of the tightening cycle, things are likely to get worse before they get better. Bottom Line: As global growth decelerates over the coming quarters, the Fed will be the final nail into the retail-heavy speculative assets’ coffin (see chart).
Highlights Our three strategic themes over the long run: (1) great power rivalry (2) hypo-globalization (3) populism and nationalism. The implications are inflationary over the long run. Nations that gear up for potential conflict and expand the social safety net to appease popular discontent will consume a lot of resources. Our three key views for 2022: (1) China’s reversion to autocracy (2) America’s policy insularity (3) petro-state leverage. The implications are mostly but not entirely inflationary: China will ease policy, the US will pass more stimulus, and energy supply may suffer major disruptions. Stay long gold, neutral US dollar, short renminbi, and short Taiwanese dollar. Stay tactically long global large caps and defensives. Buy aerospace/defense and cyber-security stocks. Go long Japanese and Mexican equities – both are tied to the US in an era of great power rivalry. Feature Chart 1US Resilience
US Resilience
US Resilience
Global investors have not yet found a substitute for the United States. Despite a bout of exuberance around cyclical non-US assets at the beginning of 2021, the year draws to a close with King Dollar rallying, US equities rising to 61% of global equity capitalization, and the US 30-year Treasury yield unfazed by inflation fears (Chart 1). American outperformance is only partly explained by its handling of the lingering Covid-19 pandemic. The US population was clearly less restricted by the virus (Chart 2). But more to the point, the US stimulated its economy by 25% of GDP over the course of the crisis, while the average across major countries was 13% of GDP. Americans are still more eager to go outdoors and the government has been less stringent in preventing them (Chart 3).
Chart 2
Chart 3Social Restrictions Short Of Lockdown
Social Restrictions Short Of Lockdown
Social Restrictions Short Of Lockdown
Going forward, the pandemic should decline in relevance, though it is still possible that a vaccine-resistant mutation will arise that is deadlier for younger people, causing a new round of the crisis. The rotation into assets outside the US will be cautious. Across the world, monetary and credit growth peaked and rolled over this year, after the extraordinary effusion of stimulus to offset the social lockdowns of 2020 (Chart 4). Government budget deficits started to normalize while central banks began winding down emergency lending and bond-buying. More widespread and significant policy normalization will get under way in 2022 in the face of high core inflation. Tightening will favor the US dollar, especially if global growth disappoints expectations. Chart 4Waning Monetary And Credit Stimulus
Waning Monetary And Credit Stimulus
Waning Monetary And Credit Stimulus
Chart 5Global Growth Stabilization
Global Growth Stabilization
Global Growth Stabilization
Global manufacturing activity fell off its peak, especially in China, where authorities tightened monetary, fiscal, and regulatory policy aggressively to prevent asset bubbles from blowing up (Chart 5). Now China is easing policy on the margin, which should shore up activity ahead of an important Communist Party reshuffle in fall 2022. The rest of the world’s manufacturing activity is expected to continue expanding in 2022, albeit less rapidly. This trend cuts against US outperformance but still faces a range of hurdles, beginning with China. In this context, we outline three geopolitical themes for the long run as well as three key views for the coming 12 months. Our title, “The Gathering Storm,” refers to the strategic challenge that China and Russia pose to the United States, which is attempting to form a balance-of-power coalition to contain these autocratic rivals. This is the central global geopolitical dynamic in 2022 and it is ultimately inflationary. Three Strategic Themes For The Long Run The international system will remain unstable in the coming years. Global multipolarity – or the existence of multiple, competing poles of political power – is the chief destabilizing factor. This is the first of our three strategic themes that will persist next year and beyond (Table 1). Our key views for 2022, discussed below, flow from these three strategic themes. Table 1Strategic Themes For 2022 And Beyond
2022 Key Views: The Gathering Storm
2022 Key Views: The Gathering Storm
1. Great Power Rivalry Multipolarity – or great power rivalry – can be illustrated by the falling share of US economic clout relative to the rest of the world, including but not limited to strategic rivals like China. The US’s decline is often exaggerated but the picture is clear if one looks at the combined geopolitical influence of the US and its closest allies to that of the EU, China, and Russia (Chart 6).
Chart 6
China’s rise is the most destabilizing factor because it comes with economic, military, and technological prowess that could someday rival the US for global supremacy. China’s GDP has surpassed that of the US in purchasing power terms and will do so in nominal terms in around five years (Chart 7).
Chart 7
True, China’s potential growth is slowing and Chinese financial instability will be a recurring theme. But that very fact is driving Beijing to try to convert the past 40 years of economic success into broader strategic security. Chart 8America's Global Role Persists (If Lessened)
America's Global Role Persists (If Lessened)
America's Global Role Persists (If Lessened)
Since China is capable of creating an alternative political order in Asia Pacific, and ultimately globally, the United States is reacting. It is penalizing China’s economy and seeking to refurbish alliances in pursuit of a containment policy. The American reaction to the loss of influence has been unpredictable, contradictory, and occasionally belligerent. New isolationist impulses have emerged among an angry populace in reaction to gratuitous wars abroad and de-industrialization. These impulses appeared in both the Obama and Trump administrations. The Biden administration is attempting to manage these impulses while also reinforcing America’s global role. The pandemic-era stimulus has enabled the US to maintain its massive trade deficit and aggressive defense spending. But US defense spending is declining relative to the US and global economy over time, encouraging rival nations to carve out spheres of influence in their own neighborhoods (Chart 8). Russia’s overall geopolitical power has declined but it punches above its weight in military affairs and energy markets, a fact which is vividly on display in Ukraine as we go to press. The result is to exacerbate differences in the trans-Atlantic alliance between the US and the European Union, particularly Germany. The EU’s attempt to act as an independent great power is another sign of multipolarity, as well as the UK’s decision to distance itself from the continent and strengthen the Anglo-American alliance. If the US and EU do not manage their differences over how to handle Russia, China, and Iran then the trans-Atlantic relationship will weaken and great power rivalry will become even more dangerous. 2. Hypo-Globalization The second strategic theme is hypo-globalization, in which the ancient process of globalization continues but falls short of its twenty-first century potential, given advances in technology and governance that should erode geographic and national boundaries. Hypo-globalization is the opposite of the “hyper-globalization” of the 1990s-2000s, when historic barriers to the free movement of people, goods, and capital seemed to collapse overnight. Chart 9From 'Hyper-Globalization' To Hypo-Globalization
From 'Hyper-Globalization' To Hypo-Globalization
From 'Hyper-Globalization' To Hypo-Globalization
The volume of global trade relative to industrial production peaked with the Great Recession in 2008-10 and has declined slowly but surely ever since (Chart 9). Many developed markets suffered the unwinding of private debt bubbles, while emerging economies suffered the unwinding of trade manufacturing. Periods of declining trade intensity – trade relative to global growth – suggest that nations are turning inward, distrustful of interdependency, and that the frictions and costs of trade are rising due to protectionism and mercantilism. Over the past two hundred years globalization intensified when a broad international peace was agreed (such as in 1815) and a leading imperial nation was capable of enforcing law and order on the seas (such as the British empire). Globalization fell back during times of “hegemonic instability,” when the peace settlement decayed while strategic and naval competition eroded the global trading system. Today a similar process is unfolding, with the 1945 peace decaying and the US facing the revival of Russia and China as regional empires capable of denying others access to their coastlines and strategic approaches (Chart 10).1 Chart 10Hypo-Globalization And Hegemonic Instability
Hypo-Globalization And Hegemonic Instability
Hypo-Globalization And Hegemonic Instability
Chart 11Hypo-Globalization: Temporary Trade Rebound
Hypo-Globalization: Temporary Trade Rebound
Hypo-Globalization: Temporary Trade Rebound
No doubt global trade is rebounding amid the stimulus-fueled recovery from Covid-19. But the upside for globalization will be limited by the negative geopolitical environment (Chart 11). Today governments are not behaving as if they will embark on a new era of ever-freer movement and ever-deepening international linkages. They are increasingly fearful of each other’s strategic intentions and using fiscal resources to increase economic self-sufficiency. The result is regionalization rather than globalization. Chinese and Russian attempts to revise the world order, and the US’s attempt to contain them, encourages regionalization. For example, the trade war between the US and China is morphing into a broader competition that limits cooperation to a few select areas, despite a change of administration in the United States. The further consolidation of President Xi Jinping’s strongman rule will exacerbate this dynamic of distrust and economic divorce. Emerging Asia and emerging Europe live on the fault lines of this shift from globalization to regionalism, with various risks and opportunities. Generally we are bullish EM Asia and bearish EM Europe. 3. Populism And Nationalism A third strategic theme consists of populism and nationalism, or anti-establishment political sentiment in general. These forces will flare up in various forms across the world in 2022 and beyond. Even as unemployment declines, the rise in food and fuel inflation will make it difficult for low wage earners to make ends meet. The “misery index,” which combines unemployment and inflation, spiked during the pandemic and today stands at 10.8% in the US and 11.4% in the EMU, up from 5.2% and 8.1% before the pandemic, respectively (Chart 12). Large budget deficits and trade deficits, especially in the US and UK, feed into this inflationary environment. Most of the major developed markets have elected new governments since the pandemic, with the notable exception of France and Spain. Thus they have recapitalized their political systems and allowed voters to vent some frustration. These governments now have some time to try to mitigate inflation before the next election. Hence policy continuity is not immediately in jeopardy, which reduces uncertainty for investors. By contrast, many of the emerging economies face higher inflation, weak growth, and are either coming upon elections or have undemocratic political systems. Either way the result will be a failure to address household grievances promptly. The misery index is trending upward and governments are continually forced to provide larger budget deficits to shore up growth, fanning inflation (Chart 13). Chart 12DM: Political Risk High But New Governments In Place
DM: Political Risk High But New Governments In Place
DM: Political Risk High But New Governments In Place
Chart 13EM: Political Risk High But Governments Not Recapitalized
EM: Political Risk High But Governments Not Recapitalized
EM: Political Risk High But Governments Not Recapitalized
Chart 14EM Populism/Nationalism Threatens Negative Surprises In 2022
EM Populism/Nationalism Threatens Negative Surprises In 2022
EM Populism/Nationalism Threatens Negative Surprises In 2022
Just as social and political unrest erupted after the Great Recession, notably in the so-called “Arab Spring,” so will new movements destabilize various emerging markets in the wake of Covid-19. Regime instability and failure can lead to big changes in policies, large waves of emigration, wars, and other risks that impact markets. The risks are especially high unless and until Chinese imports revive. Investors should be on the lookout for buying opportunities in emerging markets once the bad news is fully priced. National and local elections in Brazil, India, South Korea, the Philippines, and Turkey will serve as market catalysts, with bad news likely to precede good news (Chart 14). Bottom Line: These three themes – great power rivalry, hypo-globalization, and populism/nationalism – are inflationary in theory, though their impact will vary based on specific events. Multipolarity means that governments will boost industrial and defense spending to gear up for international competition. Hypo-globalization means countries will attempt to put growth on a more reliable domestic foundation rather than accept dependency on an unreliable international scene, thus constraining supplies from abroad. Populism and nationalism will lead to a range of unorthodox policies, such as belligerence abroad or extravagant social spending at home. Of course, the inflationary bias of these themes can be upset if they manifest in ways that harm growth and/or inflation expectations, which is possible. But the general drift will be an inflationary policy setting. Inflation may subside in 2022 only to reemerge as a risk later. Three Key Views For 2022 Within this broader context, our three key views for 2022 are as follows: 1. China’s Reversion To Autocracy As President Xi Jinping leads China further down the road of strongman rule and centralization, the country faces a historic confluence of internal and external risks. This was our top view in 2021 and the same dynamic continues in 2022. The difference is that in 2021 the risk was excessive policy tightening whereas this coming year the risk is insufficient policy easing. Chart 15China Eases Fiscal Policy To Secure Recovery In 2022
China Eases Fiscal Policy To Secure Recovery In 2022
China Eases Fiscal Policy To Secure Recovery In 2022
China’s economy is witnessing a secular slowdown, a deterioration in governance, property market turmoil, and a rise in protectionism abroad. The long decline in corporate debt growth points to the structural slowdown. Animal spirits will not improve in 2022 so government spending will be necessary to try to shore up overall growth. The Politburo signaled that it will ease fiscal policy at the Central Economic Work Conference in early December, a vindication of our 2021 view. Neither the combined fiscal-and-credit impulse nor overall activity, indicated by the Li Keqiang Index, have shown the slightest uptick yet (Chart 15). Typically it takes six-to-nine months for policy easing to translate to an improvement in real economic activity. The first half of the year may still bring economic disappointments. But policymakers are adjusting to avoid a crash. Policy will grow increasingly accommodative as necessary in the first half of 2022. The key political constraint is the Communist Party’s all-important political reshuffle, the twentieth national party congress, to be held in fall 2022 (usually October). While Xi may not want the economy to surge in 2022, he cannot afford to let it go bust. The experience of previous party congresses shows that there is often a policy-driven increase in bank loans and fixed investment. Current conditions are so negative as to ensure that the government will provide at least some support, for instance by taking a “moderately proactive approach” to infrastructure investment (Chart 16). Otherwise a collapse of confidence would weaken Xi’s faction and give the opposition faction a chance to shore up its position within the Communist Party. Chart 16China Aims For Stability, Not Rapid Growth, Ahead Of 20th National Party Congress
China Aims For Stability, Not Rapid Growth, Ahead Of 20th National Party Congress
China Aims For Stability, Not Rapid Growth, Ahead Of 20th National Party Congress
Party congresses happen every five years but the ten-year congresses, such as in 2022, are the most important for the country’s overall political leadership. The party congresses in 1992, 2002, and 2012 were instrumental in transferring power from one leader to the next, even though the transfer of power was never formalized. Back in 2017 Xi arranged to stay in power indefinitely but now he needs to clinch the deal, lest any unforeseen threat emerge from at home or abroad. Xi’s success in converting the Communist Party from “consensus rule” to his own “personal rule” will be measurable by his success in stacking the Politburo and Politburo Standing Committee with factional allies. He will also promote his faction across the Central Committee so as to shape the next generations of party leaders and leave his imprint on policy long after his departure. The government will be extremely sensitive to any hint of dissent or resistance and will move aggressively to quash it. Investors should not be surprised to see high-level sackings of public officials or private magnates and a steady stream of scandals and revelations that gain prominence in western media. The environment is also ripe for strange and unexpected incidents that reveal political differences beneath the veneer of unity in China: defections, protests, riots, terrorist acts, or foreign interference. Most incidents will be snuffed out quickly but investors should be wary of “black swans” from China in 2022. Chinese government policies will not be business friendly in 2022 aside from piecemeal fiscal easing. Everything Beijing does will be bent around securing Xi’s supremacy at all levels. Domestic politics will take precedence over economic concerns, especially over the interests of private businesses and foreign investors, as is clear when it comes to managing financial distress in the property sector. Negative regulatory surprises and arbitrary crackdowns on various industrial sectors will continue, though Beijing will do everything in its power to prevent the property bust from triggering contagion across the economic system. This will probably work, though the dam may burst after the party congress. Relations with the US and the West will remain poor, as the democracies cannot afford to endorse what they see as Xi’s power grab, the resurrection of a Maoist cult of personality, and the betrayal of past promises of cooperation and engagement. America’s midterm election politics will not be conducive to any broad thaw in US-China relations. While China will focus on domestic politics, its foreign policy actions will still prove relatively hawkish. Clashes with neighbors may be instigated by China to warn away any interference or by neighbors to try to embarrass Xi Jinping. The South and East China Seas are still ripe for territorial disputes to flare. Border conflicts with India are also possible. Taiwan remains the epicenter of global geopolitical risk. A fourth Taiwan Strait Crisis looms as China increases its military warnings to Taiwan not to attempt anything resembling independence (Chart 17A). China may use saber-rattling, economic sanctions, cyber war, disinformation, and other “gray zone” tactics to undermine the ruling party ahead of Taiwan’s midterm elections in November 2022 and presidential elections in January 2024. A full-scale invasion cannot be ruled out but is unlikely in the short run, as China still has non-military options to try to arrange a change of policy in Taiwan.
Chart 17
Chart 17BMarket-Based Risk Indicators Say China/Taiwan Risk Has Not Peaked
Market-Based Risk Indicators Say China/Taiwan Risk Has Not Peaked
Market-Based Risk Indicators Say China/Taiwan Risk Has Not Peaked
China has not yet responded to the US’s deployment of a small number of troops in Taiwan or to recent diplomatic overtures or arms sales. It could stage a major show of force against Taiwan to help consolidate power at home. China also has an interest in demonstrating to US allies and partners that their populations and economies will suffer if they side with Washington in any contingency. Given China’s historic confluence of risks, it is too soon for global investors to load up on cheap Chinese equities. Volatility will remain high. Weak animal spirits, limited policy easing, high levels of policy uncertainty, regulatory risk, ongoing trade tensions, and geopolitical risks suggest that investors should remain on the sidelines, and that a large risk premium can persist throughout 2022. Our market-based geopolitical risk indicators for both China and Taiwan are still trending upwards (Chart 17B). Global investors should capitalize on China’s policy easing indirectly by investing in commodities, cyclical equity sectors, and select emerging markets. 2. America’s Policy Insularity Our second view for 2022 centers on the United States, which will focus on domestic politics and will thus react or overreact to the many global challenges it faces. The US faces the first midterm election after the chaotic and contested 2020 presidential election. Political polarization remains at historically high levels, meaning that social unrest could flare up again and major domestic terrorist incidents cannot be ruled out. So far the Biden administration has focused on the domestic scene: mitigating the pandemic and rebooting the economy. Biden’s signature “Build Back Better” bill, $1.75 trillion investment in social programs, has passed the House of Representatives but not the Senate. The spike in inflation has shaken moderate Democratic senators who are now delaying the bill. We expect it to pass, since tax hikes were dropped, but our conviction is low (65% subjective odds), as a single defection would derail the bill. The implication would be inflationary since it would mark a sizable increase in government spending at a time when the output gap is already virtually closed. Spending would likely be much larger than the Congressional Budget Office estimate, shown in Chart 18, because the bill contains various gimmicks and hard-to-implement expiration clauses. Equity markets may not sell if the bill fails, since more fiscal stimulus would put pressure on the Federal Reserve to hike rates faster.
Chart 18
Chart 19
Whether the bill passes or fails, Biden’s legislative agenda will be frozen thereafter. He will have to resort to executive powers and foreign policy to lift his approval rating and court the median voter ahead of the midterm elections. Currently Democrats are lined up to lose the House and probably also the Senate, where a single seat would cost them their majority (Chart 19). The Senate is still in play so Biden will be averse to taking big risks. For the same reason, Biden’s foreign policy goal will be to stave off various bubbling crises. Restoring the Iranian nuclear deal was his priority but Russia has now forced its way to the top of the agenda by threatening a partial reinvasion of Ukraine. In this context Biden will not have room for maneuver with China. Congress will be hawkish on China ahead of the midterms, and Xi Jinping will be reviving autocracy, so Biden will not be able to improve relations much. Biden’s domestic policy could fuel inflation, while his domestic-focused foreign policy will embolden strategic rivals, which increases geopolitical risks. 3. Petro-State Leverage A surge in gasoline prices at the pump ahead of the election would be disastrous for a Democratic Party that is already in disarray over inflation (Chart 20). Biden has already demonstrated that he can coordinate an international release of strategic oil reserves this year. Oil and natural gas producers gain leverage when the global economy rebounds, commodity prices rise, and supply/demand balances tighten. The frequency of global conflicts, especially those involving petro-states, tend to rise and fall in line with oil prices (Chart 21). Chart 20Inflation Constrains Biden Ahead Of Midterms
Inflation Constrains Biden Ahead Of Midterms
Inflation Constrains Biden Ahead Of Midterms
Chart 21
Both Russia and Iran are vulnerable to social unrest at home and foreign strategic pressure abroad. Both have long-running conflicts with the US and West that are heating up for fundamental reasons, such as Russia’s fear of western influence in the former Soviet Union and Iran’s nuclear program. Both countries are demanding that the US make strategic concessions to atone for the Trump administration’s aggressive policies: selling lethal weapons to Ukraine and imposing “maximum pressure” sanctions on Iran. Biden is not capable of making credible long-term agreements since he could lose office as soon as 2025 and the next president could reverse whatever he agrees. But he must try to de-escalate these conflicts or else he faces energy shortages or price shocks, which would raise the odds of stagflation ahead of the election. The path of least resistance for Biden is to lift the sanctions on Iran to prevent an escalation of the secret war in the Middle East. If this unilateral concession should convince Iran to pause its nuclear activities before achieving breakout uranium enrichment capability, then Biden would reduce the odds of a military showdown erupting across the region. Opposition Republicans would accuse him of weakness but public opinion polls show that few Americans consider Iran a major threat. The problem is that this logic held throughout 2021 and yet Biden did not ease the sanctions. Given Iran’s nuclear progress and the US’s reliance on sanctions, we see a 40% chance of a military confrontation with Iran over the coming years. With regard to Ukraine, an American failure to give concessions to Russia will probably result in a partial reinvasion of Ukraine (50% subjective odds). This in turn will force the US and EU to impose sanctions on Russia, leading to a squeeze of natural gas prices in Europe and eventually price pressures in global energy markets. If Biden grants Russia’s main demands, he will avoid a larger war or energy shock but will make the US vulnerable to future blackmail. He will also demoralize Taiwan and other US partners who lack mutual defense treaties. But he may gain Russian cooperation on Iran. If Biden gives concessions to both Russia and Iran, his party will face criticism in the midterms but it will be far less vulnerable than if an energy shock occurs. This is the path of least resistance for Biden in 2022. It means that the petro-states may lose their leverage after using it, given that risk premiums would fall on Biden’s concessions. Of course, if energy shocks happen, Europe and China will suffer more than the US, which is relatively energy independent. For this reason Brussels and Beijing will try to keep diplomacy alive as long as possible. Enforcement of US sanctions on Iran may weaken, reducing Iran’s urgency to come into compliance. Germany may prevent a hardline threat of sanctions against Russia, reducing Russia’s fear of consequences. Again, petro-states have the leverage. Therefore investors should guard against geopolitically induced energy price spikes or shocks in 2022. What if other commodity producers, such as Saudi Arabia, crank up production and sink oil prices? This could happen. Yet the Saudis prefer elevated oil prices due to the host of national challenges they face in reforming their economy. If the US eases sanctions on Iran then the Saudis may make this decision. Thus downside energy price shocks are possible too. The takeaway is energy price volatility but for the most part we see the risk as lying to the upside. Investment Takeaways Traditional geopolitical risk, which focuses on war and conflict, is measurable and has slipped since 2015, although it has not broken down from the general uptrend since 2000. We expect the secular trend to be reaffirmed and for geopolitical risk to resume its rise due to the strategic themes and key views outlined above. The correlation of geopolitical risk with financial assets is debatable – namely because some geopolitical risks push up oil and commodity prices at the expense of the dollar, while others cause a safe-haven rally into the dollar (Chart 22). Global economic policy uncertainty is also measurable. It is in a secular uptrend since the 2008 financial crisis. Here the correlation with the US dollar and relative equity performance is stronger, which makes sense. This trend should also pick up going forward, which is at least not negative for the dollar and relative US equity performance (Chart 23). Chart 22Geopolitical Risk Will Rise, Market Impacts Variable
Geopolitical Risk Will Rise, Market Impacts Variable
Geopolitical Risk Will Rise, Market Impacts Variable
Chart 23Economic Policy Uncertainty Will Rise, Not Bad For US Assets
Economic Policy Uncertainty Will Rise, Not Bad For US Assets
Economic Policy Uncertainty Will Rise, Not Bad For US Assets
We are neutral on the US dollar versus the euro and recommend holding either versus the Chinese renminbi. We are short the currencies of emerging markets that suffer from great power rivalry, namely the Taiwanese dollar versus the US dollar, the Korean won versus the Japanese yen, the Russian ruble versus the Canadian dollar, and the Czech koruna versus the British pound. We remain long gold as a hedge against both geopolitical risk and inflation. We recommend staying long global equities. Tactically we prefer large caps and defensives. Within developed markets, we favor the UK and Japan. Japan in particular will benefit from Chinese policy easing yet remains more secure from China-centered geopolitical risks than emerging Asian economies. Within emerging markets, Mexico stands to benefit from US economic strength and divorce from China. We would buy Indian equities on weakness and sell Chinese and Russian equities on strength. We remain long aerospace and defense stocks and cyber-security stocks. -The GPS Team We Read (And Liked) … Conspiracy U: A Case Study “Crazy, worthless, stupid, made-up tales bring out the demons in susceptible, unthinking people.” Thus the author’s father, a Holocaust survivor translated from Yiddish, on conspiracy theories and the real danger they present in the world. Scott A. Shay, author and chairman of Signature Bank, whose first book was a finalist for the National Jewish Book Award, has written an intriguing new book on the topic and graciously sent it our way.2 Shay is a regular reader of BCA Research’s Geopolitical Strategy and an astute observer of international affairs. He is also a controversialist who has written essays for several of America’s most prominent newspapers. Shay’s latest, Conspiracy U, is a bracing read that we think investors will benefit from. We say this not because of its topical focus, which is too confined, but because of its broader commentary on history, epistemology, the US higher education system – and the very timely and relevant problem of conspiracy theories, which have become a prevalent concern in twenty-first century politics and society. The author and the particular angle of the book will be controversial to some readers but this very quality makes the book well-suited to the problem of the conspiracy theory, since it is not the controversial nature of conspiracy theories but their non-falsifiability that makes them specious. As the title suggests, the book is a polemical broadside. The polemic arises from Shay’s unique set of moral, intellectual, and sociopolitical commitments. This is true of all political books but this one wears its topicality on its sleeve. The term “conspiracy” in the title refers to antisemitic, anti-Israel, and anti-Zionist conspiracy theories, particularly the denial of the Holocaust, coming from tenured academics on both the right and the left wings of American politics. The “U” in the title refers to universities, namely American universities, with a particular focus on the author’s beloved alma mater, Northwestern University in Chicago, Illinois. Clearly the book is a “case study” – one could even say the prosecution of a direct and extended public criticism of Northwestern University – and the polemical perspective is grounded in Shay’s Jewish identity and personal beliefs. Equally clearly Shay makes a series of verifiable observations and arguments about conspiracy theories as a contemporary phenomenon and their presence, as well as the presence of other weak and lazy modes of thought, in “academia writ large.” This generalization of the problem is where most readers will find the value of the book. The book does not expect one to share Shay’s identity, to be a Zionist or support Zionism, or to agree with Israel’s national policies on any issue, least of all Israeli relations with Arabs and Palestinians. Shay’s approach is rigorous and clinical. He is a genuine intellectual in that he considers the gravest matters of concern from various viewpoints, including viewpoints radically different from his own, and relies on close readings of the evidence. In other words, Shay did not write the book merely to convince people that two tenured professors at Northwestern are promoting conspiracy theories. That kind of aberration is sadly to be expected and at least partially the result of the tenure system, which has advantages as well, not within the scope of the book. Rather Shay wrote it to provide a case study for how it is that conspiracy theories can manage to be adopted by those who do not realize what they are and to proliferate even in areas that should be the least hospitable – namely, public universities, which are supposed to be beacons of knowledge, science, openness, and critical thinking, but also other public institutions, including the fourth estate. Shay is meticulous with his sources and terminology. He draws on existing academic literature to set the parameters of his subject, defining conspiracy theories as “improbable hypotheses [or] intentional lies … about powerful and sinister groups conspiring to harm good people, often via a secret cabal.” The definition excludes “unwarranted criticism” and “unfair/prejudiced perspectives,” which are harmful but unavoidable. Many prejudices and false beliefs are “still falsifiable in the minds of their adherents,” which is not the case with conspiracy theories, although deep prejudices can obviously be helpful in spreading such theories. Conspiracy theories often depend on “a stunning amount of uniformity of belief and coordination of action without contingencies.” They also rely excessively on pathos, or emotion, in making their arguments, as opposed to logos (reason) and ethos (credibility, authority). Unfortunately there is no absolute, infallible distinction between conspiracy theories and other improbable theories – say, yet-to-be-confirmed theories about conspiracies that actually occurred. Conspiracy theories differ from other theories “in their relationship to facts, evidence, and logic,” which may sound obvious but is very much to the point. Again, “the key difference is the evidence and how it is evaluated.” There is no ready way to refute the fabrications, myths, and political propaganda that people believe without taking the time to assess the claims and their foundations. This requires an open mind and a grim determination to get to the bottom of rival claims about events even when they are extremely morally or politically sensitive, as is often the case with wars, political conflicts, atrocities, and genocides: Reliable historians, journalists, lawyers, and citizens must first approach the question of the cause or the identity of perpetrators and victims of an event or process with an open mind, not prejudiced to either party, and then evaluate the evidence. The diagnosis may be easy but the treatment is not – it takes time, study, and debate, and one’s interlocutors must be willing to be convinced. This problem of convincing others is critical because it is the part that is so often left out of modern political discourse. Conspiracy theories are often hateful and militant, so there is a powerful urge to censor or repress them. Openly debating with conspiracy theorists runs the risk of legitimizing or appearing to legitimize their views, providing them with a public forum, which seems to grant ethos or authority to arguments that are otherwise conspicuously lacking in it. In some countries censorship is legal, almost everywhere when violence is incited. The problem is that the act of suppression can feed the same conspiracy theories, so there is a need, in the appropriate context, to engage with and refute lies and specious arguments. Clients frequently email us to ask our view of the rise of conspiracy theories and what they entail for the global policy backdrop. We associate them with the broader breakdown in authority and decline of public trust in institutions. Shay’s book is an intervention into this topic that clients will find informative and thought-provoking, even if they disagree with the author’s staunchly pro-Israel viewpoint. It is precisely Shay’s ability to discuss and debate extremely contentious matters in a lucid and empirical manner – antisemitism, the history of Zionism, Holocaust denialism, Arab-Israeli relations, the Rwandan genocide, QAnon, the George Floyd protests, various other controversies – that enables him to defend a controversial position he holds passionately, while also demonstrating that passion alone can produce the most false and malicious arguments. As is often the case, the best parts of the book are the most personal – when Shay tells about his father’s sufferings during the Holocaust, and journey from the German concentration camps to New York City, and about Shay’s own experiences scraping enough money together to go to college at Northwestern. These sequences explain why the author felt moved to stage a public intervention against fringe ideological currents, which he shows to have gained more prominence in the university system than one might think. The book is timely, as American voters are increasingly concerned about the handling of identity, inter-group relations, history, education, and ideology in the classroom, resulting in what looks likely to become a new and ugly episode of the culture and education wars. Let us hope that Shay’s standards of intellectual freedom and moral decency prevail. Matt Gertken, PhD Vice President Geopolitical Strategy mattg@bcaresearch.com Footnotes 1 The downshift in globalization today is even worse than it appears in Chart 10 because several countries have not yet produced the necessary post-pandemic data, artificially reducing the denominator and making the post-pandemic trade rebound appear more prominent than it is in reality. 2 Scott A. Shay, Conspiracy U: A Case Study (New York: Post Hill Press, 2021), 279 pages. Strategic Themes Open Tactical Positions (0-6 Months) Open Cyclical Recommendations (6-18 Months) Appendix: GeoRisk Indicator China
China: GeoRisk Indicator
China: GeoRisk Indicator
Russia
Russia: GeoRisk Indicator
Russia: GeoRisk Indicator
United Kingdom
UK: GeoRisk Indicator
UK: GeoRisk Indicator
Germany
Germany: GeoRisk Indicator
Germany: GeoRisk Indicator
France
France: GeoRisk Indicator
France: GeoRisk Indicator
Italy
Italy: GeoRisk Indicator
Italy: GeoRisk Indicator
Canada
Canada: GeoRisk Indicator
Canada: GeoRisk Indicator
Spain
Spain: GeoRisk Indicator
Spain: GeoRisk Indicator
Taiwan
Taiwan Territory: GeoRisk Indicator
Taiwan Territory: GeoRisk Indicator
Korea
Korea: GeoRisk Indicator
Korea: GeoRisk Indicator
Turkey
Turkey: GeoRisk Indicator
Turkey: GeoRisk Indicator
Brazil
Brazil: GeoRisk Indicator
Brazil: GeoRisk Indicator
Australia
Australia: GeoRisk Indicator
Australia: GeoRisk Indicator
South Africa
South Africa: GeoRisk Indicator
South Africa: GeoRisk Indicator
Section III: Geopolitical Calendar
Dear Clients, This is the final publication for the year, in which we recap some of the key economic developments this month. Our publishing schedule will resume on January 6, 2022. The China Investment Strategy team wishes you a very happy and safe holiday season and a prosperous New Year! Best regards, Jing Sima China Strategist Feature Recently released data show China’s economy is weakening despite easing monetary policy and power-supply constraints. Our credit impulse – measured by the year-on-year change in total social financing as a share of GDP – inched up in November (Chart 1, top panel). Given that the indicator leads economic activity by about six to nine months, we maintain the view that China’s economy will not bottom until Q2 next year. Chinese stocks, driven by business cycle, will remain under downward pressures in the next three to six months (Chart 1, middle and bottom panels). On the policy front, the PBoC announced a 50bps cut in the reserve requirement ratio (RRR) rate taking effect in mid-December. Last week’s Central Economic Work Conference (CEWC) signaled that stabilizing the economy will be the government’s core policy objective for 2022. However, we believe that policymakers will be data dependent and will only allow an overshoot in credit growth when the slowdown in the economy gathers pace in early 2022. Thus, investors should maintain an underweight allocation to Chinese equities relative to global stocks, at least for the next three to six months, until credit growth significantly improves. Chart 1Downside Risks Remain High For Chinese Stocks Until The Econmomy Troughs
Downside Risks Remain High For Chinese Stocks Until The Econmomy Troughs
Downside Risks Remain High For Chinese Stocks Until The Econmomy Troughs
Chart 2Chinese Internet Stocks Are Not Cheap
Chinese Internet Stocks Are Not Cheap
Chinese Internet Stocks Are Not Cheap
Chinese investable stocks, particularly internet companies, will continue to face geopolitical and regulatory headwinds in the next 12 months. Chinese tech stocks sold off this year, but they are not cheap (Chart 2). Economic weakness in the onshore market in the next three to six months may trigger more selloffs and further multiples compressions in Chinese investable stocks. Qingyun Xu, CFA Associate Editor qingyunx@bcaresearch.com Cuts To The RRR And Relending Rates: Not Game Changers Chart 3RRR Cut Is Not A Game Changer
RRR Cut Is Not A Game Changer
RRR Cut Is Not A Game Changer
Following the RRR cut announcement in early December, the PBoC announced a 25bps decrease in the relending rate targeting agriculture and small businesses (Chart 3). The measures sent an easing signal in response to mounting downside risks in the economy. However, their impact on credit growth will likely be limited for the following reasons: First, the PBoC indicated that the RRR cut will release around RMB1.2 trillion in liquidity to the banks. From that amount, RMB950 billion will be used to replace maturing Medium-term Lending Facility (MLF) this month, which leaves only RMB250 billion for new liquidity injection. Chart 4Business Conditions For SMEs Deteriorated Faster Than For Larger Businesses
Business Conditions For SMEs Deteriorated Faster Than For Larger Businesses
Business Conditions For SMEs Deteriorated Faster Than For Larger Businesses
Secondly, the PBoC is trying to prevent a jump in market-based rates in the next two quarters. Demand for liquidity is usually high due to tax season by year-end plus a front-loading of local government bond (LGB) issuance. Moreover, the Chinese New Year in Q1 2022 will further boost demand for liquidity. Thirdly, the targeted relending rate drop is intended to lower the borrowing costs of small-medium enterprises (SMEs) whose profitability has been challenged by rising input costs and sluggish consumer demand (Chart 4). Loan demand from small enterprises, as shown in the PBoC survey, peaked much earlier and tumbled more rapidly than their larger peers (Chart 4, bottom panel). The rate cut has decreased the possibility of a broadly based decline in interest rates in the near-term. China’s Credit Growth May Have Bottomed, But The Rebound Is Moderate Chart 5Below-Expectation Credit Growth In November
Below-Expectation Credit Growth In November
Below-Expectation Credit Growth In November
China’s aggregate credit growth ticked up slightly in November. The modest advance mainly reflects an acceleration in LGB issuance. Chart 5 highlights that excluding LGB financing, China’s credit impulse remains on a downward trend. LGBs will be frontloaded in Q1 2022 before the March National People’s Congress sets the full-year quota for LGBs. However, without a meaningful rebound in bank loan growth, the effects of LGB issuance on infrastructure investment will be limited and short-lived, as occurred in Q1 2019 (Chart 6). Shadow banking, which historically has had a tight correlation with infrastructure investment, continued to slide in November to an all-time low. Infrastructure project approval also does not show any signs of strengthening (Chart 7). Chart 6Improvement In Infrastructure Investment Will Be Limited Without An Acceleration In Loan Growth
Improvement In Infrastructure Investment Will Be Limited Without An Acceleration In Loan Growth
Improvement In Infrastructure Investment Will Be Limited Without An Acceleration In Loan Growth
Chart 7Key Indicators Show Weak Signs Of Revival In Infrastructure Spending
Key Indicators Show Weak Signs Of Revival In Infrastructure Spending
Key Indicators Show Weak Signs Of Revival In Infrastructure Spending
Weak demand for bank loans from corporations dragged down credit growth in November as evidenced by softening growth in medium- and long-term corporate loans (Chart 8). Both corporate financing needs and investment willingness continued to wane, implying that corporate demand for bank lending may not turn around soon despite recent monetary easing (Chart 8, bottom panel). In addition, marginal easing measures in the property market have not worked their way into the sector. Bank loans to real estate developers plummeted to all-time lows last month, while trust loans contracted significantly in November, which indicates that financing conditions for real estate developers have not improved (Chart 9). Chart 8Loan Demand Remains Weak And Unlikely To Turn Around Imminently
Loan Demand Remains Weak And Unlikely To Turn Around Imminently
Loan Demand Remains Weak And Unlikely To Turn Around Imminently
Chart 9Deepening Contraction In Trust Loans Indicates Deteriorating Financing Conditions For Real Estate Developers
Deepening Contraction In Trust Loans Indicates Deteriorating Financing Conditions For Real Estate Developers
Deepening Contraction In Trust Loans Indicates Deteriorating Financing Conditions For Real Estate Developers
Easing Of Property Restrictions Will Marginally Benefit The Housing Market Last week’s Politburo meeting and the CEWC both proposed to promote affordable rental housing and support reasonable housing demand. Loan growth to government-subsidized social welfare housing has been decelerating since 2018 and started to contract this year (Chart 10). It will likely strengthen next year amid policy support, but from a very low level and at a modest rate. In addition, although social welfare housing loans account for around 40% of bank loans to real estate developers, they are only about 6% of developers’ total source of funding as of 2020. We expect more policy finetuning in the coming months, which may help slow the pace of deterioration in real estate developers’ financing conditions. Real estate developers’ financing from banks may bottom on the back of government’s intervention, but the improvement in total funds to developers will be gradual without mortgage rate cuts and a pickup in home sales (Chart 11). Meanwhile, the downward trend in housing completion will be sustained in the coming months (Chart 11, top panel). Chart 10Bank Loans To Social Welfare Housing Will Likely Improve Modestly Amid Policy Support
Bank Loans To Social Welfare Housing Will Likely Improve Modestly Amid Policy Support
Bank Loans To Social Welfare Housing Will Likely Improve Modestly Amid Policy Support
Chart 11Less Funding = Reduced Completions And Investments
Less Funding = Reduced Completions And Investments
Less Funding = Reduced Completions And Investments
Housing prices in most Tier-one and Tier-two cities continued to move down through November. Data for high-frequency floor space sold show that housing demand continued to abate last month despite a modest uptick in household mortgage loans (Chart 12). Home sales will remain depressed as buyers expect more discounts in housing prices and real estate tax reforms loom. Falling prices and constraints in developers’ financing will continue to weigh on housing starts, given the strong positive correlation between property starts and housing prices (Chart 13). Chart 12Demand For Housing In November Showed Little Signs Of Revival
Demand For Housing In November Showed Little Signs Of Revival
Demand For Housing In November Showed Little Signs Of Revival
Chart 13Housing Starts Are Highly Correlated With Prices
Housing Starts Are Highly Correlated With Prices
Housing Starts Are Highly Correlated With Prices
The Rebound In November’s PMI Does Not Signal A Bottom In China’s Economy Chart 14China's PMI Rebounds Amid Supply-Side Improvement
China's PMI Rebounds Amid Supply-Side Improvement
China's PMI Rebounds Amid Supply-Side Improvement
The NBS manufacturing PMI returned to above the 50-expansionary threshold in November, but the rise reflects a near-term supply-side improvement related to the power shortage rather than a demand-driven recovery (Chart 14). China’s overall business conditions and domestic demand are still worsening, indicating that the rebound in the manufacturing PMI may be short-lived. The production subindex jumped by three and half percentage points in November from October, reflecting re-started operation of heavy-industry enterprises that were halted amid electricity shortages in September and October. Robust global demand for China’s manufactured goods supported a strong reading in November’s new export orders subindex. However, domestic demand remains lackluster. A proxy for the new domestic orders derived from the PMI reached its lowest level since February 2020 (Chart 14, bottom panel). In addition, service PMI weakened last month. A sharp resurgence in domestic COVID cases curbed service sector activity last month. Given uncertainties surrounding the Omicron variant and China’s zero-tolerance policy towards COVID, the service sector’s recovery will likely remain below-trend into 1H 2022 (Chart 15 and 16). Chart 15Lingering COVID Effects Will Continue To Impede Service Sector Activity In 1H22
Lingering COVID Effects Will Continue To Impede Service Sector Activity In 1H22
Lingering COVID Effects Will Continue To Impede Service Sector Activity In 1H22
Chart 16Service Sector Recovery In China Has Lagged
Service Sector Recovery In China Has Lagged
Service Sector Recovery In China Has Lagged
Inflation Passthroughs Ongoing Producer price index (PPI) inflation may have peaked. Meanwhile, the consumer price index (CPI) shows another upturn in November. Despite the peak in PPI inflation, it will likely remain above trend through at least 1H22, supported by elevated commodity and energy prices (Chart 17). Chart 17PPI May Have Peaked, But Will Remain Elevated In The Near Term
PPI May Have Peaked, But Will Remain Elevated In The Near Term
PPI May Have Peaked, But Will Remain Elevated In The Near Term
Chart 18Ongoing Inflation Passthroughs
Ongoing Inflation Passthroughs
Ongoing Inflation Passthroughs
A synchronized rise between PPI consumer goods and non-food CPI, and a narrower gap between PPI and CPI inflation, suggest an ongoing inflation passthrough from producers to consumers (Chart 18). Price increases in some key sectors of manufactured consumer goods sped up in November (Chart 19). However, we do not think China’s consumer price inflation will prevent policymakers from further policy easing. Consumer goods prices are lightly weighted in China’s CPI. An acceleration in inflation passthroughs in this component is unlikely to significantly push up the CPI aggregates. Headline CPI may gather steam next year if food prices rise while energy prices remain at current levels. Nonetheless, in recent years China’s monetary policymaking has been more tightly correlated with the PPI and core CPI, and not headline CPI (Chart 20). Chart 19Manufactured Consumer Goods Prices On The Rise
Manufactured Consumer Goods Prices On The Rise
Manufactured Consumer Goods Prices On The Rise
Chart 20Monetary Policy Is Tightly Correlated With Core CPI And Not Headline CPI
Monetary Policy Is Tightly Correlated With Core CPI And Not Headline CPI
Monetary Policy Is Tightly Correlated With Core CPI And Not Headline CPI
Surging Prices Underpin China’s Exports, While The Rebound In Imports Is Unsustainable Chart 21Surging Export Prices Underpinned Strong Growth In The Value Of China's Exports
Surging Export Prices Underpinned Strong Growth In The Value Of China's Exports
Surging Export Prices Underpinned Strong Growth In The Value Of China's Exports
Chinese exports in volume tumbled in November, however, surging export prices underpinned the strong growth in the value of exports (Chart 21). Demand from the US drove Chinese exports this year and the moderation in volume growth was more than offset by escalating prices (Chart 22). China’s export prices have caught up with the global average (Chart 23). Chart 22Strong Demand From US Has Driven Up China's Exports
Strong Demand From US Has Driven Up China's Exports
Strong Demand From US Has Driven Up China's Exports
Chart 23Chinese Export Prices Have Caught Up With The Global Average
Chinese Export Prices Have Caught Up With The Global Average
Chinese Export Prices Have Caught Up With The Global Average
We expect China’s export growth to slow in the new year on the back of softer global growth and a rotation in US household consumption from goods to services (Chart 24). However, while slowing, global economic growth is projected to remain above trend. The low level of industrial inventories will also provide support to the demand for goods, which will help to sustain strong growth in Chinese exports (Chart 25). China’s imports surprised to the upside in November, boosted by imports of commodities such as coal and crude oil. November’s acceleration in imports reflects a higher demand for primary commodities from Chinese producers, who recovered some production capacity from the power shortages in the previous few months. Chart 24US Household Spending Will Shift From Goods To Services
US Household Spending Will Shift From Goods To Services
US Household Spending Will Shift From Goods To Services
Chart 25Inventory Restocking In The US Will Support Chinese Exports Next Year
Inventory Restocking In The US Will Support Chinese Exports Next Year
Inventory Restocking In The US Will Support Chinese Exports Next Year
Furthermore, the increase in import prices in November outpaced the very modest uptick in the volume of imports, indicating that domestic demand remains sluggish (Chart 26). Credit growth, which normally leads import growth by about six months, only climbed moderately in November and will provide limited support to imports in the coming months (Chart 27). Chart 26Rising Import Prices Masked Weakness In China's Domestic Demand
Rising Import Prices Masked Weakness In China's Domestic Demand
Rising Import Prices Masked Weakness In China's Domestic Demand
Chart 27Modest Rebound In Credit Impulse Will Provide Little Support To Chinese Imports
Modest Rebound In Credit Impulse Will Provide Little Support To Chinese Imports
Modest Rebound In Credit Impulse Will Provide Little Support To Chinese Imports
Chart 28Chinese Demand For Industrial Metals Remains In Deep Contraction
Chinese Demand For Industrial Metals Remains In Deep Contraction
Chinese Demand For Industrial Metals Remains In Deep Contraction
China’s imports of industrial metals, such as copper and steel, improved a little in November, but their year-on-year growth remains in deep contraction (Chart 28). Weakening construction activity amid a continued downtrend in China’s property market will likely reduce the demand for industrial metals. Therefore, the rebound in November’s import growth may be short-lived. The RMB Faces Headwinds In 2022 Regardless Of A Rise In FX Deposit RRR The RMB has climbed about 2% against the dollar since late July despite broad-based dollar strength. In trade-weighted terms, the RMB is at its strongest level since late 2015 (Chart 29). A rapidly appreciating RMB does not bode well for China’s industrial sector profits, and thus not at the PBoC’s best interests (Chart 30). Under this backdrop, last week the PBoC announced that it will raise the banks’ foreign exchange (FX) deposit reserve requirement ratio (RRR) to 9% from 7%, effective December 15. This is the second increase this year aimed at easing the RMB’s pace of appreciation. The RMB fell slightly against the US dollar following the announcement last week. Chart 29The RMB Has Strengthened Despite A Strong USD
The RMB Has Strengthened Despite A Strong USD
The RMB Has Strengthened Despite A Strong USD
Chart 30Strengthening RMB Does Not Bode Well For Corporate Profit Growth
Strengthening RMB Does Not Bode Well For Corporate Profit Growth
Strengthening RMB Does Not Bode Well For Corporate Profit Growth
The RMB appreciation against dollar this year was mainly enhanced by China’s record current account surplus and favorable interest rate differentials between China and the US (Chart 31 and 32). Although the increase in the deposit RRR rate will force banks to hold more foreign currencies and lift the cost of RMB speculation, the RRR hike itself has little impact on altering the existing path in RMB exchange rate. Moreover, the balance of FX deposits stands at US$1 trillion as of November this year. The 200bps increase in the FX deposit reserve ratio will only freeze about US$20 billion in FX liquidity, which is negligible compared with the US$580 billion in China’s trade surplus so far this year. Chart 31Current Account Surplus Will Likely Shrink Next Year
Current Account Surplus Will Likely Shrink Next Year
Current Account Surplus Will Likely Shrink Next Year
Chart 32Interest Rate Differentials Will Narrow Further
Interest Rate Differentials Will Narrow Further
Interest Rate Differentials Will Narrow Further
However, looking forward the conditions favored RMB this year are at risk of reversing in 2022. China’s weaker economic fundamentals and a slower pace in trade surplus next year, as well as narrowed interest rate differentials between the US and China due to falling long-duration bond yields in China, will provide headwinds to RMB. Therefore, investors should closely follow these key factors and to be cautious to bet on continued RMB appreciation. Table 1China Macro Data Summary
More Slowdown To Come Before More Easing
More Slowdown To Come Before More Easing
Table 2China Financial Market Performance Summary
More Slowdown To Come Before More Easing
More Slowdown To Come Before More Easing
Footnotes Market/Sector Recommendations Cyclical Investment Stance
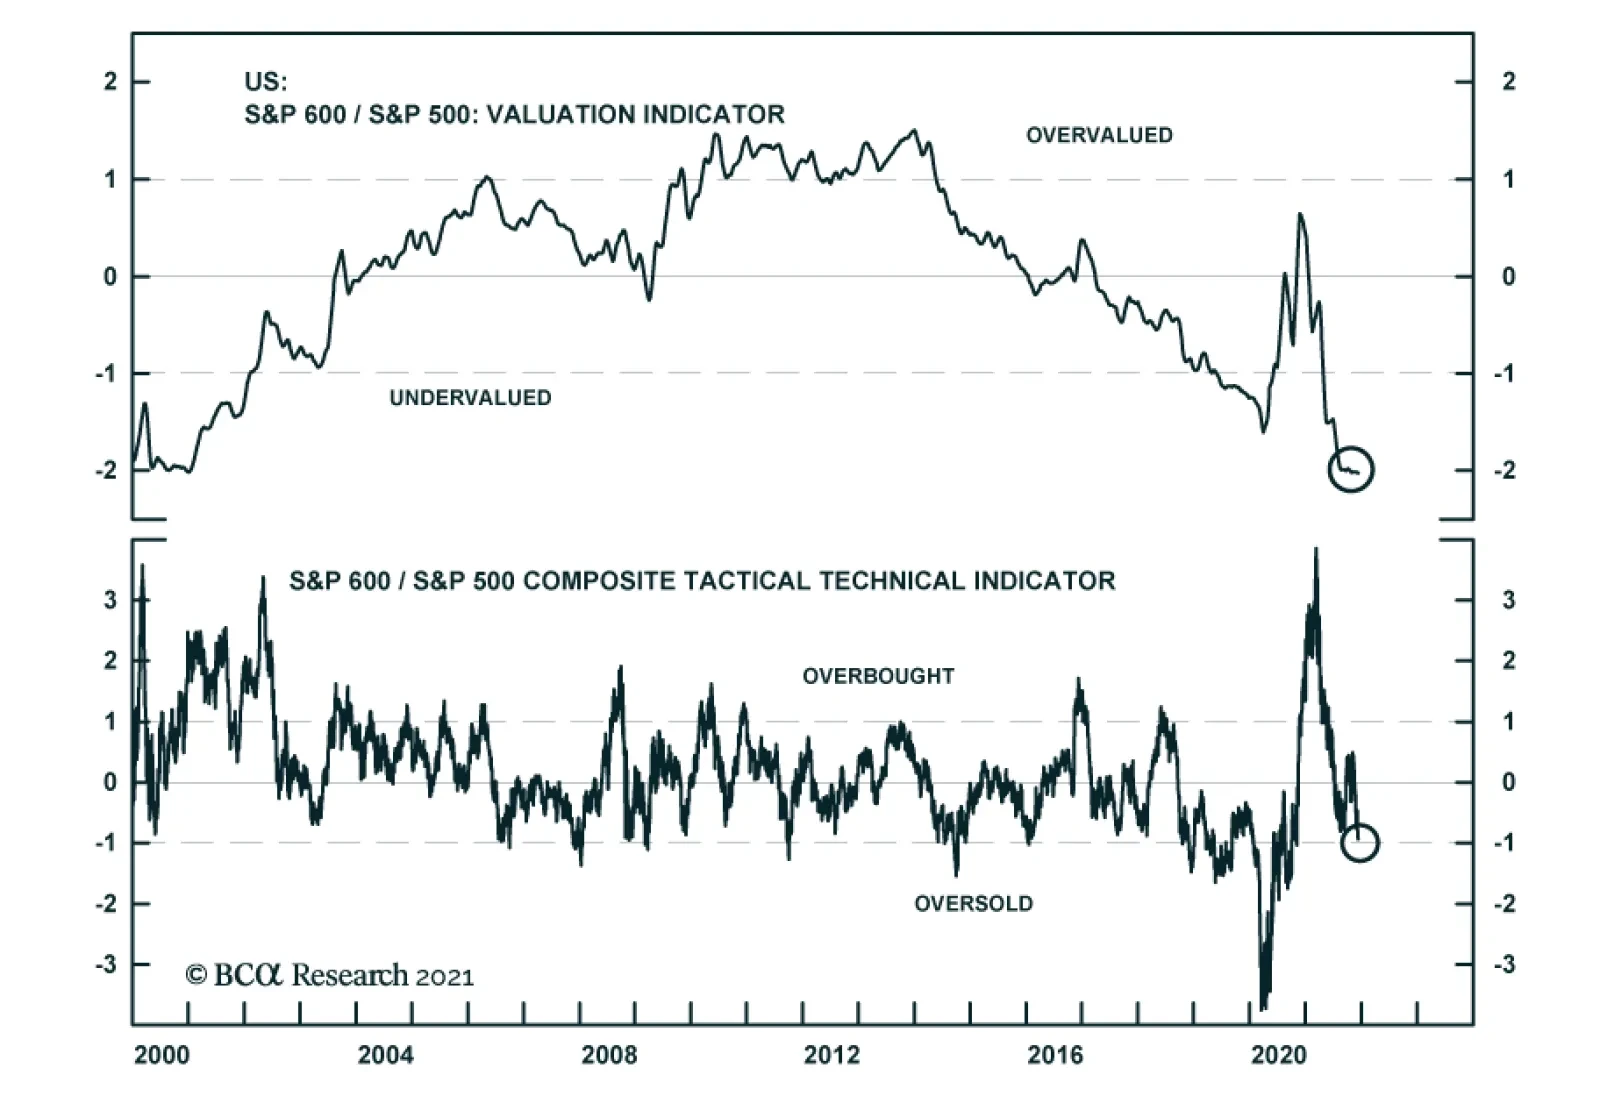
The 10-year Treasury yield is too low based on our US Bond strategists’ estimated fair value range. We expect the 10-year yield to rise towards 2-2.25% by end-2022 as the Fed tightens monetary policy next year. This environment of rising interest rates bodes…