Equities
Stock buybacks have surged following last year’s pandemic-induced collapse. This trend reflects the solid US economic environment. Companies engage in buyback activity when they are in solid financial standing. Robust economic activity in the US has been…
BCA Research’s European Investment Strategy service concludes that European equities are likely to withstand higher yields in 2022. To begin with, BCA Research’s US Bond strategists anticipate a modest rise in Treasury yields to 2.25% in…

Highlights 2022 will be a year of economic normalization. We hope that even if we can’t leave COVID behind, we will learn to live with it. Economic growth will remain strong, but it will be trending down towards its long-term average, while inflation will cool off somewhat on the back of the resolution of supply chain bottlenecks and waning pent-up demand. Monetary conditions will tighten, and 10-year rates will move up towards the 2-2.25% mark. Corporate profitability will return to trend. The likely deceleration in earnings growth and margin contraction will be driven by a combination of factors: A slowdown in top-line growth, a decline in corporate pricing power, and increases in labor and input costs. The US economy is firmly in the slowdown stage of the business cycle. However, growth is coming off high levels, and this phase is likely to be prolonged, and this is by no means a death knell for the bull market. Yet, during the slowdown, returns tend to be lower than during the recovery and expansion phases of the business cycle, and volatility is heightened. We expect an S&P 500 total return of just under 8% – the net result of robust revenue growth and some return compression from profit margins and equity multiples. Point estimates are difficult in finance, so we will characterize this return expectation as in the middle single digits. Overweight Small vs. Large for the following reasons: First, Small is expected to outperform in an environment of rising rates - A BCA view for 2022. Second, Small is cheap. Third, the profitability of Small has improved dramatically which attests to the ability of smaller companies to efficiently manage their operations even under duress. Last, while Small is trading with a 25% discount to Large on a forward PE basis, its earnings growth over the next 12 months is expected to be double of Large, 20% vs. 10%. We are neutral in our Growth/Value allocation, but we find the argument of rates rising and Value outperforming highly compelling. Our neutral position will be a great launching pad towards overweighting value stocks at the first whiff of rising long rates. In the meantime, we choose a selective exposure to value sectors by the means of our hand-picked cyclical themes. Overweight Cyclicals vs. Defensives as the pandemic will recede in importance in 2022: Every time COVID fears subside, Cyclicals outperform Defensives. Pent-up demand has not yet waned, hindered by supply shortages and shipping delays. Further, rising rates is an environment favorable for Cyclicals at the expense of Defensives. Within Cyclicals, we prefer the following sectors and themes: Consumers are flush with cash and there is strong pent-up demand for services and selected consumer goods like services: Overweight Hotels, Restaurants, Cruises, Amusement Parks, and Casinos, along with Commercial and Professional Services. Also, overweight Healthcare Equipment and Services which benefits from the backlog in elective procedures. New Capex Cycle: Businesses bring their supply chains back to the US and excess consumer demand has driven the need for expanded capacity. Capex intentions are on the rise. Overweight Construction and Engineering, Building Materials, and Capital Goods. New Credit Cycle: Early signs that both consumer and business lending is picking up. Rising rates will also lend a helping hand to Banks – overweight Overweight Energy as demand for oil is robust on the back of global recovery and chronic underinvestment in Capex. Underweight resource stocks, which are exposed to a slowdown in China. The US housing market should post a solid performance next year on the back of the structural demand tailwinds: Since GFC, around five million houses were underbuilt. This supply shortage also coincides with millennials, a cohort that has 11 million more people compared to the previous generation, starting families. Overweight Real Estate and Homebuilders Multi-year structural themes are Millennials, Generation Z, EV revolution, and Cybersecurity. 2022 will be a big year for the new technology themes. We are reading about gene editing, the metaverse, 3D printing, and cleantech. We will be sure to share what we learn in a series of Special Reports. Feature House Views Last Week, BCA published its annual outlook, a transcript of our yearly discussion with the firm’s long-time clients, Mr. X and his daughter, Ms. X. In this document, we discussed the major themes for 2022. Below are some of the main conclusions: The COVID-19 pandemic is likely to recede in importance next year. The effect of the recently discovered Omicron variant remains unknown, but we expect any negative economic impact that occurs to be limited to the first half of the year. A receding pandemic will lay the groundwork for a more normal labor market, prices, and the supply of both goods and services. We expect actual inflation will come in lower next year than what short-maturity inflation expectations currently suggest. Economic growth in advanced economies will be above trend for the year on average, and we expect the US and euro area output gaps to close in 2022. Any economic activity disrupted by Omicron in the first half of 2022 will likely shift into the second half of the year. Above-trend growth will be supported by easy monetary policy, a shift in spending from goods to services, and a sizeable amount of excess savings that will support overall consumer spending. A reacceleration in Chinese economic activity is more likely in the latter half of next year rather than in the coming six months.
Chart 0
Stocks will outperform bonds in 2022, but equity market returns will be in the single-digit territory – the net result of robust revenue growth and some return compression from profit margins and equity multiples. Equity market volatility may increase in the lead-up to US monetary policy tightening at the end of the year, but we expect only a moderate rise in long-maturity bond yields—which will not threaten economic activity or cause a major decline in equity multiples. Equity investors should favor small-cap over large-cap stocks in 2022. Small-cap stocks tend to outperform when bond yields are rising, and relative valuation levels are attractive. We generally favor cyclical sectors next year but stretched relative performance versus defensives means that we expect to rotate away from cyclicals at some point over the coming year. A window exists for value outperformance versus growth in 2022, in response to higher long-maturity government bond yields. We do recommend the former over the latter. Brent oil prices will average around $80-81/bbl next year, essentially flat from pre-Omicron levels. The US dollar may remain strong over the coming few months, depending on the extent of the economic impact from the Omicron variant. Beyond that, the dollar’s countercyclical nature, above-trend global growth, and overbought conditions suggest that investors should bet on a lower dollar. In this report, we will explore the implications of the above views for US Equities. 2022 Is A Year Of Normalization If 2021 passed under the banner of recovery, 2022 will be a year of economic normalization. We hope that even if we can’t leave COVID behind, we will learn to live with it, variants and all, and it will become less disruptive to the economy and our personal lives. As such, economic growth will remain strong, but it will be trending down towards its long-term average, while inflation will cool off somewhat on the back of the resolution of supply chain bottlenecks and waning pent-up demand. Monetary conditions will tighten, and 10-year rates will move up towards the 2-2.25% mark. US Economic Growth And Corporate Profitability Will Return To Trend The economy is expected to grow at a robust pace next year (7.3% nominal GDP growth), albeit slower than this year (Chart 1). After a growth surge on the back of the post-COVID recovery, the economy has entered the slowdown phase of the business cycle. Economic growth is poised to shift closer to its long-term trend in 2022. Corporate profitability is also expected to trend lower next year (Chart 2). While corporate earnings in 2021 have been impressive, this performance is unlikely to be repeated, as the unique circumstances of the pandemic and the recovery are giving way to more ordinary business conditions. Amid the pandemic and during the early innings of recovery, companies have cut costs aggressively, improved productivity, while lower interest rates have reduced debt servicing burdens, and a weaker dollar has boosted overseas earnings. As the economy restarted, sales growth surged, and corporate pricing power was on the rise thanks to significant pent-up demand for goods and services and consumers being flush with cash. Chart 1Economic Growth Will Return To Trend
Economic Growth Will Return To Trend
Economic Growth Will Return To Trend
Chart 2Sales Growth Is Poised To Slow
Sales Growth Is Poised To Slow
Sales Growth Is Poised To Slow
In 2022, earnings growth will return to trend (Chart 3). The likely deceleration in earnings growth and margin contraction (Chart 4) next year will be driven by a combination of factors: First and foremost, a slowdown in top-line growth, a decline in corporate pricing power, i.e., the ability of companies to raise prices, which has been diminished by consumers’ income increasing slower than inflation.
Chart 3
Chart 4Profit Margins Are Set To Compress
Profit Margins Are Set To Compress
Profit Margins Are Set To Compress
In the meantime, the tight labor market is putting upward pressure on wage growth (Chart 5). Labor costs are singlehandedly the largest expense, hovering around 50% of sales, dwarfing all the other expense items. Input costs are also on the rise with PPI soaring, cutting into corporate profitability (although we do expect PPI to decelerate) (Chart 6). Chart 5Wage Growth Is Accelerating
Wage Growth Is Accelerating
Wage Growth Is Accelerating
Chart 6Corporate Pricing Power Has Been Waning
Corporate Pricing Power Has Been Waning
Corporate Pricing Power Has Been Waning
In addition, there are a few minor expenses that are set to rise in 2022: Capex recovery will push up depreciation expense, interest expense is set to go up because of rising rates and corporate re-leveraging, and taxes are projected to increase, especially for the US multinationals exposed to the international minimum tax. And of course, there is also an appreciating dollar, diminishing the translated value of overseas profits. While each of these line items is minor, in concert they will have a noticeable adverse effect on corporate profitability. We provide analysis of the S&P 500 margins in Marginally Worse and Sector Margin Scorecard reports. 2022: Pedestrian Returns And Higher Volatility The US economy is firmly in the slowdown stage of the business cycle. However, growth is coming off high levels, and this phase is likely to be prolonged, and this is by no means a death knell for the bull market. Yet, during the slowdown, returns tend to be lower than during the recovery and expansion phases of the business cycle (Chart 7). Slowdowns are also usually accompanied by heightened volatility.
Chart 7
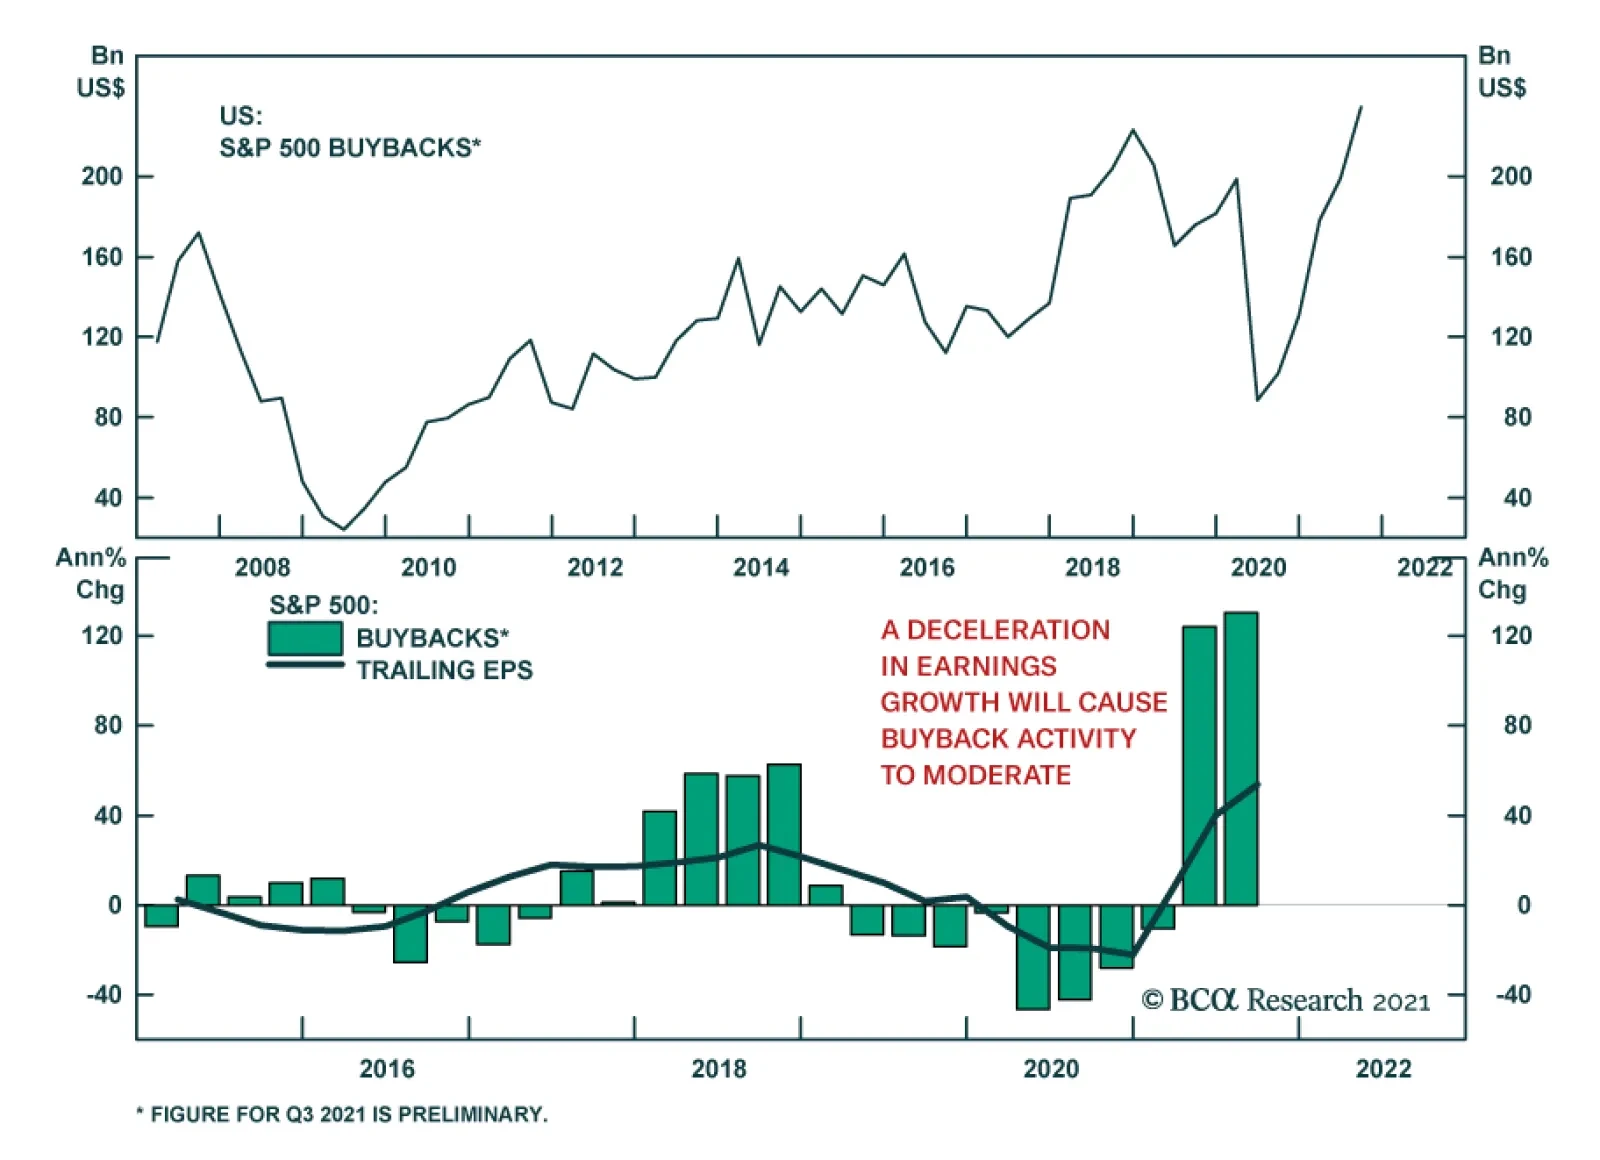
The TINA trade is still on – there are few inexpensive asset classes, and yield is hard to come by. With rates expected to rise, equities are still a more attractive alternative to bonds (Chart 8). Equities are real assets that do a good job protecting investments from rising prices (that is until inflation triggers tighter monetary policy). With rate hikes still a few quarters away, the party is continuing. There is still a lot of liquidity sloshing around looking for attractive corners of the market. This is manifested in positive equity inflows and a “buy-on-dips” mentality, which, so far, has precluded any major market corrections. Buybacks are on the rise – many corporations have had bumper profits and are returning cash to shareholders (Chart 9). This trend is exacerbated by the current administration’s hostility to M&A activity.
Chart 8
Chart 9Buybacks Are Reverting To The Pre-pandemic Level
Buybacks Are Reverting To The Pre-pandemic Level
Buybacks Are Reverting To The Pre-pandemic Level
Returns: Multiple Expansion Passes Baton To Earnings Growth Multiple expansion was a key driver of returns in 2020. In 2021, the baton was passed to earnings growth, which contributed 40% to realized returns this year (Chart 10). 2022 will be more like 2021 than 2020. Multiple expansion is highly unlikely as it tends to be a driver of returns during the recovery stage of the business cycle when the market anticipates economic rejuvenation. Furthermore, valuations are already elevated. When the S&P 500 is trading at over 21x forward earnings, the probability of negative returns over the next 12 months has historically been around 65% (Chart 11). While we believe that there are many factors supporting equities delivering positive returns next year, it is hard to be overly optimistic.
Chart 10
Chart 11
Hence, it will be earnings growth again that will rule the day in 2022, with a little help from dividends and buybacks. However, while earnings growth is a key driver of returns, it is expected to slow from the current levels, returning to its historical trend (Chart 12). The blockbuster returns of 2021 will be in the rear-view mirror. Chart 12Earnings Growth Is Slowing
Earnings Growth Is Slowing
Earnings Growth Is Slowing
Total Return Estimate: Mid-To-High Single Digits Above-trend economic growth and consumer price inflation point to revenue growth in the high single digits, and this would normally serve as a conservative estimate for earnings growth given that profit margins have been trending higher since the beginning of the 2009 economic recovery. However, margins are expected to compress in 2022, and earnings growth to decelerate. We proxy sales growth to nominal GDP growth of 7.6%. With margins expected to contract, the best scenario for the degree of operating leverage for the S&P 500 is a historical average of 0.96, translating sales growth into earnings growth of 7.3% (Table 1). For reference, sell-side analysts expect S&P 500 earnings to grow by 8% in 2022 (Chart 13). S&P 500 PE NTM stands at 20.5 which, historically, on average, is about three points below realized PE LTM in 12 months. We assume that PE LTM at the end of 2022 will be 25.6, or a 1.6% contraction from the 25.2 multiple today. Table 12022 S&P 500 Price Target And Total Return Estimate
2022 Key Views: US Equities
2022 Key Views: US Equities
Chart 13
With an average historical dividend yield of 2.2%, we get: (1+7.3%)*(1-1.6%)*(1+2.2%) = 7.9% - Total Return Estimate 4,591*(1+7.3%)*(1-1.6%) =~ 4,850 - Price Target We expect an S&P 500 total return of just under 8% – the net result of robust revenue growth and some return compression from profit margins and equity multiples. Point estimates are difficult in finance, so we will characterize this return expectation in the middle single digits. The rate of multiple contraction, earnings growth, and dividend yield in 2022 are just educated guesses. Sector And Styles Key Views Small Vs. Large Cap: It Is Finally A Small World 2021 was a tumultuous year for small caps. After a strong outperformance at the beginning of the year on the back of a recovery trade, this asset class has been languishing since March, with each new attempt for a prolonged rally failing (Chart 14). Over the year, small caps have become extremely cheap and unloved, trading at 16x forward earnings with a 25% discount to Large. The BCA Valuation Indicator for Small vs. Large is standing more than two standard deviations below its long-term average. So why was Small so unloved considering two blockbuster reporting seasons with earnings growth of more than 200%? Even on an annualized basis, since 2019 Small has delivered 47% annualized growth compared to 14% from Large (Chart 15). Moreover, smaller companies have been successful in repairing their balance sheets, which now look much healthier. Chart 14Small Had A Tumultuous Year
Small Had A Tumultuous Year
Small Had A Tumultuous Year
Chart 15
Small was out of favor as investors fretted about an economic slowdown (Chart 16), the Delta variant (along with the other Greeks), razor-thin margins, and the ability of smaller companies to navigate the economy, plagued with supply bottlenecks and labor shortages. Yet, we went overweight Small vs. Large back in October and are still sticking to our guns. First, Small, which has higher allocations to Cyclicals, such as Financials and Industrials, is expected to outperform in the environment of rising rates (Chart 17) - A BCA view for 2022. Second, in a market where most asset classes are exuberantly expensive, Small is cheap. Third, the profitability of Small has improved dramatically, which attests to the ability of smaller companies to efficiently manage their operations even under duress, as well as to pass costs on to their customers. Last, while Small is trading with a 25% discount to Large on a forward PE basis, its earnings growth over the next 12 months is expected to be double that of Large, 20% vs. 10%. The froth in expectations for the earnings growth of Small has also come down from its peak at 88% and now appears to be a low bar to clear. Chart 16Small Earnings Growth Expectations Are Reasonable And Profitability Has Rebounded
Small Earnings Growth Expectations Are Reasonable And Profitability Has Rebounded
Small Earnings Growth Expectations Are Reasonable And Profitability Has Rebounded
Chart 17Small Is Expected To Outperform In The Environment Of Rising Rates
Small Is Expected To Outperform In The Environment Of Rising Rates
Small Is Expected To Outperform In The Environment Of Rising Rates
What are the risks to this call? If economic growth disappoints, and the yield curve continues its relentless flattening, signifying a Fed policy mistake or the onset of another COVID Greek, Small is bound to underperform. Margins are narrow and continued cost pressures, especially surging labor costs, have the potential to dent small caps’ profitability. Yet, on a balance of probabilities of such an outcome vs. attractive valuations and fundamentals, this is a risk we are willing to take. Growth Vs. Value: Be Nimble The story of Growth vs. Value is similar to that of Large vs. Small. Value had a fantastic run as the pandemic started to recede, but then as worries about the Delta variant emerged, Growth took over yet again. Over the past year, Growth outperformed Value by 11%, and by 18% over just the last 26 weeks. As a result of such a strong run, Growth has become very expensive, trading at 29x forward multiples, which is a 80% premium to Value (which is trading at 16x). The Growth/Value BCA Valuation indicator is nearly 3 standard deviations above average, and from a statistical perspective, is 99% likely to mean revert. What makes this valuation discrepancy absurd is that both asset classes are bound to deliver roughly the same earnings growth over the next year, i.e., 10%. What is the deal? Just like Small vs. Large, this year, Value vs. Growth has been strongly linked to the 30-year Treasury yield (Chart 18). This has not always been the case in the past, but since the onset of the pandemic, very long-maturity bond yields have done a good job at explaining the relative performance of these asset classes. Growth is overweight Technology, which has been a star of the “work from home” theme. Further, falling long rates inflate the present value of cash flows and earnings of the growth stocks. In the meantime, Value is highly exposed to Financials, which have a hard time maintaining their profitability during times of falling rates and flattening yield curves. Apart from sector composition, Growth as an asset class has also become synonymous with quality, which comes to the rescue at times of heightened risk aversion and uncertainty. This is usually accompanied by falling rates. Indeed, profit margins for Growth are 7% higher than for Value. Since 2019, the annualized earnings growth of Growth is 14.4% compared to 9.8% for Value. The difference is even more dramatic for Sales growth: 6.5% for Growth vs. -1.1% for Value (Chart 19). Chart 18US Value Versus Growth Is Strongly Correlated With Interest Rates
US Value Versus Growth Is Strongly Correlated With Interest Rates (CHART 18)
US Value Versus Growth Is Strongly Correlated With Interest Rates (CHART 18)
Chart 19
However, while we observe that Growth is more reliable for churning out strong numbers, falling sales of Value indicate substantial pent-up demand for products and services. Value also thrives in the environment of robust economic growth and the steepening yield curve. We are currently neutral in our Growth/Value allocation, but we find the argument of rates rising and Value outperforming highly compelling. Our neutral position will be a great launching pad towards overweighting value stocks at the first whiff of rising long rates. In the meantime, we choose a selective exposure to value sectors by the means of our hand-picked cyclical themes. We have also retained some exposure to Growth by staying with our overweights to Technology and Pharma, as a means of protecting our portfolio from the kind of volatility we have experienced because of the Omicron scare and the Fed’s policy adjustments. Growth Is Robust And COVID Is Receding: Overweight Cyclicals Cyclical sectors have significantly outperformed Defensives this year (by 12%), benefiting from economic reopening and ubiquitous pent-up demand both from businesses and consumers. Despite a strong run and exceeding the pre-pandemic peak (Chart 20), Cyclicals have room to move higher when compared with the prevailing levels in 2010-2011, but that period reflected resource price levels that we are unlikely to see in the coming year. Yet, we expect further outperformance of Cyclicals in 2022. Chart 20Cyclicals/Defensives Performance Has Exceeded Pre-Pandemic Peak
Cyclicals/Defensives Performance Has Exceeded Pre-Pandemic Peak
Cyclicals/Defensives Performance Has Exceeded Pre-Pandemic Peak
Chart 21Cyclicals Rally When COVID Fears Reced
Cyclicals Rally When COVID Fears Reced
Cyclicals Rally When COVID Fears Reced
We do hope that the pandemic will recede in importance in 2022: Every time COVID fears subside, Cyclicals outperform Defensives (Chart 21). Pent-up demand has not yet waned, hindered by supply shortages and shipping delays. For many cyclical sectors, such as Consumer Discretionary, Financials, Real Estate, and Industrials, annualized sales growth from 2019 to 2021 is below historical levels, suggesting that there is room for catchup growth (Chart 22).
Chart 22
One of the cornerstones of the BCA outlook is that rates will rise. This is an environment favorable for Cyclicals. Defensive sectors tend to underperform when bond yields are rising, as many of them are heavily indebted and have somewhat fixed cash flows because of regulations (Utilities, Telecoms) or strong competition from cheaper substitutes (Pharma amid challenges from generics and biosimilars). Cyclicals are not that much more expensive than Defensives (22x vs. 19x forward earnings) and are trading with a 13% premium. The Cyclical/Defensive Valuations Indicator has come down from three to two standard deviations (Chart 23). Despite a modest valuations premium, earnings of Cyclical sectors are expected to grow at 25% while Defensives will only grow at 6% over the next 12 months. In short, Cyclicals are more attractive than Defensives as a group, but we prefer a granular approach and handpick cyclical sectors that we expect to thrive in the current macroeconomic environment and have favorable sales and earnings growth prospects. Later in the report, we will discuss some of our cyclical sector picks. Chart 23Relative Valuations Of Cyclicals Have Come Down But Are Still Rich
Relative Valuations Of Cyclicals Have Come Down But Are Still Rich
Relative Valuations Of Cyclicals Have Come Down But Are Still Rich
Despite Worries About Inflation, Consumers Still Have Money To Spend: Overweight Consumer Services The US government has supported consumers during the lockdowns with a series of helicopter cash drops to all Americans, enumerated in trillions of dollars. As a result, even nine months after the last cash disbursement, consumers are sitting on $2.3 trillion in excess savings (Chart 24). Extremely loose fiscal and monetary policy have lifted household net worth by 128% of GDP (Chart 25). And while consumers do indeed worry about inflation, expecting it to rise to 7.5% in 12 months, there is still plenty of dry powder sitting in their bank accounts. Chart 24Consumers And Businesses Have A Lot Of Dry Powder
Consumers And Businesses Have A Lot Of Dry Powder
Consumers And Businesses Have A Lot Of Dry Powder
Chart 25Household Wealth Has Soared
Household Wealth Has Soared
Household Wealth Has Soared
Consumer spending on goods has been above the pre-pandemic trend for months and has recently turned. In the meantime, spending on services is still below pre-pandemic levels, suggesting that there is plenty of pent-up demand (Chart 26). Specifically, spending on sports clubs, public transportation, personal care, medical services, and professional services are still below pre-pandemic levels. Pent-up demand will boost Consumer Services, and we recommend overweights to Hotels, Restaurants, Cruises, Amusement Parks, and Casinos, along with Commercial and Professional Services. Further, while pent-up demand for goods has generally been met, there are still pockets of demand out there due to shortages, such as for automobiles and selected consumer durables. We are also overweight Healthcare Equipment and Services which benefits from the backlog in elective procedures. Chart 26Spending On Services Is Still Below The Pre-pandemic Trend
Spending On Services Is Still Below The Pre-pandemic Trend
Spending On Services Is Still Below The Pre-pandemic Trend
New Capex Cycle: Overweight Industrials Industrials is another cyclical sector that we favor. Supply chain disruptions have demonstrated for many businesses that they need to bring their supply chains back to the US, launching the US Manufacturing Renaissance. Also, excess consumer demand has driven the need for expanded capacity. For months now, manufacturers have been inundated with orders (Chart 27). The industrial sector is also exposed to the restocking of inventories and is poised to benefit from the Infrastructure Bill. Therefore, Industrials will continue to benefit from the surge in capital expenditures, as evidenced by the sharp increase in US core capital goods orders. Capex intentions have been on the rise as well (Chart 28). Chart 27Producers Inundated With Orders And Need More Capacity
Producers Inundated With Orders And Need More Capacity
Producers Inundated With Orders And Need More Capacity
To profit from this emerging trend, we are overweight Construction and Engineering, Building Materials, and Capital Goods. Chart 28Surge In Capital Expenditure Will Benefit Industrials
Surge In Capital Expenditure Will Benefit Industrials
Surge In Capital Expenditure Will Benefit Industrials
New Credit Cycle: Overweight Banks 2021 was a blockbuster year for banks on the back of the booming M&A and IPO activity. However, to achieve sustainable profitability, they need to jumpstart the loan growth process. Both businesses and consumers have repaired their balance sheets, and the re-leveraging cycle is set to commence to finance Capex and higher price tag purchases like autos. There are early signs that lending is likely to pick up next year (Chart 29). According to JPM: “The customers who typically contribute to credit card loan growth are starting to spend the savings built up from the pandemic at a faster clip, suggesting they could be getting closer to taking on debt again.” Credit card spending is recovering (Chart 30). Chart 29Early Innings Of A New Credit Cycle
Early Innings Of A New Credit Cycle
Early Innings Of A New Credit Cycle
Chart 30Consumers Are Borrowing Again
Consumers Are Borrowing Again
Consumers Are Borrowing Again
While sell-side analysts anticipate that margins will decline, we believe that they may surprise on the upside: High operating leverage, improving pricing power, and growing demand for loans will contribute to strong profitability. Further, the BCA house view is 10-year rates rising to 2.0 – 2.25% in 2022, which will support net interest margins. Energy Sector Vs. Materials Energy profit margins are linked to underlying commodity prices. The BCA Commodity and Energy strategists’ view is that the medium-term supply/demand backdrop is highly supportive of the current energy pricing dynamics and that the oil price is expected to stay high, at around its current level, for the next two years. They also note that upside price risk is increasing going forward, due to inadequate Capex. Although the price of oil has risen above the break-even level, energy companies are reluctant to invest in Capex due to pressure from shareholder activists and newly found financial discipline (Chart 31). As a result, prices are likely to remain high until “high prices cure high prices.” In the meantime, energy producers are returning cash to shareholders – a unique bonus in the current world starved for yields. Oil demand is expected to stay robust on the back of the global economic recovery, especially with an increase in consumption by airlines that are resuming international travel. Case in point: ExxonMobil (XOM) “anticipates demand improvement in its downstream segment with a continued economic recovery.” Chart 31Chronic Underinvestment Is Driving Up Price Of Oil
Chronic Underinvestment Is Driving Up Price Of Oil
Chronic Underinvestment Is Driving Up Price Of Oil
Chart 32A Slowdown In China Is Hurting Demand For Raw Materials
A Slowdown In China Is Hurting Demand For Raw Materials
A Slowdown In China Is Hurting Demand For Raw Materials
Resource stocks, on the other hand, may not meaningfully outperform in 2022, at least not consistently – our views on China imply that metals and mining stocks may at least passively underperform in the first half of the year (Chart 32). US Housing Rally Still Has Legs To Run On The US housing market should post a solid performance next year on the back of the structural demand tailwinds: Since the GFC, around five million houses were underbuilt. This supply shortage also coincides with millennials, a cohort that has 11 million more people compared to the previous generation, starting families. The data is also reflective of the supply/demand mismatch with inventories of new and existing homes for sale, and the homeowner vacancy rate at all-time lows, and housing prices exploding higher. At the same time, US building permits are still below the two million SAAR print that historically marked previous housing cycle peaks (Chart 33). The implication is that the current housing boom still has room to go further, benefiting US homebuilders as they monetize the supply/demand mismatch. Homebuilder sentiment rose to a six-month high in November. Tack on the 80bps sell-off in the 30-year US Treasury yield that translates into more affordable mortgage rates for consumers, and there is little that can undercut the US housing market throughout 2022. We are bullish on both the Real Estate and Homebuilders sectors. However, we would be remiss not to mention risks to this call: The performance of the real estate market is highly dependent on the direction of the rates. If long rates rise substantially, this sector will be in the crosscurrents of housing shortages and less affordable mortgages. However, the 2-2.25% 10-year yield that BCA anticipates by end -2022 should not put a significant dent into house ownership affordability. Chart 33Housing Shortages Will Drive Multi-Year Outperformance of Real Estate And Homebuilders
Housing Shortages Will Drive Multi-Year Outperformance of Real Estate And Homebuilders
Housing Shortages Will Drive Multi-Year Outperformance of Real Estate And Homebuilders
Risks To The Outlook Rising rates are a key condition for our sector and style calls to pan out. However, if supply chain bottlenecks do not clear soon, inflation will not slow down meaningfully, and the US economy will enter a rising price-wage spiral. The Fed will realize that it is behind the curve and will start hiking rates aggressively, i.e., faster than the pace currently anticipated by the market. As a result, economic growth will disappoint, and the unemployment rate will rise. The yield curve will continue flattening with long rates staying range-bound or moving lower. In this scenario, Growth and Defensives will outperform, while Small, Value and Cyclicals will underperform. Multi-Year Structural Themes To finish, we want to remind clients of our long-term themes, which we expect to continue to pan out next year. Millennials Are Not Coming Of Age; They Are Already Here According to the US Census Bureau, millennials (born 1982 to 2000), are the US's largest living generation and represent more than one-quarter of the US population. This is a generation that is highly educated, and relatively unburdened by debt. While in the past, this generation was perceived as “forever young,” it is rapidly showing signs of maturing: Joining the labor force, starting families, and shopping for houses and cars, thereby pushing consumption up. However, millennials’ consumption basket is different, with an emphasis on new technology, homeownership, electric vehicles, and green energy. ETFs that capture the theme are MILN and GENY. Gen Z Is Coming Of Age And Has Money To Spend Generation Z in the US includes 62 million people born between 1997 and 2012. With $143B in buying power in the US alone, making up nearly 40% of all consumer sales, Gen Z wields increasing influence over consumer trends. This is the first generation of digital natives—they simply can’t remember the world without the internet. They are the early adopters of the new digital ways to bank, get medical treatments, and learn. Gen Z is joining the workforce and replacing retiring baby boomers. We have created a Gen Z basket with stocks representing fintech, investing and crypto, online gaming, quality-over-price, and some others. There are no ETFs just yet that capture this emerging theme. Cybersecurity Is A Must-Have Global digital transformation as well as rising geopolitical tensions create fertile ground for attacks by both cybercriminals and malicious state actors. The cyber defenses of most private and public companies are still ill-prepared, and the space is poised for robust growth since cybersecurity is a “must-have” for survival. This growing market has attracted a plethora of new cybersecurity players who provide cloud-based SaaS solutions and are well-versed in deploying AI and ML to counter cyber threats. While many of these companies are still young with relatively small capitalization, their potential is enormous. We recommend tactical and structural overweights to the theme. The following ETFs provide exposure to the theme: BUG, CIBR, and HACK. EV Revolution The auto industry is undergoing a major technological disruption. This process is expensive and perilous yet presents an enormous future earnings growth opportunity. And all the ingredients for success are in place: The proliferation of new technologies, government support, changing consumer preferences, and a surging US economy. This tide will lift all boats: Legacy and EV-only auto manufacturers and suppliers as well as EV ecosystem players. We are bullish on the sector on a 12-month investment horizon. ETFs are DRIV, IDRIV, KARS, BATT, and LIT. What We Are Researching For 2022 2022 will be a big year for the new technology themes. Some are brand new, while others have been around for a while. We are reading about gene editing, the metaverse, 3D printing, and cleantech. We will be sure to share what we learn in a series of Special Reports. Irene Tunkel Chief Strategist, US Equity Strategy irene.tunkel@bcaresearch.com Recommended Allocation
Highlights The risk to European stocks from higher yields is overstated for 2022. Not only do equities possess a valuation cushion compared to bonds, but also the stock returns/bond yields correlation remains positive. This positive correlation is only two decades old, and it is a consequence of the stabilization of inflation and inflation expectations, which caused bond yield changes to mostly reflect adjustment in anticipated economic activity. As long as the recent inflation upsurge peters off next year, the equity/yield correlation will remain positive in 2022. Despite this sanguine short-term view, the long-term outlook is fraught with risks because next year’s inflation decline will be temporary; inflation is on a secular uptrend. The equity returns/bond yield correlation will become negative toward the middle of the decade, which will create a major headwind for the secular returns of both stocks and bonds. Feature Extremely low yields and elevated valuations constitute a potentially toxic mix for the equity outlook next year. The logic is straightforward: if yields rise enough, nosebleed multiples will become unjustifiable and the stock market will crash. Chart 1Protection Against Higher Yields
Protection Against Higher Yields
Protection Against Higher Yields
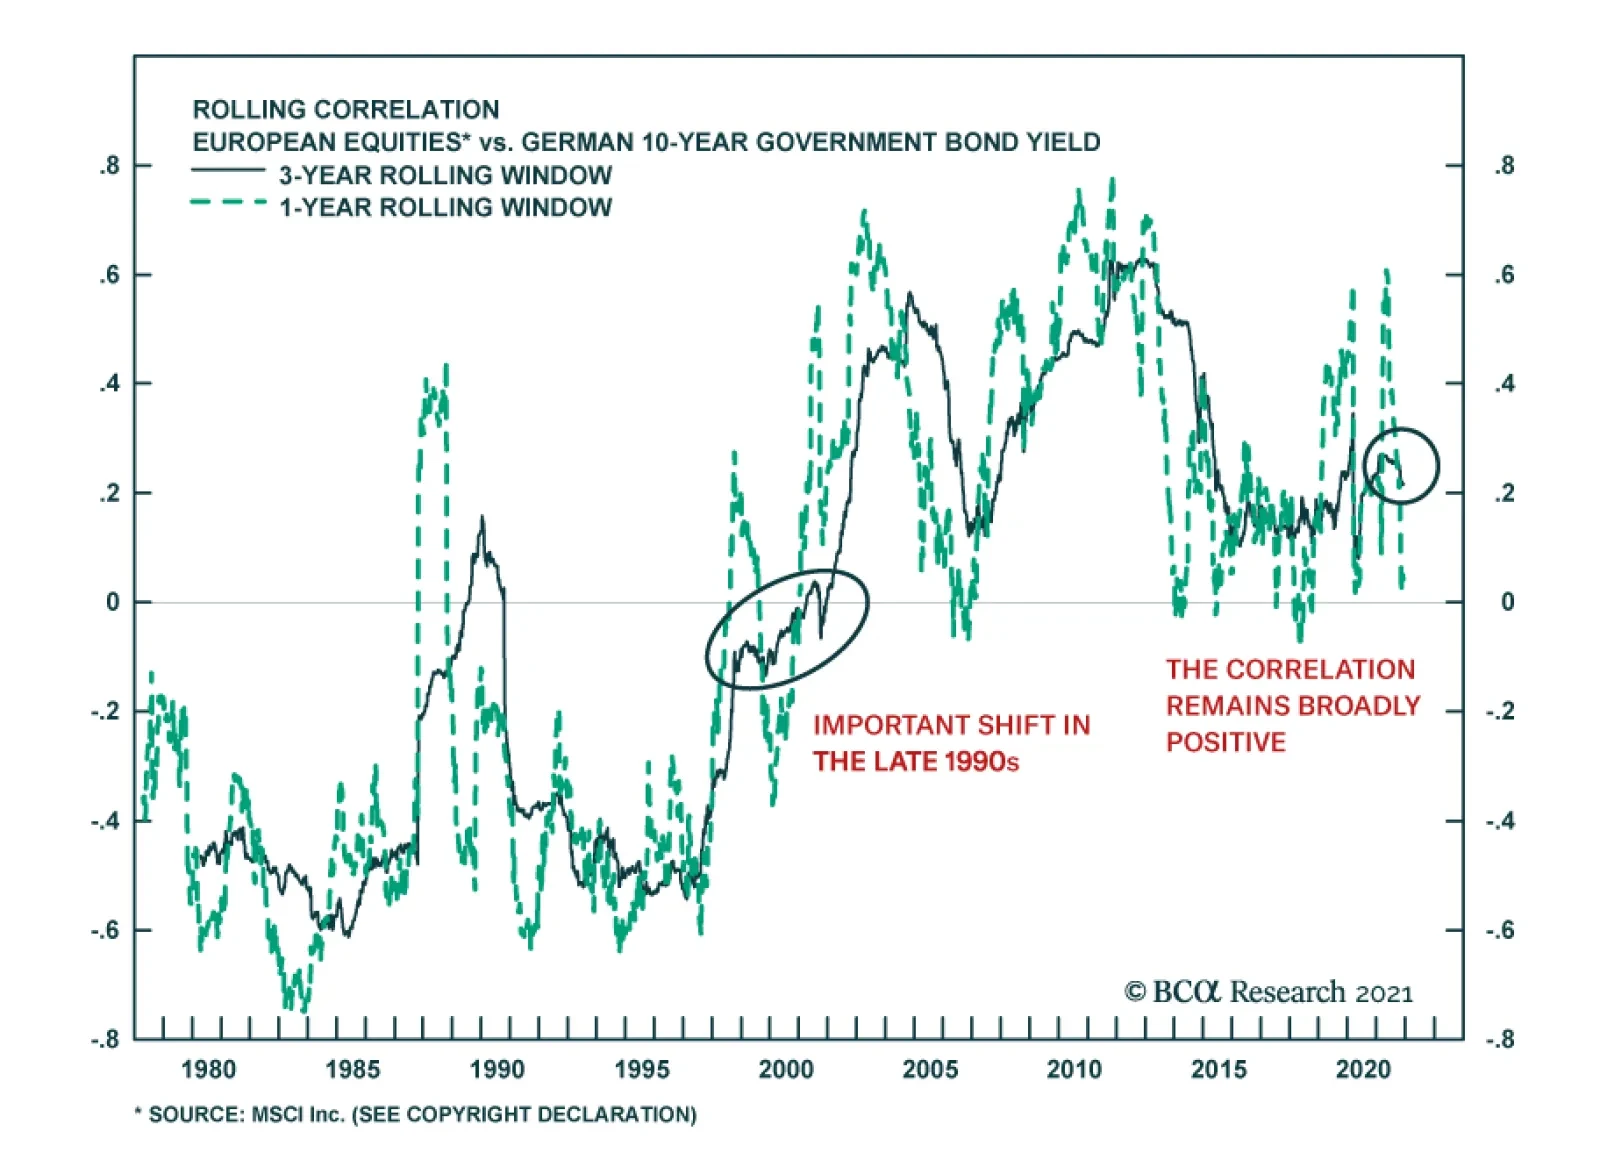
The picture is more complex and instead, European equities are likely to withstand higher yields. To begin with, BCA Research’s US Bond strategists anticipate a modest rise in Treasury yields to 2.25% in 2022, and our Global Fixed-Income strategists foresee an even more limited increase in German rates. Moreover, as we showed in our 2022 Key Views piece published last week, European equities embed a large valuation cushion in the form of a significant premium in their dividend yield relative to Bund yields (Chart 1). The correlation between yields and equities is another facet that will impact the effect of higher yields on the equity bull market. For now, it is premature to conclude that the positive correlation between yields and the absolute performance of European equities is poised to turn negative again in 2022. However, over the next couple of years, such a correlation reversal will take place, because inflation expectations are increasingly likely to become unmoored to the upside. Stocks Like Higher Yields Over the past two decades, one of the major financial market paradoxes has been the relationship between equity prices and bonds yields. Since 1998, the weekly returns of the MSCI Euro Area equity benchmark have correlated positively with the change in 10-year German yields (Chart 2). However, prior to the late 1990s, changes in bond yields and stocks prices were negatively correlated. Chart 2For Two Decades, Bond Yields And Stocks Prices Have Moved Together
For Two Decades, Bond Yields And Stocks Prices Have Moved Together
For Two Decades, Bond Yields And Stocks Prices Have Moved Together
The key to the shifting relationship between stocks and bonds is the link between yields and economic activity. Stock returns have always been procyclical because earnings are the most important driver of equity returns (Chart 3). However, bond yields have become increasingly pro-cyclical over time. Today, Bund yields and the German LEI move in tandem, but, prior to 1986, their five-year rolling correlation was negative (Chart 4). Chart 3Stocks Follow Earnings Who Follow Growth
Stocks Follow Earnings Who Follow Growth
Stocks Follow Earnings Who Follow Growth
Chart 4Shifting Link Between Bunds And German Growth
Shifting Link Between Bunds And German Growth
Shifting Link Between Bunds And German Growth
The positive correlation between German growth and German yields sheds light on why the correlation between yields and stocks is now positive, but it does not explain why this positive link emerged in the late 1990s and not earlier. Financial asset prices reflect global phenomena. Stock indices in advanced economies overrepresent multinationals which are affected by global economic fluctuations. Meanwhile, capital is fungible and flows freely across borders. As a result, German bond yields are not the unique factor that matters to the correlation between equities and stock. Instead, the behavior of global yields and equities is critical. Chart 5Living In The Shadow Of The Asian Crisis
Living In The Shadow Of The Asian Crisis
Living In The Shadow Of The Asian Crisis
According to this logic, the correlation between global yields and global growth becomes important. As Chart 5 illustrates, the relationship between global bond returns and global economic activity became much closer around 1998 than it was prior to this date. The key turning point was the Asian crisis of 1997/98. Why was the Asian crisis so fundamental? It was the end state of the disinflationary trend started under Federal Reserve Chairman Paul Volker. After the Asian crisis, the region’s newly industrialized economies switched from chronic current account deficits to chronic surpluses, which added to the global supply of savings. Moreover, Asian economies became hypercompetitive because of severely devalued exchange rates, which limited pricing power around the world. Finally, the Chinese economy became a force to be reckoned with and its share of global trade expanded massively. Together, these forces amplified competitive pressure around the world and made every inflation uptick self-limiting. The impact of the shock is visible in the inflation data. As Chart 6 shows, core inflation in the US and in the G7 has been stable since 1998, capped near 2.5%, except for 2021. Additionally, after the Asian crisis, the volatility of core inflation collapsed among both the G7 and Eurozone economies (Chart 7). Chart 62.5%, A 20-Year Old Ceiling
2.5%, A 20-Year Old Ceiling
2.5%, A 20-Year Old Ceiling
Chart 71998: RIP CPI Volatility
1998: RIP CPI Volatility
1998: RIP CPI Volatility
The effect of this steady inflation was to stabilize inflation expectations. Thus, after 1998, the most important driver of bond price annual changes has been fluctuations in anticipated real economic activity, which explains why the relationship between global bond returns and the global LEI became much tighter afterward (Chart 5, on page 4). This result is crucial to understand the impact of higher yields for equities. It suggests that, if rising yields reflect improving economic growth, then the correlation between yields and stocks will remain positive and equities may climb higher along with mounting long-term interest rates. Bottom Line: Higher yields do not necessarily portend the end of the equity bull market. Stock prices and bond yields have been positively correlated since the Asian crisis of 1997/98 because fluctuating growth expectations drive most of the change in yields. As long as this remains the case, equities can handle higher yields. Can The Correlation Shift Sign Again? The correlation between equities and bonds is not static. There are threats that could restore both temporarily or permanently the negative correlation between changes in bond yields and stock returns that prevailed prior to 1998. A Temporary Correlation Shift? Since their March 2020 lows, 10-year yields have increased 94bps and 51bps in the US and Germany, respectively. Meanwhile, the MSCI Eurozone equity benchmark is up 78%. We are clearly not yet in an environment in which rising long-term interest rates hurt stocks. In the short term, the correlation between yield changes and equity returns may turn negative if yield moves into constraining territory—this is to say, if they rise enough to risk a recession. In more academic terms, this equates to rates moving above the neutral rate of interest, or r-star. Chart 8A Long Way To Go Before Policy Becomes Tight
A Long Way To Go Before Policy Becomes Tight
A Long Way To Go Before Policy Becomes Tight
There is little indication that interest rates are moving above this level in the short term. US and European policy rates remain well below Taylor rule estimates of equilibrium (Chart 8), which suggests that policies are still highly accommodative. The most worrisome signal comes from the slope of the yield curve. Since March 2021, the US 2-/10-year yield curve has flattened by 76bps to 81bps and, since October 2021, the same yield curve has flattened by 23bps to 35bps in Germany. Moreover, the 20-/30-year US yield curve became inverted in October 2021. These dynamics may indicate that policy is already on the verge of becoming too tight, even if only five interest rate hikes are expected in the US over the next two years. Chart 9Term Premia Are Still Negative
Term Premia Are Still Negative
Term Premia Are Still Negative
A curve flattening episode is the normal course of events when central banks become less accommodative; it is not a sign of impending doom. Instead, an inverted yield curve is the indication that the policy rate is above r-star. After all, if interest rates genuinely constrain growth, they will slow economic activity in the future, which will necessitate lower rates and generate a negative curve slope. We are not there yet. Moreover, the term-premium remains negative across major advanced economies, which suggests that a recessionary signal will come from a deeper yield-curve inversion than in the past (Chart 9). Chart 10Upside To The Terminal Rate
Upside To The Terminal Rate
Upside To The Terminal Rate
Another factor likely to allow yields to rise without killing the equity market is that the expected terminal rate of interest remains too low, as we wrote in our 2022 Key Views piece last week. Historically, it is common for the expected terminal rate to rise as central banks begin to lift interest rates, especially if the economy handles the first hikes well. Today, the expected terminal rate is below the levels that prevailed after the GFC, despite a much firmer economy unburdened by private sector deleveraging and excessive fiscal tightening (Chart 10). As such, we anticipate the expected terminal rate to increase, which will limit how quickly the yield curve will flatten next year even if the Fed elevates interest rates and the ECB aggressively downshifts its pace of asset purchases once the PEPP ends. Chart 11Long-Term Inflation Expectations Are Not A Concern, Yet
Long-Term Inflation Expectations Are Not A Concern, Yet
Long-Term Inflation Expectations Are Not A Concern, Yet
Under this aperture, the biggest risk for stocks remains inflation. Further acceleration in inflation, especially if it pushes the 5-year/5-year forward inflation breakeven rate above the Fed’s comfort zone (Chart 11), could hurt stocks. Essentially, investors would price in a shift in the monetary policy environment whereby risks of a severe tightening would increase. However, as we recently wrote, the odds are mounting that short-term inflation will soon peak. Oil inflation is ebbing, while transportation costs are declining and supply bottlenecks are beginning to ease. Moreover, money growth in the US and the Eurozone, which proved relevant variables to explain inflation this year, is also waning (Chart 12). Finally, a mounting number of global central banks are tightening policy, which implies that maximum accommodation is behind us (Chart 13) In this context, we expect the positive correlation between stock returns and yield changes to remain broadly positive. A short-term rise in yields could easily contribute to equity market volatility and may even cause a deeper stock market correction than any experienced since April 2020. However, this will prove to be a temporary phenomenon, and thus we remain buyers of the dip. Chart 12Slowing Money Supply Growth, At Last
Slowing Money Supply Growth, At Last
Slowing Money Supply Growth, At Last
Chart 13Global Policy Is Becoming Less Easy
Global Policy Is Becoming Less Easy
Global Policy Is Becoming Less Easy
A Longer-Term Correlation Shift? A shift in the long-term correlation between equity returns and bond yield changes is a much more meaningful risk to stocks than short-term changes. BCA expects inflation to peak in the short term, but this will only be part of a stop-and-go process. Inflation is on a structural uptrend and so, any decline in 2022 and early 2023 will morph into renewed pressure, after the global output gap becomes positive again by the end of next year. Chart 14A Deflationary Tailwind Is Gone
A Deflationary Tailwind Is Gone
A Deflationary Tailwind Is Gone
Many structural forces are moving away from deflationary to inflationary. True, technological progress remains a deflationary anchor. However, this downward pressure on inflation is no longer buttressed by a deepening of globalization (Chart 14). Moreover, because of the rise of populism around the world over the past five years, fiscal policy is unlikely to move back to the austere Washington Consensus that dictated governance from President Reagan up to the moment President Trump took power. Additionally, ageing across advanced economies and China, as well as the so-called “Great Resignation,” will constrain the expansion of the global supply side. This background suggests that the period of flat inflation that prevailed from 1998 to 2020 is ending. As a corollary, inflation expectations will embark on a multi-year upward drift. This process is likely to loosen the correlation between economic activity and yields. As a result, the period of positive correlation between yield changes and equity returns is in its last innings. This will represent a major difficulty for asset allocators over the next ten to twenty years, as it points to poor long-term real returns for both bonds and stocks. Bottom Line: The correlation between stock returns and bond yield changes is likely to remain positive in 2022, which implies that European stocks will eke out another year of positive returns, despite BCA’s house view that yields will rise. However, the long-term outlook is more problematic. The growing likelihood that inflation is making a secular upturn means that the two-decades old positive correlation between equity returns and bond yield change will become negative again around the middle of the decade. This shift will have a profound and deleterious impact on both stocks’ and bonds’ secular returns. Mathieu Savary, Chief European Strategist Mathieu@bcaresearch.com Tactical Recommendations
The Correlation Convolution
The Correlation Convolution
Cyclical Recommendations
The Correlation Convolution
The Correlation Convolution
Structural Recommendations
The Correlation Convolution
The Correlation Convolution
Closed Trades Currency Performance Fixed Income Performance Equity Performance
Highlights The helicopter drops are over, … : The economic impact payments and supplemental unemployment insurance benefits may have stopped, but their full impact has yet to be felt. … but fiscal and monetary policy will continue to support demand, … : US households are sitting on more than $2 trillion of excess pandemic savings. If they were to spend just half of their stash over the next two or three years, the economy would gain a steady tailwind. … and the macro backdrop will remain equity-friendly, … : Monetary policy will be less accommodative going forward but it will remain solidly supportive of markets and the economy across all of 2022. … so investors should stick around for one last round: Equities and spread product outperform when monetary policy is easy. As long as COVID-19 doesn’t spring a nasty surprise, the expansion will continue and risk assets will once again generate positive excess returns over Treasuries and cash. Feature BCA editors’ annual sit-down with Mr. and Ms. X provides a welcome opportunity to gather our thoughts for the coming year and review how this year’s calls panned out. Looking back to this time last year,1 our risk-friendly recommendations performed well as the rationale behind them proved to be sound. Financial markets thrived in the wake of monetary and fiscal policy measures intended to err on the side of providing too much accommodation. The policy efforts were massive, and their support for markets and the economy has yet to be fully exhausted; indeed, their lengthy half-life is a key pillar of our sanguine 2022 outlook. Unlike last December, investors cannot look forward to peak accommodation in the year ahead; the peak is behind us and monetary and fiscal stimulus will be throttled back. The Fed is currently deliberating how much to accelerate its taper timetable, with an eye toward gaining the flexibility to hike rates sooner than previously planned. The hawkish turn foreshadowed by Chair Powell two weeks ago in Congressional testimony unsettled markets somewhat, but it is important to note that monetary policy settings are merely on track to become less accommodative – they are nowhere near crossing the line to restrictive and will not approach it anytime soon. Investors can be certain that markets will enjoy ample policy support across all of 2022 and we expect that equities will still be in a bull market when Mr. and Ms. X return to discuss the outlook for 2023. We are on board with the BCA consensus as detailed in the Bank Credit Analyst’s 2022 outlook.2 Early indications suggest that the Omicron variant will not be enough of a threat to provoke a negative growth surprise and we expect that the pandemic will recede in importance as the year unfolds. As it fades, supply chains should become less snarled, easing the near-term pressures that have been pushing prices higher. We expect that markets are overestimating inflation in the near term and that growth will be robust in the US and other developed economies. Despite the dialing back of some accommodation, monetary policy will remain easy, supporting economic activity and market valuations. We foresee another year of solidly positive excess returns for risk assets. The Economy Is Firing On All Cylinders You wouldn’t necessarily know it to talk with investors, much less consumer confidence survey respondents, but aggregate demand is surging and ought to remain robust going forward. Households are in fantastic shape. Although their net worth growth slowed in the third quarter, its 13% annualized seven-quarter (1Q20 through 3Q21) pace is within a whisker of all-time highs (Chart 1). They have accumulated $2.3 trillion of excess savings since the pandemic began and have plenty of capacity to borrow to augment their spending power. Just about anyone who wants a job can have one: the ratio of job openings to unemployed workers is making new highs (Chart 2) and the share of people in the labor force filing initial jobless claims is approaching the all-time lows set before the pandemic (Chart 3). Chart 1The Wealth Effect Will Support Consumption
The Wealth Effect Will Support Consumption
The Wealth Effect Will Support Consumption
Chart 2More Jobs Than People Without Them ...
More Jobs Than People Without Them ...
More Jobs Than People Without Them ...
Businesses are on a solid financial footing, as well. Debt as a share of net worth is near the lower end of its typical range since the high yield bond market got going in the late ‘80s (Chart 4). Borrowing costs are scraping all-time lows (Chart 5) and profit margins are wide (Chart 6). Banks and fixed income asset managers are falling all over themselves to lend to businesses and will continue to do so while default rates remain low. Chart 3... And Almost No Layoffs
... And Almost No Layoffs
... And Almost No Layoffs
Chart 4Corporations Have Less Debt And More Equity, ...
Corporations Have Less Debt And More Equity, ...
Corporations Have Less Debt And More Equity, ...
Chart 5... But Debt Has Never Cost Less ...
... But Debt Has Never Cost Less ...
... But Debt Has Never Cost Less ...
Chart 6... And Profit Margins Are Wide
... And Profit Margins Are Wide
... And Profit Margins Are Wide
Financial conditions will remain highly accommodative despite the Fed’s and other major developed world central banks’ moves to make them less easy at the margin. Below-equilibrium policy rates will continue to encourage financed purchases of homes, autos and other durable goods and entice investment via low hurdle rates. If sovereign bond yields rise modestly in 2022 in line with our high-conviction base case, governments won’t feel any pressure to tighten the fiscal screws. That may nourish modern monetary theory fantasies to the ultimate detriment of public finances, but it should ensure that all three engines of domestic demand – households, businesses and government – will hum in 2022. Omicron has reminded everyone that the pandemic is not over, but the shadow it casts on public health and economic activity is set to shrink. Booster shots of the Pfizer vaccine apparently provide effective protection, and Omicron’s mutations will not allow it to evade Merck’s and Pfizer’s soon-to-be-approved antiviral pills. The availability of pills to treat those who contract COVID could possibly be a game-changer in terms of neutralizing its global threat. Distributing shelf-stable pills is vastly simpler than delivering vaccines that need to be transported at temperatures below -70 degrees Fahrenheit. The Earnings Bar Has Been Set Very Low Our constructive view would not translate into risk friendly investment strategy if asset prices already discounted it or were expecting something even better. Just as the economy is on a better path than consumers seem to perceive and investors believe can persist, S&P 500 earnings per share are poised to grow over the next four quarters by more than the bottom-up analyst consensus expects. As compared to the simple annualized run rate of last quarter’s earnings ($215.76, or $53.89 times 4), the analyst consensus is calling for effectively no growth ($215.87) over the four quarters through 3Q22. That is a surprising prediction based on two sets of empirical evidence. First, earnings typically rise outside of recessions (Chart 7). Second, analysts have consistently forecast that forward four-quarter earnings would top the run rate of the last reported quarter’s earnings for four decades (Chart 8). This year, though, analysts have repeatedly called for quarter-over-quarter declines in earnings (Table 1), only to have reported numbers shred their estimates by jaw-dropping margins, just as they have in all six full quarters since COVID-19 arrived (Chart 9). We interpret the phase shift in the magnitude of earnings beats as evidence that companies have surprised themselves by how much they’ve been able to increase efficiency and/or cut costs during the pandemic. Our interactions with the investment community suggest that it has also been surprised but views the gains as one-off events that are unlikely to continue. Chart 7Earnings Declines Outside Of Recessions Are Rare
Earnings Declines Outside Of Recessions Are Rare
Earnings Declines Outside Of Recessions Are Rare
Chart 8This Has Been An Odd Time To Expect 40-Year Lows In Earnings Growth
This Has Been An Odd Time To Expect 40-Year Lows In Earnings Growth
This Has Been An Odd Time To Expect 40-Year Lows In Earnings Growth
Table 1Grim Expectations
2022 Key Views: Stay For One More Round
2022 Key Views: Stay For One More Round
Expectations of sequentially declining earnings would fit if the economy were flirting with falling below stall speed, as it regularly did during the sluggish post-GFC expansion. But they are completely at odds with the Bloomberg economist consensus that GDP will grow at a 5% real annualized rate this quarter and 3.9% in calendar 2022 (Table 2). Over time, S&P 500 revenue growth should converge with nominal GDP growth, so the current expectations for around 10% and 7% annualized nominal GDP growth in 4Q21 and 2022, respectively, are a decent starting point for estimating S&P 500 revenue growth over those periods. While we expect that S&P 500 profit margins have peaked, we do not foresee a sharp decline in 2022, and operating leverage should ensure that high single-digit revenue growth will translate into healthy earnings gains.
Chart 9
Table 2Above-Trend Growth Ahead
2022 Key Views: Stay For One More Round
2022 Key Views: Stay For One More Round
Bottom Line: The S&P 500 should have no trouble topping consensus estimates that foresee next to no growth in earnings over the next four quarters. There is ample room for corporate earnings to surprise to the upside. Our Major Disagreement With Markets Differences of opinion make markets and our biggest one pertains to the future direction of interest rates. We think the widespread conviction that the Fed will be unwilling or unable to raise the fed funds above 2%, if that, lest it crush financial markets and the real economy is way off base. The majority of investors seem to have taken the decade between the crisis and the pandemic as evidence that rates will remain very low for very long. Many of them must be buying the longer end of the Treasury curve in anticipation that an expedited liftoff date is the first step on the path to the next recession (Chart 10). Chart 10The Bond Market Sees Ice, Not Fire
The Bond Market Sees Ice, Not Fire
The Bond Market Sees Ice, Not Fire
The risk asset selloff that ensued in December 2018 after the FOMC marched the fed funds rate up to 2.5% looms large in the markets’ minds and feeds the widespread view that an ambitious program of rate hikes will pull the rug out from under financial assets and the economy. Many investors have also been conditioned by the post-crisis decade to assume that inflation cannot exceed 2% for a sustained period. The market view is rooted in honest-to-goodness evidence, but we think it is of little relevance now, given the way the massive pandemic fiscal stimulus programs have altered the backdrop. In the space of thirteen months from March 2020 through March 2021, Congress passed bills injecting over $5 trillion of aid – 25% of a year’s GDP – into the economy. The Herculean effort contrasted sharply with the skittish disbursement of less than 5% of GDP on the Bush and Obama administrations’ watch from 2008 through 2010. The aftermath of the crisis demonstrated that even multiple rounds of QE do not by themselves trigger inflation, especially if demoralized households and businesses are disinclined to borrow money to consume or invest, and chastened banks are subjected to regulatory strictures forcing them to maintain sizable new capital buffers and discouraging them from making any but plain-vanilla loans to highly rated borrowers. The Bernanke Fed’s three rounds of QE presumably tamped down interest rates, but the cash that bought the Treasury and agency securities barely tiptoed into the wider world before the primary dealer banks sent it right back to the Fed as excess reserves. With banks hiding their QE money under the mattress, the money supply didn’t expand in any notable way after the crisis. Thanks to Congress’ series of 2020-21 helicopter drops, the money supply has been growing at rates that would make the late Paul Volcker’s head spin (Chart 11). Inflation is fiendishly more complicated than Milton Friedman’s always-and-everywhere dictum suggests, but there’s now a whole lot of money chasing a limited amount of goods, services and assets. We expect that a receding pandemic will allow greater quantities of goods and services to be produced, and that securities underwriters and their clients are hard at work ramping up asset supply, but inflation has far more of a chance to gain traction now than it did in the decade before the pandemic. Chart 11Bringing "Always And Everywhere" Back Into Vogue?
Bringing "Always And Everywhere" Back Into Vogue?
Bringing "Always And Everywhere" Back Into Vogue?
We therefore think the lower-for-longer and lower-for-ever crowd will find itself offsides at some point in the next few years. We do not think it will get its comeuppance in 2022, however, as we see long yields rising only modestly, with the 10-year Treasury yield ending next year at 2-2.25%. Though we expect the fed funds rate will end the upcoming hiking cycle well north of 2%, bringing about the end of the bull markets in equities and credit, and quite possibly inducing the next recession, we do not think markets will abandon their new-normal rates view by the end of next year. This story will be continued, likely with a greater sense of urgency, in our 2023 outlook. Investment Recommendations Consistent with the foregoing, we make the following recommendations for 2022: Overweight equities in multi-asset portfolios. Although they are not cheap, and may experience a turbulent ride in 2022 as inflation concerns wax and wane, COVID-19 infections periodically surge and the Fed tries to adjust its messaging and actions on the fly, stocks should continue to generate sizable positive excess returns over Treasuries and cash. Overweight cyclical sectors and underweight defensive sectors within equity portfolios. If we’re right to be constructive on the global economy, Energy, Industrials, Materials and Financials are better positioned to benefit than Health Care, Staples and Utilities. Overweight small-cap equities versus large-cap equities. The S&P 600 SmallCap Index has greater exposure to our cyclicals-over-defensives call and our US Equity Strategy colleagues highlight that its constituents are cheaper than the S&P 500’s and are projected to have better earnings growth. Adding small-cap exposure to equity portfolios aligns with our constructive view on the economy and markets. Underweight fixed income in multi-asset portfolios. Underweight Treasuries within bond portfolios. Maintain below-benchmark duration within bond portfolios. Though we do not expect the bond market to see things entirely our way next year, we think the long end of the yield curve will shift out somewhat. We therefore have little appetite for duration and Treasuries and expect spread product will outperform Treasuries and high-yield corporate bonds will outperform investment-grade corporates. Consider hybrid alternatives to traditional fixed income securities. When we roll out our multi-asset ETF portfolio next month, it will include a hybrid bucket of income-generating assets to help multi-asset investors seeking income find low-beta destinations with a fighting chance of generating positive real total returns. Doug Peta, CFA Chief US Investment Strategist dougp@bcaresearch.com Footnotes 1 Please see the December 14, 2020 US Investment Strategy Report, "2021 Key Views: It’s The Policy, Stupid." 2 Please see the December 2021 Bank Credit Analyst, "OUTLOOK 2022: Peak Inflation – Or Just Getting Started?"
Highlights 1. How will the pandemic resolve? 2. Will services spending recover to its pre-pandemic trend? 3. Will we spend our excess savings? 4. How will central banks react to inflation? 5. Will cryptocurrencies continue to eat gold’s lunch? 6. How fragile is Chinese real estate? 7. Will there be another shock? Fractal analysis: Personal goods versus consumer services. Feature Chart of the WeekWill Services Spending Recover To Its Pre-Pandemic Trend?
Will Services Spending Recover To Its Pre-Pandemic Trend?
Will Services Spending Recover To Its Pre-Pandemic Trend?
“Judge a man by his questions, not by his answers” The quotation above is often misattributed to Voltaire instead of its true author, Pierre-Marc-Gaston de Lévis. Irrespective of the misattribution, we agree with the maxim. Asking the right questions is more important than finding answers to the wrong questions. In this vein, this report takes the form of the seven crucial questions for 2022 (and our answers). 1. How Will The Pandemic Resolve? As new variants of SARS-CoV-2 have arrived like clockwork, the number of new global cases of infection and the virus reproduction rate have formed a near-perfect mathematical ‘sine wave’. This near-perfect sine wave will propagate into 2022 (Chart I-2). Chart I-2The Pandemic's Sine-Wave Will Propagate Into 2022
The Pandemic's Sine-Wave Will Propagate Into 2022
The Pandemic's Sine-Wave Will Propagate Into 2022
But how will this sine wave of infections translate into mortality, morbidity, and stress on our healthcare systems? As we explained in RNA Viruses: Time To Tell The Truth, the answer depends on the specific combination of contagiousness, immuno-evasion, and pathogenicity of each variant. Yet none of this should come as any surprise. Flus and colds also come in waves, which is why we call them flu and cold seasons. And the morbidity of a given flu and cold season depends on the aggressiveness of that season’s flu and cold variant. So, just like the flu and the cold, Covid will become an endemic respiratory disease which comes in waves. The trouble is that our under-resourced health care systems can barely cope with a bad flu season, let alone with an additional novel disease that can be worse than the flu. Hence, until we add enough capacity to our healthcare systems, expect more disruptions to economic activity from periodic non-pharmaceutical interventions such as travel bans, vaccine passports, and face-mask mandates. 2. Will Services Spending Recover To Its Pre-Pandemic Trend? The pandemic has given us a crash course in virology and epidemiology. We now understand antigens, antibodies, and ‘reproduction rates.’ We understand that a virus transmits as an aerosol in enclosed unventilated spaces, and that singing, and yelling eject this viral aerosol. We understand that vaccinations for RNA viruses have limited longevity, do not prevent reinfections, and that certain environments create ‘super-spreader’ events. Armed with this new-found awareness, a significant minority of people have changed their behaviour. Services which require close contact with strangers – going to the dentist or in-person doctors’ appointments, going to the cinema or to amusement parks, or using public transport – are suffering severe shortfalls in demand. Given that this change in behaviour is likely long-lasting, demand for these services is unlikely to regain its pre-pandemic trend in 2022 (Charts I-3 - I-6). Chart I-3Dental Services Are Far Below The Pre-Pandemic Trend
Dental Services Are Far Below The Pre-Pandemic Trend
Dental Services Are Far Below The Pre-Pandemic Trend
Chart I-4Physician Services Are Far Below The Pre-Pandemic Trend
Physician Services Are Far Below The Pre-Pandemic Trend
Physician Services Are Far Below The Pre-Pandemic Trend
Chart I-5Recreation Services Are Far Below The Pre-Pandemic Trend
Recreation Services Are Far Below The Pre-Pandemic Trend
Recreation Services Are Far Below The Pre-Pandemic Trend
Chart I-6Public Transportation Is Far Below The Pre-Pandemic Trend
Public Transportation Is Far Below The Pre-Pandemic Trend
Public Transportation Is Far Below The Pre-Pandemic Trend
Therefore, to keep overall demand on trend, spending on goods will have to stay above its pre-pandemic trend. This will be a tough ask. Durables, by their very definition, last a long time. Even clothes and shoes, though classified as nondurables, are in fact quite durable. Meaning that are only so many cars, iPhone 13s, gadgets, clothes and shoes that any person can own before reaching saturation. If, as we expect, spending on goods falls back to its pre-pandemic trend, but spending on services does not recover to its pre-pandemic trend, then there will be a demand shortfall in 2022 (Chart of the Week). 3. Will We Spend Our Excess Savings? If spending falls short of income – as it did through the pandemic – then, by definition, our savings have gone up. Many people claimed that this war chest of savings would unleash a tsunami of spending. Well, it didn’t. And, it won’t. Previous episodes of excess savings in 2004, 2008, and 2012 had no impact on the trend in spending (Chart I-7).
Image
The explanation comes from a theory known as Mental Accounting Bias. The theory states that we segment our money into different accounts, which are sometimes physical, sometimes only mental, and that our willingness to spend money depends on which mental account it occupies. This contrasts with standard economic theory which assumes that money is perfectly fungible, meaning that a dollar in a current (checking) account is no different to a dollar in a savings or investment account. In practice, money is not fungible, because we attach different emotions to our different mental accounts. A dollar in our current account we will gladly spend, but a dollar in our savings account we will not spend. Hence, the moment we move the dollar from our current account into our savings account, our willingness to spend it collapses. This explains why consumption trends have no connection with windfall income receipts once those income receipts end up in our savings mental or physical account. Pulling all of this together, the war chest of savings accumulated during the pandemic is unlikely to change the overall trend in spending. 4. How Will Central Banks React To Inflation? The real story of the current ‘inflation crisis’ is that while goods and commodity prices have surged exactly as expected in a positive demand shock, services prices have not declined as would be expected in the mirror-image negative demand shock. The result is that aggregate inflation has surged even though aggregate demand has not (Chart I-8 and Chart I-9). Chart I-8Goods Prices Have Reacted To A Positive Demand Shock...
Goods Prices Have Reacted To A Positive Demand Shock...
Goods Prices Have Reacted To A Positive Demand Shock...
Chart I-9...But Service Prices Have Not Reacted To A Negative Demand Shock
...But Service Prices Have Not Reacted To A Negative Demand Shock
...But Service Prices Have Not Reacted To A Negative Demand Shock
Why have services prices remained resilient despite a massive negative demand shock? One answer, as explained in question 2, is that much of the shortfall in services demand is due to behavioural changes, which cannot be alleviated by lower prices. If somebody doesn’t go to the dentist or use public transport because he is worried about catching Covid, then lowering the price will not lure that person back. In fact, the person might interpret the lower price as a signal of greater risk, and might become more averse. In technical terms, the price elasticity of demand for certain services has flipped from its usual negative to positive. This creates a major problem for central banks, because if the price elasticity of services demand has changed, then surging aggregate inflation is no longer a reliable indicator of surging aggregate demand. To repeat, inflation is surging even though aggregate demand is barely on its pre-pandemic trend. Hence in 2022, central banks face a Hobson’s choice. Choke demand that does not need to be choked, or turn a blind eye to inflation and risk losing credibility. 5. Will Cryptocurrencies Continue To Eat Gold’s Lunch? Most of the value of gold comes not from its economic utility as a beautiful, wearable, and electrically conductive metal, but from its investment value as a hedge against the debasement of fiat money. The multi-year investment case for cryptocurrencies is that they are set to displace much of gold’s investment value. Still, to displace gold’s investment value, cryptocurrencies need to match its other qualities: an economic utility, and limited supply. A cryptocurrency’s economic utility comes from its means of exchange for the intermediation services that its blockchain provides. For example, if you issue a bond or smart-contract using the Ethereum blockchain, then you must pay in its cryptocurrency ETH. Which gives ETH an economic utility. Furthermore, the number of blockchains that will succeed as go-to places for intermediation services will be limited, and each cryptocurrency has a limited supply. Thereby, the supply of cryptocurrencies that have a utility is also limited. With an economic utility, a limited supply, and drawdowns that are becoming smaller, cryptocurrencies can continue to displace gold’s dominance of the $12 trillion anti-fiat investment market. Therefore, the cryptocurrency asset-class can continue its strong structural uptrend, albeit punctuated by short sharp corrections (Chart I-10). Chart I-10Cryptocurrencies Will Continue To Displace Gold's Investment Value
Cryptocurrencies Will Continue To Displace Gold's Investment Value
Cryptocurrencies Will Continue To Displace Gold's Investment Value
The corollary is that the structural outlook for gold is poor. 6. How Fragile Is Chinese Real Estate? A decade-long surge in Chinese property prices has lifted Chinese valuations to nosebleed levels. According to global real estate specialist Savills, prime real estate yields in China’s major cities are now barely above 1 percent, and the world’s five most expensive cities are all in China: Hangzhou, Shenzhen, Guangzhou, Beijing, and Shanghai (Chart I-11).
Chart I-11
Without a social safety net and with limited places to park their money, Chinese savers have for years been encouraged to buy homes, in the widespread belief that property is the safest investment, whose price only goes up. With the bulk of people’s wealth in property acting as a perceived economic safety net, even a modest decline in house prices would constitute a major shock to the household sector’s hopes and expectations of what property is. Therefore, in contrast to the US housing debacle in 2008, the Chinese government will ensure that its property market adjustment does not come from a collapse in home prices. Rather, it will come from a collapse in property development and construction activity. This will have negative implications for commodities, emerging Asia, developing countries that produce raw materials, and machinery stocks worldwide. 7. Will There Be Another Shock? Most strategists claim that shocks, such as the pandemic, are unpredictable. We disagree. Yes, the timing and source of an individual shock is unpredictable, but the statistical distribution of shocks is highly predictable. We define a shock as any event that causes the long-duration bond price in a major economy to rally or slump by at least 20 percent.1 Using this definition through the last 60 years, the statistical distribution of the number of shocks in any ten-year period is Poisson (3.33) and the time between shocks is Exponential (3.33). This means that in any ten-year period, the likelihood of suffering a shock is a near-certain 95 percent; in any five-year period, it is an extremely high 80 percent; in a two-year period it is a coin toss at 50 percent; and even in one year it is a significant 30 percent (Chart I-12).
Chart I-12
Therefore, on a multi-year horizon, another shock is a near-certainty even if we do not know its source or precise timing. The question is, will it be net deflationary, or net inflationary? Our high-conviction view is that it will be net deflationary. Meaning that even if it starts as inflationary, it will quickly morph into deflationary. The simple reason is that it is not just Chinese real estate that is fragile. Through the past ten years, world prime residential prices are up by 70 percent while rents are up by just 25 percent2 (Chart I-13). Meaning that the bulk of the increase in global real estate prices is due to skyrocketing valuations. The culprit is the structural collapse in global bond yields – which, in turn, is due to persistently ultra-low policy interest rates combined with trillions of dollars of quantitative easing. Chart I-13Property Price Inflation Has Far Exceeded Rent Inflation
Property Price Inflation Has Far Exceeded Rent Inflation
Property Price Inflation Has Far Exceeded Rent Inflation
This means that bond yields have very limited scope to rise before pulling the bottom out of the $300 trillion global real estate market. Given that this dwarfs the $90 trillion global economy, it would constitute a massive deflationary backlash to the initial inflationary shock. Some people counter that in an inflationary shock, property – as the ultimate real asset – ought to perform well even as bond yields rise. However, when valuations start off in nosebleed territory as now, the initial intense headwind from deflating valuations would obliterate the tailwind from inflating incomes. Investment Conclusions To summarise, 2022 will be a year in which: Covid waves continue to disrupt the economy; a persistent shortfall in spending on services is not fully countered by excess spending on goods; China’s construction boom comes to an end; inflation takes time to cool, pressuring central banks to raise rates despite fragile demand; and the probability of another shock is an underestimated 30 percent. We reach the following investment conclusions: Overweight the China 30-year bond and the US 30-year T-bond. There will be no sustained rise in long-duration bond yields, and the risk to yields is to the downside. Long-duration equity sectors and stock markets that are least sensitive to cyclical demand will continue to rally (Chart I-14). Chart I-14The US Stock Market = The 30-Year T-Bond Multiplied By Profits
The US Stock Market = The 30-Year T-Bond Multiplied By Profits
The US Stock Market = The 30-Year T-Bond Multiplied By Profits
Overweight the US versus non-US. Underweight Emerging Markets. Underweight old-economy cyclical sectors such as banks, materials, and industrials. Commodities will struggle. Underweight commodities that haven’t corrected versus those that have (Chart I-15). Chart I-15Underweight Commodities That Haven't Yet Corrected
Underweight Commodities That Haven't Yet Corrected
Underweight Commodities That Haven't Yet Corrected
Overweight the US dollar versus commodity currencies. Cryptocurrencies will continue their structural uptrend at the expense of gold. Goods Versus Services Is Technically Stretched Finally, this week’s fractal analysis corroborates the massive displacement from services spending into goods spending, highlighted by the spectacular outperformance of personal goods versus consumer services. This outperformance is now at the point of fragility on its 260-day fractal structure that has signalled previous reversals (Chart I-16). Therefore, a good trade would be to short personal goods versus consumer services, setting a profit target and symmetrical stop-loss at 12.5 percent. Chart I-16Underweight Personal Goods Versus Consumer Services
Underweight Personal Goods Versus Consumer Services
Underweight Personal Goods Versus Consumer Services
Dhaval Joshi Chief Strategist dhaval@bcaresearch.com Footnotes 1 As bond yields approach their lower limit, this definition of a shock will need to change as it will become impossible for long-duration bond prices to rally by 20 percent. 2 Based on Savills Prime Index: World Cities – Capital Values, and World Cities – Rents and Yields, June 2011 through June 2021. Fractal Trading System Fractal Trades 6-Month Recommendations Structural Recommendations Closed Fractal Trades Indicators To Watch - Bond Yields Chart II-1Indicators To Watch - Bond Yields - Euro Area
Indicators To Watch - Bond Yields - Euro Area
Indicators To Watch - Bond Yields - Euro Area
Chart II-2Indicators To Watch - Bond Yields - Europe Ex Euro Area
Indicators To Watch - Bond Yields - Europe Ex Euro Area
Indicators To Watch - Bond Yields - Europe Ex Euro Area
Chart II-3Indicators To Watch - Bond Yields - Asia
Indicators To Watch - Bond Yields - Asia
Indicators To Watch - Bond Yields - Asia
Chart II-4Indicators To Watch - Bond Yields - Other Developed
Indicators To Watch - Bond Yields - Other Developed
Indicators To Watch - Bond Yields - Other Developed
Indicators To Watch - Interest Rate Expectations Chart II-5Indicators To Watch - Interest Rate Expectations
Indicators To Watch - Interest Rate Expectations
Indicators To Watch - Interest Rate Expectations
Chart II-6Indicators To Watch - Interest Rate Expectations
Indicators To Watch - Interest Rate Expectations
Indicators To Watch - Interest Rate Expectations
Chart II-7Indicators To Watch - Interest Rate Expectations
Indicators To Watch - Interest Rate Expectations
Indicators To Watch - Interest Rate Expectations
Chart II-8Indicators To Watch - Interest Rate Expectations
Indicators To Watch - Interest Rate Expectations
Indicators To Watch - Interest Rate Expectations
The S&P 500 return is becoming concentrated once again. Over the past three months, the combined return from the 257 S&P stocks that rallied was 316 index points, 62 (20%) of which came from only two tickers: MSFT and AAPL. As a group, FAANG-like stocks represent high-quality defensive Growth due to their sheer size, liquidity, predictable and growing cash flows, and sound balance sheets.
Chart
High-quality growth stocks outperform in an environment of slowing growth and falling 10-year US Treasury yield as it justifies the valuations premium FAANGs command (see Charts 1 & 2). Further, FAANGs also provide downside protection during times of heightened risk aversion (please see here). However, the BCA house view remains that US Treasury rates will rise over the course of 2022, and that economic growth will remain above trend. In this scenario, Growth will underperform Value, and Small caps will outperform Large caps. Bottom Line: We recommend staying away from FAANG-like stocks in 2022, and funneling funds into the other 495 S&P 500 stocks.
Revisiting S&P 5 Vs S&P 495
Revisiting S&P 5 Vs S&P 495
Revisiting S&P 5 Vs S&P 495
Revisiting S&P 5 Vs S&P 495
Highlights Indian stocks need more time to digest and consolidate the significant gains from earlier this year. However, the country’s medium and long-term growth outlook remains positive. Indian firms’ profit margins will likely settle at a higher level than usual. That will also put a floor on its equity multiples. With an imminent topline recovery, the main driver of Indian stocks next year will be profits, in contrast with multiple expansions during the last year and a half. India is beginning a cyclical expansion with a cheap rupee. Stay neutral Indian stocks in an EM equity basket for now. Investors should overweight India in an EM domestic bond portfolio. Feature Chart 1Indian Stocks Are Overbought
Indian Stocks Are Overbought
Indian Stocks Are Overbought
We tactically downgraded Indian stocks from overweight to neutral in EM and emerging Asian equity portfolios in early October this year. This call has worked out well so far as India’s absolute and relative share prices seem to have peaked. The primary reason for our tactical “neutral” call on Indian equities was this market’s vertical rise earlier this year, both in absolute and relative terms. Similar spikes – in terms of magnitude and duration back in 2007 and in 2014 – were followed by a period of underperformance (Chart 1). Yet, we recommended downgrading to only a neutral allocation. The reason is that the country’s cyclical outlook remains constructive, and the profit expansion cycle has further to run. That forbade us from turning too bearish on this bourse. A neutral stance on India also makes sense for the next several months as this bourse digests and consolidates its previous gains. In this report, we detail the various nuances of our analysis. Meanwhile, the Indian currency is cheap versus the greenback and will likely be one of the best performing currencies in the EM world over the next year. A positive currency outlook also makes Indian government bonds attractive for foreign investors, as Indian bonds also offer a high yield amid a benign domestic inflation backdrop. Dedicated EM domestic bond portfolios should stay overweight India. Equity Multiple Compression Ahead? Chart 2India's Profit Margin Expansion Has Led To Its Equity Re-Rating
India's Profit Margin Expansion Has Led To Its Equity Re-Rating
India's Profit Margin Expansion Has Led To Its Equity Re-Rating
An upshot to the steep equity rally earlier this year has been India’s stretched valuations. That made many investors question the sustainability of the outperformance. A pertinent question, therefore, is how overvalued have Indian stocks become? And how much multiple compression can investors expect in this bourse? Before we answer this question, it’s useful to understand what drove the cyclical re-rating of Indian markets in the first place. The solid black line in Chart 2 shows the gross profit margins of all Indian listed non-financial firms. They have risen substantially since spring 2020 to reach decade-high levels. Margin expansions of this magnitude are indicative of material efficiency gains; and are usually rewarded with an equity re-rating. This is indeed what happened since spring 2020: stock multiples rose following the expanding margins. The same can be said if we only consider the major non-financial corporations’ EBITDA margins (Chart 2, bottom panel). If one looks at the cyclically adjusted P/E ratio (CAPE) instead, we see a very similar thing: the CAPE ratio has also risen in line with rising profit margins (Chart 3). Chart 3Profit Margins Have A Bearing On Equity Valuations
Profit Margins Have A Bearing On Equity Valuations
Profit Margins Have A Bearing On Equity Valuations
Charts 2 and 3 show that the positive correlations between profit margins and stock multiples held steady over past several cycles. Hence, it will be reasonable to expect that should Indian firms hold on to wide margins, they will not suffer a significant de-rating going forward. Can Margins Stay Wide? Chart 4Indian Firms' Borrowing Costs Will Likely Stay Low
Indian Firms' Borrowing Costs Will Likely Stay Low
Indian Firms' Borrowing Costs Will Likely Stay Low
Before we delve into the question of whether margins can stay wide, we need to understand what caused such a margin expansion in the first place. That cause is cost cutting: wage bills have gone down as businesses slashed employees. Data from Oxford economics show that there had been 9% fewer workers in India as of September 2021 compared to March 2020, just before the pandemic. Interest expense has also gone down – both relative to sales and profits (Chart 4) – as interest rates were cut aggressively. In our view, the latest rollover in profit margins will likely be temporary and limited. It is probably due to hiring back of some employees. Beyond a near-term limited drop in margins, the more relevant question to ask is, can Indian corporations maintain high margins? Our bias is that, to a large extent, they can. The main reason is that firms’ costs are slated to stay under control: Chart 5Indian Companies Do Not Face Any Wage Pressures
Indian Companies Do Not Face Any Wage Pressures Firms' Costs Will Likely Stay Low As Wage Pressures Are Muted...
Indian Companies Do Not Face Any Wage Pressures Firms' Costs Will Likely Stay Low As Wage Pressures Are Muted...
Wage expectations are low. Going forward, as millions of new job seekers and workers temporarily discouraged by the pandemic enter the job market, wages have little chance of much of an increase. The top panel of Chart 5 shows salary expectations from an industrial survey by RBI. Both the assessment for the current quarter and expectations for the next quarter have been a net negative for a while. Rural wages are also similarly timid (Chart 5, bottom panel). Notably, companies’ hiring back of employees is slow. It seems they prefer to substitute labor by capital by investing in new machines and equipment. This will boost productivity and cap wages. Overall, high productivity growth will keep companies’ profit margins wide and excess labor will suppress wages. Higher margins and low inflation are bullish for the stock market. Critically, headline inflation is within the central bank target bands, and our model shows that it will likely remain as such (Chart 6, top panel). Core inflation is also likely to stay flattish (Chart 6, bottom panel). This means the odds are that the central bank will not raise rates anytime soon. Flattish inflation and policy rates mean firms’ borrowing costs, in both nominal and real terms, are slated to stay approximately as low as they are now. Low real borrowing costs are usually a tailwind for stocks (Chart 7).
Chart 6
Chart 7Low Borrowing Costs Are Bullish For Stocks
Low Borrowing Costs Are Bullish For Stocks
Low Borrowing Costs Are Bullish For Stocks
All put together, Indian companies will likely see their costs largely under control. That, in turn, should keep profit margins wider than usual. Wide profit margins should limit multiple compression. Can The Topline Rise Further? Wider margins will boost total profits if and once the topline (revenues) recovers. So, the next question is, how much topline recovery is in the cards? Chart 8Indian Economy Is In A Rapid Expansion Mode
Indian Economy Is In A Rapid Expansion Mode
Indian Economy Is In A Rapid Expansion Mode
There are already signs that sales will likely accelerate in the months to come: PMI indexes for both the manufacturing and services sectors have recovered strongly since the Delta variant-induced lockdowns in spring. They are now hovering around a very high level of close to 60. This indicates that the economy is in a rapid expansion mode (Chart 8). The Industrial Outlook survey (conducted by the RBI) shows that the order books for the September quarter was already at a decade-high level. The expectation for the next few quarters is even more elevated – indicating strong momentum (Chart 9, top panel). In other surveys, such as the PMI and Business Expectation survey (from Dun & Bradstreet), we see similar strong order books (Chart 9, bottom panel). While orders are strong, inventory of finished goods is low. Not surprisingly, businesses are expecting very high-capacity utilization in the next few quarters (Chart 10, top two panels). Chart 9Firms' Order Books Are Quite Robust
Firms' Order Books Are Quite Robust
Firms' Order Books Are Quite Robust
Chart 10Low Inventories Mean Stronger Economic Activity Ahead
Low Inventories Mean Stronger Economic Activity Ahead
Low Inventories Mean Stronger Economic Activity Ahead
They are expecting to hire more people. Companies also believe consumer demand will revive which will enable wider profit margins. In sum, firms are optimistic about accelerating economic activity (Chart 10, bottom two panels). Chart 11A Positive Bank Credit Impulse Is Bullish For Industrial Activity
A Positive Bank Credit Impulse Is Bullish For Industrial Activity
A Positive Bank Credit Impulse Is Bullish For Industrial Activity
This, in turn, is encouraging them to make capital investments. Finally, the commercial banks’ credit impulse has also turned positive. Rising bank credit impulses usually signal stronger industrial production (Chart 11). To summarize, chances are that firms’ top lines are set to rise materially. Coupled with high margins, this will translate into strong profit acceleration in the next several quarters. Put differently, over the past year and a half, Indian firms witnessed rising margins. Going forward, they will likely see rising profits. Higher profits, in turn, will propel Indian share prices cyclically beyond any short-term consolidation. A Sustainable Expansion? In a notable departure from most developed countries, India’s recovery from the pandemic-induced recession has been more capex-led, rather than consumption-led (Chart 12). One reason for that is the Indian government did not supplement the lost household incomes during the lockdowns nearly as much as developed countries did. That, in turn, kept household demand low. And it also contributed to keeping inflation in check – even though India’s supply side was also paralyzed due to strict lockdown measures. On the other hand, firms’ profits soared owing to rigorous cost-cutting. Higher profits in turn have encouraged firms to expand their production capacity. Companies are ramping up capital spending as they expect sales to accelerate in the future (Chart 13). Chart 12A Capex-Led Recovery Will Prolong The Economic Expansion
A Capex-Led Recovery Will Prolong The Economic Expansion
A Capex-Led Recovery Will Prolong The Economic Expansion
Chart 13Strong Profits Are Encouraging Firms To Ramp Up Capital Spending
Strong Profits Are Encouraging Firms To Ramp Up Capital Spending
Strong Profits Are Encouraging Firms To Ramp Up Capital Spending
Notably, the combination of curtailed household demand and robust capital expenditure has set India’s inflation dynamics apart from many other countries in Latin America and EMEA. While India’s inflation remains largely contained, countries in those regions are witnessing accelerating inflation. Also, over a cyclical horizon, a capex-led expansion is very crucial for India as this will determine the duration and magnitude of the cycle. Strong investment expenditures do not only boost firms’ competitiveness and profitability, but they also help keep inflationary pressures at bay. Lower inflation for a longer period means the central bank need not raise rates as soon and/or as much as otherwise would be the case. That in turn allows the economic and profit expansion to continue for longer. An extended period of expansion is also positive for multiples as investors extrapolate profit growth over many years ahead. India’s current dynamics are a case in point. Given the country is facing no imminent interest rate hikes, stock multiples can stay higher for longer. This is because multiple de-rating commences only after meaningful rate hikes have already been accorded (Chart 14). Since that is quite far off, valuations are not facing any immediate and considerable headwinds. Finally, India is beginning the new cycle with a rather inexpensive currency. Chart 15 shows that the rupee is currently cheaper by about 10% than what would be its “fair value” vis-à-vis the US dollar. The fair value has been derived from a regression analysis of the exchange rate on the relative manufacturing producer prices of India and the US. Chart 14It Takes Several Rate Hikes Before It Hurts Stock Multiples
It Takes Several Rate Hikes Before It Hurts Stock Multiples
It Takes Several Rate Hikes Before It Hurts Stock Multiples
Chart 15India's Cyclical Expansion Has A Tailwind From Cheap Currency
India's Cyclical Expansion Has A Tailwind From Cheap Currency
India's Cyclical Expansion Has A Tailwind From Cheap Currency
Investment Conclusions Equities: Given the vertical rise earlier this year, Indian stocks would likely need a few more months to digest previous gains and consolidate. Hence, even though the country’s cyclical outlook remains constructive, we recommend that dedicated EM and Asian equity portfolios stay neutral on this market for now. Absolute return investors should stay on the sidelines and wait for a better entry point. Currency and Bonds: The rupee is cheap and could be one of the best performers within the EM world over a cyclical horizon. Indian government bonds also offer a good value with a rather high yield (6.4% for 10-year securities) amid a benign inflation outlook. A positive rupee outlook also makes Indian bonds more appealing for foreign investors. Investors should stay overweight India in an EM local currency bond portfolio. Rajeeb Pramanik Senior EM Strategist rajeeb.pramanik@bcaresearch.com Footnotes
Highlights As investors’ hunt for yield continues, REITs emerge as an attractive asset class. Characterized by an attractive risk-adjusted return (comparable to public equities), and high dividend yields, REITs can add value to investors’ portfolios. The macro backdrop is supportive: Moderate levels of inflation and rising rates have historically been positive for REITs’ performance. Valuations, albeit currently looking frothy, are reflective of a recovery that was broad-based and swift. REITs’ risk premium is attractive, currently 540 basis points. Fundamentals remain supportive of a positive outlook on REITs. Even though cap rates (which historically have moved in lockstep with interest rates) could rise given our macro outlook, the cap-rate spread remains close to its historical average. The pandemic has accelerated some existing trends in the real-estate sector and established new ones. Those will create opportunities for investors. For example, the decline of retail and rise of e-commerce, working from home, and migration away from city centers are observable patterns with investable opportunities. Accordingly, the Global Asset Allocation (GAA) service upgraded the Real Estate sector to Overweight in its July 2021 Quarterly Outlook. In the near-term – given current elevated levels of inflation – we prefer REITs with short-term leases (such as self-storage and residential REITs) over those with long-term leases (such as retail and office) since the former can adjust rents more quickly. Structurally, we favor sectors supported by the growth of the digital economy. The post-pandemic environment should be positive for sectors such as data centers and industrial REITs. Feature In today’s environment of accommodative monetary policy, low interest rates, unattractive valuations and poor return prospects for income-generating assets, investors have been forced to dial up their risk appetite. Real estate stands out as a particularly attractive alternative. The Global Asset Allocation (GAA) service turned positive on real estate in July given the favorable macro backdrop in which: Inflation – while likely to come down from current elevated levels – will be higher in future than in recent decades; There is tight supply in some segments of commercial real estate (CRE); Rental growth is accelerating. This Special Report focuses on REITs, which are the simplest way for most investors to get liquid exposure to the real estate market. The report is structured as follows. We first look at the broad US REITs market (mainly equity REITs) and analyze its historical risk-return characteristics, fundamentals, and valuations. We then assess how REITs fared in previous environments of rising rates and inflation. In the second section, we analyze various sectors of the REITs market, identifying likely losers and winners from our base-case expectations for inflation and growth, and based on our views of how long-term demand for real estate will shift following the pandemic. While we have concerns about potential weaknesses in some segments of commercial real estate (e.g., retail), we highlight opportunities in more technology-driven segments of CRE. Introduction The REITs market in the US as of Q3 2021 has a market value of close to $1.5 trillion. The bulk of this is equity REITs – trusts that own and operate income-producing assets and earn income mostly through rents. The remaining are mortgage REITs which lend money directly to real-estate owners or indirectly by purchasing mortgages or securitized securities such as mortgage-backed securities (MBS) and earn income on those investments. While technically considered equities, the business model of mortgage REITs makes them more like bonds than equities. The composition of the REITs market has changed over the years. While the traditional retail and residential segments dominated the market in the first years of the millennium, structural changes have shifted the balance towards segments such as infrastructure, data centers and industrial (Chart 1). The pandemic accelerated trends that were already in play: For example, the rise of e-commerce, digitalization of services, increased teleworking, and reshoring of manufacturing and supply chains. These have had adverse effects on traditional real estate segments such as retail.
Chart 1
Historical Risk And Return, Valuations, Fundamentals & Correlations Since 1973, US all-equity1 REITs have outperformed both public equities and fixed-income assets (both government bonds and investment-grade corporate bonds) on an absolute basis, providing investors with an 11.9% annualized return versus 10.8%, 6.8%, and 7.6% respectively. On a risk-adjusted basis however, REITs’ performance was equal to that of their public equity counterparts, but lower than fixed-income assets because of REITs’ higher volatility. The negative skewness and excess kurtosis also indicate a high probability of large negative returns. Mortgage REITs (split between Home Financing and Commercial Financing), on the other hand, have returned only 5.2% on an annualized basis, while racking up annualized volatility 3.5 percentage points higher than their all-equity counterparts (Table 1). Table 1Historical Risk-Return Characteristics
Are REITs Still Attractive?
Are REITs Still Attractive?
In order to generate the sort of yields investors expect, mortgage REITs resort to leverage (about 6-8 times) which increases volatility (Chart 2). For example, REITs focusing on residential/home financing buy low credit-risk securities (with almost zero default risk), add leverage, and hedge changes in interest rates via derivatives. Mortgage REITs focusing on commercial financing use less leverage, but take on additional credit and default risk embedded in their underlying assets. Both types of REITs remain highly exposed to the economic cycle and financial conditions. Despite disappointing returns (mainly stemming from narrowing net interest spreads), mortgage REIT investors have been entranced by the high dividend yields. These have averaged 11.3% over the past four decades and are still close to 8% today, much higher than the yields of their all-equity counterparts and other assets (Chart 3). Chart 2Mortgage REITs Are Volatile...
Mortgage REITs Are Volatile...
Mortgage REITs Are Volatile...
Chart 3...And Have High Dividend Yields
...And Have High Dividend Yields
...And Have High Dividend Yields
Table 2Attractive Dividend Yields Across Sectors
Are REITs Still Attractive?
Are REITs Still Attractive?
Dividend yields for all-equity REITs are also attractive in today’s low-yielding investment environment, even though they are at all-time lows – currently they average 2.9%, 150 basis points higher than for public equities. In fact, all REIT sectors and subsectors (with the exception of the lodging/resorts sector) currently have dividend yields higher than those of public equities (Table 2). Even though REITs are considered equities, analyzing them requires different indicators. Whereas equity investors rely on multiples such as price-to-earnings (P/E) or price-to-book (P/B), for REITs price-to-funds from operations (P/FFO) is a more important valuation tool. FFO is favored over earnings since it adds back depreciation and amortization expenses, and adds to net income any gains (or subtracts any losses) from sales of underlying assets. REITs traded at a steady 17x FFO between the end of the Global Financial Crisis (GFC) and the start of the pandemic. FFO fell by 30% in the first two quarters of 2020 compared to Q4 2019, pushing the P/FFO multiple to 24.7 – an all-time high. But FFO as of Q3 2021 has inched back above its pre-pandemic level (Chart 4). The risk premium for REITs (calculated as the FFO yield minus the real 10-year treasury yield) – currently at 5.4% – remains higher than the pre-GFC bottom of 3.5%. (Chart 5). Chart 4Valuations Reflect A Swift Recovery
Valuations Reflect A Swift Recovery
Valuations Reflect A Swift Recovery
Chart 5REITs Risk Premium Is Still Elevated
REITs Risk Premium Is Still Elevated
REITs Risk Premium Is Still Elevated
With the exception of the lodging/resorts sector, REITs’ FFO as of Q3 2021 is higher than one year ago. The occupancy rate for major sectors of the REITs market is starting to rise. Overall net operating income (NOI) for Q3 2021 was 4.5% higher than its pre-pandemic (Q4 2019) level (Chart 6). Chart 6Occupancy Rates Are Rising Again
Occupancy Rates Are Rising Again
Occupancy Rates Are Rising Again
This however is the result of a large year-on-year increase in inorganic or non-same-store net operating income (NOI) – income from assets owned for less than 12 months (either recently acquired or developed) (Chart 7). M&A activity has been increasing, and amounted to almost $47 billion over the past four quarters – driven by activity in the infrastructure, self-storage, and free-standing2 segments (Chart 8).
Chart 7
Chart 8...As M&A Activity Rose
...As M&A Activity Rose
...As M&A Activity Rose
Chart 9REITs Have Low Leverage...
REITs Have Low Leverage...
REITs Have Low Leverage...
The real-estate sector has historically been seen as risky due to its high leverage, but leverage has been on the decline. Over the past decade, REITs’ reliance on equity capital has increased, with the equity/assets ratio rising from 32% in 2008 to 43% in 2021. The ratio of debt to book assets stands at around 49%, much lower than the 58% during the GFC (Chart 9). REITs have also extended the average maturity of their debt from 5 years in 2008 to over 7.5 years today. The fall in interest rates over the past two decades has benefited equity REITs: As rates fell, so did the interest they paid on their debt. Liquidity ratios also improved, with REITs’ coverage ratio (earnings relative to interest expense) at 6x, cash levels and undrawn lines of credit relative to interest expense close to 2x and 7x, respectively (Chart 10). In summary, REITs are an attractive asset class, since leverage is lower, earnings continue to rise, and cap rates – while declining – remain high compared to the risk-free rate. REITs, however, remain highly correlated to public equities: The current 3-year rolling correlation between REITs and public equities is above its historical average of 0.57 (Chart 11). This high correlation undermines the diversification benefit of REITs to investors’ portfolios. Moreover, investors should note that the correlation between REITs and direct real estate (DRE) has averaged only 0.1 over the past four decades. Even when DRE is lagged to account for its appraisal-based methodology, correlation does not rise. Chart 10...And Ample Liquidity Buffers
...And Ample Liquidity Buffers
...And Ample Liquidity Buffers
Chart 11REITs Remain Highly Correlated To Equities
REITs Remain Highly Correlated To Equities
REITs Remain Highly Correlated To Equities
In a previous Special Report we showed however that, while both direct and indirect real estate exposure can add value to investors’ portfolios on a risk-adjusted basis, direct real estate should be favored given its low correlation to other financial assets (such as equities and bonds) as well as the illiquidity premium that investors with no need for immediate liquidity can harvest. The Macro Outlook Our base case is that interest rates will inch higher over the next 12 months and that inflation will moderate but remain higher than during the past decade. How would such an environment affect the outlook for real estate – and REITs in particular? Interest rates and cap rates tend move in lockstep (with the exception of a divergence from mid-2003 until the GFC). This implies that rising rates could lead to higher cap rates, and thus lower property values (Chart 12, panel 1). The current cap-rate spread (the difference between the cap rate and the 10-year Treasury yield) is close to its long-term average of 365 basis points. This should help mitigate downward pressure on property values and act as a buffer when rates rise (Chart 12, panel 2). As long as rising rates are reflective of strengthening economic growth – and we expect US growth to remain above trend for the next two years at least (Chart 13) – and do not hurt the health of corporate tenants or increase defaults, demand for real estate should rise. Chart 12Interest Rates And Cap Rates Tend To Move In Lockstep
Interest Rates And Cap Rates Tend To Move In Lockstep
Interest Rates And Cap Rates Tend To Move In Lockstep
Chart 13Above-Trend Growth Should Bolster Demand For Real Estate
Above-Trend Growth Should Bolster Demand For Real Estate
Above-Trend Growth Should Bolster Demand For Real Estate
Historically, rising rates coincided with strong performance from REITs. On average, REITs returned 25.4% during episodes of rising interest rates, even higher than the return from equities of 24.5%. However, that figure is distorted by some outliers: REITs returned over 100% between 1976 and 1980, and in 2003-2007 (Table 3). The median return of REITS was only 7.1% versus 22.5% for equities. Excluding those two periods lowers REITs’ mean return to 9.4%. Valuation data begins only in 2000, but we can see that REITs were attractively valued in 2003, trading at about 9x P/FFO. By the peak of the market in Q1 2007, they were trading at more than 17x P/FFO. Table 3REITs Fared Well In Previous Periods Of Rising Interest Rates
Are REITs Still Attractive?
Are REITs Still Attractive?
Chart 14
REITs however fared poorly in periods of rising inflation. In a Special Report published in mid-2019, we showed that REITs were a poor hedge against very high inflation and that, much like equities, once the economy overheats and inflation rises sharply (which we define as CPI above 3.3%), REITs produced negative excess returns over cash (Chart 14 and Table 4). For investors able to be more granular in REIT allocations, drilling down to sub-categories of the market might be beneficial, particularly given the low correlation between REIT sectors (Chart 15). Table 4REITs Are Not A Good Inflation Hedge (II)
Are REITs Still Attractive?
Are REITs Still Attractive?
Chart 15Low Correlation Between REIT Sectors
Low Correlation Between REIT Sectors
Low Correlation Between REIT Sectors
The real estate market is diverse. Each sector is driven by different dynamics, reacts differently to the business cycle and changes in consumer behavior, and therefore has different return characteristics. Annual returns by sector have ranged from 4% to 19% since 1994 (Table 5). Moreover, sectors do not react in the same way to rising interest rates or inflation. Properties with short-term leases, such as hotels, storage, and apartments, can reprice and adjust rents as prices rise. On the other hand, those on the other end of the lease spectrum, e.g., retail and healthcare, have less flexibility to do so (Diagram 1). REITs with shorter-term leases (an equally-weighted basket of lodging, self-storage, and residential) outperfomed those with longer-term leases (an equally-weighted basket of healthcare, industrial, retail, and office) during periods of rising interest rates (Chart 16). Table 5REIT Sector Historical Returns
Are REITs Still Attractive?
Are REITs Still Attractive?
Diagram 1Short-Term Leases Outperform...
Are REITs Still Attractive?
Are REITs Still Attractive?
Chart 16...During Periods Of Rising Interest Rates
...During Periods Of Rising Interest Rates
...During Periods Of Rising Interest Rates
Bottom Line: The REITs market has recovered after the slump early in the pandemic. Current multiples appear expensive. However, they may just reflect a recovery that has been broad-based and swift. Cap rates historically have moved in lockstep with rising rates. If rates rise, as we expect, cap rates are likely to rise in tandem, putting downward pressure on property prices. The cap rate spread however remains close to its historical average and this should act as a buffer when rates rise. Moderate levels of inflation and rising rates are usually a positive for REITs’ performance. However, just like equities, once inflation rises too high (historically above 3.3%), REITs’ returns fall. We prefer REITs with short-term leases compared to those with long-term leases, as the former can reprice and adjust rental pricing more quickly. The Post-Covid Environment The pandemic has accelerated some existing trends in the real-estate sector and established new ones. Some sectors will struggle in this new environment, while others will flourish. In this section, we describe the likely post-pandemic world and how it will impact various segments of the real-estate market. We also assess where there are opportunities that investors can capitalize on. Retail The “death of retail” is not a new phenomenon. As technological advances led to the rise of e-commerce, consumer spending shifted from in-store to online. Over the past two decades, non-store retail sales in the US have grown at an annualized 9.5%, compared to 3.1% for in-store sales. E-commerce has risen to almost 14% of total retail sales (Chart 17). This shift is reflected in the halving of the weight of retail REITs in the REITs index over the past decade. The composition of the sector has also changed and is no longer dominated by regional malls and shopping centers but by free-standing properties: These include restaurants, theaters, fitness centers, pharmacies, etc. (Chart 18). Chart 17The Rise Of E-Commerce...
The Rise Of E-Commerce...
The Rise Of E-Commerce...
Chart 18...Had An Adverse Impact On The Retail Sector
...Had An Adverse Impact On The Retail Sector
...Had An Adverse Impact On The Retail Sector
The headwinds facing the sector – particularly shopping centers – have not abated. The size of vacant shopping center space has increased to 220 million square feet, approximately 11% of total retail space available: This is close to its post-GFC high. Private multi-retail capex continues to decline and is below its post-GFC low (Chart 19). Retail REITs’ occupancy rate is among the lowest among CRE: 94% as of Q3 2021, although it is higher than during the past two recessions. Funds from operations (FFO) and net operating income (NOI) have been declining over the past few years, with the exception of free-standing properties which saw low but positive growth (Chart 20). Chart 19Plenty Of Vacant Inventory In Shopping Centers...
Plenty Of Vacant Inventory In Shopping Centers...
Plenty Of Vacant Inventory In Shopping Centers...
Chart 20...But There Could Be Opportunities In Free-Standing Properties
...But There Could Be Opportunities In Free-Standing Properties
...But There Could Be Opportunities In Free-Standing Properties
The pandemic exacerbated some other underlying trends and threats. Smaller in-store retailers have shifted to an online presence, aided by companies like Shopify, which saw the numbers of merchants on its platform grow from 1.07 to 1.75 million in 2020. Consumers are also likely to favor shopping in smaller-scale, local shops as they find convenience in stores close to home. Additionally, given the positive correlation between household density and retail space, as households migrate from city centers to the suburbs there will be less need for retail space within city centers. Bottom Line: We recommend investors underweight the retail sector within their broad real estate exposure. The structural headwinds are not likely to disappear. Within retail, we would favor free-standing properties over shopping centers and regional malls. Office There has long been a close link between office demand and employment. As the labor market tightens, demand for offices increases and rents tend to rise (Chart 21). Investors in office REITs have earned 9.6% annualized returns, 90 basis points annualized below the overall return of the all-equity REITs index, over the past two decades. The sector is currently flush with supply. Estimates show that almost 18% (close to 800 million square feet) of total office space is vacant, yet capex has continued to increase over the past decade (Chart 22). Chart 21The Pandemic Has Changed Office Demand Dynamics
The Pandemic Has Changed Office Demand Dynamics
The Pandemic Has Changed Office Demand Dynamics
Chart 22...Leaving The Sector With Empty Space
...Leaving The Sector With Empty Space
...Leaving The Sector With Empty Space
The pandemic, however, might be the catalyst for change. After social restrictions were imposed and offices shut down, the BLS estimates that in May 2020 as many as 35-40% of US employees were telecommuting, strictly because of the pandemic (Chart 23). Since then, as restrictions were lifted and vaccination rates rose, this number has come down to 12%,3 as more employees returned to some sort of pre-pandemic normalcy. The US Household Pulse survey (published by the US Census Bureau), however, shows close to 40% of employees working at home as of the end of September (Chart 24).
Chart 23
Chart 24
Chart 25Mobility Data Showing No Full Return To Offices
Mobility Data Showing No Full Return To Offices
Mobility Data Showing No Full Return To Offices
The true number of employees who telework likely lies in between the BLS’s 15% and the Census Bureau’s 40%. A study by Jonathan Dingel and Brent Neiman estimated, based on job characteristics,4 that 37% of jobs in the US can be done entirely from home (46% if weighted by wages). Whether employees will favor a work-from-home versus a return-to-office environment is still unclear. Most surveys show a 50-50 split. High-frequency data such as the Google Mobility Trends show that the number of people going to their workplace has not yet returned to normal (Chart 25). It is likely however that office utilization rates will not return to pre-pandemic levels. This might incentivize firms to search either for offices with flexible leases or co-shared space. Chart 26Are Employers Leaving City Centers With Their Employees?
Are Employers Leaving City Centers With Their Employees?
Are Employers Leaving City Centers With Their Employees?
Companies face the choice of downsizing and so reducing business costs, or keeping the same premises which would allow for lower office density and enable social distancing between employees who return to the office. Estimates by CBRE suggest that office demand will not fall by as much as the reduction in the time employees will be in the office. CBRE argues that, while the average US employee is likely to spend 24% less time in an office, demand for office space will fall by only 9%. This calculation factors in more space per employee to allow for social distancing and collaborative working. Additionally, as more employees move away from inner cities, employers could move with them. This trend is reflected in suburban office prices which have risen by 15.1% since the beginning of 2020, compared to those in central business districts (CBD) which have risen by a mere 0.2% (Chart 26). Bottom Line: Investors in office space should be wary of corporates which are unwilling to return to offices operating at full capacity, and instead focus on single-tenant assets with long-term leases. Healthcare Chart 27Like Equities, Healthcare REITs Are A Defensive Play
Like Equities, Healthcare REITs Are A Defensive Play
Like Equities, Healthcare REITs Are A Defensive Play
REITs within this sector are focused on hospitals, senior and nursing homes, and laboratories. Since 1994, healthcare REITs have returned 10.7% annualized, with 21.1% annual volatility. These numbers, however, mask the underlying reality. Healthcare, being a defensive sector, outperformed the broad REITs market only during the dot-com recession and the GFC. In the short-lived pandemic-driven recession in 2020, healthcare REITs underperformed the broad index by 15%. On the other hand, during bull markets, particularly post the GFC, healthcare REITs significantly underperformed the broad market (Chart 27). The sector also has a high dividend yield, which has averaged 6.7% over the past 25 years, 160 basis points higher than the broad index’s historic average (Chart 28). In a Special Report published last year, we explained the structural reasons for our longstanding overweight position on Healthcare equities. We expect demand for healthcare services to continue to rise as life expectancy increases, populations age, and retiring baby boomers spend their accumulated wealth (mainly on healthcare) (Chart 29). Chart 28Healthcare REITs Have High Dividend Yields
Healthcare REITs Have High Dividend Yields
Healthcare REITs Have High Dividend Yields
Chart 29An Aging Population Will Support Demand For Healthcare
An Aging Population Will Support Demand For Healthcare
An Aging Population Will Support Demand For Healthcare
Elder care facilities will play a major role in supporting the increasingly aging population over the coming years. The pandemic has emphasized the need for high-quality senior housing: In our previous report, we highlighted that lack of funding and mismanagement – particularly in for-profit nursing homes – were reasons why they had almost four times as many Covid infections as those run by the government or non-profits. Chart 30...Increasing Investment In Healthcare Facilities
...Increasing Investment In Healthcare Facilities
...Increasing Investment In Healthcare Facilities
Chart 31Healthcare REITs' Fundamentals Are Recovering
Healthcare REITs' Fundamentals Are Recovering
Healthcare REITs' Fundamentals Are Recovering
The private sectors has already began to step in to meet this demand: Healthcare private construction expenditure has risen over the past few years and is likely to rise further (Chart 30). Cap rates continue to inch lower, but still have a decent spread over 10-year Treasurys (Chart 31, panel 1). Fundamentals have also began to improve: FFO and NOI growth seem to have bottomed, after dipping into negative territory as a result of the pandemic (panels 2 & 3). The sector has been going through a phase of consolidation: There have been significant acquisitions over the past few quarters, particularly of distressed operators (panel 4). Bottom Line: There is a structural long-term case to favor REITs in this sector, particularly an aging population with ample savings to spend on healthcare. Federal support and oversight have helped bolster confidence (for both occupants of care homes and investors) during the pandemic, and are likely to continue. Lodging/Resorts Chart 32Income Has Been The Only Source Of Return For Lodging REITs
Income Has Been The Only Source Of Return For Lodging REITs
Income Has Been The Only Source Of Return For Lodging REITs
Chart 33The Travel Industry Has Not Yet Recovered
The Travel Industry Has Not Yet Recovered
The Travel Industry Has Not Yet Recovered
Lodging REITs have been the worst performing sector over the past 27 years. Since 1994, they have returned only an annualized 4.1%, 640 basis points lower than the all-equity REITs index, with annual volatility 14 percentage points higher. They have steadily underperformed the market since 1997. Property prices within the sector have consistently declined, and income has been the only source of return (Chart 32). Lodging demand is closely linked to travel, which has been deeply impacted by the pandemic. The number of US domestic airline passengers is still only half that of the pre-pandemic period (Chart 33). With vaccines rolled out and most pandemic restrictions likely to be lifted eventually, the travel sector is set to rebound, albeit not equally across segments. Chart 34Personal Travel Likely To Recover Before Business Travel
Personal Travel Likely To Recover Before Business Travel
Personal Travel Likely To Recover Before Business Travel
Chart 35The Hotel Industry's Recovery
The Hotel Industry's Recovery
The Hotel Industry's Recovery
Personal and leisure travel is likely to return first: More people are now comfortable about going on vacation and want to make up for the “lost travel” of the past two years (Chart 34). Hotel occupancy rates, while still below 2019 levels, continue to rise, and revenue per available room (RevPAR) is close to 2019 levels (Chart 35). Business travel, on the other hand, might not recover as fast. The shift to remote working and videoconferencing is likely to push companies to review travel budgets. Business travel, which halved between 2019 and 2020, is forecast to return to its pre-pandemic level only in 2024/2025. This is likely to have a larger adverse impact on higher-end, major-city hotels. Chart 36The Pandemic's Effect On The Lodging Sector
The Pandemic's Effect On The Lodging Sector
The Pandemic's Effect On The Lodging Sector
The industry has been facing other headwinds for the past few years. The threat from online lodging platforms, such as Airbnb, has put downward pressure on occupancy rates, which have been declining recently after having hovered around the mid-60% level over the past 30 years. Bottom Line: Real spending on hotels and motels remains 26% below trend (Chart 36). A revival in leisure travel, the easing of restrictions, and pent-up demand will support the sector in the short-term. However, domestic business travel and international tourism might be slow to recover. Investors in lodging and resorts should reduce exposure to major-city assets and focus instead on rural or resort-based getaways. Residential Residential REITs are primarily focused on apartments, rather than single-family homes or manufactured (mobile) homes – although the share of apartments has been declining over the past few years (Chart 37). Since 1994, residential REITs have outperformed the broad market by an annualized 1.8 percentage points. More recently, since the single-family homes segment was added to the sector (in December 2015), residential REITs have continued to outperform the broad market, driven by a 21.4% annualized return from the manufactured homes segment, 19.4% from single-family homes, and 12.3% from apartments. The sector’s outperformance should not come as a surprise. The housing sector has been undersupplied for decades: The ratio of annual housing starts to the total number of households is 1.2% – 0.7 percentage points below its pre-GFC average (Chart 38). This has pushed up prices, increasing unaffordability, particularly for first-time buyers (Chart 39). This increased the percentage of US housing inventory occupied by renters rather than owners (Chart 40). Chart 37Apartments Make Up The Majority Of Residential REITs
Apartments Make Up The Majority Of Residential REITs
Apartments Make Up The Majority Of Residential REITs
Chart 38Housing Undersupply Is No New Issue...
Housing Undersupply Is No New Issue...
Housing Undersupply Is No New Issue...
Chart 39...Making Home Prices Unaffordable...
...Making Home Prices Unaffordable...
...Making Home Prices Unaffordable...
Chart 40...Particularly For Young Adults
...Particularly For Young Adults
...Particularly For Young Adults
Chart 41The Pandemic Pushed Renters Outside Of Major Cities
The Pandemic Pushed Renters Outside Of Major Cities
The Pandemic Pushed Renters Outside Of Major Cities
The pandemic, and its impact on shopping and work, has pushed city residents to the suburbs. This is reflected in the gap between the rental vacancy rate in large cities versus that in the suburbs (Chart 41). It is also noticeable in REITs’ performance: Ones dominated by suburban housing have outperformed those focused on city centers over the past year. Home prices, appreciating faster than rental growth, will remain a tailwind for residential REITs (Chart 42). Supply shortages will keep prices high. Fundamentals also remain supportive of a positive outlook on the sector: The cap rate on residential REITs is about 260 basis points over the 10-year Treasury yield, and both FFO and NOI growth seem to have troughed (Chart 43). Chart 42Rising Home Price Will Be A Tailwind For Residential REITs
Rising Home Price Will Be A Tailwind For Residential REITs
Rising Home Price Will Be A Tailwind For Residential REITs
Bottom Line: Investors should favor the residential sector within the REITs market, favoring single-family homes and manufactured homes over apartments, and out-of-city over downtown properties. Chart 43Improving Fundamentals For The Residential Sector
Improving Fundamentals For The Residential Sector
Improving Fundamentals For The Residential Sector
Data Centers Data centers are facilities that provide space for customers’ servers and other network and computing equipment. Due to the high and complex technical set-up specifications, leases are usually longer (upwards of five years). Properties that support the digital economy have attracted a lot of demand over the past few years. New technologies such as artificial intelligence, virtual reality, and autonomous vehicles will prove a tailwind over the coming years. Since data first became available (January 2016), data centers have outperformed the REITs benchmark by almost 60 percentage points (Chart 44). The pandemic has accelerated those trends, as social restrictions led offices, schools, and stores to close. This led to an increase in internet traffic and data creation. Estimates by OpenValut show that broadband usage increased by 51% in 2020 compared to 2019, partly due to remote learning and teleworking. Demand for data centers is expected to continue to grow. Fundamentals for the sector remain supportive: The cap rate – albeit now lower than post the GFC– is still near that of the broad benchmark (Chart 45, panel 1) and both NOI and FFO continue to grow (panels 2 & 3). Chart 44Sectors Supporting A Digitalized Economy Will Be Long-Term Outperfomers
Sectors Supporting A Digitalized Economy Will Be Long-Term Outperfomers
Sectors Supporting A Digitalized Economy Will Be Long-Term Outperfomers
Chart 45...Supporting Fundamentals' Growth
...Supporting Fundamentals' Growth
...Supporting Fundamentals' Growth
Bottom Line: Internet traffic remains the primary driver of the performance of data-center REITs. The move towards a more digitalized economy is likely to prove a tailwind for the sector. This should also immunize the sector over the economic cycle as dependence on data increases structurally. A new normal in remote working and learning, as well as continued investment in new technologies, support an allocation to the sector. Industrial Technological advances, particularly the rise of e-commerce, have also helped the industrial sector, increasing the need for logistics and fulfillment centers. Research by Prologis shows that e-commerce requires more than 3x the logistics space of brick-and-mortar sales. That is why investment in the sector has been rising over the past decade (Chart 46). Demand shows no signs of cooling: The occupancy rate of industrial REITs is at an all-time high, 4 percentage points higher than its 20-year average (Chart 47). Rental growth for industrial properties – particularly down the value chain closer to the end-consumer – has been robust due to the scarcity of permittable land. Chart 46Increased Demand For Warehouses Has Translated Into More CAPEX...
Increased Demand For Warehouses Has Translated Into More CAPEX...
Increased Demand For Warehouses Has Translated Into More CAPEX...
Chart 47...And Pushed Up Occupancy Rates
...And Pushed Up Occupancy Rates
...And Pushed Up Occupancy Rates
The pandemic has also revealed how vulnerable current supply chains are and has accelerated a trend BCA Research has highlighted for years: The decline of globalization. Going forward, companies will move to reshore some of their production to gain greater control over supply chains (Chart 48). This will amplify the need for industrial space. Bottom Line: We expect the industrial sector to continue to outperform the broad REITs market, supported by continued investment in fulfillment and logistics centers. Fundamentals remain strong: Same-store NOI is growing at over 6% a year, and acquisitions have increased, with more than $5.5 billion over the past four quarters (Chart 49). The industrial sector has been one of the quickest to revive projects put on hold during the pandemic, with the development pipeline as of Q3 2021 34% higher than in Q4 2019. Chart 48The End Of Globalization, And Supply Chain Reshoring Will Increase The Need For Industrial Space
The End Of Globalization, And Supply Chain Reshoring Will Increase The Need For Industrial Space
The End Of Globalization, And Supply Chain Reshoring Will Increase The Need For Industrial Space
Chart 49Increased M&A Activity In The Industrial Sector
Increased M&A Activity In The Industrial Sector
Increased M&A Activity In The Industrial Sector
Amr Hanafy Senior Analyst Amrh@bcaresearch.com Footnotes 1 All-equity REITs refer to equity REITs plus infrastructure and timberland REITs. 2 Free-standing REITs own stand-alone properties away from malls and are a subsector of the retail sector. 3 This does not include those whose telework was unrelated to the pandemic, such as those who worked entirely from home prior to the pandemic. 4 Jonathan I. Dingel and Brent Neiman, "How Many Jobs Can Be Done At Home?" NBER Working Paper No. 26948, April 2020.
Dear Clients, Next week, in addition to sending you the China Macro And Market Review, we will be presenting our 2022 outlook on China at our last webcasts of the year “China 2021 Key Views: A Challenging Balancing Act”. The webcasts will be held Wednesday, December 15 at 10:00 am EDT (English) and Thursday, December 16 at 9:00 am HKT (Mandarin). Best regards, Jing Sima China Strategist Highlights China’s policymakers are balancing between staying the course with structural reforms and stabilizing the economy. This carefully calibrated approach means that Beijing will only initiate piecemeal policy easing in the near term. China will ramp up investment in the new economy, which is too small to fully offset the drag on the aggregate economy from weakening old economy sectors. In the next three to six months, the economy will deteriorate further, but Beijing will only press the stimulus accelerator harder if their pressure points are breached. A zero-tolerance policy towards COVID will be maintained for the foreseeable future. Uncertainties surrounding the Omicron variant will reinforce this approach. The common prosperity policy initiative will likely accelerate ahead of the 20th National Congress of the Chinese Communist Party (NCCCP) in the fall of 2022. While the plan will ultimately benefit income and consumption for the majority of Chinese households, the uncertainties surrounding impending tax reforms will curb demand for housing and luxury goods in the short term. We remain underweight Chinese stocks. Prices for onshore stocks will likely fall in the next three to six months when the market starts to price in lower-than-expected economic growth and disappointing stimulus. Selloffs in the first half of 2022 may present an opportunity to turn positive on onshore stocks in absolute terms. We will turn bullish on Chinese stocks relative to global equities only when credit expansion overshoots weakness in the economy, which has a low likelihood. We continue to favor onshore stocks versus offshore within a Chinese equity portfolio. Tensions between the US and China may intensify leading up to the political events next year. Chinese offshore stocks, highly concentrated in internet companies, still face the risks of being caught in both geopolitical crossfires and domestic regulatory pressures. Feature China’s economy slowed significantly in 2H21, with the extent of policy tightening and magnitude of the decline in growth much larger than global investors expected. As we forecasted in our last year’s Key Views report, 2021 marked the beginning of a new era in which policymakers would switch gears from building a "moderately prosperous society" to becoming a "great modern socialist nation”.The pivot means that officials would tolerate slower economic growth, implement tougher financial and industry regulations, and accelerate structural reforms. On the cusp of 2022, we are cautious about the willingness of China’s top leadership to initiate large-scale policy easing. Even though policy tone has shifted to a more pro-growth bias, authorities are still trying to replace old economic drivers with the new economy sectors. Furthermore, they are struggling to maintain a delicate balance between boosting short-term growth and maintaining long-term reforms goals. As a result, their policies are sending mixed signals. As seen in 2018 and 2019, the policymakers’ reluctance to activate a full-scale stimulus does not bode well for global commodity prices. Chinese onshore stocks underperformed their global counterparts during the 2018-19 period. Chinese stocks will face nontrivial headwinds in the coming months and warrant a cautious stance until more stimulus is introduced and the macro picture begins to meaningfully improve. The main themes in our outlook for 2022 are discussed below. Key View #1: Balancing Between The Old And New Economies Despite a recent pro-growth bias in the policy tone, the speed of easing has been incremental and the magnitude piecemeal. Moreover, authorities are telegraphing policy support in new economy sectors (such as high tech and clean energy), while only somewhat loosening restrictions in old economy sectors (mainly property and infrastructure). Chart 1Current Easing Path Is Looking A Lot Like In 2018/19
Current Easing Path Is Looking A Lot Like In 2018/19
Current Easing Path Is Looking A Lot Like In 2018/19
China’s policy framework has shifted since late 2017 as we noted in previous reports. The top leadership is more determined to stay the course with reforms and tolerate slower growth in the old economy. Our BCA Li Keqiang Leading Indicator highlights policymakers’ carefully calibrated policy actions to avoid a dramatic overshoot of credit growth; these actions are consistent with 2018/19 and starkly contrast with policy frameworks in 2012 and 2015. Monetary conditions have meaningfully eased, but the rebound in money supply and credit growth has lagged and is muted due to heightened regulatory oversight (Chart 1). Investors should keep low expectations about the policymakers’ willingness to boost growth in old economy sectors. The easing of restrictions in property sector – from prompting banks to resume lending to qualified homebuyers and developers, to allowing funding for developers to acquire distressed real estate assets – are steps to alleviate an escalating risk of widespread bankruptcies among real estate developers. However, regulators have not changed the direction of their structural policies. Funding constraints placed on both developers and banks since last August remain intact. Banks still need to meet the “two red lines” that set the upper limit on the portion of their lending to the property sector, while developers must bring their leverage ratios below the “three red lines” by end-2023. Maintaining these binding constraints on developers and banks will continue to weigh on the housing market in the coming years. The recent easing may reduce the intensity of funding constraints, but the banks will be extremely cautious to extend lending to a broad range of developers. Aggressive crackdowns on property market speculation in the past 12 months has fundamentally shifted both developers’ and consumers’ expectations for future home prices. Growth in home sales and new projects dropped to their 2015 lows, while current real estate inventories are comparable to 2015 highs (Chart 2). Therefore, unless regulators are willing to initiate more aggressive policy boosts, such as cutting mortgage rates and/or providing government funds to monetize inventory excesses in the housing market, the current easing measures probably will not revive sentiment in the property market. Thus, odds are that the property market downtrend will extend through 2022 (Chart 3). Chart 2Downward Momentum In Property Market Comparable To 2015
Downward Momentum In Property Market Comparable To 2015
Downward Momentum In Property Market Comparable To 2015
Chart 3Policymakers Will Have To Allow Significant Re-leveraging To Revive The Market
Policymakers Will Have To Allow Significant Re-leveraging To Revive The Market
Policymakers Will Have To Allow Significant Re-leveraging To Revive The Market
Chart 4Key Indicators Show Weak Signs Of Revival In Infrastructure Spending
Key Indicators Show Weak Signs Of Revival In Infrastructure Spending
Key Indicators Show Weak Signs Of Revival In Infrastructure Spending
We expect some modest increase in infrastructure spending next year from the meager 0.7% growth in 2021, but we are skeptical that policymakers will allow any substantial rebound. Shadow banking activity and infrastructure project approval, two key indicators we monitor for signs of a meaningful easing in infrastructure spending, show little improvement (Chart 4). Our outlook for infrastructure investment is based on the following: Since 2017 policymakers have assumed a much more hawkish approach toward reducing investment in the capital-intensive and unproductive old economic sectors. Next year’s 20th NCCCP will not fundamentally change this policy setting. The 19th NCCCP in late 2017 deviated from the past; infrastructure investment growth downshifted following the event, whereas significant spending boosts had followed previous NCCCPs (Chart 5). Beijing adhered to its structural downshift in infrastructure spending even during the 2018/19 US-China trade war and after last year’s pandemic-induced economic contraction. Chart 5Infrastructure Investment Shifted To A Lower Gear Following The 19th NCCCP
Infrastructure Investment Shifted To A Lower Gear Following The 19th NCCCP
Infrastructure Investment Shifted To A Lower Gear Following The 19th NCCCP
Chart 6
Secondly, government spending since 2017 has tilted towards social welfare over building “bridges to nowhere”, a meaningful change from the past and in keeping with President Xi Jinping’s political priorities (Chart 6). The trend will likely continue next year because local governments need to maintain large social welfare budgets to counter the economic impact of the prolonged domestic battle against COVID. Local government revenues, on the other hand, will be reduced due to slumping land sales. Thirdly, there has been strong policy guidance by the central government to shift investment to the new economy sectors and away from traditional infrastructure projects. The PBoC in early November launched the carbon emission reduction facility (CERF) to offer low interest loans to financial institutions that help firms cut carbon emissions.
Chart 7
China’s new economy sectors have experienced rapid growth in recent years, but in the short-term, infrastructure spending in those sectors will not fully offset a reduction in traditional infrastructure (Chart 7). The combined spending in tech infrastructure (including information transmission such as 5G technology and services) and green energy stood at RMB1.6 trillion last year, compared with the RMB19 trillion investment in traditional infrastructure and RMB14 trillion in the real estate sector. Bottom Line: Beijing will continue to push for investment in new economy sectors since the leadership is determined to reduce dependency on unproductive segments of the economy. Even as the economy slows, they will be reluctant to ramp up leverage and channel capital to the old economy sectors. Unfortunately, the small size of the new economy’s sectors versus the old economy will inhibit their ability to stabilize and accelerate economic growth via these policies. Key View #2: The Pressure Points We do not think Beijing will allow the economy to freefall past the “point of no return”. The economy still needs to grow by 4.5-5.0% per annum between 2021 and 2035 to achieve the target of doubling GDP by 2035 (Chart 8A and 8B). Chart 8AThe Structural Downshift In Chinese Growth Will Continue…
The Structural Downshift In Chinese Growth Will Continue…
The Structural Downshift In Chinese Growth Will Continue…
Chart 8B...But A 5%+/- Rate Of Growth Will Keep China Well On Track Of Doubling Its GDP By 2035
...But A 5%+/- Rate Of Growth Will Keep China Well On Track Of Doubling Its GDP By 2035
...But A 5%+/- Rate Of Growth Will Keep China Well On Track Of Doubling Its GDP By 2035
Investors should watch the following pressure points to assess whether China’s leaders will feel the urgency to turn policy to outright reflationary: A collapse in onshore financial market prices. China’s economic fundamentals will weaken further in the next three to six months and the risks to Chinese equity prices are on the downside. However, the odds are still low that the onshore equity, bond and currency markets will plunge as in 2015. Onshore stocks are cheaper than during the height of their 2015 boom-bust cycle, margin trading remains well below its 2015 level and economic fundamentals are stronger (Chart 9). Selloffs by global investors in China’s offshore equity and high-yield bond markets have not triggered much panic in the onshore markets and, therefore, will not drive Beijing to change its macro policy (Chart 10). Chart 9Valuations In Chinese Stocks Are Not As Extreme As In 2015
Valuations In Chinese Stocks Are Not As Extreme As In 2015
Valuations In Chinese Stocks Are Not As Extreme As In 2015
Chart 10Onshore Markets Have Been Relatively Calm
Onshore Markets Have Been Relatively Calm
Onshore Markets Have Been Relatively Calm
Chart 11China/US Growth Rates In 2022 Will Be Uncomfortably Close, Based On IMF Forecasts
China/US Growth Rates In 2022 Will Be Uncomfortably Close, Based On IMF Forecasts
China/US Growth Rates In 2022 Will Be Uncomfortably Close, Based On IMF Forecasts
Narrowing growth differentials between China and the US. In the IMF’s October World Economic Outlook, economic growth in 2022 for China and the US is projected at 5.6% and 5.2%, respectively. The forecast suggests that next year the growth differential between the two largest economies will be narrowed to less than one percentage point, rarely seen in China’s post-reform history (Chart 11). Notably, the most recent Bloomberg consensus estimate for the 2022 US real GDP growth is much lower at 3.9%, whereas China is expected to grow by 5.3% and in line with the IMF forecast. We do not suggest that Beijing will make its policy decisions based on these growth projections. Rather, we expect that if China’s growth in 1H22 falls behind that in the US, Chinese policymakers will feel an urgency to stimulate the economy and show a better economic scorecard ahead of the all-important 20th NCCCP next fall. Rising unemployment. Current data shows a mixed picture. Unemployment rates have been falling in all age groups (Chart 12). Demand for labor in urban areas, on the other hand, has been shrinking (Chart 13). The employment subindex in China’s service PMIs has also been dropping. Our view is that the resilient export/manufacturing sector has provided strong support to employment this year, while the labor supply in urban areas has been sluggish due to tighter travel restrictions and frequent regional lockdowns. The combination of strong manufacturing demand for labor and a lack of supply has reduced excesses in the labor market and the urgency to stimulate the economy (Chart 13, bottom panels). However, the picture could change if China’s exports start to slow into next year. Chart 12China's Unemployment Rate Is Falling...
China's Unemployment Rate Is Falling...
China's Unemployment Rate Is Falling...
Chart 13...But Demand For Labor Is Also Falling
...But Demand For Labor Is Also Falling
...But Demand For Labor Is Also Falling
Bottom Line: In the coming year, investors should watch for three pressure points that may trigger more forceful growth-supporting actions from policymakers: the onshore financial markets, economic growth differentials between the US and China, and labor market dynamics. Key View #3: The Exit Strategy Chart 14Service Sector Activities Have Been Restricted By Domestic Covid Cases And Frequent Lockdowns
Service Sector Activities Have Been Restricted By Domestic Covid Cases And Frequent Lockdowns
Service Sector Activities Have Been Restricted By Domestic Covid Cases And Frequent Lockdowns
China will not completely lift its zero-tolerance policy toward COVID in the coming year. We will likely see tightened domestic preventive measures leading to the Beijing Olympics in February and the NCCCP in October. The zero-tolerance policy cannot be sustained in the long run; China’s stringent counter-COVID measures have created a stop-and-go pattern in China’s service sector, which has taken a toll on household consumption (Chart 14). As such, Chinese policymakers will face a trade-off between hefty economic costs from its current counter-COVID measures, and the potential social costs and risks if there is a dramatic increase in domestic COVID cases. China is estimated to have fully vaccinated more than 80% of its citizens and is close to launching its own mRNA vaccine next year to be used as a booster shot. However, the inoculation rate will likely matter less to Beijing’s decision to relax its draconian approach towards COVID given the emergence of the virulent Omicron variant. Recent statement by China's top respiratory experts suggests that China will return to normalcy if fatality rate of COVID-19 drops to around 0.1%, and when R0 (the virus reproduction ratio) sits between 1 and 1.5. A more important factor that could influence Beijing’s decision is the development and effectiveness of anti-viral drug treatments. Pfizer recently announced that its anti-viral oral drug Paxlovid can reduce the hospitalization and death rates by 89% if taken within three days of the onset of symptoms. The drug-maker has announced its intention to produce enough of the medication to treat 50 million people in 2022. China’s Tsinghua University has also developed an antibody combination drug that may reduce hospitalization and mortality by 78% and is expected to be approved by Chinese regulators within this year. Beijing’s decision to abandon its zero-tolerance policy, therefore, will be based on the combined effectiveness of both vaccines and treatments. If clinical trials prove that the new antiviral drugs are effective in treating COVID patients, combined with China’s aggressive rollout of booster shots, then Beijing may incrementally relax its COVID containment measures by late 2022 or early 2023. Bottom Line: China will not loosen its zero-tolerance policy until a combination of vaccines and treatments proves to be effective against COVID. Key View #4: Common Prosperity Will Gather Steam We expect the notion of common prosperity espoused by President Xi Jinping to gain momentum ahead of the 20th NCCCP. Beijing will likely roll out measures to support consumption, particularly for low-income households. At the same time, there is a high possibility that policymakers will introduce taxes on luxury goods and accelerate the legislative process on real estate taxes. Chart 15The Slump In Property Market Will Likely Be An Extended One
The Slump In Property Market Will Likely Be An Extended One
The Slump In Property Market Will Likely Be An Extended One
The property market will remain in a limbo in 2022. In the near term, potential homebuyers will likely maintain their wait-and-see attitude before details of real estate taxes are disclosed. Home sales will remain in contraction despite improved mortgage lending conditions (Chart 15). Consumption taxes are expected to increase, targeting consumer discretionary and/or luxury goods. Chinese consumption of luxury goods benefited from government pro-growth measures last year, flush liquidity in the market and global travel restrictions. Meanwhile, growth in aggregate household income and consumption has been lackluster. President Xi Jinping’s common prosperity policy initiative is intended to narrow the income and wealth gap between the rich and poor. Moreover, empirical studies show that the marginal propensity to consume among lower- and middle-income groups, which account for more than 80% of China’s total population, is significantly higher than that of high-income groups. We expect more support for lower income groups as Beijing looks to stabilize the economy and narrow the wealth gap. Bottom Line: There is a high probability that policymakers will introduce taxes on the consumption of luxury goods and initiate the legislative process on real estate taxes in the next 12 months. Investment Conclusions Chinese stocks in both the onshore and offshore markets have cheapened relative to global equities. However, in absolute terms onshore stocks are not unduly cheap and offshore stocks are cheap for a reason (Chart 16). We remain defensive in our investment strategy for Chinese stocks in the next two quarters, given the headwinds facing the onshore and offshore markets. We do not rule out the possibility that China’s authorities will stimulate more forcefully in the next 12 months. However, for Chinese policymakers to ramp up leverage again, the near-term dynamics in the country’s economic cycle will have to significantly worsen. Chinese stocks will sell off in this scenario, but the selloff will provide investors with a good buying opportunity in the expectation of a more decisive stimulus (Chart 17). Chart 16Chinese Onshore Stocks Are Not Particularly Cheap, While Offshore Stocks Are Cheap For A Reason
Chinese Onshore Stocks Are Not Particularly Cheap, While Offshore Stocks Are Cheap For A Reason
Chinese Onshore Stocks Are Not Particularly Cheap, While Offshore Stocks Are Cheap For A Reason
Chart 17Selloff Risks Are High Before The Economy Stabilizes
Selloff Risks Are High Before The Economy Stabilizes
Selloff Risks Are High Before The Economy Stabilizes
Chart 18A Deja Vu Of 2018-2019?
A Deja Vu Of 2018-2019?
A Deja Vu Of 2018-2019?
If the economy slows in an orderly and gradual manner, then there is a slim chance that policymakers will allow an overshoot in stimulus. The Politburo meeting on Monday sent a stronger pro-growth message, the PBoC cut the reserve requirement ratio (RRR) rate by 50bps, and regulators will likely allow a front-loading of local government special-purpose bonds in Q1 next year. However, based on the lessons learned in 2019, regulators can be quick to scale back policy support if they see there is a risk of overshooting in credit expansion (Chart 18). The measured stimulus during the 2018-2019 period did not bode well for Chinese stocks or global commodity prices (Chart 19A and 19B). Meanwhile, we do not think the recent selloff in offshore stocks provided good buying opportunities. In the next 6 to 12 months, any tactical rebound in Chinese investable stocks will present a good selling point. Chart 19AChina's Measured Stimulus In 2018-2019 Did Not Bode Well For Global Commodity Prices
China's Measured Stimulus In 2018-2019 Did Not Bode Well For Global Commodity Prices
China's Measured Stimulus In 2018-2019 Did Not Bode Well For Global Commodity Prices
Chart 19BChinese Stocks Underperformed In 2018-2019
Chinese Stocks Underperformed In 2018-2019
Chinese Stocks Underperformed In 2018-2019
Investable stocks, highly concentrated in China’s internet companies, are caught in domestic regulatory clampdowns and geopolitical crossfires. We expect tensions between China and the US to intensify in 2022 in light of next fall’s 20th NCCCP in China and mid-term elections in the US. Furthermore, Didi Global’s decision to delist from the New York Stock Exchange last week highlights that both China and the US are unanimous in their efforts (although for different reasons) to remove Chinese firms from US bourses. Risks associated with future delisting of Chinese firms will continue to depress the valuations of Chinese technology stocks. Jing Sima China Strategist jings@bcaresearch.com Market/Sector Recommendations Cyclical Investment Stance