Equities

Highlights Investors and consumers expect that inflation will remain quite high over the next year, but they are unconcerned that upward price pressures will last: According to surveys and market prices, inflation will exceed 4% next year before subsiding over the longer term to the comfortable levels of the last two decades. The Fed also views elevated inflation as a near-term phenomenon and accordingly expects to hike the fed funds rate at a deliberate pace: The Fed is on the same page as the hoi polloi, and is not gearing up to remove accommodation with any particular haste. While the decade following the financial crisis demonstrated that extremely easy monetary policy does not by itself promote high inflation, the landscape has changed: A decade of ZIRP and QE failed to produce any dire effects, but it remains to be seen how extreme monetary and fiscal accommodation will interact. We expect the bull market will end once the Fed falls behind the curve on inflation and is forced to tighten monetary policy aggressively to catch up: We think the bull has another year to run, but excessive stimulation will eventually bring about its demise. Feature For most of the year, every discussion with our investor-clients has eventually worked its way around to inflation. How high is it going to go? How long will it last? What will it mean for the economy? What will it mean for stocks? How will the Fed react? As the year-over-year change in the Consumer Price Index has climbed steadily higher, breaking above 6% last month for the first time in 31 years (Chart 1), the tenor of the conversations has shifted. Investors have come to recognize that the economy is subject to upward price pressures that are more than the temporary by-product of pandemic base effects. Inflation is nonetheless still largely viewed as a temporary phenomenon that will fade once reopening supply bottlenecks can be resolved. While markets are resigned to another year of high inflation, they are secure in the notion that the disinflationary currents of the last several decades will squelch them over the longer term. Chart 1Long Time, No See
Long Time, No See
Long Time, No See
The tension between the competing ideas that both inflationary and disinflationary currents are real sets up a potential market showdown. If it is only a matter of time before disinflationary forces return to smother today’s post-COVID disruptions, the widely shared consensus view that the fed funds rate will meander its way to a peak of 2% will be validated. The equity bull market will continue, albeit at a slower pace, until it dies of natural causes. Markets could be in for a rude awakening, however, if the forces supporting higher prices outlast the pandemic and overcome the long-running disinflationary trend. This report considers how inflation could ruin the party. Our base-case view is that the Fed will find itself behind the curve. When it does, it will be forced to tighten monetary policy fast and furious, moving more swiftly to a higher terminal fed funds rate than markets currently expect. That will bring down the curtain on the bull market in risk assets and it may also spark the next recession, but we think the good times will last for at least one more year. What Markets Expect: Inflation Despite all the attention higher prices have drawn, investors haven’t gotten too worked up over them. Although they’ve made considerable revisions to their near-term expectations, their expectations for inflation ten years from now haven’t budged since the start of the year. As the Treasury1 (Chart 2) and CPI swaps (Chart 3) markets show, big consumer price increases are expected to be concentrated in the next year, come off the boil in year two and then slowly cool over the next few years. At the back half of the 10-year curve, year-over-year CPI increases are expected to settle into the range that prevailed during the nineties’ and early 2000s’ inflation moderation.
Chart 2
Chart 3
Financial markets do not exist in a vacuum, of course, and the expectations of participants in the real economy matter as well. The University of Michigan’s consumer survey indicates that households’ expectations accord with financial markets’ (Chart 4): inflation will be uncomfortably high over the next year but an afterthought five years from now. Whether the phenomenon is called adaptive expectations or recency bias, everyone’s – investors’, consumers’, businesses’, and economists’ (Chart 5) – expectations of the future are colored by the recent past. It is not a stretch to envision consumer prices rising by more than 4% in 2022 after having watched them surge since March, but apparently economic participants will need to see them remain elevated for a longer stretch before they can picture inflation enduring for two or three years, much less five to ten years. Chart 45% Now, But Only 3% Later
5% Now, But Only 3% Later
5% Now, But Only 3% Later
Chart 5Reliably Anchoring To The Recent Past
Reliably Anchoring To The Recent Past
Reliably Anchoring To The Recent Past
What Markets Expect: Fed Policy Chart 6Faster, Yes; Farther, No
Faster, Yes; Farther, No
Faster, Yes; Farther, No
If inflation isn’t expected to persist at an elevated rate for an extended period, there’s no reason to expect that the Fed will aggressively tighten monetary policy. Higher-than-expected inflation readings have led money markets to bring their first rate hike ETA (the liftoff date) forward to next July, and to price in two rate hikes in the second half of next year (Chart 6, top panel). They continue to expect that the Fed will conclude its tightening cycle once the fed funds rate is around 2% (the terminal rate). They also expect that the Fed will take its time getting to that terminal rate, hiking by no more than 75 basis points (“bps”) in a single year (Chart 6, bottom two panels), roughly in line with the 100-bps annual pace of 2017 and 2018. The Fed concurs. As per the latest Summary of Economic Projections (SEP), released after the September FOMC meeting, the 18 board members and regional presidents casting votes expect the FOMC to take its time hiking rates. With exactly half of the voters calling for no rate hikes next year, the median and mean expectations were for one-half and two-thirds of a 25-bps rate hike in 2022, respectively (Chart 7A). By the end of 2023, the median and mean SEP voter expects a cumulative 3.5 and 3.1 25-bps rate hikes, respectively (Chart 7B). By the end of 2024, median and mean expectations are for a cumulative 6.5 and 6.1 25-bps rate hikes, respectively (Chart 7C).
Chart 7
Chart 7
Chart 7
Table 1Same Terminal Rate, Different Liftoff Date
How Will The Party End?
How Will The Party End?
Conditions have changed since late-September upon the release of September and October inflation data, though Chair Powell didn’t give any ground in his press conference following the November 3rd meeting. Rounding the expectations at each year-end period as of the September 22nd meeting, the median SEP voter expected zero or one rate hike in 2022, three in 2023 and three in 2024, pushing the top end of the fed funds rate range to 2% as of the end of 2024. Market expectations have moved since the last SEP, with the overnight index swap curve going from zero rate hikes in the next twelve months to two, and from two rate hikes in the next 24 months to five, but financial markets and the Fed remain on the same page (Table 1). A Kinder, Gentler Fed Emboldened by the experience of the last expansion, in which worrisome inflation did not materialize despite a zero fed funds rate and 50-year lows in unemployment, the Fed has embarked on a course quite different from the one the late Paul Volcker might have charted. Nagged by persistently low post-crisis inflation, the FOMC has decided that pursuing an average inflation target that makes up for previous shortfalls will best allow it to meet its price stability mandate. Letting undershoot bygones be bygones paved the way for inflation expectations to slide, constraining its ability to stimulate the economy at the zero bound. To re-anchor expectations in its preferred 2.3-2.5% range, and give a zero fed funds rate more zip, the FOMC must convince markets that it will occasionally let inflation run hot. A more aggressive pursuit of its full employment mandate, as outlined in the August 2020 revisions to the FOMC’s Statement on Longer-Run Goals and Monetary Policy Strategy, should also help nudge expectations upward. Per the revisions commentary on the Fed’s website, “The previous expansion demonstrated that a strong labor market can be sustained without inducing an unwanted increase in inflation. To the contrary, when unemployment fell to levels that were previously thought to be unsustainable, the labor market proved remarkably adaptable, bringing many benefits to families and communities that all too often had been left behind. Accordingly, the new Statement … only … [pledges to address] ‘shortfalls of employment from its maximum level’ rather than the [previous] ‘deviations from its maximum level’[.] This change signals that high employment, in the absence of unwanted increases in inflation or the emergence of other risks that could impede the attainment of the Committee’s goals, will not by itself be a cause for policy concern.”2 The Fly In The Ointment Chart 8Wall Street And Main Street
Wall Street And Main Street
Wall Street And Main Street
While we acknowledge that the September 22nd SEP may be somewhat out of date as a guide to the board members’ and regional presidents’ fed funds rate expectations, the easier stance outlined in the revised monetary policy strategy statement remains very much in effect. The upshot, from our perspective, is that the FOMC intends to be behind the inflation curve in the coming rate-hiking cycle. If inflation remains contained after lingering pandemic dislocations are resolved, the behind-the-curve takeaway will not be all that impactful for investors. After all, those who positioned for dollar debasement and runaway inflation when the Bernanke Fed introduced QE and ZIRP were clobbered by investors who loaded up on risk assets and blithely rode easy money tailwinds higher. There is a critical difference this time, however, beyond the increasing magnitude of the Fed’s accumulated asset purchases. Pandemic fiscal stimulus has dwarfed the comparatively meager fiscal response to the global financial crisis. And going forward, the Biden administration’s spate of ambitious spending proposals contrasts sharply with the Obama administration’s deficit reduction focus. The post-crisis era has served as a natural experiment on the effects of unprecedented monetary accommodation on economic activity and consumer price inflation. Asset prices surged, buoyed by a negative real fed funds rate and a ballooning Fed balance sheet (Chart 8, top panel), but the rate of growth in consumption (Chart 8, bottom panel) was unchanged. Although household net worth gains lead consumption growth, the vast majority of financial assets are held by households with a low marginal propensity to consume. Asset price inflation doesn’t necessarily lead to consumer price inflation because it doesn’t necessarily have an observable impact on aggregate demand. Fiscal stimulus is different, however. The stimulus packages created to counter the economic effects of COVID-19 put money directly in the hands of households with high marginal propensities to consume. They have been consuming avidly since emerging from their spring 2020 lockdowns (Chart 9) and we expect that they will continue to do so until they’ve run down at least one half of their $2.3 trillion of excess pandemic savings. Rising wages may additionally promote demand, as will the baby boomers’ shift into their peak consumption years, along with the massive investment required to meet green energy goals. Chart 9Consumers Have Momentum (And The Savings And Borrowing Capacity To Sustain It)
Consumers Have Momentum (And The Savings And Borrowing Capacity To Sustain It)
Consumers Have Momentum (And The Savings And Borrowing Capacity To Sustain It)
Demand was sluggish for an entire decade following the GFC, but it appears as if it will be quite robust for a while after the pandemic. We believe that aggregate demand is on a course to exceed aggregate supply after reopening supply chain issues are resolved. At that point, the transitory inflation view will no longer be credible, and the Fed may find itself having to play catch up. When it does, it will have to hike rates more and faster than financial markets expect. Once the Fed has shifted into fast and furious mode, or markets develop a widespread conviction that it will, the bull markets in risk assets will end and the expansion might, too. In the meantime, setting investment strategy will depend on how long it takes for the inflation inflection point to arrive. We do not yet think the inflection point is in sight and therefore continue to recommend that investors with a twelve-month timeframe overweight equities and credit in multi-asset portfolios. We remain on the alert, however, and will shift our view if events move faster than we currently expect. We would rather leave some upside on the table than stay at the party too long. Doug Peta, CFA Chief US Investment Strategist dougp@bcaresearch.com Footnotes 1 Off-the-run Treasury maturities do not trade all that well, and TIPS other than 1-, 2-, 5- and 10-year maturities are even less liquid. The TIPS inflation expectations curve (Chart 2) is therefore less reliable than the CPI swaps curve (Chart 3) at individual points, but it confirms the broad direction of investors’ inflation expectations. 2 Question 6, How has the review altered how the Federal Reserve will pursue its maximum employment objective? Accessed November 22, 2021. Emphasis added. Federal Reserve Board - Q&As.
Highlights Few emerging market peers have a track record of democracy like India does. Russia and others have long histories of political instability and one-man rule. Several large EMs have experienced stints of military rule in the post-WWII era. While India’s democratic credentials are real, these should not be exaggerated. India’s political system suffers from some structural and cyclical vulnerabilities. These imperfections deserve attention today, more than ever, given that India trades at a record premium to peers. From a strategic perspective, we remain Buyers of India. India’s democratic traditions will lend political stability as the country’s economic heft grows. However, on a time horizon, we recommend paring exposure to Indian assets. A loaded state election calendar awaits in 2022, which will be followed by crucial state elections in 2023 and general elections in 2024. While we expect the incumbent political party to retain power in 2024, history suggests that the road to general elections is paved with policy risks. Policymakers tend to shift attention from market friendly-reform to voter-friendly policies as these key state elections approach. Additionally, geopolitical risks for India are ascendant as dangerous transitions are underway to India’s west and east too. Feature
Chart 1
Investors regard India as being exceptionally well-off on political parameters. It is viewed by many as the blue-eyed boy of emerging market democracies. And for good reason. Despite its massive population and very low per capita incomes, India has remained a functional democracy for over seventy years. Democratic political regimes are a relatively new trend. The number of democracies began exceeding the number autocracies in the world only very recently in 2002 (Chart 1). India was one of the earliest adopters of this trend compared to emerging market peers. Its democratic traditions are so well-entrenched now that they are comparable to those of some of the most developed economies of the world (Chart 2). To add to these democratic credentials, every government at the national level in India has completed its full five-year term since 1999, thereby offering stability. Investors greatly value the political stability that India offers. While political stability is only one factor that investors consider, India has traded at a 28% premium relative to democracies and a 67% premium to non-democracies like Russia and China over the last decade (Chart 3).
Chart 2
Chart 3
In this report we highlight that while India’s democratic credentials are real, these should not be exaggerated. The political system in India is solid but far from perfect. It suffers from both structural and cyclical vulnerabilities. These imperfections deserve attention today more than ever, given that India trades at a record premium to peers (Chart 3). Also, a closer look at India’s political system is warranted given that both geopolitical and macroeconomic risks for India are ascendant. With India, the devil always lies in the details. India is the largest democracy of the world but is also one of the few large democracies that follows a first-past-the-post (FPTP) method of determining election winners and has no effective limit on the number of political parties that can contest elections. Most democracies, either combine an FPTP system with natural or legislative limit on the number of competing political parties (such as in the case of UK and US) or rely on a non-FPTP system, with specific vote thresholds to enter Parliament. The combination of an FPTP system along with a system that allows multiple small political parties to exist entails challenges and makes the system vulnerable to some structural policy problems that are often overlooked. These include: A Tendency To Go All-In: An FPTP system means that at an election, the contestant with the highest number of votes is declared the winner even if the victory margin is very low. For instance, the narrowest victory margin recorded at an Indian constituency-level election is a mere 9 votes! Such a system where the winner takes all, irrespective of the victory margin, creates perverse incentives for contesting candidates to go all-in on populism ahead of elections. Indian elections have thus seen candidates offer everything from food and free laptops, to free alcohol and hard cash, in a bid to woo voters in the run up to elections. Too Many Players Can Spoil The Election: An FPTP system alongside a multi-party system can lead to very high degrees of political competition. While competition is usually a virtue, very high levels of political competition tend to fragment the electorate. Owing to these reasons, political competition in India tends to be very high in general. For instance, the last two general elections in India saw 15 candidates contest from each constituency on average. This compares to an average number of contestants from each constituency being 5 for UK or 6 for Canada. The problem with this fragmentation is that the victorious politician may lack a strong popular mandate. Smaller Indian states bear the brunt of this problem. The smaller the state, the cost of the pre-election campaign is lower, so the number of contestants shoots up in smaller regions (Chart 4).
Chart 4
Rent-Seeking Becomes A Necessity: Such a system which combines FPTP and no major entry barriers for contestants arguably encourages rent-seeking behavior, which election winners frequently display. Populist spending promised by candidates to lure voters ahead of elections can be very high, especially when political competition is stiff. Winners then are keen to recover this “sunk cost” and to create a war chest for the next election. This prompts the rent-seeking that often becomes a necessity for candidates who run expensive election campaigns. To conclude, few emerging market peers have a sustained track record of democracy like India does. Russia and others have long histories of both political instability and one-man rule. Brazil, Turkey, Thailand, South Korea, Taiwan, and Indonesia have all experienced stints of military rule and revolutions in the post-WWII era. Whilst India’s political stability credentials are solid, the existence of high degrees of political competition alongside high degrees of social complexity will spawn both structural and cyclical policy risks in India. Navigating India’s Political Peculiarities It is heuristically convenient to assume that policy risks in India are uniform across time. However, in this report, we highlight that policy risks for India hardly tend to be the same through the five-year term of a political party in charge at the national level. The five-year term of any central government in India is paved with cyclical policy risks. The good news is that there is a method to the madness. We present a simple method to identify a “pattern” to the cyclical policy risks: We break down India’s general election cycle into a five-year sequence. Year 1 is defined as the year after a general election takes place (such as 2020) and Year 5 is defined as the year in which a general election takes place (such as 2019 or 2024). (See the Appendix for a quick overview of India’s political system.) Given that India has 28 states and a state government’s term lasts five years, about six state elections are held each year. After identifying this five-year sequence, we then identify specific states that become due for state elections during this five-year period. Such a characterization of India’s election cycle shows how the five-year period from one election to the other is hardly the same. In fact, it becomes clear how policy risks tend to be definitively elevated in the years leading up to a general election. Year 3 in such a framework sees elections in some of India’s largest states (size), India’s politically most sensitive states (sensitivity), and India’s socially most complex states (complexity). 2022 will mark the beginning of Year 3 of the current five-year cycle and will see: Size: The most loaded state election schedule which will affect more than a quarter of India’s population (Chart 5). Sensitivity: Elections take place in most of India’s northern region (Chart 6), which is a key constituency for the ruling Bhartiya Janata Party (BJP).
Chart 5
Chart 6
Complexity: Elections take place in some of the most socially conflict-prone states such as say Manipur (Chart 7). Year 3 of India’s cycle is also worth bracing for as it typically sees the policy machinery’s attention shift away from big-ticket reform to populism. This is probably because Year 4 sees some of the poorest states in India undergo elections (Chart 8) and then Year 5 sees a general election.
Chart 7
Chart 8
What becomes clear now is that India is set to enter the business-end of its five-year election cycle in 2022. So, what specific policy changes should investors expect? The Road To Elections … Is Paved With Policy Risks Irrespective of the political party in power at the centre, populism as a theme tends to become more defined in the two years leading to a general election in India. For instance, history suggests that government spending in the two years leading up to a general election tends to be higher than in the previous three years (Chart 9). The last time this theme did not play out was in the run up to the elections of 2014 when in fact the incumbent i.e., the Indian National Congress (INC) lost elections to the Bhartiya Janata Party (BJP). Distinct from the fiscal support to the economy that tends to rise in the run up to elections, it is notable that even money supply growth, inflation to an extent and even the pace of Rupee depreciation tends to be faster in India in the years leading up to a general election (Chart 10).
Chart 9
Chart 10
The run up to Year 3 and Year 4 of India’s election cycle also tends to see the announcement of voter-friendly policies that may not necessarily be market-friendly. Examples of this phenomenon include: Record Increase In Revenue Spends Ahead Of 1999 General Elections: In 1998 the-then Finance Minister oversaw a whopping 20% year-on-year increase in revenue expenditure. This is almost double the average growth rate of 13% seen in this metric over the last 25 years. Farm-loan Waiver Ahead of 2009 General Elections: In 2008 i.e., the year before the general elections of 2009, the Indian National Congress (INC)-led central government announced its decision to write off farm loans of about $15 billion (in inflation-adjusted terms today). Demonetization Decision Ahead Of 2017 Uttar Pradesh State Elections: The BJP-led central government announced its decision to demonetize 86% of currency in circulation in November 2016 in a bid to prove the government’s commitment to crackdown on black money. GST Rate Cuts Ahead Of 2017 Gujarat State Elections: The Goods and Services Tax (GST) council announced a cut in the GST rate for over 150 items in November 2017. This was ahead of Gujarat state elections that were due in December 2017. Such decisions are known to work with voters. The incumbent political party that announced these policy decisions, in each of the three cases cited above, won the elections that they subsequently contested. Just last week, the Indian Government decided to repeal farm sector reform related laws which it had announced a year ago. It is not entirely coincidental that this pro-voter decision has been announced just a few months ahead of critical state elections due in 2022. Key State Elections To Watch In 2022
Chart 11
State elections are due in seven states in India in 2022. State elections due in 2022 will have an indelible impact on India’s policy outlook for 2022 because the BJP is the incumbent party in most of these states and BJP’s popularity has suffered because of the pandemic (Chart 11). The government’s decision last week to roll back farm sector reform is a great example of this phenomenon. Of all the state elections due in 2022, the two key elections that will have the biggest bearing on the 2024 general elections will be the elections in Uttar Pradesh in February 2022 and in Gujarat in December 2022. BJP’s popularity in these states should be closely watched to get a better sense of the 2024 general election outcome. The BJP won about 80% of the cumulative seats these two states offer at the 2019 general elections. At the last state elections held in Uttar Pradesh in 2017, the BJP stormed into power in the state, winning 77% of seats. BJP’s entry into power there was symbolic as the road to New Delhi is said to pass through this state (Chart 12). Gujarat on the other hand has been a BJP stronghold and PM Modi began his political innings as the chief minister of this state. Despite being in power in Gujarat for over two decades, the BJP managed to retain power in this state at the last elections held in 2017 (Chart 13).
Chart 12
Chart 13
Accurate pre-poll data for these states will be available only closer to election day. Our early on-ground checks suggest that the BJP is set to almost certainly retain power in Uttar Pradesh in 2022. However, the BJP runs the risk of losing some vote share in Gujarat owing to the anti-incumbency effect it faces and owing to the rise of parties like the Aam Aadmi Party (AAP) in the state of Gujarat. Another tool that can be used to estimate the likely result of these two key state elections is the economic growth momentum in these states. State election results from 2021 suggest that this macro variable matters a great deal. While it is not the only variable that matters, the incumbent lost elections in large states in 2021 when growth decelerated excessively (Chart 14). For instance, in 2021, Tamil Nadu saw its GDP growth decelerate significantly but West Bengal saw its GDP growth decelerate by a lesser extent. Notably, the incumbent was displaced out of power in Tamil Nadu but managed to retain power in West Bengal possibly because of several factors including a lesser slowdown in economic growth (Chart 14). If GDP growth were to affect election outcomes in 2022 as well then, the incumbent i.e., the BJP, will comfortably retain power in Uttar Pradesh but may have to deal with the risk of losing some vote share in Gujarat. This is because economic growth accelerated in Uttar Pradesh over the last five years before the pandemic. GDP growth rates remained high in Gujarat but the pace of acceleration was weaker (Chart 15).
Chart 14
Chart 15
However, from the perspective of the general elections of 2024, BJP’s position in these two states remains fairly strong, and this is true even if it experiences minor setbacks in the upcoming state elections. National parties like the BJP tend to enjoy greater fervor amongst voters in general elections as opposed to state elections. It hence would take an earthquake defeat in these state elections to alter this assumption – an outcome which appears unlikely at this stage. The takeaway from the above is that investors must brace for the BJP pursuing populist policies over the next two years. In fact, we are increasingly convinced that the BJP government’s budget for FY23 (due to be announced on 1 February 2022) will see a marked increase in transfer payments for farmers in specific or low-income groups in general. The announcement of a brand-new program aimed at lifting incomes of India’s lowest economic strata cannot be ruled out. But from the perspective of the 2024 elections, the BJP appears well-placed to retain power. Investors will face negative policy turbulence in the short run but should maintain a base case of policy continuity over the long run. Investment Conclusions If You Are Playing A Long Game, Then Hold: From a strategic perspective, we remain Buyers of India. India’s democratic traditions will lend political stability as the country’s economic heft grows. Its democratic credentials will also yield geopolitical advantages as America aims to create an axis of democracies to contain autocratic regimes. It is notable that the US’s most recent alliance-formation efforts - such as the Quadrilateral Security Dialogue or the AUKUS nuclear submarine deal - involve some of the oldest democracies of the world. As India sheds its historical stance of neutrality, in favor of closer alignment with the US against China, its democratic credentials will help India deepen its engagement with geopolitically powerful democracies. If You Are Playing A Short Game, Then Fold: The Indian market appears priced for perfection today. We recommend paring exposure to Indian assets on a tactical time horizon. Historically India’s premium relative to emerging markets has shown some correlation with the BJP’s popularity (Chart 16). However, India’s premium relative to EMs has shot through the roof over the last year and hence even if BJP wins the Uttar Pradesh elections (our base case), then it is unclear if that victory will drive another bout of price-to-earnings re-rating for India. Moreover, as outlined, the road to state elections in 2022 will be paved with policy risks as the government prioritizes populism ahead of pro-market reform.
Chart 16
The BJP has managed to expand its influence in India over the last decade (Chart 17). But a unique problem now confronts Indian policymakers: while stock markets in India have risen almost vertically, wage inflation has collapsed (Chart 18). Additionally, India has administered a weak post-pandemic fiscal stimulus (Chart 19). We reckon that this fiscal restraint will be tested in the run up to key elections in 2022-23.
Chart 17
Chart 18
Chart 19
Unlike in developed economies, where fiscal stimulus is seen as pro-market because it suggests policymaking is improving and deflationary risks will be dispelled, fiscal stimulus can be market-negative in the context of an EM like India. Increases in populist spending can end up adding to existent inflationary pressures and hence can drive bond yields higher. Stock market earnings too may not end up getting a major boost on the back of increase in transfer payments to low-income groups. This is because the share of market cap accounted for by sectors which directly benefit from pro-poor spending, like Consumer Staples, has been drifting lower on Indian bourses from 10.8% in 2013 to 8.9% today. As we have been highlighting, distinct from policy risks that confront India on a tactical horizon, geopolitical risks confronting India are elevated too. Dangerous transitions are underway to India’s west (involving Pakistan and Afghanistan) as well as east (involving China). While China’s woes drive EM investors to India, any clashes with neighbors will create much better entry points into Indian stocks. Ritika Mankar, CFA Editor/Strategist ritika.mankar@bcaresearch.com Appendix: An Overview Of India’s Political System India follows a parliamentary model of democracy with a federal structure where the government at the centre as well as state level is elected for a period of five years. The central government of India is formed through general elections that are held every five years. Power is held by a political party (or a coalition of parties) that can secure and maintain a simple majority in the Lower House (or Lok Sabha) through this five-year term. India also constitutes 28 states, each with its own legislative assembly. Each state government is formed through a state election held every five years. Much like at the centre, power is held by a political party that can maintain a simple majority at the legislative assembly for this five-year term.
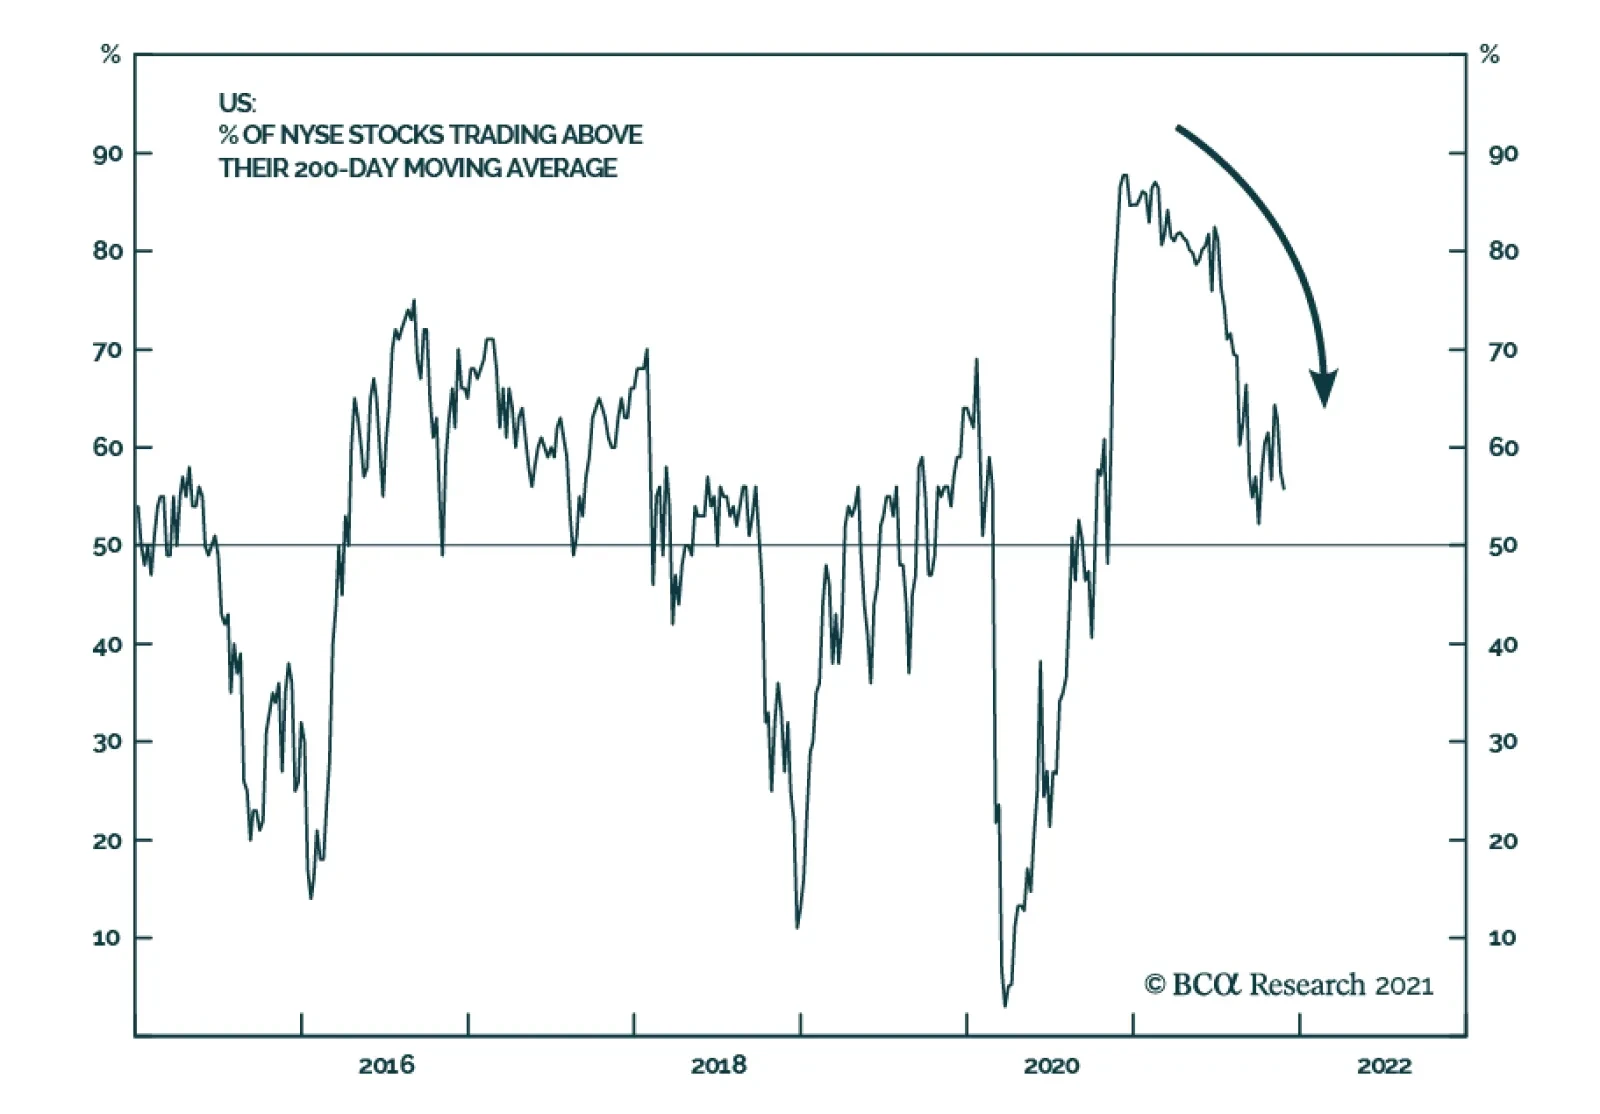
US equity breadth measured as the share of stocks trading above their 200-day moving average has collapsed since earlier this year. This development raises the question whether a constructive outlook on US equities is still appropriate. At 21.5x forward…
Dear Client, We will be working on our 2022 Outlook for China, which will be published on December 8. Next week we will be sending you BCA Research’s Annual Outlook, featuring long-time BCA client Mr. X, who visits towards the end of each year to discuss the economic and financial market outlook for the year ahead. Best regards, Jing Sima China Strategist Feature In meetings with our North American clients this past week, we expressed the view that China’s economic growth is on a downward trend and easing measures have been gradual and modest in scope. Most clients agreed that China’s economy faces tremendous headwinds, however, some investors were more optimistic about the outlook for Chinese stocks in the next 6 to 12 months. Valuations in both China’s onshore and offshore equity markets have dropped to multi-year lows and macro policies have started to ease. Cheaply valued Chinese stocks should have more upside in the wake of policy support. Policy tone recently pivoted to a more growth supporting bias, but the existing easing measures will not offset the deceleration in both credit growth and domestic demand. China’s economic activity may worsen before it stabilizes in mid-2022. Moreover, China’s financial markets do not seem to have priced in the economic weakness. Therefore, in the next one to two quarters, risks to Chinese stocks are tilted toward the downside. Chart 1Chinese Stocks Will Truly Bottom When The Economy Troughs
Chinese Stocks Will Truly Bottom When The Economy Troughs
Chinese Stocks Will Truly Bottom When The Economy Troughs
Below are some of the main questions from our meetings and our answers. Q: Policies have started to be more pro-growth. Why do you still underweight Chinese stocks? A: There are two reasons that we maintain a cautious view on Chinese stocks for at least the next six months, in both absolute terms and relative to global equities. First, we do not think that the magnitude of existing easing measures is sufficient to offset the economy’s downward momentum. Secondly, China’s business cycle lags credit growth by about six to nine months. The timing of a turnaround in the economy and stock prices may be later than investors have priced in. In short, we need to see more reflationary measures and a rebound in credit growth to have a legitimate macro fundamental basis to overweight Chinese stocks (Chart 1). Credit growth on a year-on-year basis stopped falling in October. The underlying data in credit creation, however, points to a weakening in demand for corporate loans (Chart 2). Loans to the housing sector are well below a year ago (Chart 3). Chart 2Weakening Loan Demand
Weakening Loan Demand
Weakening Loan Demand
Chart 3Bank Loans To The Housing Sector Have Not Turned Around
Bank Loans To The Housing Sector Have Not Turned Around
Bank Loans To The Housing Sector Have Not Turned Around
Chart 4It Will Take Time For Policy Easing To Restore Confidence In The Corporate Sector
It Will Take Time For Policy Easing To Restore Confidence In The Corporate Sector
It Will Take Time For Policy Easing To Restore Confidence In The Corporate Sector
Despite an acceleration in local government bond issuance in October and RMB300 billion in additional bank loans to support small and medium enterprises, growth in medium- to long-term corporate loans peaked (Chart 4). In previous cycles, a rollover in corporate demand for longer-term bank lending on average lasted more than nine months, suggesting that any policy adjustments will take a while to restore confidence in the corporate sector. Without a decisive pickup in credit growth, corporate earnings growth will be at risk of deteriorating. Moreover, policy tightening since earlier this year is still working its way through the economy and major economic indicators in China continue to decline (Chart 5). We think that China’s economy is set to decelerate even more in the next several months, suggesting that earnings uncertainty will likely rise. This, combined with reactive policymakers, already slowing earnings momentum, and a downward adjustment in 12-month forward earnings, suggests that investors have not yet reached the maximum bearishness for Chinese stock prices (Chart 6). Chart 5No Signs Of Improvement In The Economy
No Signs Of Improvement In The Economy
No Signs Of Improvement In The Economy
Chart 6The Earnings Adjustement Process Is Only Beginning
The Earnings Adjustement Process Is Only Beginning
The Earnings Adjustement Process Is Only Beginning
Q: What is the impact of China’s property market slowdown on the economy? Will recent policy easing stop deterioration in the real estate sector? A: Policy has been recalibrated by relaxing restrictions on mortgage lending and rules for land sales.1 However, the negative financing loop among developers, households and local governments may take longer to improve. Meanwhile, the market may underestimate the downside risks in housing-related activity in the next 6 to 12 months. Chart 7Households' Home Buying Intentions Have Plummeted
Households' Home Buying Intentions Have Plummeted
Households' Home Buying Intentions Have Plummeted
Our view is based on the following: Home sales will likely remain in contraction in the next two quarters. Aggressive crackdowns on property market speculation in the past 12 months have fundamentally shifted consumers’ expectations for future home prices. The impending pilot property tax reform2 (details yet to be disclosed) will only encourage the wait-and-see sentiment of potential buyers. Home sales contracted by 24% in October from a year ago. In previous cycles, contractions in home sales normally lasted for more than 12 months. Moreover, the proportion of households planning to buy a house dropped to only 7.7% in Q3 2021 from 11.6% in Q4 2020 (Chart 7). Real estate developers have slashed new projects and land purchases to preserve liquidity for debt servicing (Chart 8, first and second panels). Policymakers may succeed in prompting banks to resume lending to developers in order to alleviate the escalating risk of widespread defaults. However, so far the marginal easing has failed to reverse the downward trend in bank credit to developers along with home sales (Chart 8, third and bottom panels). Funding constraints for real estate developers will probably be sustained for another six months, despite the recent easing measures. Construction activity, housing starts, and real estate investment will likely remain in doldrum at least through 1H22 (Chart 9). Chart 8Housing Activities Are Still Falling
Housing Activities Are Still Falling
Housing Activities Are Still Falling
Chart 9Less Funding = Less Investment And Completions
Less Funding = Less Investment And Completions
Less Funding = Less Investment And Completions
The marked reduction in land sales will impede local governments’ revenues and weigh on infrastructure investment (Chart 10). Real estate and infrastructure financing contributed 50% of the increase in total Chart 10Local Government Revenues Largely Depend On The Housing Sector
Local Government Revenues Largely Depend On The Housing Sector
Local Government Revenues Largely Depend On The Housing Sector
social financing in 2020. Given that local governments face funding constraints from a slump in land sale incomes, policies on leverage from local government financing vehicles (LGFVs) will have to meaningfully loosen up to allow a rise in bank lending to support infrastructure investment. As discussed in previous reports, an acceleration in local government special-purpose bond issuance can only partially offset weak credit growth. Furthermore, shadow banking activity, which comprises LGFV borrowing and is highly correlated with China’s infrastructure investment growth, remains in contraction and indicates that growth in infrastructure investment is unlikely to rebound strongly (Chart 11). The sharp weakening of real estate construction activities will drag down the demand for building materials, machinery, home appliances and automobiles. Real estate accounts for about 60% of Chinese households’ wealth, thus any substantial drop in home prices will further weaken households’ propensity to consume (Chart 12). Chart 11More Easing Needed For A Meaningful Pickup In Infrastructure Investment
More Easing Needed For A Meaningful Pickup In Infrastructure Investment
More Easing Needed For A Meaningful Pickup In Infrastructure Investment
Chart 12Falling Demand For Commodities And Consumer Goods
Falling Demand For Commodities And Consumer Goods
Falling Demand For Commodities And Consumer Goods
Chart 13AOn The Surface Housing Inventories Are Lower Than Six Years Ago...
On The Surface Housing Inventories Are Lower Than Six Years Ago...
On The Surface Housing Inventories Are Lower Than Six Years Ago...
There are nontrivial risks that the real estate slowdown will evolve into a downturn similar to that of 2014-15. Although the existing housing inventory is more modest than the start of the 2014/15 property downturn, developers have accumulated more debt and unfinished projects in this cycle than in the past (Charts 13A & 13B). Policymakers will have to relax property sector policies much more forcefully to prevent the downturn from intensifying. In the interim, we will likely witness more deterioration in the sector. Chart 13B...But Developers Have Built Up Massive Leverages And Hidden Inventories In The Past Three Years
...But Developers Have Built Up Massive Leverages And Hidden Inventories In the Past Three Years
...But Developers Have Built Up Massive Leverages And Hidden Inventories In the Past Three Years
Q: If the property market accounts for such a big portion of local governments’ revenues, why hasn’t the waning housing market forced policymakers to loosen restrictions? A: We think regulators have been slow to backtrack property market reforms because this year China’s fiscal deficit has narrowed from last year due to lower government spending and improved income from corporate taxes. In previous property market downturns, such as 2011/12, 2015/16 and 2019, property policy restrictions were lightened following major declines in government revenues (Chart 14). However, in 2021 China’s fiscal balance sheet has been stronger than in previous cycles; central and local governments have collected much more taxes, particularly corporate taxes, than in 2020 (Chart 15). Meanwhile, government expenditures so far this year have been lower, resulting in a large improvement in the country’s fiscal deficit (Chart 16). Chart 14Falling Gov Revenues Forced Policymakers To Backtrack Reforms In The Past...
Falling Gov Revenues Forced Policymakers To Backtrack Reforms In The Past...
Falling Gov Revenues Forced Policymakers To Backtrack Reforms In The Past...
Chart 15...But This Year Gov Tax Revenues Have Been Strong
...But This Year Gov Tax Revenues Have Been Strong
...But This Year Gov Tax Revenues Have Been Strong
Chart 16Fiscal Deficit Improved This Year Despite Falling evenues From Land Sales
Fiscal Deficit Improved This Year Despite Falling evenues From Land Sales
Fiscal Deficit Improved This Year Despite Falling evenues From Land Sales
As discussed above, slightly loosened restrictions on land purchases by some regional governments will not restore developers’ confidence and boost the demand for land. The sharp increase in government's corporate tax collection will also start to ebb as economic growth slows and corporate profits decline. As such, even if government expenditures remain the same next year, the fiscal deficit will grow because revenues will be under substantial downward pressure. We expect that Chinese policymakers will have to take more actions to stabilize fiscal conditions. Forecasting exactly when this will occur is difficult, but a benign government balance sheet in much of this year is delaying policymakers’ response to the flagging housing market. Meantime, both policymakers and investors may be complacent about the state of the economy until the full scale of the property sector spillover risk becomes clear. Q: Rates are low and industrial profit growth has been strong this year. Why has capex been so sluggish? A: Investment growth in the manufacturing sector has been lackluster because their profit margins have been squeezed by rising input costs. On the other hand, investment in the mining industry has been constrained by policy restrictions. An acceleration in China’s de-carbonization efforts this year has likely constrained investment in the mining sector. Even though industrial profit growth has been concentrated among the upstream industries such as mining which profits grew by a stunning 100% this year, investment in the sector was mostly flat from a year ago (Chart 17). During the first half of the year, mid- to downstream firms were caught between rising input prices and a weak recovery in domestic consumption. Manufacturing investment grew faster than the mining sector, but manufacturing profit growth only increased by about 30% year to date (Chart 18). However, we think manufacturing investment growth may improve slightly into 2022 as the sector continues to gain pricing power. Chart 17Mining Sector's Profit Growth Way Outpaced Investment
Mining Sector's Profit Growth Way Outpaced Investment
Mining Sector's Profit Growth Way Outpaced Investment
Chart 18Manufacturing Sector Profit Growth Has Been Much More Muted Than Upstream Industries
Manufacturing Sector Profit Growth Has Been Much More Muted Than Upstream Industries
Manufacturing Sector Profit Growth Has Been Much More Muted Than Upstream Industries
Q: The RMB has been strong against the dollar, despite China’s maturing business cycle. What is your outlook for the RMB next year? A: The RMB exchange rate has been boosted by China’s record current account surplus, wide interest rate differentials and speculation that tension between the US and China will abate. However, all three favorable conditions supporting the RMB are in danger of reversing next year. Chart 19The RMB Has Been Appreciating Despite A Strong USD
The RMB Has Been Appreciating Despite A Strong USD
The RMB Has Been Appreciating Despite A Strong USD
Chart 20The RMB's Appreciation Deviates From Economic Fundamentals
The RMB's Appreciation Deviates From Economic Fundamentals
The RMB's Appreciation Deviates From Economic Fundamentals
Despite broad-based dollar strength, the CNY/USD has appreciated by 4.5% year to date (Chart 19). The RMB’s appreciation deviates from China’s economic fundamentals (Chart 20). Strong global demand for goods has boosted Chinese exports while travel restrictions curbed foreign exchange outflows by domestic households (Chart 21). China-US real interest rate differentials have been in favor of the CNY versus USD, bringing net foreign inflows to China’s onshore bond market (Chart 22). Additionally, the recent meeting between President Joe Biden and President Xi Jinping has prompted speculation that the US will lessen tariffs on Chinese imports. Chart 21Large Current Account Surplus
Large Current Account Surplus
Large Current Account Surplus
Chart 22Favorable Interest Rate Differentials And Strong Fund Inflows
Favorable Interest Rate Differentials And Strong Fund Inflows
Favorable Interest Rate Differentials And Strong Fund Inflows
Chart 23China's Extremely Robust Export Growth Unlikely To Sustain In 2022
China's Extremely Robust Export Growth Unlikely To Sustain In 2022
China's Extremely Robust Export Growth Unlikely To Sustain In 2022
Chart 24A Strong RMB Does Not Bode Well For Chinese Exporters' Profits
A Strong RMB Does Not Bode Well For Chinese Exporters' Profits
A Strong RMB Does Not Bode Well For Chinese Exporters' Profits
These factors will likely turn against the CNY next year. First, export growth will moderate as the composition of US consumption rotates from goods to services (Chart 23). Secondly, it would not be in the PBoC’s best interests to let the RMB strengthen too rapidly because an appreciating currency would be a deflationary force on China’s export and manufacturing sectors (Chart 24). While we expect policymakers to maintain their preference for a gradual approach to stimulus, we assign a high probability to a reserve requirement ratio (RRR) cut in early 2022. In this environment, Chinese bond yields will decline, which would narrow the China-US interest rate differential. Finally, while there may be some changes to US tariffs on China, it is doubtful that there would be a broad-based removal of tariffs. Chart 25The CNY/USD Will Likely Fall And Converge To Chinese Stocks' (Under)performance
The CNY/USD Will Likely Fall And Converge To Chinese Stocks' (Under)performance
The CNY/USD Will Likely Fall And Converge To Chinese Stocks' (Under)performance
The CNY’s outperformance stands out as it marks a break from its correlation with China’s relative equity performance vis-à-vis the US (Chart 25). The signal from the currency suggests that either global equity investors are overly pessimistic about economic and regulatory risks in China, or overly optimistic about the value of China’s currency. The latter option is more likely at the moment, and the CNY/USD exchange rate is at the risk of converging to the underperformance of Chinese investable stocks next year. Jing Sima China Strategist jings@bcaresearch.com Footnotes 1 China Cities Ease Land Bidding Rules as Property Stress Spreads - Bloomberg 2 China’s Pilot Property Tax Reforms Benefit Markets Despite Short-Term Pain, Analysts Say - Caixin Global Market/Sector Recommendations Cyclical Investment Stance
A key area of contention among BCA Research strategists is the outlook for US equities relative to their global peers. The Global Investment Strategy and Bank Credit Analyst services expect US stocks to underperform Euro Area equities over a 12-month…
Highlights Last month we published a report on the US corporate margins, titled “Marginally Worse.” In the report, we concluded that margins are likely to contract next year, hobbled by a slowdown in top-line growth, falling productivity, a decline in corporate pricing power, and soaring costs of labor and materials. Q3-2021 – another stellar earnings season: Companies achieved superior earnings growth and expanded margins. However, many companies guided down for Q4-2021 and 2022 citing mounting challenges, such as higher costs of labor, shipping, and raw materials. As such, deciphering which sectors are best positioned to maintain profitability is of paramount importance. Framework for Sector Margin Scorecard: We introduce a framework to rank the S&P 500 sector based on the expected resilience of their margins. It is based on four factors that provide a uniform basis for comparison across all sectors, despite their inherent differences in cost structure, effects of input costs, and ability to manage prices. The four factors driving changes in operating margins are: Sell-side operating margins forecasts as a concise summary of bottom-up company trends Pent-up demand for the sector’s products proxied by the difference between annualized sales growth in 2020 and 2021 and long-term annualized sales growth Pricing power or ability to pass on costs to customers Degree of operating leverage or ability to spread costs when sales volume increases Sectors with most resilient margins: According to this scorecard, Financials, Healthcare, Energy, and Utilities are in the best position to preserve operating margins (Table 1). Table 1Sector Margins Scorecard
Sector Margins Scorecard
Sector Margins Scorecard
Energy Sector - Upgrade to Overweight The medium-term supply/demand backdrop is highly supportive of the current crude oil prices, with a Brent price target of $81 and upside price risk due to inadequate capex. Margins are still below the pre-pandemic peak and the street expects them to increase by 7.74 percentage points over the next 12 months. High operating leverage converts growing demand from the global economic recovery into profitability. Financials – Overweight: O/W Banks, EW Insurance While sell-side analysts anticipate Financials margins will decline, we believe that margins may surprise on the upside: The sector has high operating leverage, is somewhat insulated from supply chain disruptions, sees green shoots in loan growth, and its pricing power is improving. Further, the BCA house view expects the 10-year Treasury yield will rise to 2.0% - 2.25% by the end of 2022, supporting net interest margins. Healthcare - Overweight: O/W Medical Equipment and Services, EW Pharma In July we published a report on the Healthcare sector, titled “Checking The Pulse: Deep Dive Into The Health Care Sector” and upgraded it to Overweight. The Healthcare sector is one of the most resilient sectors profitability-wise as, being defensive in nature, its sales are unaffected by changes in economic demand. The street expects margins to expand by over 2% over the next 12 months. Further, there is still significant pent-up demand for the health care services, and specifically for the elective procedures – the most lucrative segment of the Healthcare Sector. Pricing power has recently picked up. Feature Last month we published a report on US corporate profit margins, titled “Marginally Worse.” In that report, we took a close look at corporate margins by analyzing their key drivers. We have concluded that margins are likely to contract next year, driven by a slowdown in top-line growth, falling productivity, and a decline in corporate pricing power. The sales side of the margin equation will fail to offset upward cost pressures imposed by the tight labor market, soaring input prices and transportation costs, rising depreciation expense, and a potential increase in tax rates. We also developed a simple model that encapsulates all the moving parts (Chart 1). Our forecast, based on the model, reiterates that the path of least resistance for US corporate margins is lower.
Chart 1
In this report, we will take a close look at the S&P 500 sectors to gauge their ability to grow earnings and preserve margins. We aim to rank them by their ability to maintain profitability. Q3-2021 Earnings Season: Stellar Results Operating sector margins are a focal point for investors in the current environment of soaring shipping costs, PPI readings unseen for the last forty years, and a wage-price spiral that may lead to prolonged periods of elevated inflation. While rising costs have been a concern for a while now, the Q3-2021 earnings season has surprised on the upside, with 81% of companies exceeding analyst earnings expectations. Earnings increased by 42% year-over-year and sales 17%. The two-year annualized growth rate (CAGR) for S&P 500 earnings is 14.6% and 5.7% for sales. The pandemic trough has been all but forgotten, and earnings are back to their trend (Chart 2).
Chart 2
Chart 3
All sectors, except for Industrials and Consumer Discretionary, have earnings and sales that exceed pre-pandemic levels (Chart 3). Energy, Materials, and Tech enjoyed annualized eps growth over the past two years in excess of 20%. And of course, because of such robust earnings growth, most sectors have reached 2010 -2021 peak margins (Chart 4). And these are unprecedented high peaks: Most sectors’ margins are more than two standard deviations away from their five-year averages. From a statistical standpoint, Z-scores in this “zip code” indicate that the probability of even higher margins is minuscule (Chart 5).
Chart 4
Chart 5
How were companies able to achieve such stellar earnings growth and peak margins despite all the cost and supply chain disruption headwinds? The answer is strong sales growth, efficiency in managing suppliers, ability to pass on costs to customers by raising prices, and finally, high operating leverage. Here is what happened in the words of the companies: Home Depot: “Professional home improvement contractors have had huge backlogs of work to do, and impatient customers have in many cases been willing to pay up in order to get the goods needed despite supply chain problems.” Microsoft: "We do have good understanding of lead times required to meet the capacity and signals that we’re seeing. I think we do a good job managing that. It’s not to say we’re not impacted. Multiple suppliers are important to be able to manage through that, and I feel the team has done a very good job.” Union Pacific Corporation: "The Union Pacific team successfully navigated global supply chain disruptions, a major bridge outage, and additional weather events to produce strong quarterly revenue growth and financial results." Honeywell: "Our disciplined approach to productivity and pricing helped deliver a strong third quarter despite an uncertain global environment marked by supply chain constraints, increasing raw material inflation, and labor market challenges.” Coca-Cola: Our results through the first nine months of 2021," CEO Frank Harrison said, "reflect a strong balance of volume growth, price realization, and prudent expense management." However, there are also multiple cracks in the foundation, with companies such as Target and Amazon guiding lower both for Q4-2021 and 2022 citing higher costs of labor, shipping, and raw materials. As such, deciphering which sectors can maintain profitability is of paramount importance. Building A Sector Margin Scorecard So which sectors have the best ability to preserve or even expand margins over the next year? Forecasting profitability by sector is tricky, as every sector is different, and has disparate drivers of sales and costs, making cross-sectional comparisons challenging. However, we have an advantage – we are not aiming to predict a point estimate for each sector margin a year from now, but rather rank all sectors from best to worst in terms of their ability to maintain profitability. To do so, we have created a scorecard based on four factors that provide a uniform basis for comparison across all sectors, despite their inherent differences in cost structure, effects of input costs, and ability to manage prices. These factors also implicitly incorporate a potential mean reversion, i.e., high readings are unlikely to move even higher. Four factors capturing future changes in the profit margins are: Sell-side forecasts of operating margins over the next 12 months as a concise summary of bottom-up company trends Pent-up demand for the sector’s products proxied by the difference between 2019-2021 sales CAGR and long-term annualized sales growth Pricing power or ability to pass on costs to customers Degree of operating leverage or ability to spread costs when sales volume increases Factor 1: Expected Change In Operating Margins Over The Next 12 Months Top-down sector margin expectations for the next 12 months are an aggregation of the bottom-up company forecasts. Since the stock market is a market of stocks, this is an important summary of companies' trends which we incorporate into our ranking framework. In line with our view, sell-side analysts expect S&P 500 margins to contract by 1.2% over the next 12 months. Margin contraction is expected across the board with two notable exceptions: Energy and Healthcare. In the scorecard, we rank sectors based on the expected magnitude of the margin change, such that sectors with the least compression, or outright growth, are scoring better (Chart 6).
Chart 6
Factor 2: Pent-up Demand For The Sector’s Products Most sectors have enjoyed a fantastic sales and earnings recovery this year (Chart 7), with sales exceeding pre-pandemic levels thanks to strong consumer demand.
Chart 7
However, to gauge the level of pent-up demand for each sector, we compare 2020-2021 CAGR of sales growth with a long-term sales growth rate. We call this factor “sales growth differential.” Our thinking is that if recent sales growth is below a pre-pandemic normal, there is still demand left on the table. For example, the Consumer Discretionary sector is not yet back to the pre-pandemic “normal” pace of growth. Therefore, there is still strong demand for its products and services. This aligns well with what we were observing for months now. Fears of Covid-19 have resulted in a shift of spending from services to goods. As a result, demand for goods has overshot pre-pandemic levels, while demand for services is below its pre-pandemic trend and is enjoying a rebound (Chart 8). Chart 8There Is Still Pent-up Demand For Services
There Is Still Pent-up Demand For Services
There Is Still Pent-up Demand For Services
In the scorecard, we assign a higher score to the sectors like Industrials and Consumer Discretionary expecting a more significant pickup in sales growth, and a lower score to the sectors with sales growth that exceeds the historical average on the concern that mean reversion may be in store: A strong bounce back in sales has already materialized, and demand has been pulled forward. Factor 3: Pricing Power Pricing Power is a proprietary BCA indicator based on the PPI and CPI indices for the 60 different industries. Industries are rolled up into sector indices and the market index.1 Sectors with higher pricing power can pass on their costs to their customers. However, at some point, they may no longer be able to raise prices as that will dampen demand for their products. As a result, after a series of price increases, companies’ pricing power wanes. Today, pricing power of companies in most sectors is already two-to-three standard deviations above the five-year average, suggesting that the probability of further gains is extremely low, i.e., one percent or less (Chart 9). The only exceptions are the Healthcare and Financial sectors whose pricing power has barely budged.
Chart 9
What sectors do we prefer? Ones with a very high pricing power that is about to roll over or the ones whose pricing power is handicapped by outside political pressures and competitive headwinds? Since we believe that markets are driven by the second derivative, waning pricing power may have a detrimental effect on sector performance, while low and stable pricing power is already priced into expectations. To reflect this thinking, we penalize sectors whose pricing power is high relative to five years of history, expecting mean reversion. Factor 4: Degree Of Operating Leverage The degree of operating leverage (DOL), which gauges the company’s ability to spread its costs over sales, is largely determined by the cost of each marginal unit sold. This is a metric that assesses the cost structure of the sector in terms of fixed costs vs. variable costs. Sectors with higher fixed costs have higher operating leverage: It costs next to nothing to produce a marginal unit of sales, which leads to higher profitability as volume grows. We calculate DOL as the following: DOL= % Change in Operating Income/ % Change in Sales Percentage of change in operating income and sales is a five-year change to smooth out volatility and assess the longer-term relationship. Further, to obtain a comprehensive picture of the longer-term DOL, we calculate a median reading for each sector from 2010 to 2021. Median ignores extreme values and is better at capturing the “normal”. We also exclude negative and zero readings from our calculations to gauge DOL only when the companies are profitable (Chart 10).
Chart 10
Bringing It All Together: Operating Margins Sector Scorecard We have ranked all 11 sectors along the four dimensions described above. As a result, we expect Financials, Healthcare, Energy, and Utilities to be in the best position to preserve operating margins (Table 1). Table 1Sector Margins Scorecard
Sector Margins Scorecard
Sector Margins Scorecard
Energy Sector - Upgrade To An Overweight Energy profit margins are linked to underlying commodity prices. BCA Commodity and Energy strategists’ view is that the medium-term supply/demand backdrop is highly supportive of the current energy pricing dynamics and that the oil price is expected to stay high, at around its current level, for the next two years. They also note that upside price risk is increasing going forward, due to inadequate capex. Current operating margins remain well below the previous cyclical peak (Chart 11) and are expected to increase by 7.74 percentage points over the next 12 months. Although the price of oil has risen above the breakeven levels, energy companies are reluctant to invest in capex due to pressure from shareholder activists and newly found financial discipline. As a result, prices are likely to remain high until “high prices cure high prices”. In the meantime, energy producers are returning cash to shareholders – a unique bonus in the current world starved for yield. Chart 11The Street Expects the Energy Sector Margins To Expand. We concur...
The Street Expects the Energy Sector Margins To Expand. We concur...
The Street Expects the Energy Sector Margins To Expand. We concur...
Oil demand is expected to stay robust on the back of the global economic recovery, especially with an increase in consumption by airlines that are resuming international travel. Case in point: ExxonMobil (XOM) “anticipates demand improvement in its downstream segment with a continued economic recovery.” Upgrade Energy from an Equal Weight to an Overweight Financials – Overweight: O/W Banks, EW Insurance 2021 was a blockbuster year for banks on the back of the booming M&A and IPO activity. However, to achieve sustainable profitability, they need to jumpstart the loan growth process. There are early signs that lending is likely to pick up next year (Chart 12). According to JPM: "The customers who typically contribute to credit card loan growth are starting to spend the savings built up from the pandemic at a faster clip, suggesting they could be getting closer to taking on debt again" Regional banks already see the green shoots. According to Key Bank:"We are pleased with the trajectory of our loan growth." Chart 12Early Signs Of Lending Picking Up
Early Signs Of Lending Picking Up
Early Signs Of Lending Picking Up
Insurance companies are faring worse than Banks. Higher costs of labor and materials result in higher replacement costs, and higher customer payouts. However, insurers succeed in incorporating these higher expenses into pricing. While sell-side analysts anticipate margins will decline, (Chart 13) we believe that they may surprise on the upside: High operating leverage, improving pricing power (Chart 14) and growing demand for loans will contribute to strong profitability. Further, BCA expects the 10-year Treasury yield will rise to 2.0% - 2.25% by the end of 2022, supporting wider net interest margins. Chart 13While The Street Has Doubts About The Financial Sector Margins, We Are Constructive...
While The Street Has Doubts About The Financial Sector Margins, We Are Constructive...
While The Street Has Doubts About The Financial Sector Margins, We Are Constructive...
Chart 14Pricing Power Is Improving
Pricing Power Is Improving
Pricing Power Is Improving
Healthcare - Overweight: O/W Medical Equipment and Services, EW Pharma In July we published a report on the Healthcare sector, titled “Checking The Pulse: Deep Dive Into The Health Care Sector.” In this report, we upgraded the Healthcare sector to an overweight. Today, we reiterate the call. First, in a slowdown stage of the business cycle, Healthcare tends to outperform. Second, the Healthcare sector is one of the most resilient sectors profitability-wise as, being defensive by nature, its sales are unaffected by changes in economic demand. The street expects margins to expand by over 2% over the next 12 months (Chart 15). Further, there is still significant pent-up demand for health care services, and specifically for elective procedures – the most lucrative segment of the Healthcare market. Pricing power has recently picked up (Chart 16). Companies concur that life is getting better: According to JNJ:” many of the hospitals and other providers have to pay more for their input, and that's going to be reflected in the economics as we go forward. And of course, all that is reflected in how we price going forward”. Chart 15The Healthcare Margins Are Posed To Widen
The Healthcare Margins Are Posed To Widen
The Healthcare Margins Are Posed To Widen
Chart 16After A Prolonged Decline, Healthcare Pricing Power Is Finally On The Rise
After A Prolonged Decline, Healthcare Pricing Power Is Finally On The Rise
After A Prolonged Decline, Healthcare Pricing Power Is Finally On The Rise
Consumer Staples - Underweight Our sector margins scorecard has identified Consumer Staples as a sector most susceptible to a margin squeeze. Sell-side expects margins to contract by 2% (Chart 17). This is a sector that has low operating leverage which indicates that the marginal cost of producing each additional unit is high, and is particularly vulnerable to rising input costs. At the same time pricing power of the sector is likely to wane: companies were able to raise prices throughout 2021, and now pricing power is over four standard deviations above the five-year average (Chart 18). Raising prices in the environment when fiscal stimulus is in the rearview mirror, against a backdrop of negative real wage growth, will be challenging. Walmart surely knows its customers: It decided to “absorb higher costs and keep prices low for customers all across the business.” Operating Margins of Consumer Staples are likely to contract in 2022. Chart 17Consumer Staples Margins Are Expected To Plunge
Consumer Staples Margins Are Expected To Plunge
Consumer Staples Margins Are Expected To Plunge
Chart 18Pricing Power Is Not Sustainable
Pricing Power Is Not Sustainable
Pricing Power Is Not Sustainable
Investment Implications Our analysis indicates that companies in most sectors have reached their peak margins in Q3-2021. Looking ahead, there will be distinct profitability tracks, with some sectors expanding margins while others will experience margin compression. Sectors that have higher operating leverage, pent-up demand left over from the pandemic slowdown, and whose pricing power may still increase will fare best. Our scorecard screened all the 11 sectors based on these conditions, and Financials, Energy, Healthcare, and Utilities have the best shot at maintaining and even expanding their margins. We have been overweight Financials and Healthcare in our portfolios for a while now, and the expectation of resilient profitability only reinforces our conviction. We are upgrading Energy from neutral to an overweight on the back of the expected margin expansion and high oil price target. We are still underweight Utilities which we consider as a bond proxy, unlikely to outperform in a rising rates environment. Bottom Line In this report, we introduce a framework to rank the S&P 500 sectors based on the expected resilience of their margins. Factors we consider are operating leverage, pricing power, pent-up demand, and sell-side margin expectations. As a result of the analysis, we believe that Financials, Energy, Healthcare, and Utilities are posed for strong profitability in 2022. Irene Tunkel Chief Strategist, US Equity Strategy irene.tunkel@bcaresearch.com Appendix: Chart 19
CHART 19
CHART 19
Chart 20
CHART 20
CHART 20
Chart 21
CHART 21
CHART 21
Chart 22
CHART 22
CHART 22
Chart 23
CHART 23
CHART 23
Chart 24
CHART 24
CHART 24
Chart 25
CHART 25
CHART 25
Chart 26
CHART 26
CHART 26
Chart 27
CHART 27
CHART 27
Chart 28
CHART 28
CHART 28
Chart 29
CHART 29
CHART 29
Chart 30
CHART 30
CHART 30
Footnotes 1 Pricing power is calculated by finding the difference between how much the industry has been able to increase prices and the change in the cost of the raw materials due to inflation. For example, for airlines, pricing power would be measured as the difference in the airfare CPI and jet fuel inflation. The exact calculation is industry specific. Industries are rolled up into sector indices and the market index. Recommended Allocation
Dear Client, There will be no report next week as we will be working on our Quarterly Strategy Outlook, which will be published the following week. In the meantime, please keep an eye out for BCA Research’s Annual Outlook, featuring long-time BCA client Mr. X, who visits towards the end of each year to discuss the economic and financial market outlook for the year ahead. Best regards, Peter Berezin Chief Global Strategist Highlights Inflation in the US, and to a lesser extent, in other major economies, will follow a “two steps up, one step down” trajectory of higher highs and higher lows. While inflation will fall in the first half of next year as goods prices stabilize, an overheated labor market will cause inflation to re-accelerate into 2023. The Fed will be slow to respond to high inflation, implying that monetary policy will remain accommodative next year. This should help propel stocks to new highs. Chinese stimulus will offset much of the drag from a weaker domestic property market. The dollar is a high momentum currency, so we wouldn’t bet against the greenback in the near term. Nevertheless, with “long dollar” now a consensus trade, we would position for a weaker dollar over a 12-month horizon. A depreciating dollar next year should help non-US equities, especially beleaguered emerging market stocks. The dollar will strengthen anew in 2023, as the Fed is forced to turn more hawkish, and global equities begin to buckle. From Ice To Fire In past reports, we have contended that inflation in the US, and to a lesser extent, in other major economies, would follow a “two steps up, one step down” trajectory of higher highs and higher lows. We are currently near the top of those two steps. The pandemic ushered in a major re-allocation of spending from services to goods (Chart 1). US inflation should dip over the next 6-to-9 months as the demand for goods decelerates and supply-chain disruptions abate. Chart 1The Pandemic Caused A Major Shift In Spending From Services To Goods
The Pandemic Caused A Major Shift In Spending From Services To Goods
The Pandemic Caused A Major Shift In Spending From Services To Goods
CHart 2Those With Low Paid Jobs Are Enjoying Stronger Wage Gains
Those With Low Paid Jobs Are Enjoying Stronger Wage Gains
Those With Low Paid Jobs Are Enjoying Stronger Wage Gains
The respite from inflation will not last long, however. The labor market is heating up. So far, most of the wage growth has been at the bottom end of the income distribution (Chart 2). Wage growth will broaden over the course of 2022, setting the scene for a price-wage spiral in 2023. We doubt that either fiscal or monetary policy will tighten fast enough to prevent such a spiral from emerging. As a result, US inflation will surprise meaningfully on the upside. Our view has no shortage of detractors. In this week’s report, we address the main counterarguments in a Q&A format: Q: What makes you think that service spending will rebound fast enough to offset the drag from weaker goods consumption? Chart 3Inventory Restocking Could Be A Source Of Growth Next Year
Inventory Restocking Could Be A Source Of Growth Next Year
Inventory Restocking Could Be A Source Of Growth Next Year
A: There is still a lot of pent-up demand for goods. Try calling any auto dealership. You will hear the same thing: “We have nothing in stock now, but if you put in an order today, you might get a vehicle in 3-to-6 months.” Thus, durable goods sales are unlikely to weaken quickly. And with inventories near record low levels, firms will need to produce more than they sell (Chart 3). Inventory restocking will support GDP growth. As for services, real spending in the US grew by 7.9% in the third quarter, an impressive feat considering that this coincided with the Delta-variant wave. Service growth will stay strong in the fourth quarter. The ISM non-manufacturing index jumped to a record high of 66.7 in October, up from 61.9 in September. The Atlanta Fed’s GDPNow model is tracking real PCE growth of 9.2% in Q4. Goldman’s Current Activity Indicator has hooked up (Chart 4).
Chart 4
Q: Aren’t you worried that spending on services might stall next year? A: Not really. Chart 5 shows the percentage change in real spending for various types of services from January 2020 to September 2021, the last month of available data.
Chart 5
Chart 6
The greatest decline in spending occurred in those sectors that were most directly affected by the pandemic. Notably, spending on movie theaters, amusement parks, and live entertainment in September was still down 46% on a seasonally-adjusted basis compared to last January. Hotel spending was down 22%. Spending on public transport was down 26%. Only spending on restaurants was back to normal. The number of Covid cases has once again started to trend higher in the US, so that path to normalization will take time (Chart 6). Nevertheless, with vaccination rates still edging up and new antiviral drugs set to hit the market, it is reasonable to assume that many of the hardest-hit service categories will recover next year. Q: What about medical services? Some have speculated that the shift to telemedicine will require much lower spending down the road. A: It is true that spending on outpatient services in September was $43 billon below pre-pandemic levels. However, over two-fifths of that shortfall was in dental services, which are not amenable to telemedicine. Spending on dental services was down 16% from its January 2020 levels, compared to 6% for physician services. A more plausible theory is that many people are still worried about venturing to the doctor’s or dentist’s office. In addition, a lot of elective procedures were canceled or postponed due to the pandemic. Clearing that backlog will lift medical spending next year. Chart 7The Flow Of Savings Has Fallen Back To Pre-Pandemic Levels But The Stock Of Accumulated Savings Remains High
The Flow Of Savings Has Fallen Back To Pre-Pandemic Levels But The Stock Of Accumulated Savings Remains High
The Flow Of Savings Has Fallen Back To Pre-Pandemic Levels But The Stock Of Accumulated Savings Remains High
In any case, the cost of a telemedicine appointment is typically no different from an in-person one. And, to the extent that telemedicine does become more widespread, this could encourage more people to seek medical assistance. Lastly, even if spending on certain services does not fully recover after the pandemic, this will probably simply result in a permanent increase in spending on goods. The only way that overall consumer spending will falter is if the savings rate rises, which seems unlikely to us. Q: Why do you say that? The savings rate has been very high throughout the pandemic. A: The savings rate did spike during the pandemic, but that was mainly because fewer services were available, and because households were getting transfer payments from the government. Now that these payments have ended, the savings rate has dropped to 7.5%, roughly where it was prior to the pandemic. There is good reason to think the savings rate will keep falling next year. Households are sitting on $2.3 trillion in excess savings, most of which reside in bank deposits (Chart 7). As they run down those savings, consumption will rise in relation to income. The household deleveraging cycle is over. After initially plunging during the pandemic, credit card balances are rising (Chart 8). Banks are eager to make consumer loans (Chart 9). Household net worth has risen by over 100% of GDP since the start of the pandemic (Chart 10). As we discussed three weeks ago, the wealth effect alone could boost annual consumer spending by up to 4% of GDP. Chart 8APost-GFC Deleveraging Has Ended And People Are Swiping Credit Cards Again Following The Pandemic Scare
Post-GFC Deleveraging Has Ended And People Are Swiping Credit Cards Again Following The Pandemic Scare
Post-GFC Deleveraging Has Ended And People Are Swiping Credit Cards Again Following The Pandemic Scare
Chart 8BPost-GFC Deleveraging Has Ended And People Are Swiping Credit Cards Again Following The Pandemic Scare
Post-GFC Deleveraging Has Ended And People Are Swiping Credit Cards Again Following The Pandemic Scare
Post-GFC Deleveraging Has Ended And People Are Swiping Credit Cards Again Following The Pandemic Scare
Chart 9Banks Are Easing Credit Standards For Consumer Loans
Banks Are Easing Credit Standards For Consumer Loans
Banks Are Easing Credit Standards For Consumer Loans
Chart 10A Record Rise In Household Net Worth
A Record Rise In Household Net Worth
A Record Rise In Household Net Worth
Q: Household wealth could fall as the Fed starts tapering and eventually raising rates. Wouldn’t that cool the economy? A: The taper is a fait accompli, and markets are already pricing in rate hikes starting in the second half of next year. If the Fed were to signal its intention to raise rates more quickly than what has been priced in, then home prices and stocks could certainly weaken. We do not think the Fed will pivot in a more hawkish direction before the end of next year, however. The Fed’s estimate of the neutral rate is only 2.5%, a big step down from its estimate of 4.25% in 2012. The market’s view is broadly in line with the Fed’s (Chart 11). Despite the upward move in realized inflation, long-term inflation expectations remain in check – expected inflation 5-to-10 years out in the University of Michigan survey has increased from 2.3% in late 2019 to 2.9%, bringing it back to where it was between 2010 and 2015. The 5-year/ 5-year forward TIPS breakeven inflation rate is near the bottom end of the Fed’s comfort zone (Chart 12). Chart 11The Fed And Investors Still Believe In Secular Stagnation
The Fed And Investors Still Believe In Secular Stagnation
The Fed And Investors Still Believe In Secular Stagnation
Chart 12Long-Term Inflation Expectations Are Not Yet A Concern For The Fed
Long-Term Inflation Expectations Are Not Yet A Concern For The Fed
Long-Term Inflation Expectations Are Not Yet A Concern For The Fed
Q: What about fiscal policy? Isn’t it set to tighten sharply next year? A: The US budget deficit will decline next year. However, this will happen against the backdrop of strong private demand growth. Moreover, budget deficits are likely to remain elevated in the post-pandemic period. This week, President Biden signed a $1.2 trillion infrastructure bill into law, containing $550 billion in new spending. BCA’s geopolitical strategists expect Congress to pass a $1.5-to-$2 trillion social spending bill using the reconciliation process. All in all, the IMF foresees the US cyclically-adjusted primary budget deficit averaging 4.9% of GDP between 2022 and 2026, compared to 2.0% of GDP between 2014 and 2019 (Chart 13).
Chart 13
Chart 14While Overall Consumption Has Recovered, Business Spending and Direct Government Expenditures Remain Below Trend
While Overall Consumption Has Recovered, Business Spending and Direct Government Expenditures Remain Below Trend
While Overall Consumption Has Recovered, Business Spending and Direct Government Expenditures Remain Below Trend
It should also be noted that government spending on goods and services has been quite weak over the past two years (Chart 14). The budget deficit surged because transfer payments exploded. Unlike direct government spending, which is set to accelerate over the next few years, households saved a large share of transfer payments. Thus, the fiscal multiplier will increase next year, even as the budget deficit shrinks. Q: We have focused a lot on demand, but what about supply? There are over 4 million fewer Americans employed today than before the pandemic and yet the job openings rate is near a record high. Chart 15Despite A Notable Decline, There Are Still A Lot Of People Avoiding Work Because Of Worries About Contracting Or Transmitting Covid
Despite A Notable Decline, There Are Still A Lot Of People Avoiding Work Because Of Worries About Contracting Or Transmitting Covid
Despite A Notable Decline, There Are Still A Lot Of People Avoiding Work Because Of Worries About Contracting Or Transmitting Covid
A: Some people who left the workforce will regain employment. According to the Census Bureau’s Household Pulse Survey, there are still 2.5 million people not working because they are afraid of catching or transmitting the virus (Chart 15). That said, some workers may remain sidelined for a while longer. The very same survey also revealed that about 8 million of the 100 million workers currently subject to vaccine mandates say that “they will definitely not get the vaccine.” In addition, about 3.6 million workers have retired since the start of the pandemic, about 1.2 million more than one would have expected based on pre-existing demographic trends. Most of these retirees will not work again. Lifestyle choices may keep others from seeking employment. Female labor participation has declined much more during the pandemic and than it did during the Great Recession (Chart 16). While many mothers will re-enter the labor force now that schools have reopened, some may simply choose to stay at home.
Chart 16
The bottom line is that the pandemic has reduced labor supply at a time when labor demand remains very strong. This is likely to exacerbate the labor shortage. Q: Any chance that higher productivity will offset some of the damage to the supply side of the economy from decreased labor participation? A: US labor productivity did increase sharply during the initial stages of the pandemic. However, that appears to have been largely driven by composition effects in which low-skilled, poorly-paid service workers lost their jobs. As these low-skilled workers have returned to the labor force, productivity growth has dropped. The absolute level of productivity declined by 5.0% at an annualized rate in the third quarter, leading to an 8.3% increase in labor costs. It is telling that productivity growth has been extremely weak outside the US (Chart 17). This gives weight to the view that the pandemic-induced changes in business practices have not contributed to higher productivity, at least so far. It is also noteworthy that a recent study of 10,000 skilled professionals at a major IT company revealed that work-from-home policies decreased productivity by 8%-to-19%, mainly because people ended up working longer. Increased investment spending should eventually boost productivity. Core capital goods orders, which lead corporate capex, are up 18% since the start of the pandemic (Chart 18). However, the near-term impact of increased investment spending will be to boost aggregate demand, stoking inflation in the process.
Chart 17
Chart 18US Capex Should Pick Up
US Capex Should Pick Up
US Capex Should Pick Up
Q: We have spoken a lot about the US, but the world’s second biggest economy, China, is facing a massive deflationary shock from the implosion of its real estate market. Could that deflationary impulse potentially cancel out the inflationary impulse from an overheated US economy? A: You are quite correct that inflation has risen the most in the US. While inflation has picked up in Europe, this mainly reflects base effects (Chart 19). Inflation in China has fallen since the start of the pandemic despite booming exports. There are striking demographic parallels between China today and Japan in the early 1990s. The bursting of Japan’s property bubble corresponded with a peak in the country’s working-age population (Chart 20). China’s working-age population has also peaked and is set to decline by more than 40% over the remainder of the century. Chart 19The US Stands Out As The Inflation Leader
The US Stands Out As The Inflation Leader
The US Stands Out As The Inflation Leader
Chart 20Demographic Parallels Between China And Japan
Demographic Parallels Between China And Japan
Demographic Parallels Between China And Japan
That said, there are important differences between the two nations. In 1990, Japan was a rich economy; output-per-hour was nearly 70% of US levels. China is still a middle-income economy; output-per-hour is only 20% of US levels (Chart 21). China has the ability to outgrow some of its problems in a way that Japan did not. In addition, Chinese policymakers have learned from some of Japan’s mistakes. They have been trying to curb the economy’s dependence on property development; real estate development investment has fallen from 12% of GDP in 2014 to less than 10% of GDP (Chart 22). China is still building too many new homes, but unlike Japan in the 1990s, the government is likely to pursue stimulus measures to compensate for a shrinking property sector. This should keep the economy from entering a deflationary slump.
Chart 21
Chart 22Real Estate Investment Has Peaked In China
Real Estate Investment Has Peaked In China
Real Estate Investment Has Peaked In China
Q: Let’s bring this back to markets. What is the main investment takeaway from your view? A: The main takeaway is that investors should remain bullish on stocks and other risk assets for the next 12 months but be prepared to turn more cautious in 2023. The neutral rate of interest in the US is higher than generally assumed. This means that monetary policy is currently more accommodative than widely believed, which is good for stocks. Unfortunately, it also means that a policy error is likely: The Fed will keep rates too low for too long, causing the economy to overheat. Chart 23Bank Stocks Tend To Outperform When Yields Rise
Bank Stocks Tend To Outperform When Yields Rise
Bank Stocks Tend To Outperform When Yields Rise
This overheating will not be evident over the next six months. As we noted at the outset of this report, the US economy is currently at the top of the proverbial two steps in our projected “two steps up, one step down” trajectory for inflation. The cresting in durable goods inflation will provide a temporary respite from inflationary worries, even as the underlying long-term driver of higher inflation – an increasingly tight labor market – gains traction. Strong consumer demand and persistent labor shortages will incentivize companies to invest in new capacity and automate production. This will benefit industrial stocks and select tech names. Rising bond yields will also boost bank shares (Chart 23). A country’s current account balance is simply the difference between what it saves and what it invests. With savings on the downswing and investment on the upswing, the US will find it increasingly difficult to finance its burgeoning trade deficit. The US dollar is a high momentum currency, so we wouldn’t necessarily bet against the greenback in the near term (Chart 24). Nevertheless, with “long dollar” now a consensus trade, we would position for a weaker dollar over a 12-month horizon (Chart 25).
Chart 24
Chart 25Long Dollar Is A Crowded Trade
Long Dollar Is A Crowded Trade
Long Dollar Is A Crowded Trade
Chart 26A Depreciating Dollar Next Year Should Help Non-US Equities
A Depreciating Dollar Next Year Should Help Non-US Equities
A Depreciating Dollar Next Year Should Help Non-US Equities
A depreciating dollar next year should help non-US equities, especially beleaguered emerging markets (Chart 26). The dollar will strengthen anew in 2023, as the Fed is forced to turn more hawkish, and global equities begin to buckle. Peter Berezin Chief Global Strategist pberezin@bcaresearch.com Global Investment Strategy View Matrix
Image
Special Trade Recommendations
Image
Current MacroQuant Model Scores
Image
Highlights Remain neutral on the US dollar. A breakout of the dollar would cause a shift in strategy. Russia’s conflict with the West is heating up now that Germany has delayed the certification of the Nord Stream II pipeline. As long as the focus remains on the pipeline, the crisis will dissipate sometime in the middle of next year. But there is an equal chance of a massive escalation of strategic tensions. Our GeoRisk Indicators will keep rising in Europe, negatively affecting investor risk appetite. Stick with DM Europe over EM Europe stocks. If the dollar does not break out, South Korea and Australia offer cyclical opportunities. Turkish and Brazilian equities will not be able to bounce back sustainably in the midst of chaotic election cycles and deep structural problems. Rallies are to be faded. Feature We were struck this week by JP Morgan CEO Jamie Dimon’s claim that his business will “not swayed by geopolitical winds.”1 If he had said “political winds” we might have agreed. It is often the case that business executives need to turn up their collars against the ever-changing, noisy, and acrimonious political environment. However, we take issue with his specific formulation. Geopolitical winds cannot shrugged off so easily – or they are not truly geopolitical. Geopolitics is not primarily about individual world leaders or topical issues. It is primarily about things that are very hard and slow to change: geography, demography, economic structure, military and technological capabilities, and national interests. This is the importance of having a geopolitically informed approach to macroeconomics and financial markets: investment is about preserving and growing wealth over the long run despite the whirlwind of changes affecting politicians, parties, and local political tactics. In this month’s GeoRisk Update we update our market-based, quantitative geopolitical risk indicators with a special focus on how financial markets are responding to the interplay of near-term and cyclical political risks with structural and tectonic pressures underlying a select group of economies and political systems. Is King Dollar Breaking Out? Chart 1King Dollar Breaking Out?
King Dollar Breaking Out?
King Dollar Breaking Out?
Our first observation is that the US dollar is on the verge of breaking out and rallying (Chart 1). This potential rally is observable in trade-weighted terms and especially relative to the euro, which has slumped sharply since November 5th. Our view on the dollar remains neutral but we are watching this rally closely. This year was supposed to be a year in which global growth recovered from the pandemic on the back of vaccination campaigns, leading the counter-cyclical dollar to drop off. The DXY bounce early in the year peaked on April 2nd but then began anew after hitting a major resistance level at 90. The United States is still the preponderant power within the international system. The USD remains the world’s leading currency by transactions and reserves. The pandemic, social unrest, and contested election of 2020 served as a “stress test” that the American system survived, whether judging by the innovation of vaccines, the restoration of order, or the preservation of the constitutional transfer of power. Meanwhile Europe faces several new hurdles that have weighed on the euro. These include the negative ramifications of the slowdown in Asia, energy supply shortages, a new wave of COVID-19 cases, and the partial reimposition of social restrictions. Moreover the Federal Reserve is likely to hike interest rates faster and higher than the European Central Bank over the coming years. Potential growth is higher in the US than Europe and the US growth is supercharged by fiscal stimulus whereas Europe’s stimulus is more limited. Of course, the US’s orgy of monetary and fiscal stimulus and ballooning trade deficits raise risks for the dollar. Global growth is expected to rotate to other parts of the world over the coming 12 months as vaccination spreads. There is still a chance that the dollar’s bounce is a counter-trend bounce and that the dollar will relapse next year. Hence our neutral view. Yet from a geopolitical perspective, the US population and economy are larger, more dynamic, more innovative, safer, and more secure than those of the European Union. The US still exhibits an ability to avoid the reckoning that is overdue from a macroeconomic perspective. Russia-West Conflict Resumes In our third quarter outlook we argued that European geopolitical risk had hit a bottom, after coming off the sovereign debt crisis of 2010-15, and that geopolitical risk would begin to rise over the long term for this region. Our reasoning was that the markets had fully priced the Europeans’ decision to band together in the face of risks to the EU’s and EMU’s integrity. What markets would need to price going forward would be greater risks to Europe’s stability from a chaotic external environment that Europe lacked the willingness or ability to control: conflict with Russia, immigration, terrorism, and the slowdown in Asia. In particular we argued that Russia’s secular conflict with the West would resume. US-Russia relations would not improve despite presidential summits. The Nord Stream II pipeline would become a lightning rod for conflict, as its operation was more likely to be halted than the consensus held. (German regulators paused the approval process this week, raising the potential for certification to be delayed past the expected March-May months of 2022.) Most importantly we argued that the Russian strategy of political and military aggression in its near-abroad would continue since Russia would continue to feel threatened by domestic instability at home and Western attempts to improve economic integration and security coordination with former Soviet Union countries. Chart 2Putin Showdown With West To Escalate Further
Putin Showdown With West To Escalate Further
Putin Showdown With West To Escalate Further
For this reason we recommended that investors eschew Russian equities despite a major rally in commodity prices. Any rally would be undercut by the slowing economy in Asia or geopolitical conflicts that frightened investors away from Russian companies, or both. Today the market is in the process of pricing the impact on Russian equities from commodity prices coming off the boil. But politics may also have something to do with the selloff in Russian equities (Chart 2). The selloff can continue given still-negative hard economic data from Asia and the escalation of tensions around Russia’s strategically sensitive borders: Ukraine, Belarus, Poland, Lithuania, Moldova, and the Black Sea. The equity risk premium will remain elevated for eastern European markets as a result of the latest materialization of country risk and geopolitical risk – the long running trend of outperformance by developed Europe has been confirmed on a technical resistance level (Chart 3). Our mistake was closing our recommendation to buy European natural gas prices too early this year. Chart 3Favor DM Europe Amid Russia Showdown
Favor DM Europe Amid Russia Showdown
Favor DM Europe Amid Russia Showdown
In early 2021, our market-based geopolitical risk indicator for Russia slumped, implying that global investors expected a positive diplomatic “reset” between the US and Russia. We advised clients to ignore this signal and argued that Russian geopolitical risk would take back off again. We said the same thing when the indicator slumped again in the second half of the year and now it is clear the indicator will move sharply higher (Chart 4). The point is that geopolitics keeps interfering with investors’ desire to resuscitate Russian equities based on macro and fundamental factors: cheap valuations, commodity price rises, some local improvements in competitiveness, and the search for yield. Chart 4Russian GeoRisk Indicator - Risks Not Yet Priced
Russian GeoRisk Indicator - Risks Not Yet Priced
Russian GeoRisk Indicator - Risks Not Yet Priced
Russia may or may not stage a new military incursion into Ukraine – the odds are 50/50, given that Russia has invaded already and has the raw capability in place on Ukraine’s borders. The intention of an incursion would be to push Russian control across the entire southern border of Ukraine to Odessa, bringing a larger swathe of the Black Sea coast under Moscow’s control in pursuit of Russia’s historic quest for warm water ports. The limitations on Russia are obvious. It would undertake new military and fiscal burdens of occupation, push the US and EU closer together, provoke a stronger NATO defense alliance, and invite further economic sanctions. Yet similar tradeoffs did not prevent Russia from taking surprise military action in Georgia in 2008 or Ukraine in 2014. After the past 13 years the US and EU are still uncoordinated and indecisive. The US is still internally divided. With energy prices high, domestic political support low, and Russia’s long-term strategic situation bleak, Moscow may believe that the time is right to expand its buffer territory further into Ukraine. We cannot rule out such an outcome, now or over the next few years. If Russia attacks, global risk assets will suffer a meaningful pullback. It will not be a bear market unless the conflict spills out beyond Ukraine to affect major economies. We have not taken a second Ukraine invasion as our base case because Russia is focused primarily on getting the Nord Stream pipeline certified. A broader war would prevent that from happening. Military threats after Nord Stream is certified will be more worrisome. A less belligerent but still aggressive move would be for Russia to militarize the Belarussian border amid the conflict with the EU over Belarus’s funneling of Middle Eastern migrants into the EU via Poland and Lithuania. A closer integration of Russia’s and Belarus’s economies and militaries would fit with Russia’s grand strategy, improve Russia’s military posture in eastern Europe, and escalate fears of eventual war in Poland and the Baltic states. The West would wring its hands and announce more sanctions but may not have a higher caliber response as such a move would not involve hostilities or the violation of mutual defense treaties. This outcome would be negative but also digested fairly quickly by financial markets. Our European GeoRisk Indicators (see Appendix) are likely to respond to the new Russia crisis, in keeping with our view that European geopolitical risk will rise in the 2020s: German risk has dropped off since the election but will now revive at least until Nord Stream II is certified. If Russia re-invades Ukraine it will rise, as it did in 2014. French risk was already heating up due to the presidential election beginning April 10 (first round) but now may heat up more. Not that Russia poses a direct threat to France but more that broader regional insecurities would hurt sentiment. The election itself is not a major risk to investors, though terrorist attacks could tick up. President Macron has an incentive to be hawkish on a range of issues over the next half year. The UK is in the midst of the Russia conflict. Its defense cooperation with Ukraine and naval activity in the Black Sea, such as port calls in Georgia, have prompted Russia’s military threats – including a threat to bomb a Royal Navy vessel earlier this year. Not to mention ongoing complications around Brexit. The Russian situation is by far the most significant factor. Spain is at a further remove from Russia but its risks are rising due to domestic political polarization and the rising likelihood of a breakdown in the ruling government. Bottom Line: We still favor these countries’ equities to those of eastern Europe but our risk indicators will rise, suggesting that geopolitical incidents could cause a setback for some or all of these markets in absolute terms. A pickup in Asian growth would be beneficial for developed European assets so we are cyclically constructive. We remain neutral on the USD-EUR though a buying opportunity may present itself if and when the Nord Stream II pipeline is certified. Korea: Nobody’s Heard From Kim In A While Chart 5Korea GeoRisk Indicator Still Elevated
Korea GeoRisk Indicator Still Elevated
Korea GeoRisk Indicator Still Elevated
Geopolitical risk has risen in South Korea due to COVID-19 and its aftershocks, including supply kinks, shortages, and policy tightening by the giant to the West (Chart 5). South Korea’s geopolitical risk indicator is still very high but not because of North Korea. Our Dear Leader Kim Jong Un has not been overly provocative, although he has restarted the cycle of provocations during the Biden administration. Yet South Korean geopolitical risk has skyrocketed. The problem is that investors have lost a lot of appetite for South Korea in a global environment in which demographics are languishing, globalization is retreating, a regional cold war is developing, and debt levels are high. Domestic politics have become more redistributive without accompanying reforms to improve competitiveness or reform corporate conglomerates. The revival of the South Korean conservatives ahead of elections in 2022 suggests political risk will remain elevated. Of course, North Korea could still move the dial. A massive provocation, say something on the scale of the surprise naval attack on the Chonan in the wake of the global financial crisis in spring of 2010, could push up the risk indicator higher and increase volatility for the Korean won and equities. Kim could take such an action to insist that President Biden pay heed to him, like President Trump did, or at least not ignore him, in a context in which Biden is doing just that due to far more pressing concerns. Biden would be forced to reestablish a credible threat. Still, North Korea is not the major factor today. Not compared to the economic and financial instability in the region. At the same time, if global growth surprises pick up and the dollar does not break out, Korea will be a beneficiary. We have taken a constructive cyclical view, although our specific long Korea trade has not worked out this year. Korean equities depreciated by 11.2% in USD terms year-to-date, compared to 0.3% for the rest of EM. Structurally, Korea cannot overcome the negative demographic and economic factors mentioned above. Geopolitically it remains a “shrimp between two whales” and will fail to reconcile its economic interests with its defense alliance with the United States. Australia: Wait On The Dollar Chart 6Australian GeoRisk Indicator Still Elevated
Australian GeoRisk Indicator Still Elevated
Australian GeoRisk Indicator Still Elevated
Australian geopolitical risk has not fallen back much from this year’s highs, according to our quant indicator (Chart 6). Global shortages and a miniature trade war were the culprits of this year’s spike. The advantage for Australia is that commodity prices and metals look to remain in high demand as the world economy fully mends. Various nations are implementing large public investment programs, especially re-gearing their energy sectors to focus more on renewables. The reassertion of the US security alliance is positive for Australia but geopolitical risk is rising on a secular basis regardless. Cyclically we would look positively toward Australian stocks. Yet they have risen by 4.3% in common currency terms this year so far, compared to the developed market-ex-US average of 11.0%. Moreover the Aussie’s latest moves confirm that the US dollar is on the verge of breaking out which would be negative for this bourse. Structurally Australia will go through a painful economic transition but it will be motivated to do so by the new regional cold war and threats to national security. The US alliance is a geopolitical positive. Turkey And Brazil The greenback’s rally could be sustainable not only because of the divergence of US from Asian and global growth but also because of the humiliating domestic political environment of most prominent emerging markets. Chart 7Emerging Market Bull Trap
Emerging Market Bull Trap
Emerging Market Bull Trap
We booked gains our “short” trade of the currencies of EM “strongmen,” such as Brazil’s Jair Bolsonaro and Turkey’s Recep Erdogan, earlier this year. But we noted that we still hold a negative view on these economies and currencies. This is especially true today as contentious elections approach in both countries in 2022 and 2023 respectively (Chart 7). Turkey is trapped into an inflation spiral of its own design, which enervates the economy, as our Emerging Markets Strategy has shown. It is also trapped in a geopolitical stance in which it has repeatedly raised the stakes in simultaneous clashes with Russia, the US, Europe, Israel, the Arab states, Libya, and Iran. Russia’s maneuvers in the Black Sea are fundamentally threatening to Turkey, so while Erdogan has maintained a balance with Russia for several years, Russian aggression could upset that balance. Turkey has backed off from some recent confrontations with the West lately but there is not yet a trend of improvement. The COVID-19 crisis gave Erdogan a badly needed bump in polls, unlike other EM peers. But this simply reinforces the market’s overrating of his odds of being re-elected. In reality the odds of a contested election or an election upset are fairly high. New lows in the lira show that the market is reacting to the whole negative complex of issues around Turkey. But the full weight of the government’s mismanaging of economic policy to stay in power and stay geopolitically relevant has not yet been felt. The election is still 19 months away. A narrow outcome, for or against Erdogan and his party, would make things worse, not better. Brazil’s domestic political and geopolitical risks are more manageable than Turkey’s. But it faces a tumultuous election in which institutional flaws and failures will be on full display. Investors will try to front-run the election believing that former President Luiz Inácio Lula da Silva will restore the good old days. But we discourage that approach. We see at least two massive hurdles for the market: first, Brazil has to pass its constitutional stress test; second, the next administration needs to be forced into difficult decisions to preserve growth and debt management. These will come at the expense of either growth or the currency, according to our Emerging Markets Strategy. We still prefer Mexican stocks. Geopolitically, Turkey will struggle with Russia’s insecurity and aggression, Europe’s use of economic coercion, and Middle Eastern instability. Brazil does not have these external problems, although social stability will always be fragile. Investment Takeaways The dollar is acting as if it may break out in a major rally. Our view has been neutral but our generally reflationary perspective on the global economy is being challenged. Russia’s conflict with the West will escalate, not de-escalate, in the wake of Germany’s decision to delay the certification of the Nord Stream II pipeline. Russia has greater leverage now than usual because of energy shortages. A re-invasion of Ukraine cannot be ruled out. But the pipeline is Russia’s immediate focus. Investors have seen conflict in Ukraine so they will be desensitized quickly unless the conflict spreads into new geographies or spills out to affect major economies. The same goes for trouble on Belarus’s borders. Stick with long DM Europe / short EM Europe. Opportunities may emerge to become more bullish on the euro and European equities if and when the Nord Stream II situation looks to be resolved and Asian risks to global growth are allayed. If the dollar does not break out, South Korea and Australia are cyclical beneficiaries. Whereas “strongman” regimes will remain volatile and the source of bull traps, especially Turkey. Matt Gertken Vice President Geopolitical Strategy mattg@bcaresearch.com Footnotes 1 “JP Morgan chief becomes first Wall Street boss to visit during pandemic,” Financial Times, November 15, 2021, ft.com. Strategic View Open Tactical Positions (0-6 Months) Open Cyclical Recommendations (6-18 Months) Open Trades & Positions
Image
Section II: Appendix: GeoRisk Indicator Russia
Russia: GeoRisk Indicator
Russia: GeoRisk Indicator
United Kingdom
UK: GeoRisk Indicator
UK: GeoRisk Indicator
Germany
Germany: GeoRisk Indicator
Germany: GeoRisk Indicator
France
France: GeoRisk Indicator
France: GeoRisk Indicator
Italy
Italy: GeoRisk Indicator
Italy: GeoRisk Indicator
Canada
Canada: GeoRisk Indicator
Canada: GeoRisk Indicator
Spain
Spain: GeoRisk Indicator
Spain: GeoRisk Indicator
Korea
Korea: GeoRisk Indicator
Korea: GeoRisk Indicator
Turkey
Turkey: GeoRisk Indicator
Turkey: GeoRisk Indicator
Brazil
Brazil: GeoRisk Indicator
Brazil: GeoRisk Indicator
Australia
Australia: GeoRisk Indicator
Australia: GeoRisk Indicator
South Africa
South Africa: GeoRisk Indicator
South Africa: GeoRisk Indicator
Section III: Geopolitical Calendar
Highlights China’s slowdown will deepen, and US bond yields will likely rise. This augurs well for the US dollar but will produce a toxic cocktail for EM. The recent weakness in the commodity complex will continue. EM markets are at risk in absolute terms and will continue to underperform their DM counterparts. From a global macro perspective, the US dollar’s appreciation will be a re-balancing act. In a world where China is exporting economic weakness/deflation and the US is experiencing genuine inflation, a strong US dollar is desirable. The latter will redistribute inflation away from the US to the rest of the world and will redirect disinflationary pressures from the rest of the world to the US. Feature Chart 1DXY Breakout, EM FX Breakdown
DXY Breakout, EM FX Breakdown
DXY Breakout, EM FX Breakdown
The US dollar is breaking out and EM currencies are breaking down (Chart 1). This will set in motion a number of responses in global financial markets. These include but are not limited to selloffs in EM equities, domestic bonds and EM credit markets and a setback in the commodity complex. Hence, we reiterate our negative stance on EM stocks and fixed-income markets. We continue to recommend shorting a basket of EM currencies versus the US dollar. Please refer to the end of this report for detailed investment recommendations. Why The Greenback Is Set To Strengthen Since early in the year, our investment strategy has been based on two macro themes: China’s slowdown and rising US inflation. We concluded early on that these dynamics are positive for the US dollar. Both macro themes have played out fairly well, yet until recently the broad trade-weighted US dollar’s advance has been hesitant. Odds are that the rally in the greenback is about to accelerate. Chart 2China's Slowdown = US Dollar Rally
China's Slowdown = US Dollar Rally
China's Slowdown = US Dollar Rally
The fundamental case for the US dollar rally remains as follows: China’s slowdown will weigh more on emerging Asia, Japan, Europe, and/or commodity producing, developing and developed economies than it will on the US. The basis is that US exports to China make up only 0.7% of its GDP. The same ratio is much higher for the rest of the world. Hence, the US economy will outperform many advanced and emerging economies. Chart 2 illustrates that, historically, whenever China has slowed down, the US dollar has rallied. The mainland’s property construction is shrinking, and traditional infrastructure investment is also extremely weak (Chart 3). Beijing is easing its regulatory and macro policies but only by degrees. For now, policy support will be insufficient to reverse the business cycle downturn. In the meantime, the US economy is overheating. Specifically, all core type inflation measures have surged to well above 2% (Chart 4). Critically, nominal wages are rising at the fastest rate seen in the past 35 years (Chart 5). Chart 3China: Infrastructure Investment Is Very Weak
China: Infrastructure Investment Is Very Weak
China: Infrastructure Investment Is Very Weak
Chart 4US Core Inflation Is Broad-Based And High
US Core Inflation Is Broad-Based And High
US Core Inflation Is Broad-Based And High
Given that the employee quit rate is very high, employers will have to grant notable wage increases to both new and current employees. Thus, wage growth will accelerate further. Recent wage gains have not been offset by productivity growth. As a result, unit labor costs are rising (Chart 6). This will push businesses to raise their selling prices. So long as household income and consumption remain robust, businesses will likely succeed in raising their prices. In short, US inflation is acute and genuine, and, hence, it will persist unless the economy slows considerably. Chart 5US Nominal Wage Growth Is At Its Fastest In 35 Years
US Nominal Wage Growth Is At Its Fastest In 35 Years
US Nominal Wage Growth Is At Its Fastest In 35 Years
Chart 6US Unit Labor Costs Are Rising Fast
US Unit Labor Costs Are Rising Fast
US Unit Labor Costs Are Rising Fast
The rise in US inflation will initially be bullish for the US dollar. The reason is that fixed-income markets will move to price in higher Fed funds rates and the Fed will also acknowledge the need to hike rates given that core inflation is well above its target range. At some point in future, however, high inflation will start hurting the US dollar. This will happen when the Fed eschews rate hikes and falls behind the inflation curve. We believe we are still in a window where US bond yields could rise further. Rising US interest rates will support the dollar. Finally, the US economy, but not necessarily its equity and credit markets, is better positioned to handle central bank tightening than are other DM and EM economies. American consumers have substantially deleveraged and there are shortages in US housing and cars. Even as US borrowing costs rise, interest rate sensitive sectors like housing and autos will still do well because of pent-up demand. In particular, the US housing market is sensitive to long-term (30-year) mortgage rates and not the front end of curve. On the contrary, many EM and other DM economies and their housing sectors are sensitive to domestic short-term rates. In percentage terms, the rise in US mortgage rates will likely be smaller than those in DM and EM economies. In short, the US economy will not slow sharply in the response to rates while EM and other DM economies will. This augurs well for the dollar. The key US vulnerability from higher interest rates stems from its equity and credit markets, not the real economy. US equities and credit markets are very richly priced, so the rising cost of capital could trigger a major selloff. In turn, wealth effects and tightening financial conditions will pose a risk to the real economy. However, even in this case, the US dollar will initially appreciate because it always rallies during risk-off phases. The greenback’s depreciation will resume when the Fed turns dovish again. From a big picture macro perspective, the US dollar’s appreciation will be a re-balancing act. In a world where China is exporting economic weakness/deflation and the US is experiencing genuine inflation, a strong US dollar is desirable. The latter will redistribute inflation away from the US to the rest of the world and will redirect disinflationary pressures from the rest of the world to the US. In this period of US dollar strength, EM financial markets will be hurt because foreign investors always flee EM when their currencies depreciate. Bottom Line: China’s slowdown will deepen, and US bond yields will likely rise. This will produce a toxic cocktail for EM. Watch Out Commodity Prices Chart 7Reduced Financing For Property Developers = Less Construction
Reduced Financing For Property Developers = Less Construction
Reduced Financing For Property Developers = Less Construction
The downturns in China’s property construction and traditional infrastructure spending are bad for raw material prices. The following points offer an explanation as to why commodity prices will relapse in spite of the fact that they have thus far resisted China’s slowdown. Although Chinese property sales and starts have been shrinking, floor area completed (construction work) has been very strong. However, the liquidity crunch that many real estate developers are experiencing will lead them to halt or cut back on their construction work (Chart 7, top panel). The latter will weigh on raw material prices (Chart 7, bottom panel). Taiwan’s new export orders PMI for the basic materials sector has dropped below 50, indicating plunging regional demand for raw materials (Chart 8). Ongoing weakness in Chinese demand is the culprit behind this drop. Due to electricity shortages, mainland production of industrial metals has plunged (Chart 9, top panel). Yet, the prices of these metals have recently corrected (Chart 9, bottom panel). Falling prices amid shrinking supply are a sign of major demand relapse. Chart 8Greater China: Orders For Basic Materials Are Already Shrinking
Greater China: Orders For Basic Materials Are Already Shrinking
Greater China: Orders For Basic Materials Are Already Shrinking
Chart 9Base Metal Price Falling Despite Production Shutdowns In China
Base Metal Price Falling Despite Production Shutdowns In China
Base Metal Price Falling Despite Production Shutdowns In China
The Baltic Dry index – the price of shipping bulk commodities – has rolled over decisively. It has reasonable correlation with industrial metal prices. Oil is much less exposed than base metals to China’s property and infrastructure contraction. In the case of crude, the key risks are the US and China releasing their strategic reserves and the US dollar strength. Bottom Line: The recent weakness in the commodity complex will continue. Other Considerations Chart 10China's Onshore Stock-to_Bond Ratio Is Breaking Down
China's Onshore Stock-to_Bond Ratio Is Breaking Down
China's Onshore Stock-to_Bond Ratio Is Breaking Down
There are a number of other considerations and indicators that lead us to maintain a negative stance on EM financial markets: China’s onshore stock-to-bond ratio has broken below its 200-day moving average (Chart 10). This signifies a deepening growth slump in China. EM equity underperformance has been broad-based. Both the market cap-weighted and equal-weighted EM equity indexes have been underperforming their respective DM indexes. Further, not only have TMT (technology, media and telecom) stocks been underperforming their DM peers, but non-TMT stocks have also lagged their counterparts substantially (Chart 11). Last but not least, EM TMT stocks remain at risk. First, share prices of Chinese internet companies will continue derating due to structurally lower profitability going forward as the government exercises more control over them. We have discussed this in previous reports. In addition, consumer spending online has slowed sharply while smartphone sales are plunging (Chart 12). Chart 11EM Equity Underperformance Is Broad-Based
EM Equity Underperformance Is Broad-Based
EM Equity Underperformance Is Broad-Based
Chart 12China: Online Spending Is Very Weak
China: Online Spending Is Very Weak
China: Online Spending Is Very Weak
Second, DRAM (memory chip) prices are deflating and the value of DRAM sales is shrinking (Chart 13). This is weighing on Korean semiconductor share prices like Samsung and SK Hynix. These stocks have a large market cap in the KOSPI index. Finally, demand for semiconductors produced by Taiwanese companies has been booming but it is presently showing signs of moderation (Chart 14). Chart 13Falling DRAM Prices Are Weighing On Korean Semi Stocks
Falling DRAM Prices Are Weighing On Korean Semi Stocks
Falling DRAM Prices Are Weighing On Korean Semi Stocks
Chart 14Taiwanese Semiconductor Industry: Moderating Orders
Taiwanese Semiconductor Industry: Moderating Orders
Taiwanese Semiconductor Industry: Moderating Orders
Importantly, geopolitical risks around Taiwan in general and TSMC in particularly are enormous. The latter is literally at the center of the US-China confrontation. The timing of a diplomatic or even military crisis is uncertain but our Geopolitical Strategy team expects geopolitical risks over Taiwan to escalate substantially. The recent summit between Presidents Joe Biden and Xi Jinping does not change this assessment. Investment Recommendations Chart 15EM Credit Markets: Prepare For A Broad Selloff
EM Credit Markets: Prepare For A Broad Selloff
EM Credit Markets: Prepare For A Broad Selloff
Continue underweighting EM equities in a global equity portfolio. Within the EM space, our overweights are Korea, Singapore, China (favoring A shares over investable stocks), Vietnam, Russia, central Europe and Mexico. Concerning EM equity sectors, we reiterate the short EM banks / long DM banks and short EM banks / long EM consumer staples positions. In line with our US dollar breakout thesis, we continue to recommend a short position in a basket of the following EM currencies versus the US dollar: BRL, CLP, COP, PEN, ZAR, TRY, THB, PHP and KRW. EM exchange rate depreciation is bad for EM domestic bonds. Currency weakness could lead central banks in Latin America to hike rates further. In brief, the risk-reward of EM local currency bonds is still unattractive. In this space, we recommend the following positions: bet on yield curve flattening in Mexico and Russia (pay 1-year/receive 10-year swap rates); pay Czech 10-year swap rates; receive Chinese and Malaysian 10-year swap rates. We reiterate our underweight in EM credit (both sovereign and corporate) markets versus US corporate credit, quality adjusted. As EM exchange rates depreciate, EM credit spreads will widen (Chart 15). Chinese high-yield corporate US dollar bonds are not yet a buy because the mainland property market’s travails are far from over, as was discussed in our recent Special Report. For a complete list of our recommendations across all asset classes and country strategy within each asset class, please see below or visit our web site. Arthur Budaghyan Chief Emerging Markets Strategist arthurb@bcaresearch.com Footnotes Equities Recommendations Currencies, Credit And Fixed-Income Recommendations
Highlights On a 2-3 year horizon, stay overweight the US stock market, in absolute terms and relative to the non-US stock market… …and stay overweight the US dollar. A good model for the US stock market is the 30-year T-bond price multiplied by US profits. A good model for the non-US stock market is the 2-year T-bond price multiplied by non-US profits. A major long-term risk to the US stock market comes from the blockchain, which is set to return the ownership and control of our data and digital content back to us – from Facebook, Google, and the other tech behemoths that currently control, manipulate, and monetise it… …but this risk is only likely to manifest itself on a 5-10 year horizon. Fractal analysis: The Israeli shekel is overbought. Feature Chart of the WeekThe US Stock Market = The 30-Year T-Bond Multiplied By US Profits
The US Stock Market = The 30-Year T-Bond Multiplied By US Profits
The US Stock Market = The 30-Year T-Bond Multiplied By US Profits
Fears that inflation will stay stubbornly high have lit a fuse under short-dated bond yields. But further along the curve, longer-dated bonds have remained an oasis of relative calm. Indeed, the 30-year T-bond yield stands 50 bps lower today than it stood in March. Given that long-duration bonds underpin the valuation of long-duration stocks, the relative calm of the 30-year bond yield explains the relative calm of the stock market in the face of higher short-term bond yields. The corollary is that substantially higher 30-year yields would threaten that calm. Inflation Will Crash Back To Earth In 2022 The relative calm of the 30-year bond yield is telling central banks: go ahead and hike rates if you want. You’ll just have to slash them again and, on average, keep them lower than you would if you didn’t hike them so soon. Rate hikes work by choking aggregate demand, but aggregate demand doesn’t need choking. Aggregate demand is barely on its pre-pandemic trend in the US, and remains far below its pre-pandemic trend in other major economies, such as the UK, Germany, and France. The pre-pandemic trend is important because it is our best estimate of potential supply. On this best estimate, aggregate demand is still below potential supply (Chart I-2). Chart I-2The 30-Year T-Bond Yield Sees That Aggregate Demand Is Fragile
The 30-Year T-Bond Yield Sees That Aggregate Demand Is Fragile
The 30-Year T-Bond Yield Sees That Aggregate Demand Is Fragile
If aggregate demand is below potential supply, then what can explain the recent surge in inflation? The answer is the massive and unprecedented displacement of demand from services to goods, combined with modern manufacturing processes unable to meet even a 5 percent excess demand, let alone the 26 percent excess demand for durables recently experienced in the US (Chart I-3). Chart I-3The Booming Demand For Goods Is Crashing Back To Earth While Services Remain In Shortfall
The Booming Demand For Goods Is Crashing Back To Earth While Services Remain In Shortfall
The Booming Demand For Goods Is Crashing Back To Earth While Services Remain In Shortfall
Yet as we highlighted last week in The Global Demand Shortfall Of 2022, the recent booming demand for goods is crashing back to earth while the demand for some services will remain structurally below the pre-pandemic trend. Combined with a tsunami of supply that will hit the global economy with a lag, inflation is also likely to crash back to earth by late 2022. The US Stock Market = The 30-Year T-Bond Multiplied By US Profits An important characteristic of any investment is its duration. If all an investment’s cashflows were converted into one ‘lump-sum’ cashflow, then the duration of the investment quantifies how far into the future that lump-sum cashflow would be. For a bond, the duration also equals the percentage change in its price for every 1 percent change in its yield.1 Interestingly, the durations of the US stock market and the 30-year T-bond are very similar, at around 25 years. Therefore, all else being equal, the US stock market should track the 30-year T-bond price. Of course, all else is not equal. The 30-year T-bond has fixed cashflows, whereas the stock market has cashflows that track profits. Allowing for this key difference, the US stock market should track: (The 30-year T-bond price) multiplied by (US profits) multiplied by (a constant) In which the constant connects current profits to the theoretical lump-sum payment 25 years ahead, thereby quantifying the structural growth of profits. But to the extent that the constant does not change, we can ignore it. Simplistic as this model appears, it does provide an excellent explanation for the US stock market’s evolution through the past 40 years (Chart of the Week and Chart I-4) – with deviations from the ‘fair-value’ giving a good gauge of the market’s over- or under-valuation. Chart I-4The US Stock Market = The 30-Year T-Bond Multiplied By US Profits
The US Stock Market = The 30-Year T-Bond Multiplied By US Profits
The US Stock Market = The 30-Year T-Bond Multiplied By US Profits
Looking ahead, there are three ways in which the structural bull market could end: If the overvaluation (deviation from fair-value) became so extreme that a substantial decline in price was required to re-converge with the 30-year T-bond price multiplied by profits. If the 30-year T-bond price could no longer rise to counter a substantial decline in profits. If the constant that links current profits to future profits phase-shifted down, implying that the growth rate of US stock market profits had phase-shifted down – as happened for non-US stock market profits after the dot com bust (Chart I-5). Going through each of these, the US stock market’s current overvaluation of around 10 percent is not so extreme as to be a structural impediment. Chart I-5The Valuation Of The Non-US Stock Market Phase-Shifted Down
The Valuation Of The Non-US Stock Market Phase-Shifted Down
The Valuation Of The Non-US Stock Market Phase-Shifted Down
Meanwhile, the 30-year T-bond yield has scope to decline by at least 150 bps, equating to a 40 percent counterweight to a decline in profits. Hence, this is not a structural impediment either, but will become one once the 30-year T-bond yield reaches 0.5 percent in the next deflationary shock. As for a phase-shift down in profit growth, this is a genuine long-term risk. The main risk comes from the blockchain and its threat to the pseudo-monopoly status that the US tech behemoths have in owning, controlling, manipulating, and monetising our data and the digital content that we create. The blockchain is set to return that ownership and control back to us, to the detriment of Facebook, Google, and the other behemoths of the US stock market. However, this is a long-term risk, likely to manifest itself on a 5-10 year horizon. We conclude that on a 2-3 year horizon, investors should own the US stock market. The Non-US Stock Market = The 2-Year T-Bond Multiplied By Non-US Profits We can extend the preceding analysis to the non-US stock market, with two differences. First, the non-US stock market has a much shorter duration given its much lower exposure to growing cashflows. A higher weighting to financials – which underperform when long yields are falling – further lowers the effective duration to just 2 years (empirically). Second, and obviously, the non-US stock market depends on non-US profits (Chart I-6). Chart I-6The Non-US Stock Market = The 2-Year T-Bond Multiplied By Non-US Profits
The Non-US Stock Market = The 2-Year T-Bond Multiplied By Non-US Profits
The Non-US Stock Market = The 2-Year T-Bond Multiplied By Non-US Profits
It follows that the non-US stock market tracks: (The 2-year T-bond price) multiplied by (non-US profits) We can now decompose the post dot com performance of the US and non-US stock markets into their underlying structural components. The US stock market has received a massive tailwind: a 60 percent increase in the 30-year T-bond price plus a 200 percent increase in profits (Chart I-7). While the non-US stock market has received a lesser tailwind: a 10 percent increase in the 2-year T-bond price plus a 60 percent increase in profits (Chart I-8).2 Chart I-7The US Stock Market Has A Powerful Tailwind...
The US Stock Market Has A Powerful Tailwind...
The US Stock Market Has A Powerful Tailwind...
Chart I-8...The Non-US Stock Market Has A Weak Tailwind
...The Non-US Stock Market Has A Weak Tailwind
...The Non-US Stock Market Has A Weak Tailwind
Therefore, over the past two decades, the non-US stock market has been hampered by its low duration and by its profits that are fossilised, both metaphorically and literally. Metaphorically fossilised, because the non-US stock market is over-exposed to industries that are in structural decline such as financials and basic resources. And literally fossilised, because it is also over-exposed to the dying fossil fuel industry. Looking ahead, there are three ways that non-US stocks could outperform US stocks: If the relative valuation (deviation from respective fair-values) became extreme in favour of non-US stocks. If the 2-year T-bond price outperformed the 30-year T-bond price – effectively meaning that the 30-year T-bond price would have to fall far given that the 2-year T-bond is like cash. If non-US profits outperformed US profits. Going through each of these: both the US and non-US stock markets appear similarly overvalued versus their respective fair-values; the 30-year T-bond is unlikely to fall far given that it would destabilise the global financial system; and fossilised non-US profits are unlikely to outperform those in the US in the next few years. We conclude that on a 2-3 year horizon, investors should stay overweight the US stock market relative to the non-US stock market. One final consideration is the US dollar. Successive deflationary shocks – the 2008 GFC, the 2015 EM recession, and the 2020 pandemic – have taken the greenback to new highs as capital flows have flooded into US T-bonds (Chart I-9). It follows that the ultimate high in the dollar will coincide with the ultimate low in the 30-year T-bond yield. Chart I-9Successive Deflationary Shocks Take The Dollar To New Highs
Successive Deflationary Shocks Take The Dollar To New Highs
Successive Deflationary Shocks Take The Dollar To New Highs
Stay structurally overweight the US dollar. The Israeli Shekel Is Overbought In this week’s fractal analysis, we note that the strong recent rally in ILS/GBP has reached the point of maximum fragility on its 130-day fractal structure that has signalled several previous reversals (Chart I-10). Chart I-10The Israeli Shekel Is Overbought
The Israeli Shekel Is Overbought
The Israeli Shekel Is Overbought
On this basis, a recommended trade would be short ILS/GBP, setting a profit target and symmetrical stop-loss at 4.2 percent. Dhaval Joshi Chief Strategist dhaval@bcaresearch.com Footnotes 1 Defined fully, the duration of an investment is the weighted average of the times of its cashflows, in which the weights are the present values of the cashflows. 2 From January 1, 2005. Fractal Trading System Fractal Trades 6-Month Recommendations Structural Recommendations Closed Fractal Trades Indicators To Watch - Bond Yields Chart II-1Indicators To Watch - Bond Yields ##br##- Euro Area
Indicators To Watch - Bond Yields - Euro Area
Indicators To Watch - Bond Yields - Euro Area
Chart II-2Indicators To Watch - Bond Yields ##br##- Europe Ex Euro Area
Indicators To Watch - Bond Yields - Europe Ex Euro Area
Indicators To Watch - Bond Yields - Europe Ex Euro Area
Chart II-3Indicators To Watch - Bond Yields ##br##- Asia
Indicators To Watch - Bond Yields - Asia
Indicators To Watch - Bond Yields - Asia
Chart II-4Indicators To Watch - Bond Yields ##br##- Other Developed
Indicators To Watch - Bond Yields - Other Developed
Indicators To Watch - Bond Yields - Other Developed
Indicators To Watch - Interest Rate Expectations Chart II-5Indicators To Watch - Interest Rate Expectations
Indicators To Watch - Interest Rate Expectations
Indicators To Watch - Interest Rate Expectations
Chart II-6Indicators To Watch - Interest Rate Expectations
Indicators To Watch - Interest Rate Expectations
Indicators To Watch - Interest Rate Expectations
Chart II-7Indicators To Watch - Interest Rate Expectations
Indicators To Watch - Interest Rate Expectations
Indicators To Watch - Interest Rate Expectations
Chart II-8Indicators To Watch - Interest Rate Expectations
Indicators To Watch - Interest Rate Expectations
Indicators To Watch - Interest Rate Expectations