Equities
BCA Research’s European Investment Strategy service introduced their rotation graphs to assess the evolution of the relative trend and momentum of various assets. The rotation graph for European sectors suggests that some important shifts are underway in…
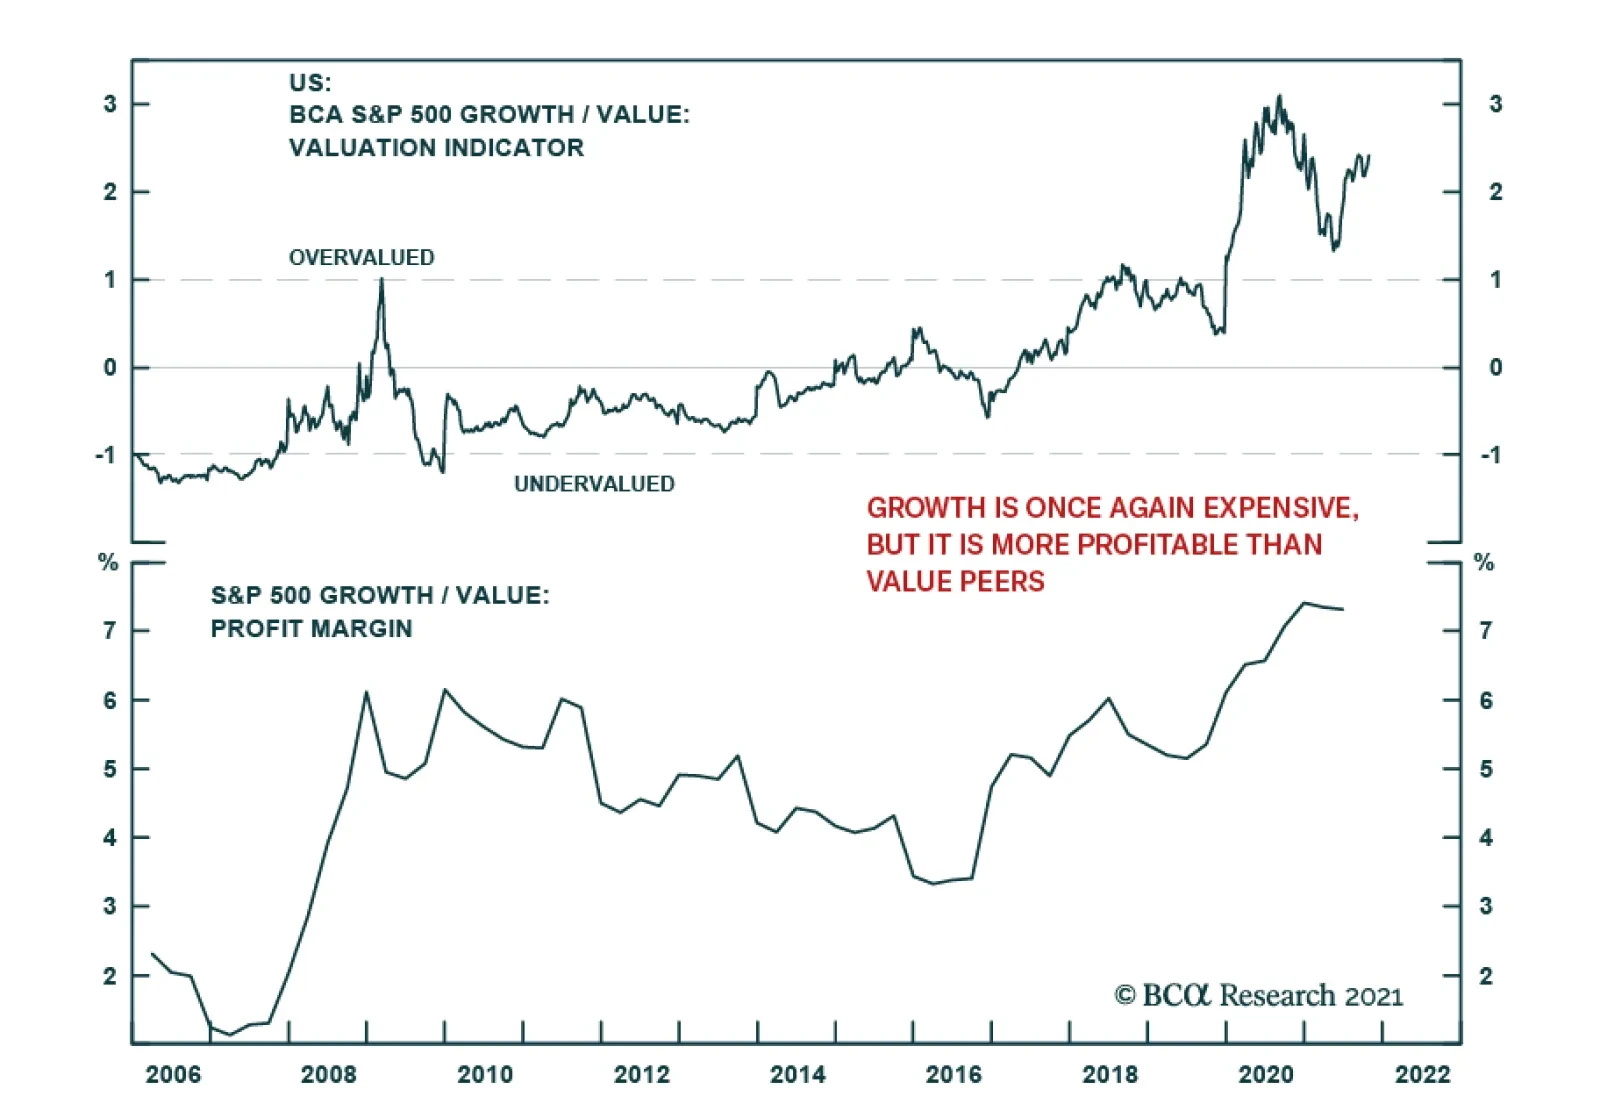
Recent weakness among key stocks that benefitted from the pandemic suggests that the stay at home trade is nearing exhaustion. Our equity strategists’ growth/value valuation indicator shows that growth stocks are once again expensive. Similarly, their…

Highlights Rate Hikes Are Coming – O/W Banks And Small Caps: Rampant inflation is changing investor expectations on the timing and speed of rate hikes. At present, the market is pricing in three rate hikes in 2022. Overweight sectors that outperform in a rising rates environment. Shortages Of Goods – O/W Semis: Overweight industries which are upstream in the supply chain, such as semiconductor manufacturers. They enjoy strong pent-up demand and significant pricing power. Transportation Bottlenecks – O/W Airfreight, Road And Rail: While skyrocketing transportation costs are a boost for most, they are a boon for ocean shipping lines, and US transport companies, such as truck lines and railways. Pent-Up Demand For Services – O/W Travel Complex: The ISM PMI Non-Manufacturing composite reading indicates that demand for services still exceeds demand for goods. Stay overweight Hotels, Restaurants, Entertainment and Professional Business Services. Underweight Airlines for now. US Consumers Are Feeling Poorer – This Will Weight On Profits: Real wages are not keeping up with prices, erasing American consumer purchasing power, thus putting a lid on corporate pricing power. This will hurt profits in the Consumer Discretionary sector, in addition to causing broad-based margin compression. Fundamentals Are Strong For Now: Companies delivered blockbuster Q3 2021 earnings results and peak margins. However, an unusually high percentage of companies (52.6%) were guiding lower. Rising labor costs, reduced productivity, and loss of corporate pricing power will lead to margin compression as early as 2022. Strong Equity Inflows Into Year-End: Late-in-year catchup pension contributions translate into strong inflows into US equities after the early fall hiatus. Buying on dips still offers downward protection from a major market pullback. Buybacks vs Dividends: Share buybacks are on the rise, seemingly displacing dividends as a means of returning cash to shareholders. For cash yield, focus on sectors known for using buybacks to disburse cash to shareholders: Technology and Financials.
Image
Reiterating Investment Positioning Overarching Macroeconomic Themes Rate Hikes Are Coming Taper Tantrum 2.0 rotation is running its course: Sectors and styles most adversely affected by rising rates, such as Consumer Staples, Communications, Services and Health Care have underperformed in October (Chart 1), while cyclicals, geared to rising rates, have outperformed. Growth/Technology has benefited from recent rate stabilization.
Chart 1
Chart 2Market Is Pricing In Three Rate Hikes in 2022
Market Is Pricing In Three Rate Hikes in 2022
Market Is Pricing In Three Rate Hikes in 2022
Market now expects three rate hikes by the end of 2022: Rampant inflation is changing investor expectations on the timing and the speed of rate hikes. A month ago, the probability of two rate hikes in 2022 stood at around 55%. Now, the probability of three rate hikes is roughly 64% (Chart 2). The BCA house view is that the Fed will raise rates once in December 2022 – an outlook much more temperate than the market’s. Investment Implication: Banks, Small Caps and Cyclicals outperform in a rising rates environment (Table 1). Table 1Recent Performance Of Sectors In A Rising Rates Regime
US Equity Chart Pack
US Equity Chart Pack
Shortages Of Goods Shortages are ubiquitous. How do we make money from this theme? We choose industries that are positioned upstream in the supply chain; for example, we prefer Semis to Durable Goods (Chart 3). Manufacturers of chips face strong demand and significant pricing power, while durable goods manufacturers face shortages and have to pass higher input costs on to their customers, which constrains demand and sales growth. Of course, there is also another aspect contributing to the underperformance of durables: Purchases of goods have exceeded the pre-pandemic trend and turned. Over the past three months, semis outperformed the S&P 500 by nearly 5%, while durables underperformed by 12%. Investment Implication: Stay overweight Semiconductors and Semiconductor Equipment, underweight Durable Goods (Table 2). Chart 3Demand for Chips Is Booming
Demand for Chips Is Booming
Demand for Chips Is Booming
Table 2Sectors Affected By Shortage: Recent Performance
US Equity Chart Pack
US Equity Chart Pack
Pent-Up Demand for Services The ISM Non-Manufacturing PMI for October has come in at a record 66.7 (62 expected) (Chart 4A), and new orders are soaring at 70. These readings exceed the ISM Manufacturing PMI (60.8), suggesting that demand for services still exceeds demand for goods. Furthermore, spending on services is still below pre-pandemic levels, and the rebound is running its course (Chart 4B). We conclude that our “pent-up demand for services” investment theme still has legs. Chart 4AISM Services Is Soaring
ISM Services Is Soaring
ISM Services Is Soaring
Chart 4BStill Strong Pent-up Demand For Services
Still Strong Pent-up Demand For Services
Still Strong Pent-up Demand For Services
Investment Implication: Stay overweight Hotels, Restaurants, Entertainment and Professional Business Services (Table 3). Stay away from Airlines for now. Table 3Travel Complex: Recent Performance
US Equity Chart Pack
US Equity Chart Pack
Transportation Bottlenecks Shipping costs continue their ascent (Chart 5). Over 100 ships are currently anchored in LA/Long Beach ports compared to almost immediate unloading before the pandemic. While rising transportation costs are denting the profit margins of a wide range of companies, from retailers to manufacturers, they are a boon for ocean shipping lines, and US transport companies, such as truck lines and railways. Case in point: A.P. Moller-Maersk, the world’s largest boxship operator, delivered $5.44B in quarterly profits last week – doubling its entire 2020 income, on the heels of the unprofitable years of 2018 and 2019.1 Profits of other freight operators are also surging. Investors take notice: After a stretch of underperformance, the S&P 500 Transportation Index outperformed the S&P 500 by 6.55% in October. Chart 5Shipping Costs Still Exorbitant
Shipping Costs Still Exorbitant
Shipping Costs Still Exorbitant
Investment Implication: Continue overweight of Transportation Services, specifically Air Freight and Logistics, and Road and Rail (Table 4). Table 4Transportation: Recent Performance
US Equity Chart Pack
US Equity Chart Pack
US Consumers Are Feeling Poorer Consumers are right to worry about inflation: Nominal wages increased by 4.5% Year-on-Year in October, the highest reading over the past 40 years. However, real wage growth is negative, i.e. it is not keeping up with prices, erasing American consumers’ buying power (Chart 6). According to a Gallup survey, upticks in citations of the deficit and inflation are largely responsible for an increase in mentions of any economic issue – from 16% in September to 24% in October.2 According to the Conference Board survey, consumers expect prices to rise by 7% over the next 12 months. Loss of purchasing power is bound to dampen consumer demand, as we have seen with demand for Consumer Durables and Autos which has collapsed due to shortages and sky-high prices. Corporate pricing power is waning: As a result of pressures on consumer purchasing power, US producers are reporting that they find it harder to raise prices. Looking ahead, companies will have to absorb price increases (Chart 7). Chart 6Wage Increases Are Not Keeping Up With Inflation
Wage Increases Are Not Keeping Up With Inflation
Wage Increases Are Not Keeping Up With Inflation
Chart 7Corporate Pricing Power Is Waning
Corporate Pricing Power Is Waning
Corporate Pricing Power Is Waning
Investment Implication: Erosion of consumer pricing power will eventually harm the Consumer Discretionary sector and will lead to a broad-based margin compression. Fundamentals Peak margins are here: The confluence of rising wages, falling productivity, and reduced ability to raise prices translates into an impending margin squeeze. We forecast that the year-over-year margin change will be negative in 2022 (Chart 8). The Q3 2021 earnings season delivered blockbuster results so far with roughly two-thirds of the companies reporting, and results are striking. 83% of companies have beaten the street expectations with the average earnings surprise standing at 11% (Chart 9).
Chart 8
Chart 9
Sales beats are only marginally worse: 77% of the companies have exceeded expectations with an average sales surprise of 3%. Quarter-on-quarter earnings growth is 0.25%, exceeding an expected 6% contraction. Compared to Q3 2019, EPS CAGR is 12%. These results indicate that street expectations were a low bar to clear. Forward guidance is concerning: Most companies commented that supply chain bottlenecks and soaring shipping costs are the major headwinds. Most companies have navigated a challenging economic environment swimmingly so far. However, looking ahead, waning pricing power, falling productivity, and rising costs will weigh on profitability. These factors are the ubiquitous reasons for negative guidance: 52.6% of companies are guiding lower for Q4 2021 (compare that to 32.7% in the previous quarter). Investment Implication: It is likely that the Q4 2021 earnings season disappoints. Sentiment Strong inflows into US equities after early fall hiatus. This can be explained by FOMO (fear of missing out), and lots of cash sitting on the sidelines, which many retail investors aim to park in US equities (Chart 10). Furthermore, historically, November and December have been characterized by robust equity inflows: Retail investors wait until the end of the year to reach clarity on their financial situation and to allocate funds to 401Ks, IRAs, and 529s. Investment Implication: Buying on dips still offers downward protection from a major market pullback. Chart 10Strong Inflows Into US Equities: Buying On Dip Is Still En Vogue
Strong Inflows Into US Equities: Buying On Dip Is Still En Vogue
Strong Inflows Into US Equities: Buying On Dip Is Still En Vogue
Uses Of Cash Buybacks Replace Dividends: Share buybacks are on the rise again (Chart 11, Panel 1), seemingly displacing dividends as a means of returning cash to shareholders: The dividend payout ratio is flagging (Chart 11, Panel 2). From a corporate standpoint, dividends require a long-term commitment, while buybacks can be a “one-off,” lending more flexibility to corporate treasurers. Corporations also prefer buybacks as they reduce their share count and inflate earnings per share. Investment Implication: For cash yield, focus on sectors known for using buybacks to disburse cash to shareholders: Technology and Financials. Chart 11Buybacks Are Replacing Dividends
Buybacks Are Replacing Dividends
Buybacks Are Replacing Dividends
Irene Tunkel Chief Strategist, US Equity Strategy irene.tunkel@bcaresearch.com S&P 500 Chart 12Macroeconomic Backdrop
Macroeconomic Backdrop
Macroeconomic Backdrop
Chart 13Profitability
Profitability
Profitability
Chart 14Valuations And Technicals
Valuations And Technicals
Valuations And Technicals
Chart 15Uses Of Cash
Uses Of Cash
Uses Of Cash
Cyclicals Vs Defensives Chart 16Macroeconomic Backdrop
Macroeconomic Backdrop
Macroeconomic Backdrop
Chart 17Profitability
Profitability
Profitability
Chart 18Valuation And Technicals
Valuation And Technicals
Valuation And Technicals
Chart 19Uses Of Cash
Uses Of Cash
Uses Of Cash
Growth Vs Value Chart 20Macroeconomic Backdrop
Macroeconomic Backdrop
Macroeconomic Backdrop
Chart 21Profitability
Profitability
Profitability
Chart 22Valuations And Technicals
Valuations And Technicals
Valuations And Technicals
Small Vs Large Chart 23Macroeconomic Backdrop
Macroeconomic Backdrop
Macroeconomic Backdrop
Chart 24Profitability
Profitability
Profitability
Chart 25Valuations and Technicals
Valuations and Technicals
Valuations and Technicals
Chart 26Uses Of Cash
Uses Of Cash
Uses Of Cash
Footnotes 1 WSJ, Supply-Chain Pain Is Maersk’s Gain as $5.44 Billion Profit Dwarfs Amazon, UPS, November 2, 2021. 2 Job Market Ratings Set Record, but Economic Confidence Slides (gallup.com), October 27, 2021. Recommended Allocation
Highlights We introduce our rotation graphs to assess the evolution of the relative trend and momentum of various assets. US equities remain on firm footing, but their weakening relative momentum suggests that investors may soon begin to rotate away from this market in favor of the Eurozone and EM. Cyclicals continue to dominate defensives, globally and in Europe. European value stocks are experiencing improving momentum, which suggests that a rotation out of growth equities is afoot. While European small-cap equities sport attractive fundamentals, rotational dynamics indicate it is still too early to overweight them aggressively. The energy crisis is a dominant driver of the relative sector performance in Europe and resulted in a massive shift in leadership from industrials to energy. As long as oil and natural gas act as a drag, industrials will lag. Financials are well supported. Swedish stocks have borne the brunt of the energy price spike, while Norwegian equities have been its main beneficiaries. The improvement in momentum of German stocks suggests that their relative underperformance will soon end. Spanish shares look attractive from a tactical perspective. Swiss industrials will need a recovery in EUR/CHF to outperform other European industrials. UK industrials will continue to outperform their continental competitors, while Spanish industrials have a window through which to shine. A rotation into UK financials may soon begin as their momentum improves. The darkest days for German financials are ending, while Spanish, Italian, and Swedish financials may soon witness a wave of underperformance. Spanish consumer discretionary equities are becoming more attractive compared to their European counterparts. While Dutch names continue to outperform other European tech equities, their softening momentum suggests investors are beginning to rotate out of this country. Spanish and German tech names offer an attractive diversification opportunity within the industry. Feature Methodology The combination of excess liquidity, large pools of fast money, elevated valuations across most securities, and the existence of the near-term momentum reversal effect encourage investors to rotate from one asset to the next in the hope of rapid profits. Measures to assess where each market stands in this rotational pattern can be useful for investors to catch these swings. In this optic, we introduce our rotation screener focused on equities. It is a simple tool that looks at whether a sector or a country is strengthening relative to its benchmark and whether this strength is happening at a faster or slower momentum. To measure each dimension, we use proprietary indicators of relative strength and momentum. Once each asset’s relative strength and relative momentum are established, we can position them in quadrants. We follow traditional terminology. The upper right quadrant denotes “Leading” assets, or securities that are outperforming their benchmark with strengthening momentum. The bottom right quadrant denotes “Weakening” assets, or securities that are outperforming their benchmark but with a deteriorating momentum. The bottom left quadrant denotes “Lagging” assets, or securities that are underperforming with decreasing momentum. Finally, the top left quadrant indicates “Improving” assets, or securities that are underperforming but with increasing momentum. Investors should move to overweight assets that are in the Improving quadrants and to underweight assets that are inching toward the “Lagging” from the “Weakening” quadrants. This method is very flexible and can be applied to sectors, countries, styles, and so on, as long as a benchmark is available to generate comparisons. In this report, we will analyze the following from a rotational perspective: global national markets, global cyclicals vs global defensive’s, European cyclicals vs European defensives, European sectors, European national markets, European financials, European consumer discretionaries, and European tech stocks. Global National Markets
Chart 1
US equities have moved from the Leading quadrant to the Weakening one as they continue to outperform the global benchmark but with a decelerating momentum (Chart 1). This locates the US market in a risky position that could herald a period of underperformance, especially if global economic surprises accelerate. From a rotational perspective, US stocks could still experience another wave of outperformance over the coming weeks, as momentum has been firming over the past four weeks. The Euro Area benchmark has fully moved from the Weakening quadrant in August to the Lagging one today. Investors should monitor Europe’s relative momentum closely, because a pick-up from here would push the Eurozone into Improving territory, a warning of an imminent trend change in European relative stock prices. Emerging markets have exited the Lagging zone and moved into the Improving quadrant. The move is far from decisive and remains at risk with Chinese credit growth still decelerating. The recent decline in steel prices in China suggests that construction activity in that economy continues to slow. Thus, as long as Chinese credit flows deteriorate, EM stocks will have trouble moving into the Leading quadrant. Cyclicals Vs Defensives Global defensive equities tried to move into the Leading quadrant at the end of the summer, but, ultimately, they plunged back into Lagging territory as global stocks recovered in October (Chart 2). Meanwhile, global cyclicals moved in the opposite trajectory, shifting from the Lagging quadrant to the Leading one over the past three months. Cyclicals continue to benefit from the general uptrend in the market. Even the recent decline in yields is doing little to boost the performance of defensive equities. The biggest risk to these stocks remains the Chinese economic slowdown. For now, this deterioration has not been large enough to compensate for the general vigour in profits and consumption in advanced economies. However, if inflation worries do not abate, then the Chinese slowdown will become more problematic for global cyclicals as it will raise the spectre of stagflation.
Chart 2
Chart 3
The rotational pattern for European cyclicals vs defensive stocks mimics that of global equities (Chart 3). However, European cyclicals are somewhat softer than their global equivalents, hurt by Europe’s greater exposure to the Chinese business cycle compared to the US’s exposure. European Investment Styles
Chart 4
Over the past three months, European investment styles have begun a major shift. Value has moved from the Lagging quadrant to the Improving one, which suggests that flows could push value into the Leading quadrant (Chart 4). Moreover, growth has moved from the Leading quadrant to the weakening one, which created a similar dynamic as the decline in performance of the quality factor. This confirms that the rise in yields is beginning to favour a shift in style from growth to value. Meanwhile, small-cap stocks have tumbled into the Lagging quarter. We do expect attractive returns for European small-cap names over an 18- to 24-month investment horizon. However, we have not moved yet to overweight this sector of the market and rotational patterns confirm it is too early to do so safely. European Sectors
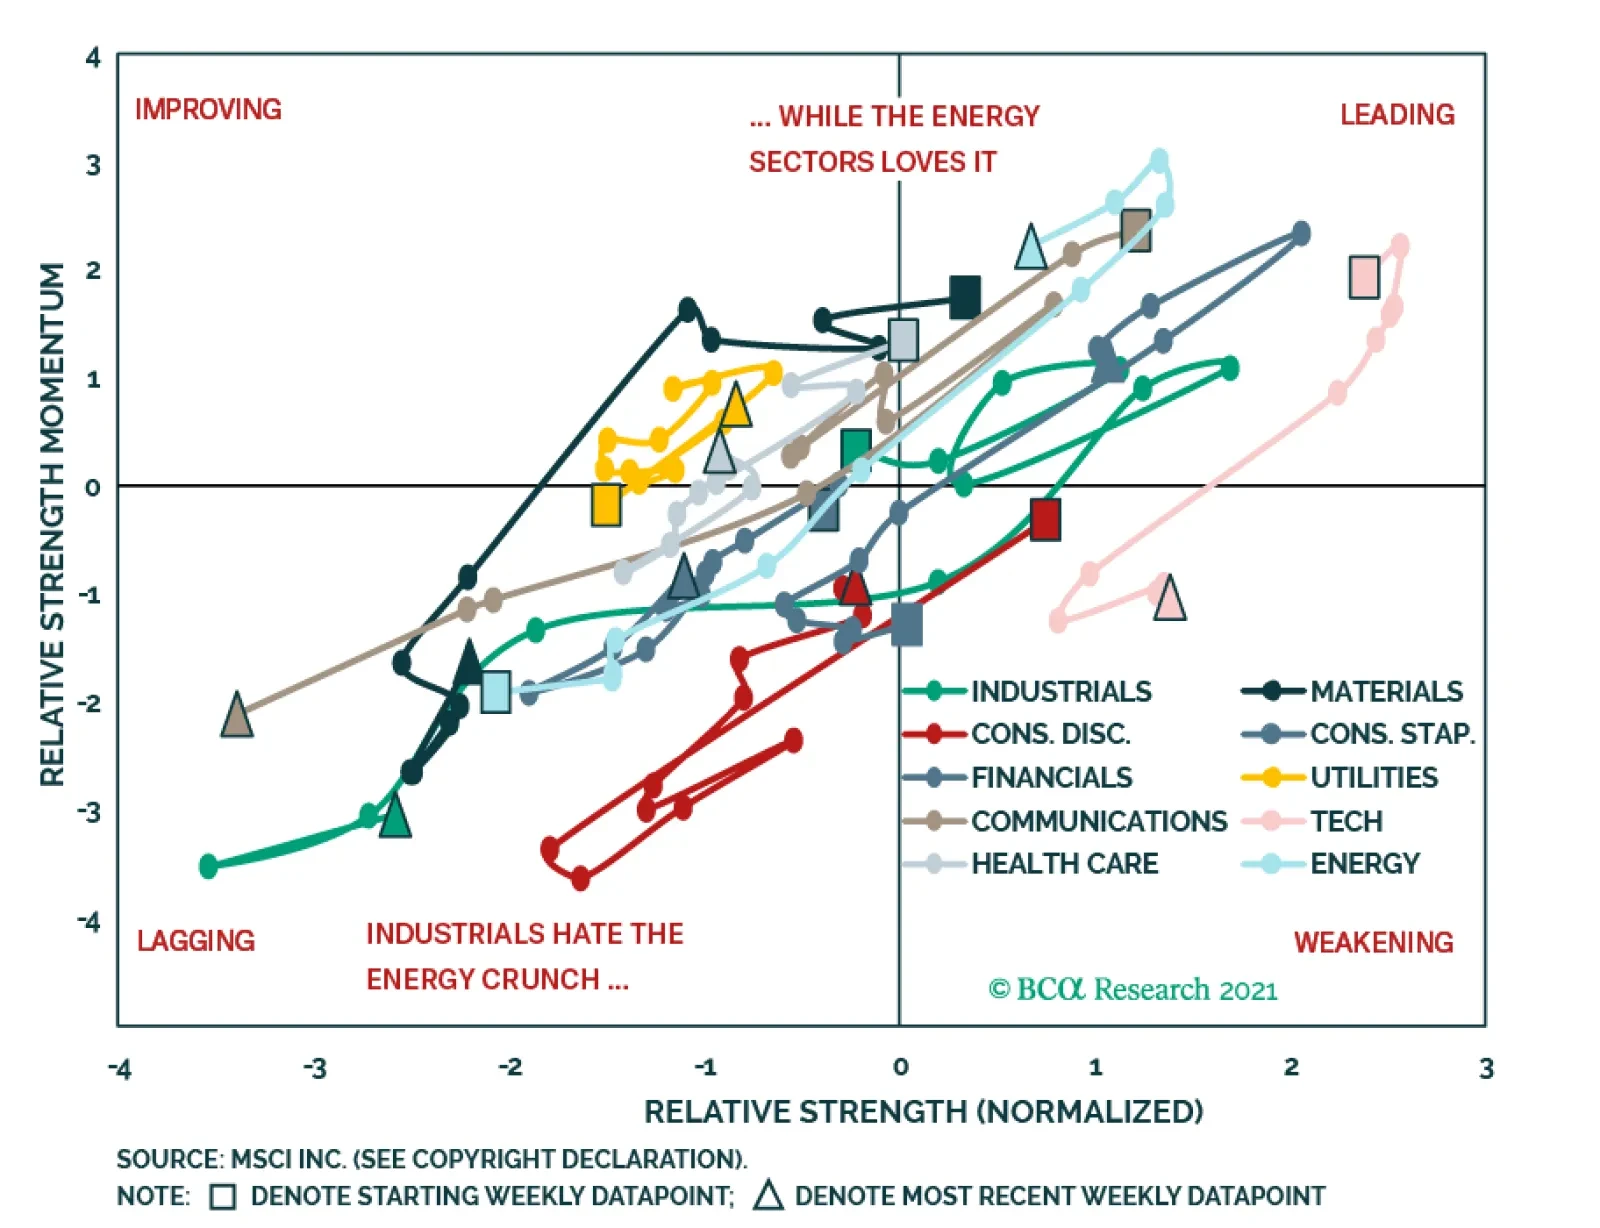
Chart 5
Sectors have begun to make some important shifts in European markets (Chart 5). Tech has moved from the Leading quadrant to the weakening one. While the sector continues to outperform, it is doing so with a declining momentum, and it could soon move to the Lagging quadrant. This deteriorating price action must be monitored closely. Consumer discretionary names, which were strong performers that have become increasingly weak, have moved from the Weakening quadrant to the lagging one. However, their momentum is not deteriorating as much as it did nine weeks ago, which suggests a move to the Improving quadrant could soon be in the offing. Financials have greatly enjoyed the uptick in global yields. After a short passage through the Lagging quadrant, they have shifted into the Leading one. This suggests that the winds remain behind this sector, which we continue to overweight. Industrials and energy have become mirror images of one another, highlighting the negative impact on European economic activity and profitability of the recent surge in energy prices. The industrials have moved from the Leading quadrant to the lagging one, as the energy sector experienced the opposite direction of travel. This suggests that industrials will only recover their shine once the energy crisis abates, which will also hurt energy stocks. European National Markets
Chart 6
The rotational pattern exhibited by European national markets bears their respective sectoral footprints (Chart 6). The tech-heavy Dutch market has moved from the Leading quadrant to the Weakening one, the industrials-focused Swedish market has fallen into the Lagging quadrant from the Weakening one and the Norwegian market has leapt out of Lagging into Leading territory. Hence, if the rotation out of tech deepens, The Netherlands will tumble directly into the Lagging zone, while an easing in energy prices will force Norway and Sweden to switch places on the back of a rotation out of energy into industrials. Germany is of particular interest. It is a well-diversified market that has become oversold. Moreover, as we wrote in September, its relative performance exhibits a significant discount to relative earnings. From a rotational perspective, Germany is moving to leave the Lagging quadrant; a durable shift into the Improving quadrant will sufficiently assuage traders into buying this market. This process will support our overweight position in German equities. Spain is another market we like on a tactical basis. Over the course of the past three months, it moved out of Lagging territory into the Improving zone. This price action supports our thesis that the large country-discount embedded across Spanish equity sectors is excessive and should soon dissipate. The main risk to this view would be another down leg in bond yields, which would hurt financials—a major weight in this market. Italy, too, is in the process of executing a full rotation, having exited the Weakening quadrant and moved into the Lagging one. Italian stocks have tried to punch their way into the Improving zone but have failed to do so. They will require higher yields to move out into the Improving zone durably because of the heavy financials weighting of Italian stocks. European Industrials
Chart 7
Within European industrials, a rotational pattern is also evident (Chart 7). Swiss industrials have moved out of the Leading quadrant into the Lagging one as the Swiss franc continues to appreciate against the euro. The rising CHF imparts deflationary pressures into Switzerland and the SNB continues to build up its reserves. As a result, EUR/CHF will appreciate once EUR/USD finds a firmer footing. Thus, while it is too early to overweight Swiss industrials relative to those of the Eurozone, their oversold nature suggests that a rotation in favour of Swiss manufacturing businesses will soon take place. At the current juncture, Spanish industrials look appealing. They have moved out of the Lagging quadrant into the Improving one as the momentum of their relative performance improves. Additionally, they are close to moving into the leading territory. This picture is consistent with a narrowing of the discount embedded in all Spanish sectors since the pandemic broke out. Swedish industrials are also trying to exit the Lagging territory; their elevated RoE, and heavy sensitivity to the DM capex cycle indicate that they should move into the Leading quadrant in the coming weeks. UK industrials have remained in the Leading zone for the past three months, but their relative momentum is softening, which risks them being placed in the Weakening zone. The recent deterioration in GBP/EUR could provide a breath of fresh air, as it will improve the competitiveness of UK industrials compared to continental firms. Even then, for now, rotational dynamics do not flag an imminent problem for UK industrials. European Financials
Chart 8
The clearest rotational pattern within European financials may be found in Sweden and the UK (Chart 8). Over the past three months, Swedish financials have fallen out of the Leading quadrant into the Weakening one, and they are inching closer toward the Lagging zone. This suggests that they could soon begin to underperform. Meanwhile, UK financials offer a mirror image as they exited the Lagging quadrant and moved into the improving one. They have yet to enter Leading territory, but seem close to doing so. The pessimism toward the UK is overdone right now. BCA’s Global Fixed-Income Strategy team expects the UK yield curve to steepen anew. UK financials would be prime beneficiaries of this dynamic. Italian and Spanish financials are also exhibiting some concerning moves lately. Both were in the Leading quadrant, but they have since shifted to the lagging one as peripheral spreads widened. Meanwhile, money seems to be moving into German financials, which have advanced from the Lagging quadrant to the Improving quadrant. While they are not as close to the Leading quadrant as their UK competitors, this shift warrants monitoring. European Consumer Discretionary
Chart 9
Within the consumer discretionary space, most European countries have remained in their quadrant (Chart 9). Nonetheless, Spanish CD stocks have moved out of the Lagging zone into the Leading quadrant, while their Italian counterparts have recently entered the Weakening quadrant where they have joined French CDs. While both these countries’ consumer discretionary firms are witnessing weakening momentum, they remain in an upward trend against their European competitors. It is therefore too early to sell these countries within this industry. German Consumer discretionary equities are still in the Lagging quadrant, but they are trying to move into the Improving one, where UK CD names have remained for the past three months. European Tech
Chart 10
The European tech sector is very much a story about The Netherlands versus the rest, due to the large size of the Dutch tech sector (Chart 10). For now, rotational patterns remain in favour of Dutch names; they have exited the Leading quadrant, but, while their momentum is weakening somewhat, they remain in a pronounced relative uptrend. A few small markets offer some promise. Over the past three months, both Spanish and German tech names have shifted from the Lagging quadrant into the Improving one. Their elevated momentum measures suggest that a shift into the Leading quadrant is imminent. As such, investors should consider switching some of their tech holdings into these two countries to diversify away from the Dutch behemoth. Mathieu Savary, Chief European Strategist Mathieu@bcaresearch.com
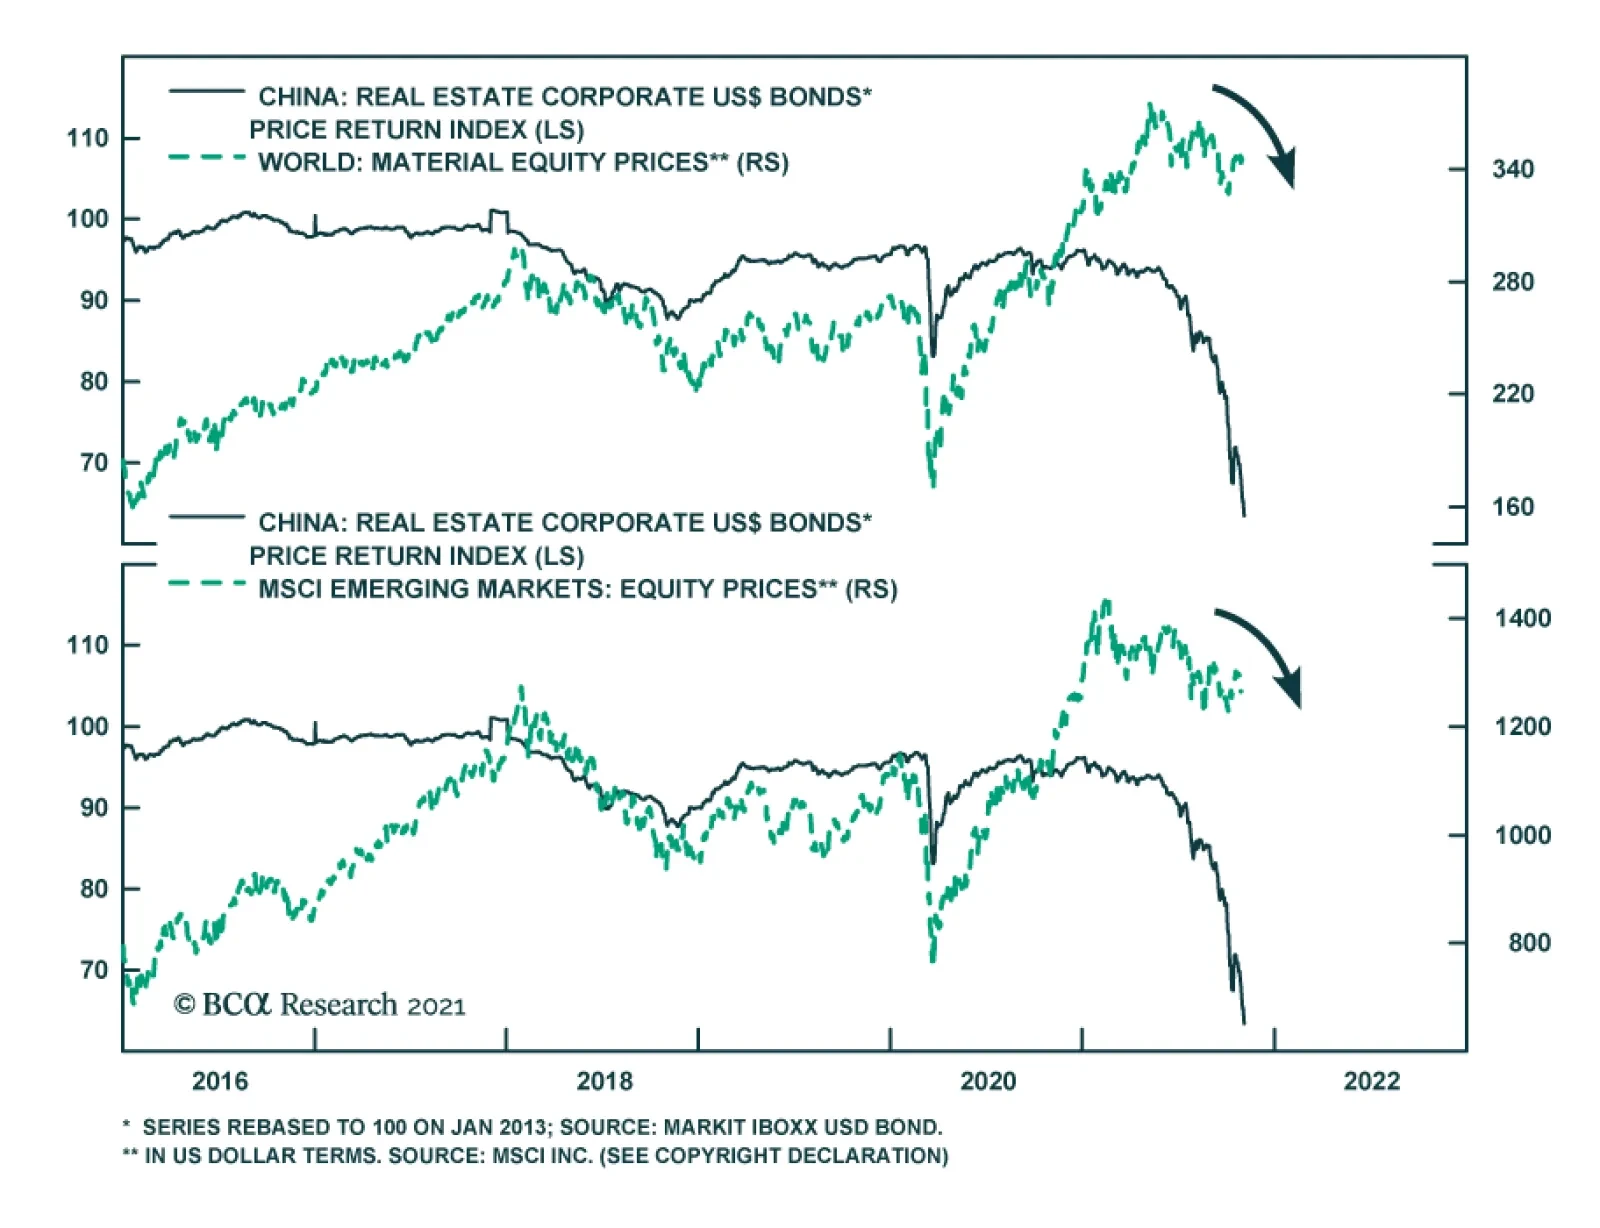
The meltdown in China’s property bond market shows no signs of abating. The most recent cause for concern is Kaisa Group whose shares were suspended on Friday after it missed an interest payment. Kaisa is just the latest in a growing list of property…
BCA Research’s Geopolitical Strategy service concludes that there is a tactical opportunity in Japanese equities. Japan’s ruling Liberal Democratic Party retained its single-party majority in the Diet in the October 31 election, putting Prime Minister…
Highlights Japan’s long-term weaknesses – a shrinking population, low productivity growth, excess indebtedness – are very well known. However, it still punches above its weight in the realm of geopolitics. Abenomics – sorry, Kishidanomics – can still deliver some positive surprises every now and then. As the global pandemic wanes, and China faces a historic confluence of internal and external risks, investors should begin buying the yen on weakness. Japanese industrials also are an attractive play in a global portfolio. While the yen will likely fare better than the dollar over the next 6-9 months, it will lag other procyclical currencies. Feature Japan has always been an “earthquake society,” in which things seem never to change until suddenly everything changes at once. The good news for investors is that that change occurred in 2011 and the latest political events reinforce policy continuity. Why “Abenomics” Remains The Playbook Over ten years have passed since Japan suffered a triple crisis of earthquake, tsunami, and nuclear meltdown. In fact, the Fukushima nuclear crisis merely punctuated a long accumulation of national malaise: the country had suffered two “Lost Decades” and was in the thrall of the Great Recession, a rare period of domestic political change, and a rise in national security fears over a newly assertive China. The nuclear meltdown marked the nadir. The result of all these crises was a miniature policy revolution in 2012 – Prime Minister Shinzo Abe and the Liberal Democratic Party (LDP) returned to power and initiated a range of bolder policies to whip the country’s deflationary mindset and reboot its foreign and trade relations. The new economic program, “Abenomics,” consisted of easy money, soft budgets, and pro-growth reforms. It succeeded in changing Japan. Both private debt and inflation, which had fallen during the lost decades, bottomed after the 2011 crisis and began to rise under Abe (Chart 1). By the 2019 House of Councillors election, however, Abe was running out of steam. Consumption tax hikes, the US-China trade war, and COVID-19 thwarted his plans of national revival. In particular, Abe hoped to capitalize on excitement over the 2020 Tokyo Olympics to hold a popular referendum on revising the constitution. Constitutional revision is necessary to legitimize the Self-Defense Forces and thus make Japan a “normal” nation again, i.e. one that can maintain armed forces. But the global pandemic interrupted. Until the next heavyweight prime minister comes along, Japan will relapse into its old pattern of a “revolving door” of prime ministers who come and go quickly. For example, the only purpose of Abe’s immediate successor, Yoshihide Suga, was to tie off loose ends and oversee the Olympics before passing the baton (Chart 2). Chart 1Abenomics Was Making Progress
Abenomics Was Making Progress
Abenomics Was Making Progress
Chart 2
The next few Japanese prime ministers will almost inevitably lack Abe’s twin supermajority in parliament, which was exceptional in modern history (Chart 3). It will be hard for the LDP to expand its regional grip given that it holds a majority in all 11 of the regional blocks in which the political parties contend for seats based on their proportion of the popular vote (Table 1).
Chart 3
Table 1LDP+ Komeito Regional Performance
Japan: Foreign Threats, Domestic Reflation
Japan: Foreign Threats, Domestic Reflation
Short-lived, traditional prime ministers will not be able to create a superior vision for Japan and will largely follow in Abe’s footsteps. In September Prime Minister Fumio Kishida replaced Suga – a badly needed facelift for the ruling Liberal Democrats ahead of the October 31 election. The LDP retained its single-party majority in the Diet, so Kishida is off to a tolerable start (Chart 4). But he is far from charismatic and will not last long if he fumbles in the upper house elections in July 2022. This gives him a little more than half a year to make a mark.
Chart 4
Kishida will oversee a roughly 30-40 trillion yen stimulus package, or supplemental budget, by the end of this year. Japanese stimulus packages are almost always over-promised and under-delivered. However, given the electoral calendar, he will put together a large package that will not disappoint financial markets. His other goal will be to build on recent American efforts to cobble together a coalition of democracies to counter China and Russia. Japan’s Grand Strategy In Brief Chart 5Japan Exposed To China Trade
Japan Exposed To China Trade
Japan Exposed To China Trade
Japan’s grand strategy over centuries consists of maintaining its independence from foreign powers, controlling its strategic geographic approaches to prevent invasion, and stopping any single power from dominating the eastern side of the Eurasian landmass. Originally the hardest part of this grand strategy was that it required establishing unitary political control over the far-flung Japanese archipelago. However, since the Meiji Restoration, Tokyo has maintained centralized government. Since then Japan has focused on controlling its strategic approaches and maintaining a balance among the Asian powers. During the imperialist period it tried to achieve these objectives on its own. After World War II, the United States became critical to Japan’s grand strategy. Through its broad alliance with Washington, Tokyo can maintain independence, make sure critical territories are not hostile (e.g. Taiwan and South Korea), and deter neighboring threats (North Korea, China, Russia). It can at least try to maintain a balance of power in Eurasia. Yet these constant national interests underscore Japan’s growing vulnerabilities today: China’s economy is now two-times larger than Japan’s and Japan is more dependent on China’s trade than vice versa (Chart 5). Under Xi Jinping, Beijing is actively converting its wealth into military and strategic capabilities that threaten Japan’s security. Rising tensions across the Taiwan Strait are fueling nationalism and re-armament in Japan. Russia’s post-Soviet resurgence entails an ever-closer Russo-Chinese partnership. It also entails Russian conflicts with the US that periodically upset any attempts at Russo-Japanese détente. North Korea’s asymmetric war capabilities and nuclearization pose another security threat. South Korea’s attempts to engage with the North and China, and compete with Japan, are unhelpful. All of these realities drive Japan closer to the United States. Even the US is increasingly unpredictable, though not yet to the point of causing serious doubts about the alliance. If the US were fundamentally weakened, or abandoned the alliance, Japan would either have to adopt nuclear weapons or accommodate itself to Chinese hegemony to meet its grand strategy. Nuclearization would be the more likely avenue. The stability of Asia depends greatly on American arbitration. Japan’s Strategy Since 1990 Beneath this grand strategy Japan’s ruling elites must pursue a more particular strategy suited to its immediate time and place. Ever since Japan’s working population and property bubble peaked in the early 1990s, the country’s relative economic heft has declined. To maintain stability and security, the central government in Tokyo has had to take on a very active role in the economy and society. The first step was to stabilize the domestic economy despite collapsing potential growth. This has been achieved through a public debt supercycle (Chart 6). Unorthodox monetary and fiscal policy largely stabilized demand, at the cost of the world’s highest net debt-to-GDP ratio. The economic adjustment was spread out over a long period of time so as to prevent a massive social and political backlash. Unemployment peaked in 2009 at 5.5% and never rose above this level. The ruling elite and the Liberal Democrats maintained control of institutions and government. The second step was to ensure continued alliance with the United States. Japan could deal with its economic problems – and the rise of China – if it maintained access to US consumers and protection from the US military. To maintain the alliance required making investments in the American economy, in US-led global institutions, and cooperating with the US on various initiatives, including controversial foreign policies. As in the 1950s-60s, Japan would bulk up its Self-Defense Forces to share the burden of global security with the United States, despite the US-written constitution’s prohibition on keeping armed forces. The third step was to invest abroad and put Japan’s excess savings to work, developing materials and export markets abroad while employing foreign workers and factories to become Japan’s new industrial base in lieu of the shrinking Japanese workforce (Chart 7). Chart 6Japan's Public Debt Supercycle
Japan's Public Debt Supercycle
Japan's Public Debt Supercycle
Chart 7
Japan’s post-1990 strategy has staying power because of the massive pressures on Japan listed above: China’s rise, Russo-Chinese partnership, North Korean threats, and American distractions. Investors tend to underrate the impact of these trends on Japan. Unless they fundamentally change, Japan’s strategy will remain intact regardless of prime minister or even ruling party. Russia’s role is less clear and could serve as a harbinger of any future change. President Vladimir Putin and Abe had the best chance in modern memory to resolve the two countries’ territorial disputes, build on mutual interests, and maybe even sign a peace treaty. But Russia’s clash with the West proved an insurmountable obstacle. New opportunities could emerge at some later juncture, as Japan’s interest in preventing China from dominating Eurasia gives it a strong reason to normalize ties with Russia. Russia will at some point worry about overdependency on China. But this change is not on the immediate horizon. Japan’s Tactics Since 2011
Chart 8
Japan is nearly a one-party state. Brief spells of opposition rule, in 1993 and 2009-11, are exceptions that prove the rule. The Liberal Democrats did not fall from power so much as suffer a short “time out” to reflect on their mistakes before voters put them right back into power. However, these timeouts have been important in forcing the ruling party to adjust its tactics for changing times, as with Abenomics. Kishida will not have enough political capital to change direction. The emphasis will still be on defeating deflation and rekindling animal spirits and corporate borrowing (as opposed to relying exclusively on public debt). Kishida has talked about a new type of capitalism and a more active redistribution of wealth, in keeping with the current zeitgeist among the global elite. However, Japan lacks the impetus for dramatic change. Wealth inequality is not extreme and political polarization is non-existent (Chart 8). The LDP is wary of losing votes to the populist Japan Innovation Party, or other regional movements, but populism does not have as fertile ground in countries with low inequality. The desire to boost wages was a central plank of Abenomics (Chart 9) and an area of success. It will come through in Kishida’s policies as well. But the ultimate outcome will depend on how tight the labor market gets in the upcoming economic cycle. Similarly Kishida can be expected to encourage, or at least not roll back, women’s participation in the labor force, as labor markets tighten (Chart 10). As the pandemic wanes it is also likely that he will reignite Abe’s loose immigration policy, which saw the number of foreign workers triple between 2010 and 2020. This inflow is perhaps the surest sign of any that insular and xenophobic Japan is changing with the times to meet its economic needs. Chart 9Kishidanomics To Build On Abe's Wage Growth
Kishidanomics To Build On Abe's Wage Growth
Kishidanomics To Build On Abe's Wage Growth
Chart 10Women Off To Work But Fertility ##br##Relapsed
Women Off To Work But Fertility Relapsed
Women Off To Work But Fertility Relapsed
The only substantial difference between Kishidanomics and Abenomics is that Abe compromised his reflationary fiscal efforts by insisting on going forward with periodic hikes to the consumption tax. Kishida is under no such expectation. Instead he is operating in a global political and geopolitical context in which ambitious public investments are positively encouraged even at the expense of larger budget deficits (Chart 11). Yet interest rates are still low enough to make such investments cheaply. The stage is set for fiscal largesse. Chart 11Fiscal Largesse To Continue
Fiscal Largesse To Continue
Fiscal Largesse To Continue
Kishida can be expected to promote large new investments in supply-chain resilience, renewable energy, and military rearmament. The US and EU may exempt climate policies from traditional budget accounting – Japan may do the same. Even more so than China and Europe, Japan has a national interest in renewable energy since it is almost entirely dependent on foreign imports for its fossil fuels. The green transition in Japan is lagging that of Germany but the Japanese shift away from nuclear power has gone even faster, creating an import dependency that needs to be addressed for strategic reasons (Chart 12). Monetary-fiscal coordination began under Abe and can increase under Kishida. What is clear is that public investment is the top priority while fiscal consolidation is not. Military spending is finally starting to edge up as a share of GDP, as noted above. For many years Japanese leaders talked about military spending but it remained steady at 1% of GDP. Now, at the onset of the US-China cold war, the Japanese are spending more and say the ratio will rise to 2% of GDP (Chart 13). Tensions with China, especially over Taiwan, will continue to drive this shift, though North Korea’s weapons progress is not negligible.
Chart 12
Chart 13
The Biden administration is prioritizing US allies and the competition with China, which makes the Japanese alliance top of mind. Tokyo’s various attempts to talk with Beijing in recent years have amounted to nothing, with the exception of the Regional Comprehensive Economic Partnership, which is far from ratification and implementation. Japan’s relations with China are driven by interests, not passing attitudes and emotions. If Biden proves too dovish toward China – a big “if” – then it will be Japan pushing the US to take a more hawkish line rather than vice versa. Japan will take various strategic, economic, technological, and military actions to defend itself from the range of external threats it faces. These actions will intimidate and provoke China and other neighbors, which will help to entrench the “security dilemma” between the US and China and their allies. For example, Japan will eagerly participate in US efforts to upgrade its military and its regional alliances and partnerships, including via the Quadrilateral Security Dialogue with India and Australia. The Biden administration might force Japan to play nice with South Korea and patch up their trade war. But that is a price Japan can pay since American involvement also precludes any shift by South Korea fully into China’s camp. If China should invade Taiwan – which we cannot rule out over the long run – Japan’s vital supply lines and national security would fall under permanent jeopardy. Japan would have an interest in defending Taiwan but its willingness to war with China may depend on the US response. However, both Japan and the US would have to draw a stark line in defense of Japanese territory, not least Okinawa, where US troops are based. Both powers would mobilize and seek to impose a strategic containment policy around China at that point. Until The Next Earthquake … For Japan to abandon its post-1990 strategy, it would need to see a series of shocks to domestic and international politics. If China’s economy collapsed, Korea unified, or the US abandoned the Asia Pacific region, then Tokyo would have to reassess its strategy. Until then the status quo will prevail. At home Japan would need to see a split within the Liberal Democrats, or a permanent break between the LDP and their junior partner Komeito, combined with a single, consolidated, and electorally viable opposition party and a charismatic opposition leader. This kind of change would follow from major exogenous shocks. Today it is nowhere in sight – the last two shocks, in 2011 and 2020, reinforced the LDP regime. Theoretically some future Japanese government could adopt a socialist platform that relies entirely on public debt rather than trying to reboot private debt. It could openly embrace debt monetization and modern monetary theory rather than trying to raise taxes periodically to maintain the appearance of fiscal rectitude. But if it tried to distance itself from the United States and improve relations with Russia and China, such a strategy would not go very far. It would jeopardize Japan’s grand strategy. For the foreseeable future, Japan’s economic security and national security lie in maintaining the American alliance and continuing an outward investment strategy focused on emerging markets other than China. Macroeconomic Developments The key message from an economic context is that fiscal stimulus is likely to be larger in Japan than the market currently expects. The IMF is penciling in a fiscal deficit of around 2% of potential GDP next year, which will be a drag on growth (Chart 14). More likely, Kishida will cobble together a slightly larger package to implement most of the initiatives he has proposed on the campaign trail. Meanwhile, a large share of JGBs are about to mature over the next couple of years, providing room for more issuance, which the BoJ will be happy to assimilate (Chart 15). Chart 14More Fiscal Stimulus In Japan Likely
More Fiscal Stimulus In Japan Likely
More Fiscal Stimulus In Japan Likely
Chart 15Lots Of JGBs Mature In The Next Few Years
Lots Of JGBs Mature In The Next Few Years
Lots Of JGBs Mature In The Next Few Years
Real numbers on the size of the fiscal package have been scarce, but it should be around 30-40 trillion yen, spread over a few years. With Japan’s net interest expense at record lows (Chart 16), and a lot of the spending slated for worthwhile productivity-enhancing projects such as supply chains, green energy, education and some boost to the financial sector in the form of digital innovation and consolidation, we expect fiscal policy in Japan will remain moderately loose, with the BoJ staying accommodative. The timing of more fiscal stimulus is appropriate as Japan has managed to finally put the pandemic behind it. The number of new Covid-19 cases is at the lowest recorded level per capita, and Japan now has more of its population vaccinated than the US. As a result, the manufacturing and services PMIs, which have been the lowest in the developed world, could stage a coiled-spring rebound. This will be a welcome fillip for Japanese assets (Chart 17). Chart 16Little Cost To Issuing More Debt
Little Cost To Issuing More Debt
Little Cost To Issuing More Debt
Chart 17The Japanese Recovery Has Lagged
The Japanese Recovery Has Lagged
The Japanese Recovery Has Lagged
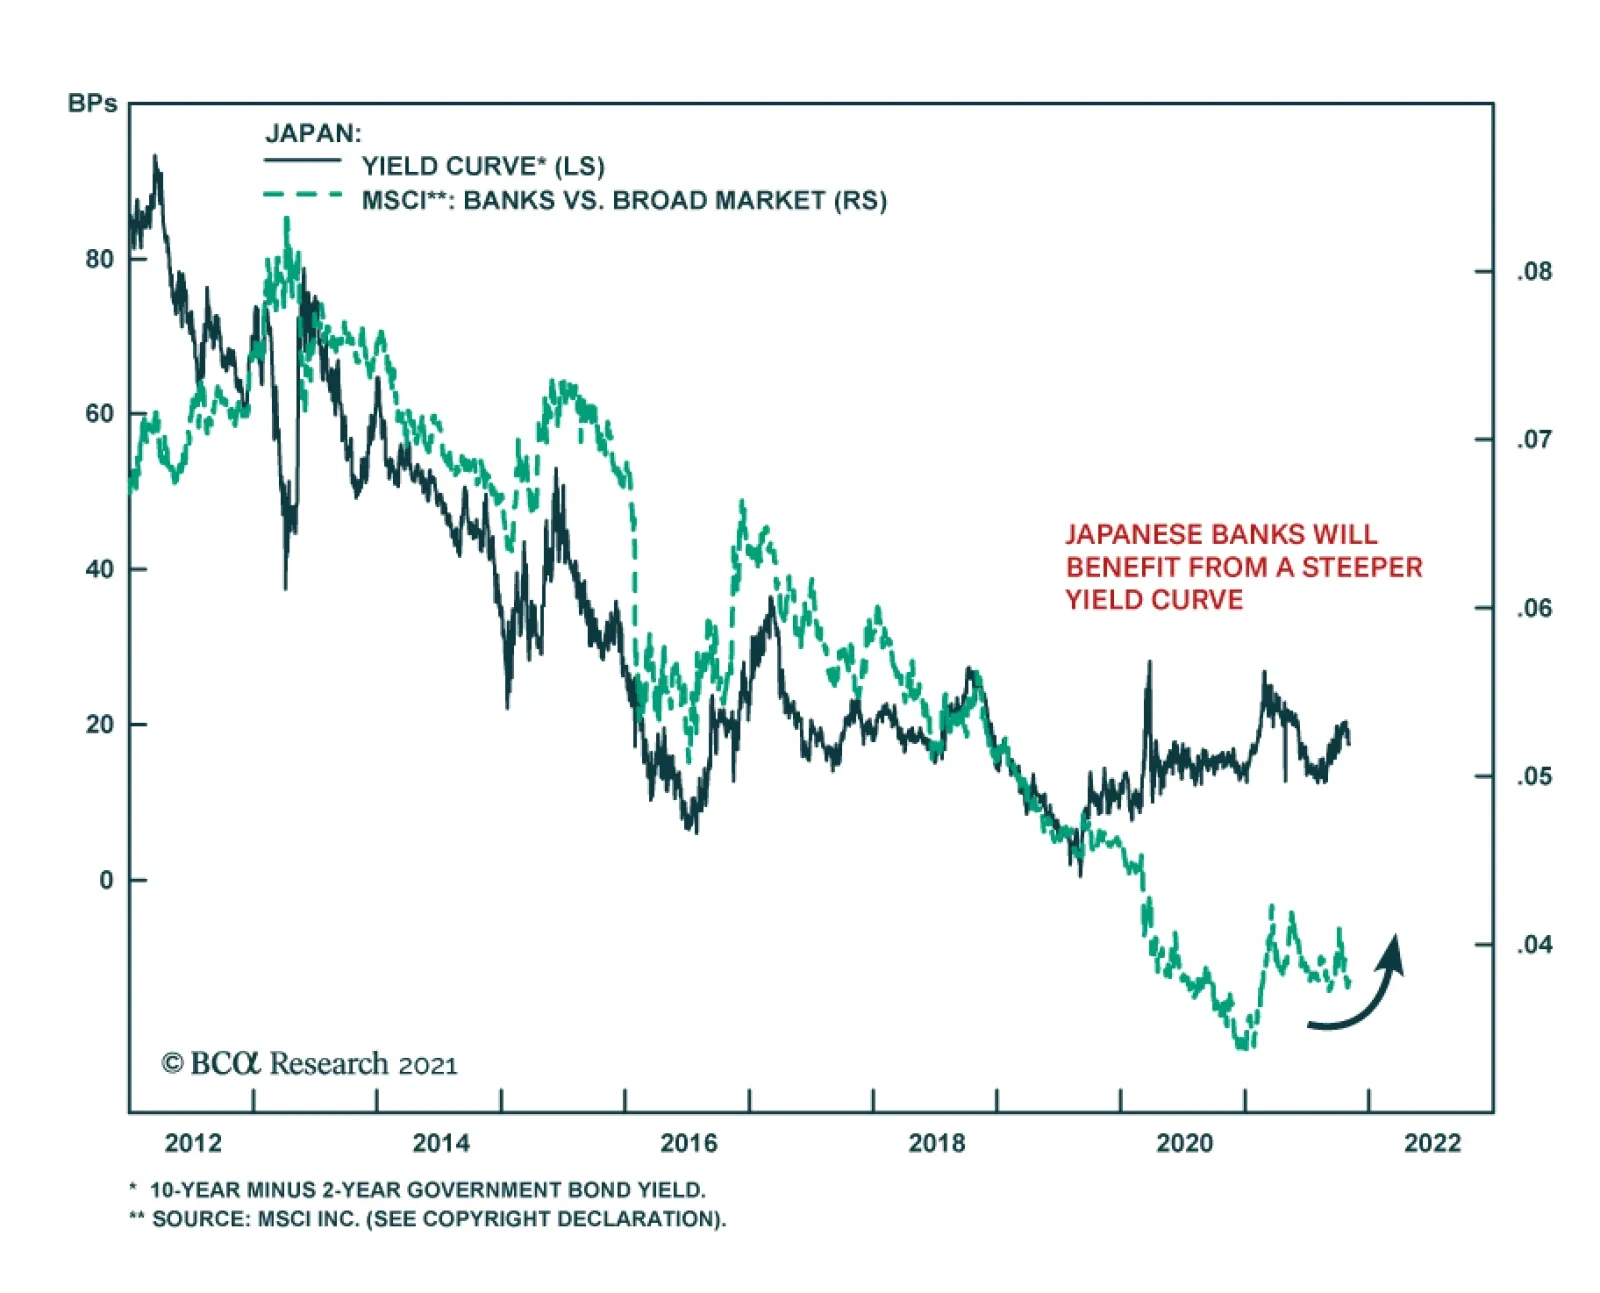
Consumption could also surprise to the upside in Japan. With the consumption tax hike of 2019 and the 2020 pandemic now behind us, pent-up demand could finally be unleashed in the coming quarters. Rising wages and high savings underscore that Japan could see a vigorous rebound in consumption, as was witnessed in other developed economies. This will be particularly the case as inflation stays low. The big risk for Japan from a macro perspective is an external slowdown, driven by China. A boom in foreign demand has been a much welcome cushion for Japanese growth, especially amidst weak domestic demand. The risk is that this tailwind becomes a headwind as Chinese growth slows, especially as a big share of Japanese exports go to China. Our view has been that policy makers in China will be able to ring-fire the property crisis, preventing a “Lehman” moment. As such, while China’s slowdown is a reality and downside risks warrant monitoring, we also expect China to avoid a hard landing. Meanwhile, Japanese exports are also diversified, with other developed and emerging markets accounting for the lion’s share of total exports. For example, exports to the US account for 19% of sales while EU exports account for 9%. Both exports and foreign machinery orders remain quite robust, suggesting that the slowdown in China will not crush all external demand (globally, export growth remains very strong). It is noteworthy that many countries now have “carte blanche” to boost infrastructure spending, especially in areas like renewable energy and supply chain resiliency. Japan continues to remain a big supplier of capital goods globally. This will ensure that an economic recovery around the world will buffer foreign machinery orders. Market Implications Japanese equities have underperformed the US over the last decade, and Kishidanomics is unlikely to change this trend. But to the extent that more fiscal stimulus helps lift aggregate demand, a few sectors could begin to see short-term outperformance. More importantly, the underperformance of certain Japanese equity sectors have not been fully justified by the improving earnings picture (Chart 18). This suggests some room for catch-up. Banks in particular could benefit from a steeper yield curve in Japan, rising global yields and proposed reform in the sector (Chart 19). We will view this as a tactical opportunity however, than a strategic call. Our colleagues in the Global Asset Allocation service have clearly outlined key reasons against overweighting Japan, and are currently neutral. More importantly, industrials also look poised to see some pickup in relative EPS growth, as global industrial demand stays robust. An improvement in domestic demand should also favor small caps over large caps. Chart 18ADismal Earnings Explain Some Underperformance Of Japanese Equities
Dismal Earnings Explain Some Underperformance Of Japanese Equities
Dismal Earnings Explain Some Underperformance Of Japanese Equities
Chart 18BDismal Earnings Explain Some Underperformance Of Japanese Equities
Dismal Earnings Explain Some Underperformance Of Japanese Equities
Dismal Earnings Explain Some Underperformance Of Japanese Equities
Chart 19Japanese Banks Will Benefit From A Steeper Yield Curve
Japanese Banks Will Benefit From A Steeper Yield Curve
Japanese Banks Will Benefit From A Steeper Yield Curve
Foreigners have huge sway over the performance of Japanese assets, especially equities. Foreign holders account for nearly 30% of the Japanese equity float. This is important not only for the equity call but for currency performance as well since portfolio flows dominate currency movements. Historically, the yen and the Japanese equity market have been negatively correlated. This was due to positive profit translation effects from a lower currency. However, it is possible that Japanese domestic profits are no longer driven only by translation effects, but rather by underlying productivity gains. This could result in less yen hedging by foreign equity investors, which would restore a positive relationship between the relative share price performance and the currency. As for the yen, the best environment for any currency is when the economy can generate non-inflationary growth. Japan may well be entering this paradigm. Historically, now has been the exact environment where the yen tends to do well, as the economy exits deflation and enters non-inflationary growth (Chart 20). Chart 20The Yen And Japanese Growth
The Yen And Japanese Growth
The Yen And Japanese Growth
Markets have been wrongly focusing on nominal rather than real yields in Japan and the implication for the yen. Therefore the risk to a long yen view is that the Bank of Japan keeps rates low as global yields are rising. However, in an environment where global inflationary pressures normalize (say in the next 6-9 months) and temper the increase in global yields, this could provide room for short covering on the yen. In our view, the yen is already the most underappreciated currency in the G10, as rising global yields have led to a massive accumulation of short positions. Finally, from a valuation standpoint, the yen is the cheapest G10 currency according to our PPP models, and is also quite cheap according to our intermediate-term timing model (Chart 21). With the yen being a risk-off currency, it also tends to rise versus the dollar not only during recessions, but also during most episodes of broad-based dollar weakness. This low-beta nature of the currency makes it a good portfolio hedge in an uncertain world. Chart 21The Yen Is Undervalued
The Yen Is Undervalued
The Yen Is Undervalued
Given the historic return of geopolitical risk to Japan’s neighborhood, as the US and Japan engage in active great power competition with China, the yen is an underrated hedge. Matt Gertken Vice President Geopolitical Strategy mattg@bcaresearch.com Chester Ntonifor Vice President Foreign Exchange Strategy chestern@bcaresearch.com
This week we continue our series of thematic Special Reports. Over the past few months, we have covered the EV Revolution and Generation Z. In this report, we conduct a “deep dive” analysis of Cybersecurity as an investment theme for equity investors. Spoiler Alert: We recommend Cybersecurity as a structural and tactical overweight. For a shorter investment horizon, the recent pullback and deflated valuation premium present a good entry-point. A Primer On Cybersecurity What Is Cybersecurity? Cybersecurity focuses on protecting computers, networks, programs, and data from unauthorized and/or unintended access. A wide range of malicious activities fall under the umbrella of cybercrime: Theft and damage of personal and financial data, theft of money, embezzlement, demands for ransom, theft of intellectual property, and illicit and illegal use of computers' processing power or cloud storage. The methods the hackers use are breaches, phishing, privileged-access credential abuse, and endpoint security attacks. Cybersecurity Index ISE Cyber Security Index (HXR) is a NASDAQ index launched in 2010, that encapsulates publicly traded companies that operate in the Cybersecurity space, whether by providing infrastructure or services. Cybersecurity is a theme that spans several different industries: It is dominated by Software (57%) and Computer Services (29%). The remaining 14% are split between Telecommunications Equipment and Defense (Chart 1). The space includes both legacy providers and aggressive cloud-only newcomers. Cybersecurity Vs Software Services The S&P 500 Software and Services Industry Group Index (Software and Services) is HXR’s best proxy – the correlation of monthly returns is 65%. Compared to Software and Services, HXR index performance has been volatile and more recently underwhelming. Cybersecurity was underperforming for the past six months (Chart 2). There are several reasons for Cybersecurity lagging Software and Services.
Chart 1
Chart 2Cybersecurity Has Underperformed Software And Services
Cybersecurity Has Underperformed Software And Services
Cybersecurity Has Underperformed Software And Services
First, companies in the former are much younger and smaller than in the latter (Chart 3), and the size effect has been at play. Second, the industry composition of the two indexes is different, with HXR's allocations to Telecom and Defense sectors being slightly more defensive in nature. Last, and most important, Cybersecurity stocks surged early in the pandemic on the back of lockdowns and a ubiquitous shift to remote work, and hence some of the performance and profits growth were “borrowed” from the future. Chart 3Cybersecurity Theme Is Exposed To The Size Effect
Cybersecurity Theme Is Exposed To The Size Effect
Cybersecurity Theme Is Exposed To The Size Effect
Cybercrime Statistics Cybercrime statistics are sobering, with the number of occurrences increasing fast, and financial damage reaching catastrophic amounts. Cybercrime will cost the world $6 trillion in 2021, and $10.5 trillion annually by 2025,1 representing one of the greatest transfers of wealth in history. The average total cost of a data breach is $4.24 million in 2021, which is up from $3.86 million in 2020.2 US ransomware attacks cost an estimated $915 million in 2020.3 93% of companies deal with rogue cloud apps usage.4 86.2% of surveyed organizations were affected by a successful cyberattack.5 The cost and damage of cyberattacks underpins why Cybersecurity has risen from being an accessory to becoming a “must-have” for companies’ survival (Charts 4 and 5).
Chart 4
Chart 5Cybercrime Losses Spur Demand For Cybersecurity
Cybercrime Losses Spur Demand For Cybersecurity
Cybercrime Losses Spur Demand For Cybersecurity
Key Cybersecurity Verticals And Companies Cybersecurity has evolved over time. Legacy non-cloud incumbents that used to offer on-premises anti-virus software, such as NortonLifeLock, are morphing into or giving way to cloud-based solutions and software-as-a-service (SaaS) providers. These cutting-edge security players leverage Artificial Intelligence (AI) and Machine Learning (ML) to preempt threats, as opposed to reacting to them. In addition, the advantage of the cloud-based solutions is that there is no hardware to buy or manage. The Cybersecurity universe can be split into three major categories: Physical Network Infrastructure, Digital Network Infrastructure, and Cloud And Data Security. Physical Network Infrastructure Companies in this segment provide a mix of digital and physical solutions including supplying communication appliances such as routers and other network hardware. This segment has two incumbents: Cisco Systems (CSCO) and Juniper Networks (JNPR). Digital Network Infrastructure Companies focus on providing broad server and network security against a wide range of attacks. Product offerings may also include firewalls and AI threat detection. A10 Networks (ATEN) and Akamai Technologies (AKAM) operate in this segment. Cloud And Data Security The key verticals of Cloud And Data Security are Endpoint Protection, Secure Web Gateways, Identity Access Management, and Detection and Blocking of malicious emails. Most companies in this space offer cloud-based solutions and SaaS and have products in each of the four data security categories. Companies that roll up a variety of security software functions into a cloud- based service comprise a broad segment called Secure Access Service Edge, or SASE. Fortinet (FTNT), Check Point Software (CHKP), Palo Alto Networks (PANW), and Zscaler (ZS) are all SASE. These companies replace existing gateways, virtual private networks (VPN), edge routers, and firewalls. SASE is expected to have 57% growth in spending in 2021, with 40% compounded growth through 2024.6 Endpoint Protection Platforms help customers secure end-user devices such as mobile devices, laptops, and servers. To be one step ahead of cyber adversaries, these cloud-based companies offer SaaS that deploys AI and ML algorithms to detect and predict threats based on the analysis of the vast data collected across the entire platform. Crowdstrike, Check Point, and SentinelOne are the segment leaders. Secure Web Gateways prevent unsecured traffic from entering an internal network through external web applications. This is executed by the providers acting as a middleman so that users can bypass their internal networks to connect to the applications by leveraging providers data-cloud. These cloud-only companies’ SaaS and Firewall-as-a-Service secure customer access to internally and externally managed applications, such as email or customer relationship management. Fortinet, Zscaler, Palo Alto Networks (PANW), AvePoint (AVE), and Cloudflare (NET) are the best-of-breed players in this space. Identity Access Management (IAM) focuses on enabling access to networks only to authorized users. Multi-factor authentication, application programming interface (API) access management, and single sign-on (SSO) are a few identity solutions that fall under this vertical. Okta (OCTA) and Ping Identity (PING) are the leading players in this space. Their cloud native solutions offer access to all applications within a single portal using the same authentication. Detection And Blocking Of Malicious Emails – Companies in this segment detect and block emails that include known or unknown malware, malicious URLs, and impersonation of legitimate contacts. Mass and spear phishing is becoming a preferred gateway for cyber criminals and is becoming epidemic – 95% of cyberattacks use email. These providers complement traditional detection techniques with AI to identify fake logos and detect anomalous email patterns and high-risk links. Mimecast (MIME) and Check Point (CHKP) are active in this segment. Key Industry Drivers Digitization, Remote Work, And Shift To Cloud Increase Demand For Cybersecurity The pandemic-driven shift to remote work, broad-based migration to cloud computing, development of the Internet-of-Things – every new digital process and asset create new potential targets for hackers. The sophistication of the attacks is also on the rise, deploying AI, ML, and 5G. There appears also to be cooperation among different hacker groups. This year alone, high-profile data breaches, such as Kaseya, Accellion, Pulse Secure, and Solar Winds, affected universities, defense firms, S&P 500 companies, and government agencies. These developments, as troubling as they are, are a boon for Cybersecurity companies. Cybersecurity is becoming business-critical. Despite its celebrity status, this is an industry that is still in the early innings, and ubiquitous digitization requires increasingly more complex cyber defenses. Cyber-Space: A New Realm Of (Geo)Political Conflict Generally the risk of a major exogenous shock affecting global markets from a cyber incident is underrated (Table 1). The world is inherently an anarchic place because nations are sovereign and there is not a single world government to enforce international law. However, nations periodically work out codes of conduct and norms of behavior to impose limitations on conflict and chaos. The post-WWII and post-Cold War global order is an example. A tolerably functional international order is beneficial for global trade and investment flows. Increasingly international rules and norms are being challenged. The decline of the US and Europe in economic, technological, and military weight – relative to the rest of the world – has given rise to a “multipolar” distribution of power in which the rules of the road are contested. Disputes over sovereignty, territory, maritime rights, and air space have been escalating for over a decade in the areas around Russia, China, and the Mediterranean region. Table 1Cyber Event Underrated In Consensus View Of Global Risks
Cybersecurity: A Must-Have For Survival
Cybersecurity: A Must-Have For Survival
Cyber-space is a new realm or domain of human activity. Because it is international, it is inherently ungovernable, and because it is new, nations have not had decades in which to establish basic rules or norms. It is very close to pure anarchy. Given that overall geopolitical competition is rising in the context of multipolarity, cyber-space is an attractive arena for nations to pursue their objectives because it presents fewer constraints – nations can act more independently and aggressively with limited accountability. Cyber gives nation-states (and their proxy groups) greater anonymity and plausible deniability. Russia can directly intervene in American social and political life through state-backed cyber agents, or it can condone the actions of criminal groups that conduct ransomware attacks. Nations can also use cyber tools to pursue state economic goals that align with broader strategic goals. For example, China can pursue technological upgrades for state-backed industry through cyber-theft. The trend for the foreseeable future is for governments to invest in Cybersecurity and cyber-capabilities in order to fortify this new and lawless realm of competition. Russia and China have attempted to seal off their cyber-space to prevent interference from foreign powers. They have also used cyber capabilities to take advantage of the relatively unregulated cyberspace of the liberal democracies. The democracies are now attempting to increase control over their own cyber domains. They need to protect critical infrastructure but also are increasingly focused on patrolling the ideological space. Finally, while nations are often deterred from aggression by conventional militaries, cyber-space creates an avenue to pursue interests aggressively with minimal risk of physical conflict. The US and Israel will continue to sabotage Iran’s nuclear program. Russia will continue to use cyber tools to try to reclaim dominance in the former Soviet Union. And China could resort to cyber-attacks against Taiwan if it is not yet willing to pursue an extremely difficult and risky amphibious invasion. Governments and corporations will deal with extreme uncertainty in this environment. They will have to invest in Cybersecurity. But they will also run the risk that at some point cyber-meddling will go too far and provoke real-world retaliation. President Biden reflected the sentiment of the US political establishment during a speech in July at the Office of the Director of National Intelligence: “I think it’s more likely we’re going to end up, if we end up in a war – a real shooting war with a major power – it’s going to be as a consequence of a cyber breach of great consequence and it’s increasing exponentially, the capabilities.”7 This risk will reinforce the need for more robust cyber defenses to prevent physical harm to a nation’s people and wealth. Hence what governments will not be able to do is penalize or break up their Cybersecurity corporations. Cyber firms will see strong public and private demand without the regulatory pressure that other tech companies (especially social media) will face. Corporate Spending On Cybersecurity Services Is Soaring According to IDC, the global Cybersecurity market is expected to grow from $125 billion in 2020 to $175 billion by 20248 at an 8.8% CAGR. After all, companies that purchased or implemented automated security features in their businesses can reduce potential cyber-attack losses by more than 50%, making it a worthwhile investment. Both large and small businesses are yet to fully implement Cybersecurity defenses. According to an IDG cybersecurity survey,9 91% of organizations are increasing their Cybersecurity budgets in 2021 (compared to 96% in 2020). Companies invest to prevent malicious attacks, and protect an increasingly distributed IT environment, and securely connect their remote workforce (Chart 6). According to an IBM security survey, only 25% of responders stated that they had fully implemented automated security. Clearly, demand for cyber defenses is poised for strong growth.
Chart 6
Public Spending Commitments Will Fortify Cyber Defenses In response to the numerous breaches, the current US administration is placing a high priority on defensive cyber programs. Within the broader $6 trillion Biden budget request to Congress, $10 billion will be allocated to civilian government Cybersecurity in 2022 (Chart 7), bringing the total federal IT spending to just over $58 billion. Since 2017, US government departments have seen the Cybersecurity share of their basic discretionary funding rise steadily from 1.38% to 1.73%. The Biden administration’s broader legislative agenda includes expanding broadband Internet, building infrastructure, and regearing the US energy grid. New cyber vulnerabilities will emerge and both public and private entities will need to invest in security. Chart 8 further reveals the importance of Federal software spending to Cybersecurity equity performance. Our bet is that increases in Federal software spending outlays will lead to outperformance of HXR relative to the Software and Services index.
Chart 7
Chart 8Stepped Up Government Spending Will Lift Cybersecurity Stocks
Stepped Up Government Spending Will Lift Cybersecurity Stocks
Stepped Up Government Spending Will Lift Cybersecurity Stocks
Key Drivers Of Profitability Sales Growth Cybersecurity sales year-over-year growth is soaring at 40% this year and dwarfs the rate of sales growth of Software and Services (Chart 9). This is consistent with a joint survey by IDC and Bloomberg Intelligence Services, which found that worldwide Cybersecurity spending will outpace general software spending by almost 4.9% annualized from 2020 to 2024 (Chart 10).10 Chart 9Cybersecurity Sales Are Soaring
Cybersecurity Sales Are Soaring
Cybersecurity Sales Are Soaring
Chart 10
R&D Investing Has Slowed Cybersecurity companies have been investing in R&D aggressively prior to the pandemic. Intellectual property is a competitive advantage in this space, and R&D has likely been ramped up in “arms races”, with different industry players building their competitive moats. Recently, spending on R&D has eased. We believe that this slowdown is temporary as companies need to stay competitive and fend off threats from cybercriminals (Chart 11). Earnings Growth Despite robust revenue growth, year-over-year earnings growth has recently slowed (Chart 12). Shift to remote work in 2020 resulted in a demand surge that has pulled profits forward. However, despite economic normalization and a return to the pre-pandemic trends, the structural shifts towards cloud and remote work are here to stay, while cybercriminals are getting increasingly more creative and aggressive. As a result, earnings growth is bound to pick up going forward. Chart 11R&D Investment Has Slowed Down
R&D Investment Has Slowed Down
R&D Investment Has Slowed Down
Chart 12After Lockdown Surge, Earnings Growth Is Normalizing
After Lockdown Surge, Earnings Growth Is Normalizing
After Lockdown Surge, Earnings Growth Is Normalizing
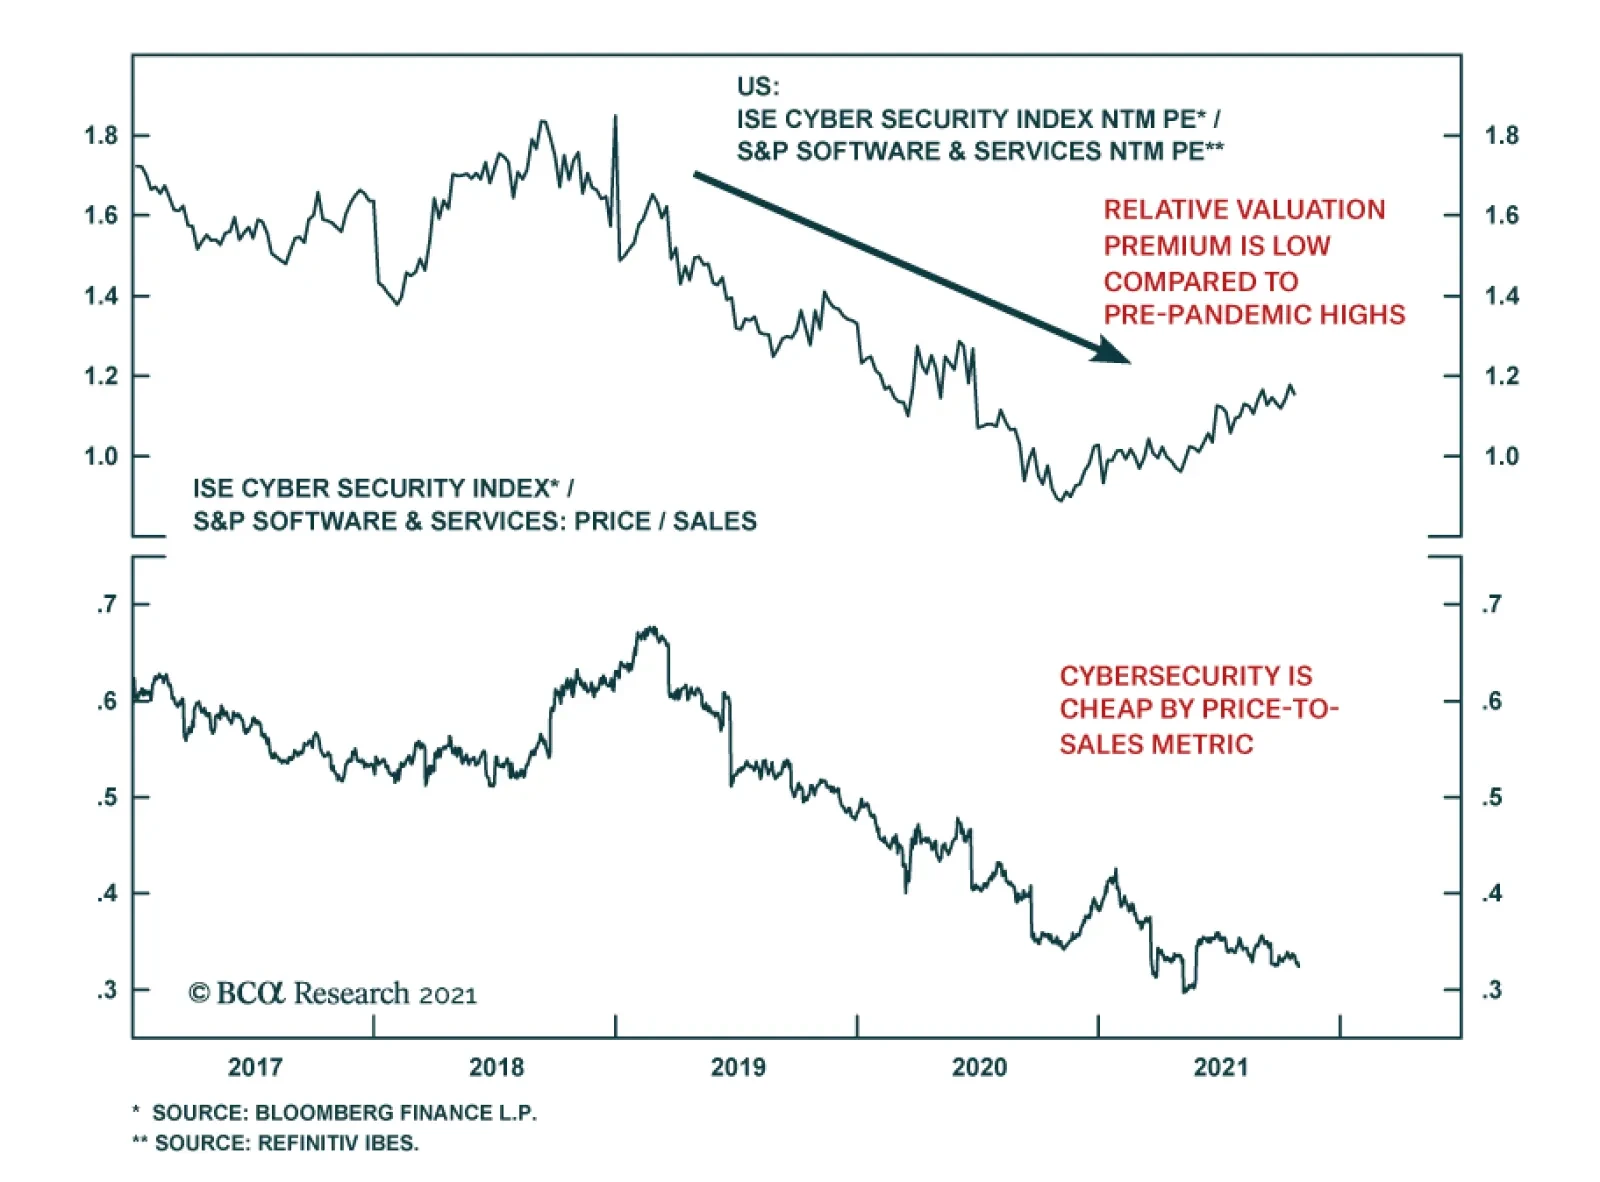
Valuations Currently, HXR is trading at 37x forward earnings, and 104x trailing, which translates into an 13% premium to Software and Services. While this valuation premium appears high, it is low compared to historical values (Charts 13 & 14). The former hefty premium has been deflated by recent underperformance (18%). There is also a meaningful discount to Software and Services when it comes to the Price-To-Sales metric, which is, arguably, the best gauge of value for growing companies. Chart 13Relative Valuation Premium Is Low Compared To Pre-Pandemic Highs
Relative Valuation Premium Is Low Compared To Pre-Pandemic Highs
Relative Valuation Premium Is Low Compared To Pre-Pandemic Highs
Chart 14Cybersecurity Is Cheap By Price-To-Sales Metric
Cybersecurity Is Cheap By Price-To-Sales Metric
Cybersecurity Is Cheap By Price-To-Sales Metric
From a valuation standpoint, Cybersecurity stocks are exorbitantly expensive, yet we can make a case that they are attractive compared to their own history, and these levels signify an opportunity to build a new position in this theme. How To Invest In Cybersecurity ETFs There are a number of highly liquid ETFs, such as CIBR, BUG, and HACK, powered by the Cybersecurity theme, cutting across several industry groups (Table 2 & Appendix). These passively managed funds have relatively high expense ratios. Direct indexing may be preferable as a basket of the Cybersecurity stocks is relatively easy to assemble. Given that the CIBR ETF has predominantly US companies, is most liquid, and has the highest AUM, it is our vehicle of choice for capturing the Cybersecurity theme. Table 2Cybersecurity ETFs
Cybersecurity: A Must-Have For Survival
Cybersecurity: A Must-Have For Survival
S&P 500 Investors with an S&P500-only mandate may create a Cybersecurity basket from five major players spread across several sectors to gain direct exposure to the large-cap Cybersecurity universe: Cisco (CSCO), Juniper (JNPR), Fortinet (FTNT), NortonLifeLock (NLOK), and Akamai (AKAM). These companies represent the entire network security market, with CSCO and JNPR providing exposure to physical network infrastructure, AKAM representing the Digital Network Infrastructure vertical, FTNT covering Digital Data Security, and finally NLOK a legacy player focused on End Point Protection. It is important to note that some of the fastest growing and innovative players, such as Crowdstrike, Okta, and Zscaler, are outside of the S&P 500 as their market capitalizations are too small. Investment Implications Cybersecurity is increasingly important for businesses in the US and abroad, with demand for solutions surging. As a result, Cybersecurity is a structural investment theme, which warrants a long-term position in most equity portfolios. As with any investment into an emerging technology or theme, it is likely to be volatile, but the long-term upside should justify day-to-day jitters. Also, our analysis demonstrates that now is a good time to build a tactical overweight in Cybersecurity stocks. These stocks have been languishing for a few months, losing some of the valuation froth generated by the work-from-home hype. As a result, most of the cybersecurity stocks are attractively valued compared to history and are poised for a rebound on the back of robust demand for their services. Bottom Line Global digital transformation as well as rising geopolitical tensions create fertile ground for attacks by both cyber criminals and malicious state actors. The cyber defenses of most private and public companies are still ill-prepared, and the space is poised for a robust growth since Cybersecurity is a “must have” for survival. This growing market has attracted a plethora of new cybersecurity players which provide cloud-based SaaS solutions, and are well-versed in deploying AI and ML to counter cyber threats. While many of these companies are still young with relatively small capitalization, their potential is enormous. We recommend tactical and structural overweights to the theme. Irene Tunkel Chief Strategist, US Equity Strategy irene.tunkel@bcaresearch.com Matt Gertken Vice President Geopolitical Strategy mattg@bcaresearch.com Arseniy Urazov Senior Analyst ArseniyU@bcaresearch.com Appendix
Image
Image
Footnotes 1 Special Report: Cyberwarfare In The C-Suite, Cybercrime Magazine, Nov 13, 2020. 2 IBM and Ponemon Institute Research 3 Emsisoft 4 Imperva 2019 Cyberthreat Defense Report 5 CyberEdge Group 2021 Cyberthreat Defense Report 6 Barron’s, Security Software Stocks Should Have Strong Q2 Results. Here’s Why, July 12, 2021. 7 Nandita Bose, “Biden: If U.S. has ‘real shooting war’ it could be result of cyber attacks,” Reuters, July 28, 2021, reuters.com. 8 IDC, “Ongoing Demand Will Drive Solid Growth for Security Products and Services, According to New IDC Spending Guide,” Aug 13, 2020. 9 Cybersecurity at a Crossroads: The Insight 2021 Report", IDG Research Services, 2021. Respondents included more than 200 C-level IT and IT security executives in organizations with an average of 21,300 employees across a wide range of industries. 10 Source: Bloomberg Intelligence (Mandeep Singh - Senior Industry Analyst), August 25, 2021 & IDC.
BCA Research’s US Equity Strategy, Geopolitical Strategy & US Political Strategy services recommend Cybersecurity as a structural and tactical overweight. The pandemic-driven shift to remote work, broad-based migration to cloud computing, and the…
Highlights Economy – It is more likely that the third quarter slowdown reflected demand deferral than demand destruction: We are not concerned that the lousy third quarter GDP release heralds stagflation. Massive fiscal transfers and an unprecedented increase in household wealth will support consumption and keep the economy from stagnating. Markets – Another quarter, another sizable earnings beat: Despite shortages, bottlenecks and logistics challenges, S&P 500 profit margins held up much better than expected in the third quarter, allowing earnings to maintain their pandemic streak of exceeding the analyst consensus by an unusually wide margin. Strategy – Stay on the right side of the cycles: The business cycle, the credit cycle and the monetary policy cycle all support overweighting equities and underweighting Treasuries and cash. There will be a time to turn defensive, but it’s not here yet. Feature Stagflation, combining stagnant activity and high inflation, is a clever phrase but a deeply unpleasant economic outcome. It is central bankers’ and elected officials’ bête noire because there is no politically palatable way to counter it. Raising rates to throttle inflation risks driving unemployment higher while stimulating the economy to bolster employment risks letting inflation burn out of control. Paul Volcker was hung in effigy for taking the former route, plunging the economy into a painful double-dip recession to shatter the inflationary mindset, while Jimmy Carter saw his re-election prospects evaporate once voters were asked how they’d fared over his stagflation-ridden term. The November edition of the Bank Credit Analyst examines the drivers of the ‘70s/early ‘80s stagflation. After a through then-and-now comparison, it concludes that a stagflationary outcome is unlikely albeit not impossible. We agree, for the simple reason that you can’t have stagflation without stagnating and we expect that the economy will grow well above its trend level all the way through 2022. We expect that sustained nominal GDP growth of 6% or more, in contrast to the 4% rate that has prevailed since 2000, will support risk asset outperformance over the next twelve months. A Discouraging Quarter The rise of the Delta variant cast a pall over the economy in the third quarter, as the first estimate of GDP made clear. A summer that began with great optimism about getting back to normal quickly fizzled in the face of surging infections (Chart 1), stalled vaccinations (Chart 2), spotty supplies and logistical bottlenecks. GDP growth forecasts cratered (Chart 3, top panel) and economists went on to dial back their expectations for next quarter (Chart 3, middle panel) and 2022 (Chart 3, bottom panel). In the end, growth proved to be even worse than expected, falling all the way to 2% with real final domestic demand (GDP after backing out inventory stocking and net exports) growing just 1%. Chart 1So Much For The Summer Of Fun
So Much For The Summer Of Fun
So Much For The Summer Of Fun
Chart 2Grinding To A Halt
Grinding To A Halt
Grinding To A Halt
Chart 3Downward Revisions
Downward Revisions
Downward Revisions
A bear could interpret the decline as evidence that extraordinary policy measures have failed, giving way after just two quarters of Potemkin village growth. We are decidedly bullish, however, and view the third quarter as a stumble that will merely stretch out a consumption-fueled blowout that has already begun. A swoon in motor vehicle purchases lopped off 240 basis points of GDP by itself, while declining residential investment cost 40 basis points. The third quarter’s decline in auto sales was unprecedented during an expansion, however (Chart 4), and we view it as a supply-driven hiccup that will disappear once production revives. (Ford’s double-digit rise after reporting earnings last week suggests the equity market sees it that way, too.) Chart 4An Unprecedented Expansion Event
An Unprecedented Expansion Event
An Unprecedented Expansion Event
As for residential investment, we stand by our view that the housing market has been inadequately supplied for several years.1 Structural issues like tight local zoning rules may be as much of a constraint on supply as cyclical factors, but they are not new and we do not expect that they will thwart builders’ response once the requisite human and material inputs can again be accessed. Like auto sales, residential investment does not typically decline amidst expansions (Chart 5). We attribute the slowdown in services consumption, particularly in food services and accommodations (Chart 6, top panel) and recreation services (Chart 6, bottom panel), to last quarter’s spike in COVID infections. Now that the Delta variant seems to have run its course and 5-to-11-year-olds are poised to become vaccination-eligible, we expect the recovery in discretionary services consumption to return to something between its first half and third quarter pace. Chart 5Residential Investment Looks More Likely To Contribute To Growth Than Detract From It
Residential Investment Looks More Likely To Contribute To Growth Than Detract From It
Residential Investment Looks More Likely To Contribute To Growth Than Detract From It
Chart 6Not So Bad For An Outbreak
Not So Bad For An Outbreak
Not So Bad For An Outbreak
The Creeping Menace The Delta variant upended a quarter’s output, but inflation could prove to be a more durable threat. Nominal GDP growth in the third quarter (7.8%) slowed considerably from the first half (12.1%), but the decline in real growth to 2% from 6.5% was much worse. If inflation doesn’t come down more rapidly than it did last quarter – as measured by the GDP deflator, it was 6.1% in 2Q and 5.7% in 3Q – it threatens to swallow up much of the quickened nominal growth pace. If upward price pressures are not as transitory as they first appeared, the expansion may fail to live up to its hype. The good news from our perspective is that long-run inflation expectations remain muted. Neither consumer surveys nor market-based measures suggest that a potentially self-fulfilling inflationary mindset has taken hold. The University of Michigan’s consumer confidence survey reveals that households’ inflation expectations curve is sharply inverted, with inflation over the next five to ten years, 2.8%, expected to be two percentage points lower than next year’s 4.8% rate (Chart 7). The market-based inflation expectations curve is not so steeply negative – investors aren’t as gloomy about the near-term outlook – but it is decidedly inverted and reinforces the transitory narrative (Table 1). Chart 7Households Think Inflation's Transitory ...
Households Think Inflation's Transitory ...
Households Think Inflation's Transitory ...
We (and the Fed) focus so much attention on the inflation expectations curve because high inflation will not become self-sustaining until economic actors – workers, businesses, consumers and lenders – begin to expect it will persist into the future and change their behavior accordingly. When inflation is expected to be persistently high, workers insist on higher wages to maintain purchasing power, businesses demand higher prices to preserve their margins, consumers accelerate their big-ticket purchases to get the most bang for their buck and lenders require higher nominal pro forma returns. The resulting feedback loops help inflation become entrenched in the same way that expectations of falling prices have enabled the deflationary mindset that continues to grip Japan. As long as households and investors expect inflation to decelerate over time, the inflation genie will not have gotten out of the bottle. Table 1... And So Do Financial Markets
Half-Empty Or Half-Full?
Half-Empty Or Half-Full?
Households Have A Great Deal Of Dry Powder We have closely monitored US households’ pandemic savings ever since the CARES Act payments began to flow. We viewed the growing pile of excess savings – aggregate household savings above the level that would have accumulated if pre-pandemic income and consumption trends had continued – as a proxy for households’ ability to make up for foregone consumption once COVID-19 loosened its grip on economic activity. Our running tally, now $2.2 trillion, has stabilized since the final round of economic impact payments was distributed this spring: spending caught up to its pre-pandemic trajectory in August and income slipped below its pre-COVID trend last month upon the expiration of federal supplemental unemployment insurance benefits. Households flexed their formidable spending capacity in the first half of the year, when consumption grew at a whopping 11.7% annualized real rate even while excess savings continued to grow. The experience of the first half testifies to the force of pent-up demand, the magnitude of fiscal support extended to households and the staggering wealth gains that have resulted from the appreciation of home prices and financial assets. As our Global Investment Strategy colleagues highlighted in their latest report, since the end of 2019, household net worth as a share of GDP has grown at its highest rate on record (Chart 8). Citing empirical studies finding that households spend 5 to 8 cents of every incremental dollar of housing wealth and 2 to 4 cents of every incremental dollar of stock market gains, they estimate that the wealth effect will support about $600 to $900 billion of consumption. Chart 8A Wealth Surge For The Books
A Wealth Surge For The Books
A Wealth Surge For The Books
We have lauded excess savings as the primary support for elevated consumption, but those numbers suggest that household net worth gains deserve nearly equal billing. Our ballpark assumption has been that households will spend around one half of their excess savings, or $1.1 trillion, equivalent to nearly 5% of GDP. $600 to $900 billion of wealth effect consumption would tack on another 2.5 to 4%, bringing the total incremental spending capacity to 7 to 9% of GDP. Though these estimates are imprecise and should not be viewed as predictions, they testify to the force of the consumption tailwinds available to support the US economy. Another Robust Quarter For S&P 500 Earnings Amazon’s sizable third quarter earnings miss and stark fourth quarter guidance banished the budding sense of celebration surrounding the current reporting season, but it has nonetheless been exceptional by pre-COVID standards. Through the first three weeks, with 279 companies having reported results, third quarter earnings are projected to be 7.4% ahead of the final consensus estimate (Chart 9). Though it will fall short of the two- and three-standard-deviation level the index has reached the previous five quarters, this quarter is on track to top the maximum 6% beat recorded from 2012 through 2019 (Chart 10).
Chart 9
Chart 10
Possibly the most surprising factor within the bottom-line EPS data has been the magnitude and breadth of margin surprises. Through last Friday, revenues had surprised to the upside by 2% while earnings had beaten by 11%. The 9-percentage-point spread reveals how much margins have surpassed expectations in the face of upward wage and other input cost pressures. Breadth has also been impressive, with every sector but Materials achieving wider-than-expected margins (Table 2). Table 2Margins Positively Surprised Nearly Across The Board
Half-Empty Or Half-Full?
Half-Empty Or Half-Full?
We do not know why margins fared better in the real world than they did in analyst models – it was presumably a combination of increased operating leverage and an ability to continue to reduce or eliminate some costs – but we expect margins will contract in subsequent quarters, as per our US Equity Strategy team’s recent detailed analysis. In this regard, perhaps the reduced magnitude of this quarter’s earnings beat heralds a return to the pre-pandemic pattern in which companies were not able to achieve unanticipated efficiency gains quarter after quarter. For the last two quarters, we have been highlighting that expectations were very low because the consensus was calling for highly unusual quarter-over-quarter declines in earnings. If those laughably easy comparisons go away, the path may become a little rockier for equities. For the next twelve months, however, we expect gale-force consumption tailwinds will allow equities to continue to generate positive excess returns over Treasuries and cash. Doug Peta, CFA Chief US Investment Strategist dougp@bcaresearch.com Footnotes 1 Please see the July 12, 2021 US Investment Strategy Special Report, "The US Housing Market: Déjà Vu All Over Again?" available at usis.bcaresearch.com.