Equities

Cybersecurity Primer
Cybersecurity Primer
In the coming weeks, we will continue our series of thematic Special Reports by conducting a “deep dive” analysis of cybersecurity stocks. This is a pervasive investment theme, and we recommend it as a new structural overweight. While cybersecurity is not new to the investment community, it is still in the early innings: The pandemic-driven shift to remote work, broad-based migration to cloud computing, development of the internet-of-things, and increasing geopolitical tensions create new targets for hackers who are after valuable data or just want to achieve maximum damage to the networks. With cybercrimes costing the world nearly $600 billion each year,1 and cyber-attacks increasing in number and sophistication, the global cybersecurity market is expected to grow from $125 billion in 2020 to $175 billion by 2024.2 Both large and small businesses are yet to fully implement cybersecurity defenses. According to a survey by Forbes magazine, 55% of business executives plan to increase their budgets for cybersecurity in 20213 aiming to prevent malicious attacks. These developments, are a boon for the cybersecurity stocks, making them an attractive long-term investment. In the upcoming Special Report, we will discuss the outlook and the key drivers of the industry, the types of cyber security defenses and companies behind them, and evaluate the fundamentals and valuation of our cyber security basket. We will draw investment conclusions to gauge the theme’s prospects as a tactical (three to six months investment horizon) investment. Bottom Line: Stay tuned for an upcoming Special Report on cybersecurity equities in the coming weeks. Top three cybersecurity ETFs by AUM are: CIBR, HACK, and BUG. Footnotes 1Mordor Intelligence, 2020. 2IDC, “Ongoing Demand Will Drive Solid Growth for Security Products and Services, According to New IDC Spending Guide,” Aug 13, 2020. 3Forbes, 2020
Highlights The ruling African National Congress will be difficult to displace in upcoming elections given the large economic role it plays in the public sector and in low-income households. Low growth outcomes will continue as the government navigates allocating state funds more efficiently, amid rising public debt, weak macroeconomic fundamentals and a fresh undertaking of fiscal austerity. The African National Congress is primed to claw back some lost voter support with President Ramaphosa at the helm. But Ramaphosa will also put a stop to fiscal austerity ahead of the 2024 general election. Our new South Africa Geopolitical Risk Indicator captures moments of significant political risk in the past and currently signals that the country is facing a geopolitical and political risk level last seen in 2016. The political status quo will remain for now, which is positive for investors. But China’s economic troubles and South Africa’s eventual need to inflate away its debt pose long-term risks for investors. Feature In the wake of COVID-19, South Africa has witnessed an increase of civil unrest. Severe looting in July 2021 only lasted a couple of days and was mostly contained to the central and eastern parts of the country but it nearly brought the country to a stand-still. The imprisonment of former President Jacob Zuma and a harsh lockdown amid resurging COVID-19 cases at the time fanned flames already lit by long-standing structural economic issues. The country has been stuck in a low growth trap for several years and government is facing constraints from rising debt levels. Yet the ruling party (the African National Congress, or ANC) will be difficult to displace in upcoming municipal elections and future general elections. It plays a large role in the public sector and low-income households depend heavily on government grants. Moreover, the ruling party also enjoys a “liberator” status, with voters pledging support to the ANC based on the party’s historical achievement of playing a major role in ending the apartheid regime. Unless the party implodes from within – possible but unlikely – the ANC will continue to rule, which is also the best outcome for investors at the current juncture. Low Growth Continues Amid High Debt The South African economy was straining before the pandemic and will continue to underperform going forward. Plagued by rampant corruption, misused state funds, and a lack of political leadership, the public sector has dragged on growth for several years now. Coupled with poor productivity in the primary and secondary sectors, South Africa’s economy faces headwinds which will affect future growth outcomes for years to come (Chart 1A).
Chart 1
In the mining sector, the country’s top foreign exchange earner, output has been in a structural decline since 1980 even as the country has benefited from several commodity price booms (Chart 1B). More recently, Ramaphosa’s 2018 investment drive to rebuild South African industries has failed to galvanize a turnaround.1 Manufacturing is much of the same story as mining. Output has been in decline from 1990 and has reached its lowest level since mid-1960 (Chart 1C). The National Union of Metal Workers have recently undertaken a protracted strike that has lasted three weeks already – with many industry bodies citing the dangers of irreparable harm to production and severe job losses should the strike continue for much longer. Other factors such as intermittent electricity outages across the country will subtract from productivity going forward. Chart 1BPrimary Sector Productivity In Structural Downfall...
Primary Sector Productivity In Structural Downfall...
Primary Sector Productivity In Structural Downfall...
Chart 1C...Followed By The Secondary Sector
...Followed By The Secondary Sector
...Followed By The Secondary Sector
Chart 2Public Debt Is Ballooning Fast
Public Debt Is Ballooning Fast
Public Debt Is Ballooning Fast
From longstanding misuse of public funds comes the ballooning public government debt (Chart 2). Our colleagues over at the BCA Emerging Markets Strategy team have assessed the state of fiscal policy and debt in South Africa and the outlook is bleak. The government is currently pursuing fiscal austerity measures to rein in debt. However, these measures are unlikely to be enough and will become politically untenable over time. Otherwise, to stabilize debt, policy makers will have to inflate their way out of debt servicing costs or increase fiscal spending to boost nominal GDP growth. According to the 2021 budget speech, real spending is projected to contract each year over the next three years. This marks the first cut to nominal noninterest government expenditure in at least 20 years. Other items such as health care will see spending cuts over the next three years and remain lower than 2013 levels. Social protection and job creation initiatives will also see spending cuts. Another large budgetary item that will see spending cuts is the public sector wage bill. The government has reiterated its commitment to curb this growing expense. Recent negotiations with civil servants saw only a 1.5% wage increase over the next year compared to an average growth rate of 7% over the last five years. Chart 3Government Spending Important To Demand
Government Spending Important To Demand
Government Spending Important To Demand
Austerity measures will lower public sector demand and ultimately growth. However, if successful, they will bolster both potential economic growth and the ruling party’s support. The problem is the timing of the general election in 2024. The economic backdrop in the country remains weak. Assuming more civil unrest takes place, government finances will be burdened with picking up the cost again and appeasing the masses through higher social spending. Austerity measures will presumably be relaxed ahead of the 2024 vote. Government debt needs to be curtailed considering that debt servicing costs are the second largest expenditure item of the country’s national economic budget. But given how large the public sector contributes to local demand (Chart 3), the ANC will see pushback by trade unions and those that have been in its growing employ. However, pushback will not necessarily translate into an irreversible breakdown of political support. Trade unions have been part and parcel of the ANC since the party’s inception. The party will have to strike a balance to keep the unions on its side. Bottom Line: Under Ramaphosa’s leadership, government austerity measures will continue at least over the short to medium term but will most likely be balanced to ensure the ANC maintains control through the 2024 elections. Ramaphosa Strengthens The ANC Civil unrest is nothing new in South Africa. There have been various displays of civil unrest and riots in recent years. The most recent civil unrest led to over 300 civilian casualties, the deadliest since the apartheid era. However, casualties were mostly a result of public stampeding civilian-on-civilian violence. The government did not play a major role in these deaths compared to the Marikana massacre of 2012.2 Even then, despite the ANC facing backlash from the immediate community, the party suffered no major fallout nationally. Recent unrest was more widely spread this time around and serves as an early warning signal to the ANC that social risks are high and not abating. But as things stand, these events will not displace the ANC from power. Such events would need to occur more regularly across the entire country, for them to pose a real threat to ANC rule. Since taking the helm of the ruling party in late 2017, Ramaphosa is viewed a lot more favorably than his predecessor, Zuma, by most South Africans. Ramaphosa is more business friendly, transparent, and is at least trying to weed out corruption in government. The public view of Ramaphosa’s handing of COVID-19 has been improving. Even supporters of the Democratic Alliance, the official opposition, and the Economic Freedom Fighters, a radical far-left party, have shown a large improvement in their approval of Ramaphosa’s handling of the pandemic (Chart 4). The Economic Freedom Fighter’s growth has largely been driven by disgruntled ANC supporters in recent years. Seeing supporters of the Economic Freedom Fighters improve their approval of Ramaphosa is positive for the ANC in upcoming elections.
Chart 4
The ANC has two significant backstops to any deep erosion of their voter base: feudalism and social grants. Feudalism is defined as a socioeconomic structure in which people work for a leader of a community or tribe who in return, give them protection and use of land. It still runs deep in South Africa and across its cultures and tribes. It gives life to the ANC, a strong base that the Economic Freedom Fighters will always have a tough time chipping away at. Rural voters matter most to the ANC and mostly live under feudal rule. Tribal leaders and village chiefs play a major part in everyday life for rural people. There is overwhelming support among these leaders for the ANC because the ruling party provides them with access to land, among other things. By contrast, the Democratic Alliance and the Economic Freedom Fighters have had little success in penetrating these barriers. Support for both of these parties is driven by urban dwellers. The overarching royal Zulu family is the biggest factor contributing to feudalism. The Zulu family will always support the ANC and ensure their people do too. The Zulus are the largest tribe of black South Africans and have significant interests in the ANC maintaining power, such as access to land and financial resources. Obviously they have historic ties to the founding of the ANC and past leaders of the ANC, including Zuma (but not Ramaphosa). Additionally, the tripartite alliance of trade unions, the South African Communist Party, and the ANC has always ensured that workers represented in labor unions across the country voted for the ANC. The candidate elected president of the ANC, and ultimately the country, has always had the backing of trade unions, represented by the largest, the Congress of South African Trade Unions.3 The Congress of South African Trade Unions has never waived their support of the ANC in any elections and have shown no interest in supporting any other parties. The social grants system is the second backstop. The ANC provides social payments to 22% of the population, of which approximately 76% of recipients vote for the ANC (Chart 5, top panel). That’s a significant amount of the population that will forego a large part of their economic livelihoods if they vote for the Economic Freedom Fighters or another party to rule the country. In the current climate of COVID-19, foregoing government grants in order to vote for another party will not happen. Voters are increasingly worried about losing their social grants if another party comes into power (Chart 5, bottom panel). While other parties like the Economic Freedom Fighters have promised to more than double the going social grant rate if they come to power, social grant recipients and ANC voters at large have not budged on this “promise.” A sure thing today is better than a gamble tomorrow. But, if the fiscal standing of the country teeters into a position whereby the ANC fails to meet its growing social grant liabilities, then the Economic Freedom Fighters will gain the most, even if its promises will be extremely difficult to back up. Upcoming municipal elections in November 2021 will put to the test whether the ANC will shed support like it did in the 2016 election (Chart 6, top panel). Under Zuma, the ANC’s losses were the Economic Freedom Fighter’s gains. In the 2019 general election this transfer of votes lost some momentum because of Ramaphosa’s ability to galvanize support for the ANC (Chart 6, bottom panel). The Economic Freedom Fighter’s rise has been driven by the party’s ability to berate the ANC on its systemic corruption, embodied in Zuma. With Zuma in jail and Ramaphosa cleaning up the party and government, the Economic Freedom Fighters will lose momentum in forthcoming elections.4
Chart 5
Chart 6
To the ANC’s benefit, opposition parties that won some significant metros in the 2016 municipal elections subsequently formed coalitions that have largely failed to govern well. Specifically, in the economic capital of Johannesburg, the ANC reclaimed a majority to govern the city through coalitions with smaller parties, after the Democratic Alliance and Economic Freedom Fighters governed the city following the 2016 election. While the ANC has only reclaimed one of three metros lost in the 2016 municipal elections, they have benefited from lackluster service delivery by opposition parties which has shown that there is no realistic alternative to the ANC right now.5 Bottom Line: As Ramaphosa cleans up the ANC and government, the ANC will shed less support to the EFF and look to claw back lost voters in forthcoming elections. Introducing Our South Africa GeoRisk Indicator Recent civil unrest in South Africa presents an ideal backdrop to introduce a new GeoRisk Indicator to our existing suite of thirteen indicators. Our newly devised South Africa GeoRisk Indicator captures moments of significant political risk in the past, including this year’s civil unrest, and currently signals that the country is facing a geopolitical and political risk level last seen in 2016, when President Zuma was on his way out of office (Chart 7). Chart 7South Africa Geopolitical Risk Indicator
South Africa Geopolitical Risk Indicator
South Africa Geopolitical Risk Indicator
The South Africa indicator is based on the rand and US dollar exchange rate (ZAR/USD) and its deviation from four underlying macro variables that should otherwise explain its economic trend. These variables are: gold prices, emerging market equities, industrial production, and retail sales. The four variables cover South Africa’s commodity dependency, financial sector, and the supply and demand side of the domestic economy. All four variables exhibit sufficient correlation with the ZAR/USD for use in this indicator. If the ZAR/USD weakens relative to these variables, then a South Africa-specific risk premium is apparent. As with previous indicators, we ascribe that premium to politics and geopolitics, although this is a generalization, and a qualitative assessment must always be made. The indicator is effective in tracking the country’s recent history too. Events such as ex-President Zuma’s general election win in 2009, and his controversial firing of several finance ministers in late 2015, signal an increase in risk. Meanwhile, lower risk was implied when current president, Ramaphosa, was elected president of the ANC in late 2017, and later, in 2019, as president of the country. Some additional events worth highlighting include: (1) In late 2001 to mid-2002, the local currency lost significant value relative to the US dollar for several reasons. First, the 1998 Asia financial crisis continued to send aftershocks throughout the emerging markets. The ZAR was put through the ringer in forward markets by speculators on a frequent basis, buying cheaper in the spot and driving speculation in the forward market, making easy returns. This speculation was only compounded by the South African Reserve Bank’s intervention in the local currency market to curtail speculation through regulatory action. Second, money supply grew substantially from mid-2001 to early 2002, which is associated with exchange rate undershooting.6 Thirdly, adding to these factors, contagion risk from neighboring Zimbabwe, which was dealing with land seizures and food shortages at the time, played into risk aversion toward regional and South African assets. (2) Eskom, South Africa’s state-owned power utility company, implements more regular power outages amid struggles to supply rising demand. (3) Despite allegations of corruption, former President Zuma wins the ANC presidential nomination. Zuma becomes party president. (4) Former President Zuma wins the general election (5) Former President Zuma fires well-respected then finance minister Nhlanhla Nene (6) Former President Zuma fires well-respected then finance minister Pravin Gordhan (7) President Ramaphosa wins the ANC presidential nomination. Ramaphosa becomes party president. (8) Former President Zuma resigns from the presidency (9) Former US President Donald Trump tweets on white farm murders in South Africa7 (10) President Ramaphosa wins the general election (11) First COVID-19 case is reported (12) Civil unrest and looting In terms of South African assets, when geopolitical and political risk rises, investors favor alternative emerging market assets (Chart 8). In 2021, South African equities have climbed to levels last seen in 2018 on the back of an improving global growth outlook and swelling commodity prices. But recent civil unrest has seen local equities pull back a notch. If risks escalate further, local assets will continue to retreat. Chart 8Geopolitical Risk Signals Move To Alternative Bourses
Geopolitical Risk Signals Move To Alternative Bourses
Geopolitical Risk Signals Move To Alternative Bourses
Investment Takeaways Table 1 provides a snapshot of equity performance, volatility, and relative valuations and momentum in South Africa compared to frontier markets, including African frontier markets, and emerging markets. Table 1South Africa And African Frontier Markets: Valuations, Momentum, Volatility
South Africa: Ruling Party Will Stay
South Africa: Ruling Party Will Stay
Chart 9Wait And See On Frontier Markets
Wait And See On Frontier Markets
Wait And See On Frontier Markets
Equity returns in South Africa have notched good gains as global growth picks up alongside rising commodity prices. On a risk-adjusted basis, however, Nigeria and Kenya are more attractive. The general aggregates of Frontier and African frontier markets are more attractive on the same basis. Price and timing wise, Table 1 shows valuations and momentum relative to other markets. South Africa is cheap but Nigeria is cheaper. On a cyclical basis, South Africa has more to offer than Nigeria. African countries such as Nigeria and Ghana are all prepped to move higher in the wake of cheaper currencies. But a widening financial crisis in China is a risk to these countries given how they have trended closely with Chinese total social financing (Chart 9). Meanwhile, Kenyan equities have outperformed. South African equities in US dollar terms have retreated somewhat following recent civil unrest and some contagion linked to China’s Evergrande crisis (Chart 9, second panel). If China secures its economic recovery, then higher commodity prices will boost miners and industrial stocks going forward. But this is not guaranteed. Upcoming municipal elections will aid investors in determining what to expect from the policy backdrop. We expect that the ANC will stabilize, i.e. not lose control of more cities, and this should throw some impetus back into local equities. Conclusion This year’s civil unrest was stark and disruptive but does not spell fundamental political destabilization or the end of ANC rule in upcoming elections. The South African economy is structurally weak and, aside from a bounceback on the post-pandemic recovery, will continue to lag its peers until the ANC and Ramaphosa get a solid grip on allocating state funds more efficiently, promoting a more friendly and stable business environment, and fighting corruption. Undertaking fiscal austerity now is not a bad thing for the ANC, but it will become an increasing political liability leading up to the next general election. Ramaphosa will have to pull the plug on fiscal cost cutting as soon as 2023, so as to allow demand to recover before voters head to the polls again in 2024. But this has longer term economic implications. Public debt will continue to rise in this case and add to debt default risk and debt servicing costs. If austerity is reinstated after elections, the South African economy will remain in a low growth trap. For now, tightening the fiscal belt is doable because of the dynamic created by the downfall of Zuma, giving support to austerity as a means of cutting back corruption, and the pandemic, which reinforces the ANC as the institutional ruling party during a time of national crisis. Guy Russell Research Analyst GuyR@bcaresearch.com Appendix The market is the greatest machine ever created for gauging the wisdom of the crowd and as such our Geopolitical Risk Indicators were not designed to predict political risk but to answer the question of whether and to what extent markets have priced that risk. Our South African GeoRisk Indicator (see Chart 8 above) makes use of the same methodology used for all thirteen of our other indicators. The methodology avoids the pitfall of regression-based models. We begin with a financial asset that has a daily frequency in price, in this case the ZAR/USD, and compare its movement against several fundamental factors. These factors are the price of gold in US dollars, emerging market equities in US dollar terms, South African industrial production, and South African retail sales. Like our recently added Australia GeoRisk Indicator, South Africa is a commodity exporting country. South Africa is the largest producer of platinum in the world, and was the seventh largest gold producer by volume in 2019. Gold is South Africa’s largest export and the ZAR has a strong historic correlation to gold prices.8 Hence we use gold prices instead of platinum, which is less well correlated. South Africa also has a deep financial market, with lose capital controls and easy flow of funds. When sentiment toward EM equities is high, the ZAR benefits, and hence our inclusion of emerging market equities. On the supply and demand side of the economy, both industrial production and retail sales show a strong relationship with the ZAR. We include these as the last two variables measured in our indicator. All four variables exhibit strong correlation with the local currency. If the currency sharply underperforms them, then it must be weighed down by some risk premium, which we ascribe to domestic political and policy developments or the general geopolitical environment. Footnotes 1 In 2018, President Cyril Ramaphosa laid out a target of $100 billion in new investments over the next five years, primarily targeting primary and secondary industries. According to The United Nations Conference on Trade and Development, foreign direct investment flows into South Africa in 2020 almost halved to $2.5 billion from $4.6 billion in 2019, which was a 15% decline from around $5.4 billion in 2018. 2 The Marikana massacre was the killing of 34 miners by the South African Police Service. It took place on 16 August 2012 and was the most lethal use of force by South African security forces against civilians since 1976. 3 According to the International Labour Organization, South Africa’s union density rate was 28.1% in 2016. Strikingly, the public sector union density rate was approximately 70.1% compared to 29.1% in the private sector. 4 In June 2021, ex-President Jacob Zuma was sentenced to 15 months imprisonment for contempt of court, by failing to legally attend a tribunal on corruption in South Africa. Zuma has recently been released on medical parole. 5 In the 2016 municipal elections, the ANC lost control of three major metros. Pretoria (political capital), Johannesburg (economic capital) and (Port Elizabeth, or Nelson Mandela Bay). The official opposition (the Democratic Alliance) and the Economic Freedom Fighters formed governing coalitions in all three of the lost ANC metros. Opposition coalitions have struggled to govern more effectively than what the ANC did, given how far apart they are ideologically. In Pretoria and Nelson Mandela Bay, service delivery has been poor since, in line with ANC rule prior to 2016. In Johannesburg, the ANC won back the metro by forming a coalition with several smaller parties. Opposition coalitions are still in force in Pretoria and Nelson Mandela Bay. 6 Bhundia, A.J. and Ricci, L.A., 2005. The Rand Crises of 1998 and 2001: What have we learned. Post-apartheid South Africa: The first ten years, pp.156-173. 7 Donald Trump tweets "I have asked Secretary of State @SecPompeo to closely study the South Africa land and farm seizures and expropriations and the large scale killing of farmers." The South African government have not seized any farms nor have there been any recordings of large-scale farm killings. The tweet caused a minor sell-off in local assets at the time. 8 Arezki, Rabah & Dumitrescu, Elena-Ivona & Freytag, Andreas & Quintyn, Marc. (2012). Commodity Prices and Exchange Rate Volatility: Lessons from South Africa’s Capital Account Liberalization. Emerging Markets Review. 19. Jordaan, F. Y., & Van Rooyen, J. H. (2011). An empirical investigation into the correlation between rand currency indices and changing gold prices. Corporate Ownership & Control, 9(1-1), 172-183.

Weekly Performance Update For the week ending Thu Oct 21, 2021 The Market Monitor displays the trailing 1-quarter performance of strategies based around the BCA Score. For each region, we construct an equal-weighted, monthly rebalanced portfolio consisting of the top 3 stocks per sector and compare it with the regional benchmark. For each portfolio, we show the weekly performance of individual holdings in the Top Contributors/Detractors table. In addition, the Top Prospects table shows the holdings that currently have the highest BCA Score within the portfolio. For more details, click the region headers below to be redirected to the full historical backtest for the strategy. BCA US Portfolio
Image
Total Weekly Return BCA US Portfolio S&P500 TRI 0.81% 2.52% Top Contributors MMP:US TGT:US SHW:US WAT:US GRMN:US Weekly Return 22 bps 16 bps 15 bps 13 bps 13 bps Top Detractors SIM:US KOF:US AMN:US PM:US MBT:US Weekly Return -20 bps -9 bps -9 bps -7 bps -6 bps Top Prospects AMN:US GOOG.L:US KOF:US WAT:US MPLX:US BCA Score 95.32% 92.78% 92.55% 91.15% 90.42% BCA Canada Portfolio
Image
Total Weekly Return BCA Canada Portfolio S&P/TSX TRI 1.52% 1.89% Top Contributors STN:CA ONEX:CA BTE:CA SMU.UN:CA ATZ:CA Weekly Return 32 bps 24 bps 20 bps 16 bps 14 bps Top Detractors IFP:CA TOU:CA TOY:CA EMP.A:CA H:CA Weekly Return -19 bps -12 bps -8 bps -8 bps -5 bps Top Prospects ELF:CA WIR.UN:CA TOU:CA IMO:CA TOY:CA BCA Score 97.98% 96.59% 96.56% 94.60% 93.58% BCA UK Portfolio
Image
Total Weekly Return BCA UK Portfolio FTSE 100 TRI 0.88% -0.22% Top Contributors DEC:GB YOU:GB NLMK:GB N91:GB VVO:GB Weekly Return 19 bps 16 bps 15 bps 14 bps 14 bps Top Detractors KETL:GB FXPO:GB BVIC:GB STEM:GB MGNS:GB Weekly Return -20 bps -11 bps -10 bps -7 bps -6 bps Top Prospects VVO:GB ROSN:GB SVST:GB TUNE:GB JHD:GB BCA Score 99.54% 99.09% 98.39% 96.40% 96.39% BCA Eurozone Portfolio
Image
Total Weekly Return BCA EMU Portfolio MSCI EMU TRI 0.78% 0.52% Top Contributors TTALO:FI SOF:BE BSL:DE SHUR:BE PMAG:AT Weekly Return 15 bps 12 bps 11 bps 11 bps 10 bps Top Detractors ERF:FR SES:IT SOL:IT ARG:FR FSKRS:FI Weekly Return -16 bps -8 bps -5 bps -4 bps -4 bps Top Prospects ROTH:FR HLAG:DE FSKRS:FI STR:AT SOL:IT BCA Score 98.71% 98.00% 97.79% 96.11% 95.97% BCA Japan Portfolio
Image
Total Weekly Return BCA Japan Portfolio TOPIX TRI 0.69% 0.70% Top Contributors 8097:JP 4958:JP 8739:JP 6676:JP 9436:JP Weekly Return 15 bps 15 bps 12 bps 7 bps 7 bps Top Detractors 3003:JP 2208:JP 9532:JP 8133:JP 9543:JP Weekly Return -11 bps -10 bps -4 bps -3 bps -3 bps Top Prospects 6960:JP 9436:JP 9882:JP 9422:JP 4544:JP BCA Score 99.41% 99.39% 99.23% 98.77% 97.35% BCA Hong Kong Portfolio
Image
Total Weekly Return BCA Hong Kong Portfolio Hang Seng TRI -0.14% 4.23% Top Contributors 316:HK 3306:HK 2768:HK 1600:HK 323:HK Weekly Return 30 bps 19 bps 10 bps 9 bps 9 bps Top Detractors 6118:HK 1708:HK 1277:HK 1967:HK 1866:HK Weekly Return -67 bps -25 bps -13 bps -12 bps -8 bps Top Prospects 1277:HK 746:HK 857:HK 1088:HK 43:HK BCA Score 100.00% 99.66% 98.36% 97.78% 97.05% BCA Australia Portfolio
Image
Total Weekly Return BCA Australia Portfolio S&P/ASX All Ord. TRI 0.76% 1.43% Top Contributors SXY:AU PWH:AU MHJ:AU AVN:AU ZIM:AU Weekly Return 52 bps 21 bps 18 bps 18 bps 18 bps Top Detractors CGS:AU NHC:AU ABB:AU ERA:AU MMS:AU Weekly Return -27 bps -26 bps -13 bps -13 bps -11 bps Top Prospects MHJ:AU RIC:AU BLX:AU ADI:AU CDD:AU BCA Score 99.51% 98.87% 98.07% 97.81% 97.71%
Who Likes A Flattening Yield Curve?
Who Likes A Flattening Yield Curve?
In a recent daily report, we analyzed relative performance of the S&P 500 sectors and styles under different US 10-year Treasury yield (UST10Y) regimes. Today we expand our analysis and map relative performance of the S&P 500 sectors and styles under the distinct US Treasury yield curve regimes, defined as a three-months change between 10-year and 2-year yields. To analyze sector and style performance by regime, we calculate contemporaneous three-months relative returns of sectors and styles. To summarize the results, we calculate median relative return of each sector/style in each regime. We subtract total period median to remove the sector and style biases in the long-term performance. In a flattening yield curve environment, Defensives, Quality, and Growth tend to outperform, as it indicates scarcity of growth. Accordingly, Real Estate, Technology, Utilities, and Communications Services also outperform. Yield curve steepening is usually associated with growth acceleration. This regime gives boost to more economically sensitive and capex intensive sectors and styles: Value, Small caps, and Cyclicals. Bottom Line: The shape of the US Treasury yield curve will be an important variable to monitor going forward, as it has a substantial effect on relative sector and style performance.
Highlights Liquidity conditions in Bangladesh are easy and growth has revived. Exports are set to recover as well. Foreign reserve accumulation will continue, which will have positive implications for the economy and stock prices. Steadily rising capital expenditure has improved the economy’s productivity and competitiveness. Progress towards gender and income equality has also been impressive. Growth will stay strong and steady, which warrants higher equity multiples. Bangladeshi stocks also have low correlation with their EM and Emerging Asian counterparts, providing diversification benefits. Absolute return investors should buy this market on dips. Dedicated EM/Frontier market equity portfolios should consider overweighting Bangladeshi stocks. Feature A new business cycle appears to be unfolding in Bangladesh. Domestic demand has picked up. Exports are slated to rise as well. The country’s structural progress also continues to be impressive. Not surprisingly, stocks have gone up in tandem. Yet, high and rising oil prices may lead to a pause in the rally. Absolute-return investors with a time horizon of more than one year should therefore consider accumulating equities on dips. Dedicated equity investors should consider adding the very ‘low-correlation’ Bangladeshi equity market to an EM Asia/EM equity portfolio (Chart 1). External Tailwinds Bangladesh’s foreign reserves have surged to a new high. This has been a very positive development for both the economy and stock prices (Chart 2). Chart 1Bangladeshi Stocks Will Benefit From Liquidity Tailwinds
Bangladeshi Stocks Will Benefit From Liquidity Tailwinds
Bangladeshi Stocks Will Benefit From Liquidity Tailwinds
Chart 2Foreign Reserves, M1 And Stock Prices
Foreign Reserves, M1 And Stock Prices
Foreign Reserves, M1 And Stock Prices
Chart 3Both Current And Capital Account Balances Have Improved
Both Current And Capital Account Balances Have Improved
Both Current And Capital Account Balances Have Improved
The country’s balance of payments (BoP) has improved substantially in the last couple of years. The improvement can be attributed to both current and capital accounts: The current account deficit has narrowed significantly since 2018. The improvement will likely persist as the outlook of its two main components are both promising: Remittances have surged to an all-time high of $25 billion over the past 12-months. In the coming year too, it will likely stay buoyant thanks to a 2% incentive scheme that the government introduced on inward remittances (Chart 3, top panel). The second major component, the trade deficit, will likely stabilize. This is because exports are set to pick up, in part due to rising orders from the EU, Bangladesh’s prime export destination (Chart 4). The recent surge in trade credit inflows also implies a significant rise in export revenues in the coming months (Chart 5). That said, high oil prices, if they remain as such, will lead to higher import bills. Crude and petroproducts make up about 10% of Bangladesh’s import costs and can be a headwind to the trade balance, and by extension, stock prices. Chart 6 shows that stock prices accelerate when oil prices are low, but struggle when oil prices rise. Chart 4Strong EU Orders Means Exports Are Set To Accelerate Further
Strong EU Orders Means Exports Are Set To Accelerate Further
Strong EU Orders Means Exports Are Set To Accelerate Further
Chart 5A Surge In Trade Credit Also Implies Strong Export Numbers Ahead
A Surge In Trade Credit Also Implies Strong Export Numbers Ahead
A Surge In Trade Credit Also Implies Strong Export Numbers Ahead
Capital account inflows have risen sharply too. The rise is due mainly to surging trade financing inflows (as mentioned above), and elevated government foreign borrowing (Chart 3, bottom panel). Going forward, trade financing inflows can remain at a high level if the country continues to obtain the same volume of export orders. The government’s foreign borrowing may also persist. Notably, this long-term financing is mostly used to import capital goods – something that the country needs for its investment and infrastructure projects (Chart 7). With Bangladesh’s ever-rising capital expenditure, such long-term capital inflows – either in the form of government borrowing, or FDI, or a combination of two – will likely continue. If so, this will not only help boost the country’s BoP in the short-term, but it will also be a long-term positive for Bangladesh since capital spending will help improve productivity. Chart 6Stocks Struggle Whenever Oil Prices Rise Too Much
Stocks Struggle Whenever Oil Prices Rise Too Much
Stocks Struggle Whenever Oil Prices Rise Too Much
Chart 7Government's Foreign Borrowings Help Finance Infrastructure Projects
Government's Foreign Borrowings Help Finance Infrastructure Projects
Government's Foreign Borrowings Help Finance Infrastructure Projects
Overall, odds are that the BoP will stay in healthy surplus, thus allowing the central bank continue to accumulate foreign exchange reserves. This has major ramifications for the domestic economy. Rising foreign reserves augment domestic money supply. Stronger money supply is bullish for the economy, and in turn, stock prices (Chart 2, above). Growth Has Revived Domestic demand has revived. Manufacturing has risen to well-above pre-pandemic levels. Robust economic activity is also vouched for by strong electricity generation (Chart 8). What’s more, the recovery will likely have legs as a new credit cycle could well be unfolding. For one, banks are flush with excess reserves – usually a precursor to rising credit going forward. This is because the Bangladeshi central bank uses excess reserves to achieve its monetary policy objectives1 (Chart 9). Chart 8Bangladesh's Domestic Growth Has Revived Well Beyond Pre-Pandemic Levels
Bangladesh's Domestic Growth Has Revived Well Beyond Pre-Pandemic Levels
Bangladesh's Domestic Growth Has Revived Well Beyond Pre-Pandemic Levels
Chart 9A Deluge Of Excess Reserves Will Help Kickstart A New Credit Cycle
A Deluge Of Excess Reserves Will Help Kickstart A New Credit Cycle
A Deluge Of Excess Reserves Will Help Kickstart A New Credit Cycle
Chart 10Banks' NPL Problems Have Abated Marginally
Banks' NPL Problems Have Abated Marginally
Banks' NPL Problems Have Abated Marginally
Incidentally, the central bank is planning to engineer an acceleration in its domestic credit growth rate to 17.8% by June 2022, up from 10.3% in June 2021. It is also planning to augment the broad money growth to 15% from 13.6% in June 2021 as part of its 2021-22 policy objectives. That means the monetary policy setting will remain very accommodating in the foreseeable future, paving the way for a new credit cycle. Notably, the country’s inflation is under control, with both headline and core CPI hovering around 5 - 6% over the past few years. Wage growth has also been broadly in line with consumer inflation and shows no sign of accelerating. Contained wages and consumer price inflation will make the central bank’s plan to run easy policy more feasible. Meanwhile, the banks’ bad loan problems have abated somewhat. As per the latest data from the IMF, the banking system’s gross NPL ratio has fallen to 8.1%, and its net NPL ratio to 4.6% as of Q1 this year (Chart 10, top panel). The lingering NPLs are concentrated in a handful of state-owned banks whose role in the economy has steadily diminished and which now hold about 20% of the banking sector loans. Banks' capital adequacy ratios are also decent at 11.6% and 7.8% (for Tier I capital) respectively (Chart 10, bottom panel). Hence, banks will likely be more willing to expand their loan books going forward which should help propel economy. Chart 11Bangladesh Has Notched Up Impressive Growth Without Any Credit Gush
Bangladesh Has Notched Up Impressive Growth Without Any Credit Gush
Bangladesh Has Notched Up Impressive Growth Without Any Credit Gush
Remarkably, over the past decade, Bangladesh has been able to notch up a robust growth rate of 7%+ without any credit gush in the economy. Domestic credit, at 48% of GDP, is at the same level as it was ten years ago (Chart 11). Hence, should a new credit cycle unfold, Bangladeshi’s growth rate will likely move up a notch higher than it has been in the recent past. The country’s fiscal stance is not going to be tight either. The parliament has passed a budget for the 2021-22 fiscal year (July – June) that envisages a nominal spending growth of 6.3%. Incidentally, government debt is rather low at 23% of GDP. Including the debt held by all the public corporations (concentrated in public financial corporations), gross public debt goes up to 56% of GDP - still a manageable figure. Real government borrowing costs are low as well. The 10-year nominal bond yield is at 6%; in real terms (deflated by non-food CPI), it is 0%. Thus, fiscal authorities have the wherewithal to ramp up borrowing and spending to stimulate the economy should there be a need. Robust Structural Backdrop Structurally, the Bangladeshi economy is remarkably resilient. The growth rate has not only been very steady but has also seen acceleration over the past quarter century. This is in sharp contrast to the boom-and-bust cycles experienced in most other developing nations (Chart 12). Even during the recent pandemic, Bangladesh has been one of the rare countries where growth has remained positive. Importantly, factors behind this stable growth are likely to persist: Bangladesh has done very well to ramp up its capital expenditure to a substantial 32% of GDP, one of the highest rates globally (Chart 13, top panel). This has helped the economy gain competitiveness over time – which is evident in the continued improvement in its net exports volume (Chart 13, bottom panel). Chart 12Bangladeshi Economy Has Been Devoid Of Boom-Bust Cycles
Bangladeshi Economy Has Been Devoid Of Boom-Bust Cycles
Bangladeshi Economy Has Been Devoid Of Boom-Bust Cycles
Chart 13Strong And Rising Capex Has Led To Higher Competitiveness
Strong And Rising Capex Has Led To Higher Competitiveness
Strong And Rising Capex Has Led To Higher Competitiveness
Strong capex has also been instrumental for the economy to grow at a very robust 6-7% rate for decades at a stretch and yet keep inflation under control. This indicates that productive capacity and labor productivity have been rising. Inflation is often a binding constraint to fast growth over a prolonged period of time. Bangladesh’s productivity growth rates have indeed risen to among the highest rates globally, the pandemic-hit last year being a deviation from the long-term trend (Chart 14). What’s more, given the sustained investment in productive capacity and the still low absolute level of labor productivity – compared to other East and South-east Asian economies – Bangladesh should continue to see robust productivity gains in the foreseeable future. Bangladesh specializes in a staple consumer product: textiles. Rising productivity has helped export volumes quintuple over the past two decades; handily beating both emerging markets and global exports volume growth. Incidentally, in common currency terms, the relative wage ratio between Bangladesh and China has been flat at a low level. This has helped Bangladesh remain competitive and continue to expand its global export market share (Chart 15). Chart 14Bangladesh's Productivity Growth Rate Is Among The Best Globally
Bangladesh's Productivity Growth Rate Is Among The Best Globally
Bangladesh's Productivity Growth Rate Is Among The Best Globally
Chart 15Bangladesh Has Been Consistently Gaining Market Share In Global Trade
Bangladesh Has Been Consistently Gaining Market Share In Global Trade
Bangladesh Has Been Consistently Gaining Market Share In Global Trade
The country’s demographic outlook is also positive. The working age population as a share of the total is projected to rise for another decade.2 Together, strong productivity growth and a rising labor force will ensure an enviable potential growth rate of around 7 - 8% over the next decade. Inclusive, Sustainable Growth Economic factors aside, strong and steady growth in Bangladesh also owes much of its achievements to social progress. Over the past few decades, the country has attained significant improvements in various human development areas: Bangladesh boasts of one of the highest female participation rates in its labor force in the Muslim world. At 36%, this is almost twice as high as the Middle East & North Africa (20%), Pakistan (22%), and neighboring India (21%) – as per the World Bank. In the fledgling textile industry in Bangladesh, over 75% of workers are women. The country pioneered microcredit, which by design mostly goes to women. The social fabric of the country is changing as women are now much more likely to make family / economic decisions. Spending on children’s food, health and education has gone up. Women’s fertility rates have gone down significantly. At the same time, infant / maternal mortality rates have witnessed one of the fastest declines seen anywhere globally. Chart 16Bangladesh’s Income Inequality Has Remained Low As Growth Has Been Inclusive
Bangladeshi Equities: Buy On Dips
Bangladeshi Equities: Buy On Dips
Bangladesh’s income inequality – as measured by the Gini index – is one of the lowest in the world (Chart 16). What’s more, despite strong growth, inequality has not risen over the past 25 years. This is in stark contrast to many other advanced and developing countries. Such inclusive growth has rendered the society more equitable, making growth itself more sustainable. Bangladeshis have largely embraced their more liberal linguistic identity over their religious identity. For context, Bengali-speaking Bangladesh was born out of an extremely violent secession from the Urdu-speaking people of Pakistan in 1971 as the former realized that culturally their linguistic identity supersedes their religious identity.3 As such, the vast majority of Bangladeshis practice a moderate form of Islam. This factor has helped to encourage such social changes as the empowerment of women and the expansion of microcredit as religious / cultural opposition has been low. These major traits of this society, including those of gender and income equality, are likely to persist in the foreseeable future. Therefore, odds are that the strong growth will continue to remain inclusive and therefore sustainable. Investment Conclusions The Bangladeshi equity market exhibits a very low and often a negative correlation with both the EM and Emerging Asian markets. In particular, periods of global risk aversions, such as in 2014-15 and early 2020 saw the correlations turn negative. This increases market attractiveness to asset allocators as it will allow them to reap diversification benefits (Chart 17). That said, this bourse has risen significantly over the past year or so and has outperformed its EM counterparts (Chart 1 in page 1). Its valuations have also risen and are now on par with their EM peers (Chart 18). As such, there could well be a period of indigestion / consolidation – especially if our view of a stronger dollar and rising US bond yields transpires, and oil prices remain elevated over the next several months. Chart 17Bangladeshi Stocks' Correlation With EM Turns Negative During Bear Markets
Bangladeshi Stocks' Correlation With EM Turns Negative During Bear Markets
Bangladeshi Stocks' Correlation With EM Turns Negative During Bear Markets
Chart 18Bangladeshi Stock Valuations Have Risen, But Are Not Excessive
Bangladeshi Stock Valuations Have Risen, But Are Not Excessive
Bangladeshi Stock Valuations Have Risen, But Are Not Excessive
Putting it all together, we recommend that absolute return investors with a time horizon of over one year should adopt a strategy of ‘buying on dips’ for Bangladeshi stocks. Dedicated EM/frontier market equity portfolios should consider overweighting Bangladeshi stocks. Finally, regarding the currency, the Bangladeshi taka will likely remain more or less stable over the next year or so. The taka rarely depreciates unless the country’s BoP begins to deteriorate materially. As explained above, that is not in the cards. Rajeeb Pramanik Senior EM Strategist rajeeb.pramanik@bcaresearch.com Footnotes 1 Bangladeshi central bank tries to control the ‘quantity’ of money/credit, rather than the ‘price (i.e., interest rate)’ to conduct its monetary policy. To explain, it controls the ‘reserve money’ growth and thereby impact the ‘broad money (M2)’ growth - to achieve its objectives on economic growth, inflation, and the exchange rate. 2 As per the United Nations’ World Population Prospects 2019. The same metric for Vietnam, Bangladesh’s main exports competitor, has peaked in 2015. 3 For a detailed account of the geopolitical outlook of Bangladesh and the larger South Asia, please see South Asia: A New Geopolitical Theatre from BCA’s Geopolitical Strategy team.
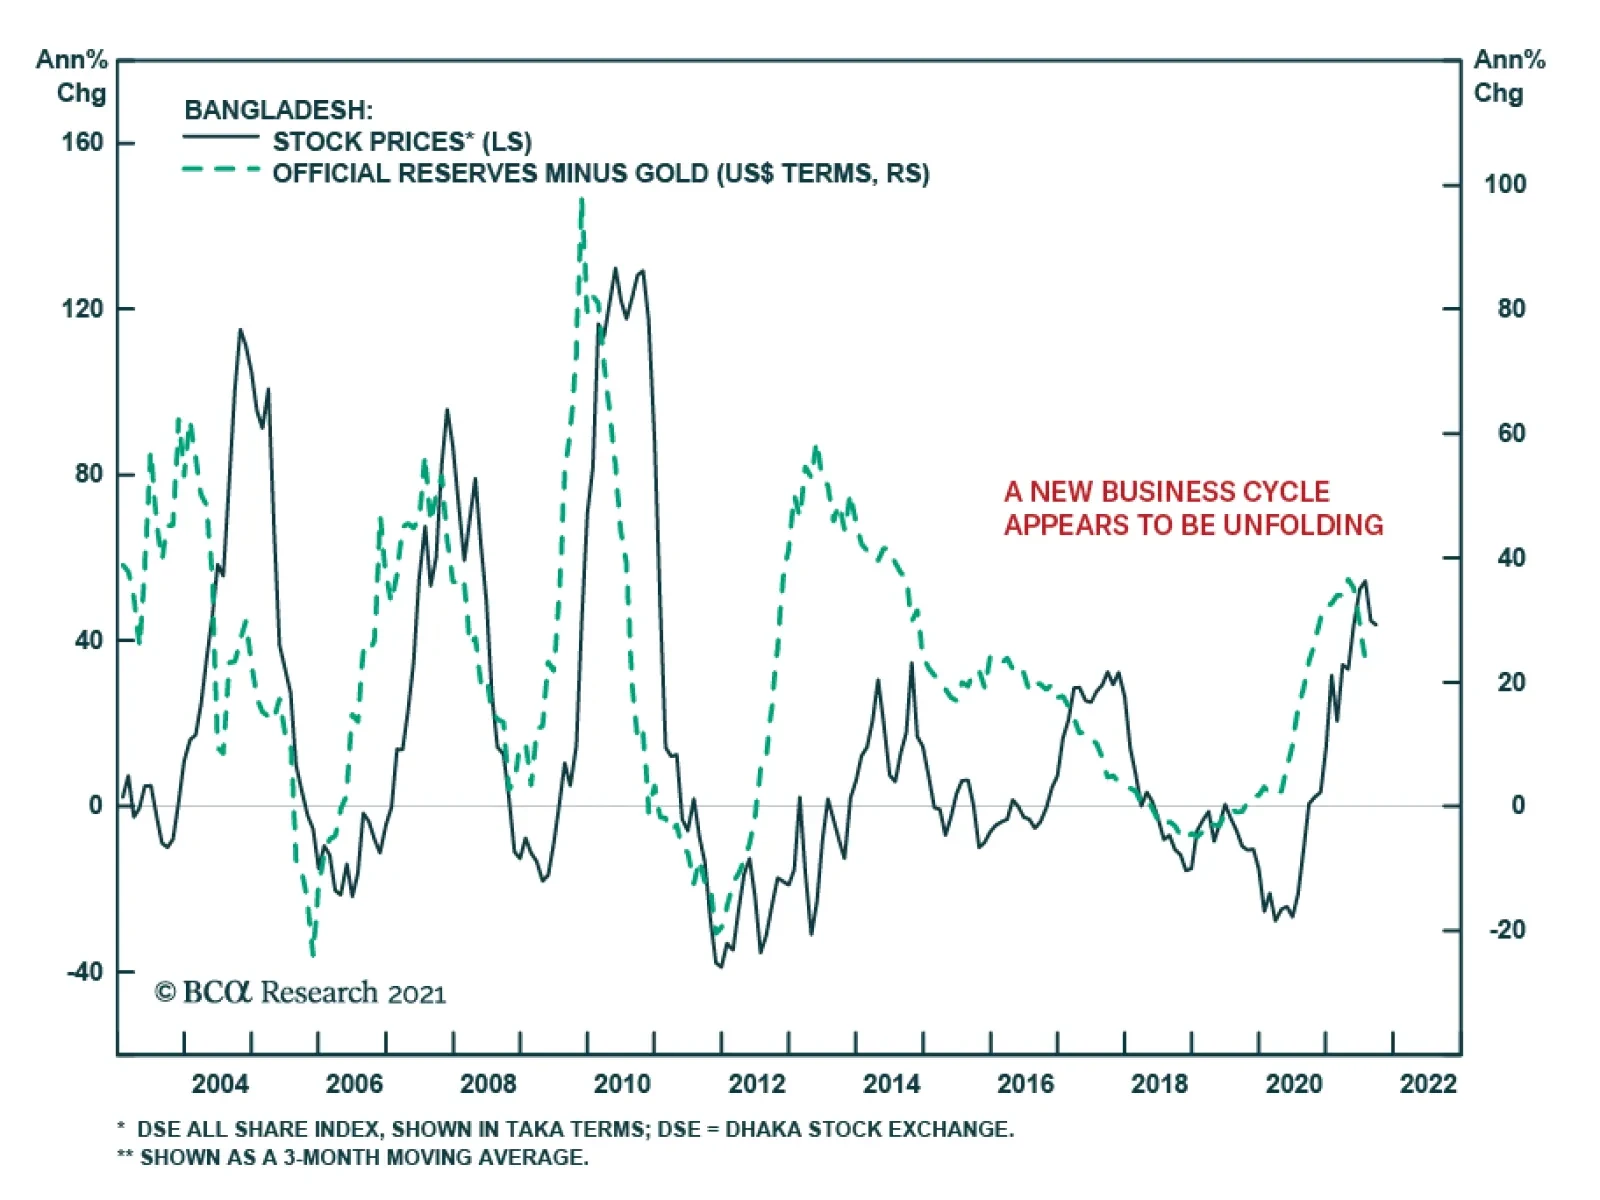
Bangladesh’s foreign reserves has surged to a new high. This has boosted both the economy and stock prices. Indeed, a new business cycle appears to be unfolding in the country. Domestic demand has picked up. Manufacturing has risen to well-above pre-pandemic…
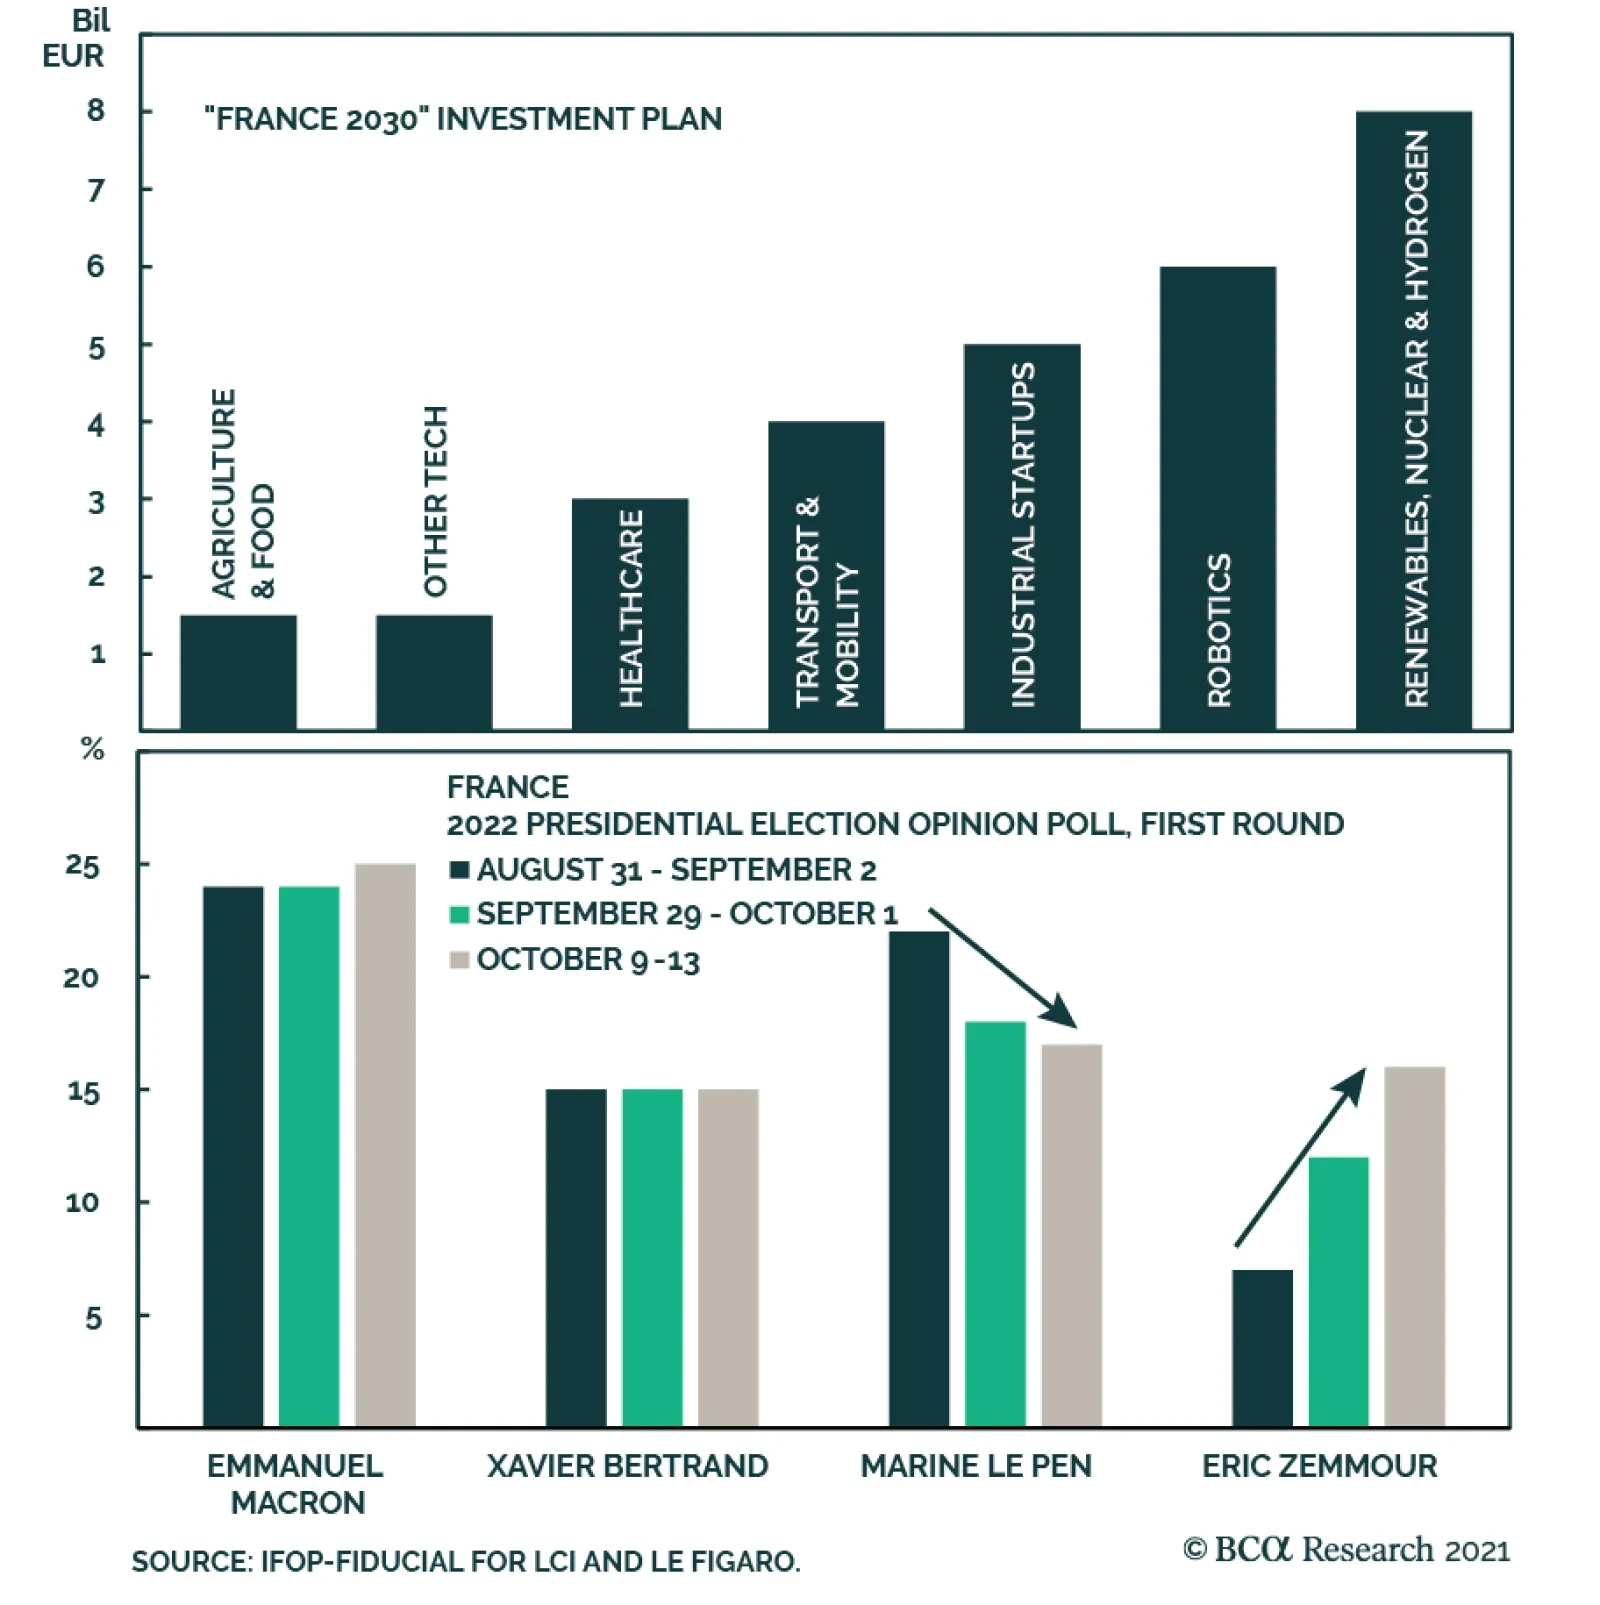
Earlier this month, French President Emmanuel Macron unveiled a EUR30 billion investment plan aimed at supporting and fostering industrial and tech “champions of the future.” This new plan comes on top of the EUR100 billion recovery package that was announced…
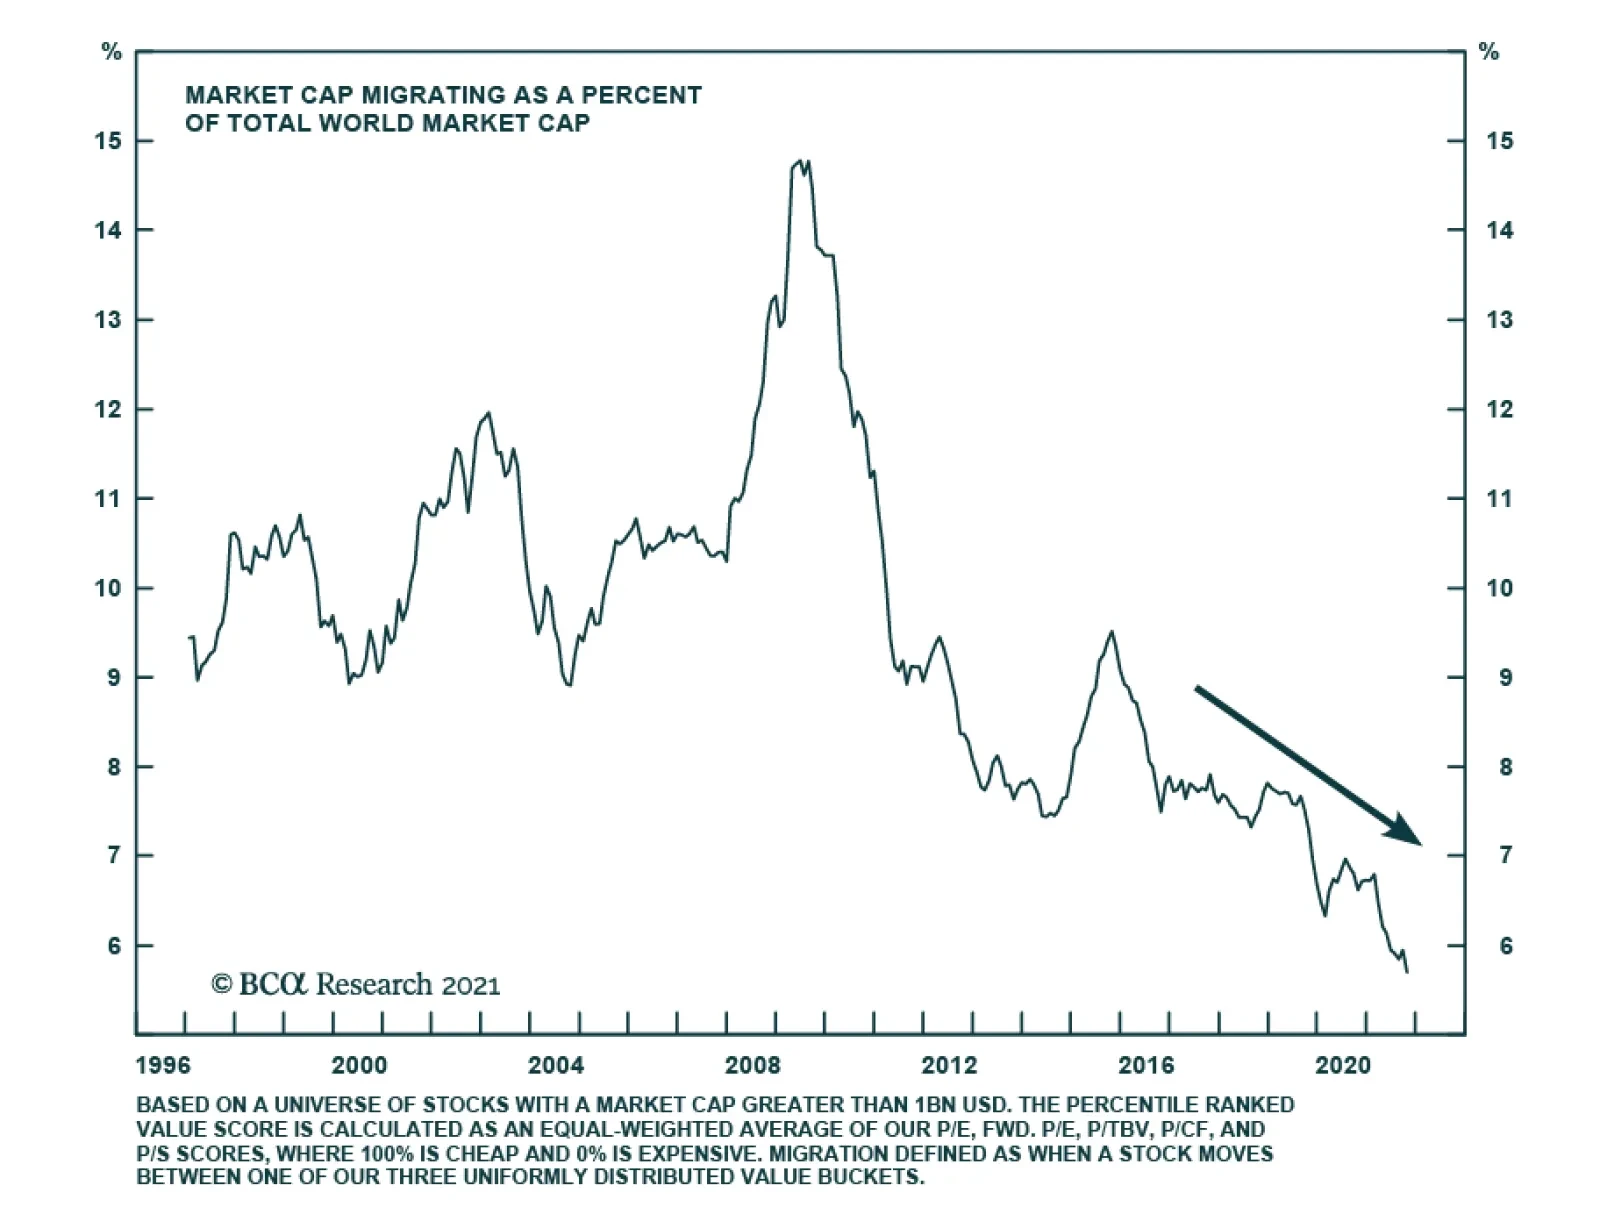
In a seminal paper, Fama and French describe the process of migration as the movement of stocks across different value buckets. An example is when stocks in the cheap bucket migrate to the neutral and expensive bucket, or when stocks in the expensive…
Highlights Economy – Everyone from banks to households to businesses is swimming in cash: The Fed’s asset purchases will continue until the middle of next year, but banks, households and businesses already have more cash than they know what to do with. Markets – The flood of liquidity may limit how much rates can rise: The biggest banks have positioned themselves to benefit from rising rates and they are all waiting for somewhat higher yields to begin deploying their excess reserves. Strategy – From the biggest banks’ perspective on the economy, risk assets look like the only place to be: Bank stocks’ relative outlook may be meh, but there’s an enormous amount of dry powder available to support economic activity, credit performance and financial asset prices. What The Banks See The SIFI banks (BAC, C, JPM and WFC) and USB got the third quarter earnings season off to a good start last week. The stock market wasn’t impressed – the stocks were mixed-to-weaker after reporting – but the big banks handily beat expectations. We think the market got it right, as they didn’t offer much of a reason to be excited about net interest income in the coming quarters, but we don’t study their results and their calls to assess the outlook for their own stocks. We do so to use the banks’ privileged vantage point to gain insight into the broad macro backdrop as revealed by the actions and intentions of households and businesses, borrower performance, lender willingness and the overall state of the financial system. They told a uniformly consistent story this quarter about copious liquidity, which is driving record low credit losses and fueling potent economic growth while continuing to weigh on consumer lending volumes. Difficulty replenishing inventories and a welcoming reception for debt and equity issues have been holding back business borrowing as well. The banks nonetheless saw some signs of life for loan demand in the last month of the quarter and they are optimistic about the consumption outlook. They are eager to lend their still growing hoard of deposits though they are unwilling to direct much of it to securities, preferring to wait for more appealing yields, which they expect are on the way. We heard plenty to affirm our constructive take on the economy through at least the end of next year. Households are spending at a rate that validates our time-release view of fiscal transfers and their incomes are rising enough to keep their checking account balances elevated even though the fiscal flows have largely ceased. Businesses remain flush and can be expected to restock depleted inventories once production and transportation logjams can be untangled. M&A activity is surging, underwriting calendars are full and trading desks have been very busy. When it comes to the banks themselves, the analyst community was focused on net interest income (NII). NII is a function of lending volumes, which will remain subdued in the near term even if they have begun to turn up, and lending margins. The latter can’t expand unless rates rise but the latest yield backup appears to have run its course with the 10-year Treasury yield easing ten basis points to 1.5% in just four sessions last week. An outward shift in the yield curve is what the banks need to outperform the S&P 500 over the rest of the year but their own opportunistic deployment of idle capital as rates rise may prove to be self-limiting. Households Are Spending (Chart 1) … Chart 1Snapback
Snapback
Snapback
[Bank of America consumer customers’ spending] was robust, … up 23% over 2019[.] September was the best month of the year and we’ve seen that spending rate continue through the first part of October. (Moynihan, BAC CEO) [C]ombined debit and credit [card] spend was up 24% versus the third quarter of 2019. Within that data, travel and entertainment spend was up 8% versus 3Q19 and very closely tracked the patterns of the Delta variant …, softening in August and early September, and reaccelerating in recent weeks. (Barnum, JPM CFO) Consumer credit card spending activity continued to increase, up 18% in the third quarter compared to 2019 and 24% compared to 2020. [T]ravel-related spending … remains the only category that has not yet fully rebounded to 2019 levels. (Scharf, WFC CEO) Sales volumes [in credit and debit cards] have been quite strong relative to 2019 and that’s driven by consumer spend. … [S]ales were about 5% higher than 2019 in merchant processing. … Looking at merchant as an example, airline, travel and entertainment are still down quite a bit and probably … flattened a bit in the third quarter, simply because of the Delta variant. But … as [Delta] kind of subsides a bit, we would expect that to start to accelerate again. (Dolan, USB CFO) … And Paying Their Bills, … Net charge-offs this quarter fell again to … 20 basis points of average loans[,] … the lowest loss rate in 50 years. … [The] continued low level of late-stage delinquency loans (Chart 2) … drives the expectation that card losses could decline yet again in Q4 before leveling off. (Donofrio, BAC CFO) [C]onsistent with last quarter, credit continues to be quite healthy. In fact, net charge-offs are the lowest we’ve experienced in recent history. (Barnum, JPM) Chart 2Net Charge-Off Rates May Not Have Bottomed Yet
The Big Bank Beige Book, October 2021
The Big Bank Beige Book, October 2021
[C]onsumer balance sheets remain unusually strong on the back of the increase in consumer net worth during the pandemic. (Fraser, C CEO) Consumers’ financial condition remains strong with leverage at its lowest level in 45 years and the debt burden below its long-term average. (Scharf, WFC) Consumer credit performance continued to improve with strong collateral values for homes and autos and consumer cash reserves remaining above pre-pandemic levels. Net [consumer] loan charge-offs declined to 23 basis points. (Santomassimo, WFC CFO) [O]ur net charge-off ratio hit a record low of 20 basis points. … [W]e expect it’s probably going to stay at these lower levels for a few quarters, and then it’s going to start to normalize. [It] probably doesn’t get back to what we would … define as normal, which is kind of 45 to 50 basis points overall, until at least the end of 2022 and probably sometime in 2023. (Dolan, USB) … But They Don’t Yet Need To Borrow (Chart 3) Chart 3US Households Have Built Up A Mountain Of Excess Savings ...
US Households Have Built Up A Mountain Of Excess Savings ...
US Households Have Built Up A Mountain Of Excess Savings ...
[C]hecking customers that had maybe $2,000 or $3,000 in balances with us, they’re sitting with three times what they had before the [pandemic] (Chart 4). … They will spend some of that, I assume, but interestingly enough [their balances have] been growing month-over-month for the last few months. [They’re] not going down even though the stimulus payments … other than childcare stopped. So one thing that bodes well for the economy … is consumer[s] still ha[ve] a lot of money in their accounts and they’re going to spend it. (Moynihan, BAC) Chart 4... And Most Of Them Are Sitting In Checking Accounts
... And Most Of Them Are Sitting In Checking Accounts
... And Most Of Them Are Sitting In Checking Accounts
[W]e expect deposit growth to continue, although it’s going to be likely at a slower rate than … so far this year. … You got to remember that … tapering is still QE. So the deposits are not likely to decline until many quarters after QE ends, if they ever do, because as the economy expands, the multiplier effect [could drive] growth in deposits, even though the money supply is coming down. (Donofrio, BAC) [W]hile the [credit card] payment rate is still very elevated, it’s come down from the highs and revolving balances have stabilized. And when we look inside our data, we see evidence of excess deposits starting to normalize in segments of the population that traditionally revolve. So … we’re optimistic about the growth prospects of revolving card balances. (Barnum, JPM) [W]e are encouraged by our household growth and balance sheet trends. However, we expect it to take some time for revolving credit card balances to return to pre-pandemic levels (Chart 5), given the amount of liquidity in the system. (Barnum, JPM) Chart 5A Direct Hit To Net Interest Margins
A Direct Hit To Net Interest Margins
A Direct Hit To Net Interest Margins
[H]ealthy consumer balance sheets and persistently elevated payment rates did mean that loan growth remained under pressure. (Fraser, C) [O]ur customers have significant liquidity, … [with] consumer median deposit balances … up 48% for customers who received federal stimulus and 40% for those who did not. (Scharf, WFC) While payment rates remain high, average [card] balances grew 3% from the second quarter, the first time [they’ve] grown since the fourth quarter of 2020. (Santomassimo, WFC) [W]e’re actually seeing ... credit card balances … start to grow and possibly accelerate as we get into 2022. When you think about customers that are kind of revolving type of customers, … with government stimulus starting to dissipate , … they are going to be looking to credit products … to support their [spending]. … [O]verall, we’re fairly bullish on consumer lending. (Cecere, USB CEO) Ditto Businesses [E]xcluding PPP loans, total … commercial loans grew [at an annualized rate of 11% on a quarter-over-quarter basis] …, but global banking utilization rates are still 700 basis points [below] 2019 [levels]. (Donofrio, BAC) C[ommercial]&I[ndustrial] loans were down 3% [quarter-on-quarter], but up 1% excluding PPP, driven by higher originations. … [C]onsistent with last quarter, we are seeing a slight uptick in utilization rates in middle market and those among larger corporates seem to have stabilized, albeit at historically low levels[,] … consistent with the theme … that the smaller you are and the less likely you are to have benefited from the wide-open capital markets, the more likely you are to be borrowing. We do hear a lot about supply-chain issues from that customer segment [though]. (Barnum, JPM) Corporate client sentiment remains very positive with healthy cash flows and liquidity driving M&A activity and deleveraging. (Fraser, C) Commercial banking loans were up slightly at the end of the third quarter, while line utilization was stable at historic lows. Supply chain difficulties and labor shortages continued to represent significant challenges for our client base. (Scharf, WFC) Commercial credit performance continued to improve and net loan charge-offs declined to 3 basis points. … The commercial real estate [CRE] portfolio has continued to perform well. The recovery in retail and hotel properties reflected increased liquidity and improved valuations. While we have not seen any widespread stress in office, we continue to watch this sector closely and believe that any impact … will take time to play out. (Santomassimo, WFC) [T]he principal challenge in [C&I] is that we continue to see a fair amount of payoffs[.] Where we are seeing nice areas of opportunity … is in asset-backed securitization type of lending [like] warehouse mortgage lines, [and] some supply chain financing activities. … [In the middle-market space,] we are seeing lots of [customer] confidence and relatively strong pipelines. (Cecere, USB) Banks Have Tons Of Dry Powder (Chart 6) And Want To Put It To Work (Chart 7) Chart 6All Dressed Up And Nowhere To Go
All Dressed Up And Nowhere To Go
All Dressed Up And Nowhere To Go
Chart 7Borrowers Wanted
Borrowers Wanted
Borrowers Wanted
[Lending] is a customer-driven business and so $900 billion-odd of loans against $2 trillion of deposits is largely driven by customer activity. The good news is you can see in [breakouts of lending by category] what I call the smile chart that the other half of the smile is coming up, meaning that customers are starting to draw on credit and use it and that will bode well for [them] growing their businesses and stuff[.] (Moynihan, BAC) [I]n CRE, we see quite a robust origination pipeline, as we’ve sort of fully removed any pandemic-related credit pullbacks and we’re leaning into that. (Barnum, JPM) [L]ine utilizations remained low and [commercial] loan demand continued to be impacted by low client inventory levels and strong client cash positions. However, there was some increase in demand late in the quarter and period-end balances increased … 1% from the second quarter. (Santomassimo, WFC) [W]e actually saw some growth [quarter-over-quarter] in CRE. The project level, pipelines, things like that are reasonably strong. As we kind of think about the next couple of quarters, though, what we are seeing in the marketplace is pretty strong competition. (Cecere, USB) All Together Now [W]e have a lot of excess liquidity right now, so there’s always an opportunity to deploy some of that in the future. (Donofrio, BAC) [A]t the highest level, … nothing has really changed, meaning we’re still happy to be patient [about deploying excess liquidity into securities.] (Dimon, JPM CEO) [W]e’ve got a lot of liquidity that’s available for us to invest as we see rates increase[.] (Mason, C CFO) As we think about redeployment, we’re still being pretty patient. … [W]e still think that there is more risk to the upside on rates than there is downside at this point. … [W]hen opportunities present themselves, we’ll take advantage of them, … but we’re going to be patient as we see how things develop over the coming months. (Santomassimo, WFC) [We expect] that rates are going to start moving up, at least on the long end, and so we’re trying to be patient and be in a position to be opportunistic when rates are in the right spot. (Dolan, USB) Investment Implications We remain constructive on markets and the economy over the next six to twelve months because of the fundamental support provided by consumers’ embarrassment of riches and our expectation that a meaningful portion of the money sloshing around the economy will bolster financial markets. In keeping with the theme of this Beige Book report, we let participants in last week’s earnings calls make the points in their own words: first, Bank of America CEO Brian Moynihan with the fundamental argument and then an analyst with an insightful question about supply and demand dynamics in the rates market. [The US economy] is led by the American consumer … [and] spending levels are growing at [a] 10% [rate]. That is a tremendous amount of spending that’s going on and it’s accelerating, even as the stimulus is in the rearview mirror by quite a [few] months. So as people get back to work [with] higher wages … , there’s just more money to spend. (Moynihan, BAC) [T]here’s a significant amount of liquidity on bank balance sheets that’s waiting to be put to work, and I’m wondering if that doesn’t put [something of a] cap on how much rates can rise. And then you’re going to have some decline in Treasury issuance because of a declining budget deficit. And then you’re still going to have QE through the first half of next year. So you’ve got a lot of demand for a shrinking supply on the Treasury side. That’s why I’m curious what sort of rate structure you’re anticipating going forward. (Charles Peabody, Portales Partners) Doug Peta, CFA Chief US Investment Strategist dougp@bcaresearch.com
Dear Client, There will be no weekly report next week. Instead, we will host our quarterly webcast on Tuesday, October 26 for the US and EMEA regions and Wednesday, October 27 for the Asia Pacific region. We will resume our regular publishing schedule on Monday, November 1. In the meantime, we look forward to seeing many of you at our BCA Research Investment Conference this week. Best regards, Mathieu Savary Highlights This year’s decline in EUR/USD has rendered this pair sufficiently inexpensive and oversold to account for the near-term risks we highlighted in March. Nonetheless, some risks remain—among them, the continued credit slowdown in China, diverging monetary policy trends, and the energy crisis hurting Europe. However, long-term fundamentals continue to support the euro’s 12- to 18-month outlook. Moreover, Chinese credit growth may soon stabilize and markets already largely factor in the policy divergence between the Fed and the ECB. As a result, we buy the euro today with a preliminary target at 1.25 and a stop loss at 1.1175. The Bank of England will lift rates this December, but the market already prices in a hawkish BoE. GBP/USD has upside, even if the euro should outpace the pound in the coming months. Look to upgrade UK small-cap stocks. Italian equities do not appear particularly appealing on a cyclical horizon, neither in absolute nor relative terms. Investors should favor Spanish stocks over Italian ones for the next 12-to-18 months. Feature EUR/USD recently flirted with 1.15. Did this move create a buying opportunity? Last March, we warned that the euro would correct to the 1.12 to 1.15 zone because short-term models flagged it as expensive, speculators carried a substantial net-long exposure, and Chinese credit growth was set to slow meaningfully. These forces have now mostly played out; thus, the euro’s near-term outlook is becoming more positive. Despite this more constructive view, EUR/USD still carries ample downside risks, especially if Chinese authorities remain reluctant to reflate their economy. Moreover, the energy crisis facing Europe clouds the euro. We are nonetheless buyers of EUR/USD, with a target at 1.25. Investors should set a wide stop in at 1.1175. Cheap And Oversold The internal dynamics of the euro indicate that the bulk of the sell-off is behind us. First, the euro is now cheap on a tactical basis. Back in March, our short-term fair value model for EUR/USD flagged at 7% overvaluation based on real rate differentials, on the slope of the German yield curve relative to that of the US, and on the copper-to-lumber prices ratio. Today, this same measure shows a 5% undervaluation. BCA’s Foreign Exchange Strategy Intermediate Term Timing Model (ITTM) flags an even clearer buy signal. The ITTM framework combines interest rate parity models, with risk aversion and considerations for the currency’s trend. Currently, this model is at -8% or nearly minus one standard error. Historically, such a depressed reading points to generous returns in the subsequent 12 months (Chart 1). Second, the euro is oversold. BCA’s Intermediate Term Technical Indicator has hit 7, which is consistent with past rebounds in EUR/USD (Chart 2). While some of these rallies have been extremely short-lived, the technical indicator’s message is stronger when it is matched by a buy signal from the ITTM. Chart 1Strong Buy Signal From Short-Term Valuations
Strong Buy Signal From Short-Term Valuations
Strong Buy Signal From Short-Term Valuations
Chart 2EUR/USD is Oversold
EUR/USD is Oversold
EUR/USD is Oversold
Chart 3Stale Euro Longs Have Been Purged
Stale Euro Longs Have Been Purged
Stale Euro Longs Have Been Purged
Third, speculators do not carry a large net long position in the euro anymore. This variable suggests that the worst of the selling pressure is behind us, but it has yet to send a strong buy signal on its own (Chart 3). Bottom Line: The euro is sufficiently inexpensive that our Intermediate-term timing model flags a strong buy signal. Moreover, our technical indicators paint an oversold picture consistent with a reversal. Nonetheless, speculators may not be long EUR/USD anymore, but they are not aggressively selling it either. Thus, macro dynamics remain important to the future trend of this currency. Macro Fog Remains The macro environment is not yet conducive to a euro rally, especially when Chinese credit growth remains weak. However, considering the euro’s valuation and technical picture, small changes in the macro environment could be enough to catalyze a jump in EUR/USD. A key problem for the euro is that the dollar remains well bid. The yen and the dollar are the two momentum currencies within the G-10 (Chart 4). This property of the dollar is a large handicap for the euro, because it remains the most liquid vehicle to bet on the USD. Thus, as long as the dollar’s momentum is strong, the euro will find it difficult to rally. Relative economic growth is another headwind for EUR/USD. European activity is weakening versus that of the US. Since 2019, the relative manufacturing PMIs between the Euro Area and the US track EUR/USD, and they currently confirm the euro’s weakness (Chart 5). Moreover, European economic surprises are significantly weaker than US ones, which adds to the euro’s malaise (Chart 5, bottom panel). Chart 4The Dollar Is A Momentum Currency
Time For The Euro To Shine?
Time For The Euro To Shine?
Chart 5Deteriorating European Growth Hurts EUR/USD
Deteriorating European Growth Hurts EUR/USD
Deteriorating European Growth Hurts EUR/USD
The near-term outlook does not signal a resolution of this issue until the first half of 2022. The declines in the expectation and current situation components of both the ZEW and Sentix surveys herald an additional deceleration in manufacturing activity (Chart 6). The Eurozone’s growth problems reflect China’s slowing credit flows. Europe economic activity is still extremely sensitive to the evolution of the global industrial cycle (Chart 7, top panel), much more so than the US GDP is. China’s business cycle is an essential determinant of the robustness of the global manufacturing sector. Consequently, when measures of China’s marginal propensity to consume decelerate, such as the gap between M1 and M2 growth, European PMIs and industrial production underperform those of the US (Chart 7, second and bottom panels). Chart 6A Bit More Time Before Europe's Slowdown Ends
A Bit More Time Before Europe's Slowdown Ends
A Bit More Time Before Europe's Slowdown Ends
Chart 7China's Travails Hurt Europe
China's Travails Hurt Europe
China's Travails Hurt Europe
The fourth quarter of 2021 is likely to represent the tail end of the Chinese headwind on EUR/USD. The Chinese credit impulse remains weak, but signs of a floor are beginning to appear. For example, the decline in Chinese commercial banks excess reserve growth warned us of the coming decline in the credit impulse. Today, excess reserves have begun to stabilize, which points to an upcoming imporvement in credit flows (Chart 8). Additionally, the Evergrande problems continue to weigh on Europe in the near-term because of the deceleration in Chinese construction activity; however, the crisis will also intensify the pressure on Beijing to revive credit growth in order to avoid a systemic collapse. Chart 8Will China's Credit Impulse Bottom Soon?
Will China's Credit Impulse Bottom Soon?
Will China's Credit Impulse Bottom Soon?
Monetary policy differentials also remain euro bearish. The US Federal Reserve will announce the start of its tapering program on November 3. The FOMC is set to hike rates by the end of 2022. Meanwhile, the ECB is unphased by the increase in European inflation, which remains mostly a reflection of energy prices and base effects. Thus, Europe will lag behind the US when it comes to monetary policy tightening. Nonetheless, investors already understand this dichotomy very well. The US OIS curve anticipates four hikes in 2023. Meanwhile, the EONIA curve shows a first 25-bps hike only by September 2023. Thus, the euro will suffer more from policy differentials if the Fed generates hawkish surprises relative to this pricing. The energy crisis shaking Europe is the last major headwind currently affecting the euro. Historically, EUR/USD and the ratio of European to US natural gas prices track each other (Chart 9). This relationship reflects relative growth dynamics. A stronger Eurozone economy relative to the US pushes up the value of the euro and European natural gas, which is a commodity with heavy industrial usage. However, since this summer, the spike in European natural gas prices has coincided with a decline in the euro. This divergence highlights the negative effect on European activity of the current energy shock, which raises fears of stagflation. The cross-Atlantic bond market dynamics confirm the notion that the energy shock increases the perceived stagflation risk in the Eurozone. German yields have risen relative to US ones because of a pick-up in inflation expectations, not real rates (Chart 10). The lack of traction for relative real rates is appropriate because market participants believe that the ECB wants to ignore the spike in energy prices. An environment of rising relative inflation expectations but stable relative real rates is very negative for any currency, including the euro. However, European inflation expectations should decrease relative to those of the US once European natural gas prices normalize, which we expect to take place in the coming months (Chart 10, bottom panel). This process will be very positive for the euro. Chart 9The European Energy Crisis Harms The Euro
The European Energy Crisis Harms The Euro
The European Energy Crisis Harms The Euro
Chart 10Pricing In European Stagflation?
Pricing In European Stagflation?
Pricing In European Stagflation?
Bottom Line: While euro pricing and technicals suggest EUR/USD will bottom soon, the economic environment is murkier. The dollar is a momentum currency, and its current strength feeds the euro’s weakness. China’s credit flows continue to decelerate, which hurts the euro; however, credit flows may stabilize in early 2022. The Fed is a tailwind for the dollar, but markets already price in this reality. Finally, the energy crisis hurts European growth and thus EUR/USD; nonetheless, the spike in natural gas prices will soon give way to a period of decline, which will lessen the pain for the euro. What To Do? When we balance the positives and negative for the euro, we are becoming more comfortable with buying EUR/USD outright, even if it is still a risky bet. To begin with, the big fundamental forces point to a firmer euro on an 18- to 24-month basis: BCA’s Foreign Exchange strategists see greater cyclical downside for the USD and believe the current rebound is a pronounced countertrend move within a multi-year dollar bear market. The euro will naturally benefit over the coming years from a weak greenback. EUR/USD is still inexpensive on long-term valuation metrics. Based on BCA’s purchasing power parity model, this pair trades 17% below its fair value. Moreover, the PPP estimate keeps rising in favor of the euro, a result of the Eurozone’s lower inflation compared to the US (Chart 11). The relative balance of payments favors the euro. The European economy generates a current account surplus of 3% of GDP compared to a current account deficit of 3.1% for the US. The US current account deficit is unlikely to narrow, even if the federal government’s budget hole declines because the private sector’s savings rate is falling even faster. Moreover, US real two-year rates remain well below those of its trading partners. Investors underweight Eurozone assets aggressively. For the past ten years, capital has consistently flowed out of the Euro Area relative to the US (Chart 12). European growth should converge toward the US next year, especially if Chinese credit activity stabilizes. Therefore, 2022 should witness a period of inflows into the Eurozone. Chart 11EUR/USD Significant Long-Term Discount
EUR/USD Significant Long-Term Discount
EUR/USD Significant Long-Term Discount
Chart 12Investors Underweight Eurozone Assets
Investors Underweight Eurozone Assets
Investors Underweight Eurozone Assets
We argued that the valuation and technical backdrop shows the Euro is becoming increasingly supportive and our timing model is clearly arguing against selling EUR/USD. However, the biggest technical risk is the momentum sensitivity of the dollar, which means that the euro’s weakness could last somewhat longer. Nevertheless, BCA’s Dollar Capitulation Index now warns of a pullback in the USD, especially as speculators are very long DXY futures (Chart 13). The biggest downside risk remains China’s credit trend. If it takes more time than we anticipate for Beijing to put an end to the credit impulse slowdown, the euro will experience greater downside pressure. Moreover, the longer it takes Beijing to reflate, the greater the chance of an uncontrolled selloff in the CNY, which would drag down the euro (Chart 14). Chart 13Is The Dollar Technically Vulnerable?
Is The Dollar Technically Vulnerable?
Is The Dollar Technically Vulnerable?
Chart 14China Remains The Euro's Main Risk
China Remains The Euro's Main Risk
China Remains The Euro's Main Risk
Despite this level of near-term uncertainty, we recommend investors buy the euro, with a target at 1.25, and a stop loss at 1.1175. Bottom Line: Conditions are falling in place for the countertrend decline in the euro to end soon. As a result, the euro should converge back toward the upward path driven by fundamentals. The greatest near-term risk remains the path of Chinese credit trends. We recommend investors buy the euro with a preliminary target at EUR1.25 and a stop loss at 1.1175. Country Focus: A Well Discounted BoE Hike The Bank of England will begin to increase interest rates at its December meeting. The BoE’s communication has been clear that it does not see a need to wait between the end of its tapering program in December and the beginning of its hiking campaign. Recent comments by senior MPC members, including new Chief Economist Huw Pill, also suggest a rate hike is looming. Chart 15The BoE's Inflation Problem
The BoE's Inflation Problem
The BoE's Inflation Problem
We see little reason to doubt the willingness of the MPC to start lifting the Bank Rate. UK Core CPI stands at 3.1% or 110 basis points above the BoE’s inflation target. Moreover, both market-based and survey-based long-term inflation expectations are well above 3.5%, which increases the risk of a dangerous dis-anchoring of UK inflation (Chart 15). UK economic activity remains inflationary. Wages are strong, climbing 7.2% in August. This number probably exaggerates the underlying wage growth due to compositional effects, but job creation remains robust and the unemployment rate fell to 5.2%. The BoE was concerned that the end of the furlough scheme last month would cause a jump in unemployment, but their fears have dwindled, because job vacancies stand at a record high and capex intentions are solid (Chart 16). The housing market continues to be a tailwind to growth. House prices are up 10% annually, which lifts household net worth considerably (Chart 17). The pace of transactions in the real estate market will slow this spring because the stamp duty holiday will end; however, low mortgage rates and expectations of further housing gains may fuel greater appreciation. This creates long-term financial stability risks for the UK because household leverage will rise. This worries the BoE. Chart 16The UK's Labor Market Strength Will Continue
The UK's Labor Market Strength Will Continue
The UK's Labor Market Strength Will Continue
Chart 17Rising Household Net Worth
Rising Household Net Worth
Rising Household Net Worth
Market participants already expect a hawkish BoE. A rate hike is priced in for December and the SONIA curve embeds almost two more increases in 2022. The 4.3% underperformance of the UK government bond index over the global benchmark in seven weeks also underscores the rapid adjustment in investors’ perceptions of the UK policy path. BCA’s Global Fixed-Income strategists have underweighted UK government bonds for two months, and they maintain a negative view over the coming quarters. Nonetheless, the risk of a short-lived countertrend rebound in UK bonds’ relative performance is significant. However, it would be a temporary position squaring, while hedge funds and CTAs take profits. BCA’s Foreign Exchange strategists expect GBP/USD to rebound. Cable is oversold and trades at a 12% discount to BCA’s PPP fair-value estimate. GBP/USD is also hurt by fears that the BoE hikes will damage the UK economy. From a contrarian perspective, this creates a positive entry point to buy cable, especially because the pound should benefit from the anticipated dollar weakness and the euro’s upcoming rally. However, BCA’s FX strategists also foresee some decline in the pound versus the euro, because GBP is a low beta play on EUR/USD. Hence, the trade-weighted pound could remain flat to slightly down in the coming months. We stay neutral on UK small-cap stocks relative to large-cap equities, but we are putting them on an upgrade alert. Small-cap stocks benefit from the strength in the domestic economy; however, they are also extremely expensive compared to large-cap ones (Chart 18). The arbiter of performance will be profits. The forward EPS of small-caps have lagged behind those of large-caps by 9% since the COVID recession, after underperforming since 2016 (Chart 19). Small-caps’ relative profits are currently trying to stabilize, but the durability of this trend will be tested if the trade-weighted pound remains flat in the coming months. Thus, the EPS of small-cap shares must regain more ground before moving more aggressively in this market. Chart 18UK Small Cap Are Pricey
UK Small Cap Are Pricey
UK Small Cap Are Pricey
Chart 19Follow The Profits
Follow The Profits
Follow The Profits
Bottom Line: On the back of a strong UK economy and significant inflationary forces, the BoE will start elevating interest rates this December. The market already prices in this outcome. Nonetheless, UK bonds should continue to underperform the global benchmark, and cable has upside, even if the near-term outlook favors the EUR over the GBP. We are putting UK small-cap stocks on a buy alert. They are expensive, but a turnaround in profits would solve this problem. Market Focus: A Quick Take On Italian Equities The Italian equity market remains Europe’s problem child. The Italian MSCI index has underperformed the rest of the Euro Area by 40% since 2010. This underperformance holds even after adjusting for sectoral differences, although it becomes less dramatic (Chart 20, top panel). Despite this underperformance, Italian equities have managed to outperform their Spanish counterparts by 27% since 2010, but this outperformance dissipates once sectoral difference are accounted for (Chart 20, bottom panel). The RoE of Italian non-financial listed equities is equivalent to the rest of the Eurozone, but it only reflects elevated financial leverage, as is the case in Spain (Chart 21). Italy’s RoA is poor, because Italy’s excess capital stocks hurts its return on capital. As a result, Italian equities continue to face a structural handicap. Chart 20A Problem Child
A Problem Child
A Problem Child
Chart 21Italy's Return On Asset Is Poor
Italy's Return On Asset Is Poor
Italy's Return On Asset Is Poor
The good run in Italian equities in absolute terms faces headwinds. Italian stocks are very sensitive to the global business cycle; however, they often respond with a delay and in an exaggerated fashion to decelerations in the global PMI (Chart 22, top panel). Moreover, since 2010, widening European high-yield corporate bond spreads have preceded falling Italian stock prices. Thus, the recent slide in the global PMI and the widening in European high-yield OAS create a period of vulnerability for Italian equities. Finally, Italian share prices have overshot the path implied by US yields (Chart 22, bottom panel). Nonetheless, Italian stocks may be sniffing out further increases in global yields. The cleanest way to play these vulnerabilities in the Italian is via a short bet against Spain. A steeper global yield curve will help both markets due to their heavy exposure to financials. However, we still favor Spanish financials, which benefit from higher RoEs than their Italian counterparts (Chart 23) and lower NPLs. As a result, the forward EPS of Spanish financials should begin to outperform those of Italian financials. Chart 22Some Risks To Italian Stocks
Some Risks To Italian Stocks
Some Risks To Italian Stocks
Chart 23Spanish Banks Are Better Placed To Benefit From Rising Global Yields
Spanish Banks Are Better Placed To Benefit From Rising Global Yields
Spanish Banks Are Better Placed To Benefit From Rising Global Yields
Mathieu Savary, Chief European Strategist Mathieu@bcaresearch.com Jeremie Peloso, Associate Editor JeremieP@bcaresearch.com Tactical Recommendations
Time For The Euro To Shine?
Time For The Euro To Shine?
Cyclical Recommendations
Time For The Euro To Shine?
Time For The Euro To Shine?
Structural Recommendations
Time For The Euro To Shine?
Time For The Euro To Shine?
Closed Trades
Time For The Euro To Shine?
Time For The Euro To Shine?
Currency Performance Fixed Income Performance Equity Performance