Equities

Recent Portfolio Moves
Recent Portfolio Moves
Next week we will be holding our quarterly webcast discussing the US equity market outlook. As a brief prologue to the webcast, the following Insight report provides a summary of our recent moves and views. In our latest Strategy Report we posited a cautious outlook for the US margins into the year end. While margins are likely to contract, we don’t expect a bear market in equities. Instead, equities are likely to print pedestrian single digit returns on the back of high valuations, and multiple expansion that “borrowed” returns from the future over the course of 2020. However, the TINA theme is still at play and excess liquidity will hold off a bear market. Even if top line S&P 500 returns remain paltry, money can still be made by granular sector selection and rotation (see chart). Specifically, we recently went overweight Small Caps at the expense of Large Caps as this asset class tends to outperform in a rising rates environment. Bottom Line: While S&P 500 returns are likely to remain in single digits over the coming months, there are plenty of opportunities on the sector level.
Highlights As US and China’s grand strategies collide, expect major and minor geopolitical earthquakes whose epicenter will now lie in South Asia and the Indian Ocean basin. Another tectonic change will drive South Asia’s emergence as a new geopolitical battle ground - South Asia is now heavily weaponized. All key players operating in this theater are nuclear powers. South Asia’s democratic traditions are well-known but notable institutional and social fault lines exist. These could trigger major geopolitical events in Afghanistan, Pakistan and in pockets of India too. We are bullish on India strategically but bearish tactically. Dangerous transitions are underway to India’s east and west. Within India, key elections are approaching, and it is possible that growth may disappoint. For reasons of geopolitics, we are strategically bullish on Bangladesh but strategically bearish on Pakistan and Sri Lanka. We are booking gains of 9% on our long rare earths basket and 1% on our long GBP-CZK trade. Feature Over the 1900s, East Asia and the Middle East emerged as two key geopolitical focal points on the world map. Global hegemons flexed their muscles and clashed in these two theaters. Meanwhile South Asia was a geopolitical backstage at best. The majority of South Asia was a British colony until the second half of the twentieth century. After WWII it struggled with the difficulties of independence and mostly missed out on the prosperity of East Asia and the Pacific. But will the twenty-first century be any different? Absolutely so. We expect the current century to be marked by major and minor geopolitical earthquakes in which South Asia and the Indian Ocean basin will play a major part. This seismic change is likely to be the result of several tectonic forces: Population: A quarter of the world’s people live in South Asia today and this share will keep growing for the next four decades. India will be the most populous country in the world by 2027 and will account for about a fifth of global population. Supply: China’s growth model has left it heavily dependent on imports of raw materials from abroad. It is clashing with the West over markets and supply chains. Beijing is building supply lines overland while developing a navy to try to secure its maritime interests. These interests increasingly overlap with India’s, creating economic competition and security concerns over vital sea lines of communication. Access: Whilst the Himalayas and Tibetan plateau have historically prevented China from expanding its influence in South Asia, China’s alliance with Pakistan is strengthening. Physical channels like the China Pakistan Economic Corridor (CPEC), and other linkages under the Belt and Road Initiative, now provide China a foot in the South Asian door like never before (Map 1). Weapons: The second half of the twentieth century saw China, India, and Pakistan acquire nuclear arms. Consequently, South Asia today is one of the most weaponized geographies globally (Map 1). Map 1South Asia To Emerge As A Key Geopolitical Theater In The 21st Century
South Asia: A New Geopolitical Theater
South Asia: A New Geopolitical Theater
With the South Asian economy ever developing, and US-China confrontation here to stay, we expect China to make its presence felt in South Asia over the coming decades. The US’s recent withdrawal from Afghanistan, and the failure of democratization in Myanmar, are but two symptoms of a grand strategic change by which China seeks to prevent US encirclement and Indo-American cooperation develops to counter China. Throw in the abiding interests of all these powers in the Middle East and it becomes clear that South Asia and the Indian Ocean basin writ large will become increasingly important over the coming decades. The Lay Of The Land - India Is The Center Of Gravity Chart 1South Asia Managed Rare Feat Of ‘Steady’ Growth
South Asia: A New Geopolitical Theater
South Asia: A New Geopolitical Theater
South Asia stands out amongst developing regions of the world for its large and young population. In recent decades, South Asia has also managed to grow its economy steadily, surpassing Sub-Saharan Africa and rivaling the Middle East (Chart 1). While South Asia’s growth rates have not been as miraculous as East Asia post World War II, its growth engine has managed to hum slowly but surely. India and Bangladesh have been the star performers on the economic growth front (Chart 2). Despite decent growth rates, the South Asian region is characterized by very low per capita incomes due to large population. On per capita incomes, Sri Lanka leads whilst Pakistan finds itself at the other end of the spectrum (Chart 3). Chart 2India And Bangladesh Have Been Star Performers
South Asia: A New Geopolitical Theater
South Asia: A New Geopolitical Theater
Chart 3Per Capita Incomes In South Asia Have Grown, But Remain Low
South Asia: A New Geopolitical Theater
South Asia: A New Geopolitical Theater
Chart 4India Accounts For About 80% Of South Asia’s GDP
South Asia: A New Geopolitical Theater
South Asia: A New Geopolitical Theater
South Asia constitutes eight nations. However only four are material from an investment perspective: India, Pakistan, Sri Lanka, and Bangladesh. India is the center of gravity as it offers the most liquid scrips and accounts for 80% of the region’s GDP (Chart 4). In addition: India accounts for 101 of the 110 companies from South Asia listed on MSCI’s equity indices. MSCI India’s market capitalization is about $1 trillion. In fact, India’s equity market could soon become larger than that of the UK and join the world’s top-five club.1 The combined market cap of MSCI Bangladesh, Sri Lanka, and Pakistan amounts to only about $6 billion. Liquidity is a constraint that investors must contend with whilst investing in these three countries in South Asia. Pakistan is the home of 220 million – set to grow to 300 million by 2040. It lags its neighbors on economic growth and governance but has nuclear weapons and a 650,000-strong military. Bottom Line: India is the center of gravity for the regional economy and financial markets in South Asia. Sri Lanka and Bangladesh are small but are developing. Pakistan is the laggard, but is militarily strong, which raises political and geopolitical risks. South Asia: Major Consumer, Minor Producer Chart 5Manufacturing Capabilities Of South Asian Economies Are Weak
South Asia: A New Geopolitical Theater
South Asia: A New Geopolitical Theater
South Asia’s defining economic characteristic is that it is a major consumer. This feature contrasts with the region’s East Asian cousins, which worked up economic miracles based on their manufacturing capabilities. South Asia’s appetite to consume is partly driven by population and partly driven by the fact that this region’s economies have an unusually underdeveloped manufacturing base (Chart 5). It’s no surprise that all countries in South Asia (with the sole exception of Afghanistan) are set to have a current account deficit over the next five years (Charts 6A and 6B). Chart 6ASouth Asian Economies Tend To Be Net Importers
South Asia: A New Geopolitical Theater
South Asia: A New Geopolitical Theater
Chart 6BSouth Asian Economies Tend To Be Net Importers
South Asia: A New Geopolitical Theater
South Asia: A New Geopolitical Theater
India is set to become the third largest global importer of goods and services (after the US and UK) over the next five years. Its rise as a large client state of the world will be both a blessing and a curse, as increased business leverage will coincide with geopolitical insecurity. Structurally, Sino-Indian tensions are rising and growing bilateral trade will not be enough to prevent them. Meanwhile dependency on the volatile Middle East is a geopolitical vulnerability. Either way, India and its region become more important to the rest of the world over time. Whilst the structure of South Asia’s economy is relatively rudimentary, it is worth noting that Bangladesh and Sri Lanka present an exception. Bangladesh has embarked on a path of manufacturing-oriented development via labor-intensive production. Sri Lanka has a well-developed services sector (Chart 7). In particular: Bangladesh: Within South Asia, Bangladesh’s manufacturing sector stands out as being better developed than regional peers. More than 95% of Bangladesh’s exports are manufactured goods –a level that is comparable to China (Chart 8). China’s share in the global apparel and footwear market has been systematically declining and Bangladesh is one of the countries that has benefited most from this shift. Bangladesh’s share in global apparel and footwear exports to the US as well as EU has been rising steadily and today stands at 4.5% and 13% respectively.2 Chart 7Bangladesh’s And Sri Lanka’s Economies Are Relatively Modern
South Asia: A New Geopolitical Theater
South Asia: A New Geopolitical Theater
Chart 8Bangladesh Has The Most Developed Exports Franchise In South Asia
South Asia: A New Geopolitical Theater
South Asia: A New Geopolitical Theater
Sri Lanka: Whilst Sri Lanka social complexities are lower and per capita incomes are higher as compared to peers in South Asia, its transition from a long civil war to a focus on economic development recently suffered a body blow, first owing to terrorist attacks in 2019 and then owing to the pandemic. The economic predicament was then worsened by its government’s hasty transition to organic farming which hit domestic food production. Geopolitically it is worth noting that China is one of the largest lenders to Sri Lanka. Whilst Sri Lanka’s central bank may be able to convince markets of the nation’s ability to meet debt obligations for now, its foreign exchange reserves position remains precarious and public debt levels remain high. Sri Lanka’s vulnerable finances are likely to only increase Sri Lanka’s reliance on capital-rich China. Despite Democracy, South Asia Has Political Tinderboxes Another factor that sets South Asia apart from developing regions like Africa, the Middle East, and Central Asia is the region’s democratic moorings. India and Sri Lanka lead the region on this front, although the last decade may have seen minor setbacks to the quality of democracy in both countries (Chart 9). Pockets of South Asia are socially and politically unstable, characterized by religious or communal strife, terrorist activity, and even the occasional coup d'état. Risk Of Social Conflict Most Elevated In Pakistan And Afghanistan India’s demographic dividend is real, but its benefits should not be overstated. For instance, India’s northern region is a demographic tinderbox. It is younger than the rest of the country, yet per capita incomes are lower, youth underemployment is higher, and society is more heterogeneous. The rise of nationalism in India is an important consequence and could engender potential social unrest. Chart 9India’s Democracy Strongest, But May Have Had Some Setbacks
South Asia: A New Geopolitical Theater
South Asia: A New Geopolitical Theater
Chart 10South Asia Is Young And Will Age Slowly
South Asia: A New Geopolitical Theater
South Asia: A New Geopolitical Theater
Chart 11Social Complexities Are High In Afghanistan & Pakistan
South Asia: A New Geopolitical Theater
South Asia: A New Geopolitical Theater
A similar problem confronts South Asia as a whole. Pakistan and Afghanistan are younger than India by a wide margin (Chart 10). But both countries are economically backward and have either poor or non-existent democratic traditions. Lots of poor youths and inadequate political valves to release social tensions make for an explosive combination. These countries are highly vulnerable to social conflict that could cause political instability at home or across the region via terrorism (Chart 11). The Gatsby Effect Most Prominent In Pakistan While various regions struggle with inequality, South Asia has less of a problem that way (Chart 12). However South Asia is characterized by very low levels of social mobility as compared to peer regions. This can partially be attributed to two centuries of colonial rule as well as to endemic traditions of social stratification. Chart 12Gatsby Effect: Social Mobility Is Lowest In Pakistan
South Asia: A New Geopolitical Theater
South Asia: A New Geopolitical Theater
Within South Asia it is worth noting that social mobility is the lowest in Pakistan and highest in Sri Lanka. Chart 13Military’s Influence Most Elevated In Pakistan And Nepal Too
South Asia: A New Geopolitical Theater
South Asia: A New Geopolitical Theater
Military Influential In Pakistan (And Nepal) Events that transpired over January 2020 in the US showed that even the oldest constitutional democracy in the world is not immune to a breakdown of civil-military relations. South Asia has seen the occasional coup d'état, one reason for the political tinderboxes highlighted above. Obviously, Myanmar is the worst – it saw its nascent democratization snuffed out just last year. But other countries in the region could also struggle to maintain civilian order in the coming decades. The military’s influence is outsized in Pakistan as well as Nepal (Chart 13). India maintains high levels of defense spending but has a strong tradition of civilian control (Chart 14). Chart 14Pakistan’s Military Budget Is Most Generous, India A Close Second
South Asia: A New Geopolitical Theater
South Asia: A New Geopolitical Theater
South Asia: A New Global Battle Ground Historically global hegemons have sought to assert their dominance by staking claim over coastal regions in Europe and Asia. Over the past two centuries Asia has emerged as a geopolitical theater second only to Europe. Naval and coastal conflicts have emerged from the rise of Japan (the Russo-Japanese War) and the Cold War (the Korean War & the Vietnam War). Today the rise of China is the destabilizing factor. The “frozen conflicts” of the Cold War are thawing in Taiwan, South Korea, and elsewhere. China is pursuing territorial disputes around its entire periphery, including notably in the East and South China Seas but also South Asia. Meanwhile the US, fearful of China, is struggling to strike a deal with Iran and shift its focus from the Middle East to reviving its Pacific strategic presence. A budding US-China competition is creating conditions for a new cold war or a series of “proxy battles” in Asia. Over the next few decades, we expect disputes to continue. But the focal points are likely to cover South Asia too. In specific, landlocked regions in South Asia are likely to see rising tensions in the twenty-first century (Map 2). Also as mentioned above, China’s naval expansion and the US’s attempt to form a “quadrilateral” alliance with India, Japan, and Australia will generate tensions and potentially conflict. European allies are also becoming more active in Asia as a result of US alliances as well as owing to Europe’s independent need for secure supply lines. Map 2China’s Interest In Landlocked Regions Of South Asia Is Rising
South Asia: A New Geopolitical Theater
South Asia: A New Geopolitical Theater
While border clashes between India and China will ebb and flow, Indo-Chinese confrontations along India’s eastern border will become a structural theme. Arguably, Sino-Indian rivalries pre-date the twenty-first century. But in a world in which the Asian giants are increasingly economically and technologically developed, Sino-Indian confrontations are likely to persist and result in major geopolitical events. Consider: China is adopting nationalism and an assertive foreign policy to cope with rising socioeconomic pressures on the Communist Party as potential GDP growth slows. China is developing a navy as well as a stronger alliance with Pakistan, which includes greater lines of communication. North India is a key constituency for the political party in power in India today (i.e., the Bhartiya Janata Party or BJP) and this geography harbors especially unfavorable views of Pakistan (Chart 15). Thus, there is a risk that the India of today could respond far more decisively or aggressively to threats or even minor disputes. More broadly, nationalism is rising in India as well as China. India is shedding its historical stance of neutrality and aligning with the US, which fuels China’s distrust (Chart 16). Chart 15Northern India Views Pakistan Even More Unfavorably Than Rest Of India
South Asia: A New Geopolitical Theater
South Asia: A New Geopolitical Theater
Chart 16India Has Aligned With The QUAD To Counter The Sino-Pak Alliance
South Asia: A New Geopolitical Theater
South Asia: A New Geopolitical Theater
Turning attention to India’s western border, clashes between India and Pakistan relating to landlocked areas in Kashmir will also be a recurring theme. Whilst India currently has a ceasefire agreement in place with Pakistan, peace between the two countries cannot possibly be expected to last. This is mainly because: Kashmir: Core problems between the two countries, like India’s control over Kashmir and Pakistan’s use of militant proxies, remain unaddressed. India’s unexpected decision in 2019 to abrogate article 370 of the Indian constitution has reinforced Pakistan’s attention on Kashmir. Sino-Pak Alliance: Pakistan accounted for 38% of China’s arms exports over 2016-20. Pakistan accounts for the lion’s share of Chinese investments made in South Asia (Chart 17). Sino-India rivalries will spill into the Indo-Pak relationship (and vice versa). Revival Of Taliban: The US withdrawal from Afghanistan has revived Taliban rule in that country. Taliban’s rise will resuscitate a range of dormant terrorist movements in Afghanistan as well as in Pakistan. India has a long history of being targeted. South Asia today is very different from what it looked like for most of the post-WWII era: it is heavily weaponized. India, Pakistan, and China became nuclear powers in the second half of the twentieth century and have been steadily building their nuclear stockpiles ever since (Chart 18). North Korea’s growing arsenal is theoretically able to target India, while Iran (more friendly toward India) may also obtain nuclear weapons. Chart 17China And Pakistan: Joined At The Hip?
South Asia: A New Geopolitical Theater
South Asia: A New Geopolitical Theater
Chart 18South Asia: The New Epicenter For Nuclear Activity
South Asia: A New Geopolitical Theater
South Asia: A New Geopolitical Theater
While nuclear arms create a powerful incentive for nations to avoid total war, they can also create unmitigated fear and uncertainty during incidents of major strategic tension. This is especially true when countries have not yet worked out a mode of living with each other, as with the US and USSR in the early days of the Cold War. Investment Takeaways For investors with an investment horizon exceeding 12 months, we highlight that India presents a long-term buying opportunity for two key reasons: China’s Internal And External Troubles Will Benefit India: As long as US and China do not reengage in a major way, global corporations will fall under pressure to diversify from China and the US will pursue closer relations with India. China faces an array of challenges across its periphery, whereas India need only focus on the South Asian sphere. India Is Rising As A Global Consumer: As long as a major Middle East war and oil shock is avoided (not a negligible risk), India should see more benefits than costs from its growing importance as a client of the world. However, over the next 12 months we worry that India is priced for perfection. India currently trades at a punchy premium relative to emerging markets (Table 1) at a time of when both geopolitical and macroeconomic headwinds are at play. In particular: Table 1We Are Bearish On India Tactically, But Bullish On India & Bangladesh Strategically
South Asia: A New Geopolitical Theater
South Asia: A New Geopolitical Theater
Major Transitions Are Dangerous: Recent developments in South Asia have added to geopolitical risks for India. The assumption of power by Taliban in Afghanistan will activate latent terrorist forces that could target India. Pakistan’s chronic instability combined with the change of power in Afghanistan could set off an escalation in Indo-Pakistani tensions, sooner rather than later. On India’s eastern front, China’s need to distract its population from a souring economy could trigger a clash between China and India. Down south, China’s rising influence over crisis-hit Sri Lanka is notable and could potentially engender security risks for India. Chart 19Politics Can Trump Economics In Run Up To General Elections
South Asia: A New Geopolitical Theater
South Asia: A New Geopolitical Theater
Growth Slowing, Elections Approaching: We worry that India’s growth engine may throw up a downside surprise over the next 12 months owing to poor jobs growth and poor investment growth. History suggests that politics often trumps economics in the run up to general elections (Chart 19). Hence there is a real risk that policy decisions will be voter-friendly but not market-friendly over 2022. As both India and Pakistan are gearing up for elections in the coming years, major military showdown or saber rattling should not be ruled out. Both countries may engineer a rally around the flag effect to bump up their pandemic-battered approval. Tension with China may escalate as Xi Jinping extends his term in power next year and seeks to enforce red lines in China’s eastern and western borders. Globally what are the key geopolitical factors that could lead to India’s underperformance in the short run? We highlight a checklist here: China Stimulates: The near-term clash between markets and policymakers in China should eventually give way to meaningful fiscal stimulus by Chinese authorities. This buoys China as well as emerging markets that depend on China for their growth. However, even if China flounders, India may not continue to outperform. The correlation between MSCI India and China equities has been positive. Fed Tightens Quickly: A faster-than-expected taper and tightening guidance could cause those emerging markets that are richly priced like India to correct. A Crisis Over Iran’s Nuclear Program: If the US is unable to return to diplomacy, tensions in the Middle East will rise and stoke oil prices. This will affect India adversely, given global price pressures and India’s high dependence on oil imports. Conversely, if these developments fail to materialize then that would lower our conviction regarding India’s underperformance in the short run. In summary, we are bullish India strategically but bearish tactically. As regards the three other investable markets in South Asia: We are bearish on Pakistan and Sri Lanka on a strategic time horizon. Whilst both nations’ rising alignment with China could be an advantage ceteris paribus, ironically their deteriorating finances are driving their proximity to capital-rich China (Chart 20). To boot, Sri Lanka’s ability to pay its way out of its economic crisis on its own steam is worsening. This is evident from its rising debt to GDP ratio (Chart 21). Chart 20Pakistan And Sri Lanka Running Low On Reserves
South Asia: A New Geopolitical Theater
South Asia: A New Geopolitical Theater
Pakistan faces elevated risks of internal social conflict, must deal with a rapidly changing external environment, has a weak democracy and an unusually influential military. Sri Lanka’s social risks are low, but its economic crisis appears likely to persist. The fact that both markets have been characterized by a high degree of volatility in earnings in the recent past implies that even a cyclical “Buy” case for either of these markets is fraught with risks (Table 1). The outlook for Bangladesh is better. Exports account for 15% of GDP and the US and Europe account for around 70% of its exports. Strong fiscal stimulus in these developed markets should augur well for this frontier market. Additionally, Bangladesh is characterized by moderate social risks, reasonably strong democracy scores and low levels of influence from the military. Its healthy public finances (Chart 21) and the fact that it shares no border with China creates the potential to leverage a symbiotic relationship with China. Chart 21Sri Lanka’s Debt Now Exceeds Its GDP
South Asia: A New Geopolitical Theater
South Asia: A New Geopolitical Theater
But there is a catch. Bangladesh as a market has a low market cap and hence offers low levels of liquidity (Table 1). We thus urge investors to avoid making cyclical investment calls on this South Asian market. However, from a long-term perspective we highlight our strategic bullish view on Bangladesh given supportive geopolitical factors. Watch out for an upcoming report from our Emerging Markets Strategy team, that will delve into the macroeconomic aspects of Bangladesh. Ritika Mankar, CFA Editor/Strategist ritika.mankar@bcaresearch.com Footnotes 1 Abhishek Vishnoi and Swetha Gopinath, "India's stock market on track to overtake UK in terms of m-cap: Report" Business Standard, October 2021. 2 Arianna Rossi, Christian Viegelahn, and David Williams, "The post-COVID-19 garment industry in Asia" Research Brief, International Labour Organization, July 2021. Open Trades & Positions
South Asia: A New Geopolitical Theater
South Asia: A New Geopolitical Theater
South Asia: A New Geopolitical Theater
South Asia: A New Geopolitical Theater
Highlights A perfect storm has engulfed global energy markets. Strong economic growth, adverse weather conditions, and politically-induced supply disruptions have caused energy prices to surge. Fortunately, the global economy has become less vulnerable to energy shocks. Not only has the energy intensity of the global economy declined over the past few decades, but central banks are now less inclined to respond to higher energy prices by raising interest rates. Stock returns have been positively correlated with oil prices over the past decade. This suggests that equities can withstand the current level of oil prices. Markets are betting that energy prices will come down. Yet, given the diminished feedback loop between higher energy prices and slower economic growth, energy prices can stay elevated for longer than the market is discounting. We remain long the December 2022 Brent Crude futures contract as well as the Russian ruble and the Brazilian real. Value stocks are a cheap and effective hedge against higher-than-expected inflation. A Perfect Storm For Energy Markets Global energy prices have soared (Chart 1). The price of crude, having fallen into negative territory in April 2020, currently trades at over $80 per barrel. Natural gas prices have jumped more than three-fold in the UK and across much of continental Europe since March. In the US, the price of natural gas has doubled. Chart 1Natural Gas Prices Have Dipped, But Are Still Up Massively On The Year
Natural Gas Prices Have Dipped, But Are Still Up Massively On The Year
Natural Gas Prices Have Dipped, But Are Still Up Massively On The Year
Chart 2Global Industrial Production Is Back Above Pre-Pandemic Levels
Global Industrial Production Is Back Above Pre-Pandemic Levels
Global Industrial Production Is Back Above Pre-Pandemic Levels
A perfect storm has driven up energy prices. The reopening of the global economy has supported energy demand. A surge in spending on goods has depleted inventories, forcing producers to ramp up output. Global industrial production is 8% higher than in January 2020 (Chart 2). Merchandise trade has recovered more quickly than expected (Chart 3). Chinese exports are up 28% from the start of the pandemic (Chart 4). Electricity consumption in China is running 7.5% above trend (Chart 5). Chart 3World Trade Has Recovered Faster Than Expected
The Global Energy Crisis: Causes And Consequences
The Global Energy Crisis: Causes And Consequences
Chart 4China's Export Sector Is Booming
China's Export Sector Is Booming
China's Export Sector Is Booming
Chart 5Strong Manufacturing Activity Has Pushed Up Electricity Demand In China
Strong Manufacturing Activity Has Pushed Up Electricity Demand In China
Strong Manufacturing Activity Has Pushed Up Electricity Demand In China
Weather has amplified the tightness in energy markets. A cold snap across the Northern Hemisphere this spring depleted natural gas supplies (Chart 6). Compounding the problem, a lack of wind reduced energy production by European wind farms, leading to a shift toward natural gas and coal for power generation. A hot summer in Northern Asia raised electricity demand. Flooding in China and Indonesia curbed coal output, while a drought in Brazil reduced hydroelectric generation. Chart 6Natgas Storage Remains Tight
The Global Energy Crisis: Causes And Consequences
The Global Energy Crisis: Causes And Consequences
Political Factors Policy developments have contributed to the dislocations in energy markets. China has been trying to wean itself off coal, which still accounted for 63% of electricity generation in 2020 (Chart 7). For a while, Australian coal imports made up for the lack of domestic coal production, but those disappeared last year following a diplomatic row between the two nations (Chart 8). To fill the energy gap, China has stepped up purchases of natural gas from Russia. Chart 7China Has Been Trying To Shift Away From Coal
The Global Energy Crisis: Causes And Consequences
The Global Energy Crisis: Causes And Consequences
Chart 8A Lack Of Aussie Coal Imports Has Depleted Chinese Coal Inventories
A Lack Of Aussie Coal Imports Has Depleted Chinese Coal Inventories
A Lack Of Aussie Coal Imports Has Depleted Chinese Coal Inventories
Never one to miss an opportunity, Russia has taken advantage of the natural gas shortage by pushing Germany to approve the newly completed Nord Stream 2 pipeline. The US$11 billion pipeline carries gas directly to Germany. Built under the Baltic Sea, it bypasses Ukraine and thus deprives the NATO-allied government in Kyiv of as much as $2 billion a year in transit fees. The pipeline was backed by outgoing chancellor Angela Merkel and has the strong support of the German public (Chart 9). However, opposition from the US has kept the project in limbo. Texas Senator Ted Cruz has blocked approval for President Biden’s nominees to various departmental posts in an effort to halt the pipeline. Chart 9Germans Say "Ja" To Nord Stream 2
The Global Energy Crisis: Causes And Consequences
The Global Energy Crisis: Causes And Consequences
Cruz has justified his actions on foreign policy grounds. However, economics has probably also played a role: The US is Europe’s top supplier of liquefied natural gas. Texas exported 2.5 trillion cubic feet of natural gas last year. It’s Not Just ESG Years of subpar investment in the energy sector have exacerbated the crisis. Globally, oil and gas capex is down 60% since 2014 (Chart 10). Proven global oil reserves increased by only 6% between 2010 and 2020, having risen by 26% over the preceding decade. Gas reserves followed a similar trajectory, increasing by only 5% between 2010 and 2020 compared to 30% over the prior ten years (Chart 11). It would be easy to blame ESG for this predicament, but the truth is that energy had been a lousy sector for investors until recently. The shares of global energy companies have risen just 25% since March 2009, compared to 315% for the MSCI All-Country World Index (Chart 12). Chart 10Energy Producers Have Not Been Investing Much In New Capacity
The Global Energy Crisis: Causes And Consequences
The Global Energy Crisis: Causes And Consequences
Chart 11Oil And Gas Reserves Have Barely Grown Over The Past Decade
The Global Energy Crisis: Causes And Consequences
The Global Energy Crisis: Causes And Consequences
The Global Economy Is Less Dependent On Energy Could the jump in energy prices torpedo growth? It is possible, but the bar for an energy-induced recession is much higher than in the past. The energy intensity of the global economy has fallen steadily over time, especially in advanced economies. Today, the US generates three-times as much output for every joule of energy consumed than it did in 1970 (Chart 13). Chart 12Low Returns On Capital Have Reduced Investment In The Energy Sector
Low Returns On Capital Have Reduced Investment In The Energy Sector
Low Returns On Capital Have Reduced Investment In The Energy Sector
Chart 13The Global Economy Has Become Less Energy Intensive Over Time
The Global Economy Has Become Less Energy Intensive Over Time
The Global Economy Has Become Less Energy Intensive Over Time
In the US, household spending on energy has declined from a peak of 8.3% of disposable income in 1980 to 3.5% in August 2021, the latest month of data. Chart 14When It Comes To Energy Production, The USA Is Now #1
When It Comes To Energy Production,The USA Is Now #1
When It Comes To Energy Production,The USA Is Now #1
While the recent run-up in energy prices will push up that number towards 4% in October, US consumers are well positioned to absorb the blow. Last week’s “disappointing” September jobs report saw private-sector employment rise by 317,000. Combined with an increase in the average length of the workweek, aggregate hours worked rose by 0.8% on the month – equivalent to 1,036,000 new private-sector jobs. Improved conditions for energy producers will also help insulate the US economy. The US now produces over 11 million barrels of oil per day, more than Saudi Arabia (Chart 14). Higher energy costs will exact more of a toll on European growth. However, as Mathieu Savary, BCA’s Chief European Strategist, recently argued, the region is likely to weather the storm given current strong growth momentum. Central Banks No Longer Fret Over Higher Oil Prices Helping matters is the fact that central banks are no longer responding to rising energy prices like they once did. Up until the Global Financial Crisis, the Fed would often lift rates whenever oil prices jumped (Chart 15). Since then, the Fed has looked through oil price fluctuations, a sensible strategy considering that core inflation is no longer highly correlated with oil prices (Chart 16). Chart 15Rising Oil Prices No Longer Scare The Fed
Rising Oil Prices No Longer Scare The Fed
Rising Oil Prices No Longer Scare The Fed
Chart 16Oil Spikes No Longer Feed Into Core Inflation Like They Used To
Core Inflation No Longer Driven By Oil Prices Oil Spikes No Longer Feed Into Core Inflation Like They Used To
Core Inflation No Longer Driven By Oil Prices Oil Spikes No Longer Feed Into Core Inflation Like They Used To
The ECB has also changed tack. Jean-Claude Trichet disastrously hiked rates when oil prices reached $140/bbl in 2008, just as the global economy was heading off a cliff. Having failed to learn from his mistake the first time around, he then pushed the ECB to raise rates two times in 2011, helping to set off the euro area debt crisis. Mario Draghi and Christine Lagarde have followed a different course. In her speeches, Lagarde has pushed back on any talk that the ECB will expedite policy normalization. “The lady isn’t tapering,” she said on September 9th, echoing Margaret Thatcher’s famous proclamation. Energy Prices Should Come Off The Boil, But Geopolitics And The Weather Are Wild Cards Chart 17US Rig Count Has Risen From Low Levels
US Rig Count Has Risen From Low Levels
US Rig Count Has Risen From Low Levels
Looking out, a number of factors should help restore balance to the energy market. The US rig count, while still far below its 2014 highs, has doubled since last year (Chart 17). It usually takes 6-to-9 months for a newly deployed rig to start producing output. China has instructed 170 coal mines to expand capacity. It has also allowed utilities to charge higher prices, helping to stave off bankruptcies across the sector. In addition, it is releasing some Australian coal from storage, potentially a first step towards restarting imports. Still, there are many wild cards at play that could cause energy prices to rise further. In addition to uncertainty over Chinese energy policy and the ongoing dispute over the Nord Stream 2 pipeline, the situation in Iran remains volatile. Matt Gertken, BCA’s Chief Geopolitical Strategist, believes that Iran could secure enough enriched uranium to make a nuclear device by the end of the year. In his opinion, “a crisis over Iran is imminent.” Any disruption of Middle Eastern energy flows will add to global supply bottlenecks and price pressures. Furthermore, there is continued uncertainty about OPEC’s strategy. So far, OPEC and its partners have been reluctant to boost production. The general feeling among market participants is that OPEC would increase output if oil prices rose towards $100/bbl for fear that excessively high prices would expedite the adoption of electric vehicles. At this point, however, that electric horse has left the barn. OPEC may simply decide that it is better to wrangle out as much revenue from its reserves while they still have value. Weather also remains a wild card. The US Climate Prediction Center estimates that there is a 70%-to-80% chance that La Niña will return this winter. La Niña typically results in colder temperatures across much of Western and Northern Europe, which would lead to higher electricity demand. Investment Implications Markets are betting that energy prices will come down. The futures curves are in backwardation (Chart 18). Investors expect oil, gas, and coal prices to decline over the coming months (Chart 19). Chart 18Energy Futures Are In Backwardation
Energy Futures Are In Backwardation
Energy Futures Are In Backwardation
Chart 19Investors Expect Commodity Prices To Fall
The Global Energy Crisis: Causes And Consequences
The Global Energy Crisis: Causes And Consequences
One does not need to bet on higher energy prices these days to make money from being long energy futures; one only needs to bet that prices will not fall as much as currently discounted. Given the diminished feedback loop between higher energy prices and slower economic growth, the view of BCA’s Commodity and Energy Strategy service, led by Bob Ryan, is that energy prices can stay elevated for longer than the market is discounting. Chart 20Stock Prices Are Now Positively Correlated With Oil
Stock Prices Are Now Positively Correlated With Oil
Stock Prices Are Now Positively Correlated With Oil
We remain long the December 2022 Brent Crude futures contract as well as the Russian ruble and the Brazilian real. Stock returns have been positively correlated with oil prices over the past decade (Chart 20). This suggests that equities can withstand the current level of oil prices. Some stocks will do better than others, however. Energy and banks are overrepresented in value indices (Table 1). Energy stocks will do well if oil prices remain buoyant (Chart 21). For their part, banks should also outperform the market if bond yields continue to drift higher (Chart 22). Table 1Breaking Down Growth And Value By Sector
The Global Energy Crisis: Causes And Consequences
The Global Energy Crisis: Causes And Consequences
Chart 21Higher Oil Prices Are A Tailwind For Energy Stocks
Higher Oil Prices Are A Tailwind For Energy Stocks
Higher Oil Prices Are A Tailwind For Energy Stocks
Chart 22Bank Stocks Tend To Outperform When Yields Rise
Bank Stocks Tend To Outperform When Yields Rise
Bank Stocks Tend To Outperform When Yields Rise
Chart 23Inflation Expectations Are Highly Correlated With Oil Prices
Inflation Expectations Are Highly Correlated With Oil Prices
Inflation Expectations Are Highly Correlated With Oil Prices
In fixed-income portfolios, we continue to prefer TIPS over nominal bonds. Chart 23 shows that the 5y/5y forward TIPS breakeven inflation is highly correlated with oil prices. Thus, overweighting TIPS remains an effective hedge against an oil spike. Peter Berezin Chief Global Strategist pberezin@bcaresearch.com Global Investment Strategy View Matrix
The Global Energy Crisis: Causes And Consequences
The Global Energy Crisis: Causes And Consequences
Special Trade Recommendations
The Global Energy Crisis: Causes And Consequences
The Global Energy Crisis: Causes And Consequences
Current MacroQuant Model Scores
The Global Energy Crisis: Causes And Consequences
The Global Energy Crisis: Causes And Consequences
Next week is the BCA Annual Conference, at which I will debate Professor Nouriel Roubini on ‘The Outlook For Cryptocurrencies’. I will make the passioned case for cryptos, and Nouriel will make the passioned case against. I do hope that many of you can join the debate, as well as the other insightful sessions at the conference. As such, there will be no report next week and we will be back on October 28. Highlights The anomaly of the current ‘inflation crisis’ is not that goods and commodity prices have surged. The anomaly is that state intervention protected services prices from a massive (and continuing) negative demand shock. Absent the state intervention, there would not be the current ‘inflation crisis’. On a 6-12-month horizon: Underweight the durables-heavy consumer discretionary sector versus the market. Underweight commodities that have not yet sharply corrected versus those that have sharply corrected. For example, underweight tin versus iron ore. From the current ‘inflation crisis’, the real surprise could be how low inflation ends up 12 months from now. Hence, stay overweight US T-bonds versus US TIPS. Fractal analysis: Natural gas, plus industrial metals versus industrial metal equities. Feature Chart of the WeekServices Prices Suffered In The Post-GFC Services Slump...
Services Prices Suffered In The Post-GFC Services Slump...
Services Prices Suffered In The Post-GFC Services Slump...
Chart of the Week...But Not In The Post-Pandemic Services Slump. Why Not?
...But Not In The Post-Pandemic Services Slump. Why Not?
...But Not In The Post-Pandemic Services Slump. Why Not?
The great writers, artists, and musicians tell us that the most profound messages often come from what is not said, not painted, and not played. What does not happen is sometimes more significant than what does happen. In this vein, we believe that the real story of the current ‘inflation crisis’ is not what has happened to goods and commodity prices, but what has not happened to services prices. The real story is that while goods and commodity prices have reacted exactly as would be expected to a positive demand shock, services prices have not reacted as would be expected to the mirror-image negative demand shock. The Anomaly Is Not Goods Prices, It Is Services Prices The following analysis quantifies the impact of the pandemic on different parts of the economy by examining the deviations of current spending and prices from their pre-pandemic trends. The analysis uses US data simply because of its timeliness and granularity, but the broad patterns and conclusions apply equally to most other developed economies. Looking at the overall economy, we know that, thus far, we have experienced neither a lasting negative demand shock from the pandemic, nor a lasting positive demand shock from the ensuing stimulus. We know this, because current spending is not far short of its pre-pandemic trend. The real story of the current ‘inflation crisis’ is not what has happened to goods and commodity prices, but what has not happened to services prices. Yet when we drill down to the components of spending, we see a different story. The pandemic and its policy response unleashed a massive and unprecedented displacement of spending from services to goods (Chart I-2). Chart I-2The Pandemic Unleashed A Massive Displacement Of Spending From Services To Goods
The Pandemic Unleashed A Massive Displacement Of Spending From Services To Goods
The Pandemic Unleashed A Massive Displacement Of Spending From Services To Goods
By March 2021, while US spending on services was still below its pre-pandemic trend by $700 billion, or 8 percent, the displacement of those dollars of spending had boosted spending on the smaller durable goods component by 26 percent. Suffice to say, a 26 percent excess demand for durable goods cannot be satisfied by a modern manufacturing sector that utilises just-in-time supply chains and negligible spare capacity! As surging demand met relatively fixed supply, the price of durable goods skyrocketed to the current 11 percent above its pre-pandemic trend (Chart I-3). Chart I-3The Inflation In Durables Prices Is Rational, The Absence Of Deflation In Services Prices Is Irrational
The Inflation In Durables Prices Is Rational, The Absence Of Deflation In Services Prices Is Irrational
The Inflation In Durables Prices Is Rational, The Absence Of Deflation In Services Prices Is Irrational
It follows that the inflation in durables prices is the perfectly rational outcome of a classic positive demand shock – meaning, surging demand in the face of limited supply. What is much less rational is that a massive negative demand shock for services has had almost no negative impact on services prices. This is the untold story of the current ‘inflation crisis’ which requires further explanation. Government Intervention Prevented A Collapse In Services Prices If the pandemic had unleashed a classic negative demand shock for services, then services prices would have collapsed. We know this because in the aftermath of the global financial crisis (GFC), services prices fell below their pre-GFC trend exactly in line with the decline in services demand. But in the aftermath of the pandemic’s massive negative shock for services spending, services prices have remained on their pre-pandemic trend (Chart of the Week). The question is, how? The answer is that this was not a classic negative demand shock. The reason that service spending collapsed was that a large swathe of services – such as leisure and hospitality – became unavailable because of mandated shutdowns or lockdowns. In this case, there was no point in reducing prices to reattract demand from durable goods because nobody could buy these services anyway! In effect, while the goods sector remained subject to market forces, a large swathe of the service sector came under state intervention, and was no longer subject to market forces. Meanwhile, statisticians continued to record the seemingly unaffected price of eating out or going to the theatre, even though most restaurants and entertainment venues were shuttered, making their prices meaningless. Absent state intervention in the services sector, we would not be talking about the current ‘inflation crisis’. Absent state intervention, these service providers would have had to reduce their prices to attract wary consumers amid a pandemic. This we know from Sweden, the one major economy that did not have any mandated shutdowns or lockdowns. While leisure and hospitality have remained largely open, Sweden’s services prices have declined markedly from their pre-pandemic trend – in sharp contrast to the unchanged trend in the US (Chart I-4). Chart I-4Services Prices Have Declined In Non-Interventionist Sweden, But Not In The Interventionist US
Services Prices Have Declined In Non-Interventionist Sweden, But Not In The Interventionist US
Services Prices Have Declined In Non-Interventionist Sweden, But Not In The Interventionist US
Hence, while inflation now stands at a sedate 2 percent in Sweden, it stands at a hot 5 percent in the US. If the US (and other country) governments had not intervened in the services sector, then the evidence from the GFC in 2008 and Sweden today strongly suggests that services prices would be below their pre-pandemic trend, offsetting goods prices that are above their pre-pandemic trend. The result would be that the overall price level would be on, or close to, its pre-pandemic trend. Just as overall spending is on its pre-pandemic trend. To repeat the key message of this analysis, the anomaly in most economies is not that goods and commodity prices have surged. The price surge is the perfectly rational response to a positive demand shock. The anomaly is that services prices did not react negatively to a negative demand shock (Chart I-5 and Chart I-6), as they did post-GFC and post-pandemic in non-interventionist Sweden. Chart I-5The Anomaly Is Not That Goods Prices ##br##Rose...
The Anomaly Is Not That Goods Prices Rose...
The Anomaly Is Not That Goods Prices Rose...
Chart I-6...The Anomaly Is That Services Prices Did Not Fall
...The Anomaly Is That Services Prices Did Not Fall
...The Anomaly Is That Services Prices Did Not Fall
The untold story is that, absent state intervention in the services sector, we would not be talking about the current ‘inflation crisis’. What Happens Next? The surging demand for durables is correcting. Since March, it is already down by 15 percent but requires a further 7 percent decline to reach its pre-pandemic trend, which we fully expect to happen. After all, there are only so many smartphones and used cars that you can own! Meanwhile, as manufacturers respond with a lag to recent high prices, expect a tsunami of durables supply to hit in 6-12 months just as demand has fallen off a cliff. The result will be a major threat to any durable good or commodity price that has not already corrected. As a salutary warning of what lies ahead, witness the recent 75 percent crash in lumber prices. The same principle applies to non-durables such as food and energy. Non-durables spending is likely to fall back to its pre-pandemic trend, and non-durables prices are likely to follow. Again, outside a short-lived surge in demand from, say, a very cold winter, there is only so much energy and food that you can consume. For services, there are two opposing forces. The inflationary force is that the recent inflation in goods will transmit into wages and therefore into services prices. Against this, the deflationary force is that structural changes, such as hybrid home/office working, mean that services spending will struggle to make the near 6 percent increase to reach its pre-pandemic trend. Underweight the durables-heavy consumer discretionary sector versus the market. Pulling these effects together, we reiterate three investment recommendations on a 6-12 month horizon: Underweight the durables-heavy consumer discretionary sector versus the market (Chart I-7). Underweight commodities that have not yet sharply corrected versus those that have sharply corrected. For example, underweight tin versus iron ore. From the current ‘inflation crisis’, the real surprise could be how low inflation ends up 12 months from now. Hence, stay overweight US T-bonds versus US TIPS. Chart I-7As Durables Spending Normalises, The Durables-Heavy Consumer Discretionary Sector Underperforms
As Durables Spending Normalises, The Durables-Heavy Consumer Discretionary Sector Underperforms
As Durables Spending Normalises, The Durables-Heavy Consumer Discretionary Sector Underperforms
Natural Gas Prices Are Technically Extreme The surge in natural gas prices in both Europe and the US has reached a point of extreme fragility on its 130-day fractal structure. Hence, if the tight fundamentals show the slightest signs of abating, natural gas prices would be vulnerable to a sharp reversal (Chart I-8). Chart I-8Natural Gas Prices Are Technically Extreme
Natural Gas Prices Are Technically Extreme
Natural Gas Prices Are Technically Extreme
Elsewhere, we see an arbitrage opportunity between industrial metal prices, which are still close to highs, and industrial metal equities, which have plunged by 20 percent since May. The relationship between the underlying metal prices and the metals equities sector is now stretched versus its history, and on its composite 65/130-day fractal structure (Chart I-9). Chart I-9The Relationship Between Metal Prices And Metal Equities Is Stretched
The Relationship Between Metal Prices And Metal Equities Is Stretched
The Relationship Between Metal Prices And Metal Equities Is Stretched
Hence, the recommended trade is to go short the LMEX Index/ long nonferrous metals equities. One way to implement the long side of the pair is through the ETF PICK. Set the profit target and symmetrical stop-loss at 8 percent. Dhaval Joshi Chief Strategist dhaval@bcaresearch.com Fractal Trading System Fractal Trades 6-Month Recommendations Structural And Thematic Recommendations Closed Fractal Trades Indicators To Watch - Bond Yields Chart II-1Indicators To Watch - Bond Yields ##br##- Euro Area
Indicators To Watch - Bond Yields - Euro Area
Indicators To Watch - Bond Yields - Euro Area
Chart II-2Indicators To Watch - Bond Yields ##br##- Europe Ex Euro Area
Indicators To Watch - Bond Yields - Europe Ex Euro Area
Indicators To Watch - Bond Yields - Europe Ex Euro Area
Chart II-3Indicators To Watch - Bond Yields ##br##- Asia
Indicators To Watch - Bond Yields - Asia
Indicators To Watch - Bond Yields - Asia
Chart II-4Indicators To Watch - Bond Yields ##br##- Other Developed
Indicators To Watch - Bond Yields - Other Developed
Indicators To Watch - Bond Yields - Other Developed
Indicators To Watch - Interest Rate Expectations Chart II-5Indicators To Watch - Interest Rate Expectations
Indicators To Watch - Interest Rate Expectations
Indicators To Watch - Interest Rate Expectations
Chart II-6Indicators To Watch - Interest Rate Expectations
Indicators To Watch - Interest Rate Expectations
Indicators To Watch - Interest Rate Expectations
Chart II-7Indicators To Watch - Interest Rate Expectations
Indicators To Watch - Interest Rate Expectations
Indicators To Watch - Interest Rate Expectations
Chart II-8Indicators To Watch - Interest Rate Expectations
Indicators To Watch - Interest Rate Expectations
Indicators To Watch - Interest Rate Expectations
Highlights In this report, we take a close look at corporate margins by analyzing their key drivers: The general level of economic activity, trends in labor costs and productivity, borrowing costs, tax rates, depreciation charges, the exchange rate, and corporate pricing power. The likely contraction of margins next year will be driven by a combination of factors: First and foremost, a slowdown in top-line growth and a decline in corporate pricing power. In the meantime, the tight labor market is putting upward pressure on wage growth despite a peak in productivity improvement. Input costs are also on the rise with PPI soaring, cutting into corporate profitability. Depreciation is already rising on the back of the recent recovery in capex. Interest expense has bottomed in the face of rising rates, and the potential healing of corporate balance sheets is leading to re-leveraging to raise capital for capex and buybacks. The US corporate tax rate is bound to increase based on news from Capitol Hill. The model above encapsulates all of these moving parts (Chart 1) and reiterates that the path of least resistance is lower for US corporate margins. S&P 500 operating margins are likely to contract in 2022. Feature Profits Have Rebounded S&P 500 earnings growth has rebounded vigorously from the pandemic low. Operating earnings-per-share stand 32% YoY above the January 2020 pre-pandemic high (Chart 2). Margins have also exceeded pre-pandemic levels of 11.7% reaching 14.4% in September (Chart 3). The basic story behind a rebound in profitability is well understood: Companies have cut costs aggressively, productivity has improved, lower interest rates have reduced debt servicing burdens, a weaker dollar has boosted overseas earnings, and corporate pricing power has strengthened. Gauging the direction of change for each of these various factors will help us assess whether profits can continue growing, and whether operating margins can continue expanding. Chart 1After An Impressive Surge, Margins Are Set To Decline
Marginally Worse
Marginally Worse
Chart 2Profits Have Rebounded Vigorously
Profits Have Rebounded Vigorously
Profits Have Rebounded Vigorously
Chart 3Margins Are Above Pre-pandemic High
Margins Are Above Pre-pandemic High
Margins Are Above Pre-pandemic High
Sneak Preview: We expect profit margins to contract in 2022 NIPA Operating Margins vs S&P 500 Operating Margins The market tends to focus on S&P 500 earnings and these can be measured on a reported or operating basis, with the latter removing the effects of one-off charges. In order to better understand the path of S&P 500 margins, we aim to relate profits to the economic cycle; to do so, we analyze the data from the national income and product accounts (NIPA) because they are fully integrated with GDP and any related series. National non-financial after-tax profits without the inventory valuation adjustment (IVA) and the capital consumption adjustment (CCAdj)1 are conceptually closest to S&P 500 profits as they measure the after-tax worldwide earnings of US corporations. Fortunately, the S&P and equivalent national income measures of operating profits broadly track each other over the long run, although the S&P data display greater volatility. The NIPA profit margin series is 70% correlated with S&P 500 operating profit margins. While this level of correlation indicates that long-term trends in NIPA profits and S&P earnings are broadly similar, short-term annual and quarterly growth rates can differ dramatically. The Key Drivers Of Profitability A number of factors can influence the path of profits: The general level of economic activity, including trends in borrowing costs, tax rates, depreciation charges, the exchange rate, productivity, and corporate pricing power. It clearly would be most bullish if productivity had been the main driver because any future benefits from the other four sources will be limited. Interest rates will normalize at some point, and effective tax rates seem more likely to rise than fall from current levels, and we should hope for faster depreciation in line with increased capital spending. In addition, the downside in the dollar is constrained by the desire of other countries to maintain competitive exchange rates. Corporate pricing power is the sole mitigating factor against these cost pressures. In this report, we will methodically go through and assess the outlook for each of these profit drivers, and their cumulative effect on profit margins for the next year or so. Revenue Growth Is A Key To Margin Expansion The EBITD measure of domestic non-financial profits excludes the impact of changes in taxes, interest rates and depreciation charges and is thus the series that is most directly affected by the underlying economic cycle and by productivity. Moreover, because it covers only domestic profits, it is not overly influenced by exchange-rate movements. GDP growth and NIPA EBITD margin expansion move in tandem. The post-pandemic rebound in economic growth has underpinned margin recovery (Chart 4). However, real GDP forecasts have recently been cut from 6.5% to just under 6% for 2021, and to 4% in 2022 (Chart 5). Slower growth suggests that the pace of margin expansion will also slow. Chart 4EBITD Margins Usually Track GDP
EBITD Margins Usually Track GDP
EBITD Margins Usually Track GDP
Chart 5GDP Growth Is Expected To Slow
GDP Growth Is Expected To Slow
GDP Growth Is Expected To Slow
Cost Drivers Of Profits Labor Expense As Percentage Of Sales Has Been Falling Looking at the expense side of the NIPA Income Statement, we note that labor costs are singlehandedly the largest expense, hovering around 50% of sales, dwarfing all the other expense items (Chart 6). The NIPA EBITD margin allows us to gauge the effect of changes in labor costs on the bottom line. Chart 6Labor Costs Are The Largest Expense
Labor Costs Are The Largest Expense
Labor Costs Are The Largest Expense
After the initial spike to 54% of sales at the beginning of the pandemic, explained by rapidly falling sales and an inability of companies to rapidly reduce employee numbers, labor costs as a percentage of sales have been reverting to historical levels. This is a curious phenomenon as wages have recently been on the rise: The number of open positions has been exceeding the number of job seekers by over a million, indicating that jobs are plentiful. As a result, the quit rate has exploded (Chart 7). To attract and retain workers, businesses have been raising compensation, leading to average weekly earnings rising by more than 5% year over year. As a result, wages-to-sales have been trending up (Chart 8). Chart 7Quit Rate Exploded Pushing Wages Up
Quit Rate Exploded Pushing Wages Up
Quit Rate Exploded Pushing Wages Up
Chart 8Wages-to-Sales Have Been Trending Up
Wages-to-Sales Have Been Trending Up
Wages-to-Sales Have Been Trending Up
If companies must pay more for labor, why has the labor expense as percentage of sales fallen? To answer this question, we will look at the selling prices over unit labor costs as a proxy for the EBITD margin (Chart 9) to examine the underlying profitability as a function of labor costs. However, since the beginning of the pandemic, this stable relationship has broken down, with selling prices falling over unit labor costs, while margins have been expanding. Digging deeper, we notice that NIPA sales prices have rebounded (Chart 10) due to a surge in inflation and a rise in a corporate pricing power (Chart 11), while unit labor costs dived. This can be attributed to a pandemic productivity surge (Chart 12), making it cheaper to produce each additional unit. Chart 9A Proxy For EBITD Margin
A Proxy For EBITD Margin
A Proxy For EBITD Margin
Chart 10Sales Prices Are Up, Unit Labor Costs Are Down
Sales Prices Are Up, Unit Labor Costs Are Down
Sales Prices Are Up, Unit Labor Costs Are Down
Chart 11US Corporate Power Is Waning
US Corporate Power Is Waning
US Corporate Power Is Waning
Chart 12Productivity Has Peaked
Productivity Has Peaked
Productivity Has Peaked
However, after rising for months, the ability of companies to raise prices further has been diminished by consumers’ income increasing slower than inflation, reducing their purchasing power. Improvements in productivity have also peaked and are unlikely to propel margins higher. Input Costs Are Soaring While cost of goods sold (COGS) is not one of the lines in the NIPA income statement, we would be remiss not to mention that input costs have been on the rise. The most recent reading in PPI was up 8.3% YoY (Chart 13). The price of oil has been surging as well. An increase in the cost of materials definitely has an adverse effect on corporate margins. We will quantify the effects of the year-on-year percentage of PPI on margins later in this report. Chart 13Input Prices Have Soared
Input Prices Have Soared
Input Prices Have Soared
Other Drivers Of Profitability: Depreciation, Interest And Taxes Switching gears to other costs, interest, taxes, and depreciation expenses are likely to increase going forward. Capex Is Rising, So Will Depreciation Expense Depreciation expense is the second largest expense in the cost structure, constituting some 15% of sales. Between mid-2009 and mid-2012, depreciation charges fell sharply, curtailed by weak investment growth during the Global Financial Crisis (GFC) economic downturn. Similarly, the same story unfolded during the 2015 manufacturing slowdown, and the pandemic-induced recession (Chart 14). Today, growth in US domestic fixed investment has rebounded at rates comparable to the 2000 and 2010 recoveries. The trend will continue: According to the Philly Fed Manufacturing Survey, capex intentions have been rising (Chart 15). As a result, depreciation expense is set to climb, cutting into margins and earnings. Chart 14Capex Surge Will Lead To Higher Depreciation
Capex Surge Will Lead To Higher Depreciation
Capex Surge Will Lead To Higher Depreciation
Chart 15More Capex Is Under Way
More Capex Is Under Way
More Capex Is Under Way
Interest Costs Set To Increase With Rising Rates Interest charges are small compared to other expenses, never rising above 5% of sales. There has been quite a lot of variability in interest charges in recent years, reflecting swings in both interest rates and the level of corporate borrowing (Chart 16). Falling interest costs provided a boost to profits between 2008 and 2010, as well as during the trade war and the pandemic. Also, corporations have been de-leveraging, but this trend is about to turn: As the corporate sector heals, it is likely to re-leverage, whether to finance capex or buybacks. With interest rates set to rise, interest costs are likely to become a drag on profits (Chart 17). Chart 16Higher Rates And Corporate Re-Leveraging Will Push Interest Costs Up
Higher Rates And Corporate Re-Leveraging Will Push Interest Costs Up
Higher Rates And Corporate Re-Leveraging Will Push Interest Costs Up
Chart 17Corporate Debt Has Bottomed
Corporate Debt Has Bottomed
Corporate Debt Has Bottomed
Effective Tax Rates Are Likely To Increase Effective tax rates have fallen from about 18% in 2014-2017 to 12% in January 2018 because of the Trump Administration’s tax reform and remain low by historical standards (Chart 18). Meanwhile, taxes paid have also been hit by the 2020 downturn thanks to temporary tax breaks, and have not yet rebounded to pre-pandemic levels, thereby aiding margin expansion. However, given the Biden Administration’s push to increase the US corporate tax rate and eliminate loopholes, chances are that tax expenses will rise. Chart 18Effective Tax Rates Are Low By Historical Standards
Effective Tax Rates Are Low By Historical Standards
Effective Tax Rates Are Low By Historical Standards
Overseas Profits So far, we have focused on the domestic drivers of changes in margins. Yet for many US corporations, especially the ones in the S&P 500, overseas profits are a key source of profits. Many industries derive a substantial share of sales from abroad, and for Technology, this number stands as high as 58%. Historically, overseas profits have been a tremendous source of growth (Chart 19) thanks to rising exposure to fast-growing emerging economies, a weaker dollar, and the transfer of operations to low-tax regimes. However, recently this trend has turned due to closing loopholes allowing companies to locate headquarters in lower tax regime jurisdictions, tax reform, foreign profits amnesty, and unified global pressure to tax US multinationals. Onshoring of manufacturing production is another emerging trend that is likely to improve the efficiency of supply chains but will add to production expenses, chipping away at corporate profitability. The US dollar has been weakening during the pandemic, giving a boost to profits thanks to both lower prices of the American goods and translation effects (Chart 20). Chart 19Overseas Profits Are Trending Down
Overseas Profits Are Trending Down
Overseas Profits Are Trending Down
Chart 20USD TRW Is Strengthening
USD TRW Is Strengthening
USD TRW Is Strengthening
Hence, we conclude that the share of overseas profits is unlikely to change and is not going to become an engine for profit growth for US corporations. Where Next For Profits? The clear implication from the above analysis is that profits have ceased to benefit from earlier benign trends in depreciation charges, interest costs, and tax rates. Looking ahead, these factors, are destined to become modest headwinds for profit growth. Sales growth is also likely to slow as GDP growth returns to trend, with overseas profits less of a source of growth. And importantly, productivity growth and pricing power have peaked and turned, depriving the economy of its key drivers of margin expansion. S&P 500 The obvious question is how all the factors affecting NIPA margins translate into the forecast for change in S&P 500 operating margins. S&P 500 margins are subject to the same profit drivers as the NIPA accounts. In order to forecast the effect of these factors on the year-on-year changes in operating margins, we have built a simple regression model that uses year-on-year changes in average hourly earnings (AHE) to capture the cost of labor; high-yield option-adjusted spreads (OAS) to capture the cost of borrowing; year-on-year PPI as a change in cost of input materials; the trade-weighted USD as an indicator capturing change in foreign profits; and, lastly, the BCA pricing power indicator to measure companies’ ability to pass on these costs to their customers (Table 1). Table 1Regression To Predict Operating Margins YoY%
Marginally Worse
Marginally Worse
The model forecast of margin growth peaked in August 2021 and is about to slow into the balance of the year (Chart 21). Margins will contract outright in December 2021-January 2022. The growth rate for margins in January 2022 is -65% year on year. In January 2021, operating margins were 7.2%. Incorporating a negative year-on-year growth rate, we arrive at margins of only 2.6%, which is certainly very low. The caveat here is that our objective is to predict the direction of change as opposed to working out a point estimate of future margins. In other words, there is a wide confidence interval around any forecast of earnings given the unpredictability of movements in the exchange rate, productivity and the general level of economic activity. However, our assumptions are conservative, and the model clearly points to a margin contraction in 2022. Chart 21After An Impressive Surge, Margins Are Set To Decline
Marginally Worse
Marginally Worse
And lastly, why will margins contract? What is the main culprit that would make things worse? The answer is an increase in input and labor costs (PPI and AHE), both of which are no longer being offset by a corporate pricing power: The ability of corporations to pass on their costs to customers has diminished, and margins are going to take a hit (Chart 22 & Table 2). Chart 22Increase In Costs Is No Longer Offset By Pricing Power
Marginally Worse
Marginally Worse
Table 2Contributions To Margins Growth
Marginally Worse
Marginally Worse
Bottom Line Earnings growth and profit margins are of paramount importance to the performance of equities – as we wrote in a report in August, the key driver of returns has shifted from multiple expansion to earnings growth. Despite the recent pullback, the S&P 500, trading at 20.5x forward multiples, is still expensive. Our analysis shows that S&P 500 operating margins are likely to contract in 2022 because of rising wages, a slowdown in productivity, increases in interest and depreciation expenses, and potential tax hikes. On the revenue side, US GDP growth is slowing, and corporate pricing power is waning, making it difficult to pass on rising costs to customers. Impending margin contraction does not bode well for the strong performance of US equities in the year ahead. Irene Tunkel Chief Strategist, US Equity Strategy irene.tunkel@bcaresearch.com Footnotes 1 Profits before tax reflect the charges used in tax accounting for inventory withdrawals and depreciation. The inventory valuation adjustment (IVA) and the capital consumption adjustment (CCAdj) are used to adjust before-tax profits to NIPA asset valuation concepts. The IVA adjusts inventories to a current-cost basis, which is similar to valuation of inventory withdrawals on a last-in/first-out basis. The CCAdj adjusts tax-reported depreciation to the NIPA concept of economic depreciation (or “consumption of fixed capital”), which values fixed assets at current cost and uses consistent depreciation profiles based on used asset prices. Recommended Allocation
Highlights The surge in European natural gas prices is a consequence of China’s effort to wean itself off its coal addiction and of the energy supply problems around the world. As long as the energy price surge does not threaten a policy response by the ECB, it will not plunge Europe into a significant downturn. So far, the ECB is unlikely to respond, because a wage-inflation spiral has not developed. Natural gas prices will decline significantly over the coming months, as a result of the Nord Stream 2 pipeline and other developments around the world; thus, the energy price shock will not spill over into a durable inflation wave across the continent. Without a significant risk of premature monetary tightening, European cyclical assets will perform well over the coming 18 months. EUR/USD will stabilize in the 1.15-1.12 zone, and peripheral bonds will continue to outperform the core. Feature Europe is amidst an unprecedented energy crisis, following the past three months’ 235% and 240% increases in natural gas prices in the UK and the Netherlands’ benchmarks, respectively. Investors now begin to fear that this energy crunch will threaten the European economic recovery and could even plunge Europe into a renewed recession. Underlying inflation must rise enough to prompt a hawkish monetary policy response for the energy price spike to topple the economy. Higher energy prices alone will not be enough. Despite the current panic, more supply will make its way to Europe. Future prices are skewed to the downside from here. As a result, investors should refrain from betting on a rapid removal of monetary accommodation from the ECB. Additionally, an end to the energy crisis will allow the euro to recover and will help European cyclical assets. A Multifaceted Crisis The extraordinary spike in European energy and electricity prices reflects a rare confluence of events. Chart 1China's Wean Off From Coal
China's Wean Off From Coal
China's Wean Off From Coal
First, China’s intake of natural gas is surging because of two decisions made by Beijing. The Xi Jinping administration is fighting aggressively to improve air quality in the country, because pollution is one of the population’s main worries. As a result, China is aiming to curtail the role of coal (which today accounts for 63% of its electricity production) in its energy mix; coal production is not following electricity generation (Chart 1, top panel). Coal imports are not substituting for the lack of domestic supply growth. Instead, China has cut its intake of Australian coal dramatically (Chart 1, bottom panel) in response to tensions between the two nations. Natural gas is filling the gap. Second, the rest of the world is also voraciously absorbing natural gas. The Korean economy has greatly benefited from the global rebound in industrial activity, and Japan is increasingly re-opening, a result of its accelerating vaccination campaign. Latin America has become an unusual buyer of LNG. Low rainfalls in Brazil have caused hydro-power generation to be well under normal levels this summer. As a result, natural gas shipments were also called upon to fill this gap. Third, Europe’s investment in alternatives is facing difficulties. As Chart 2 highlights, the EU generates 26% of its electricity generation from renewables; wind accounts for 55% of this category. However, as BCA’s commodity strategists recently showed, wind power generated low levels of output last summer across the EU and the UK, which occasioned a scramble for natural gas and coal power generation. This process forced Europe to bid up LNG prices to compete with China, which caused European natural gas inventories to fall below the seasonal range of the past five years (Chart 3). Chart 2Europe’s Reliance On Renewable
The European Energy Crisis
The European Energy Crisis
Chart 3Low Nat Gas Inventories
The European Energy Crisis
The European Energy Crisis
Chart 4There's A Reason Why Energy Is Not Attracting Capital
There's A Reason Why Energy Is Not Attracting Capital
There's A Reason Why Energy Is Not Attracting Capital
Fourth, the lack of investment in the energy sector over the past seven years is slowing the supply response. Much of the blame for this phenomenon has been laid on rising ESG standards, which have disincentivized banks, insurance companies, and pension plans from putting money in the energy sector. This is only partially true. The main culprit behind this lack of investment is the poor return generated in the energy sector over the past twelve years, especially compared to the tech sector. As an example, in Europe, ASML surged by more than 5000% since March 6 2009, whereas Royal Dutch Shell rose 19% (Chart 4). The former naturally attracted significantly more capital than the latter. Fifth, utilities are fearing a cold winter and are trying to stock up natural gas ahead of the cold season. The US Climate Prediction Center assigns a 70% to 80% chance of a La Niña event this winter. La Niña is a complex weather pattern that results in colder surface temperatures in the Pacific Ocean; it often produces colder temperatures across much of Western and Northern Europe. The effort to shore up depressed inventory levels ahead of this potential threat increases the pressure on natural gas prices. Bottom Line: The surge in European natural gas prices reflects a confluence of unusual forces. China is trying to move away from polluting coal electricity generation, while global demand has been buoyed by the re-opening of the economy and exceptional weather patterns. Moreover, the supply response of the energy sector is tepid following seven years of low capital investment because of low rates of returns. To add insult to injury, EU CO2 emission allocation prices reached a record of EUR64.3/ton in September, which adds to the pressure on electricity prices created by record natural gas prices. From Energy Crunch To Recession? This rapid climb in energy prices is bound to affect European economic activity in the fourth quarter as some firms must curtail production. However, important counterbalances will limit this pain. Hence, on its own, the energy crisis is unlikely to cause a major slowdown or recession. Natural gas, oil, and coal consumption only represent a small share of output at 2% of GDP, or the lowest level since 1999 (Chart 5). If we assume that all energy prices average their 2008 peaks for the next 12 months, the energy spending as a share of GDP will hit 5%, still below the 2008 apex. We do not believe average energy prices will be that high for that long (see European Nat Gas Prices Have Downside section). Thus, while the current energy prices surge is painful for many, the effective tax on the overall European economy remains manageable. Robust income expansion compensates for this small growth-tax increase. The Eurozone Gross National Income is rebounding smartly since its Q2 2020 trough. Exports outside the Eurozone are near all-time highs, and the goods and services balance of the current account is strong (Chart 6). Chart 5Energy Spending Is Small
The European Energy Crisis
The European Energy Crisis
Chart 6Offsets To Rising Energy Costs
Offsets To Rising Energy Costs
Offsets To Rising Energy Costs
Chart 7Resilient Confidence
Resilient Confidence
Resilient Confidence
Confidence surveys remain unphased by the tumult in the energy market. The European Commission Consumer and Business Confidence Surveys stand near 3- and 14-year highs, respectively (Chart 7, top panel). The Belgian Business Confidence Survey, which historically acts as a bellwether for the whole of Europe, still stands near its all-time high. Even more surprising, the retail sales survey continues to climb higher (Chart 7, second panel). In Germany, which is historically sensitive to energy prices, the Ifo Business Climate index is remarkably stable (Chart 7, third panel). Even Italy, which is exceptionally reliant on natural gas, is resilient: Consumer confidence hit a ten-year high, and business confidence remains close to its recent record (Chart 7, bottom panel). Fiscal policy is creating another important offset to higher energy prices. Underlying government deficits are tabulated to decrease from 3.8% of GDP for the Eurozone in 2020 to 3.6% in 2021 and 1.5% in 2022. However, this is happening as private sector savings decline rapidly, the result of the re-opening of the economy and robust confidence. Instead, what matters is that the deficit will remain large by historical standards and is creating more aggregate demand than in the pre-pandemic period (Chart 8). Moreover, the NGEU funds will spend an envelop worth EUR750 billion, mostly for vulnerable economies, such as Italy or Spain. Ultimately, it requires more than just rising energy prices to prompt an economic contraction. The US provides an interesting example. As Chart 9 illustrates, when previous sharp increases in commodity prices were associated with a rapid tightening in monetary policy, a recession followed. This time around, monetary policy is looking through the surge in input prices, because global central bankers firmly believe that the recent increase in inflation is transitory. Similarly, because credit spreads remain very narrow, equity prices remain elevated, and global bond yields are still very low, global financial conditions will remain extremely accommodative. Thus, if inflation does not broaden and central bankers do not panic, growth will turn out to be fine. Chart 8No More Budget Surpluses
The European Energy Crisis
The European Energy Crisis
Chart 9Higher Commodity Prices Alone Won't Cause A Recession
Higher Commodity Prices Alone Won't Cause A Recession
Higher Commodity Prices Alone Won't Cause A Recession
Bottom Line: The European energy crisis is causing investors to worry, and many now fear that a major slowdown or even another contraction in output is in the offing. However, carbon-based energy represents too small a share of GDP to cause such a dire outcome, especially when income growth remains strong, confidence is elevated, and fiscal policy is broadly accommodative. Ultimately, the reaction of central bankers will determine the outlook for economic activity. Will The ECB Respond To Inflation? The hurdle is very high for the ECB to respond to the recent increase in HICP to 3.4%. To begin with, the ECB is still reeling from its decision to lift the repo rate twice, to 1.5% in 2011 when HICP reached 3% on the back of strong energy prices (Chart 10). This decision is now widely considered a policy mistake that accentuated the European sovereign debt crisis. Beyond a fear of repeating history, the ECB is constrained by the narrow nature of European inflation. As Chart 11 shows, trimmed mean CPI, which includes 84% of the consumer prices index components, remains extremely depressed by historical standards, highlighting the role of a few components in driving up overall inflation. Moreover, shelter inflation remains a tepid 1.1%. Hence, the surge in CPI reflects higher commodity prices and base-effects from the pandemic. Chart 10The 2011 Mistake
The 2011 Mistake
The 2011 Mistake
Chart 11Inflation Is Still Narrowly Based
Inflation Is Still Narrowly Based
Inflation Is Still Narrowly Based
Wage dynamics will determine when energy prices will cause a broad-based increase in inflation. Without significantly higher wage growth, higher energy prices are a relative price shock that saps spending in other areas. For now, the de-linking of Bund yields and European energy prices confirms we are still facing such a price shock (Chart 12, top panel). Trends in hourly earnings and negotiated wages are currently also inconsistent with generalized inflation (Chart 12, second and third panel). Obviously, the situation may change. It will require a large adjustment in expectations. For now, European inflation expectations are trending higher, but they remain mostly a function of dynamics in the energy market (Chart 13, top panel). Similarly, the fluctuations in energy prices strongly influence the perception of firms about their ability to raises prices (Chart 13, bottom panel). Chart 12A Relative Price Shock, Not Generalized Inflation
A Relative Price Shock, Not Generalized Inflation
A Relative Price Shock, Not Generalized Inflation
Chart 13Inflation Expectations Will Follow Energy Prices
Inflation Expectations Will Follow Energy Prices
Inflation Expectations Will Follow Energy Prices
Ultimately, energy price inflation must remain elevated for several more months before inflation expectations become permanently unhinged. Thus, if energy prices stabilize or decrease in the new year, then no wage-inflation spiral will develop, and the ECB will not lift policy rates and prompt a severe slowdown in economic activity. Bottom Line: Due to the memory of the 2011 policy mistake and the lack of broad-based inflationary pressures in Europe, the ECB will continue to ignore the rise in headline inflation. However, if energy price increases perdure long enough, inflation expectations and wages will become problematic. Only in this context will the ECB tighten policy and prompt a severe slowdown. European Nat Gas Prices Have Downside We expect European natural gas prices to decline significantly over the coming months, which will prevent the ECB from tightening policy too early and cause a significant growth slowdown. The opening of the Nord Stream 2 pipeline early next year is a game changer. German regulators still have to announce whether to allow deliveries to flow to the domestic market, but Russia is already filling the pipeline completed last month. Moreover, the German public widely supported the project in May (Chart 14), and the recent energy crunch must have only solidified this trend. Nord Stream 2 is key for another reason. Russia limited the inflow of gas to Europe ahead of the pipeline opening to improve its negotiation position and put pressure on Germany to accept the project. Most importantly, the IEA estimates that Russia has ample capacity to supply European gas markets, and the trend in Russian gas production remains healthy (Chart 15). Chart 14Broad-based Support For Nord Stream 2
The European Energy Crisis
The European Energy Crisis
Chart 15Nat Gas Production Profiles
The European Energy Crisis
The European Energy Crisis
Outside of Russia, other gas producers will continue to ramp up production. Australia is becoming an increasingly important player in the global LNG market and its production is rising (Chart 15, second panel). Qatari production has been flat for nine years. However, recent permit auctions point toward a strong increase in production in the North Field, in the order of 40% by 2026, buttressed by $60 billion in capex from 2021 to 2025. Saudi Arabia, too, is expected to increase natural gas production from next year to 2025. Finally, US production is still expanding; the IEA expects this country to become the world’s largest LNG exporter by 2025. A large part of the fears about higher European natural gas prices over the coming months relate to La Niña. Investors understand full well that it could generate a cold winter and are focusing on this risk, which is already reflected in natural gas prices. However, La Niña also causes wetter winters in Brazil, which would allow a resumption of hydro-power generation in this market. Additionally, La Niña also results in unstable winter conditions in Northern Europe, which suggests that wind will increase; the latter would alleviate some of the problems linked to renewable power that have forced natural gas prices higher. The growth in LNG demand from Asia should also slow in the near term. China is committed to its shift away from coal-powered electricity production, but the inability to produce enough electricity has caused occasional blackouts and electricity rationing around the country. In response to these pressures, Chinese authorities have recently started to allow deliveries of Australian coal. Moreover, in Japan, Fumio Kishida, the recently elected head of the LDP, is a big supporter of nuclear energy, and he plans to re-open nuclear plants rapidly after becoming prime minister. Such a move would quickly decrease Japan’s appetite for LNG. Finally, Iran remains a wild card. Iran possesses the second largest natural gas reserves in the world after Russia and is the world’s third-largest producer. Europe currently cannot access that gas because of the US post-JCPOA sanctions. However, Israel and the US are now in favor of returning to the conditions of the JCPOA, which means that, if a deal is hastened, Iranian natural gas will find its way into the global market. While it is not a base case for 2021, it is a positive tail outcome that would have a large impact on the natural gas market and help Europe greatly. Bottom Line: European natural gas prices have likely already peaked or will do so soon. The Nord Stream 2 pipeline, which should begin deliveries this winter, is an important development, especially because Russia has the capacity to supply Europe adequately. Moreover, global production of natural gas is set to increase meaningfully over the coming years. While La Niña would result in lower winter temperatures in Europe, which boost demand, it would also help in terms of the supply of hydropower in Brazil and wind in Northern Europe; meanwhile, Japan looks set to restart nuclear power generation under a Kishida administration. Finally, both the US and Israel are warming up to a return to the JCPOA with Iran, which would result in a great increase in international supply. This last point is more a downside risk for natural gas prices than a factor we are banking on. Investment Implications We expect natural gas prices to depreciate over the coming months, and thus, the current shock will have little enduring impact on European economic activity. The lack of recession risk suggests that our 18-month preference for markets like Germany, Sweden, and small cap remains appropriate. It also means that the tactical window for Spain to outperform remains open. Peripheral spreads will also remain well behaved, and Italian, Portuguese, Greek, and Spanish bonds will outperform German and French bonds further. Without higher natural gas prices, inflation expectations will not become unanchored to the upside, and the ECB will maintain a very accommodative monetary policy. Not only will the ECB lag well behind the Fed in terms of increasing interest rates, it will also remain an active buyer of European bonds next year. We continue to be a buyer of EUR/USD in the 1.15-1.12 region. The ECB is unlikely to come to the rescue of the euro; however, tighter peripheral spreads, continued growth convergence with the US, and a rebound next year in global economic activity will help the common currency. Mathieu Savary, Chief European Strategist Mathieu@bcaresearch.com Tactical Recommendations
The European Energy Crisis
The European Energy Crisis
Cyclical Recommendations
The European Energy Crisis
The European Energy Crisis
Structural Recommendations
The European Energy Crisis
The European Energy Crisis
Closed Trades
The European Energy Crisis
The European Energy Crisis
Currency Performance Fixed Income Performance Equity Performance
The unfolding energy crises coupled with rising wages on the back of companies struggling to fill job openings, compelled to take a close look at US margins. In order to forecast effects of these factors on the YoY changes in S&P operating margins, we built a simple regression model that uses YoY changes in AHE to capture the cost of labor, high yield OAS to capture the cost of borrowing, PPI YoY as a proxy for the change in costs of input materials, USD TRW as an indicator capturing changes in foreign profits, and finally the BCA pricing power indicator to measure companies’ ability to pass on these costs to their customers (Table 1). Table 1
Margins Trouble Ahead
Margins Trouble Ahead
The model predicts that margins’ growth has already peaked and is due for a slowdown into the balance of the year (see Chart 1). Margins will likely contract in December 2021-January 2022 printing a negative 65% YoY number. Translating YoY growth into the headline margins number we arrive at 2.6%, which is certainly very low. A caveat here is that our objective is to predict the direction of change as opposed to work out a point estimate of the future margins. In other words, there is a wide confidence interval around any forecast of earnings given the unpredictability of moves in the exchange rate, productivity and the general level of economic activity. However, our assumptions are conservative, and the model clearly points to a margin contraction in 2022. Chart 1
Margins Trouble Ahead
Margins Trouble Ahead
Bottom Line: S&P margins have likely peaked and will head lower over the coming several quarters. Please stay tuned for more details in the upcoming Strategy Report.
Highlights Taiwan remains the epicenter of global geopolitical risk, as highlighted by the past week’s significant increase in saber-rattling around Taiwan and across East Asia and the Pacific. Tensions may subside in the short run, as the US and China resume high-level negotiations. But then again they may not. And they will most likely escalate over the long run. Investors should judge the Taiwan scenario based on China’s capabilities rather than intentions. China’s intentions may never be known but it is increasingly capable of prevailing in a war over Taiwan. Before then, economic sanctions and cyber attacks are highly likely. The US has a history of defending Taiwan from Chinese military threats. Washington is trying to revive its strategic commitment to Asia Pacific. But US attempts to increase deterrence could provoke conflict. The simplest solution to Taiwan tensions is for a change of party in Taiwan. This would require an upset in the 2022 and especially 2024 elections. China may try to arrange that. Otherwise the risk of conflict will increase. A sharp economic slowdown in China is the biggest risk for investors, as it would not only be negative for the global economy but also would threaten domestic political stability, discredit the gradual and non-military approach to incorporating Taiwan, and boost nationalist and jingoistic pressures directed against Taiwan. Feature Chart 1China's Confluence Of Internal And External Risks
China's Confluence Of Internal And External Risks
China's Confluence Of Internal And External Risks
China faces a historic confluence of internal and external political risks. This was our key view for 2021 and it continues to be priced by financial markets (Chart 1). The latest example of these risks is the major bout of saber-rattling over Taiwan. The US sent two aircraft carriers, and the UK one carrier, to the waters southwest of Okinawa for naval drills with Japan, Canada, the Netherlands, and New Zealand. Related drills are occurring across Southeast Asia, including Vietnam, Singapore, Malaysia, and others. Meanwhile the Chinese air force let loose its largest yet intrusion into Taiwan’s air defense identification zone (Chart 2). The US assured Japan that it would defend the disputed Senkaku islands, while Japan said that it would seek concrete options – beyond diplomacy – for dealing with Chinese pressure. Chart 2China’s Warning To Taiwan
Biden, Xi, And Taiwan
Biden, Xi, And Taiwan
Chart 3Market Response To Saber-Rattling Over Taiwan Strait
Market Response To Saber-Rattling Over Taiwan Strait
Market Response To Saber-Rattling Over Taiwan Strait
Yet, at the same time, a diplomatic opening emerged between the US and China. A virtual summit is expected to be scheduled between Presidents Joe Biden and Xi Jinping. The Biden administration unveiled its review of US trade policy toward China, with mixed results (i.e. imply a defensive rather than offensive trade policy). China offered to join the Trans-Pacific Partnership trade deal (the CPTPP). All sides exchanged prisoners, with Huawei’s Meng Wanzhou back in China. In the short run global investors will cheer attempts by the US and China to stabilize relations. But over the long run tensions over Taiwan suggest the underlying US-China strategic confrontation will persist. We do not doubt that global risk appetite will improve marginally on the news, including toward Chinese and Taiwanese assets (Chart 3). But investors should not mistake summitry for diplomacy, or diplomacy for concrete and material strategic de-escalation. The geopolitical outlook is gloomy for China and Taiwan. Grand Strategies Collide US grand strategy forbids countries from creating regional empires lest they challenge the US for global empire. China has the long-term potential to dominate the eastern hemisphere. The US now quite explicitly seeks to counter China’s growing economic, technological, military, and political influence. China’s grand strategy forbids countries from interfering in its domestic affairs and undermining its economic and political stability. This could include eroding its territorial integrity, jeopardizing its supply security, or denying its maritime access. The US still has considerable capabilities on this front, particularly due to its control of the oceans and special relationship with Taiwan, the democratic island that China claims as a province but that the US supplies with arms. Historically, the Kingdom of Tungning (1661-83) exemplifies that a rival political and naval power rooted in Taiwan can jeopardize the security of southern China and hence all of China (Map 1). Taiwan’s predicament is geopolitically unsustainable and the difference between the past 72 years and today is that Beijing increasingly has the military means of doing something about it. Map 1Why Taiwan’s Status Quo Is Geopolitically Unsustainable
Biden, Xi, And Taiwan
Biden, Xi, And Taiwan
China seeks to establish maritime access, expand its navy, and improve supply security. This process points toward turf battles with the US and its allies and could easily lead to conflict over Taiwan, the East and South China Seas, and other strategic approaches to China. It could also lead to conflict over technological access. The latter is an economic and supply vulnerability that relates directly to Taiwan, which produces the world’s most advanced computer chips. The Chinese strategy since the Great Recession, under two presidents of two different factions, has been to take a more assertive stance on domestic and foreign policy, economic policy, territorial disputes, and supply security. This hawkish turn occurred in response to falling potential GDP growth, which ultimately threatens social stability and the survival of the political regime. Hong Kong was long the symbol that the western liberal democracies could coexist with the Chinese Communist Party. China’s reduction of Hong Kong’s political autonomy over the past decade violated this understanding. Taiwan is now increasingly concerned about its autonomy while the West is looking to deter China from attacking Taiwan. China is willing to wage war if the West attempts to make Taiwan’s autonomous status permanent through increased military support. The US strategy since the Great Recession, under three presidents of two different parties, has been to raise the costs on China for its increasingly assertive policies, particularly in acquiring technology and using economic and military coercion against neighbors. The US is increasing its use of sanctions, secondary sanctions, tariffs, export controls, cyber warfare, and regional strategic deterrence. Hence the policy consensus in both the US and China is more confrontational than cooperative. The Biden administration is largely maintaining President Trump’s punitive measures toward China while trying to build an international coalition to constrain China more effectively. Meanwhile the Xi administration is refusing to hand over power to a successor in 2022, so there will not be a change in Chinese strategy. The US is politically divided, a major factor in Beijing’s favor. China is politically unified, particularly on the question of Taiwan. But one area of national consensus in the US is the need to become “tougher” with respect to China. President Trump’s policies and the COVID-19 pandemic reinforced this consensus. The number of Americans who would support sending US troops to Taiwan if China invaded has risen from 19% in 1982 to 52% today – meaning that the country is divided but fear of China is driving a shift in opinion.1 Chart 4Taiwan Strait Risk Shoots Up To 1950s Levels And Beyond
Biden, Xi, And Taiwan
Biden, Xi, And Taiwan
The China Cross-Strait Academy, a new think tank with pro-mainland sympathies, has produced a Cross Strait Relations Risk Index that goes back to 1950 and utilizes 59 factors ranging from politics and diplomacy to military and economics. It suggests that tensions have reached historically high levels, comparable to the 1950s, when the first and second Taiwan Strait crises occurred (Chart 4). Beware Chinese Economic Crisis – Or Concerted US Action Tensions across the Taiwan Strait began to rise in 2012 when the Communist Party adopted a more hawkish national policy in response to potential threats to its long-term rule arising from the Great Recession. The 2014 “Sunflower Protests” in Taiwan and “Umbrella Protests” in Hong Kong symbolized the rise in tension as Beijing sought to centralize control across Greater China. Support for the political status quo in Taiwan peaked around this time, although most Taiwanese still prefer the status quo to any final decision on the island’s status, which could trigger conflict (Chart 5). China’s militarization of rocks and reefs in the South China Sea throughout the 2010s gave it greater control over the strategic approaches to Taiwan. Since 2016, we have argued that geopolitical risk in the Taiwan Strait would rise on a structural, long-term basis for the following reasons: (1) China’s economic downshift triggered power consolidation and outward nationalism (2) Taiwanese opinion was shifting away from integration with the mainland (3) the US was attempting a strategic shift of focus back to Asia and countering China. Underlying this assessment was the long-running trend of rising support for independence and falling support for unification with China (Chart 6). Chart 5Taiwanese Favor Status Quo Indefinitely
Biden, Xi, And Taiwan
Biden, Xi, And Taiwan
Chart 6Very Few Taiwanese Favor Reunification, Now Or Later
Biden, Xi, And Taiwan
Biden, Xi, And Taiwan
China’s crackdown on Hong Kong from 2016-19 escalated matters further as it removed the “one country, two systems” model for Taiwan (Chart 7). China continues to insist on this solution. In 2013 and again in 2019, Xi Jinping declared that the Taiwan problem cannot be passed down from one generation to another, implying that he intended to resolve the matter during his tenure, which is expected to extend through 2035. Whether Xi has formally altered China’s cross-strait policy is debatable.2 But his use of military intimidation is not. The US policy of “strategic ambiguity” is debatable but the historical record is clear. In the three major crises in the Taiwan Strait (1954-55, 1958, and 1995-96), the US has sent naval forces to the area and clearly signaled that it would defend Taiwan against aggression.3 However, in diplomatic matters, the US has constantly downgraded Taiwan: for instance, transferring its United Nations seat to China in 1971, revoking its mutual defense treaty in 1980, and prioritizing economic cooperation with China in recent decades. The implication is that the US will not stand in the way of unification unless Beijing attempts to achieve it through force of arms. China’s conclusion from US behavior must be that it can definitely overtake Taiwan by means of economic attraction and diplomacy over time. For example, Beijing’s assertion of direct control over Hong Kong took 20 years and ultimately occurred without any resistance from the West. By contrast, a full-scale attack poses major logistical and military risks and potentially devastating costs if the US upholds its historic norm of defending Taiwan. China’s economy and political system could ultimately be destabilized, despite any initial nationalistic euphoria. Taiwan’s wealth (and semiconductor fabs) would be piles of ash. Of course, Taiwan is different from Hong Kong. The Taiwanese people can believe realistically that they have an alternative to direct rule from Beijing. If mainland China’s economic trajectory falters then the option of absorbing Taiwan gradually will fall away. Today about 30%-40% of Taiwanese people believe cross-strait economic exchange should deepen (Chart 8). Only one period of Taiwanese policy since 1949, the eight years under President Ma Ying-jeou (2008-16), focused exclusively on cross-strait economic integration and deemphasized the tendency toward greater autonomy. If China’s economic prospects dim, then Beijing will become more inclined toward the military option, both to distract from domestic instability and to prevent Taiwan from entertaining independence. Chart 7Taiwanese Oppose "One Country, Two Systems"
Biden, Xi, And Taiwan
Biden, Xi, And Taiwan
Chart 8Taiwanese Not Enthusiastic About Cross-Strait Economic Integration
Biden, Xi, And Taiwan
Biden, Xi, And Taiwan
Chart 9Taiwanese Identify Exclusively As Taiwanese, Not Chinese
Biden, Xi, And Taiwan
Biden, Xi, And Taiwan
Most likely China already has the capability to fight and win a war within the “first island chain,” including over Taiwan, especially if US intervention is hesitant or limited. But any doubts will likely be dispelled in the coming years. As long as China’s military advantage continues to grow, Beijing will increasingly view Taiwan as an object that it can take at will, regardless of whether economic gradualism would eventually work. The Taiwanese increasingly view themselves as distinctly Taiwanese – not Chinese or a mix of Taiwanese and Chinese (Chart 9). The implication is that it may be too late for China to win over hearts and minds. However, Beijing will presumably want to see whether Taiwan’s pro-independence Democratic Progressive Party (DPP) can be dislodged from power in the 2024 elections before making a drastic leap to war. Taiwan, like the US and other democracies, is internally divided. President Tsai Ing-wen’s narrative of Taiwan’s democratic triumph over authoritarianism is not only applied to the mainland but also directed against Taiwan’s own Kuomintang (KMT).4 The country is unified on its right to expand economic and diplomatic cooperation with the West but it is starkly divided on whether the US should formally ally with Taiwan, sell it arms, and defend it from invasion (Chart 10A). Kuomintang supporters say they are not willing to fight and die for Taiwan in the face of any invasion (Chart 10B). American policymakers complain that Taiwan’s military structure and policies – long managed by the KMT – are not seriously aimed at preparing for asymmetric warfare against Chinese invasion. Chart 10ATaiwan Divided On Whether US Should Increase Military And Strategic Support
Biden, Xi, And Taiwan
Biden, Xi, And Taiwan
Chart 10BTaiwan Divided On War Sacrifice
Biden, Xi, And Taiwan
Biden, Xi, And Taiwan
The international sphere also matters for Beijing’s calculus. If the US remains divided and distracted – and allies curry favor with China – then China will presumably continue the gradualist approach. But if the US unifies at home and forges closer ties with allies, aiming to curb China’s economy and defend Taiwan’s democracy, then China may be motivated to take military action sooner. If the US and allies want to deter an attack on Taiwan, they need to signal that war will exact profound costs on China, such as crippling economic sanctions, a full economic blockade, or allied military intervention. But the West’s attempts to increase deterrence could spur China to take action before the West is fully prepared. Unlike the US in the Cuban Missile Crisis, China cannot accept a defeat in any showdown over arms sales to Taiwan. Its own political legitimacy is tied up with Taiwan, contrary to that of the US with Cuba. Given the lack of American willingness to fight a nuclear war over a non-treaty ally, the probability of China launching air strikes would be much higher (Diagram 1). Diagram 1Game Theory Of A Fourth Taiwan Strait Crisis
Biden, Xi, And Taiwan
Biden, Xi, And Taiwan
The US is not trying to give Taiwan nuclear arms, or other game-changing offensive systems, although the US has sent marines and special operations forces to help train Taiwanese troops. It is up to Beijing when to make an ultimatum regarding US military support.5 Ultimately the US still controls the seas and China depends on the Persian Gulf for nearly half of its oil imports. This is a good reason for China not to invade Taiwan. But if the US imposes an oil blockade, then the US and China will go to war – this is how the US and Japan came to blows in World War II. The danger is that China assesses that the US will not go that far. Will Biden-Xi Summit Reduce Tensions? Not Over The Long Run True, strategic tensions could be calmed in the short run. The US is restarting talks with China and setting up a bilateral summit between Presidents Biden and Xi. The two sides have exchanged prisoners (e.g. Meng Wanzhou), held climate talks, and Beijing has offered to join the Trans-Pacific Partnership. The US Trade Representative is suggesting it could ease some of President Trump’s tariffs under pressure from corporate lobbyists. The Biden administration is also likely to seek Beijing’s cooperation in other areas, such as North Korea and Iran. Biden has an urgent problem with Iran and may need China’s help constraining Iran’s nuclear program. However, none of the current initiatives change the underlying clash of grand strategies outlined above. A fundamental US-China reengagement is not in the cards. China is adopting nationalism and mercantilism to deal with its slowing potential growth, while China-bashing is one of the few areas of US national consensus. Specifically: Democracy over autocracy: The Biden administration cannot afford to be seen as smoothing the way for Xi Jinping to restore autocracy in the twentieth National Party Congress 12 months from now. China doubles down on manufacturing: China is not making liberal reforms to its economy to lower trade tensions but rather doubling down on state-led manufacturing and technological acquisition, according to the US Trade Representative.6 The US trade deficit is surging due to US fiscal stimulus. Biden will maintain or even expand high-tech export controls. Climate cooperation is limited: The US public does not agree that it should exchange its homegrown fossil fuels for Beijing’s renewable energy equipment, and the US and EU are flirting with “carbon adjustment fees,” which would be tariffs on carbon-intensive goods imports from places like China. Meanwhile China just told its state-owned enterprises to do everything in their power to secure coal for electricity and ordered banks to lend more to coal companies. North Korea is already a nuclear-armed state, which China condoned, despite multiple rounds of negotiations with the West. No agreement on Iran: If China helps force Iran to accept restrictions on its nuclear program, then that could mark a substantial improvement. But China has made long term commitments to Iran recently and probably will not backtrack on them unless the US makes major concessions that would undermine its attempts to counter China. The Taiwan conundrum undermines trust. If China can be brought to help the US with historic deals on North Korea or Iran, it will expect the US to stand back from Taiwan. The US may not see it that way. A failure to do so will appear a betrayal of trust. Consider China’s bid to join the Trans-Pacific Partnership. China’s state-driven economic model is fundamentally at odds with the TPP. It only takes one member to veto China’s membership, and Australia and Japan would defer to the US on this issue. The US is only likely to rejoin the TPP, which requires Republican support in Congress, on the basis that it is a vehicle for countering China. Even if the TPP members could be convinced to accept China, they would also want to accept Taiwan, which Beijing would refuse. Ultimately if China’s membership is vetoed, then it will conclude that the West is not serious about economic integration. China will be excluded and will be more inclined to pursue its own solutions to problems. China possesses or is close to possessing the capability of taking Taiwan by force today. We cannot rule it out. Taiwanese Defense Minister Chiu Kuo-cheng just claimed it could be attempted as early as 2025. Other estimates point to important Chinese calendar dates as deadlines for Taiwan’s absorption: 2027 (centenary of the People’s Liberation Army), 2035 (Xi Jinping’s long-term policy program), and 2049 (centenary of the People’s Republic of China). The truth is that any attack on Taiwan would not be based on symbolic anniversaries but on maximizing the element of surprise, China’s military capabilities, and foreign lack of readiness and coordination. Given that China’s capabilities are in place, or nearly in place, and nobody can predict such things precisely, investors should be prepared for conflict at any time. Investment Takeaways Chart 11Taiwanese Dollar Strengthened Since Trump
Taiwanese Dollar Strengthened Since Trump
Taiwanese Dollar Strengthened Since Trump
The Taiwanese dollar has rallied since the escalation of US-China strategic tensions in 2016. The real effective exchange rate is now in line with its historic average after a long period of weakness (Chart 11). The trade war and COVID-19 have reinforced Taiwan’s advantage as a chokepoint for semiconductors and tech exports. If we thought there was no real risk of a war, we would not stand in the way of this rally. But based on geopolitical assessment above, the rally could be cut short at any time. Taiwanese equities have also rallied sharply for the same reasons – earnings have exploded throughout the pandemic and semiconductor shortage (Chart 12). Equities are not overly expensive on a cyclically adjusted price-to-earnings basis. But they are meeting resistance at a level that is slightly above fair value. Again, the macro and market fundamentals are positive but geopolitics is deeply negative. We remain underweight Taiwan. China’s willingness to try to stabilize relations with the US is an important positive sign that global investors will cheer in the short run. However, with the US economy fired up, and China’s export machine firing on all cylinders, Chinese authorities apparently believe they can maintain relatively tight monetary, fiscal, and regulatory policy, according to our Emerging Markets Strategy and China Investment Strategy. This will lead to negative outcomes in China’s economy and financial markets. The domestic economy is weak and animal spirits in the private sector are depressed. Retail sales, for example, have dropped far beneath their long-term trend (Chart 13). Chart 12Taiwanese Stocks Not Exactly Cheap
Taiwanese Stocks Not Exactly Cheap
Taiwanese Stocks Not Exactly Cheap
Chart 13China: Consumer Sentiment Weak
China: Consumer Sentiment Weak
China: Consumer Sentiment Weak
The regulatory crackdown on the property sector could trigger an economic and financial crisis (Chart 14). Chinese onshore equity markets were ultimately not able to sustain the collapse in sentiment this year that hit offshore equities even harder. China’s technology sector will continue to struggle under the burden of hawkish regulation, while Chinese stocks ex-tech have long underperformed the broad market (Chart 15). Chart 14China's Huge Property Sector Looking Wobbly
China's Huge Property Sector Looking Wobbly
China's Huge Property Sector Looking Wobbly
Chart 15Beware Financial Turmoil In Mainland China
Beware Financial Turmoil In Mainland China
Beware Financial Turmoil In Mainland China
We maintain the view that Chinese authorities will ease policy when necessary to try to prevent deleveraging in the property sector from triggering a crisis ahead of the twentieth national party congress. A look at past five-year political rotations suggests that bank loans will be flat-to-up over the coming 12 months and that fixed asset investment will tick up (Chart 16). But as long as policymakers are reluctant, risks lie to the downside for Chinese assets and related plays. Chart 16National Party Congress 2022 Requires Overall Stability
National Party Congress 2022 Requires Overall Stability
National Party Congress 2022 Requires Overall Stability
Chart 17GeoRisk Indicators Flash Warnings
GeoRisk Indicators Flash Warnings
GeoRisk Indicators Flash Warnings
China’s shift from “consensus rule” to “personal rule,” i.e. reversion to strongman rule or autocracy, permanently increases the risk of policy mistakes. This could apply to fiscal and regulatory policy as much as to cross-strait policy or foreign policy. It is appropriate that our geopolitical risk indicators for China and Taiwan are rising, signaling that equities are not yet out of the woods (Chart 17). Over the long run China is capable of staging a surprise attack and defeating Taiwan. We have argued that the odds are small this year but that some crisis is imminent – and that the risk of war will rise in the coming years. This is especially true if China cannot engineer a recession to get the Kuomintang back into power in 2024. However, from a fundamentally geopolitical point of view, any attack is bound to be a surprise and hence investors should be prepared. The three main conditions for a conflict over Taiwan are: (1) Chinese domestic instability (2) an American transfer of game-changing offensive weapon systems to Taiwan (3) a formal Taiwanese movement toward independence. The likeliest of these, by far, is Chinese instability. Matt Gertken Vice President Geopolitical Strategy mattg@bcaresearch.com Footnotes 1 See Dina Smeltz and Craig Kafura, "For First Time, Half Of Americans Favor Defending Taiwan If China Invades," Chicago Council on Global Affairs, August 26, 2021, thechicagocouncil.org. 2 See Lu Hui, "Xi says ‘China must be, will be reunified’ as key anniversary marked," Xinhua, January 2, 2019, Xinhuanet.com. For a less alarmist reading of Xi’s recent speeches, see David Sacks, "What Xi Jinping’s Major Speech Means For Taiwan," Council on Foreign Relations, July 6, 2021, cfr.org. 3 See Ian Easton, "Will America Defend Taiwan? Here’s What History Says," Strategika, Hoover Institution, June 30, 2021, hoover.org. 4 See Tsai Ing-wen, "Taiwan and the Fight for Democracy," Foreign Affairs, November/December 2021, foreignaffairs.com. 5 See Gordon Lubold, "U.S. Troops Have Been Deployed In Taiwan For At Least A Year," Wall Street Journal, October 7, 2021, wsj.com. 6 Office of the US Trade Representative, "Fact Sheet: The Biden-Harris Administration’s New Approach To The U.S.-China Trade Relationship," October 4, 2021, ustr.gov.
Weekly Performance Update For the week ending Thu Oct 07, 2021 The Market Monitor displays the trailing 1-quarter performance of strategies based around the BCA Score. For each region, we construct an equal-weighted, monthly rebalanced portfolio consisting of the top 3 stocks per sector and compare it with the regional benchmark. For each portfolio, we show the weekly performance of individual holdings in the Top Contributors/Detractors table. In addition, the Top Prospects table shows the holdings that currently have the highest BCA Score within the portfolio. For more details, click the region headers below to be redirected to the full historical backtest for the strategy. BCA US Portfolio
Market Monitor (Oct 7, 2021)
Market Monitor (Oct 7, 2021)
Total Weekly Return BCA US Portfolio S&P500 TRI 1.95% 2.18% Top Contributors EPD:US SHW:US AMN:US DECK:US WMG:US Weekly Return 21 bps 15 bps 14 bps 13 bps 13 bps Top Detractors KOF:US WAT:US BRKR:US SIM:US SC:US Weekly Return -10 bps -9 bps -1 bps -1 bps -0 bps Top Prospects ESGR:US WAT:US IT:US ANAT:US GOOG.L:US BCA Score 95.90% 93.71% 93.36% 93.04% 92.73% BCA Canada Portfolio
Market Monitor (Oct 7, 2021)
Market Monitor (Oct 7, 2021)
Total Weekly Return BCA Canada Portfolio S&P/TSX TRI 1.57% 1.81% Top Contributors NVEI:CA BTE:CA RUS:CA SMU.UN:CA IMO:CA Weekly Return 55 bps 26 bps 19 bps 14 bps 13 bps Top Detractors ELF:CA CSH.UN:CA AND:CA DSG:CA EMP.A:CA Weekly Return -11 bps -10 bps -7 bps -5 bps -4 bps Top Prospects ELF:CA TOU:CA WIR.UN:CA IMO:CA CS:CA BCA Score 97.05% 95.90% 95.26% 93.82% 93.69% BCA UK Portfolio
Market Monitor (Oct 7, 2021)
Market Monitor (Oct 7, 2021)
Total Weekly Return BCA UK Portfolio FTSE 100 TRI -1.16% -0.10% Top Contributors AGRO:GB ROSN:GB DEC:GB SVST:GB JHD:GB Weekly Return 20 bps 17 bps 14 bps 12 bps 8 bps Top Detractors TUNE:GB KETL:GB YOU:GB FXPO:GB FDM:GB Weekly Return -47 bps -27 bps -16 bps -16 bps -14 bps Top Prospects VVO:GB ROSN:GB EMIS:GB NFC:GB AGRO:GB BCA Score 99.55% 97.59% 97.09% 96.88% 96.87% BCA Eurozone Portfolio
Market Monitor (Oct 7, 2021)
Market Monitor (Oct 7, 2021)
Total Weekly Return BCA EMU Portfolio MSCI EMU TRI -0.26% 0.80% Top Contributors JMT:PT VRLA:FR TTE:FR SES:IT EDNR:IT Weekly Return 21 bps 11 bps 10 bps 10 bps 9 bps Top Detractors SRT:DE ARG:FR MVV1:DE IPS:FR VID:ES Weekly Return -29 bps -16 bps -15 bps -13 bps -13 bps Top Prospects 094124453:BE FSKRS:FI HLAG:DE STR:AT ROTH:FR BCA Score 99.50% 99.19% 99.01% 98.79% 98.78% BCA Japan Portfolio
Market Monitor (Oct 7, 2021)
Market Monitor (Oct 7, 2021)
Total Weekly Return BCA Japan Portfolio TOPIX TRI -1.86% -4.46% Top Contributors 5019:JP 7327:JP 4928:JP 9509:JP 7958:JP Weekly Return 9 bps 8 bps 7 bps 6 bps 5 bps Top Detractors 8739:JP 3003:JP 4544:JP 9882:JP 1417:JP Weekly Return -34 bps -30 bps -18 bps -15 bps -13 bps Top Prospects 9882:JP 6960:JP 9436:JP 9422:JP 4966:JP BCA Score 99.88% 99.85% 99.43% 99.42% 99.20% BCA Hong Kong Portfolio
Image
Total Weekly Return BCA Hong Kong Portfolio Hang Seng TRI 1.11% 0.51% Top Contributors 43:HK 855:HK 857:HK 329:HK 323:HK Weekly Return 51 bps 30 bps 29 bps 23 bps 13 bps Top Detractors 316:HK 3306:HK 1193:HK 811:HK 2768:HK Weekly Return -19 bps -19 bps -17 bps -13 bps -10 bps Top Prospects 1277:HK 746:HK 857:HK 3306:HK 6868:HK BCA Score 100.00% 99.81% 98.24% 97.19% 96.99% BCA Australia Portfolio
Market Monitor (Oct 7, 2021)
Market Monitor (Oct 7, 2021)
Total Weekly Return BCA Australia Portfolio S&P/ASX All Ord. TRI 0.50% -1.02% Top Contributors CDD:AU CVW:AU ERA:AU NHC:AU SXY:AU Weekly Return 42 bps 31 bps 22 bps 21 bps 14 bps Top Detractors SFR:AU PWH:AU 360:AU AUB:AU ZIM:AU Weekly Return -24 bps -16 bps -16 bps -13 bps -10 bps Top Prospects MHJ:AU RIC:AU AVN:AU GOZ:AU PL8:AU BCA Score 99.31% 98.40% 98.30% 98.04% 97.86%
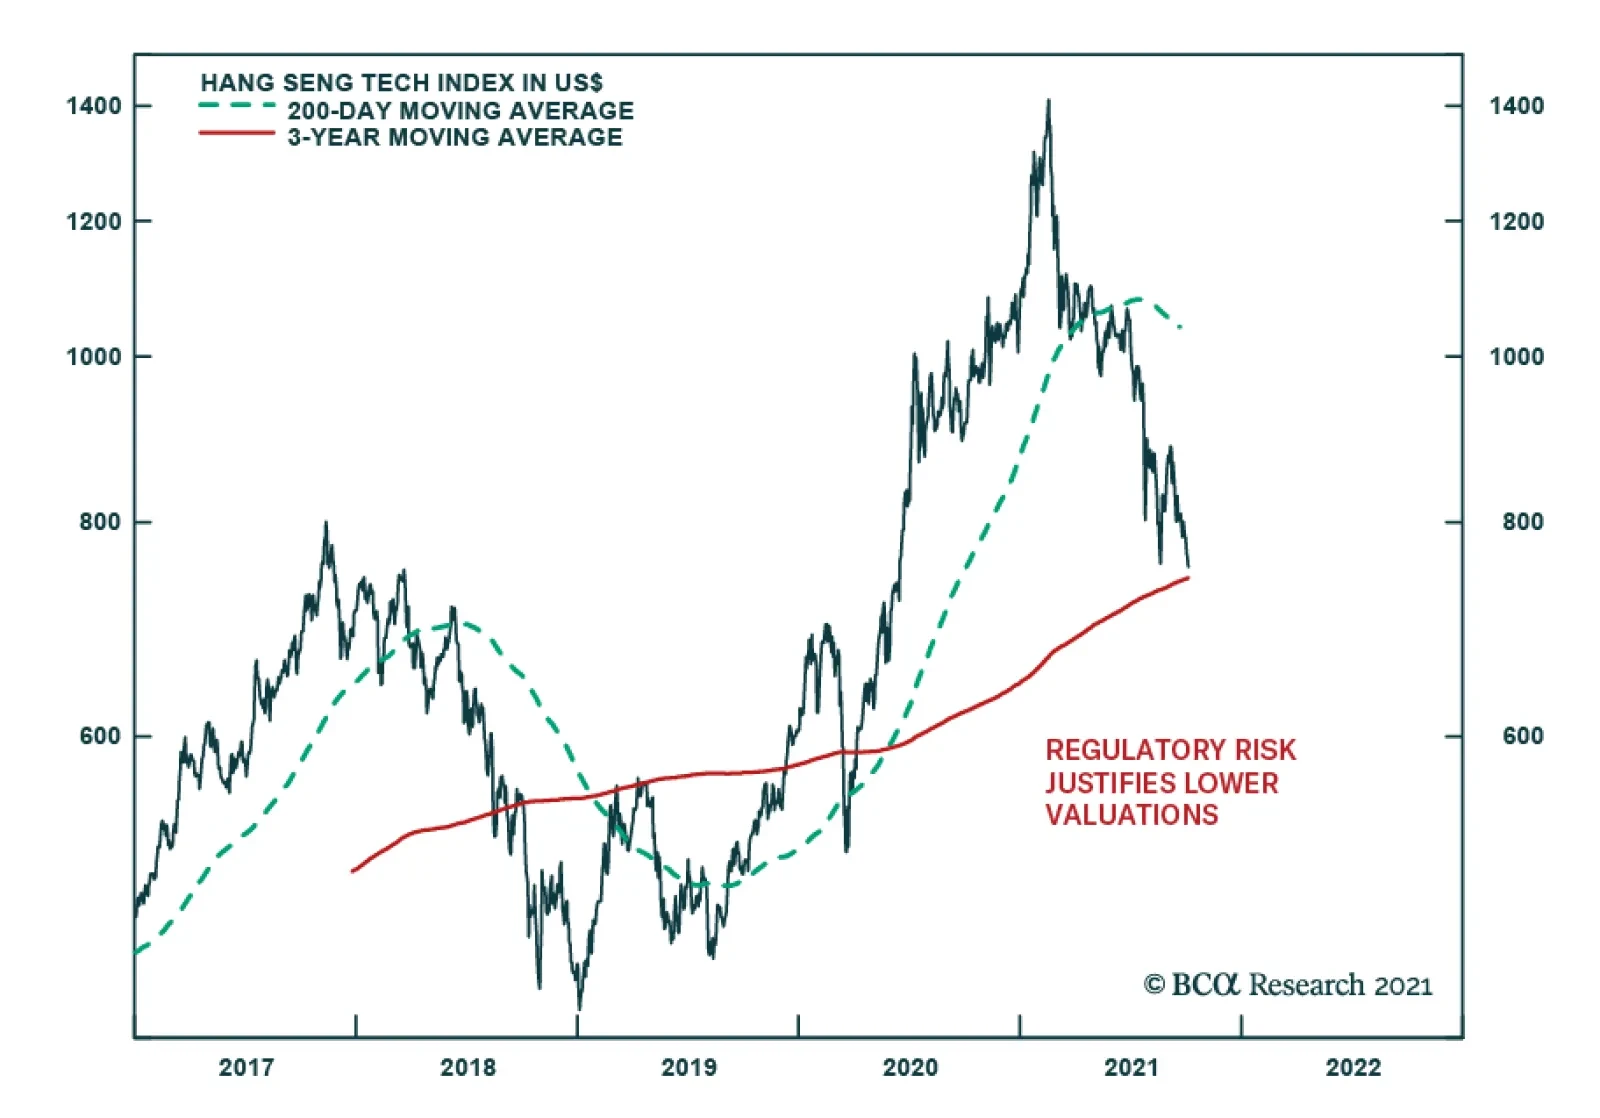
Tech stocks led the Hang Seng higher on Thursday, pushing the index up 3.1%. The improvement was broad-based with all but three constituents of the Tech index rising on the day. Meituan was the top performer, gaining nearly 10%. Does the utter collapse in…