Equities
Market moves since the beginning of September have been characterized by a selloff in US Treasurys and a deterioration in US equity returns. The spectacular performance of US stocks thus far during the pandemic has stretched multiples to an extreme. These…
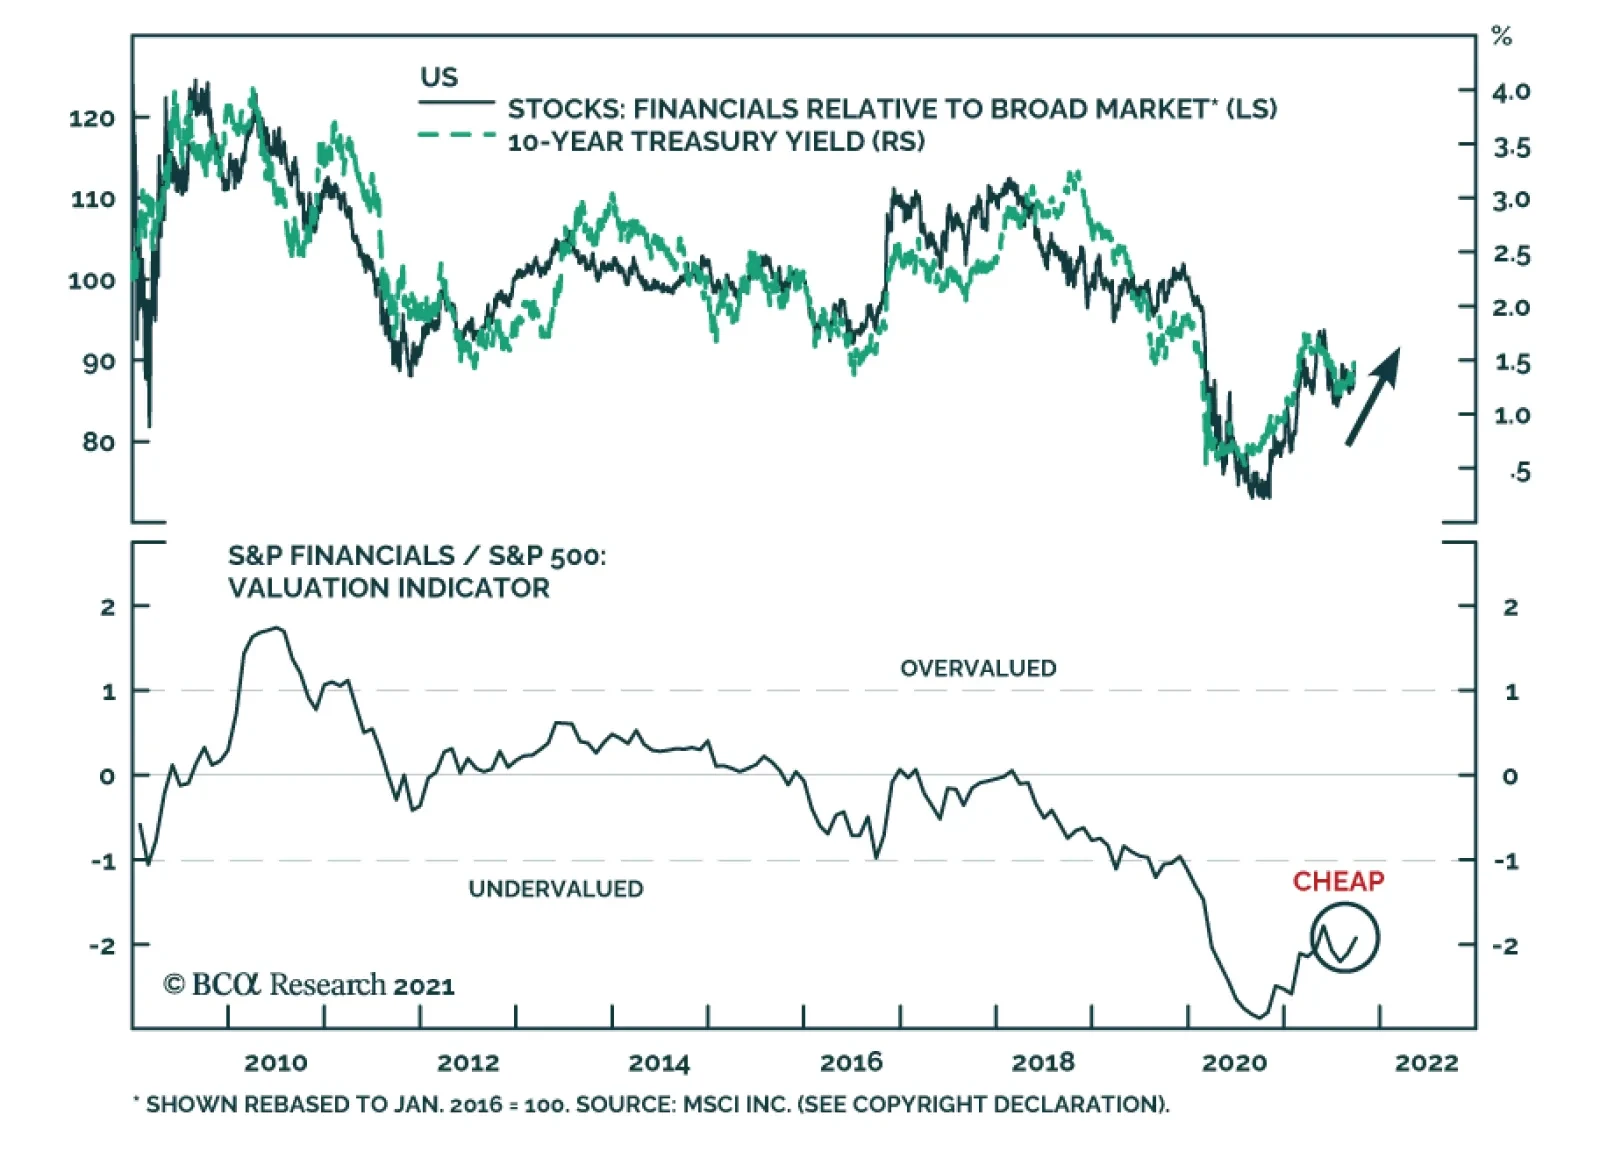
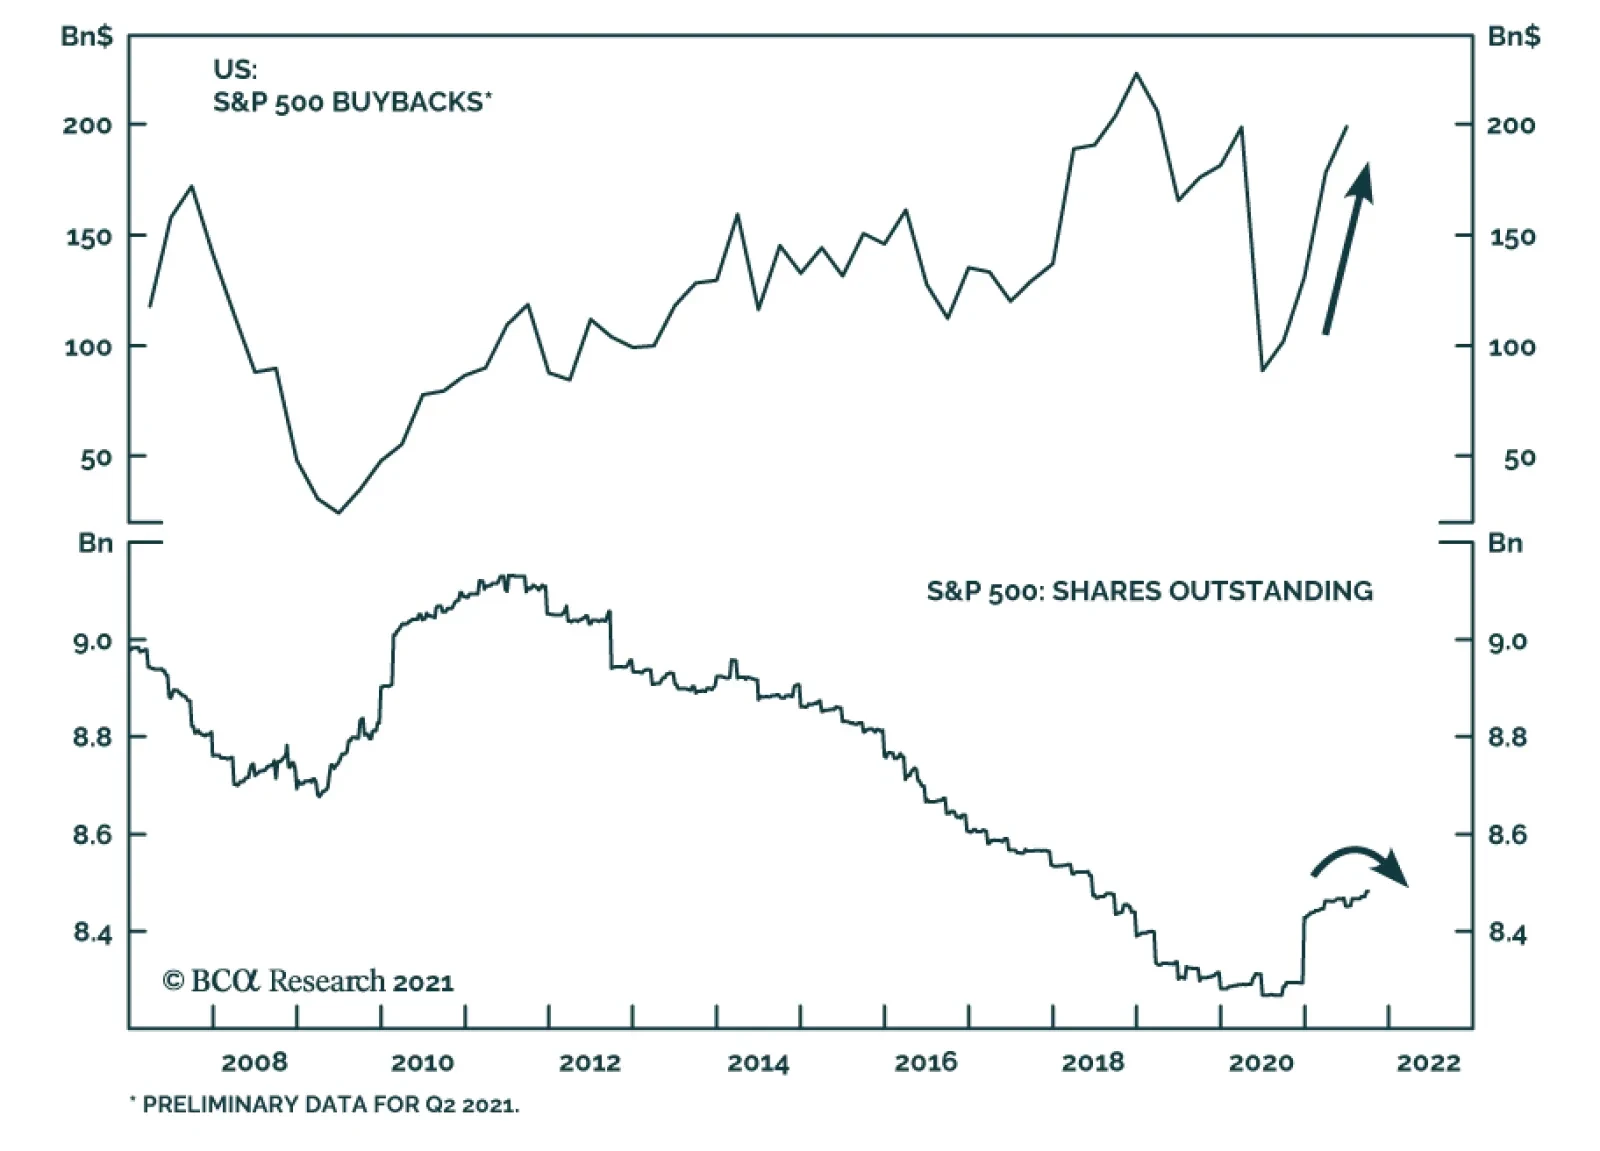
US Financials is among the best performing US equity sectors over the past three months. We expect these positive relative gains to continue. Financials will benefit from rising US bond yields over the coming year. Not only are higher interest rates…
In an Insight last week, we highlighted that the American Association of Individual Investors’ latest survey reveals a collapse in sentiment. Bears now exceed bulls by a wide margin. However, this downbeat assessment is not consistent across all indicators…
According to BCA Research’s European Investment Strategy service, the tactical environment is dangerous for European cyclicals in general, and materials in particular. The fallout from Evergrande’s problem will extend to the performance of European equity…

Highlights The Evergrande crisis is not China’s Lehman moment. Nonetheless, Chinese construction activity will decelerate further in response to this shock. Global equities are frothy enough that a weaker-than-expected Chinese construction sector will remain a near-term risk to stocks prices. European markets are more exposed to this risk than US ones. Tactically, this creates a dangerous environment for cyclicals in general and materials in particular. Healthcare and Swiss stocks would be the winners. Despite these near-term hurdles, we maintain a pro-cyclical portfolio stance, which we will protect with some temporary hedges. We will lift these hedges if the EURO STOXX corrects into the 430-420 zone. A busy week for European central banks confirms our negative stance on EUR/GBP, EUR/SEK, and EUR/NOK. While EUR/CHF has upside, Swiss stocks should outperform Euro Area defensives. Stay underweight UK Gilts in fixed-income portfolios. Feature The collapse of property developer Evergrande creates an important risk for European markets. It threatens to slow Chinese construction activity further, which affects European assets that are heavily exposed to the Chinese real estate sector, directly and indirectly. This risk is mostly frontloaded, as Chinese authorities cannot afford a complete meltdown of the domestic property sector. Moreover, this economy has slowed significantly and more policy support is bound to take place. Additionally, forces outside China create important counterweights that will allow Europe to thrive despite the near-term clouds. While we see more short-term risk for European stocks and cyclical sectors, the 18-month cyclical outlook remains bright. Similarly, European stocks will not outperform US ones when Chinese real estate activity remains a source of downside surprise; but they will afterward. China’s Construction Slowdown Is Not Over The Evergrande crisis is not China’s Lehman moment. Beijing has the resources to prevent a systemic meltdown and understands full well what is at stake. At 160% of GDP, China’s nonfinancial corporate debt towers well above that of other major emerging markets and even that of Japan in the 1980s (Chart 1). If an Evergrande bankruptcy were allowed to topple this debt mountain, China would experience the kind of debt-deflation trap that proved so disastrous in the 1930s. A further deterioration of conditions in Chinese real estate activity is nonetheless in the cards, even if the country avoids a global systemic financial shock. First, the inevitable restructuring of Evergrande will result in losses for bond holders, especially foreign ones. Consequently, risk premia in the Chinese off-shore corporate bonds market will remain wide following the resolution of the Evergrande debacle. While Chinese banks are likely to recover a large proportion of the funds they lent to the real estate giant, they too will face higher risk premia. At the margin, the rising cost of capital will curtail the number of projects real estate developers take on over the coming two to three years. Second, the eventual liquidation of Evergrande will hurt confidence among real estate developers. This process may take many forms, but, as we go to press, the most discussed outcome is a breakup and restructuring where state-owned enterprises and large local governments absorb Evergrande’s operations. Evergrande’s employees, suppliers, and clients who have deposited funds while pre-ordering properties will be made whole one way or the other. However, shareholders and management will not. Wiping out shareholders and senior management will send a message to the operators of other developers, which will negatively affect their risk taking (Chart 2). Chart 1China Cannot Afford A Lehman Moment
China Cannot Afford A Lehman Moment
China Cannot Afford A Lehman Moment
Chart 2Downside To Chinese Construction Activity
Downside To Chinese Construction Activity
Downside To Chinese Construction Activity
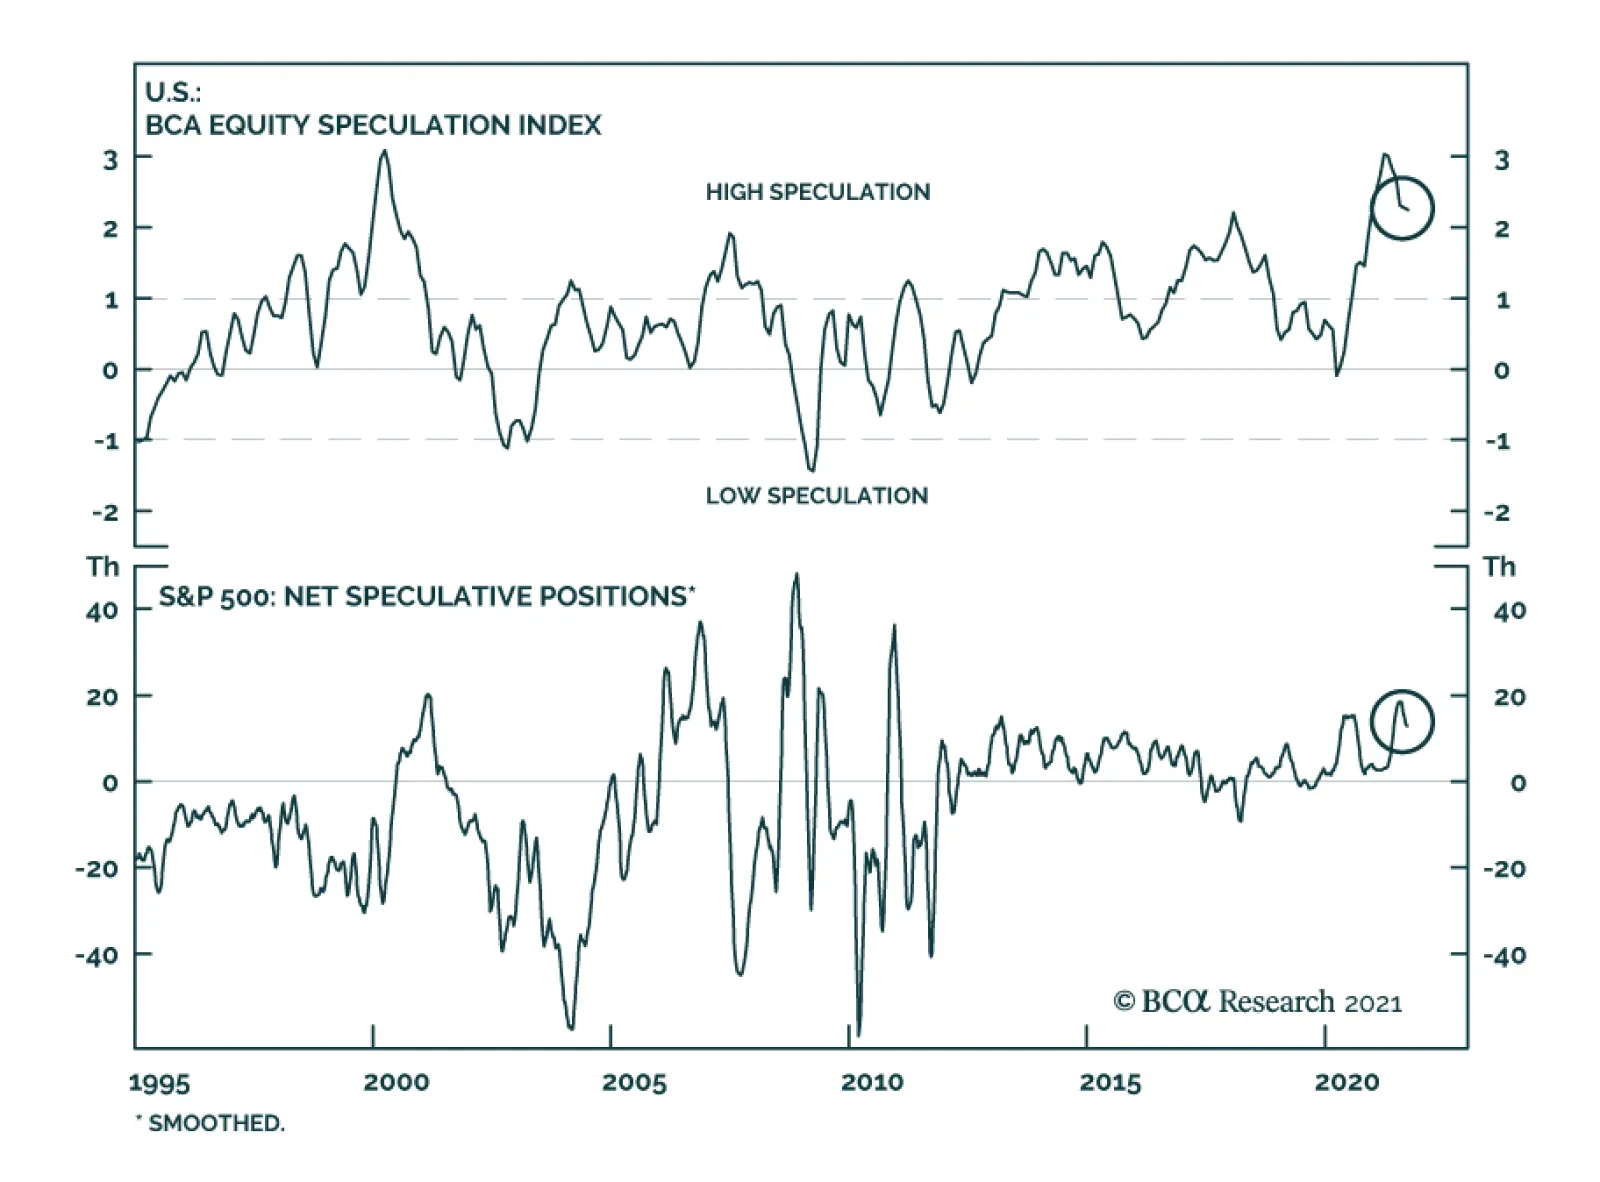
Third, one of President Xi Jinping’s key policy objectives is to tame rampant income inequality in the Chinese economy. Rapidly rising real estate prices and elevated unaffordability only worsen this problem. Hence, Beijing wants to avoid blind stimulus that mostly pushes house prices higher but that would have also boosted construction activity. Thus, if credit growth is pushed through the system, the regulatory tightening in real estate will not end. This process is likely to result in further contraction in floor space sold and started. Bottom Line: The Evergrande crisis is unlikely to morph into China’s Lehman moment. However, its fallout on the real estate industry means that Chinese construction activity will continue to contract in the coming six to twelve months or so. Chinese Construction Matters For European Equities The risk of further contraction in Chinese construction activity implies a significant near-term risk for European equities, especially relative to US ones. Even after the volatility of the past three weeks, global equities remain vulnerable to more corrective action. Speculative activity continues to grip the bellwether US market. Our BCA Equity Speculation Index is still around two sigma. Previous instances of high readings did not necessarily herald the end of bull markets; however, they often resulted in sideways and volatile trading, until the speculative excesses dissipated (Chart 3). The case for such volatile trading is strong. The Fed is set to begin its taper at its November meeting. Moreover, an end of the QE program by the middle of next year and the upcoming rotation of regional Fed heads on the FOMC will likely result in a first rate hike by the end of 2022. Already, the growth rate of the global money supply has declined, and the real yield impulse is not as supportive as it once was. Therefore, the deterioration in our BCA Monetary Indicator should perdure (Chart 4), which will heighten the sensitivity of global stocks to bad news out of China. Chart 3Rife With Speculation
Rife With Speculation
Rife With Speculation
Chart 4Liquidity Deterioration At The Margin
Liquidity Deterioration At The Margin
Liquidity Deterioration At The Margin
Chart 5Still Too Happy
Still Too Happy
Still Too Happy
Investor sentiment is also not as washed out as many news stories ascertain. The AAII survey shows that the number of equity bulls has fallen sharply, but BCA’s Complacency-Anxiety Index, Equity Capitulation Indicator and Sentiment composite are still inconsistent with durable market bottoms. Moreover, the National Association of Active Investment Managers’ Exposure Index is still very elevated. When this gauge is combined with the AAII bulls minus bears indicator, it often detects floors in the US dollar-price of the European MSCI index (Chart 5). For now, this composite sentiment measure is flashing further vulnerability for European equities, especially if China remains a source of potential bad news in the coming months. Economic linkages reinforce the tactical risk to European stocks. Chinese construction activity affects the Euro Area industrial production because machinery and transportation goods represent 50% of Europe’s export to China (Chart 6). This category is very sensitive to Chinese real estate activity. Moreover, Europe’s exports to other nations are also indirectly affected by the demand from Chinese construction. Financial markets bear this footprint. Excavator sales in China are a leading indicator of construction activity. Historically, they correlate well with both the fluctuations of EUR/USD and the performance of Eurozone stocks relative to those of the US (Chart 7). Hence, if we anticipate that the problems Evergrande faces will weigh on excavator sales in the coming months, then the euro will suffer and Euro Area stocks could continue to underperform. Chart 6Europe's Exports To China Are Sensitive To Construction Activity
Europe's Exports To China Are Sensitive To Construction Activity
Europe's Exports To China Are Sensitive To Construction Activity
Chart 7A Near-Term Risk To European Assets
A Near-Term Risk To European Assets
A Near-Term Risk To European Assets
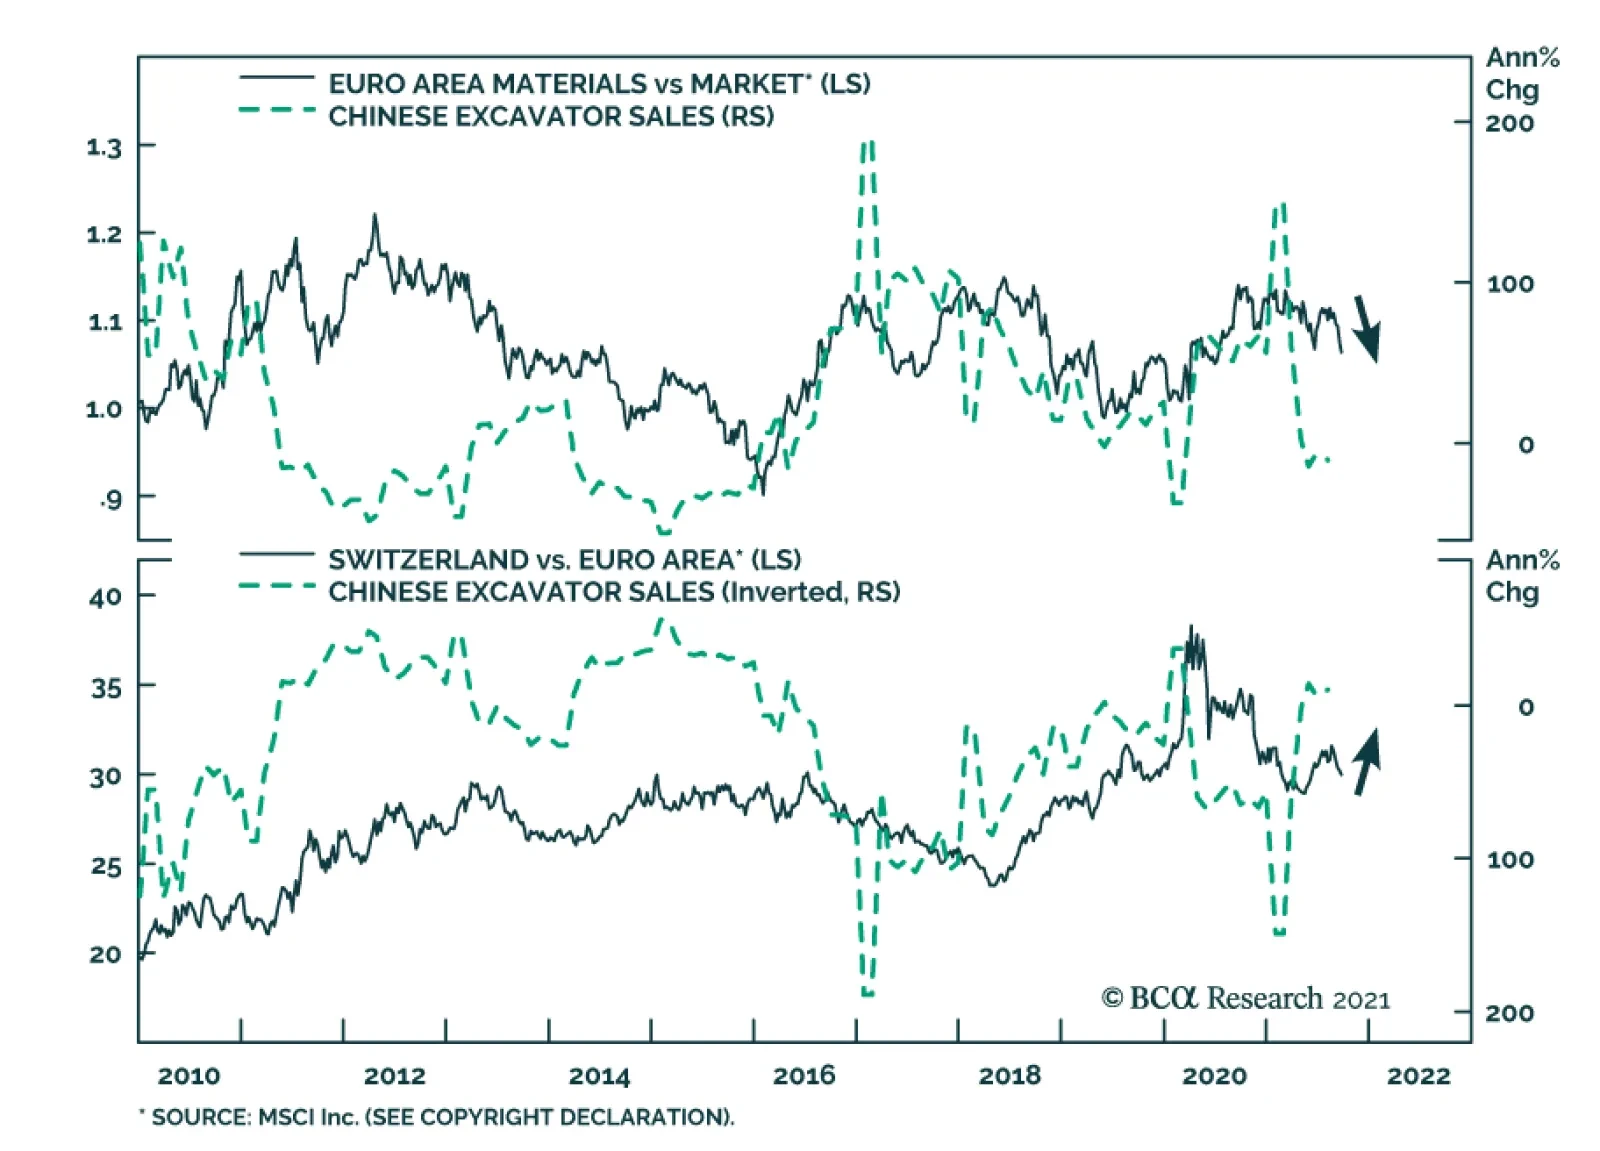
Similarly, the fallout from Evergrande’s problem will extend to the performance of European equity sectors. The sideways corrective episode in cyclical relative to defensive shares is likely to continue in the near term. This sector twist remains frothy, and often declines when Chinese credit origination is soft (Chart 8). Materials stocks are the most likely to suffer due to their tight correlation with Chinese excavator sales (Chart 9); meanwhile, healthcare equities will reap the greatest benefit as a result of their appealing structural growth profile and their strong defensive property. Geographically, Swiss stocks should perform best (Chart 9, bottom panel), because they strongly overweigh healthcare and consumer staple names. Moreover, as we recently argued, the SNB’s monetary policy is an advantage for Swiss stocks compared to Eurozone defensives.1 Additionally, Dutch equities, with their 50% weighting in tech and their small 12% combined allocation to industrials and materials, could also enjoy a near-term outperformance as investors digest the sectoral impact of weaker Chinese construction activity. Chart 8The Vulnerability Of Cyclicals/Defensives Remains
The Vulnerability Of Cyclicals/Defensives Remains
The Vulnerability Of Cyclicals/Defensives Remains
Chart 9Responses To Weaker Construction
Responses To Weaker Construction
Responses To Weaker Construction
Bottom Line: No matter how the Evergrande story unfolds, its consequence on Chinese construction activity may still cause market tremors. Global equity benchmarks may be rebounding right now, but, ultimately, they remain vulnerable to this slowdown. Any negative surprise out of China is likely to cause Europe to underperform because of its greater exposure to Chinese construction activity. Investment Conclusion: This Too Shall Pass The risks to the European equity market and its cyclicals sectors will prove transitory and will finish by the end of the year. Beijing will tolerate some pain to the real estate sector, but the stakes are too high to let the situation fester for long. The main problem is China’s large debt. Already sequential GDP growth in the first half of 2021 was worse than the same period in 2020, and credit accumulation is just as weak as in early 2018 (Chart 10). In this context, if real estate activity deteriorates too much, aggregate profits will contract and, in turn, will hurt the corporate sector’s ability to service its debt. Employment and social tensions create another stress point that will force Beijing’s hand. At 47, the non-manufacturing PMI employment index is already well into the contraction zone (Chart 11). Weakness in construction activity will hurt the labor market further. In an environment where protests have been springing up all over China, the Communist Party does not want to see more stress applied to workers. Chart 10In The End, Stimulus Will Come
In The End, Stimulus Will Come
In The End, Stimulus Will Come
Chart 11Worsening Chinese Employment Conditions
Worsening Chinese Employment Conditions
Worsening Chinese Employment Conditions
These two constraints will force Beijing to alleviate the pain caused by a weaker construction sector. As a result, we still expect the Chinese credit and fiscal impulse to re-accelerate by Q2 2022. Developments outside of China will create another important offset that will allow risk assets to thrive once their immediate froth has receded. Strong DM capex will be an important driver of global activity next year. As Chart 12 shows, capex intentions in the US and the Euro Area are rapidly expanding, which augurs well for global investments. Moreover, re-building depleted inventories (Chart 13) will be a crucial component of the solution to global supply bottlenecks. Both activities will add to global demand. As an example, ship orders are already surging. Chart 12DM Capex Intentions Are Firming
DM Capex Intentions Are Firming
DM Capex Intentions Are Firming
Chart 13Don't Forget About Inventories
Don't Forget About Inventories
Don't Forget About Inventories
We maintain a pro-cyclical stance in European markets after weighing the near-term negatives against the underlying positive forces. For now, hedging the tactical risk still makes sense and our long telecommunication / short consumer discretionary equities remain the appropriate vehicle – so does being long Swiss stocks versus Euro Area defensives. However, we will use any correction in the EURO STOXX (Bloomberg: SXXE Index) to the 430-420 zone to unload this protection. Bottom Line: The potential market stress created by a slowdown in Chinese construction activity will be a temporary force. Beijing will not tolerate a much larger hit to the economy, especially as tensions are rising across the country. Thus, even if the stimulus response to the Evergrande crisis will not be immediate, it will eventually come, which will support Chinese economic activity. Additionally, the capex upside and inventory rebuilding in advanced economies will create an offset for slowing Chinese growth. Consequently, while we maintain a pro-cyclical bias over the medium term, we are also keeping in place our hedges in the near term, looking to shed them if SXXE hits the 430-420 zone. A Big Week For Central Banks Chart 14The BoE's Is Listening To The UK's Economic Conditions...
The BoE's Is Listening To The UK's Economic Conditions...
The BoE's Is Listening To The UK's Economic Conditions...
Last week, four European central banks held their policy meetings: The Riksbank, the Swiss National Bank, the Norges Bank, and the Bank of England. No major surprises came out of these meetings, with central banks discourses and policy evolving in line with their respective economies. The BoE veered on the hawkish side, highlighting that rates could rise before its QE program is over. This implies a small possibility of a rate hike by the end of 2021. However, our base case remains that the initial hike will be in the first half of 2022. The BoE is behaving in line with the message from our UK Central Bank Monitor (Chart 14). Moreover, the combination of rapid inflation and strong house price appreciation is incentivizing the BoE to remove monetary accommodation, especially because UK financial conditions are extremely easy (Chart 14, bottom panel). One caution advanced by the MPC is the uncertainty surrounding the impact of the end of the job furlough scheme this month. However, the global economy will be strong enough next spring to mitigate the risks to the UK. The results of last week’s MPC meeting and our view on the global and UK business cycles support the short EUR/GBP recommendation of BCA’s foreign exchange strategist,2 as well as the underweight allocation to UK Gilts of our Global Fixed Income Strategy group.3 The Norges Bank is the first central bank in the G-10 to hike rates and is likely to do so again later this year. While Norwegian core inflation remains low, house prices are strong, monetary conditions are extremely accommodative, and our Norway Central Bank Monitor is surging (Chart 15). The Norwegian central bank will continue to focus on these positives, especially in light of our Commodity and Energy team’s view that Brent will average more than $80/bbl by 2023.4 In this context, we anticipate the NOK to outperform the euro over the coming 24 months. Nonetheless, the near-term outlook for Norwegian stocks remains fraught with danger. Materials account for 17% of the MSCI Norway index and are the sector most vulnerable to a deterioration in Chinese construction activity. The Riksbank continues to disregard the strength of the Swedish economy. Relative to economic conditions, it is one of the most dovish central banks in the world. The Swedish central bank is completely ignoring the message from our Sweden Central Bank Monitor, which has never been as elevated as it is today (Chart 16). Moreover, the inexpensiveness of the SEK means that Swedish financial conditions are exceptionally accommodative. At first glance, this picture is bearish for the SEK. However, easy monetary conditions will cause Sweden’s real estate bubble to expand. Expanding real estate prices and transaction volumes will boost the profits of Swedish financials, which account for 27% of the MSCI Sweden index. Moreover, Swedish industrials remain one of our favorite sectors in Europe, and they represent 38% of the same index. As a result, equity flows into Sweden should still hurt the EUR/SEK cross. Chart 15...And The Norges Bank, To Norway's
...And The Norges Bank, To Norway's
...And The Norges Bank, To Norway's
Chart 16The Riksbank Is Blowing Real Estate Bubbles
The Riksbank Is Blowing Real Estate Bubbles
The Riksbank Is Blowing Real Estate Bubbles
Chart 17The CHF Still Worries The SNB
The CHF Still Worries The SNB
The CHF Still Worries The SNB
Finally, the SNB proved reliably dovish. Our Switzerland Central Bank Monitor is rising fast as inflation and house prices improve (Chart 17). However, the SNB is rightfully worried about the expensiveness of the CHF, which generates tight Swiss financial conditions (Chart 17, bottom panel). Consequently, the SNB will keep fighting off any depreciation in EUR/CHF. Thus, the SNB will be forced to expand its balance sheet because the ECB is likely to remain active in asset markets longer than many of its peers. This process will be key to the outperformance of Swiss stocks relative to other European defensive equities. Mathieu Savary, Chief European Strategist Mathieu@bcaresearch.com Footnotes 1 Please see European Investment Strategy “The ECB’s New Groove,” dated July 19, 2021, available at eis.bcarsearch.com 2 Please see Foreign Exchange Strategy “Why Are UK Interest Rates Still So Low?,” dated March 10, 2021, available at fes.bcarsearch.com 3 Please see European Investment Strategy “The UK Leads The Way,” dated August 11, 2021, available at eis.bcarsearch.com 4 Please see Commodity & Energy Strategy “Upside Price Risk Rises For Crude,” dated September 16, 2021, available at fes.bcarsearch.com Tactical Recommendations
Europe’s Evergrande Problem
Europe’s Evergrande Problem
Cyclical Recommendations
Europe’s Evergrande Problem
Europe’s Evergrande Problem
Structural Recommendations
Europe’s Evergrande Problem
Europe’s Evergrande Problem
Closed Trades
Europe’s Evergrande Problem
Europe’s Evergrande Problem
Currency Performance Fixed Income Performance Equity Performance
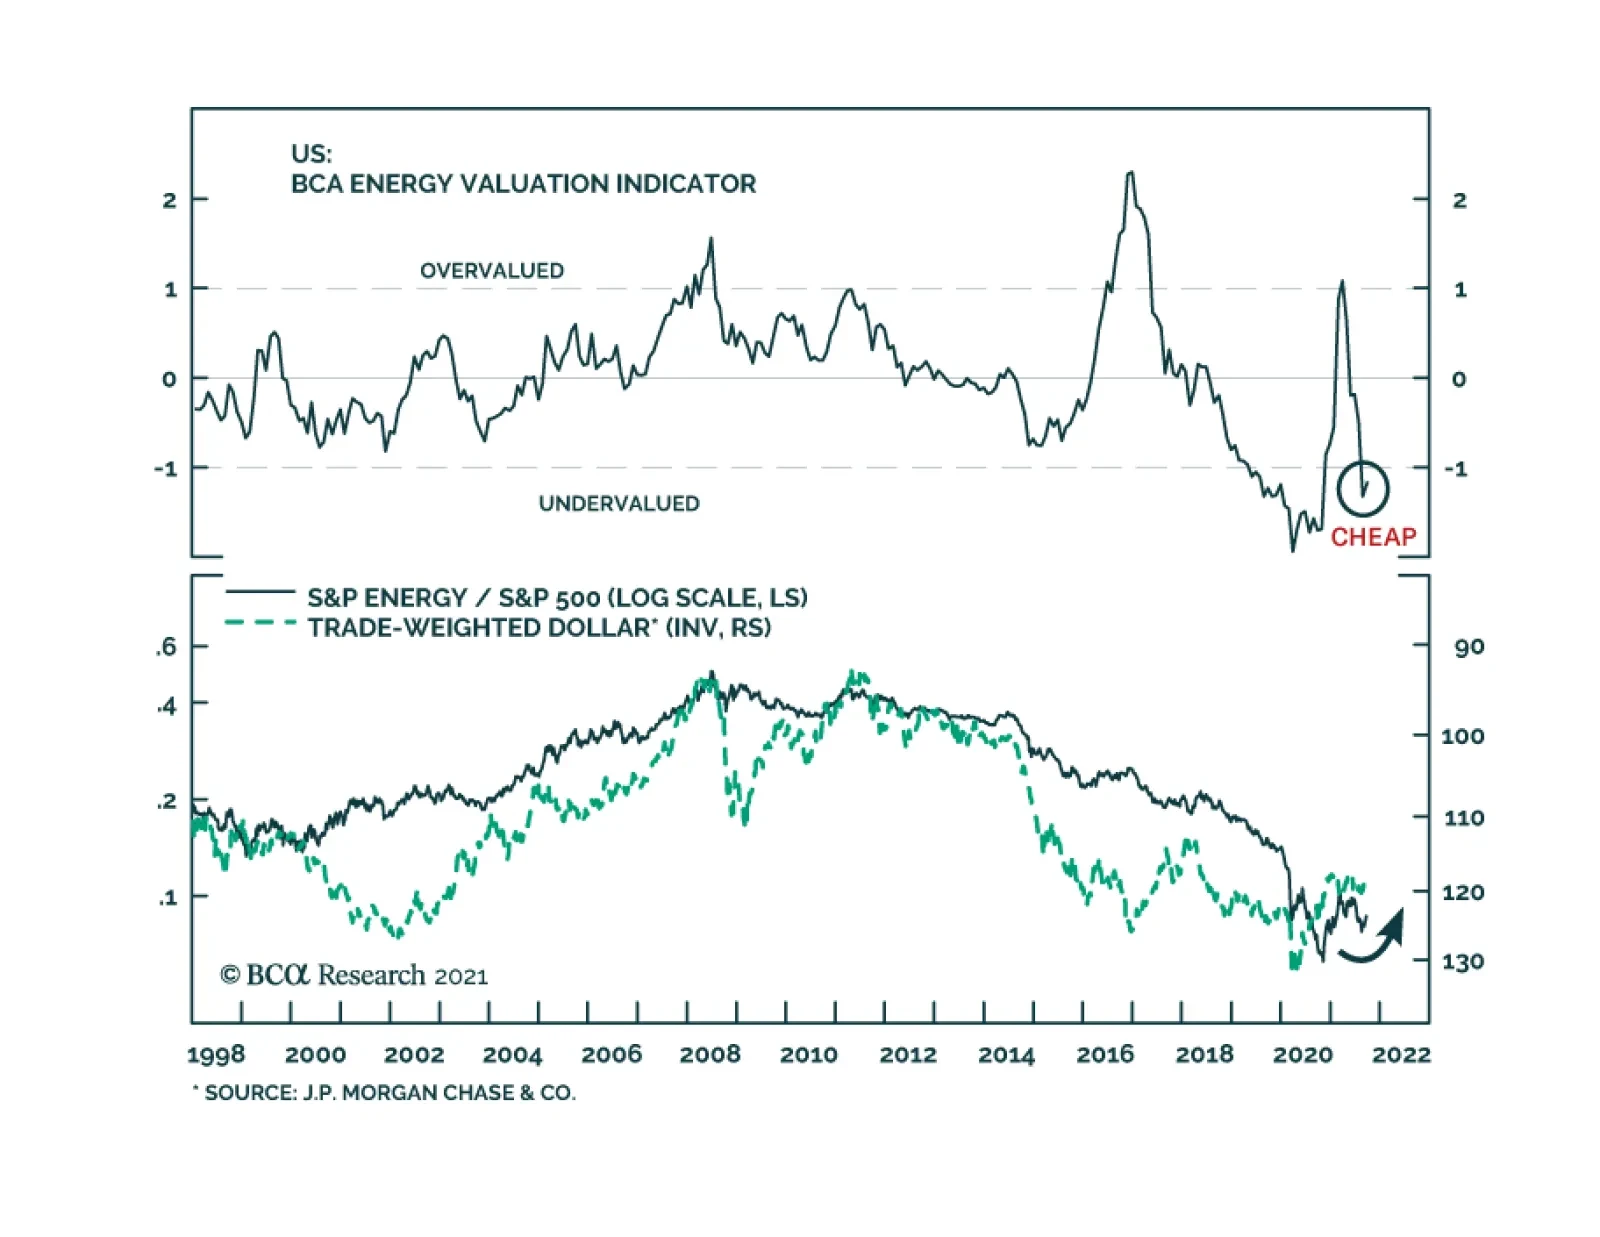
US energy stocks performed poorly earlier this year. They fell 14tween early March and late August. However, the tide seems to be turning in their favor. The energy sector is now leading the benchmark. It is up 12% since August 20 – a period of…
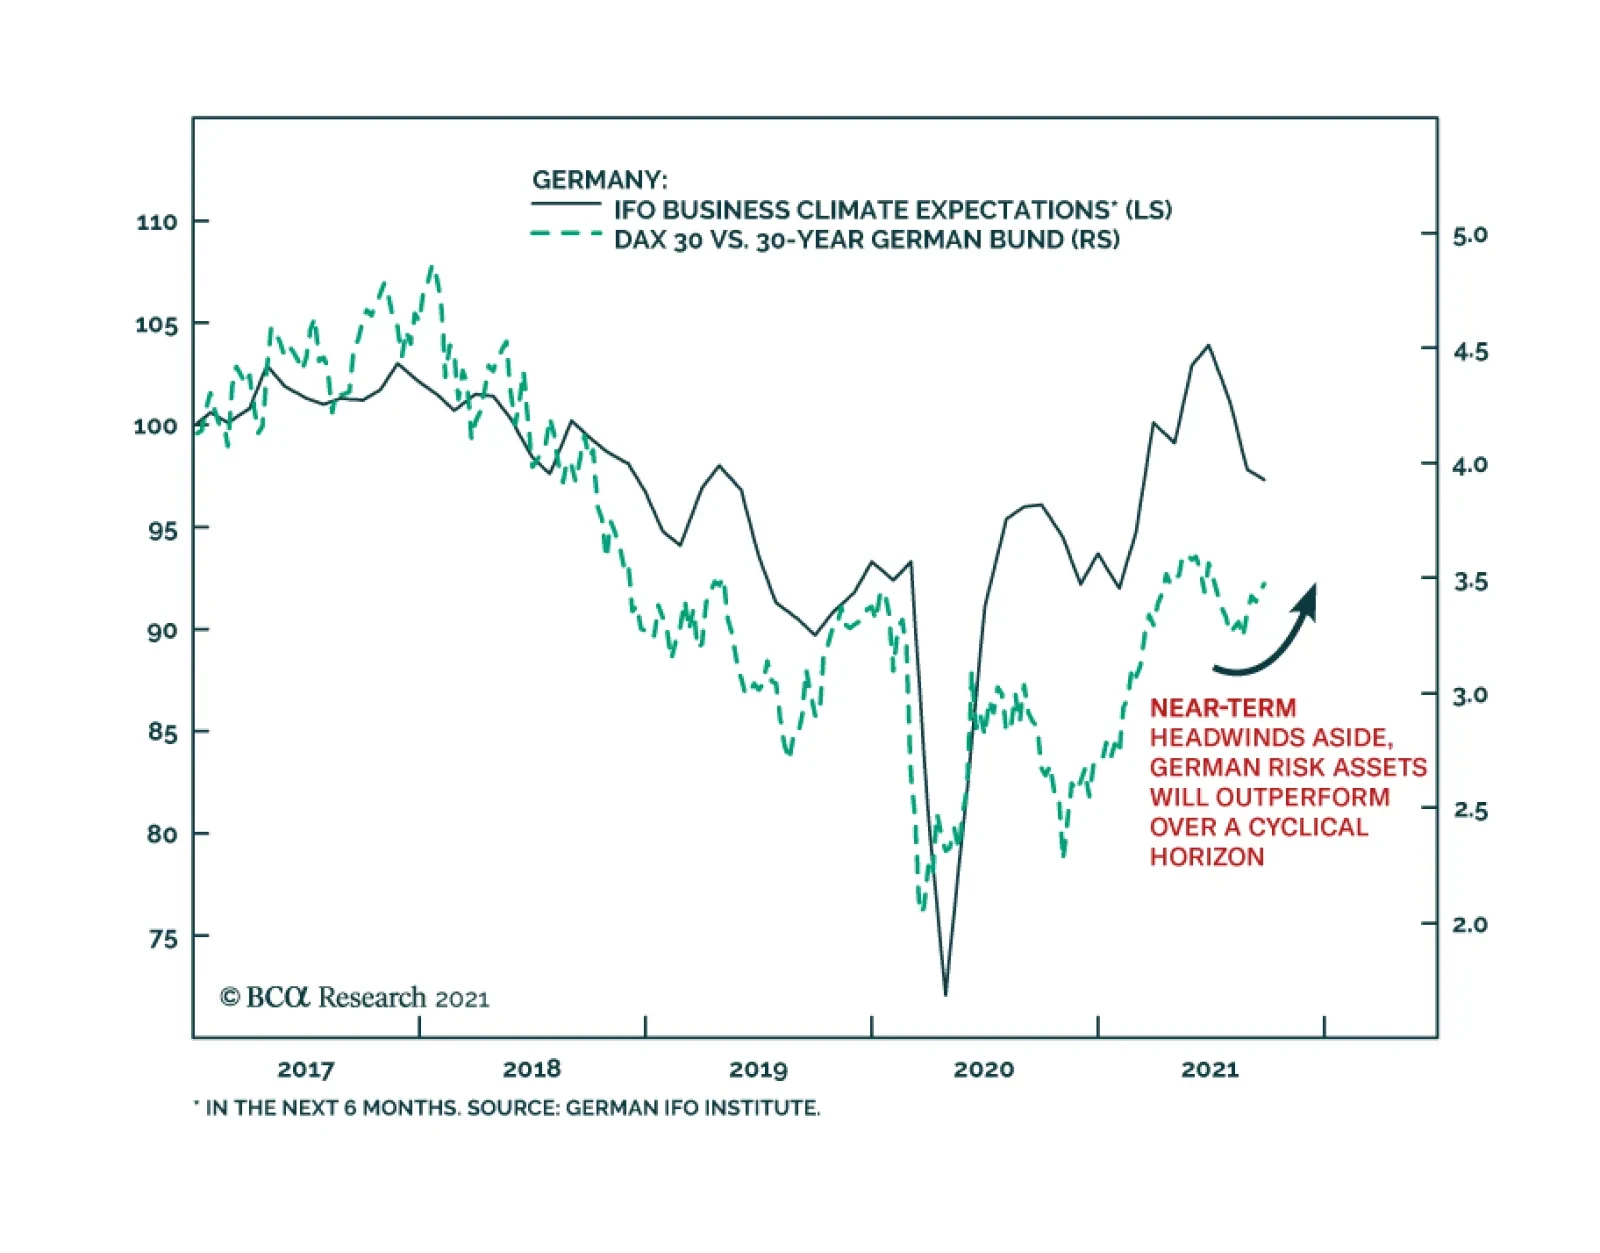
The German IFO’s Business Climate Index softened for the third consecutive month in September, falling to 98.8 from 99.6. The weakness was led by the Current Assessment number which lost 1-point versus expectations of a minor improvement. Meanwhile, the…
Highlights Evergrande is just a canary in the coalmine warning of the vulnerability of global real estate, which is now trading on its highest valuation ever. US house prices are now more extended versus rents than at the peak of the credit boom. US bond yields cannot move up very far before severely choking mortgage demand and hence the housing market (not to mention the stock market). We reiterate our structural recommendation to own the US 30-year T-bond, whose ultimate low in yield will come in the next deflationary shock. New structural recommendation: buy the China 30-year government bond Stay structurally long real estate. Even though valuations are high, they will get even higher when 30-year bond yields reach their ultimate low. Fractal analysis: Uranium and Palm Oil. Feature Chart of the WeekThe $300 Trillion Global Real Estate Market Dwarfs The $90 Trillion Global Economy
The $300 Trillion Global Real Estate Market Dwarfs The $90 Trillion Global Economy
The $300 Trillion Global Real Estate Market Dwarfs The $90 Trillion Global Economy
The recent woes of China’s systemically important real estate developer Evergrande confirm the concern we voiced in our October 29, 2020 Special Report: The Real Risk Is Real Estate. To be clear, we do not expect any Evergrande default to topple the global financial dominoes á la 2008. The Chinese government is able and almost certainly willing to prevent its own Lehman moment. A more realistic concern is that the rich valuation of real estate, both in China and globally, is vulnerable to the slightest of shocks, and Evergrande is just a canary in the coalmine. Even A 10 Percent Decline In Chinese House Prices Would Constitute A Major Shock According to global real estate specialist Savills, four of the top six world cities for real estate inflation in 2021 are in China. Through just the first half of the year, prime real estate prices have surged by 14 percent in Shanghai, 13 percent in Hangzhou, 9 percent in Shenzhen, and 8 percent in Guangzhou.1 This surge in Chinese property prices has lifted Chinese valuations to nosebleed levels. Today, prime real estate yields in China’s major cities are barely above 1 percent, just a third of the global average of 3 percent. From such nosebleed valuations, a fire sale of Evergrande’s inventory – as creditors tried to recover debts – could weigh down real estate prices. And the repercussions would extend beyond China’s property sector. Prime real estate yields in China’s major cities are barely above 1 percent, just a third of the global average of 3 percent. Without a social safety net and with limited places to park their money, Chinese savers have for years been encouraged to buy homes, in the widespread belief that property is the safest investment, whose price is only supposed to go up. With the bulk of people’s wealth in property acting as a perceived economic safety net, even a 10 percent decline in house prices would constitute a major shock to the household sector’s hopes and expectations of what property is (Chart I-2). Chart I-2Even A 10 Percent Decline In Chinese House Prices Would Constitute A Major Shock
Even A 10 Percent Decline In Chinese House Prices Would Constitute A Major Shock
Even A 10 Percent Decline In Chinese House Prices Would Constitute A Major Shock
In turn, the ensuing ‘negative wealth effect’ would unleash a major headwind to household spending in the world’s second largest economy. Nosebleed Property Valuations Everywhere The precarious valuation of real estate is not just a Chinese concern. US house prices are now more extended versus rents than at the peak of the credit boom (Chart I-3). Chart I-3US House Prices Are Now More Extended Versus Rents Than At The Peak Of The Credit Boom
US House Prices Are Now More Extended Versus Rents Than At The Peak Of The Credit Boom
US House Prices Are Now More Extended Versus Rents Than At The Peak Of The Credit Boom
Yet the phenomenon extends globally. Through the past ten years, world prime residential prices are up by 70 percent while rents are up by just 25 percent.2 As a mathematical identity, this means that the bulk of the increase in global real estate prices is due to valuation expansion (Chart I-4). Savills confirms this by pointing out that its global prime residential yield has fallen below 3 percent for the first time, and constitutes the lowest global rental yield since the firm began tracking the data in 2005. Chart I-4The Bulk Of The Increase In Global Real Estate Prices Is Due To Valuation Expansion
The Bulk Of The Increase In Global Real Estate Prices Is Due To Valuation Expansion
The Bulk Of The Increase In Global Real Estate Prices Is Due To Valuation Expansion
The culprit for the richest ever valuation of global real estate is the structural collapse in global bond yields. And the culprit for the structural collapse in bond yields is persistently ultra-low policy interest rates combined with trillions of dollars of quantitative easing (Chart I-5). Chart I-5The Culprit For The Richest Ever Valuation Of Global Real Estate Is The Structural Collapse In Global Bond Yields
The Culprit For The Richest Ever Valuation Of Global Real Estate Is The Structural Collapse In Global Bond Yields
The Culprit For The Richest Ever Valuation Of Global Real Estate Is The Structural Collapse In Global Bond Yields
But now, policy makers risk being hoisted by their own petard. The tight relationship between bond yields and real estate yields means that bond yields have very limited scope to rise before pulling the bottom out of the $300 trillion global real estate market. Given that this dwarfs the $90 trillion global economy, even a 10 percent correction amounting to $30 trillion would constitute a devastating negative wealth effect (Chart of the Week). Nosebleed Property Valuations Reinforce The Structural Case For 30-Year Bonds Some people counter that in an inflationary shock, property – as the ultimate real asset – ought to perform well even as bond yields rise. However, when valuations start off in nosebleed territory as now, the initial intense headwind from deflating valuations obliterates the tailwind from inflating incomes. An easy way to understand this intense headwind is through the concept of affordability. In the US the 15-year mortgage rate tracks the 10-year T-bond yield plus a usually consistent spread of around 1 percent. Hence, if the 10-year T-bond yield rose from 1.3 to 2 percent, the mortgage rate would rise from 2.3 to 3 percent, a proportionate increase of 30 percent. For the marginal buyer using an interest-only mortgage, this means that already stretched affordability versus income would worsen by 30 percent.3 Therefore, for the marginal buyer to keep his bid on the property the same, his income would have to inflate by 30 percent. But in an inflationary shock that pushed up the bond yield by 0.7 percent, it is implausible that wages would rise by 30 percent. Let’s say, at a push, that wages rose by 10 percent. To keep affordability and mortgage demand the same, property prices would have to plunge by 20 percent. In fact, earlier this year we saw the extreme vulnerability of US mortgage demand to higher bond yields. When the bond yield collapsed at the start of the pandemic in 2020, the mortgage rate declined more sedately. Hence, in the early stage of bond yield rebound, the US mortgage rate did not increase (Chart I-6). Chart I-6In 2020, The US Mortgage Rate Briefly Decoupled From Its Usual Relationship With The Bond Yield
In 2020, The US Mortgage Rate Briefly Decoupled From Its Usual Relationship With The Bond Yield
In 2020, The US Mortgage Rate Briefly Decoupled From Its Usual Relationship With The Bond Yield
But by early 2021, the mortgage rate had normalised its relationship with the bond yield, so the snap-up in yields earlier this year lifted mortgage rates point for point. The worrying result was that US mortgage applications for house purchases collapsed by one third (Chart I-7). Chart I-7As Bond Yields Rose Earlier This Year, US Mortgage Applications Collapsed By One Third
As Bond Yields Rose Earlier This Year, US Mortgage Applications Collapsed By One Third
As Bond Yields Rose Earlier This Year, US Mortgage Applications Collapsed By One Third
Fortunately, the negative feedback from markets and the economy meant that the snap-up in bond yields was brief. As yields have subsequently fallen back, mortgage demand has stabilised. Yet the crucial lesson is that US bond yields cannot move up very far before severely choking mortgage demand and hence the housing market (not to mention the stock market). To repeat, US house prices are more stretched versus rents than at the peak of the credit boom in 2007. With this precarious dynamic, we reiterate our structural recommendation to own the US 30-year T-bond, whose ultimate low in yield will come in the next deflationary shock. As bond yields rose earlier this year, US mortgage applications collapsed by one third. But today we are adding a new structural recommendation. Given that Chinese real estate valuations are even more precariously balanced than those in the US, and that purchases have been lending-fuelled, Chinese long-dated bonds are an excellent structural investment for those investors who can accept the capital control risks. As a structural holding, buy the China 30-year government bond (Chart I-8). Chart I-8The Ultimate Low In The US And China 30-Year Bond Yield Is Still To Come
The Ultimate Low In The US And China 30-Year Bond Yield Is Still To Come
The Ultimate Low In The US And China 30-Year Bond Yield Is Still To Come
As for the highly-valued real estate asset-class, the paradox is that valuations will reach their ultimate high when 30-year bond yields reach their ultimate low. Until then, stay structurally long real estate. Uranium Is The Latest ‘Meme Theme’ The recent near-vertical ascent in uranium plays have left many investors scratching their heads and wondering: what’s going on? The answer, in large part, is that uranium plays have become the latest ‘meme theme’. On Reddit’s Wall Street Bets forum, the Canadian uranium miner Cameco has become the second most discussed stock, with one post likening the current opportunity to that in Gamestop, the original meme stock. Of course, as in all meme themes, there must be a loose narrative to latch on to. In this case, it is that as a zero carbon-emitting source of energy, uranium demand should rise while supply remains tight. Still, fractal analysis suggests that meme investors have moved prices too far too fast. Elsewhere, fractal analysis suggests that the spectacular rally in palm oil is also susceptible to a reversal. In this case, the rally has been due to supply bottlenecks in Indonesia and Malaysia, which we expect ultimately to ease (Chart I-9) Chart I-9The Spectacular Rally In Palm Oil Is Susceptible To Reversal
The Spectacular Rally In Palm Oil Is Susceptible To Reversal
The Spectacular Rally In Palm Oil Is Susceptible To Reversal
Nevertheless, this week our favoured trade is to short the meme theme rally in uranium plays (Chart I-10). A good expression is to short the UK stock Yellow Cake, setting the profit target and symmetrical stop-loss at 13 percent. Chart I-10Short The Meme Theme Rally In Uranium Plays
Short The Meme Theme Rally In Uranium Plays
Short The Meme Theme Rally In Uranium Plays
Dhaval Joshi Chief Strategist dhaval@bcaresearch.com Footnotes 1 The other two cities in the top six are Los Angeles and Miami. 2 Based on Savills Prime Index: World Cities – Capital Values, and World Cities – Rents and Yields, June 2011 through June 2021. 3 This calculation assumes an interest only mortgage. The increase would be less for a capital repayment mortgage, but it would still be substantial. Fractal Trading System Fractal Trades 6-Month Recommendations Structural Recommendations Closed Fractal Trades Closed Trades Asset Performance Equity Market Performance Indicators To Watch - Bond Yields Chart II-1Indicators To Watch - Bond Yields - Euro Area
Indicators To Watch - Bond Yields - Euro Area
Indicators To Watch - Bond Yields - Euro Area
Chart II-2Indicators To Watch - Bond Yields - Europe Ex Euro Area
Indicators To Watch - Bond Yields - Europe Ex Euro Area
Indicators To Watch - Bond Yields - Europe Ex Euro Area
Chart II-3Indicators To Watch - Bond Yields - Asia
Indicators To Watch - Bond Yields - Asia
Indicators To Watch - Bond Yields - Asia
Chart II-4Indicators To Watch - Bond Yields - Other Developed
Indicators To Watch - Bond Yields - Other Developed
Indicators To Watch - Bond Yields - Other Developed
Indicators To Watch - Interest Rate Expectations Chart II-5Indicators To Watch - Interest Rate Expectations
Indicators To Watch - Interest Rate Expectations
Indicators To Watch - Interest Rate Expectations
Chart II-6Indicators To Watch - Interest Rate Expectations
Indicators To Watch - Interest Rate Expectations
Indicators To Watch - Interest Rate Expectations
Chart II-7Indicators To Watch - Interest Rate Expectations
Indicators To Watch - Interest Rate Expectations
Indicators To Watch - Interest Rate Expectations
Chart II-8Indicators To Watch - Interest Rate Expectations
Indicators To Watch - Interest Rate Expectations
Indicators To Watch - Interest Rate Expectations
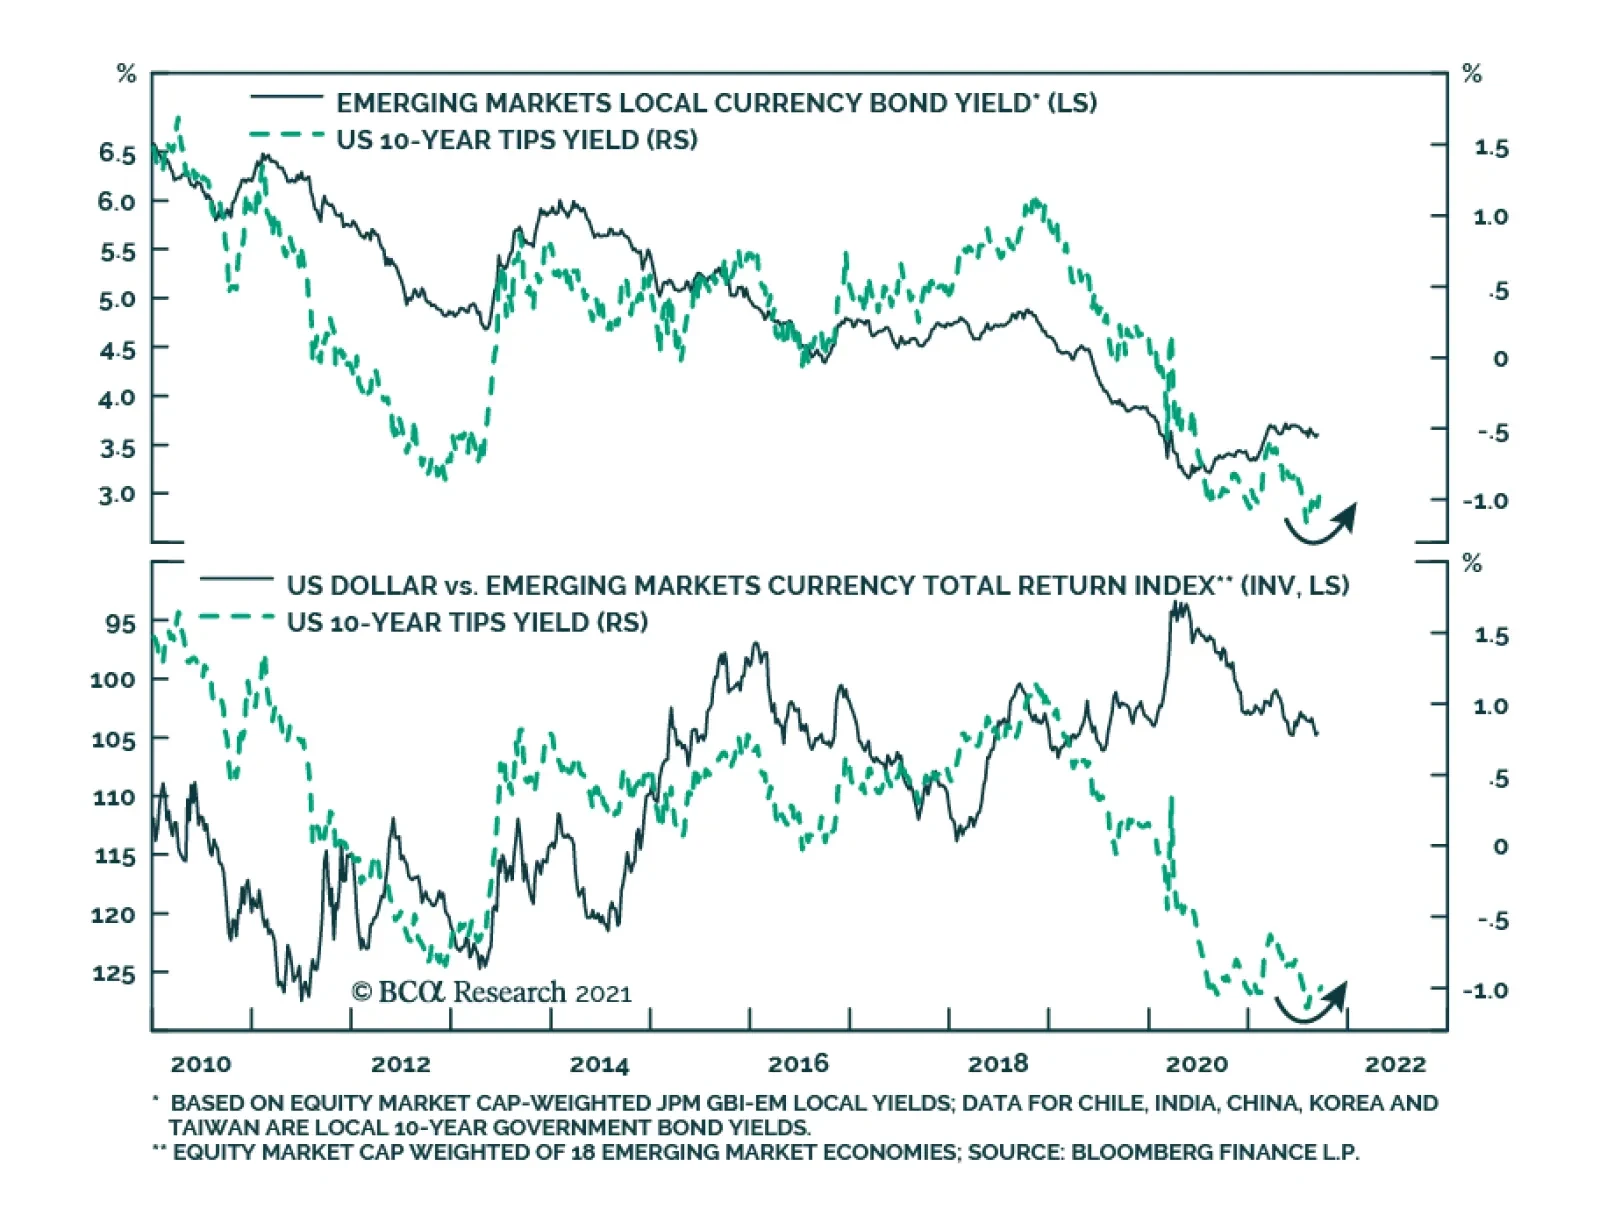
The Fed’s policy normalization process is likely to produce a slight hawkish surprise. The central bank will probably raise interest rates earlier and faster than current market expectations (see Country Focus). We do not expect this process to be a source of…
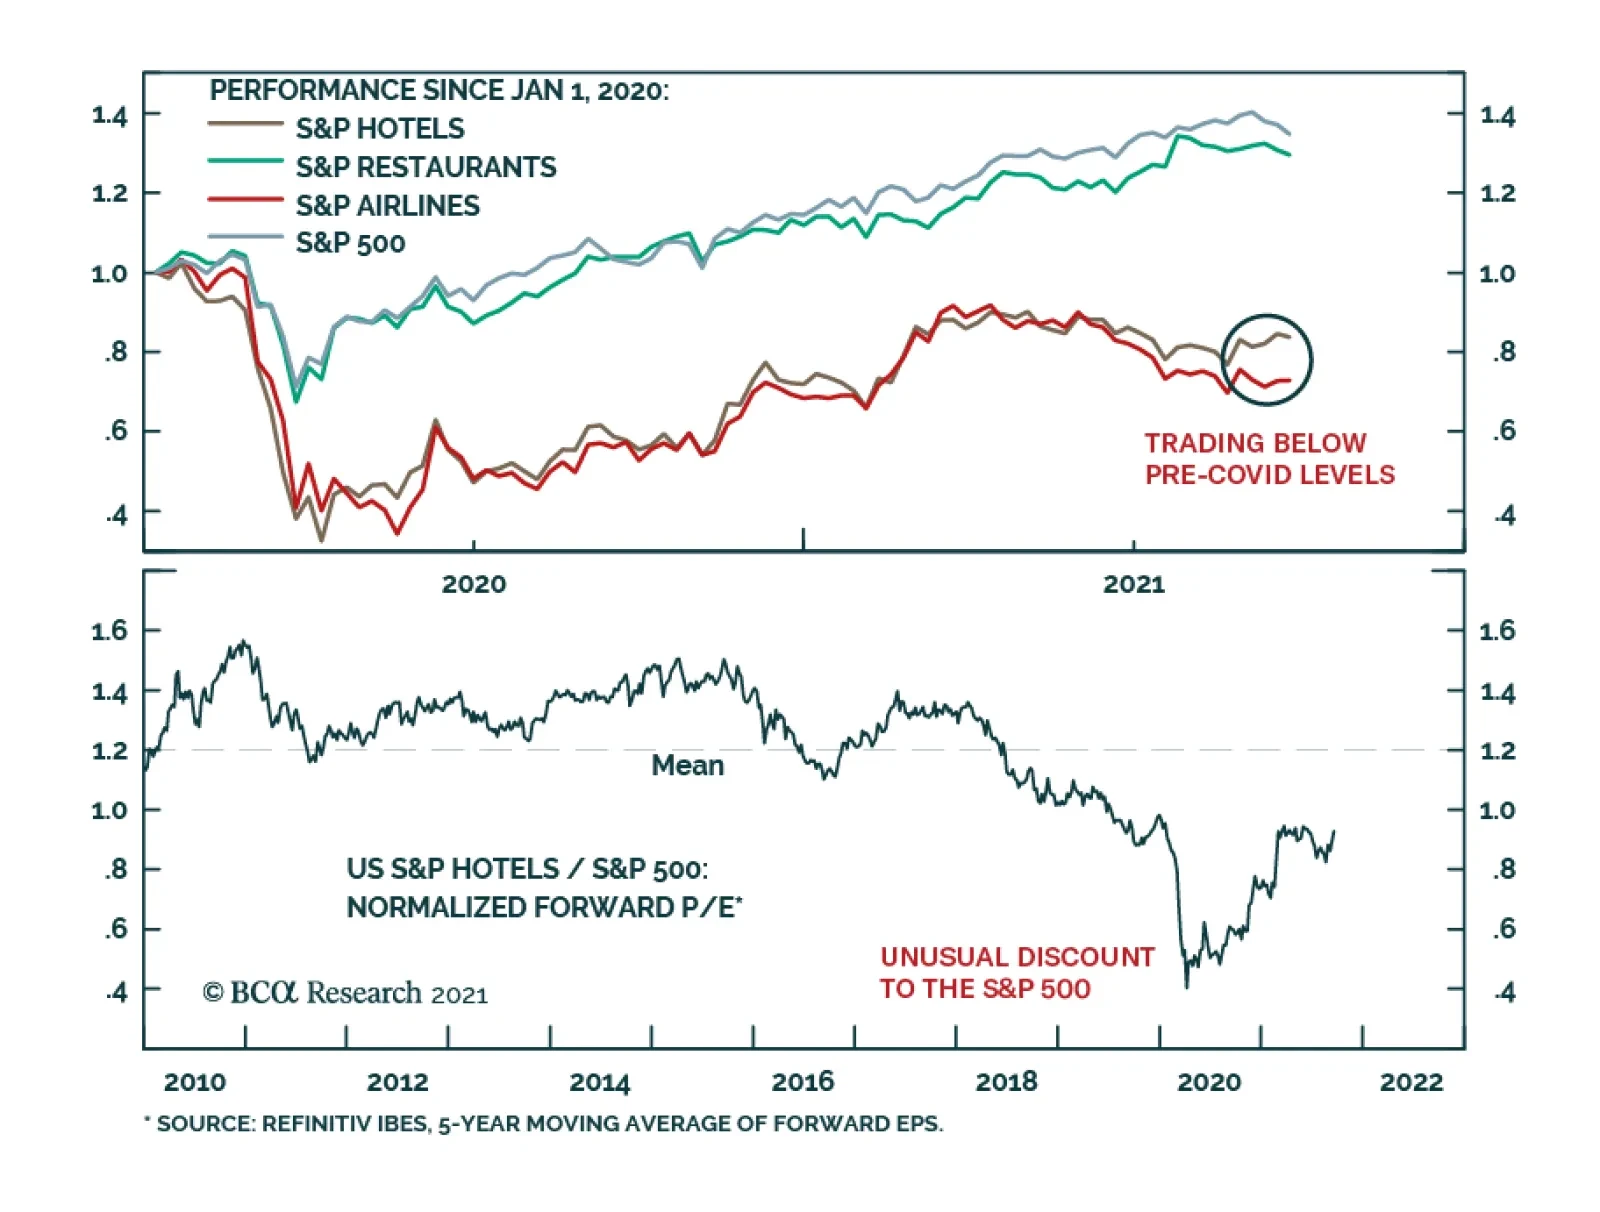
BCA Research’s US Equity Strategy service recommends overweighting the Hotels, Resorts, and Cruise Lines industry. The team summarizes this view as follows: The Delta variant is cresting. Their base case is that herd immunity is not far off. Of…