Equities
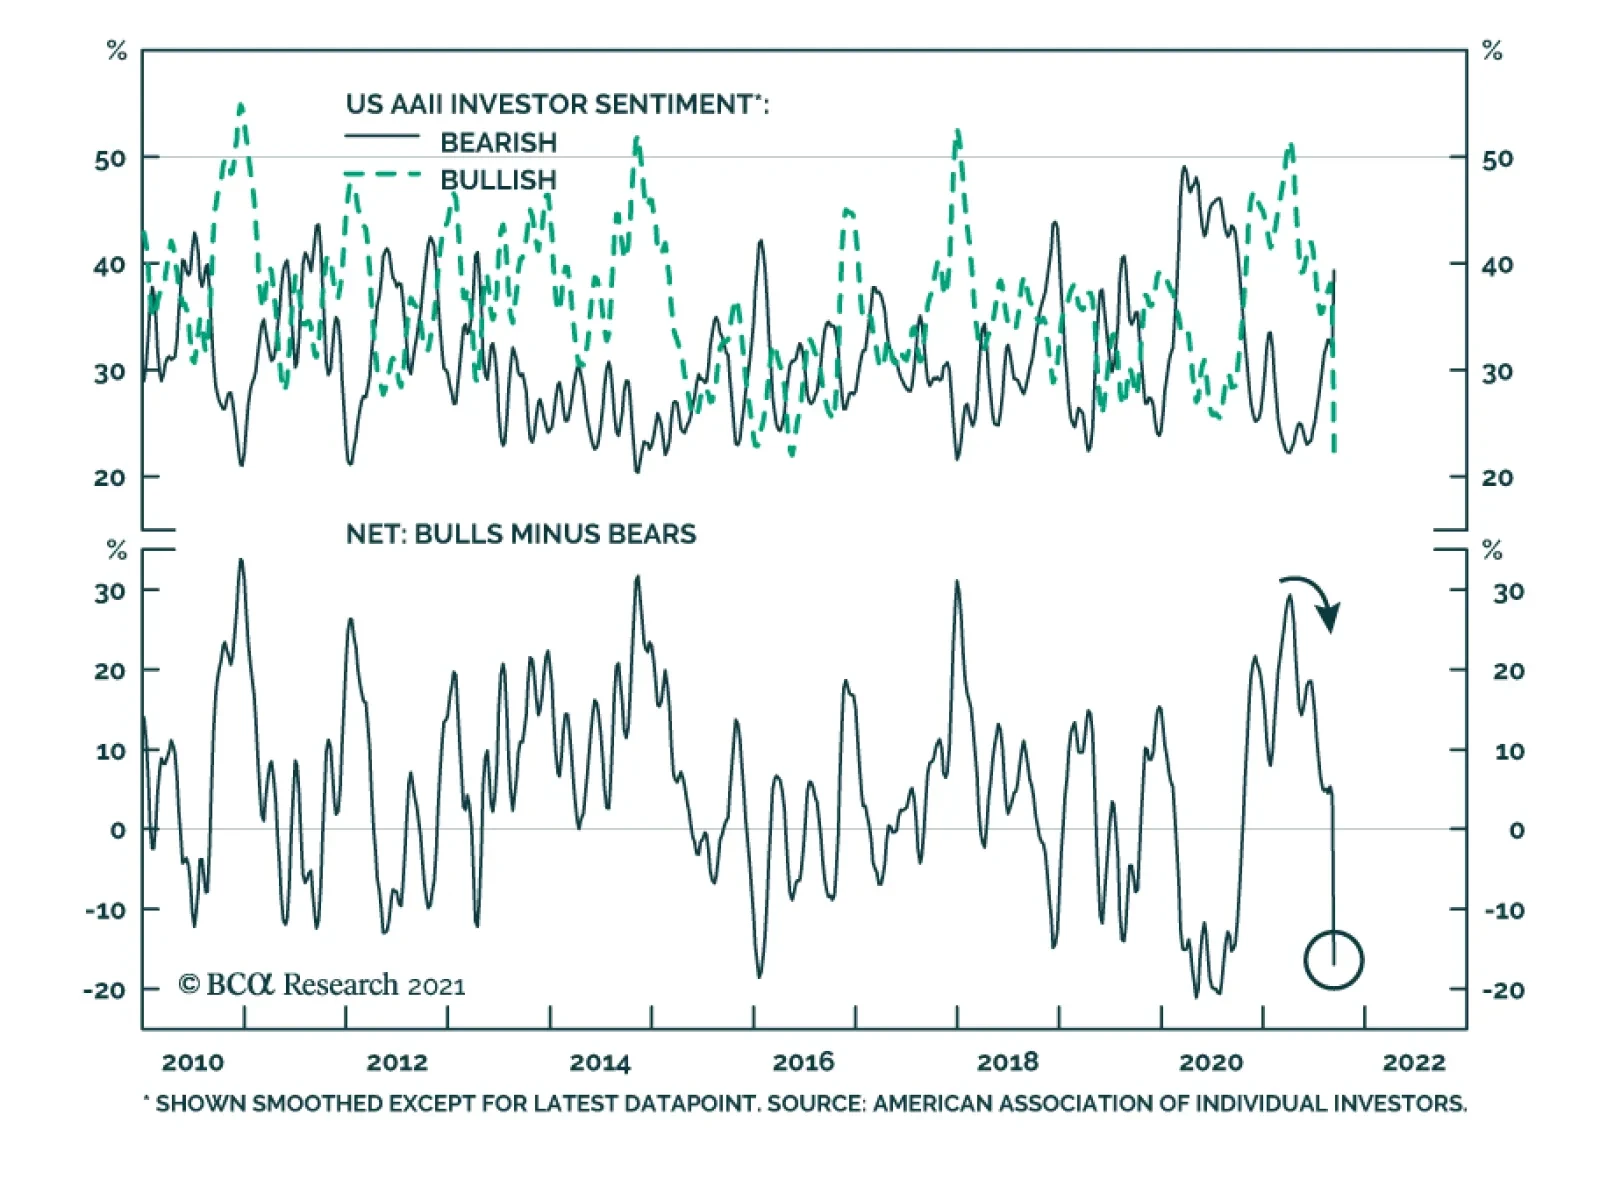
The American Association of Individual Investors’ latest sentiment survey reveals that bullish sentiment has collapsed. Bears exceeded bulls by 16.9 points in the week ending September 15 – among the widest margins in the history of the series. There are…

Over the past few days, we have received several questions regarding the decrease in US savings we highlighted on Chart 4 in the most recent Strategy Report. US personal savings have decreased by roughly $4 trillion (SAAR) since their recent peak in March 2021, which raises the question of where all that money went? We must start by looking at how personal savings are computed. Broadly speaking, the savings number is a “stock,” which has income as an inflow and spending outlays as an outflow. Change in either of them changes the level of savings in the economy. The recent decrease in personal savings was due to the decrease in the income component, while spending outlays have remained unchanged. Specifically, the $4 trillion SAAR decrease in savings matches the $4 trillion SAAR decrease in government transfers (Chart 1). The implication is that dissaving merely maintained the same level of consumer spending. Chart 1
CHART 1
CHART 1
In fact, US retail sales have contracted since March 2021, further validating our conclusion that savings did not decrease because of additional spending (Chart 2, top panel). The breakdown of the US retail sales release (Charts 2- 4) shows that the categories which increased are restaurant, miscellaneous retail, clothing stores, food & beverage retail, and gas stations. Spending on durable goods has declined. Chart 2
CHART 2
CHART 2
Chart 3
CHART 3
CHART 3
Chart 4
CHART 4
CHART 4
Bottom Line: The fall in US personal savings from the recent March 2021 peak was driven by a decline in government transfers, and consumers dipping into savings to pay for services and everyday needs.
Highlights We cannot predict how China will manage Evergrande precisely but we have a high conviction that it will do whatever it takes to prevent contagion across the property sector. However, China’s stimulus tools are losing their effectiveness over time. The country is due for a prolonged struggle with financial and economic instability regardless of whether Evergrande defaults. A messy default would obviously exacerbate the problem. China’s regulatory crackdowns target private companies and will continue to weigh on animal spirits in the private sector. The government will be forced to use fiscal policy to compensate. The US’s and China’s switch from engagement to confrontation poses a persistent headwind for investor sentiment toward China. The new consensus that investors should buy into China’s “strategic sectors” to avoid arbitrary regulatory crackdowns is vulnerable to its own logic and to sanctions by the US and its allies. Feature China poses a unique confluence of domestic and foreign political risks and global markets are now pricing them. Property giant Evergrande could default on $120 million in onshore and offshore interest payments as early as September 23, or next month, prompting investors to run for cover. Is this crisis fleeting or part of a larger systemic failure? It is a larger systemic failure. We expect a slow-motion, Japanese-style crisis over the coming decade, marked with periodic bailouts and stimulus packages. We recommend investors stay the course: steer clear of China and stay short the renminbi and Taiwanese dollar. Tactically, stick with large caps, defensive sectors, and developed markets within the global equity universe. Strategically, prefer emerging markets that benefit from forthcoming Chinese (and American) stimulus. 1. A “Minsky Moment” Cannot Be Ruled Out The chief fear is whether the approaching default of Evergrande marks China’s “Minsky Moment.” Hyman Minsky’s financial instability hypothesis held that long periods of stable revenues lead to risky financial deals and large accumulations of systemic risk that are underpriced. When revenues cannot cover interest payments, a crash ensues followed by deleveraging. Minsky’s hypothesis speaks to debt crises in an entire economy, yet nobody knows for sure whether China’s economy has reached such a breaking point. China’s national savings rate stands at 45.7% of GDP and nominal growth exceeds the long-term government bond yield. However, a sharp drop in asset prices, especially in the property sector, could change everything, as it could lead to balance sheet recession among corporates and a fall in national income. Evergrande is supposed to make an $84 million interest payment on offshore debt and a $36 million payment on onshore debt this week, and after 30 days it would default. It owes $37 billion in debt payments over the next 12 months but only has $13 billion cash on hand (as of June 30, 2021). Authorities can opt for a full bailout or a partial bailout, in which the company defaults on offshore bonds but not onshore. They could even let the company fail categorically, though that would produce exactly the kind of precipitous drop in property asset prices that would lead to wider financial contagion. State intervention to smooth the crisis is more likely – and the government can easily pressure other companies into acquiring Evergrande’s assets and business divisions. Chart 1Yes, This Could Be China's Minsky Moment
Yes, This Could Be China's Minsky Moment
Yes, This Could Be China's Minsky Moment
Chart 1 shows that China’s corporate debt-to-GDP ratio stands head and shoulders above other countries that experienced financial crises in recent decades, courtesy of our Emerging Markets Strategy. While China can undoubtedly bear large debts due to its savings, the implication is that China has large enough financial imbalances to suffer a full-fledged financial crisis, even if the timing is hard to predict. Household credit is also elevated at 61.7% of GDP, and the household debt-to-disposable-income ratio is now higher than in the United States. About two-thirds of China’s corporate debt is held by state-owned or state-controlled entities, prompting some investors to dismiss the gravity of the risk. However, financial crises often involve the transfer of debt from the state to private sector or vice versa. 59% of bond defaults in H1 2021 have involved state companies. Total debt is the main concern. Don’t take our word for it: China’s Communist Party has warned for the past decade about the danger of “implicit guarantees” and “moral hazard” that encourage financial excesses in the corporate sector. The Xi Jinping administration has tried to induce a deleveraging process since it came to power in 2012-13. Xi’s “three red lines” for the property sector precipitated the current turmoil. Even if Evergrande’s troubles are managed, China’s systemic risks will continue to boil over as its potential growth rate slows and the government continues trying to wring out financial excesses. Chart 2Policy Uncertainty, Financial Stress Can Rise Higher
Policy Uncertainty, Financial Stress Can Rise Higher
Policy Uncertainty, Financial Stress Can Rise Higher
More broadly China is experiencing an unprecedented overlap of economic and political crises: The population is aging and labor force is shrinking; The economic model since 2009 has been changing from export-manufacturing to domestic-oriented, investment-driven growth; Indebtedness is spreading from corporates to households and ultimately the government; The governance model is shifting from “single-party rule” to “single-person rule” or autocracy; The population is reaching middle class status and demanding better quality of life; The international trade environment is turning from hyper-globalization to hypo-globalization; The geopolitical backdrop is darkening with the US and its allies attempting to contain China’s ambitions of regional supremacy. Almost all of these changes bring more risks than opportunities to China over the long haul. The need for rapid policy shifts provides the ostensible reasoning for President Xi Jinping’s decision not to step down but to remain president for the foreseeable future. He will clinch this position at the twentieth national party congress in fall 2022. The implication is that policy uncertainty will continue climbing up to at least 2019 peaks while offshore equity markets will continue to trend lower, as they have done since the onset of the US trade war (Chart 2). Credit default swap rates have so far been subdued but they are showing signs of life. A sharp rise in policy uncertainty and property sector stress would pull them up. Domestic equities (A-shares) have rallied since 2019 but we would expect them to fall back given China’s historic confluence of structural and cyclical challenges, which will create further negative surprises (Chart 2, bottom panel). 2. Beijing Will Provide Bailouts And Stimulus Ad Nauseum Evergrande’s future may be in doubt but Beijing will throw all its power at stopping nationwide financial contagion. True, a policy miscalculation is possible. A tardy or failed intervention cannot be ruled out. However, investors should remember that a clear pattern of bailouts and stimulus has emerged over the course of the Xi Jinping administration whenever a “hard landing” or financial collapse loomed. The government tightens controls on bloated sectors until the financial fallout threatens to undermine general economic and social stability, at which point the government eases policy. It is often forced to stimulate the economy aggressively. Chart 3 shows these cycles in two ways: China’s control of credit through the state-controlled banks, and the frequency of news stories mentioning important terms associated with financial and economic distress: defaults, layoffs, and bankruptcies. These three terms used to be unheard of among China watchers. Under the Xi administration, a higher tolerance of creative destruction has served as the way to push forward reform. The current rise in distress is not extended, suggesting that more bad news is coming, but it also shows that the government has repeatedly been forced to provide stimulus even under the Xi administration. Chart 3Xi Jinping Has Bailed Out System Three Times Already
Xi Jinping Has Bailed Out System Three Times Already
Xi Jinping Has Bailed Out System Three Times Already
Could this time be different? Not likely. The American experience and the pandemic will also force China’s government to ease policy: China learns from US mistakes. The US lurched from Lehman’s failure into a financial crisis, an impaired credit channel, a sluggish economic recovery, a spike in polarization, policy paralysis, a near-default on the national debt, a surge in right- and left-wing populism, the tumultuous Trump presidency, widespread social unrest, a contested leadership succession, and a mob storming the nation’s capitol (Chart 4). This is obviously the nightmare of any Chinese leader and a trajectory that the Xi administration will avoid at any cost. Chart 4Lehman Brothers A Powerful Disincentive For China To Let Evergrande Fail
Lehman Brothers A Powerful Disincentive For China To Let Evergrande Fail
Lehman Brothers A Powerful Disincentive For China To Let Evergrande Fail
Chinese households store their wealth in the property sector, so any attempt at policy restraint or austerity faces a massive constraint. Only a few countries are comparable to China with respect to the share of non-financial household wealth (property and land) within total household wealth. All of them are hosts of property sector bubbles, including the bubbles in Spain and Ireland back in 2007 (Chart 5). A property collapse would destroy the savings of the Chinese people over four decades of prosperity. Chart 5Property Is The Bedrock Of Chinese Households
Five Points On China’s Crisis
Five Points On China’s Crisis
Social instability is already flaring up. Almost all China experts agree that “social stability” is the Communist Party’s bottom line. But note that the Evergrande saga has already led to protests, not only at the company’s headquarters in Shenzhen but also in other cities such as Shenyang, Guangzhou, Chongqing. Protests were filmed and shown on social media (posts have been censored). Protesters demanded repayment for wealth management products gone sour and properties they are owed that have not been built. This is only a taste of the cross-regional protests that would emerge if the broader property sector suffered. The lingering COVID-19 pandemic is still relevant. Investors should not underrate the potential threat that the pandemic poses to the regime. Severe epidemics have occurred about 11% of the time over the course of China’s history and they often have major ramifications. Disease has played a role in the downfall of six out of ten dynasties – and in four cases it played a major role. It would be suicidal for any regime to add self-inflicted economic collapse to a lingering pandemic (Table 1). Table 1Disease Threatens Chinese Dynasties – Not A Time To Self-Inflict A Recession
Five Points On China’s Crisis
Five Points On China’s Crisis
Easing policy does not necessarily mean bringing out the “bazooka” and splurging on money and credit growth, though that is increasingly likely as the crisis intensifies. Notably the July Politburo statement specifically removed language that said China would “avoid sharp turns in policy.” In other words, sharp turns might be necessary. That can only mean sharp reflationary turns, as there is very little chance of doubling down on policy tightening. A counterargument holds that the Chinese government is now exclusively focused on power consolidation to the neglect of financial and economic stability. Perhaps the leadership is misinformed, overconfident, or thinks a financial collapse will better purge its enemies – along the lines of the various political purges under Chairman Mao Zedong. Wealthy tech magnates and property owners could conceivably challenge the return of autocracy. After all, the US political establishment almost “fell” to a rich property baron – why couldn’t China’s Communist Party? Political purges should certainly be expected ahead of next year’s party congress. But not to the point of killing the economy. The government would not be trying to balance policy tightening and loosening so carefully if it sought to induce chaos. It must be admitted, however, that the change to autocracy means that the odds of irrational or idiosyncratic policy have gone up substantially and permanently. Of course, the high likelihood that Beijing will provide bailouts and stimulus should not be read as a bullish investment thesis, even though it would create a pop in oversold assets. The Chinese system is saturated with money and credit, which have been losing their effectiveness in driving growth. Financial imbalances get worse, not better, with each wave of credit stimulus. Beijing is caught between a rock and a hard place. Hence stimulus comes only reluctantly and reactively. But it does come in the end because a financial crash would threaten the life of the regime and preclude all other policy priorities, domestic and foreign. 3. Yes, China’s Regulatory Crackdown Targets The Private Sector Global growth and other emerging economies will get most of the benefit once China stimulates, since China’s own firms will still face a negative domestic political backdrop. Bullish investors argue that the government’s regulatory tightening is misunderstood and overblown. The claim is that China is not targeting the private sector generally but only isolated sectors causing social problems. Costs need to be reduced in property, education, and health to improve quality of life. China shares the US’s and EU’s desire to rein in tech giants that monopolize their markets, abuse consumer data and privacy, and benefit from distorted tax systems. Most of these arguments are misleading. China does not have a strong record on data privacy, equality, social safety nets, rule of law, or “sustainable” growth (as opposed to “unsustainable,” high-debt, high-polluting growth). China actively encourages state champions that monopolize key sectors. Many developed markets have better records in these areas, notably in Europe, yet China is eschewing these regulatory models in preference for an approach that is arbitrary and absolutist, i.e. negative for governance. As for the private sector, animal spirits have been in a long decline throughout the past decade. This is true whether judging by money velocity – i.e. the pace of economic activity relative to the increase in money supply – or by households’ and businesses’ marginal propensity to save (Chart 6). The 2015-16 period shows that even periodic bouts of government stimulus have not reversed the general trend. Regulatory whack-a-mole and financial turmoil will not improve the situation. Chart 6Private Sector Animal Spirits Depressed Throughout Xi Era
Private Sector Animal Spirits Depressed Throughout Xi Era
Private Sector Animal Spirits Depressed Throughout Xi Era
Chart 7Even Official Data Shows Consumer Confidence Flagging
Even Official Data Shows Consumer Confidence Flagging
Even Official Data Shows Consumer Confidence Flagging
Surveys of sentiment confirm that the latest developments will have a negative effect (Chart 7). Cumulatively, the changes in China’s domestic and international policy context are being interpreted as negative for business, entrepreneurship, and economic freedom – notwithstanding the government’s claims to expand opportunity in its “common prosperity” plan. 4. The Withdrawal Of US Friendship Is A Headwind For China Chart 8Other Asians Sought US Friendship, Not Conflict, When Export Models Expired
Other Asians Sought US Friendship, Not Conflict, When Export Models Expired
Other Asians Sought US Friendship, Not Conflict, When Export Models Expired
All of the successful Asian economies – including China for most of the past forty years of prosperity – have tried to stay on the good side of the United States. By contrast, China and the US today are shifting from engagement to confrontation and breaking up their economic ties (Chart 8). This is a problem for China because the US and to some extent its allies will seek to undermine China’s economy and its autocratic model as part of this great power competition. The rise in geopolitical risk is underscored by the Australia-UK-US (AUKUS) agreement, by which the US will provide Australia with nuclear submarines over the next decade. This was a clear demonstration of the US’s “pivot to Asia” and the fact that the US and China are preparing for war – if only to deter it. China’s return to autocracy and clash with the US and Asian neighbors is also leading to a deterioration of its global image, particularly over issues of transparency and information sharing. The dispute over the origins of COVID-19 is a major source of division with the US and other countries. Transparency is important for investors. The World Bank has discontinued its “Ease of Doing Business” rankings after a scandal was revealed in which China’s ranking was artificially bumped up. The last-published trend is still downward (Chart 9). Most recently China has stepped up censorship of its financial news media amid the current market turmoil, which makes it harder for investors to assess the full extent of property and financial risks.1 The US political factions agree on China-bashing if nothing else. The Biden administration has little political impetus to eschew tariffs and export controls. One important penalty will come from the Securities and Exchange Commission, which is likely to ban Chinese firms from US stock exchanges unless they conform to common accounting standards. Hence the dramatic fall in the share prices of Chinese companies listed via American Depository Receipts (ADRs), in both absolute and relative terms (Chart 10, top panel). This threat prompted China’s recent crackdown on its own firms that were attempting to hold initial public offerings on US exchanges. Chart 9US Conflict Exposes China’s Global Influence Campaign
Five Points On China’s Crisis
Five Points On China’s Crisis
The Quadrilateral Forum – the US, Japan, Australia, and India – has agreed to link the semiconductor supply chain to human rights standards, foreclosing China’s participation in that supply chain. US semiconductor firms are among the most exposed to China but they have not suffered over the course of the US-China tech war, suggesting that US vulnerabilities are limited (Chart 10, bottom panel). Chart 10US Regulators Will Kick Chinese Firms While They Are Down
US Regulators Will Kick Chinese Firms While They Are Down
US Regulators Will Kick Chinese Firms While They Are Down
The point is not to exaggerate the strength of the US and its allies but rather the costs to China of actively opposing them. The US has a difficult enough time cobbling together a coalition of states to impose sanctions on Iran over its nuclear program, not to mention forming any coalition that would totally exclude and isolate China. China is far more important to US allies than Iran – it is irreplaceable in the global economy (Chart 11). The EU and China’s Asian neighbors will typically restrain the US’s more aggressive impulses so as not to upset the global recovery or end up on the front lines of a war.2 Chart 11No Substitute For China In Global Economy
Five Points On China’s Crisis
Five Points On China’s Crisis
This diplomatic constraint on the US is probably positive for global growth but not for China per se. American allies are still able to increase the costs on China for pursuing its own state-backed development path and geopolitical sphere of influence. Japan, Australia, and others are likely to veto China’s application to join the Comprehensive and Progressive Trans-Pacific Partnership (CPTPP), while the UK and eventually the US are likely to join it. Investors should view US-China ties as a headwind at least until the two powers manage to negotiate a diplomatic thaw, i.e. substantial de-escalation of tensions. A thaw is unlikely in the lead-up to Xi Jinping’s consolidation of power and the US midterm elections in fall 2022. Presidents Biden and Xi are still working on a bilateral summit, not to mention a more substantial improvement in ties. We doubt a diplomatic thaw would be durable anyway but the important point is that until it happens China will face periodic bouts of negative sentiment from the emerging cold war. Other Asian economies thrived under US auspices – China is sailing in uncharted waters. 5. Global Investors Cannot Separate Civilian From State And Military Investments The word on Wall Street is that investors should align their strategies with those of China’s leaders so as not to run afoul of arbitrary and draconian regulators. For example, instead of “soft tech” or consumer-oriented companies – like those that give people rides, deliver food, or make creative video games – investors should invest in “hard tech” or strategic companies like those that make computer chips, renewable energy, biotechnologies, pharmaceuticals, and capital equipment. There is no question that the trend in China – and elsewhere – is for governments to become more active in picking winners and losers. Industrial policy is back. Investors have no choice but to include policy analysis in their toolbox. However, for global investors, an investment strategy of buying whatever the government says is far from convincing. The most basic investment strategy in keeping with the Xi administration’s goals would be to invest in state-owned enterprises in domestic equity markets. So SOEs should have outperformed the market, right? Wrong. They were in a downtrend prior to the 2015 bubble, the burst of which caused a further downtrend (Chart 12, top panel). Similarly, the preference for “hard tech” over “soft tech” is promising in theory but complicated in practice: hard tech is flat-to-down over the decade and down since COVID-19 (Chart 12, middle panel). It has underperformed its global peers (Chart 12, bottom panel). China’s policy disposition should be beneficial for industrials, health care, and renewable energy. First, China is doubling down on its manufacturing economy. Second, the population is aging and health care is a critical part of the common prosperity plan. Third, green energy is a way of diversifying from dependency on imported oil and natural gas. However, the profile of these sectors relative to their global counterparts is only unambiguously attractive in the case of industrials, which began to outperform even during the trade war (Chart 13). Chart 12State Approved' Trades Still Bring Risks
State Approved' Trades Still Bring Risks
State Approved' Trades Still Bring Risks
Chart 13Beware 'State Approved' Trades
Beware 'State Approved' Trades
Beware 'State Approved' Trades
In Table 2 we outline the valuations and political risks of onshore equity sectors. Valuations are not cheap. Domestic and foreign risks are not fully priced. Table 2China Onshore Equities, Valuations, And (Geo)Political Risks
Five Points On China’s Crisis
Five Points On China’s Crisis
There is a bigger problem for global investors, especially Americans: investing in China’s strategic sectors directly implicates investors in the Communist Party’s domestic human rights practices, state-owned enterprises, and national security goals. “Civil-military fusion” is a well-established doctrine that calls for the People’s Liberation Army to have access to the cutting-edge technology developed by civilians and vice versa. These investments will eventually be subject to punitive measures since the US policy establishment believes it can no longer afford to let US wealth buttress China’s military and technological rise. Investment Takeaways China may or may not work out a partial bailout for Evergrande but it will definitely provide state assistance and fiscal stimulus to try to prevent contagion across the property sector and financial system. Bad news in the coming weeks and months will be replaced by good news in this sense. However, the fact that China will eventually be forced to undertake traditional stimulus yet again will increase its systemic financial risks, in a well-established pattern. The best equity opportunities will lie outside of China, where companies will benefit from global recovery yet avoid suffering from China’s unique confluence of domestic and foreign political risks. We prefer developed markets and select emerging markets in Latin America and Asia-ex-China. Chinese households and businesses are downbeat. This behavior cannot be separated from the historic changes in the economy, domestic politics, and foreign policy. It is hard to see an improvement until the government boosts growth and the 2022 political reshuffle is over. American opposition is a bigger problem for China than global investors realize. Not only are the two economies divorcing but other democracies will distance themselves from China as well – not because of US demands but because their own manufacturing, national security, and ideological space is threatened by China’s reversion to autocracy and assertive foreign policy. Investing in China’s “hard tech” and strategic sectors with government approval is not a simple solution. This approach will directly funnel capital into China’s state-owned enterprises, domestic security forces, and military. As such the US and West will eventually impose controls. Investments may not be liquid since China would suffer if capital ever fled these kinds of projects. Both American and Chinese stimulus is looming this winter but the short run will see more volatility. We are closing our long JPY-KRW tactical trade for a gain of 4.4% Matt Gertken Vice President Geopolitical Strategy mattg@bcaresearch.com Footnotes 1 We have often noted in these pages over the past decade that multilateral organizations overrated improvements in China’s governance based on policy pronouncements rather than structural changes. 2 Still, tensions among the allies should not be overrated since they share a fundamental concern over China’s increasing challenge to the current global order. The EU is pursuing trade talks with Taiwan, and there are ways that the US can compensate France over the nullification of its submarine sales to Australia (most of which are detrimental to China’s security).
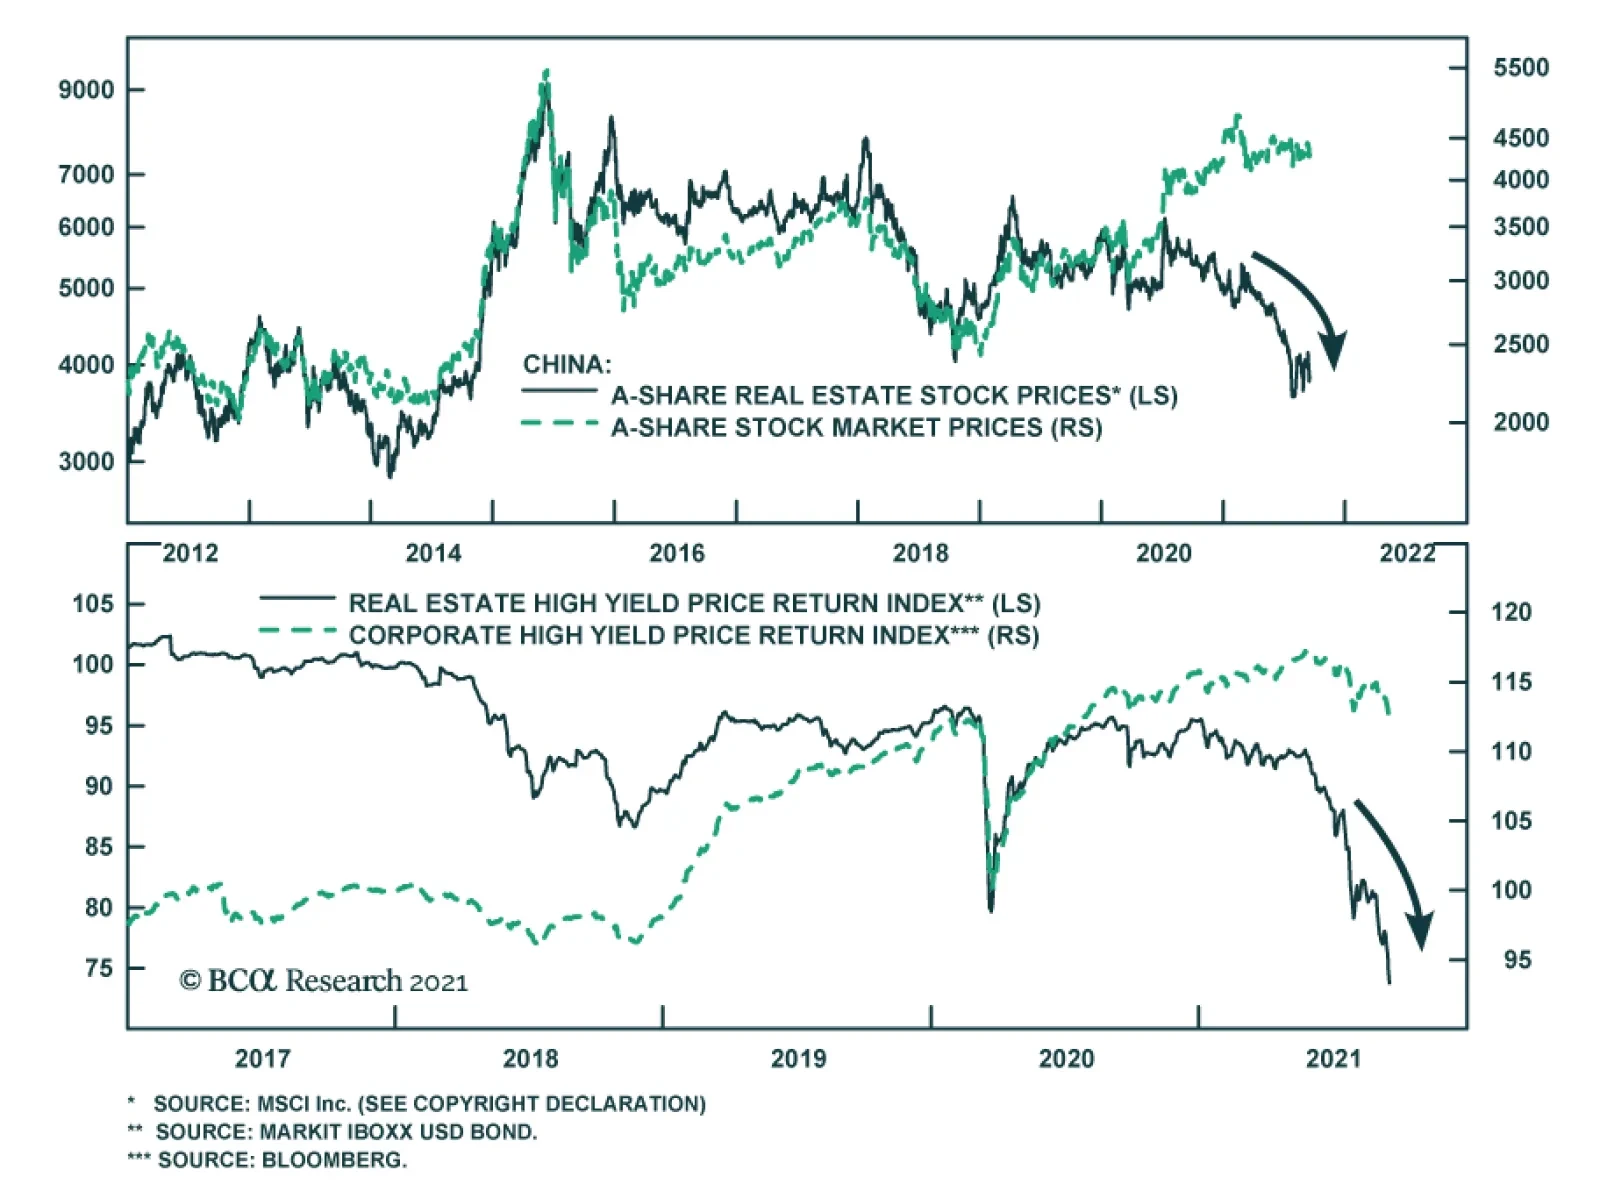
The possibility of Chinese real estate developer Evergrande’s collapse threatens the stability of the country’s economy and financial markets through multiple facets. The company accounts for an outsized share of outstanding high-yield dollar bonds and is…

BCA Research's US Investment Strategy service does not expect the fall of an overextended Chinese property developer to push the US out of Goldilocks and into too-cold territory. Reports that Evergrande will fail to make scheduled interest and principal…
Highlights Covid-19 has wreaked havoc in the markets, but the Hotels, Restaurants & Leisure, and Airline industries have been most affected. These industries constitute what we call the “travel complex” as they share common drivers of profitability: First, they have been significantly affected by restrictions imposed on individuals and businesses in response to Covid-19 and, second, they rely on discretionary spending. Recovery of the group was proceeding swimmingly until the Delta variant derailed it in late summer, with reports pouring in about dining rooms closing, airline bookings flagging, and hotel occupancy dipping. What is next? The Delta variant is cresting. Our base case is that herd immunity is not far off. Of course, the travel complex is vulnerable to any new virus scare, and this is a risk investors need to keep in mind. Rising rates will be a mild tailwind for the group, as it tends to outperform in that regime. But this is not a key driver of its performance. Consumer confidence and financial wellbeing are at the core of this group’s profitability. So far, Americans still have money to spare and generally prefer to spend it on services. It is disconcerting that the Consumer Confidence Indicator has turned, but we are not too alarmed just yet: Jobs are still plentiful, and Americans are going back to work. August retail sales surprised on the upside. In Part 1 of the report this week, we take a deep dive into the Hotel, Resort, and Cruise Lines industry. We find the industry attractive for the following reasons: Hotel occupancy has increased, and the amount of money consumers are prepared to spend in hotel stays has surged. Sales are expected to increase by 75%, albeit from low levels, over the next 12 months. Hotels have also discovered many new sources of revenue. Earnings growth is impossible to estimate since last year the industry was losing money; however, margins have just turned positive. Companies also have significant pricing power to pass on expenses to their guests, and have the ability to mend their margins, eventually going back to the historical 20%. Lastly, the industry is cheap relative to its own history on a forward PE basis. According to our Technical Indicator, it is also oversold. The Hotels, Resorts, and Cruise Lines industry has a significant potential to return to its former “glory”, and we believe that it is a sound tactical and cyclical investment. We recommend overweighing this industry. NB: Please stay tuned for Part 2 of the report, on Restaurants and Airlines, next week. Feature Part 1: Hotels, Resorts And Cruise Lines In this two-part publication, we will provide an in-depth overview of Hotels, Restaurants, and Airlines. These industries constitute what we call the “travel complex” as they share many common drivers of profitability: First, they are the industries most exposed to Covid-related fears as well as corresponding government health directives, and, second, they rely on the discretionary spending of both consumers and businesses. In this publication, we will examine the macroeconomic backdrop for the entire travel complex, and then zoom into the Hotels, Resorts, and Cruise Lines industry (“Hotels”). Next week, we will provide an in-depth overview of Restaurants and Airlines. Sneak preview: We are bullish on Hotels and are overweight this industry in our portfolio. Hotels, Restaurant And Leisure, Along With Airlines, Were The Poster Child For Post-Covid Recovery… Covid-19 has wreaked havoc in the markets, but the travel complex was most affected. Airlines, hotels, and restaurants have suffered tremendous losses, and all have required government bailouts either directly, or indirectly through the Paycheck Protection Program (PPP). The travel complex rebounded mightily as the vaccine became widely available in February, and Americans suffering from cabin fever boarded planes, traveled, and ate out (Chart 1). Chart 1Hotels And Airlines Are Still Trading Below Their Pre-Covid Levels
Hotels And Airlines Are Still Trading Below Their Pre-Covid Levels
Hotels And Airlines Are Still Trading Below Their Pre-Covid Levels
Table 1Travel Complex Is Lagging S&P 500
Travel: Extend Your Hotel Stay (Part 1)
Travel: Extend Your Hotel Stay (Part 1)
…Everything Changed This Summer All these positive developments began to reverse over the summer as Delta made its appearance in the US, and even the vaccinated succumbed to fears of infection. Airlines were one of the worst performers in the index. Hotels and restaurants were doing better, but their performance did not shoot the lights out either (Table 1). Restaurants: According to a National Restaurant Association survey of 1,000 adults, in recent weeks nearly one in five Americans say they are no longer going out to restaurants, 9% have canceled existing plans to eat out, and 37% of adults said they ordered delivery or takeout instead of dining in a restaurant. Chains like McDonald’s and Chick-fil-A are slowing their dining room reopenings. As data from restaurant analytics firm Black Box Intelligence demonstrate, sales that had grown steadily earlier this summer have fallen.1 Airlines: Several major airlines have warned in regulatory filings that their third quarter may not look as rosy as hoped. United Airlines has noted a deceleration in customer bookings, while Southwest Airlines reported a continued softness in bookings—even in leisure—and elevated trip cancelations. Similarly, American Airlines has said that, after a strong July, it saw a softness in near-term bookings in August and an increase in near-term cancelations. All three have suggested that the Delta variant is having a dampening effect on business.2 Hotels: Marriott International said that revenue per available room in August of 2021 was down 27% from the 2019 level – a drop from the 23% decline seen in July. However, the CEO of the company sounded sanguine: “The trends seem to be stabilizing as we get into the early days of September”. Most of the decline came from lockdowns in China. The most recent data shows revenue per available room was down 44 percent off 2019 levels — not ideal but an improvement from the 57 percent decline seen a week prior.3 With bad news abundant, the natural question is whether these industries are still a good tactical and cyclical investment. Delta Variant Clearly, a resurgence in infections has had an adverse effect on the travel complex. However, there are early signs that the Covid-19 Delta variant is cresting (Chart 2). Around 75% of the U.S. population has had at least one vaccine shot. Globally, 31.5 million doses/day are being administered. At this rate, it will take just eight months to vaccinate 75% of the global population. Herd immunity is not far off. Our base case is that Covid-19 and its multiple variants are unlikely to disappear, but consumers and businesses are learning how to live with it. We believe that the surge of Delta infections will subside over the fall, and the entire travel complex will continue to recuperate from the Covid-inflicted damage. Of course, the resurgence of Covid-19 cases and newer variants could undermine a recovery. This is a risk investors need to monitor. Chart 2The Covid-19 Delta Variant Is Cresting
The Covid-19 Delta Variant Is Cresting
The Covid-19 Delta Variant Is Cresting
Macroeconomic Backdrop Rising Rates Are A Tailwind For The Travel Complex Direction and rate of change in yields dictate which US equity sectors and industries will do well. There are many crosscurrents in both economic data and Fed speak currently that obscure the answer to this question. Analysis of the performance of travel industries by rates regime suggests that all of them tend to do better when rates are rising, as higher rates indicate stronger economic growth (Chart 3). Airlines are most sensitive to an economic slowdown and will underperform most if rates stay “lower for longer”. Consumers Still Have Money To Spend On Services But Less Than Before Chart 3Travel Outperforms When Rates Are Rising
Travel: Extend Your Hotel Stay (Part 1)
Travel: Extend Your Hotel Stay (Part 1)
Travel is a quintessential representation of discretionary spending on services. Consumers travel and eat out when they are confident about the future and have a healthy income and excess savings. Chart 4Disposable Income And Savings Are Returning To Trend
Disposable Income And Savings Are Returning To Trend
Disposable Income And Savings Are Returning To Trend
The helicopter money drop has increased consumer income and padded their savings. However, income gains were not permanent and, recently, disposable income has returned to trend (Chart 4, Panel 1). Further, much of the excess savings has been spent (Chart 4, Panel 2). In another unpleasant twist, over the past few months, wage gains (4.8%) have lagged price increases (5.2%), reducing the purchasing power of American consumers. In response to these developments, the consumer mood has soured: The Consumer Confidence Indicator has slumped to a six-month low of 114 from 125 a month earlier. The next 12-month inflation expectations have surged to 6.5%. While it is disconcerting that consumer confidence has turned, we are not too alarmed just yet: Jobs are still plentiful, and Americans are likely to go back to work as the majority of children are now attending schools in person. In short, Americans are not destitute, but the pattern of spending is normalizing and returning to the pre-pandemic trend. The August retail sales print at 0.7% surprised on the upside and proves that US consumers have not tightened their belts. It is also a positive for the travel complex that demand for services exceeds demand for goods: Consumer expenditure on goods is above trend and has recently turned, while spending on services is below pre-pandemic levels, and the rebound is running its course (Chart 5). Inflation Is Not A Concern For The Travel Complex CPI readings for the travel complex this summer looked outright scary: In July, airfares were up 19% YoY and the price of hotel stays was up 24% YoY. These numbers have come down to 6.7% and 19.6% in August. Indeed, these readings make us wonder whether travel is still affordable to consumers. The answer is a resounding “yes” – reported surges in prices are a function of a base effect and, compared to the same time two years ago, the two-year CAGR of prices looks reasonable for all the industries (Chart 6). Chart 6Price Increases For The Travel Complex Are Moderate
Travel: Extend Your Hotel Stay (Part 1)
Travel: Extend Your Hotel Stay (Part 1)
Chart 5Real Spending On Services Is At Pre-Pandemic Levels: Room For Further Rebound
Real Spending On Services Is At Pre-Pandemic Levels: Room For Further Rebound
Real Spending On Services Is At Pre-Pandemic Levels: Room For Further Rebound
Analysis By Industry: Hotels, Resorts, And Cruise Lines Hotels is a $55B industry4 which is forecast to produce 31.4% growth in 2021 (Table 2). Its market cap is $239Bn and it constitutes 0.6% of the S&P 500 index. The US Hotel industry suffered about $125 billion5 in aggregate lost revenues due to the pandemic in 2020. Hotel operators were in total cash-conservation mode – slashing capex budgets by 75%, suspending dividends, and raising capital. Some 670,000 workers lost their jobs or were furloughed – only half of these workers have returned so far (Chart 7). Table 2Hotels (GICS 4) Constituents
Travel: Extend Your Hotel Stay (Part 1)
Travel: Extend Your Hotel Stay (Part 1)
After a tough year, Hotels have now mostly reopened. Demand is expected to surge by 31.4% YoY in 2021, and per room revenue has reached $94, higher than the pre-Covid-19 level. Many hotels have returned to profitability. However, hotel occupancy in the US is yet to return to the pre-pandemic level: It currently stands at around 50% compared to 70% plus pre-Covid (Chart 8). Chart 7Industry Was Decimated By Covid And Is Recovering Slowly
Industry Was Decimated By Covid And Is Recovering Slowly
Industry Was Decimated By Covid And Is Recovering Slowly
Chart 8Occupancy Rates Are Returning Back To Normal
Occupancy Rates Are Returning Back To Normal
Occupancy Rates Are Returning Back To Normal
Sources Of Revenue Hotels started to recover during the first half of 2021 and revenues are expected to continue to surge to well above the pre-pandemic level in 2022. Analysts expect hotel sales to rebound by 75% over the next 12 months (Chart 9). There are multiple sources of revenue, and a reduction in business travel and international tourism is likely to be replaced by other creative options. Leisure Travel: Significant pent-up demand has been driving a recovery in hotel stays, but it is mostly in leisure travel. According to AHLA, 56% of consumers say they expect to travel for leisure, roughly the same amount as in an average year. Consumer spending on hotels has rebounded and is close to the pre-pandemic normal (Chart 10). Chart 9Blockbuster Sales Growth Is Expected (Off Low Base)
Blockbuster Sales Growth Is Expected (Off Low Base)
Blockbuster Sales Growth Is Expected (Off Low Base)
Chart 10Consumers Eagerly Spend On Hotels
Consumers Eagerly Spend On Hotels
Consumers Eagerly Spend On Hotels
Business travel is still lagging. According to AHLA, business travel was down by 85% compared to 2019 through April 2021, and since then has only begun ticking up slightly. However, going forward, this trend may turn as companies start positioning their in-person visits as a competitive advantage. Bleisure travel: A new post-Covid trend has developed: Workers combine business travel with leisure, prolonging hotel stays. Another creative idea is “working from a hotel” packages to appeal to remote workers tired of being cooped up at home. International tourism: Covid-related restrictions in the rest of the world, and especially cessation of travel from China, is still denting hotel revenue. With global vaccination rates improving by the day, this segment won’t take long to rebound. Profitability While there is forecast to be a pronounced rebound in hotel sales growth over the next 12 months, it is less obvious whether and when the industry will return to its former levels of profitability (Chart 11). After all, not only was the travel complex damaged by the pandemic, but now hotel operators also incur additional Covid-related cleaning expenses. Currently, analysts expect the next 12 months EPS to rebound to about a quarter of January 2020 trailing EPS ($10 vs $34). While this looks measly, from an investment standpoint it presents an opportunity as eventually, albeit slowly, earnings will return to trend. Historical earnings growth is not calculable as the industry was losing money until very recently. Chart 11Earnings Are Expected To Grow Again
Earnings Are Expected To Grow Again
Earnings Are Expected To Grow Again
Margins And Pricing Power Margins crossed the zero threshold in Q2-2021, but are still almost 20 percentage points below the long-term average (Chart 12). While hotel costs have increased with the pandemic, this industry has significant pricing power to pass on its costs to consumers (Chart 13). Chart 12The Hotel Industry Has Returned To Profitability
The Hotel Industry Has Returned To Profitability
The Hotel Industry Has Returned To Profitability
Chart 13Hotels Have Significant Pricing Power And Can Pass Extra Costs To Guests
Hotels Have Significant Pricing Power And Can Pass Extra Costs To Guests
Hotels Have Significant Pricing Power And Can Pass Extra Costs To Guests
Valuations And Technicals The Hotels industry is trading at 30x forward PE and on a 5-year normalized basis, it is trading with a discount to the S&P 500, which is unusual (Chart 14). In terms of our Technical Indicator, the industry is somewhat oversold, and now looks more attractive than it did earlier this year (Chart 15). Chart 14Hotels Are Trading With A Discount To S&P 500 Which Is Unusual
Hotels Are Trading With A Discount To S&P 500 Which Is Unusual
Hotels Are Trading With A Discount To S&P 500 Which Is Unusual
Chart 15Hotels Are Slightly Oversold
Hotels Are Slightly Oversold
Hotels Are Slightly Oversold
Cruise Lines Cruise Lines were the worst-hit and the slowest to recover among the sub-industries, but they are expected to make a comeback in 2022 with a significant surge in revenue growth. Most of the drivers for these companies are similar to Hotels and Resorts – but recovery is delayed due to restrictions that kept cruise ships anchored much longer than initially expected. Investment Implications We stay with our overweight in Hotels, Resorts, and Cruise Lines. We will summarize the reasons: The Delta variant is cresting. Our base case is that herd immunity is not far off. Of course, the industry is also vulnerable to any new virus scare, and this is a risk that investors need to keep in mind. Rising rates will be a mild tailwind for the industry, as it tends to outperform in that regime. But this is not a key driver of its performance. Consumer confidence and financial wellbeing are at the core of Hotel profitability. So far, Americans still have money to spare and prefer to spend it on services. It is disconcerting that the Consumer Confidence Indicator has turned, but we are not too alarmed just yet: Jobs are still plentiful, and Americans are going back to work. Hotel occupancy has increased, and the amount of money consumers are prepared to spend on hotel stays has surged. Sales are expected to increase by 75%, albeit from lower levels, over the next 12 months. Hotels have also discovered many new sources of revenue. Historical earnings growth is not available as until recently the industry was losing money; however, margins have just turned positive. Companies also have the significant pricing power to pass on expenses to their guests and have the ability to mend their margins, eventually going back to the historical 20%. Lastly, the industry is cheap relative to its own history on a forward PE basis. According to our Technical indicator, it is also oversold. The Hotels, Resorts, and Cruise Lines industry has significant potential to return to its former “glory”, and we believe that it is a sound tactical and cyclical investment. We recommend overweighing this industry. Bottom Line The Hotels, Resorts, and Cruise Lines industry has been severely damaged by the pandemic, and the road to recovery may be long. It is also vulnerable to any new virus scare. However, with Delta cresting, financially healthy US consumers choosing to spend their money on services and experiences, sell-side forecasts pointing to surging sales, and companies possessing substantial pricing power mean that we are bullish on the industry. Irene Tunkel Chief Strategist, US Equity Strategy irene.tunkel@bcaresearch.com Footnotes 1 Restaurants Close Dining Rooms Again as Delta-Driven Infections Spread, WSJ, September 13, 2021. 2 Travel Investors Need More Drive, WSJ, September 12, 2021. 3 Hotel Industry News: Marriott CEO Sees Hotels Bouncing Back Quickly After Delta Variant Slump, Skift, September 9, 2021. 4 IBISWorld, August 23, 2021. 5 Oxford Economics. Recommended Allocation
Highlights Economy – The inflation question is unresolved, and it will remain that way for the rest of the year: August’s CPI report had something for everyone and ensured the debate will continue. Doves could celebrate the month-over-month decline while hawks could argue that upward inflation pressures are no longer a transitory phenomenon. Markets – Elevated valuations make equities vulnerable, but a little turmoil in China is not likely to trigger a de-rating wave: The demise of large Chinese property developer Evergrande may cause some upheaval in China but it is not likely to ruffle the S&P 500, corporate bonds or other US spread product. Strategy – Policymakers continue to hold the key. As long as the Fed is still easing, and households direct some of their excess savings to consumption, risk assets should outperform: We still think Goldilocks is far more likely that a too-cold or a too-hot outcome. Feature We continue to view the prospects for financial markets and the economy through a Goldilocks-and-the-two-tails lens, with the idea that equities and credit will thrive against a backdrop of supercharged growth and ongoing policy support (Figure 1). The Fed’s unusually pro-cyclical stance will prolong the macro sweet spot for risk assets and ensure positive excess returns provided growth doesn’t flop (the too-cold left tail), or the inflation genie doesn’t get out of the bottle (the too-hot right tail). Though both flanks pose a risk to our base-case Goldilocks scenario, we deem overheating to be the bigger concern. Unless a vaccine-resistant variant reestablishes COVID-19 as a mortal threat to the broad population, we think it is unlikely that growth will tumble below trend this year or next. Figure 1Goldilocks And The Two Tails
Watching Both Flanks
Watching Both Flanks
One does not need to be a sworn devotee of rugged individualism to harbor some misgivings about the magnitude and scope of the direct transfers to American households or the broader fiscal effort to combat the economic effects of the pandemic. Egged on by support amounting to 25% of a year’s output, it remains entirely possible that aggregate demand might overwhelm productive capacity. The emergence of rolling bottlenecks in the spaces that were most crimped by COVID has focused attention on the threat of overheating, but the more lasting risk emanates from spaces that cannot be dismissed as unduly influenced by the pandemic. We have been closely monitoring the path of consumer prices and will continue to do so, but the ultimate outcome remains unclear. Though a Goldilocks macro backdrop remains our base-case expectation, it is far from assured. In this week’s report, we consider three potential disruptions: too much inflation, a change in the Fed’s policy course and a credit shock from China. We do not think that any of the potential disruptions is likely to change the picture in a material way and we therefore reiterate our view that investors with a twelve-month timeframe ought to maintain at least an equal weight exposure to equities and credit in a multi-asset portfolio. Fitting The August CPI Tile Into The Inflation Mosaic The pace of consumer price increases cooled in August, according to the headline and core CPIs. Both measures came in below market expectations, and the leading month-over-month series (Chart 1, dashed line) decelerated more than their year-over-year counterparts (Chart 1, solid line). Although the data were encouraging on their face, the ongoing inflation debate is nowhere near resolved. COVID continues to play havoc with the spaces it impacted most heavily, defying simple interpretations of aggregate CPI data. Base effects have warped year-over-year data once the peak pandemic months of last spring and summer entered the equation. As category-by-category analyses of the April CPI release showed, the lion’s share of the aggregate core CPI increase was powered by new and used cars and a handful of badly disrupted services like air travel, car rental, lodging and in-person entertainment. Chart 1Inflation Seems To Have Peaked
Inflation Seems To Have Peaked
Inflation Seems To Have Peaked
Chart 2A Stunning Reversal On Used-Car Lots
A Stunning Reversal On Used-Car Lots
A Stunning Reversal On Used-Car Lots
The semiconductor-driven production squeeze pushed up new car prices and took used car prices along for the ride as consumers turned to them as a ready substitute. Used car prices then rose even more as rental car companies frantically reversed 2020’s culling of their fleets to meet revived 2021 demand (Chart 2). By July, however, several of those categories had come off the boil and began to make more modest contributions to month-over-month core CPI growth. In August, they turned into headwinds, limiting core CPI’s sequential gain to just 0.1%. While the core index grew at its slowest rate since February, the segments that weren’t as heavily affected by the pandemic – the gray portion of the stacked bars in Chart 3 – experienced their largest price increases of the year. Those core categories less sensitive to transitory pandemic factors have eased a bit on a year-over-year basis (Chart 4, bottom panel) but the leading month-on-month measure suggests they will turn higher going forward. Chart 3Passing The Baton
Watching Both Flanks
Watching Both Flanks
Shelter costs account for 41% of the core CPI basket and though spiking hotel rates (Chart 5, second panel) have made an outsized contribution to their bounce off the bottom (Chart 5, top panel), the much weightier owners’ equivalent rent and primary residence cost measures have begun to hook up (Chart 5, third panel). Series that impact the supply and demand balance for residences, like the prime-age employment-to-population ratio (Chart 5, fourth panel) and the National Multifamily Housing Council’s measures of apartment market activity (Chart 5, fifth panel), suggest that the key rent series will continue moving higher. Chart 4Transitory Factors Are Abating ...
Transitory Factors Are Abating ...
Transitory Factors Are Abating ...
Chart 5... But Rents Are Rising
... But Rents Are Rising
... But Rents Are Rising
The bottom line is that the August CPI report, like much of the economic data in this particularly uncertain time, offered evidence to support opposing interpretations. We will simply have to wait and see how the data evolve over the rest of the year to gain a good read on its future trajectory. We expect that inflation will continue to come down from its summer peak while remaining comfortably above the Fed’s effective 2.3-2.5% core CPI target. Such a move will underscore that its inflation criteria have been met and focus investor attention squarely on the labor market’s progress toward regaining full employment. Much Ado About Nothing The bond market has cottoned on to the fact that the labor market, not consumer price inflation, is the swing factor for monetary policy settings, and the 10-year Treasury note has essentially ignored the core CPI breakout (Chart 6). Equities have evinced little concern, reflecting the causal relationship we noted last week. High inflation by itself is not kryptonite for stocks; the restrictive monetary policy measures the Fed eventually imposes in response to high inflation are. Inflation’s market importance thus turns on the tipping point at which it heralds restrictive monetary policy. Chart 6Treasuries Are On Board With The Transitory View
Treasuries Are On Board With The Transitory View
Treasuries Are On Board With The Transitory View
A Fed that believes elevated inflation readings are transitory is a Fed that will wait to restrain the economy to contain them. A Fed that is determined to let the economy run hot so as to nurture broad-based strength in the labor market is a Fed with a less sensitive inflation reaction function than has prevailed since Paul Volcker’s tenure. The same goes for a Fed that has made no secret of its desire to reset inflation expectations higher. Putting it all together, the Fed appears determined to wait until it sees the whites of inflation’s eyes before it takes action that will undermine economic growth. Our view that the Fed’s inflation reaction function has become less sensitive is independent of the identity of the chair. The revised statement on longer-run goals and monetary policy strategy was issued by the entire FOMC, and investors should not be distracted by the quadrennial reappointment parlor game, which has settled on a contest between chair Powell and board member Brainard. Although Brainard has won progressives’ admiration for her advocacy of tighter bank supervision, policy would not be materially different under her stewardship than it would be under Jay Powell’s. Monetary policy will be accommodative for a long time regardless of who is chairing the FOMC on February 1st and the Biden administration’s nomination decision will not have lasting market implications. Could A Messy Evergrande Unwind Trip Up The US Bull? The financial press last week was filled with stories about the dire condition of Evergrande Property Group (Chart 7), one of China’s largest property developers. As noted in several of last week’s reports, Evergrande is the world’s most indebted developer and its leverage burden is not news to dollar bond investors, who have increasingly required outsized yields to lend to the company.1 All three major credit rating agencies have downgraded it to the equivalent of CC, reflecting their view that default is imminent. Though a technical default may be certain, per reports that Evergrande will fail to make scheduled interest and principal payments due this week, the ultimate ripple effects are unknown. As our Emerging Markets Strategy team has noted, a broad range of outcomes are possible. At the most benign end of the continuum, the event could mark a crescendo of concerns that have been weighing on sentiment and activity, and trigger policy stimulus that produces economic and market inflections. At the other end, Evergrande could intensify the existing credit crunch, sparking a wave of self-reinforcing defaults and bankruptcies, culminating in a systemic event on the order of Lehman Brothers’ bankruptcy. Absent government intervention, the defaults will be messy. Most of the company’s assets are in the form of unfinished properties that will require additional capital and know-how before they can be monetized. Even its portfolios of completed properties may not be easy to sell in a residential market that was already slowing (Chart 8). The pall its troubles have cast over the property market will make things worse by prodding other liquidity-constrained developers to slash prices to move their own inventories. Chart 7Boom And Bust
Boom And Bust
Boom And Bust
Chart 8Not Exactly A Seller's Market
Not Exactly A Seller's Market
Not Exactly A Seller's Market
Our China strategists believe that the government wants to make an example out of Evergrande to impose some discipline on investors and developers. Despite repeated warnings, it has remained on the wrong side of the three red lines policy makers recently established to rein in property market excesses. Some onshore investors may be bailed out, but party officials will have no qualms about leaving offshore investors holding the bag. As China goes, so too do small neighboring economies reliant on its appetite for imports. Resource economies like Brazil, Chile and Australia that export iron ore, copper and other base metals to feed the China construction and infrastructure juggernaut could slow. Suppliers of machinery and specialized manufactured components like Japan and Europe could also feel a bit of a chill. While the US is not immune to disruptions in the rest of the world, it is a comparatively closed economy that is generally less susceptible to external troubles and has minimal financial links with the Middle Kingdom. A review of the 2020 10-Ks for the SIFI banks and Goldman Sachs and Morgan Stanley confirmed that the American banking system has minimal direct exposures to China and Hong Kong. Only Citigroup, which operates a meaningful commercial banking franchise in Hong Kong, has direct cross-border exposures that amount to as much as 1% of assets (Table 1). Table 1SIFI Exposures To China And Hong Kong
Watching Both Flanks
Watching Both Flanks
The bottom line is that we do not view Evergrande as China’s Lehman. Policymakers may want to make an example of it but not to the point that they will stand by in the face of a broad contagion. Even if it did produce a credit event that rippled across Asian EM markets and tempered investors’ enthusiasm for risk assets more generally, US markets would benefit in a relative sense befitting the dollar’s status as a defensive currency, Treasuries’ status as the predominant risk-free asset and the S&P 500’s low-beta nature. The fall of an overextended Chinese property developer is unlikely to push the US out of Goldilocks and into too-cold territory. Investment Implications Inflation will trigger a policy change once it stays high enough for long enough to trigger the Fed’s recalibrated reaction function. Markets will sniff out a policy change ahead of time and could even catalyze a policy change if the bond vigilantes awaken from their long hibernation. When we reiterate our constructive view on markets and the economy over a three-to-twelve-month timeframe, we are reiterating our assessment that markets will not begin to prepare for the policy change within the next twelve months and that growth will appear as if it will remain on an above-trend trajectory for some time beyond. We are confident that the next twelve months will remain “safe” from a policy and a growth perspective. We have much less conviction about the next six to twelve months following next September and are acutely aware that the outlook for the second half of 2022 and the first half of 2023 will exert a meaningful influence next summer. We will adjust our views based on the incoming data, but we do think the first three to six months of our cyclical timeframe will be conducive to risk asset outperformance and therefore reiterate our recommendation to overweight equities and credit while sharply underweighting Treasuries. Doug Peta, CFA Chief US Investment Strategist dougp@bcaresearch.com Footnotes 1 Per Evergrande’s annual reports, its average annual interest rate on outstanding debt on 12/31/20 was 9.49%, up from 8.99% on 12/31/19, 8.13% on 12/31/18 and 8.09% on 12/31/17.
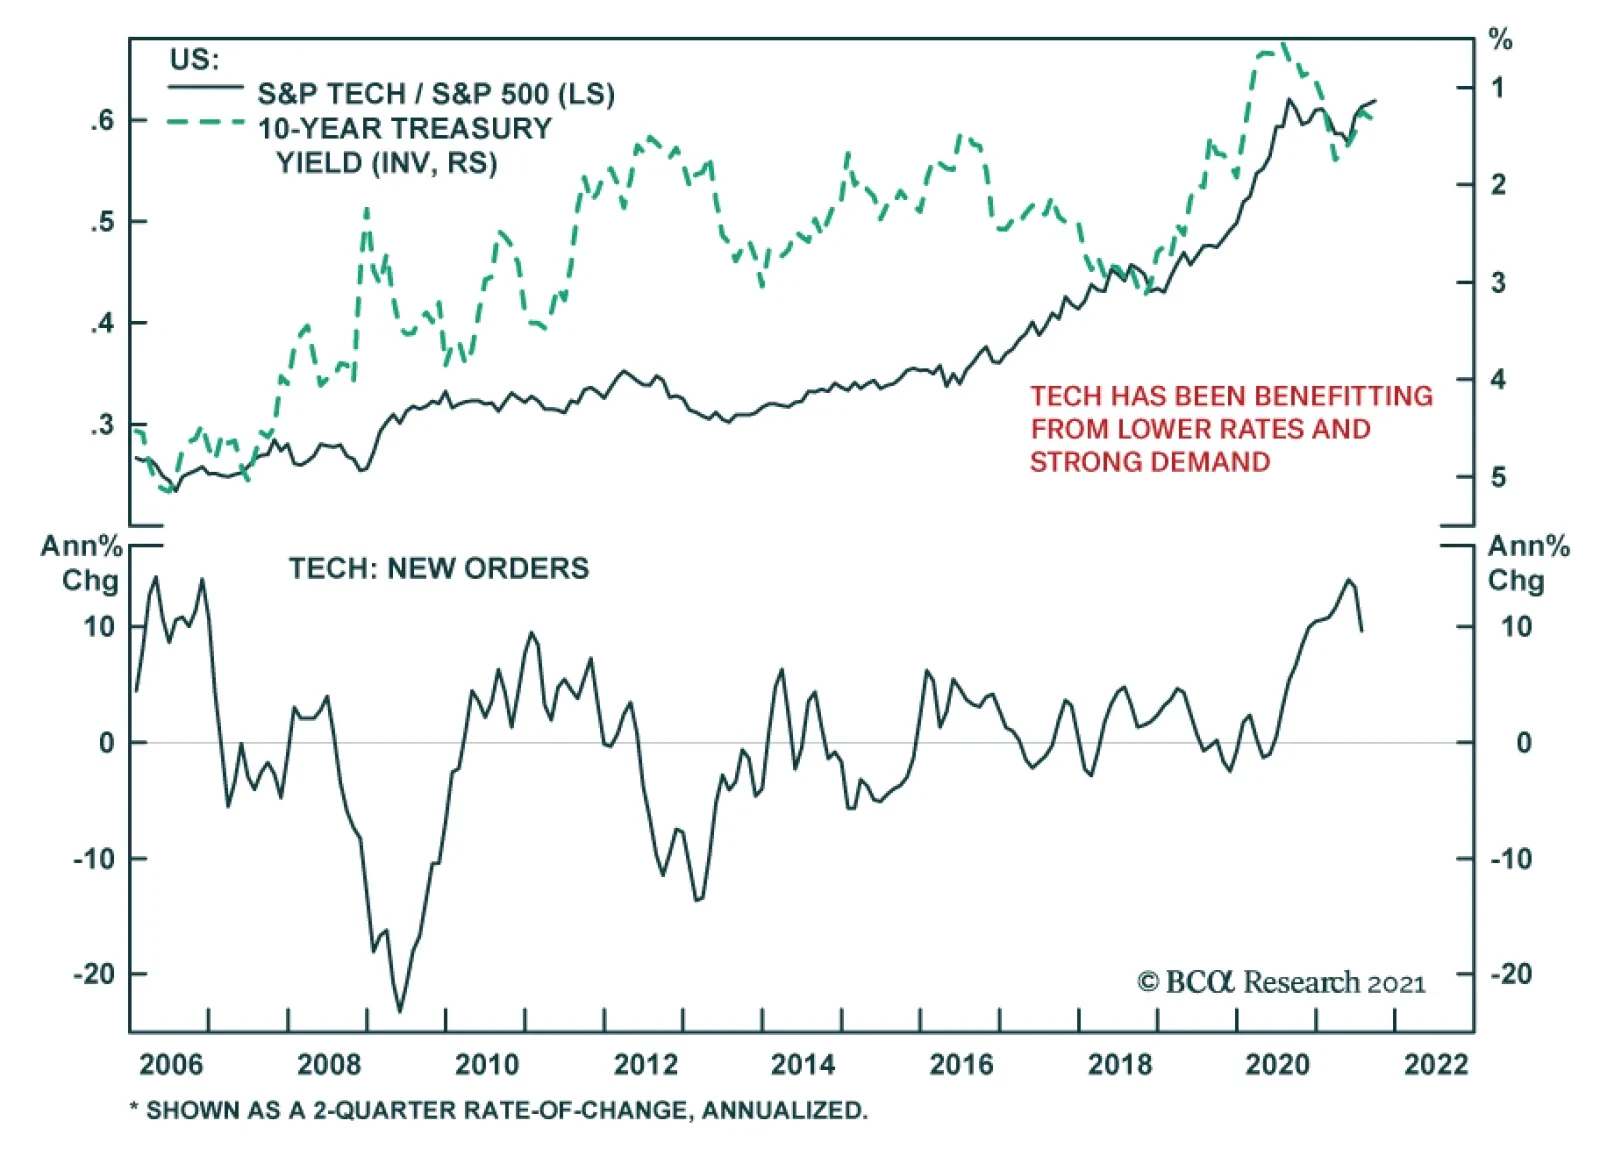
The rally in US Treasurys since March has been positive for tech stocks. The S&P 500 tech sector outperformed the benchmark by 6.58% since then. This strong performance has occurred despite elevated inflation prints and the Fed’s plan to begin normalizing…
BCA Research’s Global Investment Strategy service upgraded its rating on EM equities and currencies to strong overweight After lagging the global indices, EM stocks are set to outperform during the remainder of this year and into 2022. Five factors will…
Dear Client, I will be holding a webcast next Friday, September 24th at 10:00 AM EDT (3:00 PM BST, 4:00 PM CEST, 11:00 PM HKT) with BCA Research’s Chief Emerging Markets Strategist Arthur Budaghyan where we will debate the outlook for EM stocks. As this week’s report conveys, I am bullish, while Arthur is in the bearish camp. Please join us for what is sure to be a fiery debate. Also, instead of our regular report next week, we will be sending you a Special Report written by Matt Gertken, BCA Research’s Chief Geopolitical Strategist, discussing the stability of the American political system. I hope you will find it insightful. We will be back the following week with the GIS Quarterly Strategy Outlook, where we will explore the major trends that are set to drive financial markets in the rest of 2021 and beyond. As always, I will hold a webcast discussing the outlook the week after, on Thursday, October 7th. Best regards, Peter Berezin Chief Global Strategist Highlights After lagging the global indices, EM stocks are set to outperform during the remainder of this year and into 2022. Go long the EM FTSE index versus the global benchmark (ETF proxy: VWO versus VT). Five factors will support EM assets over the coming months: 1) The vaccination campaign in emerging markets is in full swing; 2) Domestic EM inflation will crest; 3) China will stimulate its economy; 4) The US dollar will weaken; and 5) EM valuations have discounted a lot of bad news. Contrary to popular perception, the Chinese government has not launched an indiscriminate attack on tech companies. If anything, heightened geopolitical tensions have made it more important than ever for China to buttress its tech sector. Investors wanting to gain exposure to Chinese tech while still limiting risk should consider writing cash-covered puts. For example, a strategy of selling puts on Alibaba could generate a 9% annualized yield while giving investors access to the stock at a forward PE ratio of only 12.5. Go long an equally-weighted basket consisting of the Russian ruble and Brazilian real against the US dollar. Both currencies enjoy favorable interest rate differentials and will benefit from continued strength in commodity markets. Debating The EM Outlook BCA Research has some of the brightest, most creative strategists in the world. While we often agree on many issues, we sometimes disagree. The near-term outlook for emerging markets is a case in point. My colleague, Chief EM Strategist Arthur Budaghyan, is bearish on emerging markets over a 3-to-6 month horizon. In contrast, I am bullish. In this note, I explain why. I see five reasons why EM assets will do very well during the remainder of the year and into 2022: 1) The vaccination campaign in emerging markets is in full swing; 2) Domestic EM inflation will crest; 3) China will stimulate its economy; 4) The US dollar will weaken; and 5) EM valuations have discounted a lot of bad news. Let’s examine all five reasons in turn. Vaccine Access In Emerging Markets Is Improving The proportion of EM populations which have been vaccinated is rising rapidly (Chart 1). India is now vaccinating 10 million people per day, a number that would have seemed unimaginable just a few months ago. Chart 1EM Vaccination Rates Have Been Ramping Up Rapidly
The Best Trade For The Rest Of 2021: Long EM Equities And Currencies
The Best Trade For The Rest Of 2021: Long EM Equities And Currencies
Globally, about 10 billion doses of vaccine will be produced this year (Chart 2). This does not include potential new mRNA vaccines that China is developing. China-based Walvax Biotechnology is conducting late-stage trials in Nepal, with mass production of the vaccine expected to start in October. Sinopharm is also working on its own mRNA vaccine. Meanwhile, the number of new Covid cases in most EM economies has peaked, permitting a relaxation of lockdown measures (Chart 3). Goldman’s Effective Lockdown Index for China has eased significantly since mid-August, although this week’s outbreak in Fujian province could partially reverse that trend. Chart 2At Least 10 Billion Doses Of Vaccine Will Be Produced This Year
The Best Trade For The Rest Of 2021: Long EM Equities And Currencies
The Best Trade For The Rest Of 2021: Long EM Equities And Currencies
Chart 3EM Lockdown Measures Have Eased As The Number Of New Cases Has Peaked
The Best Trade For The Rest Of 2021: Long EM Equities And Currencies
The Best Trade For The Rest Of 2021: Long EM Equities And Currencies
It is true, as Arthur has pointed out, that vaccine hesitancy is a problem in some emerging markets. However, this may not be as significant an issue as previously believed. The huge spike in cases in highly vaccinated countries such as Israel and the UK shows that herd immunity is a pipe dream. Given this reality, as long as everyone who wants a vaccine is able to receive it, the political pressure to maintain lockdowns will dissipate. Pandemic-Induced Spike In Inflation Is Fading As in most developed economies, many emerging markets have experienced a post-pandemic rise in inflation (Chart 4). Whereas DM central banks generally looked through the inflation spike, many EMs did not have that luxury. Chart 4Inflation Across The EM Universe
The Best Trade For The Rest Of 2021: Long EM Equities And Currencies
The Best Trade For The Rest Of 2021: Long EM Equities And Currencies
Worried about an unmooring of inflation expectations and currency depreciation, central banks in such countries as Brazil, Mexico, Chile, Colombia, Peru, Russia, and Turkey have all raised rates this year. Higher rates have weighed on EM growth and financial markets. The good news is that inflationary pressures are starting to abate. This week’s US CPI report for August showed an absolute decline in prices in pandemic-related categories such as airfares, hotels, admissions, and vehicles (Chart 5). Things are even improving on the semiconductor front. Chart 6 shows that memory chip prices are in a clear downtrend. Chart 5Pandemic-Driven Inflation Is Cresting
The Best Trade For The Rest Of 2021: Long EM Equities And Currencies
The Best Trade For The Rest Of 2021: Long EM Equities And Currencies
Chart 6Chip Prices Are Off Their Highs
Chip Prices Are Off Their Highs
Chip Prices Are Off Their Highs
Chart 7Agricultural Prices Have Stabilized, Which Will Help Cool EM Inflation
Agricultural Prices Have Stabilized, Which Will Help Cool EM Inflation
Agricultural Prices Have Stabilized, Which Will Help Cool EM Inflation
Critically for emerging markets, agricultural prices have stabilized (Chart 7). Historically, food inflation has been a major driver of EM inflation. Chinese Stimulus On The Way Growth in China was quite weak in the first half of the year, averaging only 3.5% on a sequential annualized basis (Chart 8). The Bloomberg consensus estimate is for Q3 growth to hit 4.3%, reflecting the negative impact of lockdown measures and the lagged effect from policy tightening. Growth in the fourth quarter is expected to rebound to only 5.7%. This seems too low to us. Barring a major spike in Covid cases, Chinese industry will be saddled with fewer social distancing restrictions in the fourth quarter. Policy is also turning more stimulative. The PBOC cut bank reserve requirements in July. In the past, cuts in reserve requirements have been a reliable predictor of faster credit growth (Chart 9). Chart 8Chinese Growth Should Accelerate After A Disappointing First Half Of 2021
Chinese Growth Should Accelerate After A Disappointing First Half Of 2021
Chinese Growth Should Accelerate After A Disappointing First Half Of 2021
Chart 9Chinese Stimulus Is On The Way
Chinese Stimulus Is On The Way
Chinese Stimulus Is On The Way
With credit growth back to its 2018 lows, there is little need for further actions to reduce lending. On the contrary, the PBOC’s meeting with financial institutions on August 23rd revealed a desire to increase credit availability. Partly reflecting this development, new bank loans rose to RMB 1.22 trillion in August, up from RMB 1.08 trillion in the prior month. Chart 10EM Stocks Have Done Well When Global Industrial Stocks Have Outperformed
EM Stocks Have Done Well When Global Industrial Stocks Have Outperformed
EM Stocks Have Done Well When Global Industrial Stocks Have Outperformed
On the fiscal side, the Ministry of Finance stated on August 27th its intention to ramp up fiscal spending by increasing local government bond issuance. As of the end of August, local governments had used up only 50% of their annual debt issuance quota, compared to 77% at the same time last year and 93% in 2019. To reinforce the need for more stimulus, the authorities announced an additional RMB 300 billion in credit support for SMEs during the latest State Council meeting held on September 1st. Local Chinese government spending has typically flowed into infrastructure. Increased infrastructure spending should buttress metals prices while providing a tailwind for global industrial stocks. I agree with Arthur’s assessment that industrials will be a winning equity sector over the coming years. EM stocks have usually beaten the global benchmark during periods when global industrial stocks were outperforming (Chart 10). A Weaker US Dollar Will Benefit Emerging Markets EM stocks tend to perform best when the US dollar is on the back foot (Chart 11). We expect the greenback to weaken over the next 12 months. As a countercyclical currency, the dollar is likely to struggle in an environment of above-trend global growth (Chart 12). Chart 11EM Stocks Tend To Outperform The Global Benchmark When The Dollar Is Weakening
EM Stocks Tend To Outperform The Global Benchmark When The Dollar Is Weakening
EM Stocks Tend To Outperform The Global Benchmark When The Dollar Is Weakening
Chart 12The Dollar Is A Countercyclical Currency
The Dollar Is A Countercyclical Currency
The Dollar Is A Countercyclical Currency
Interest rate differentials have moved sharply against the dollar (Chart 13). The US trade deficit has surged over the past 16 months. The way the US has been financing its trade deficit – relying heavily on fickle equity inflows – also leaves the dollar in a vulnerable position (Chart 14). Chart 13Interest Rate Differentials Have Moved Against The Dollar
Interest Rate Differentials Have Moved Against The Dollar
Interest Rate Differentials Have Moved Against The Dollar
Chart 14Volatile Equity Inflows Have Been Financing The US Trade Deficit, Putting The Dollar In A Vulnerable Position
Volatile Equity Inflows Have Been Financing The US Trade Deficit, Putting The Dollar In A Vulnerable Position
Volatile Equity Inflows Have Been Financing The US Trade Deficit, Putting The Dollar In A Vulnerable Position
Go Long BRL And RUB Against a backdrop of broad-based dollar weakness, EM currencies will strengthen. Currently, the 12-month interest rate differential between Brazil and the US stands at 8.7%, up from a low of 2.1% last year. Russian rates have also risen rapidly relative to US rates (Chart 15). The Russian ruble will benefit from the cyclical recovery in oil prices. Bob Ryan and BCA’s commodity team project that the price of Brent will rise 5% to $80/bbl in 2023, whereas market expectations are for a 12% decline (Chart 16). Likewise, Brazil will gain from both higher oil prices and rising Chinese demand for metals. Chart 15Interest Rate Differentials Favor The RUB And BRL Versus The USD
Interest Rate Differentials Favor The RUB And BRL Versus The USD
Interest Rate Differentials Favor The RUB And BRL Versus The USD
Chart 16Oil Prices Have More Upside
Oil Prices Have More Upside
Oil Prices Have More Upside
Accordingly, we are initiating a new trade going long an equally-weighted basket consisting of BRL/USD and RUB/USD. Are EMs A Value Trap? Emerging market stocks currently trade at a Shiller PE ratio of 14.7, compared to 36.8 for the US, 22.2 for Europe, and 24.1 for Japan. The EM discount to the global index is as large now as it was during the late 1990s. Other valuation measures tell a similar story (Chart 17). Chart 17AEM Equities Are Trading At A Large Discount (I)
The Best Trade For The Rest Of 2021: Long EM Equities And Currencies
The Best Trade For The Rest Of 2021: Long EM Equities And Currencies
Chart 17BEM Equities Are Trading At A Large Discount (II)
The Best Trade For The Rest Of 2021: Long EM Equities And Currencies
The Best Trade For The Rest Of 2021: Long EM Equities And Currencies
A low PE ratio for EM stocks could be justified based on weak expected earnings growth. However, it is far from clear that such an expectation is warranted. While EM earnings growth has lagged the US since 2011, this follows a decade when EM earnings grew much faster than in the US (Chart 18). Chart 18AEM Earnings Have Moved Sideways Since 2011 After Blazing Higher Over The Preceding Decade (I)
EM Earnings Have Moved Sideways Since 2011 After Blazing Higher Over The Preceding Decade (I)
EM Earnings Have Moved Sideways Since 2011 After Blazing Higher Over The Preceding Decade (I)
Chart 18BEM Earnings Have Moved Sideways Since 2011 After Blazing Higher Over The Preceding Decade (II)
EM Earnings Have Moved Sideways Since 2011 After Blazing Higher Over The Preceding Decade (II)
EM Earnings Have Moved Sideways Since 2011 After Blazing Higher Over The Preceding Decade (II)
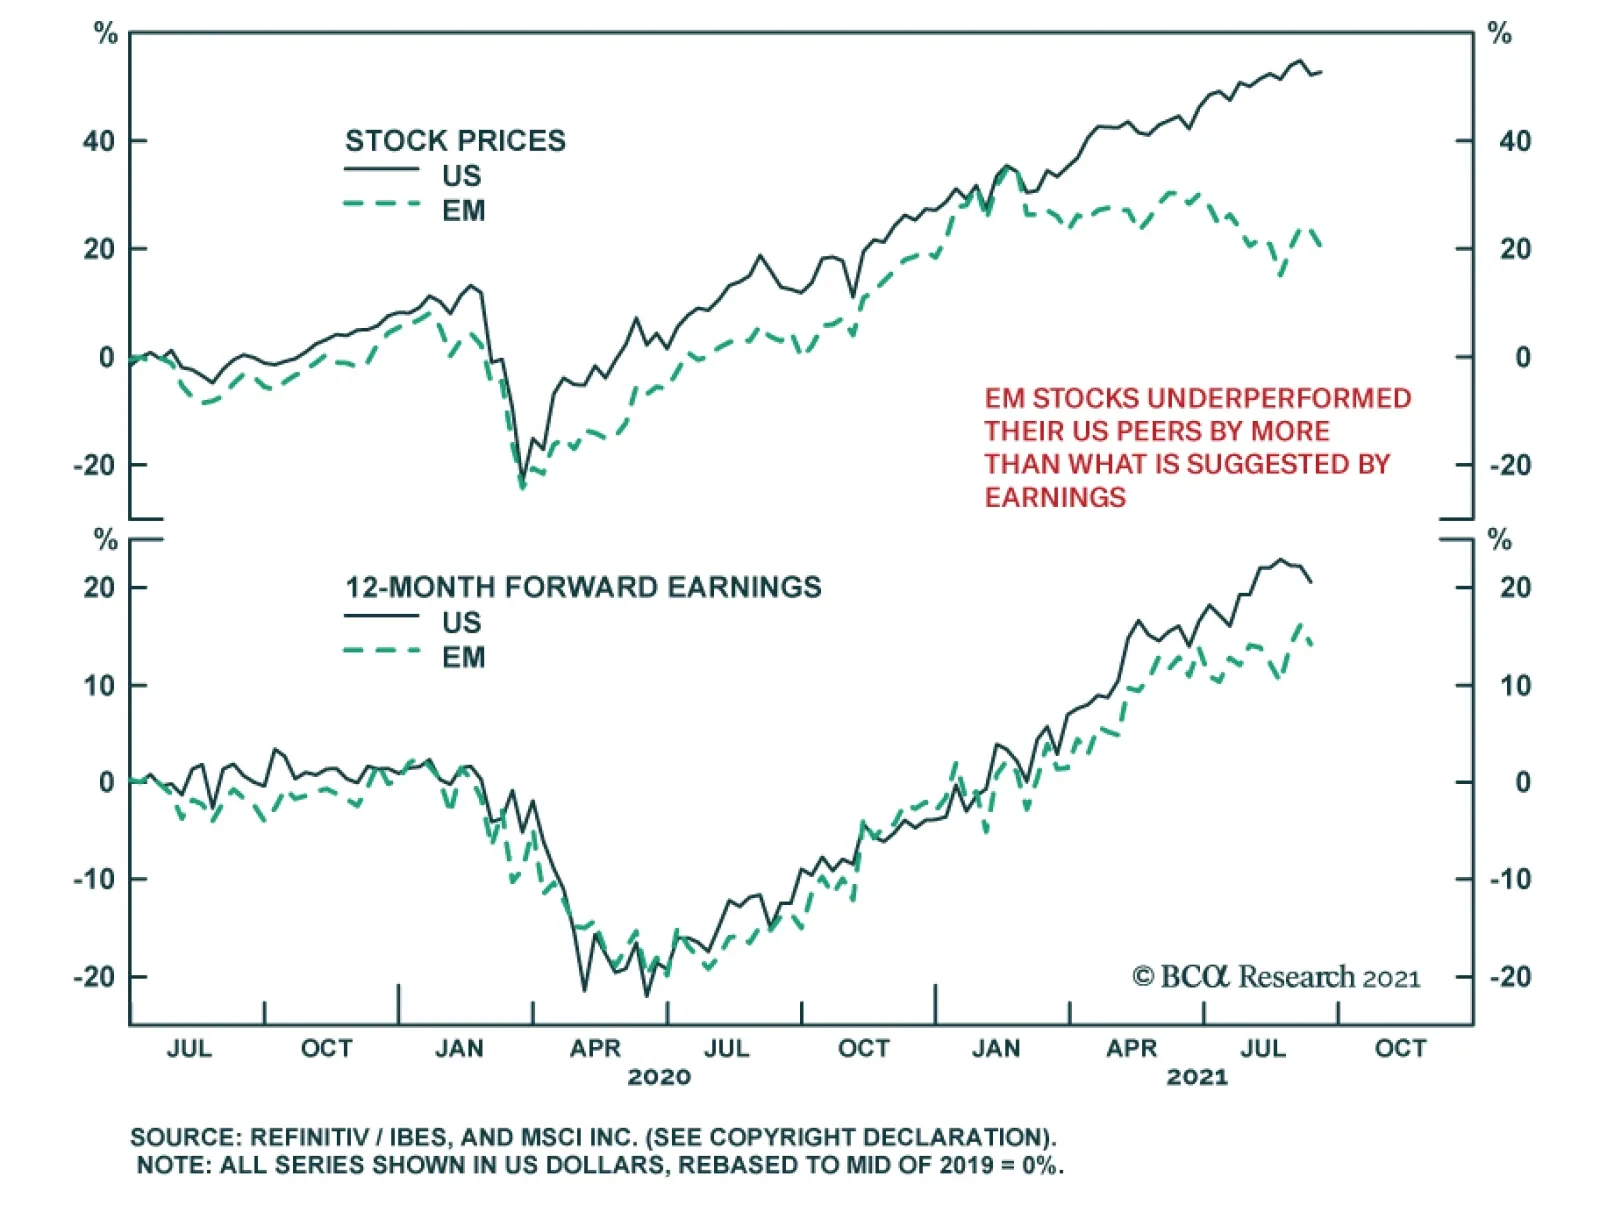
Chart 19EM Stocks Underperformed Their US Peers By More Than What Is Suggested By Earnings
EM Stocks Underperformed Their US Peers By More Than What Is Suggested By Earnings
EM Stocks Underperformed Their US Peers By More Than What Is Suggested By Earnings
On that note, it is worth mentioning that US earnings have risen by only 6 percentage points more than EM earnings since mid 2019 (20% versus 14%), even as EM stocks have underperformed their US peers by 29% over this period (52% versus 23%) (Chart 19). China’s Regulatory Crackdown The regulatory crackdown on Chinese tech companies has weighed on the sector. Chinese tech stocks have underperformed their global tech peers by 48% since February (Chart 20). Chart 20Chinese Tech Stocks Have Been Underperforming Their Global Tech Peers
Chinese Tech Stocks Have Been Underperforming Their Global Tech Peers
Chinese Tech Stocks Have Been Underperforming Their Global Tech Peers
Chinese tech is 44% of the China investable index and 15% of the MSCI EM index. Thus, the outlook for Chinese stocks is relevant not just for China-focused investors, but for EM investors more broadly (especially those who invest in index products). The current crackdown bears some resemblance to the one in 2018, which saw Tencent lose $20 billion in market capitalization in a single day. Like other Chinese tech names, Tencent shares quickly recovered from that incident. Contrary to popular perception, the Chinese government has not launched an indiscriminate attack on tech companies. If anything, heightened geopolitical tensions have made it more important than ever for China to buttress its tech sector. Rather, what the government has done is restrain companies that it either perceives as working against the national interest (i.e., addictive video game makers and expensive after-school tutoring companies) or that have too much sway over the public. Private tech companies in sectors such as semiconductors or clean energy continue to receive government support. A plausible outcome is that China’s leading consumer-oriented internet companies will go out of their way to pledge allegiance to the Communist Party just as US companies have pledged allegiance to woke ideology. If that were to happen, the Chinese government may allow them to operate normally, cognizant of the fact that it is easier to monitor a few large internet companies than many small ones. While such an outcome is far from assured, current valuations offer enough cushion to prospective investors. As we go to press, Alibaba is trading at 16.4-times earnings, Baidu is trading at 17.9-times earnings, and Tencent is trading at 26.7-times current year earnings. In comparison, the NASDAQ 100 trades at nearly 30-times earnings. Investment Conclusions Sentiment towards EM stocks is very bearish (Chart 21). Investor angst towards China is especially elevated, with the media replete with stories about the tech crackdown and problems at Evergrande, the country’s largest property developer. Chart 21Sentiment Towards EM Stocks Is Highly Bearish
Sentiment Towards EM Stocks Is Highly Bearish
Sentiment Towards EM Stocks Is Highly Bearish
All these downside risks to EM assets are well known. What are less well known are the upside risks stemming from higher vaccination rates, an easing of domestic inflationary pressures, Chinese stimulus, a weaker US dollar, and favorable valuations. With that in mind, we are upgrading our rating on EM equities and currencies to strong overweight in the view matrix at the back of this report. We are also reinstating a long EM/Global equity trade (ETF proxy: VWO versus VT). The risk-reward of buying Chinese internet stocks is reasonably appealing. Investors who want to mitigate risk should consider writing cash-covered puts. For example, a BABA put with a strike price of $130 expiring on December 16th 2022 trades for about $16. If the price of BABA does not fall below $130, you will pocket the premium, realizing an annualized yield of 9%. If the price does fall to $130, you get the stock at an attractive PE ratio of 12.5 based on current forward earnings estimates. Peter Berezin Chief Global Strategist pberezin@bcaresearch.com Global Investment Strategy View Matrix
The Best Trade For The Rest Of 2021: Long EM Equities And Currencies
The Best Trade For The Rest Of 2021: Long EM Equities And Currencies
Special Trade Recommendations
The Best Trade For The Rest Of 2021: Long EM Equities And Currencies
The Best Trade For The Rest Of 2021: Long EM Equities And Currencies
Current MacroQuant Model Scores
The Best Trade For The Rest Of 2021: Long EM Equities And Currencies
The Best Trade For The Rest Of 2021: Long EM Equities And Currencies