Equities

Weekly Performance Update For the week ending Thu Sep 16, 2021 The Market Monitor displays the trailing 1-quarter performance of strategies based around the BCA Score. For each region, we construct an equal-weighted, monthly rebalanced portfolio consisting of the top 3 stocks per sector and compare it with the regional benchmark. For each portfolio, we show the weekly performance of individual holdings in the Top Contributors/Detractors table. In addition, the Top Prospects table shows the holdings that currently have the highest BCA Score within the portfolio. For more details, click the region headers below to be redirected to the full historical backtest for the strategy. BCA US Portfolio
Market Monitor (Sep 16, 2021)
Market Monitor (Sep 16, 2021)
Total Weekly Return BCA US Portfolio S&P500 TRI -0.24% -0.40% Top Contributors AN:US EOG:US GOLF:US KOF:US SAFM:US Weekly Return 34 bps 30 bps 8 bps 5 bps 2 bps Top Detractors CQP:US MRNA:US UGI:US PFE:US DUK:US Weekly Return -14 bps -11 bps -11 bps -10 bps -9 bps Top Prospects BRK.A:US SC:US MPLX:US ESGR:US PFE:US BCA Score 96.34% 95.76% 95.14% 94.82% 94.64% BCA Canada Portfolio
Market Monitor (Sep 16, 2021)
Market Monitor (Sep 16, 2021)
Total Weekly Return BCA Canada Portfolio S&P/TSX TRI 0.02% -0.43% Top Contributors TOU:CA PXT:CA AND:CA ECN:CA IMO:CA Weekly Return 45 bps 21 bps 20 bps 15 bps 13 bps Top Detractors CFP:CA CRON:CA LNR:CA TOY:CA L:CA Weekly Return -24 bps -13 bps -12 bps -12 bps -12 bps Top Prospects LNF:CA ELF:CA WIR.UN:CA CFP:CA RUS:CA BCA Score 97.84% 96.35% 96.27% 95.53% 94.44% BCA UK Portfolio
Market Monitor (Sep 16, 2021)
Market Monitor (Sep 16, 2021)
Total Weekly Return BCA UK Portfolio FTSE 100 TRI -1.75% 0.05% Top Contributors ROSN:GB EMIS:GB IMB:GB SVT:GB KLR:GB Weekly Return 18 bps 15 bps 5 bps 4 bps 4 bps Top Detractors MXCT:GB FXPO:GB CNE:GB TRMR:GB AAL:GB Weekly Return -48 bps -37 bps -27 bps -22 bps -21 bps Top Prospects SVST:GB GLTR:GB BPCR:GB FDM:GB VVO:GB BCA Score 99.58% 98.43% 98.11% 97.85% 97.70% BCA Eurozone Portfolio
Market Monitor (Sep 16, 2021)
Market Monitor (Sep 16, 2021)
Total Weekly Return BCA EMU Portfolio MSCI EMU TRI -0.84% -0.39% Top Contributors HLAG:DE OMV:AT RDSA:NL MELE:BE IRE:IT Weekly Return 32 bps 18 bps 11 bps 10 bps 2 bps Top Detractors TTALO:FI BSL:DE CDI:FR TL5:ES FSKRS:FI Weekly Return -33 bps -20 bps -18 bps -13 bps -13 bps Top Prospects FSKRS:FI STR:AT LOG:ES BFF:IT EDNR:IT BCA Score 99.53% 99.47% 98.58% 96.15% 96.08% BCA Japan Portfolio
Market Monitor (Sep 16, 2021)
Market Monitor (Sep 16, 2021)
Total Weekly Return BCA Japan Portfolio TOPIX TRI 0.33% 1.23% Top Contributors 5021:JP 4966:JP 5020:JP 8334:JP 3132:JP Weekly Return 16 bps 15 bps 11 bps 11 bps 11 bps Top Detractors 7244:JP 3290:JP 4326:JP 8117:JP 9543:JP Weekly Return -26 bps -13 bps -11 bps -9 bps -8 bps Top Prospects 6960:JP 9882:JP 9436:JP 4544:JP 2208:JP BCA Score 99.93% 99.33% 99.11% 98.49% 98.22% BCA Hong Kong Portfolio
Image
Total Weekly Return BCA Hong Kong Portfolio Hang Seng TRI -3.36% -4.01% Top Contributors 857:HK 1735:HK 2686:HK 6118:HK 506:HK Weekly Return 42 bps 21 bps 14 bps 8 bps 5 bps Top Detractors 710:HK 836:HK 991:HK 1277:HK 323:HK Weekly Return -80 bps -37 bps -34 bps -32 bps -23 bps Top Prospects 1277:HK 98:HK 316:HK 6868:HK 323:HK BCA Score 100.00% 99.50% 98.59% 98.35% 98.31% BCA Australia Portfolio
Market Monitor (Sep 16, 2021)
Market Monitor (Sep 16, 2021)
Total Weekly Return BCA Australia Portfolio S&P/ASX All Ord. TRI 1.24% 1.36% Top Contributors YAL:AU BFG:AU MMS:AU SXY:AU SGF:AU Weekly Return 32 bps 27 bps 25 bps 16 bps 15 bps Top Detractors BXB:AU SDG:AU AGL:AU SGLLV:AU CDA:AU Weekly Return -27 bps -17 bps -11 bps -10 bps -7 bps Top Prospects SDG:AU GRR:AU PIC:AU PL8:AU RIC:AU BCA Score 99.91% 99.55% 99.38% 98.89% 98.59%
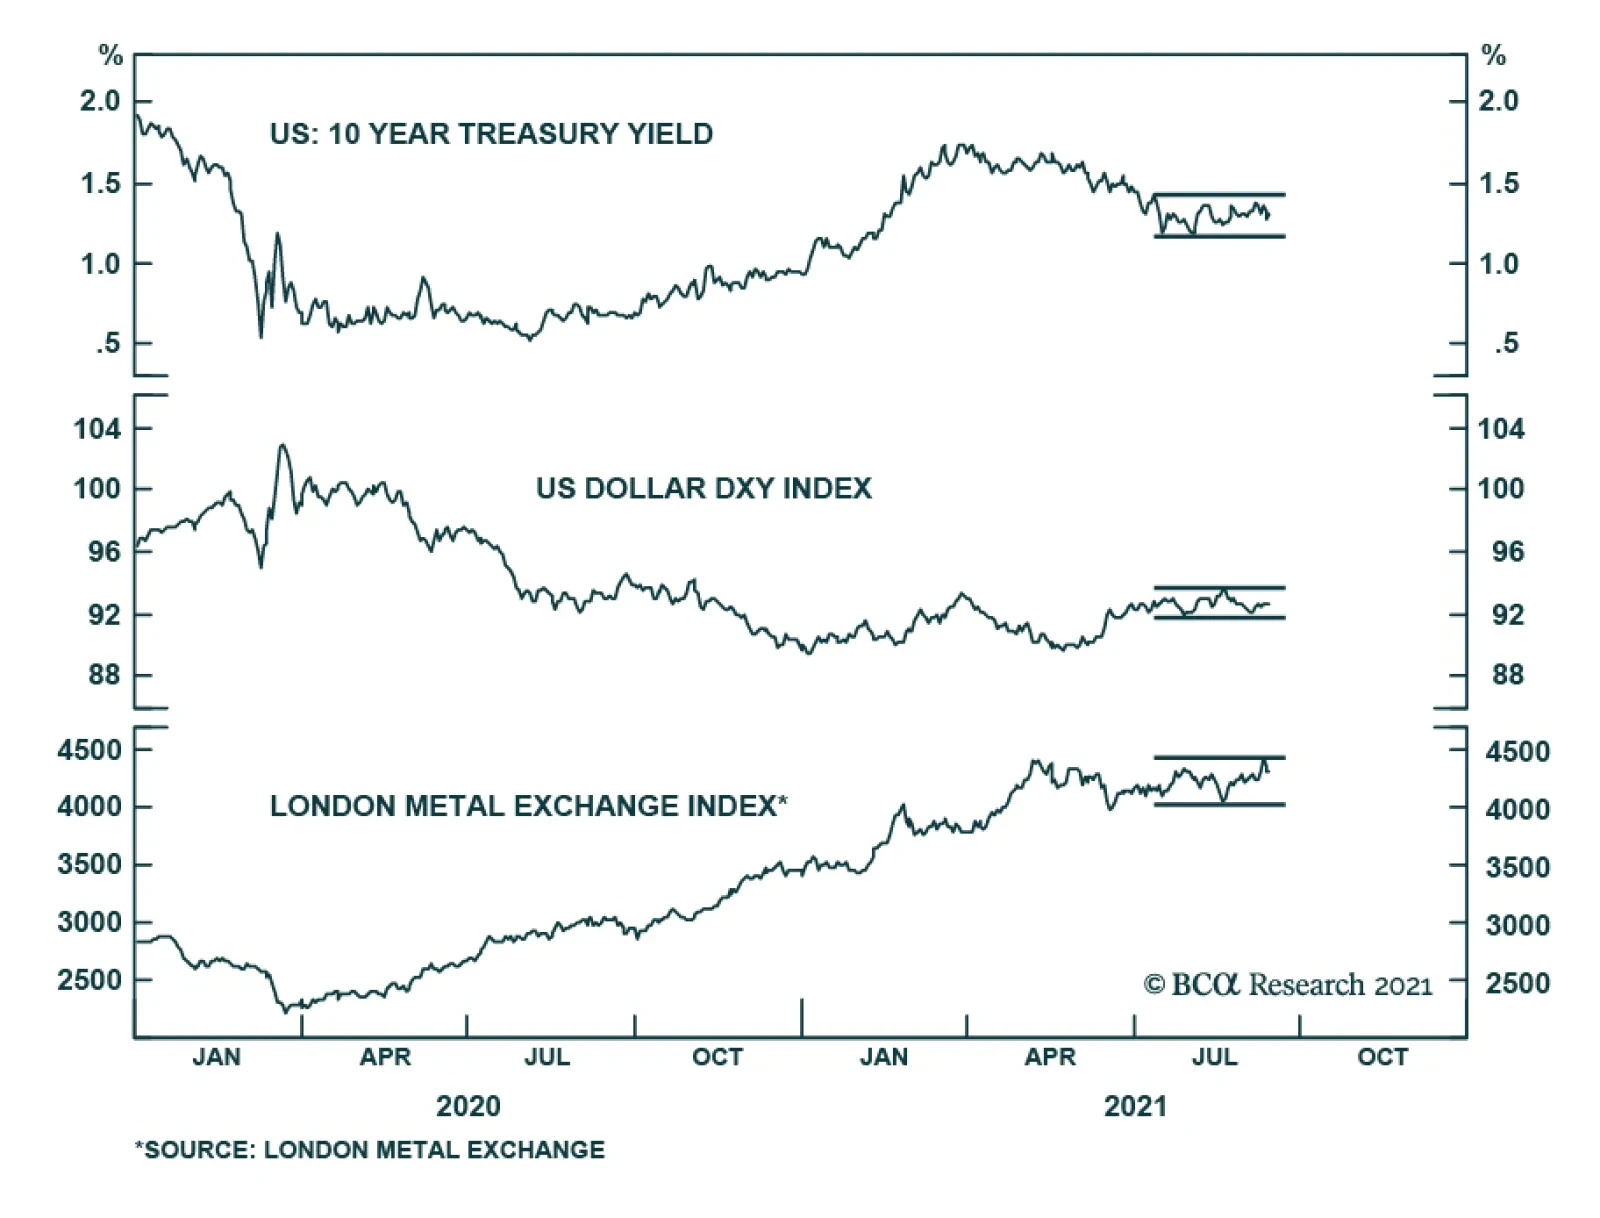
Several key financial assets are failing to send a strong signal and instead have been in a state of stasis. Abstracting from day-to-day moves, Treasury yields, the LMEX, and EUR/USD have not been on a clear trajectory since the beginning of July. Similarly,…
BCA Research's Emerging Markets Strategy service expects Evergrande’s partial default to reinforce credit tightening in China. Evergrande will likely default on some of its liabilities but there will be a bailout or roll-over of its other debt. This raises…

Please note that next Friday September 24 at 10am EDT, we will host a webcast featuring a debate between my colleague Peter Berezin and me. The topic of debate is whether investors should overweight EM in a global portfolio. Please join us by registering via this link. Highlights Chinese internet companies’ ROE will drop, warranting lower equity valuations. However, their ROE and equity multiples will not fall to the levels of listed state-owned enterprises (SOEs). Evergrande’s partial default on its liabilities will likely reinforce credit tightening that has been underway in China over the past 12 months. EM ex-TMT stocks also remain vulnerable. Continue underweighting EM in global equity and credit portfolios. Feature This is the September issue of Charts That Matter. We begin by addressing the issues concerning Chinese internet companies that have been subject to intense debate among investors. We then present key charts on overall EM and various asset classes along with brief commentary. Are Chinese Internet Stocks Investable? There is an ongoing debate in the investment community as to whether Chinese equities in general and Chinese TMT stocks in particular will remain investable. Our short answer is: they will remain investable but mind their valuations. In our opinion, “investable” means that they will from time to time offer medium- and long-term investment opportunities. Our hunch is that they may do so in the future. Nevertheless, we do not think that Chinese TMT stocks presently offer a good buying opportunity. In fact, their share prices have material downside from current levels. In our recent report and webcast, we identified the primary risks to Chinese platform companies: Higher uncertainty about their business model = a higher equity risk premium. Government regulating their profitability like those of mono- and oligopolies = low multiples. These companies performing their social duties in the form of redistributing profits from shareholders to Chinese peoples. Beijing’s involvement in their management and in the prioritization of national and geopolitical objectives over shareholder interests. Risks of delisting from US stock exchanges. Although these companies will remain investable, investors should bear these risks in mind and give careful consideration to what multiples they pay for such stocks. Going forward, Chinese platform companies’ return on equity will be considerably lower than they have been or what their current multiplies imply. A lower return on equity warrants a lower equity multiple. Chart 1Chinese Growth Stocks Are Not Cheap
Chinese Growth Stocks Are Not Cheap
Chinese Growth Stocks Are Not Cheap
On the whole, the current valuations of Chinese internet stocks are still high. Chart 1 shows trailing and 12-month forward P/E ratios for Chinese MSCI Growth Investable Index at 34 and 31, respectively. A downshifting return on equity and high uncertainty around these businesses herald lower equity valuations to come. Besides, in the case of several companies, there are also political underpinnings of this regulatory crackdown. In the case of Alibaba, a mainland government official has recently noted that Alibaba’s chairman, Jack Ma, has been acquiring media companies across the country, and now owns nearly 30 provincial-level media companies, as well as the South China Morning Post in Hong Kong. Beijing will not tolerate the control of or influence over domestic media from anyone outside the inner leadership circle. In this context, it is probable that Alibaba’s businesses will remain subject to severe regulatory pressures. How much lower should these companies’ multiples drop to become attractive? Meaningfully lower, but not to the level of multiples of listed state-owned enterprises (SOEs). Here are two reasons why these platform companies will not trade at multiples of SOEs in China: First, many existing SOEs operate in cyclical industries – commodities, industrials, autos, and banks – that structurally have low equity multiples. By contrast, platform companies operate in non-cyclical sectors that structurally have lower business cycle volatility and, therefore, should trade at higher equity multiples than cyclical industries. Second, many SOEs often had losses because they operated in non-oligopolistic industries. Faced with intense competition they had to cut prices to support volumes and employment. By contrast, platform companies’ profitability will be suppressed and capped by new government policies, but they will remain profitable because they operate in oligopolistic industries. In short, platform companies’ ROEs will be higher than those of traditional/”old-economy” SOEs. All in all, our bias is that platform companies’ valuation multiples will contract further but will not be as low as Chinese, Russian, or Brazilian SOEs have been. Bottom Line: Investors should be mindful of further de-rating in Chinese TMT/platform company stocks. These stocks are not yet out of woods. On Property Market Clampdown And Evergrande's Default Evergrande will likely default on some of its liabilities but there will be a bailout or roll-over of its other debt. Is the partial default by Evergrande, a very large Chinese property developer, a sign of a bottom in Chinese offshore equity and bond markets or will it produce a full-blown credit crisis in China? This is a valid question because both outcomes are possible: a partial bankruptcy can be a culmination of all existing negatives and can trigger policy stimulus that will produce an economic recovery and a major rally (an example of this is the LTCM crisis in the US in 1998); or a partial bankruptcy can lead to a credit crunch escalation becoming a systemic event. An example of this is Lehman Brothers’ bankruptcy in 2008. We will assign the highest probability to a third scenario: the well-telegraphed Evergrande default might not create a systemic crisis or crash. However, it will likely reinforce chronic credit tightening that has been underway in China over the past 12 months. This is negative for China and EM risk assets. Predicting the trajectory and speed of market adjustments – a crisis (wholesale selloff) versus a regular bear market interrupted by short-term rebounds – is impossible. That said, investors should stay put for now. On another note, during our webcast last week, a client asked whether restrictions on property developers’ leverage will hinder their ability and willingness to build. In turn, limited property supply will likely push up property prices, which is contrary to Beijing’s goals of curbing property price inflation. So, why are authorities pursuing this clampdown on property developers? Chart 2Property Starts And Prices Are Positively Correlated
Property Starts And Prices Are Positively Correlated
Property Starts And Prices Are Positively Correlated
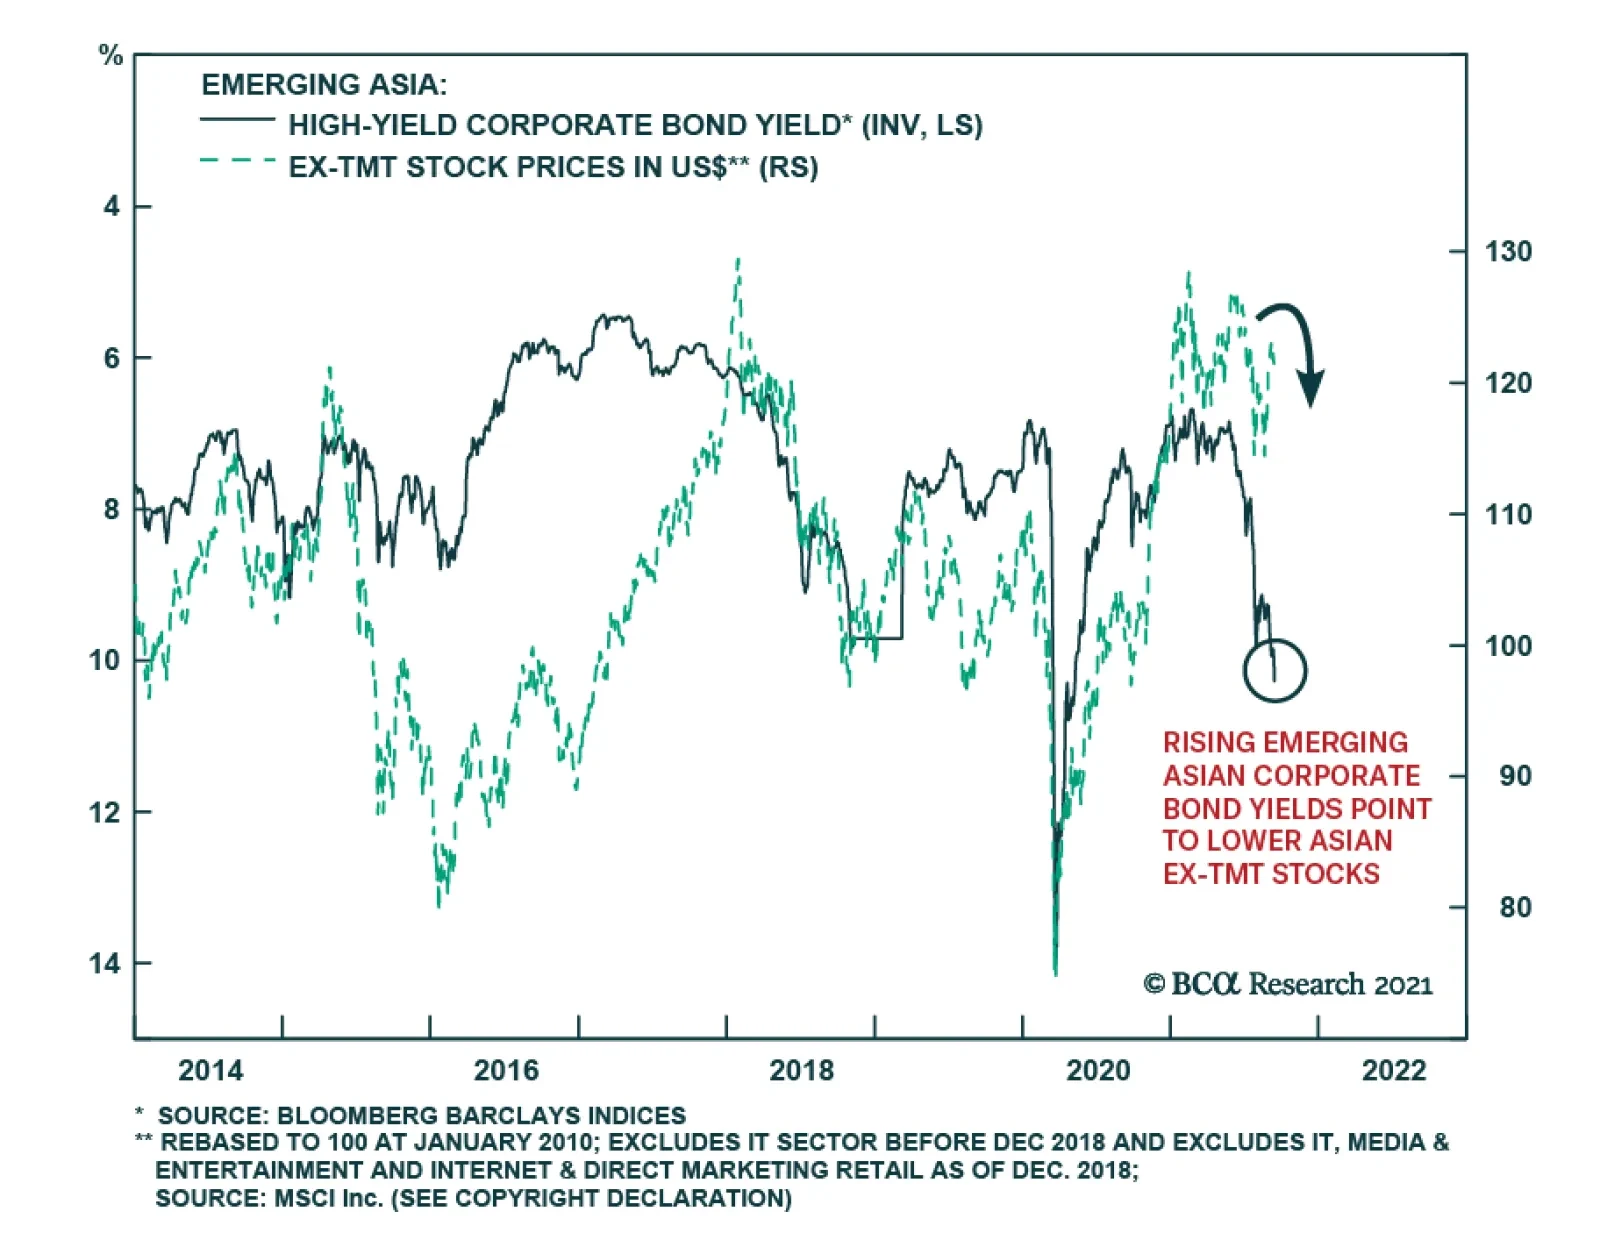
This is a very good question, and we have the following observations. In our view, authorities are clamping down on property developers’ leverage because historically there was a strong positive correlation between property starts and house prices (Chart 2). The basis for this positive correlation is that when property developers start more projects, they raise expectations via aggressive marketing of higher prices in future. As a result, people become more inclined to buy houses. In fact, more supply has not precluded property prices from surging and vice versa, as shown in Chart 2. Provided housing valuations (the house price-to-income ratios) are exceptionally high in China and high-income households have been buying multiple apartments, we can argue that (speculative) expectations for higher prices in the future have often been an important driver of demand. So, authorities are probably hoping to break this speculative cycle where higher prices breed higher prices. Aggressive marketing on the part of property developers – creating an atmosphere of euphoria around new property launches – has been an essential driver for surging house price expectations. Hence, authorities’ reasoning is that curbing property developers’ relentless debt financed expansion activity is essential for both (1) to restrain excessive house prices inflation (a social stability goal) and (2) to reduce risks of a future credit crisis (a financial stability goal). Finally, with many households/investors who own multiple properties (that are vacant rather than rented out), authorities hope that diminished expectations for future house price appreciation will bring some of these vacant properties to the market. If this occurs, the supply of residential properties for sale and rent will not drop dramatically despite lower starts by property developers. It is also critical to assess the implications of the ongoing carnage in Chinese offshore corporate bonds, where the epicenter of the selloff is property companies. The fact that property developers are experiencing a credit crunch and will be forced to deleverage has implications for China’s business cycle and other EM economies. Chart 3 illustrates that the periods of rising emerging Asian USD corporate bond yields (shown inverted on the chart) coincide with lower emerging Asian ex-TMT share prices. The link is as follows: the ongoing credit stress and deleveraging by mainland property developers means less construction and diminished demand for raw materials and industrial goods as well as possibly household white goods. There are thus negative implications not only for emerging Asian non-TMT stocks but also for overall EM. Bottom Line: Property construction in China will continue contracting (Chart 4). This will weigh on raw materials and industrial goods demand in China and beyond it. Chart 3Rising Emerging Asian Corporate Bond Yields Point To Lower Asian ex-TMT Stocks
Rising Emerging Asian Corporate Bond Yields Point To Lower Asian ex-TMT Stocks
Rising Emerging Asian Corporate Bond Yields Point To Lower Asian ex-TMT Stocks
Chart 4Chinese Housing: Sales And Starts Are Contracting
Chinese Housing: Sales And Starts Are Contracting
Chinese Housing: Sales And Starts Are Contracting
Arthur Budaghyan Chief Emerging Markets Strategist arthurb@bcaresearch.com Have EM Stocks Bottomed? Investor sentiment on EM equities has plunged close to its previous lows. However, this is a necessary but not sufficient condition to issue a buy recommendation. Critically, EM narrow money growth points to EPS deceleration in the next nine months. Yet, analysts’ net EPS revisions remain elevated and have not yet dropped to negative levels. Our bias is that EM net EPS revisions will be downgraded in the coming months. From a technical perspective, the EM equity index has failed to break above its 200-day moving average. This is a negative technical signal. Chart 5
Have EM Stocks Bottomed?
Have EM Stocks Bottomed?
Chart 6
Have EM Stocks Bottomed?
Have EM Stocks Bottomed?
Chart 7
Have EM Stocks Bottomed?
Have EM Stocks Bottomed?
Chart 8
Have EM Stocks Bottomed?
Have EM Stocks Bottomed?
EM Underperformance Is Broad-Based Not only have EM TMT stocks massively underperformed their global peers, but also EM ex-TMT stocks have been underperforming their global counterparts. Besides, the EM equal-weighted stock index has failed to break above its previous highs. Failure to break above a resistance line is often a bad omen. Finally, EM ex-TMT share prices correlate with the average of AUD, NZD and CAD, and the latter remains in a corrective phase. Chart 9
EM Underperfomance Is Broad-Based
EM Underperfomance Is Broad-Based
Chart 10
EM Underperfomance Is Broad-Based
EM Underperfomance Is Broad-Based
Chart 11
EM Underperfomance Is Broad-Based
EM Underperfomance Is Broad-Based
Red Flags For EM Periods of rising EM USD corporate bond yields coincide with lower EM share prices. EM corporate USD bond yields are rising (shown inverted below) and we expect more upside. Either US Treasury bond yields will rise and EM corporate spreads will stay broadly constant, or EM credit spreads will widen and US Treasury yields will stay range-bound. Either of these scenarios will produce higher EM corporate bond yields and, thereby, herald lower EM equity prices. Further, a breakdown in platinum prices is also raising a red flag for EM risk assets. Chart 12
Red Flags For EM
Red Flags For EM
Chart 13
Red Flags For EM
Red Flags For EM
Have Chinese And Asian Stocks Hit An Air Pocket? Relative performance of emerging Asian equities versus the global stock index has broken below its previous lows. Technically, this entails a protracted period of underperformance. Neither emerging Asian ex-TMT nor Chinese investable ex-TMT share prices have been able to break above their major resistance lines. Failure to break above a resistance line is often a bad omen. Meantime, Chinese onshore stocks and corporate bonds have not sold off enough so that authorities panic and stimulate aggressively. Chart 14
Have Chinese And Asian Stocks Hit An Air Pocket?
Have Chinese And Asian Stocks Hit An Air Pocket?
Chart 15
Have Chinese And Asian Stocks Hit An Air Pocket?
Have Chinese And Asian Stocks Hit An Air Pocket?
Chart 16
Have Chinese And Asian Stocks Hit An Air Pocket?
Have Chinese And Asian Stocks Hit An Air Pocket?
Chart 17
Have Chinese And Asian Stocks Hit An Air Pocket?
Have Chinese And Asian Stocks Hit An Air Pocket?
The US Dollar As A Litmus Test EM risk assets negatively correlate with the US dollar. The broad trade-weighted US dollar is holding above its 200-day moving average. Plus, investor sentiment on the greenback remains negative. Finally, the US dollar moves inversely with relative performance of global cyclical sectors versus global defensives (the dollar is shown inverted on chart below). The ongoing slowdown in China is bullish for the US dollar because the US economy is the least vulnerable to China’s economy. Overall, we expect the US dollar to continue firming in the coming months. Chart 18
The US Dollar As A Litmus Test
The US Dollar As A Litmus Test
Chart 19
The US Dollar As A Litmus Test
The US Dollar As A Litmus Test
Chart 20
The US Dollar As A Litmus Test
The US Dollar As A Litmus Test
Global Mining Stocks, Commodity Currencies And Commodity Prices The share prices of BHP and Rio Tinto have fallen dramatically in absolute terms. This reflects the plunge in iron ore prices and might also be a harbinger of a broader selloff in industrial metals. Further, the average of AUD, NZD and CAD also signals a correction in the broad commodities price index. Chart 21
Global Mining Stocks, Commodity Currencies And Commodity Prices
Global Mining Stocks, Commodity Currencies And Commodity Prices
Chart 22
Global Mining Stocks, Commodity Currencies And Commodity Prices
Global Mining Stocks, Commodity Currencies And Commodity Prices
Chart 23
Global Mining Stocks, Commodity Currencies And Commodity Prices
Global Mining Stocks, Commodity Currencies And Commodity Prices
Is This Decoupling Sustainable? Industrial metals prices were historically correlated with the Chinese business cycle but have decoupled since early this year. Several commodity prices – like coal, steel and aluminum – have shot up due to production shutdowns as a part of the Chinese government’s decarbonization policies. However, it will be extraordinary if commodity prices continue advancing amid a protracted slowdown in China’s old economy. Chart 24
Is This Decoupling Sustainable?
Is This Decoupling Sustainable?
Chart 25
Is This Decoupling Sustainable?
Is This Decoupling Sustainable?
Chinese Commodity Imports Have Contracted Reflecting a demand slowdown and the government’s willingness to dampen commodity price inflation, China has been shrinking its imports of several commodities. It has also released some of its strategic reserves for oil and certain industrial metals. High commodity prices are hurting profit margins of manufacturing and industrial companies leading them to lower output. Beijing is determined to curb and bring down key commodity prices to lessen the negative impact on overall growth and employment. Chart 26
Chinese Commodity Imports Have Contracted
Chinese Commodity Imports Have Contracted
Chart 27
Chinese Commodity Imports Have Contracted
Chinese Commodity Imports Have Contracted
Chinese Stimulus: How Fast And How Large? In recent months, China has been injecting more liquidity into the banking system. Rising commercial banks’ excess reserves at the PBOC point to a bottom in the credit impulse in Q4 of this year. However, the credit impulse leads the business cycle by about nine months. This implies that the economy will not revive before Q2 next year at best. In fact, the aggregate building floor area started and the installation of electricity transmission lines are already contracting and will continue shrinking till Q2 next year. Chart 28
Chinese Stimulus: How Fast And How Large?
Chinese Stimulus: How Fast And How Large?
Chart 29
Chinese Stimulus: How Fast And How Large?
Chinese Stimulus: How Fast And How Large?
Chart 30
Chinese Stimulus: How Fast And How Large?
Chinese Stimulus: How Fast And How Large?
Chart 31
Chinese Stimulus: How Fast And How Large?
Chinese Stimulus: How Fast And How Large?
An Inflation Dichotomy Between China And The US In China, consumer price inflation remains largely contained. However, in the US core consumer price inflation measures are still rising and are above 2%. An optimal exchange rate adjustment to redistribute inflation pressures from the US into China will require a stronger US dollar and a weaker RMB. Chart 32
An Inflation Dichotomy Between China And The US
An Inflation Dichotomy Between China And The US
Chart 33
An Inflation Dichotomy Between China And The US
An Inflation Dichotomy Between China And The US
Inflation And Monetary Tightening In EM ex-China Core measures of inflation have been rising in many Eastern European and Latin American economies. Their central banks will hike interest rates further. This will hurt their domestic demand at a time when the recovery in these economies has been underwhelming. Monetary and fiscal tightening will offset benefits from reopening as their vaccination rates ameliorate. Chart 34
Inflation And Monetary Tightening In EM ex-China
Inflation And Monetary Tightening In EM ex-China
Chart 35
Inflation And Monetary Tightening In EM ex-China
Inflation And Monetary Tightening In EM ex-China
Chart 36
Inflation And Monetary Tightening In EM ex-China
Inflation And Monetary Tightening In EM ex-China
Chart 37
Inflation And Monetary Tightening In EM ex-China
Inflation And Monetary Tightening In EM ex-China
What Drives EM Credit Markets? We downgraded our allocation to EM credit, currencies and equities from neutral to underweight on March 25, 2021. This strategy remains intact. The outlook for the key drivers of EM credit – EM/China business cycles and EM exchange rates – remains downbeat. In fact, EM credit markets – both investment grade and high-yield – have been underperforming their US counterparts and this trend will persist. Chart 38
What Drives EM Credit Markets?
What Drives EM Credit Markets?
Chart 39
What Drives EM Credit Markets?
What Drives EM Credit Markets?
Chart 40
What Drives EM Credit Markets?
What Drives EM Credit Markets?
Chart 41
What Drives EM Credit Markets?
What Drives EM Credit Markets?
Our Relative Equity Value Strategies We have been recommending investors go long Chinese A shares / short Chinese investable stocks since March 4, 2021 and this strategy has been extremely profitable. The same is true for the short Chinese property developers / long overall index and short Chinese investable value stocks versus global value stocks strategies. Finally, our recommendation to be long global industrials / short global materials has so far been flat but we expect it to play out for the reasons elaborated in the linked report. Chart 42
Our Relative Equity Value Strategies
Our Relative Equity Value Strategies
Chart 43
Our Relative Equity Value Strategies
Our Relative Equity Value Strategies
Chart 44
Our Relative Equity Value Strategies
Our Relative Equity Value Strategies
Chart 45
Our Relative Equity Value Strategies
Our Relative Equity Value Strategies
Retail Equity Mania In Korea And Taiwan The retail mania continues in the Korean and Taiwanese stock markets. Retail investors are the main buyers while foreign investors and domestic institutional investors have been scaling back their exposure. Surging margin loans and equity trading volumes in Korea confirm ongoing equity euphoria. We continue overweighting Korean stocks and are neutral on Taiwanese stocks within an EM equity portfolio. The difference in our strategy is due to the potential geopolitical risks that Taiwan is facing. Chart 46
Retail Equity Mania In Korea And Taiwan
Retail Equity Mania In Korea And Taiwan
Chart 47
Retail Equity Mania In Korea And Taiwan
Retail Equity Mania In Korea And Taiwan
Chart 48
Retail Equity Mania In Korea And Taiwan
Retail Equity Mania In Korea And Taiwan
Chart 49
Retail Equity Mania In Korea And Taiwan
Retail Equity Mania In Korea And Taiwan
The Semi Cycle And Risks To The Absolute Performance Of Korean And Taiwanese Stocks DRAM and NAND prices have rolled over. This is a near-term risk to the absolute performance of Korean tech stocks. However, if global industrial stocks outperform, as we expect, Korean share prices will outperform the EM equity benchmark because the KOSPI is a good proxy play on global industrials within the EM universe. Although global semiconductor shortages remain widespread, the 6-month outlook for Taiwanese technology companies has rolled over too. Chart 50
The Semi Cycle And Risks To The Absolute Performance Of Korean And Taiwanese Stocks
The Semi Cycle And Risks To The Absolute Performance Of Korean And Taiwanese Stocks
Chart 51
The Semi Cycle And Risks To The Absolute Performance Of Korean And Taiwanese Stocks
The Semi Cycle And Risks To The Absolute Performance Of Korean And Taiwanese Stocks
Chart 52
The Semi Cycle And Risks To The Absolute Performance Of Korean And Taiwanese Stocks
The Semi Cycle And Risks To The Absolute Performance Of Korean And Taiwanese Stocks
Chart 53
The Semi Cycle And Risks To The Absolute Performance Of Korean And Taiwanese Stocks
The Semi Cycle And Risks To The Absolute Performance Of Korean And Taiwanese Stocks
Footnotes Equities Recommendations Currencies, Credit And Fixed-Income Recommendations
Following this week’s CPI release, we update our Corporate Pricing Power Indicator (CPPI). As a reminder, we calculate industry group pricing power from the relevant CPI, PPI, PCE and commodity prices growth rates for each of the 60 industry groups we track. Table 1 on the next page highlights short-term pricing power trends and each industry's spread to overall inflation. 83% of the industries we cover are lifting selling prices, at a faster clip than overall inflation. Commodity-sensitive industries dominate the top of Table 1 with steel and energy industries leading the way with 75% to 10% price increase as they have enjoyed a slingshot post-COVID-19 recovery. One notable exception is the forest products industry with a tape reading of -47% due to the ongoing bear market in lumber futures. We expect the rest of the commodity complex to give up leadership as headwinds from a slowdown in China filter through the global markets. Pricing power of auto manufacturers is also on the rise – empty dealership lots and reduced supply result in a significant upward pressure on prices. There is already evidence that price increases and shortages in supply are starting to discourage consumers from making purchases. Meanwhile, most other consumer goods and services categories populate the middle of the Pricing Power table, suggesting that there is a limit to companies’ ability to raise consumer prices without damaging the demand. We also note that it is reassuring that prices of semiconductors have come down, as it may be an early indication that supply chain is starting to unclog and shortages, such as the one in semiconductors, are starting to resolve. Finally, yesterday was Lehman Bankruptcy Day – 13 years have passed. Time flies. Bottom Line: Outside of commodities and building materials, price increases are moderating. Table 1
Updating Corporate Pricing Power Indicator
Updating Corporate Pricing Power Indicator
Highlights Since June, 6 structured recommendations achieved their profit targets: short building and construction (XLB) versus healthcare (XLV); long USD/CAD; long USD/HUF; long Nike versus L’Oréal; short corn versus wheat; and short marine transport versus market. Additionally, short AMC Entertainment expired in profit, while short Australian versus Canadian 30-year bonds expired flat. Within the open trades, 3 are in profit. Against this, 2 structured recommendations hit their stop-losses: short Austria versus Chile; and short lead versus platinum. Additionally, short France versus Japan expired in loss. Within the open trades, 6 are in loss. This results in a ‘win ratio’ at a very pleasing 59 percent. Even more commendably, the 9 unstructured recommendations have all anticipated reversals or exhaustions – most notably for the ZAR, BRL, and stocks versus bonds. Feature Chart of the WeekFractal Fragility Correctly Signalled The Exhaustion Of Stocks Versus Bonds
Fractal Fragility Correctly Signalled The Exhaustion Of Stocks Versus Bonds
Fractal Fragility Correctly Signalled The Exhaustion Of Stocks Versus Bonds
A major advance in our understanding of financial markets is that the Efficient Market Hypothesis (EMH) is only partly true. The market is efficient only when a wide spectrum of investment horizons is setting the price, signified by the market having a rich fractal structure. The market is efficient only when a wide spectrum of investment horizons is setting the price, signified by the market having a rich fractal structure. The eponymous Fractal Market Hypothesis (FMH) teaches us that when the fractal structure becomes extremely fragile, the information and interpretation of longer-term investors is missing from the recent price setting. Meaning that the market has become inefficient. When the longer-term investors do re-enter the price setting process, the question is: will they endorse the most recent trend as a justification of a change in the fundamentals. In which case, the trend will continue. Or will they reject it as an unjustified deviation from a fundamental anchor. In which case, the trend will reverse. In most cases, it is the latter: a rejection and a reversal. As most investors are unaware of the FMH, it gives a competitive advantage to the few investors that use it to signal a potential countertrend reversal. On this basis, we have used it – and continue to use it – to identify countertrend investment opportunities with truly excellent results. Fractal Trade Update This a brief review and update of the 29 short-term trades that we have recommended since our last update on 3rd June 2021, including recommendations that were open on that date. The 29 recommendations have comprised 20 structured trades – which include profit-targets, symmetrical stop-losses, and expiry dates – plus a further 9 recommendations without structured exit points. In summary, 6 structured recommendations achieved their profit targets: short building and construction (XLB) versus healthcare (XLV); long USD/CAD; long USD/HUF; long Nike versus L’Oréal; short corn versus wheat; and short marine transport versus market. Additionally, short AMC Entertainment expired in profit, while short Australian versus Canadian 30-year bonds expired flat. Within the open trades, 3 are in profit. Against this, 2 structured recommendations hit their stop-losses: short Austria versus Chile; and short lead versus platinum. Additionally, short France versus Japan expired in loss. Within the open trades, 6 are in loss. This results in a ‘win ratio’ at a very pleasing 59 percent – counting a win as achieving the profit target, a loss as hitting the (symmetrical) stop-loss, and pro-rata for partial wins and losses. Even more commendably, the 9 unstructured recommendations have all anticipated reversals or exhaustions. The sections below review the structured and unstructured recommendations in chronological order. The 20 Structured Trades 1. 6th May: Short Building and Construction (PKB) vs. Healthcare (XLV) Achieved its profit target of 15 percent. 2. 6th May: Short MSCI France vs. Japan Expired after three months in partial loss but went on to become very profitable – implying that a longer holding period was required (Chart I-2). Chart I-2Short France Versus Japan Became Very Profitable
Short France Versus Japan Became Very Profitable
Short France Versus Japan Became Very Profitable
3. 13th May: Long USD/CAD Achieved its profit target of 3.7 percent and went on to reach a high-water mark of 5.7 percent. 4. 20th May: Long 10-year T-bond vs. TIPS Open, in profit, having reached a high-water mark of 2.7 percent (versus a 3.6 percent target). 5. 3rd June: Short MSCI Austria vs. Chile Hit its stop-loss of 7 percent, albeit after previously reaching a high-water mark of 5.3 percent – implying that the profit target needed to be tighter. 6. 10th June: Short AMC Entertainment Expired at a 4 percent profit, having reached a high-water mark of 65.3 percent (versus a 100 percent target) (Chart I-3). Chart I-3Fractal Analysis Works Very Well For Meme Stocks
Fractal Analysis Works Very Well For Meme Stocks
Fractal Analysis Works Very Well For Meme Stocks
7. 10th June: Long USD/HUF Achieved its 3 percent profit target, before continuing to a high-water mark of 7.6 percent (Chart I-4). Chart I-4HUF/USD Corrected By 7.6 Percent
HUF/USD Corrected By 7.6 Percent
HUF/USD Corrected By 7.6 Percent
8. 17th June: Long Nike vs. L’Oréal Achieved its 9 percent profit target, before continuing to a high-water mark of 31.3 percent (Chart I-5). Chart I-5L’Oréal Underperformed Nike By 31 Percent
L'Oreal Underperformed Nike By 31 Percent
L'Oreal Underperformed Nike By 31 Percent
9. 24th June: Short Corn vs. Wheat Achieved its 12 percent profit target, before continuing to a high-water mark of 38.7 percent (Chart I-6). Chart I-6Corn Underperformed Wheat By 39 Percent
Corn Underperformed Wheat By 39 Percent
Corn Underperformed Wheat By 39 Percent
10. 1st July: Short US REITs vs. Utilities Open, in profit, having reached a high-water mark of 3 percent (versus a 5 percent target). 11. 8th July: Short Marine Transport vs. Market Achieved its profit target of 16.5 percent. 12. 15th July: Short Lead vs. Platinum Hit its stop loss of 6.4 percent. 13. 15th July: Short Australia vs. Canada 30-year T-Bonds Expired flat. 14. 5th August: Short Tin vs. Platinum Open, in loss, albeit having reached a high-water mark of 9.3 percent (versus a 16.5 percent target). 15. 12th August: Long MSCI Hong Kong vs. MSCI World Open, in loss. 16. 12th August: Long New Zealand vs. Netherlands Open, in loss. 17. 19th August: Short India vs. China Open, in loss (Chart I-7). Chart I-7The Outperformance Of India Versus China Is Fractally Fragile
The Outperformance Of India Versus China Is Fractally Fragile
The Outperformance Of India Versus China Is Fractally Fragile
18. 26th August: Short Sugar vs. Soybeans Open, in loss. 19. 2nd September: Short Aluminum vs. Gold Open, in loss (Chart I-8). Chart I-8The Outperformance Of Base Metals Versus Precious Metals Is Fractally Fragile
The Outperformance Of Base Metals Versus Precious Metals Is Fractally Fragile
The Outperformance Of Base Metals Versus Precious Metals Is Fractally Fragile
20. 9th September: Short US Medical Equipment vs. Healthcare Services Open, in profit. The 9 Unstructured Trades 1. 10th June: Short ZAR/USD ZAR/USD subsequently corrected by 12 percent. 2. 24th June: Short Copper Copper’s rally subsequently exhausted. 3. 1st July: Short MSCI ACWI vs. 30-year T-bond The rally in stocks versus bonds has subsequently exhausted (Chart of the Week). 4. 8th July: Short BRL/COP BRL/COP subsequently corrected by 4 percent. 5. 8th July: Short Saudi Tadawul All-Share vs. FTSE Malaysia All Share KLCI The rally in Saudi Arabian equities versus Malaysian equities subsequently exhausted. 6. 12th August: Long NOK/GBP NOK/GBP has subsequently rallied by 3 percent. 7. 26th August: Short Hungary vs. EM Hungary’s outperformance is losing steam. 8. 26th August: Short USD/PLN USD/PLN subsequently corrected by 3 percent. 9. 2nd September: Short Trade Weighted US Dollar Index The dollar rally is meeting near-term resistance. Dhaval Joshi Chief Strategist dhaval@bcaresearch.com Mohamed El Shennawy Research Associate Fractal Trading System Fractal Trades 6-Month Recommendations Structural Recommendations Closed Fractal Trades Closed Trades Asset Performance Equity Market Performance Indicators To Watch - Bond Yields Chart II-1Indicators To Watch - Bond Yields ##br##- Euro Area
Indicators To Watch - Bond Yields - Euro Area
Indicators To Watch - Bond Yields - Euro Area
Chart II-2Indicators To Watch - Bond Yields ##br##- Europe Ex Euro Area
Indicators To Watch - Bond Yields - Europe Ex Euro Area
Indicators To Watch - Bond Yields - Europe Ex Euro Area
Chart II-3Indicators To Watch - Bond Yields ##br##- Asia
Indicators To Watch - Bond Yields - Asia
Indicators To Watch - Bond Yields - Asia
Chart II-4Indicators To Watch - Bond Yields ##br##- Other Developed
Indicators To Watch - Bond Yields - Other Developed
Indicators To Watch - Bond Yields - Other Developed
Indicators To Watch - Interest Rate Expectations Chart II-5Indicators To Watch - Interest Rate Expectations
Indicators To Watch - Interest Rate Expectations
Indicators To Watch - Interest Rate Expectations
Chart II-6Indicators To Watch - Interest Rate Expectations
Indicators To Watch - Interest Rate Expectations
Indicators To Watch - Interest Rate Expectations
Chart II-7Indicators To Watch - Interest Rate Expectations
Indicators To Watch - Interest Rate Expectations
Indicators To Watch - Interest Rate Expectations
Chart II-8Indicators To Watch - Interest Rate Expectations
Indicators To Watch - Interest Rate Expectations
Indicators To Watch - Interest Rate Expectations
BCA Research's China Investment Strategy service recommends a new trade: long Chinese industrial stocks/short A-shares. Chinese onshore stocks in the infrastructure, materials, and industrial sectors recently advanced strongly in the expectation that…
Looking At PPI
Looking At PPI
Last week’s PPI release came in strong, beating expectations and posting its eighth consecutive print of a higher-than-forecasted YoY increase. The release confirms that supply chains remain clogged and that businesses are forced to hike prices to offset pricing pressures. Anecdotally, the Suez Canal was briefly blocked once again last week as if foreshadowing more supply-side pain ahead. PPI internals also send the same message with goods inflation outpacing both the headline number and the services inflation (see chart). Given that service-producing industries are less reliant on raw materials, we expect the same divergence between goods and services PPI to hold over the coming several prints. Meanwhile our house view remains that the ongoing inflationary spike will be transitory in nature, and as businesses replenish inventories, inflation data will stabilize at lower levels. Please stay tuned for tomorrow’s Sector Insight report where we will update our Corporate Pricing Power table.
Dear Client, Next week, in lieu of our regular weekly report, I will be hosting two webcasts where I will discuss our view on China’s economy and financial markets. I will also address the topics that our clients are most concerned about, including China’s regulatory developments, inflation, and policy direction. The webcasts will be held on Wednesday, September 22 at 10:00 am EDT (English), and Thursday, September 23 at 9:00 am HKT (Mandarin). I look forward to discussing with you during the webcast. We will return to our regular publishing schedule on Wednesday, September 29. Best regards, Jing Sima, China Strategist Highlights China is facing cyclical inflationary pressures more than disinflationary ones. Prices of mining, raw materials and manufacturing goods have been rising at record rates. Chinese manufacturers are operating at close to full production, which suggests that there is little slack in demand. Despite soft headline readings in consumer prices, the costs of goods and services have rebounded to pre-pandemic levels. Prices for home durable goods, fuel and utilities have surged to multiyear highs. Measures to boost domestic demand will be limited as long as inflationary pressures continue and manufacturers produce at close to full capacity. Near-term policy support will likely focus on reducing costs for manufacturers and improving wage growth for lower-income households. We are initiating a trade: long industrial stocks/short A-shares. Feature China’s Producer Price index (PPI) registered a 13-year high in August, at the time when the domestic economy continued to slow. On the other hand, consumer prices (CPI) - both headline and core CPI - have been lackluster. The acceleration in producer inflation and the demand dynamics raise the question whether China is in a stagflation, a situation in which prices climb but wages and demand do not follow. Consequentially, economy policy faces a dilemma between boosting demand and containing inflation. Inflationary pressures have been driven by pandemic-related factors and the supply-side constraints will likely continue into Q1 next year. These inflationary pressures, and more importantly, undercurrents in the inflation prints, will constrain Chinese policymakers’ efforts to reflate the economy. The recent rebound in Chinese infrastructure stocks is overdone. Material stocks are also vulnerable to price setbacks. Global commodity prices will soften, although from very elevated levels. Meanwhile, we are initiating a trade: long Chinese industrial stocks relative to the A-share market. Despite falling profit growth in recent months, China’s leadership is increasing its support, both cyclically and structurally, to the manufacturing sector. Inflation Or Deflation? The details in both the PPI and CPI readings indicate that China is facing more inflationary pressures than disinflationary ones. Producers are raising prices across the board. Although consumer prices will likely remain well below the PBoC's 3% inflation target for the year mainly due to low food prices, prices in some of the key consumer goods segments are rising at an alarming pace. The inflationary pressures will continue for producers, at least through the first quarter of 2022. The strength in August’s PPI was concentrated in mining and raw materials (Chart 1, top panel). Robust global demand and tight supply conditions supported high oil and base metals prices, while pushing up coal prices. Chart 1Chinese Mining And Manufacturing Goods Prices Accelerated To Record Highs
Chinese Mining And Manufacturing Goods Prices Accelerated To Record Highs
Chinese Mining And Manufacturing Goods Prices Accelerated To Record Highs
Chart 2Commodity Prices Held Up Despite A Slowing China
Commodity Prices Held Up Despite A Slowing China
Commodity Prices Held Up Despite A Slowing China
We do not expect China’s infrastructure investment growth to pick up and support industrial metal prices. However, this year’s unsynchronized recovery in global demand and severe supply shortages have delayed the global commodity market’s price reaction to slowing Chinese demand (Chart 2). Moreover, as China’s environmental policy remains stringent during the upcoming winter, supply-side constraints from production cuts will partially offset the slowdown in China’s demand for mining and raw materials (Chart 3A and 3B). Chart 3ASupply-Side Constraints And Chinese Production Cuts Likely To Continue Into Early 2022
Supply-Side Constraints And Chinese Production Cuts Likely To Continue Into Early 2022
Supply-Side Constraints And Chinese Production Cuts Likely To Continue Into Early 2022
Chart 3BSupply-Side Constraints And Chinese Production Cuts Likely To Continue Into Early 2022
Supply-Side Constraints And Chinese Production Cuts Likely To Continue Into Early 2022
Supply-Side Constraints And Chinese Production Cuts Likely To Continue Into Early 2022
Manufacturing goods inflation registered its topmost annual growth since data collection started in 1996 (Chart 1, bottom panel). Moreover, capacity utilization rates in the industrial and manufacturing sectors are at the highest levels since 2007, well above their means (Chart 4). Changes in manufacturing capacity are highly correlated with China’s export growth and tightly linked to PPI (Chart 5). Therefore, manufacturing goods prices will remain lofty as long as external demand stays robust and China’s manufacturers continue to produce near maximum output. Chart 4Chinese Manufacturers Are Producing Near Their Max Capacity
Chinese Manufacturers Are Producing Near Their Max Capacity
Chinese Manufacturers Are Producing Near Their Max Capacity
Chart 5Robust Exports Have Been Supporting Strong Chinese Manufacturing Output
Robust Exports Have Been Supporting Strong Chinese Manufacturing Output
Robust Exports Have Been Supporting Strong Chinese Manufacturing Output
The PPI’s weakest component has been consumer goods, which inched up by a mere 0.3% from a year ago (Chart 6). However, consumer goods only account for 25% of PPI, whereas industrial and manufacturing producer goods are 75%. In addition, the underlying data shows that among the four sub-components in the PPI’s consumer goods, only food prices have remained below their pre-pandemic levels (Chart 7, top panel). Prices in durable goods have rebounded strongly since March last year and clothing and daily sundry articles have recovered to their end-2019 rate of growth (Chart 7, mid and bottom panels). Chart 6Producer Prices For Consumer Goods Remain Soft...
Producer Prices For Consumer Goods Remain Soft...
Producer Prices For Consumer Goods Remain Soft...
Chart 7...But Food Prices Have Been The Main Drag
...But Food Prices Have Been The Main Drag
...But Food Prices Have Been The Main Drag
The PPI’s price forces are consistent with the CPI, in which food has been the main drag. Core CPI, along with prices for consumer goods and services, have returned to pre-pandemic growth rates (Chart 8). Durable goods prices, such as home appliances, increased to a multiyear high in August. Fuel and utilities costs have also risen. This suggests that despite the soft CPI readings, inflation has flowed from producers to Chinese consumers through manufacturing goods. The passthrough will likely intensify into Q4 when domestic COVID-cases have been largely brought under control and the September – October holiday season will boost consumption for both goods and services. Chart 8Prices For Other Consumer Goods Categories Have Recovered
Prices For Other Consumer Goods Categories Have Recovered
Prices For Other Consumer Goods Categories Have Recovered
Table 1A Look At China’s CPI Basket – Food Dominates
Inflation, Deflation, Or Stagflation?
Inflation, Deflation, Or Stagflation?
We still expect that headline CPI will remain below the PBoC’s 3% inflation target for the year. Consumer durable goods prices are lightly weighted in China’s CPI, therefore, an acceleration in inflation passthroughs in this component is unlikely to significantly push up the CPI aggregates (Table 1). Chart 9Prices For Healthcare And Education Services On A Structural Downshift
Prices For Healthcare And Education Services On A Structural Downshift
Prices For Healthcare And Education Services On A Structural Downshift
In addition, there are some structural headwinds that will affect prices in the education and healthcare and medical services components, which together account for about 15% of the CPI. Healthcare prices have been on a policy-driven structural downshift since late 2017 and recent regulatory changes in the education industry will depress pricing power in that sector (Chart 9). Despite sluggish aggregate consumer prices, climbing prices in consumer durable goods, services and particularly, fuel and utilities, will likely force China’s leadership to take action on policy. Bottom Line: Price pressures for Chinese producers remain intense and consumers will feel the heat of escalating prices in durable goods, fuel and utilities. Inflation is threatening domestic demand, which is already slowing from its peak earlier this year. Implications On Policy Response Inflation readings –even though they are lagging economic indicators –bear significant forward-looking market implications because changes in inflation dynamics herald various policy responses. Despite slower economic growth, higher inflation coupled with accommodative monetary and fiscal policies may indicate that the economy is in a “goldilocks” stage and corporate profits can still benefit (Chart 10). Chinese onshore stocks reached record high recently (Chart 11). Chart 10Are Chinese Corporates In A 'Sweet Spot'?
Are Chinese Corporates In A 'Sweet Spot'?
Are Chinese Corporates In A 'Sweet Spot'?
Chart 11Accommodative Monetary Conditions Propelled Chinese Stock Prices To Highest Since 2015
Accommodative Monetary Conditions Propelled Chinese Stock Prices To Highest Since 2015
Accommodative Monetary Conditions Propelled Chinese Stock Prices To Highest Since 2015
However, underlying trends in China’s producer and consumer inflation prints raise the risks that policymakers may not deliver the ingredients needed for a “just right” scenario. Even though China has kept a loose monetary policy that we expect to extend into next year, inflationary pressures may force policymakers to either delay or reduce the magnitude of stimulus. Recent policy moves show that the authorities are focused on reducing input cost burdens and bumping up support for small- and medium-sized enterprises (SMEs), which are highly concentrated in mid- to downstream manufacturing and services sectors. In our view, the recent rhetoric from policymakers further reduces the odds of any broadly based stimulus to boost demand. Our view is based on the following observations: The elevated global input costs and limited price passthroughs to consumers are depressing Chinese manufacturers’ profit margins and incentives to expand production capacity. Despite strong exports and production, manufacturing investment has lagged that in infrastructure and real estate this year (Chart 12). Consumers, particularly lower-income households, are bearing most of the burdens; rising costs and slow wage growth are weakening their propensity to spend (Chart 13). Chart 12Slower Manufacturing Investment Recovery Than Infrastructure And Real Estate So Far This Year
Slower Manufacturing Investment Recovery Than Infrastructure And Real Estate So Far This Year
Slower Manufacturing Investment Recovery Than Infrastructure And Real Estate So Far This Year
Chart 13Slow Wage Growth Limits The Pace Of Consumption Recovery
Slow Wage Growth Limits The Pace Of Consumption Recovery
Slow Wage Growth Limits The Pace Of Consumption Recovery
The inflation prints came at the time when China’s top leadership shifted its structural policy goals to reduce income inequality and stabilize manufacturing share in the aggregate economy. The structural goals will likely be reflected in policy responses to the cyclical challenge. Moreover, this year’s manufacturing production volume was growing twice as fast as producer prices, a reversal from 2017 when price increases outpaced production (Chart 14). Price changes are much more important to corporate profits than volume changes. A strong RMB and sharply escalating shipping costs have also reduced exporters’ pricing power and profits (Chart 15). In contrast, mounting prices across various commodities have allowed the upstream industrial sectors, which are dominated by SOEs, to deliver much stronger profits than the downstream and private sector (Chart 16). Chart 14Growth In Manufacturing Output And Prices Starting To Converge
Growth In Manufacturing Output And Prices Starting To Converge
Growth In Manufacturing Output And Prices Starting To Converge
Chart 15Strong RMB And Rising Shipping Costs Have Reduced Chinese Exporters' Profitability
Strong RMB And Rising Shipping Costs Have Reduced Chinese Exporters' Profitability
Strong RMB And Rising Shipping Costs Have Reduced Chinese Exporters' Profitability
It is unsurprising that authorities are increasing support to the private sector in order to maintain manufacturing share in the economy and keep the export sector competitive (Chart 17). A boost in infrastructure investment, on the other hand, would exacerbate upward pressure on commodity prices and mostly benefit upstream SOEs. Chart 16Upstream Industries Disproportionally Benefited From Surging Commodity Prices
Upstream Industries Disproportionally Benefited From Surging Commodity Prices
Upstream Industries Disproportionally Benefited From Surging Commodity Prices
Chart 17Private Sector: Lower Profit Margin, Higher Costs
Private Sector: Lower Profit Margin, Higher Costs
Private Sector: Lower Profit Margin, Higher Costs
Furthermore, stimulating the traditional sectors would not revive household consumption. The subdued recovery in consumption and prices for consumer staple goods is due to slow growth in lower-income household wages and a disrupted recovery in the services sector. Ramping up infrastructure investment can support headline GDP growth, but will do little to provide jobs and wages since China’s private sector provides 80% of all jobs and 90% of annual job creations. Lower-income households have a higher marginal propensity to consume. We expect the government to accelerate fiscal support measures to fortify wages among lower-income households. Bottom Line: Ongoing inflationary pressures and the underlying forces will likely thwart policymakers from stepping up their efforts to stimulate the old economy sectors. Investment Conclusions Chart 18Rebound In Infrastructure Stocks Should Be Short-Lived
Rebound In Infrastructure Stocks Should Be Short-Lived
Rebound In Infrastructure Stocks Should Be Short-Lived
Chinese onshore stocks in the infrastructure, materials, and industrial sectors recently advanced strongly in the expectation that policymakers will ramp up their fiscal support in the old economy sectors, particularly infrastructure. Although we agree that infrastructure investment will improve, we maintain our view that a sizable rebound is highly unlikely this year. Hence, we do not expect that the rally in infrastructure stocks will be long-lasting (Chart 18). We are probably too late in the cycle to re-initiate our long material/broad market trade in the onshore and offshore equity markets (Chart 19). We closed the trade in December last year when Chinese policymakers started pulling back stimulus, and in expectations that raw material prices would tumble. However, we underestimated the intensity of China’s de-carbonization efforts and protracted global supply-side constraints. Although global commodity prices will remain elevated into 2022, the price rallies from this year are not sustainable on a cyclical (6- to 12-month) basis. Therefore, we do not recommend material stocks as a cyclical play. Chart 19Price Rally In Materials Stocks Unlikely To Sustain
Price Rally In Materials Stocks Unlikely To Sustain
Price Rally In Materials Stocks Unlikely To Sustain
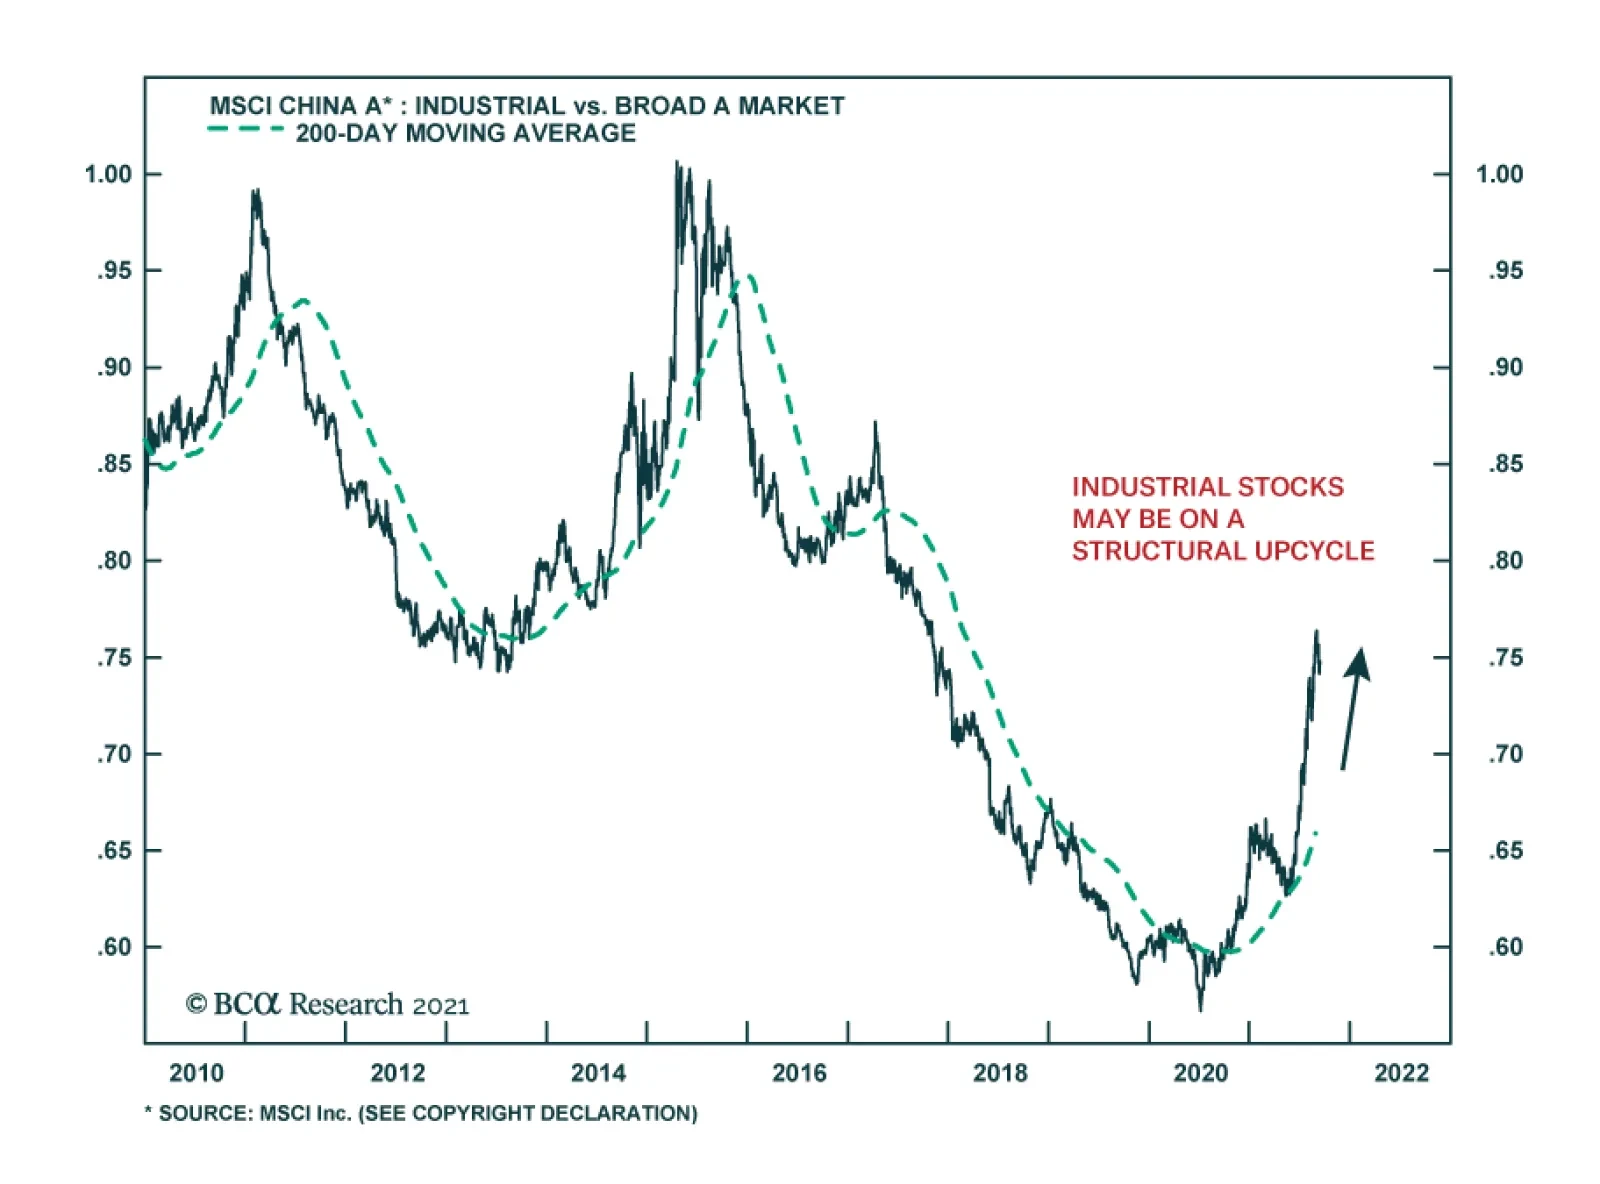
Chart 20Industrial Stocks May Be On A Structural Upcycle
Industrial Stocks May Be On A Structural Upcycle
Industrial Stocks May Be On A Structural Upcycle
Instead, we recommend a long industrial/broad A-share market trade (Chart 20). Even though China is in a late business cycle and the upcoming stimulus will be mediocre at best, we think that the industrial sector will benefit from policy support for investment in the manufacturing sector and a faster pace in the sector’s capacity expansion. Jing Sima China Strategist jings@bcaresearch.com Footnotes Market/Sector Recommendations Cyclical Investment Stance
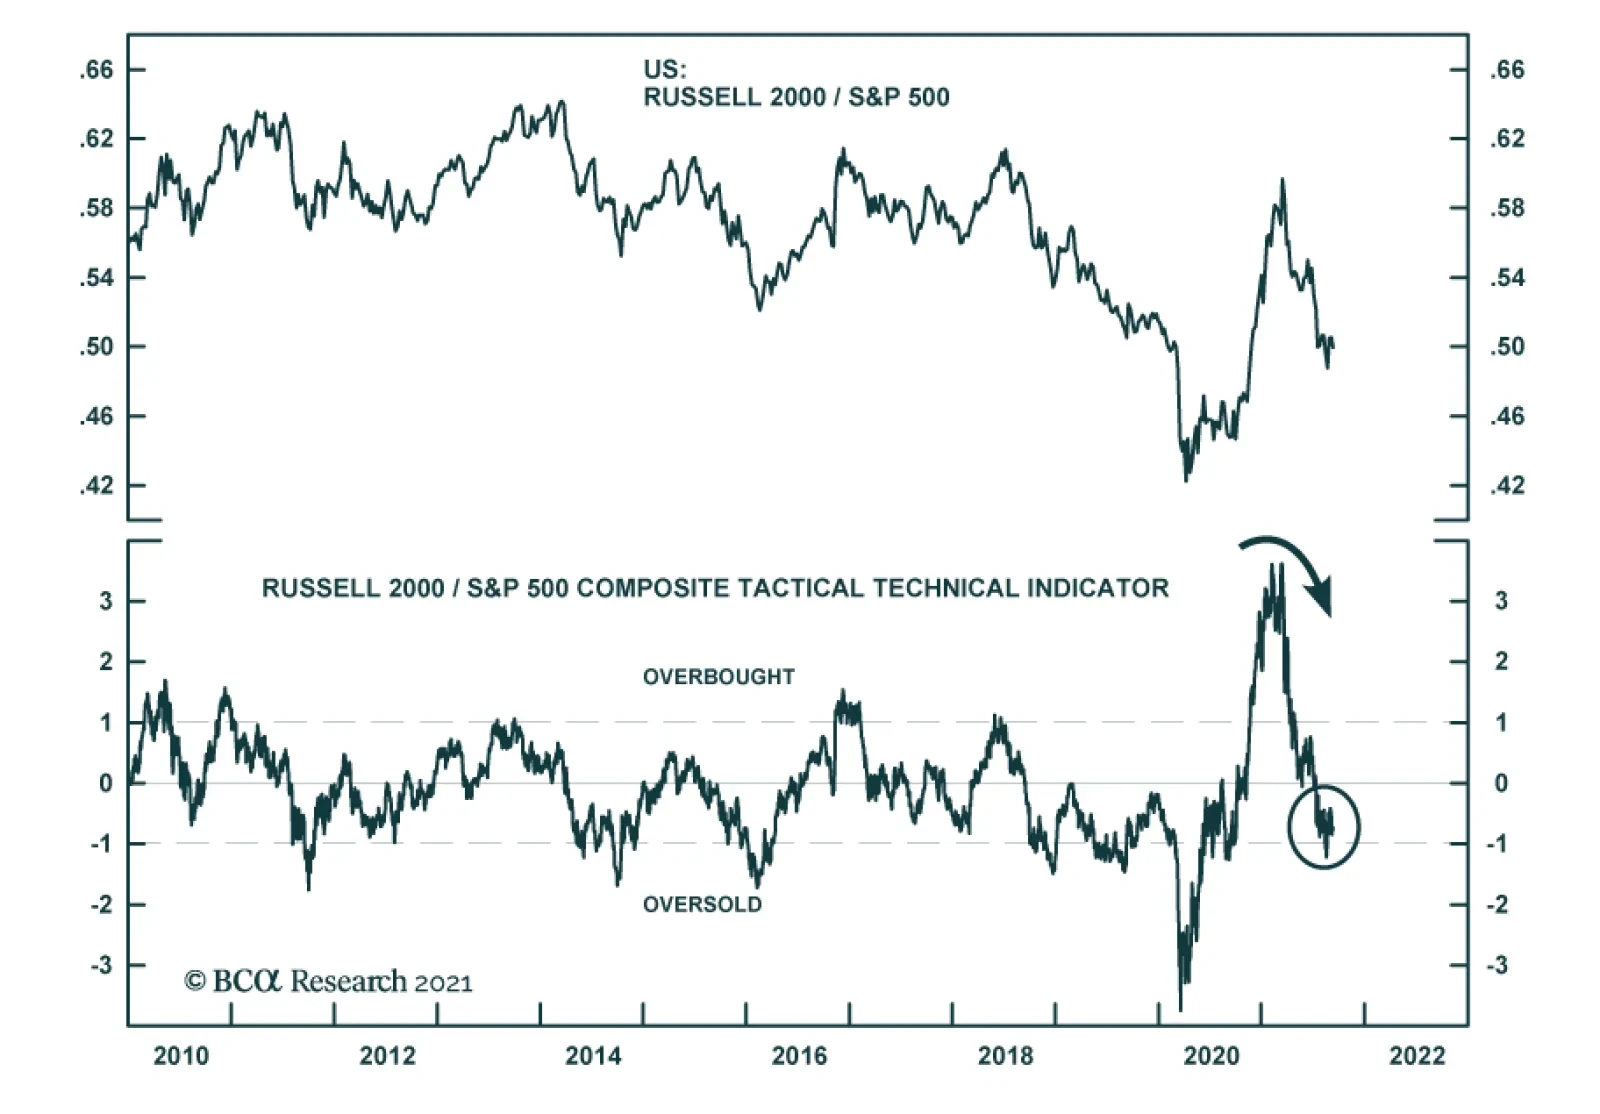
Several factors explain why US small caps have been underperforming their large cap peers since March. First, small caps benefit most early in the business cycle. This is in line with their performance following the initial COVID-19 shock last year after…