Equities
Although the S&P 500 ended its 5-day losing streak on Monday, a common narrative remains that US equities are primed for a pullback. Slowing economic growth, pandemic-related uncertainty, the likelihood that the Fed will soon begin tapering asset…

Over the weekend, North Korean state media reported that Pyongyang successfully tested two new long-range cruise missiles. The range attributed to these missiles gives North Korea the ability to target US military bases in South Korea and Japan. The test…

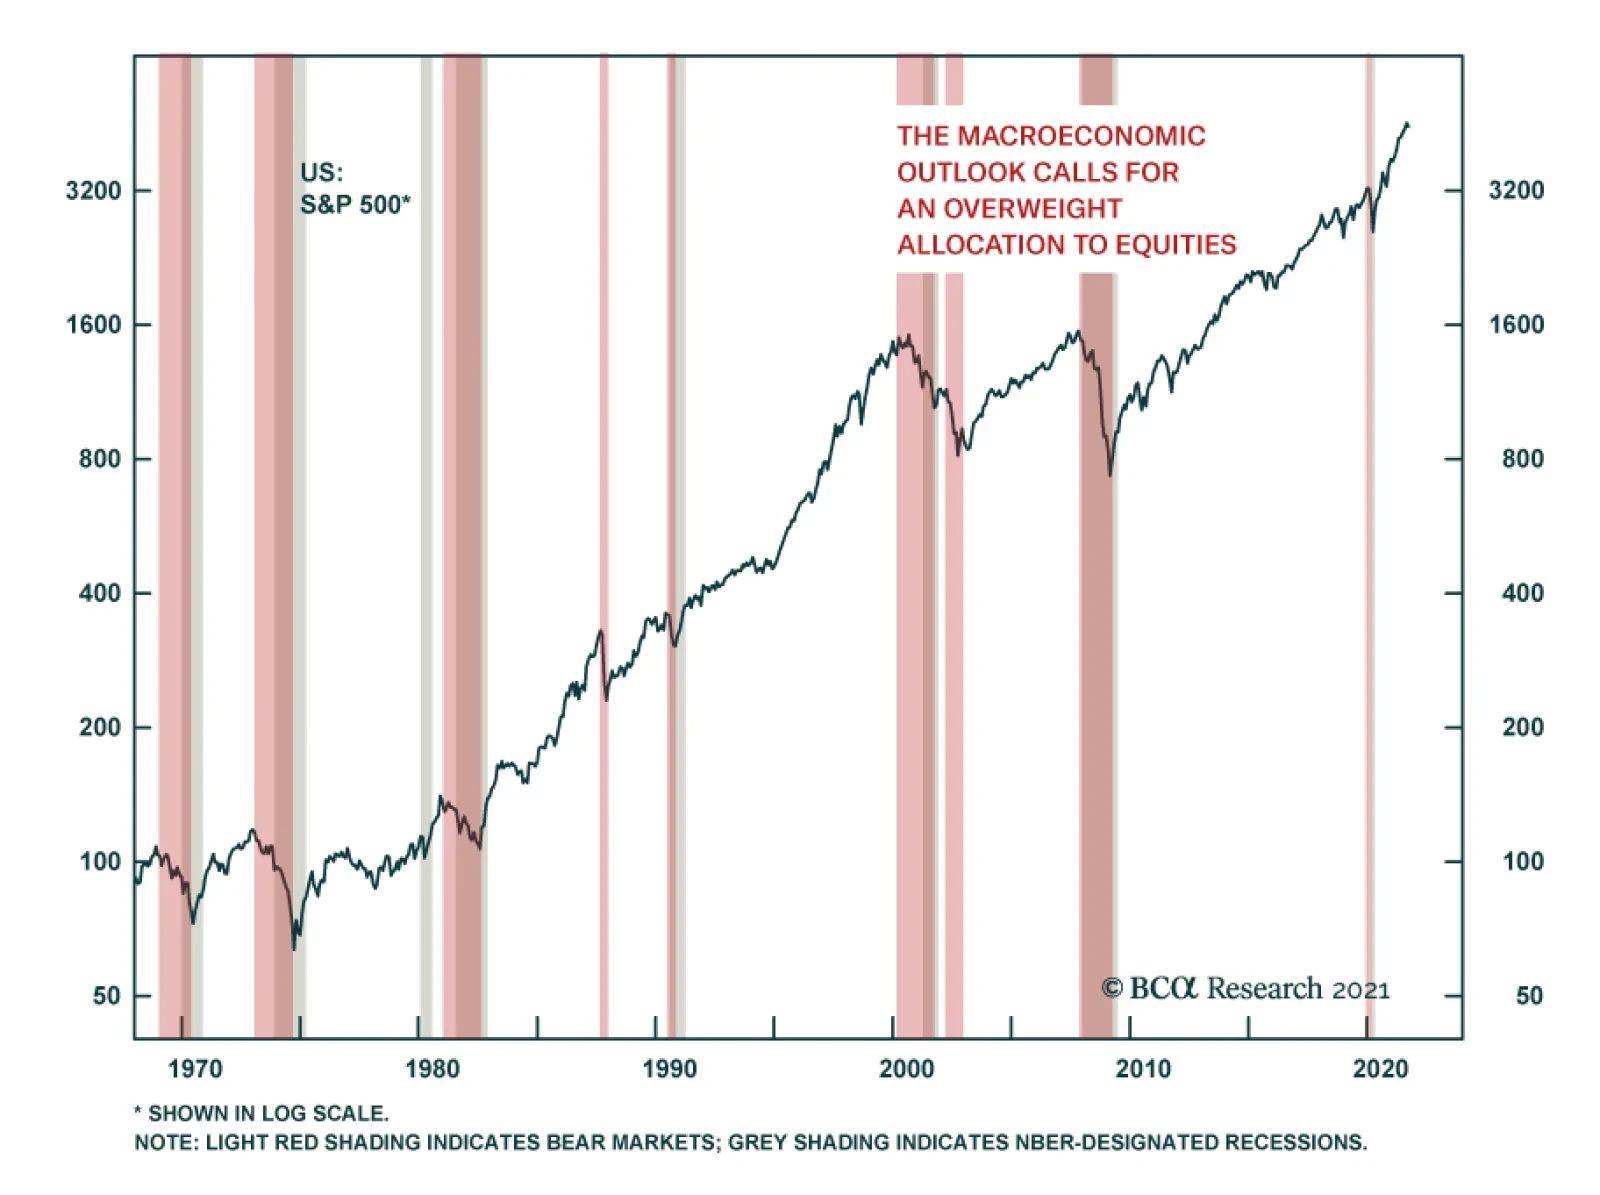
Highlights Economy – A partial undoing of 2017’s Tax Cuts and Jobs Act is in the works as Congress takes up the Biden Administration’s infrastructure agenda: A modest increase in the marginal corporate tax rate to help fund infrastructure investment is being discussed on Capitol Hill. We do not expect the ultimate agreement will meaningfully impact output. Markets – Equities appear to have taken little note of the tax-hike debate, and there are worries that investors are being overly complacent about the potential implications: Earnings estimates do not seem to reflect the impact of higher taxes on companies’ bottom lines. Based on the proposals that are reportedly being discussed, however, we think the impact on S&P 500 earnings will be modest. Strategy – A tax hike alone does not justify broad asset allocation shifts, though adjusting positions within equity portfolios could have promise: The effects from a marginal rate increase will be felt most strongly at the individual stock level, based on differences in effective tax rates. Feature We have shown that bear markets (light red shading) and recessions (gray shading) tend to coincide, while stocks generally march higher during economic expansions (Chart 1). We have also shown that the S&P 500 performs considerably better when monetary policy is easy (the fed funds rate is below our estimate of equilibrium) than when it is tight (fed funds exceeds our equilibrium estimate). While an investor could do a lot worse than mechanically tie his/her equity positioning to the state of the business cycle and/or the monetary policy cycle, it is not easy to recognize the onset of a recession in real time or accurately assess the equilibrium fed funds rate. We are confident, however, that a recession will not occur in time to sour the twelve-month outlook unless a vaccine-resistant strain of COVID emerges and that monetary policy is at least a couple years from turning restrictive. Chart 1Bear Markets Coincide With Recessions
Bear Markets Coincide With Recessions
Bear Markets Coincide With Recessions
There is more to asset allocation than monetary policy settings and the state of the business cycle, but they currently call for a default equity overweight in multi-asset portfolios. Per our process, an investor must have a very good reason for overriding that default. A blow to earnings from a corporate tax hike that has not been discounted could provide that reason, especially when valuations are extremely elevated. Although it is difficult to know exactly what markets are discounting at any given moment, it seems clear that equity analysts have not put a great deal of effort into estimating the impact of a tax hike on the earnings of the companies in their coverage universe. The good news is that our base-case scenario suggests that the tax changes most likely to make it through Congress will deal the bull a glancing blow rather than a knockout punch. We estimate that a statutory increase in the corporate tax rate from 21% to 25% would clip S&P 500 earnings by about 5%. Against a backdrop of unusually conservative four-quarter earnings expectations, the lagged effects of extraordinarily accommodative monetary and fiscal support, and a paucity of alternatives, the equity bull market appears to be capable of weathering a modest tax hike. The Gap Between Marginal And Effective Tax Rates The byzantine nature of the United States tax code creates myriad opportunities for the spectrum of companies subject to its provisions. Tailored tax advice is a thriving cottage industry that employs hundreds of thousands of well-paid accountants, attorneys and specialists in structuring transactions to minimize clients’ outlays. The upshot of the various incentives embedded in the code is that the marginal tax rate – the tax owed on an additional dollar of earnings – may diverge from the effective tax rate – the share of an entity's aggregate earnings that are paid in taxes. Based on the relative favoritism the code bestows upon a particular activity, or the disparate way it treats domestic and foreign operations, effective tax rates can vary widely at the industry level. Of the 392 S&P 500 constituents that owed income tax in their last full year of operations, 60% had an all-in effective tax rate that fell below the 21% statutory federal rate.1 After allowing for state and local income tax levies, the distribution of effective rates shows that a considerable majority of companies manage to pay less than the marginal rate (Chart 2A). The potential for reducing the effective rate is directly related to a company’s size (presumably because the biggest companies are most likely to have multinational activities): the 30 largest tax-paying constituents, accounting for over one-half of the index's tax-paying market-cap, were even more adept at staying below the all-in marginal rate (Chart 2B). Chart 2AS&P 500 Constituents Pay Less Than The Stated Tax Rate ...
Will Higher Corporate Taxes Spell The End Of The Bull Market?
Will Higher Corporate Taxes Spell The End Of The Bull Market?
Chart 2B... Especially If They're Mega-Caps
Will Higher Corporate Taxes Spell The End Of The Bull Market?
Will Higher Corporate Taxes Spell The End Of The Bull Market?
If every S&P 500 constituent’s effective tax rate equaled the marginal tax rate, an increase to 25% from 21% would result in a 5.1% decrease in S&P 500 earnings, as net income would fall from 79 cents of every dollar of pre-tax income to 75 cents. The income decline would be permanent, assuming no further tax-rate changes, and would merit an equivalent decline in the index. Changes in long-run fundamental prospects are not reflected instantaneously in stock prices, however, and it is uncertain just when the market would account for it. There are additionally some near-term buffers to declines in forward four-quarter estimates that might mask any drag from a tax hike. If A Long-Term Tree Falls, Will It Make A Sound? The future is unknowable, but we have at least a puncher’s chance of anticipating what’s to come over short segments like a quarter or a year. The ecosystem of publicly held companies largely operates within that one-to-four-quarter timeframe: companies report quarterly results, as do asset managers, and nearly everyone professionally involved with public equities is subject to compensation structures with annual performance incentives. A share of stock may entitle its owner to a proportional share of earnings in perpetuity, but the next four quarters loom large in the market’s calculus, even to the point of obscuring nearly everything that may come after them. It follows, then, that surprises affecting the outlook for the next year may muffle the market’s reaction to tax negotiations on Capitol Hill. We repeat that consensus analyst expectations for the coming four quarters are modest relative to history and the current macroeconomic backdrop. Now that the second quarter is in the books, analysts are calling for a slight earnings retrenchment, with earnings falling nearly 7% in the third quarter before rising 4% and 1% in the next two quarters, respectively, to settle in the first quarter of 2022 at a level 2% below the quarter just ended. They are not projected to top last quarter’s high-water mark until the second quarter of 2022 (Table 1). Table 1A Low Bar
Will Higher Corporate Taxes Spell The End Of The Bull Market?
Will Higher Corporate Taxes Spell The End Of The Bull Market?
It is possible that earnings will grow that slowly – the pandemic is not over, corporate profit margins may narrow if companies are unable to raise prices enough to cover their rising input costs, fiscal support for the economy is waning, and financial conditions may tighten as the Fed dials back monetary accommodation at the margin – but it would be unlikely on two counts. First, it would counter the empirical record. Earnings have tended to grow, quarter-on-quarter, during expansions (Chart 3). Chart 3That's Why They're Called Expansions
That's Why They're Called Expansions
That's Why They're Called Expansions
Second, it would fly in the face of the red-hot macroeconomic backdrop. The lagged effects of extraordinarily accommodative monetary and fiscal policy settings have real US GDP poised to grow at a pace well above its long-run potential trend through the end of 2022. The equity market is indifferent to quarterly GDP releases, which come out every 63 trading days with a one-month lag and are subject to two revisions that arrive after 21-session intervals, but trailing four-quarter GDP is highly correlated with trailing four-quarter sales (Chart 4, top) and earnings per share (Chart 4, bottom). We of course prefer forward-looking models to backward-looking data but the persistence of economic cycles, especially as they have lengthened across the postwar era, confers some useful predictive properties on trailing data. Chart 4GDP Growth Influences Revenue And Earnings Growth
GDP Growth Influences Revenue And Earnings Growth
GDP Growth Influences Revenue And Earnings Growth
Earnings are a function of revenues (units times price per unit) and margins (per-unit profitability) and robust GDP growth would seem to be tied only loosely to the latter. Over the last three decades, however, growth in S&P 500 earnings per share has been as correlated with GDP growth as growth in revenue per share. Margins are already elevated (Chart 5) and rising cost pressures threaten to squeeze them unless companies can pass on costs to their customers, but the volume pickup embedded in potent real GDP growth will mitigate some of the downward pressure. Chart 5Elevated For Longer?
Elevated For Longer?
Elevated For Longer?
We will have to wait and see how much pricing power companies have, as it will probably take several months before a clear picture begins to emerge. If they can make price hikes stick, margins will hold up, earnings will keep rising and the S&P 500 should power through the meager year-end 2021 and 2022 targets offered by a panel of buy- and sell-side strategists in last week’s Barron’s. We think it is plausible that households, flush with found money from pandemic fiscal transfers and/or financial and housing market appreciation, may prove to be relatively price-insensitive until they work down their windfalls. Vibrant demand could push companies to increase capacity, boosting hiring and capex, stoking more demand in a self-reinforcing post-pandemic honeymoon. The boom would not go on forever, but such a scenario would yield more upside for financial markets and the economy than the increasingly wary consensus projects. Revisiting Lower Fifth Avenue’s Retail Corridor To landlords’ chagrin, businesses’ real estate costs are a source of margin relief. We returned to lower Fifth Avenue to update our retail rental survey and found that little changed between Memorial Day and Labor Day. Two storefronts that were vacant at the end of May have since been rented by pandemic winners Tonal (interactive home gyms) and Hoka (high-performance running shoes), filling two corner locations in the northern half of the corridor (Figure 1). Four storefronts that were occupied by apparel retailers on our last tour – Gap, Gap Kids and Gap Body, and Rigby & Peller, a specialty purveyor of lingerie and swimwear – are vacant now (Figure 2). The net two-store decline has reduced the retail occupancy rate on Fifth Avenue between 14th Street and 23rd Street to 60% from 63%. Figure 1Fifth Avenue Storefronts, 19th Street To 23rd Street
Will Higher Corporate Taxes Spell The End Of The Bull Market?
Will Higher Corporate Taxes Spell The End Of The Bull Market?
Figure 2Fifth Avenue Storefronts, 14th Street To 19th Street
Will Higher Corporate Taxes Spell The End Of The Bull Market?
Will Higher Corporate Taxes Spell The End Of The Bull Market?
According to the Real Estate Board of New York (REBNY), average and median asking rents along the corridor have fallen by 3% and 21%, respectively, since Fall 2020. The excess of storefront supply over demand is a modest inflation corrective in an economy in which the partial release of pent-up demand has exceeded the uneven restoration of supply across several categories. REBNY’s semi-annual rental research survey left no doubt that retail tenants have the upper hand in Gotham and we’d suspect that office tenants do as well. The current market offers tenants ample availability and reduced leasing costs. Some firms recently capitalized on the conditions[,] … includ[ing] [upscale British furniture] retailer … Timothy Oulton [which leased over 7,000 square feet of space across three levels at 20th and Broadway, a block east of Fifth Avenue]. Additionally, an array of smaller service-oriented retailers such as dry cleaners, dance studios and barber shops are locking in favorable terms or shifting to better locations.2 Investment Implications The investment implications of the equity market’s seeming nonchalance regarding looming corporate tax hikes will probably be most keenly felt at the sector, sub-industry or individual stock level. Though we do not see meaningful asset allocation consequences, the disparity in effective tax rates at the sector level (Table 2) hints at disparities across sub-industries and individual stocks. With input from equity analysts, it should be possible to assemble baskets of stocks based on their sensitivity to a higher marginal income tax rate. Table 2One Size Does Not Fit All
Will Higher Corporate Taxes Spell The End Of The Bull Market?
Will Higher Corporate Taxes Spell The End Of The Bull Market?
As Barron’s September 6th Fall Investment Outlook feature highlighted, buy-side CIOs and sell-side strategists have adopted a measured tone. Year-end 2021 S&P 500 targets hover around the index’s current level and top-down 2022 projections offer no more than grudging upside. Tightening margins are a leading fundamental concern, along with rising inflation pressures, and elevated valuations contribute to the sense of unease. A chorus of “This won’t end well” intonations suggests that stocks may have a wall of worry to scale before the spoilsport consensus can claim validation. Regarding inflation concerns, asset allocators should bear in mind that stocks are an inflation hedge relative to cash and bonds. They should also recognize that high inflation does not derail equities; tight monetary policy in response to high inflation, which involves higher interest rates as part of a deliberate effort to throttle an overheating economy, derails equities. Investors conditioned to a predictably rapid Fed response may view this as a distinction without a difference. Per our house view that the fed funds liftoff date is over a year away and the sustained series of rate hikes required to tighten policy is well more than another year out, however, TINA's influence may become even more pronounced before this bull market ends. We remain vigilant, but we think it is too early to head for cover. Doug Peta, CFA Chief US Investment Strategist dougp@bcaresearch.com Footnotes 1 The term “all-in” recognizes that US corporations uniformly incur tax liabilities at the state level in addition to their federal obligations. The average marginal 2021 state income tax rate is 6.6%. 2 REBNY_Manhattan_Retail_Spring_2021.pdf
BCA Research’s European Investment Strategy & Geopolitical Strategy services conclude that German stocks are a bargain. During the past 5 months, the German MSCI index has underperformed the rest of the Eurozone by 6.2%. The poor performance of German…
Highlights Stocks tend to perform worse when unemployment is low. Since 1950, the S&P 500 has risen at an annualized pace of 12% when the unemployment rate was above its historic average compared to 6% when the unemployment rate was below its average. Three reasons help explain this relationship: 1) The unemployment rate has historically been mean-reverting; 2) Low unemployment often leads to monetary tightening; and 3) Valuations are usually more stretched when unemployment is low. In the spring of 2020, stocks benefited from what turned out to be a very auspicious environment: A steady decline in the unemployment rate from very high levels, assisted by a massive dose of monetary and fiscal stimulus. Today, the situation is less clear-cut. The labor market has improved dramatically, while both monetary and fiscal policy are turning less accommodative. Nevertheless, the Fed is unlikely to hike rates for at least 12 months, and it will take much longer than that for monetary policy to turn restrictive. This suggests that we are still in the middle-to-late stages of a business cycle expansion that began following the Great Recession (and was only briefly interrupted by the pandemic). Historically, cyclical stocks have done well during this phase of the business cycle. To the extent that cyclicals are overrepresented in overseas indices, investors should favor non-US stock markets. Non-US stocks also trade at a substantial valuation discount to their US peers. A Surprising Relationship One of the best pieces of advice I received when I was starting my research career was to get to the punchline as soon as possible. As a strategist, you are not writing a detective novel where the answers are shrouded in mystery until the very end. You are providing conclusions to readers with supporting evidence. Chart 1Stocks Do Best When Unemployment Is High
Is Low Unemployment Good Or Bad For Stocks?
Is Low Unemployment Good Or Bad For Stocks?
With that in mind, let me answer the question posed in the title of this report: Is low unemployment good or bad for stocks? As Chart 1 shows, the answer is bad. The interesting issues are why it is bad and what this may mean for investors today. There are three key reasons why low unemployment has typically corresponded with paltry equity returns: The unemployment rate has historically been mean-reverting: Low unemployment is often followed by high unemployment. And, when the unemployment rate starts rising, it keeps rising. There has never been a case in the post-war era where the unemployment rate has risen by more than one-third of a percentage point without a recession occurring (Chart 2). Chart 2When Unemployment Starts Rising, It Usually Keeps Rising
When Unemployment Starts Rising, It Usually Keeps Rising
When Unemployment Starts Rising, It Usually Keeps Rising
Low unemployment often leads to monetary tightening: An economy can only grow at an above-trend pace if there is labor market slack. Once the slack runs out, growth is liable to weaken as supply-side constraints kick in. Worse yet, labor market overheating has historically prompted central banks to raise rates (Chart 3). Higher rates in the context of slowing growth is toxic for stocks. Valuations are usually more stretched when unemployment is low: During the post-war period, the S&P 500 has traded at an average Shiller P/E ratio of 22.5 when the unemployment rate was below its historic average compared to 16.3 when the unemployment rate was above its average. Implications For The Present Day Stocks fare best when unemployment is high but falling. In contrast, stocks fare the worst when unemployment is low and rising (Chart 4). My colleague Doug Peta, BCA’s Chief US Investment Strategist, reached a similar conclusion in his August report entitled Level Or Direction? Chart 3Low Unemployment Often Leads To Monetary Tightening
Low Unemployment Often Leads To Monetary Tightening
Low Unemployment Often Leads To Monetary Tightening
Chart 4Stocks Do Best When Unemployment Is Falling From High Levels
Is Low Unemployment Good Or Bad For Stocks?
Is Low Unemployment Good Or Bad For Stocks?
In the spring of 2020, stocks benefited from what turned out to be a very auspicious environment: A steady decline in the unemployment rate from very high levels, assisted by a massive dose of monetary and fiscal stimulus. Controversially at the time, this led us to argue that the pandemic could lead to much higher stock prices. Chart 5There Is Still Slack
There Is Still Slack
There Is Still Slack
Today, the situation is less clear-cut. On the one hand, the unemployment rate has fallen dramatically, while monetary and fiscal policy are turning less accommodative. This week, the ECB reduced the pace of net asset purchases under the PEPP. The Fed will start paring back asset purchases by the end of this year. Governments are also withdrawing fiscal policy support. In the US, emergency federal unemployment benefits expired, somewhat ironically, on Labor Day. On the other hand, the unemployment rate in most economies is still above pre-pandemic levels. In the US, the unemployment rate for prime-age workers is 1.7 percentage points higher than in February 2020, while the employment-to-population ratio is 2.4 points lower (Chart 5). The presence of labor market slack ensures that policy support will be withdrawn only gradually. Granted, core CPI inflation in the US is running above 4%. Standard Taylor Rule equations suggest that the Fed funds rate should be well above zero (Chart 6). That said, these equations use realized inflation, which may be misleading given that both market participants and Fed officials expect inflation to fall rapidly (Chart 7). Indeed, the widely followed 5-year/5-year forward TIPS breakeven rate is below the Fed’s comfort zone (Chart 8).1 With long-term inflation expectations still subdued, there is no urgency for the Fed to sound more hawkish. Chart 6What Rate Does The Taylor Rule Prescribe?
Is Low Unemployment Good Or Bad For Stocks?
Is Low Unemployment Good Or Bad For Stocks?
Chart 7Investors Expect Inflation To Fall Rapidly From Current Levels
Is Low Unemployment Good Or Bad For Stocks?
Is Low Unemployment Good Or Bad For Stocks?
Chart 8Long-Term Inflation Expectations Are Muted
Long-Term Inflation Expectations Are Muted
Long-Term Inflation Expectations Are Muted
Cyclical Stocks Usually Do Best In The Latter Innings Of The Business Cycle Expansion Monetary policy is unlikely to become restrictive in any major economy during the next 18 months, which should allow global growth to remain at an above-trend pace. Hence, it is too early to turn bearish on stocks. Nevertheless, given that the unemployment rate in most countries is closer to a trough than to a peak, it is reasonable to conclude that we are somewhere in the middle-to-late stages of a business cycle expansion that began following the Great Recession (and was only briefly interrupted by the pandemic). As Chart 9 shows, cyclical equity sectors, such as industrials, energy, and materials, typically do best in the latter innings of business cycle expansions. Such was the environment that prevailed in 2005-08, and such will be the environment that prevails over the coming quarters as the unemployment rate falls further, capital spending increases, and commodity prices rise further. Chart 9The Business Cycle And Equity Sectors
Is Low Unemployment Good Or Bad For Stocks?
Is Low Unemployment Good Or Bad For Stocks?
Increased government infrastructure spending should help cyclical sectors. The US Congress is set to pass a 10-year $500 billion package. The EU’s €750 billion Next Generation fund is finally up and running. Chinese local government infrastructure spending is poised to accelerate over the remainder of the year. Chart 10The Dollar Is A Countercyclical Currency
The Dollar Is A Countercyclical Currency
The Dollar Is A Countercyclical Currency
Chart 11Past Another Covid Wave
Is Low Unemployment Good Or Bad For Stocks?
Is Low Unemployment Good Or Bad For Stocks?
A weaker US dollar should also buoy cyclical stocks (Chart 10). As a countercyclical currency, the greenback usually weakens when global growth is strong. A cresting in the Delta variant wave should help jumpstart global growth over the coming months (Chart 11). Meanwhile, interest rate differentials have moved sharply against the US dollar, while the US trade deficit has widened noticeably (Charts 12A & B). Chart 12AInterest Rate Differentials Have Moved Against The Dollar
Interest Rate Differentials Have Moved Against The Dollar
Interest Rate Differentials Have Moved Against The Dollar
Chart 12BThe US Trade Deficit Has Widened Noticeably
The US Trade Deficit Has Widened Noticeably
The US Trade Deficit Has Widened Noticeably
Cyclical sectors are overrepresented outside the US (Table 1). Although not a classically cyclical sector, financials are also overrepresented in overseas indices. BCA’s global fixed-income strategists recommend a moderately underweight duration stance. As bond yields rise, bank shares should outperform (Chart 13). In contrast, tech stocks often lag in a rising yield environment. Table 1Cyclicals Are Overrepresented Outside The US
Is Low Unemployment Good Or Bad For Stocks?
Is Low Unemployment Good Or Bad For Stocks?
Chart 13Higher Rates: A Boon For Banks And A Bane For Tech
Higher Rates: A Boon For Banks And A Bane For Tech
Higher Rates: A Boon For Banks And A Bane For Tech
How Expensive Are Stocks? A high Shiller P/E predicts low future returns (Chart 14). Today, the Shiller P/E stands at 37 in the US. This is consistent with an expected 10-year total real return of close to zero for the S&P 500. Thus, the long-term outlook for US stocks is poor. We stress the words “long term.” As the bottom panel of Chart 14 shows, no matter what the starting point of valuations is, the average return over short-term horizons is very low relative to realized volatility. This is another way of saying that valuations provide a great deal of information about the long-term outlook for stocks, but little information about their near-term direction. Over horizons of about 12 months, the business cycle drives the stock market, as a simple comparison between purchasing manager indices and stock returns illustrates (Chart 15). Chart 14Valuation Is The Single Best Predictor Of Long-Term Equity Returns
Is Low Unemployment Good Or Bad For Stocks?
Is Low Unemployment Good Or Bad For Stocks?
Chart 15AThe Business Cycle Drives Cyclical Swings In Stocks
The Business Cycle Drives Cyclical Swings In Stocks
The Business Cycle Drives Cyclical Swings In Stocks
Chart 15BThe Business Cycle Drives Cyclical Swings In Stocks
The Business Cycle Drives Cyclical Swings In Stocks
The Business Cycle Drives Cyclical Swings In Stocks
Outside the US, the Shiller P/E stands at 20. In emerging markets, it is only 16 (Chart 16). This is significantly below US levels, implying that the long-term prospect for equities is much more attractive abroad. Thus, both medium-term cyclical factors and long-term valuation considerations favor non-US stocks. Peter Berezin Chief Global Strategist pberezin@bcaresearch.com Chart 16US Stocks Are Pricey
US Stocks Are Pricey
US Stocks Are Pricey
Footnotes 1 The Federal Reserve targets an average inflation rate of 2% for the personal consumption expenditures (PCE) index. The TIPS breakeven is based on the CPI index. Due to compositional differences between the two indices, CPI inflation has historically averaged 30-to-50 basis points higher than PCE inflation. This is why the Fed effectively targets a CPI inflation rate of about 2.3%-to-2.5%. Global Investment Strategy View Matrix
Is Low Unemployment Good Or Bad For Stocks?
Is Low Unemployment Good Or Bad For Stocks?
Special Trade Recommendations
Is Low Unemployment Good Or Bad For Stocks?
Is Low Unemployment Good Or Bad For Stocks?
Current MacroQuant Model Scores
Is Low Unemployment Good Or Bad For Stocks?
Is Low Unemployment Good Or Bad For Stocks?
Highlights Germany’s election on September 26 is more of an opportunity than a risk for global investors. Coalition formation will prolong uncertainty but the key takeaway is that early or aggressive fiscal tightening is off the table for Germany … and hence the EU. Germany’s left wing is surprising to the upside as predicted, but it is the Social Democrats rather than the Greens who have momentum in the polls. This is a market-positive development. A coalition of only left-wing parties is entirely possible, but there is a 65% chance that the Christian Democrats (or Free Democrats) will take part in the next coalition to get a majority government. This would constrain business unfriendly outcomes. The German economy is likely to slow for the remainder of 2021, but the outlook for 2022 remains bright as the current headwinds facing the country will dissipate, especially if the risk of an aggressive fiscal drag is low. The underperformance of German equities relative to their Eurozone counterparts is long in the tooth. A combination of valuation, earnings momentum and technical factors suggests that German stocks will beat their peers next year. German equities will also outperform Bunds, which offer particularly unattractive prospective returns. Feature Germany’s federal election will be held on September 26. Our forecast that the left wing will surprise to the upside remains on track, albeit with the Social Democrats rather than the Greens surging to the forefront of opinion polls (Chart 1). However, the precise composition of the next government is very much in the air. Chart 1German Election: Social Democrats Take The Lead
German Election: Social Democrats Take The Lead
German Election: Social Democrats Take The Lead
Our quantitative German election model – which we introduce in this special report – predicts that the ruling Christian Democratic Union will outperform their current 21% standing in opinion polls, winning as much as 33% of the popular vote. Subjectively, this seems like an overestimation, but it goes to show that outgoing Chancellor Angela Merkel’s popularity, a historically strong voting base, and the economic recovery will help the party pare its losses this year. This finding, combined with the strong momentum for the Social Democrats, suggests that the election outcome will not be decisive. Germany will end up with either a grand coalition that includes Merkel’s Christian Democrats or a left-wing coalition that lacks a majority in parliament.1 Investors should note that none of the election outcomes are hugely disruptive to domestic or foreign policy. The status quo is unexciting but not market-negative, while a surprise left-wing victory would mean more reflation in the short run but a roll back of some pro-business policies in the long run. More broadly Germany has established a national consensus that rests on European integration, looser fiscal policy, renewable energy, and qualified engagement with autocratic powers like Russia and China. The chief takeaway is that fiscal policy will not be tightened too soon – and could be loosened substantially. Germany’s Fiscal Question Outgoing Chancellor Angela Merkel is stepping down after ruling Germany since 2005. The Christian Democratic Union, and its Bavarian sister party the Christian Social Union, together form the “Union” that is hard to beat in German elections, having occupied the chancellor’s office for 57 out of 72 years. However, both the Christian Democrats and the Social Democrats, their main rivals, have been shedding popular vote share since 1990, as other parties like the Greens, Free Democrats, the Left, and Alternative for Germany have gained traction (Table 1). Table 1Germany: Traditional Parties Lose Vote Share Over Time
German Election: Winds Of Change
German Election: Winds Of Change
The Great Recession and European sovereign debt crisis ushered in a new geopolitical and macroeconomic context that Merkel reluctantly helped Germany and the EU navigate. Germany’s clashes with the European periphery ultimately resulted in deeper EU integration, in accordance with Germany’s grand strategy and Merkel’s own strategy. But just as the euro crisis receded, a series of shocks elsewhere threatened to upend Germany’s position as one of the biggest economic winners of the post-Cold War world. The sluggish aftermath of the financial crisis, the Russian invasion of Crimea, the Syrian refugee crisis, the Brexit referendum, and President Trump’s election in the US sparked a retreat from globalization, a direct threat to an export-oriented manufacturing economy like Germany. In the 2017 election the Union lost 13.4 percentage points compared to the 2013 election. Minor parties have gradually gained ground since then. However, through a coalition with the Social Democrats, Merkel and her party managed to retain control of the government. This grand coalition eased the country’s fiscal belt in response to the trade war and global slowdown in 2019, signaling Germany’s own shift away from fiscal austerity. Then COVID-19 struck, prompting a much larger fiscal expansion to tide over the economy amid social lockdowns. Germany was not the largest EU member in terms of fiscal stimulus but nor was it the smallest (Chart 2). It joined with France to negotiate a mutual debt plan to rescue the broader EU economy and deepen integration. Chart 2Germany’s Fiscal Stimulus Ranks In The Middle Of Major Countries
German Election: Winds Of Change
German Election: Winds Of Change
Germany’s pro-EU perspective has been reinforced by Brexit and is not on the ballot in 2021. Immigration and terrorism have temporarily subsided as voter concerns. The focus of the 2021 election is how to get through the pandemic and rebuild the German economy for the future. For investors the chief question is whether conservatives will have enough sway in the next government to try to semi-normalize policy and consolidate budgets in the coming years, or whether a left-wing coalition will take charge, expanding on Germany’s proactive fiscal turn. The latter has consequences for broader EU fiscal normalization as well since Germany is traditionally the prime enforcer of deficit limits. The latest opinion polls point to more proactive fiscal policy. The country’s left-leaning ideological bloc has taken the lead (Chart 3A) and the Social Democratic leader Olaf Scholz has sprung into first place among the chancellor candidates (Chart 3B). Chart 3AGermany: Voting Intentions Favor Left-Leaning Parties
Germany: Voting Intentions Favor Left-Leaning Parties
Germany: Voting Intentions Favor Left-Leaning Parties
Chart 3BSocial Democrats Likely To Take Chancellery
German Election: Winds Of Change
German Election: Winds Of Change
Scholz has served as finance minister and is the face of the country’s recent fiscal stimulus efforts. Public opinion is clearly rewarding him for this stance as well as his party, which was previously in the doldrums.2 The Social Democrats and Greens are calling for more fiscal expansion as well as wage hikes and tax hikes (wealth redistribution) in pursuit of social equality and a greener economy (Table 2). If the Christian Democrats retain a significant role in the future coalition, these initiatives will be blunted – not to say halted entirely. But if the left parties put together a ruling coalition without the Christian Democrats, then they will be able to launch more ambitious tax-and-spend policies. Opinion polls show that voters still slightly favor coalitions that include the Christian Democrats, although momentum has shifted sharply in favor of a left-wing coalition (Chart 4). Table 2German Party Platforms
German Election: Winds Of Change
German Election: Winds Of Change
Chart 4Voters Evenly Split On Whether Next Coalition Should Include CDU
German Election: Winds Of Change
German Election: Winds Of Change
This shift is what we forecast in previous reports but now the question is whether the left-wing parties can actually win enough seats to put together a majority coalition. That is a tall order. Our quantitative election model suggests that the Christian Democrats, having suffered a long overdue downgrade in expectations, will not utterly collapse when the final vote is tallied. While we do not expect them to retain the chancellorship, momentum will have to shift even further in the opposition’s favor over the next two weeks to produce a majority coalition that excludes the Union. Our Quantitative German Election Model Our model is based off the work of Norpoth and Geschwend, who created a simple linear model to predict the vote share that incumbent governing parties or coalitions will obtain in impending elections.3 Their model utilizes three explanatory variables and has a sample size of 18 previous elections, covering elections from 1953 to 2017. Our model updates their original work to make estimates for the 2021 election. Unlike our US Political Strategy Presidential Model, which makes use of both political and economic explanatory variables in real time, our German election model makes predictions based solely on historical political variables, all of which display a high degree of correlation with popular vote share. We will look at economic factors that may affect the election later in this report. The Three Explanatory Variables 1. Chancellor Approval Rating: This variable captures the short-term support rate of the incumbent chancellor. A positive relationship exists between chancellor approval and vote share: higher approval equates to higher vote share for the incumbent party. Merkel’s approval stands at 64% today which is a boon for the otherwise beleaguered Christian Democrats (Chart 5). Chart 5Merkel's Coattails A Boon But Not Enough To Save Her Party
Merkel's Coattails A Boon But Not Enough To Save Her Party
Merkel's Coattails A Boon But Not Enough To Save Her Party
2. Long-term partisanship: This variable shows the long-term support rate of voters for specific parties or coalitions in past elections. It is measured as the average vote share of the incumbent party over the past three elections. A positive relationship with vote share exists here too: higher historical partisanship equates to a higher share of votes in forthcoming elections, and vice versa. This variable clearly gives a boost to the Christian Democrats – although it could overrate them based on past performance, as occurred in 2017 when they underperformed the model’s prediction.4 3. “Time For Change”: This is a categorical variable measured by how many terms the parties or coalition have held office leading into an election. This variable has a negative relationship with vote share outcomes. The longer an incumbent party or coalition holds office, the less vote share they will receive. Effectively, our model punishes parties that hold office for long periods of time. In this case that would be the long-ruling Christian Democrats. Model Estimation And Results Our model is estimated by the following simple equation: Popular Vote Share = constant + ßChancellor Approval Rating + ßLong-Term Partisanship + ßTime For Change Estimating the above model for the 2021 election predicts that the Union will win 32.7% of the vote share (Table 3). If this prediction came true, it would suggest that the ruling party performed almost exactly the same as in 2017. In other words, the party’s strong voter base combined with Merkel’s long coattails are expected to shore up the party. This flies in opinion polling, however, so we think the model is overestimating the Christian Democrats. Table 3Our German Election Quant Model Says CDU Will Not Collapse
German Election: Winds Of Change
German Election: Winds Of Change
Note that even if the Union performs this well, it still will not win enough seats to govern on its own. Potential Union-led coalitions are shown in Table 3, excluding the Social Democrats (see below). For a majority government, a coalition with the Free Democrats and the Greens would need to be formed. This coalition would equate to 53% of the vote share. Otherwise, to obtain a majority, the Union would have to team up with the Social Democrats, which is today’s status quo. We can use the same methodology to predict the vote share for the Social Democrats. We use the support rate of Social Democratic chancellor-candidate Olaf Scholz and calculate the long-term partisanship variable using past Social Democratic vote shares. In this case our model predicts that the Social Democrats will win 22.1% of the vote. If this result were to come true, it would not be enough for the party to govern own its own. Potential Social Democratic-led coalitions are shown in Table 4. The best coalition would be with the Greens and either the Left or the Free Democrats. But in this case the Social Democrats cannot form a government with a vote share above 50%, unless it pairs up with the Christian Democrats. Table 4Our German Election Quant Model Says SPD Has Not Yet Won It All
German Election: Winds Of Change
German Election: Winds Of Change
In other words, either the left-wing parties must build on their current momentum and outperform their historical record in the final election tally, or they will need to form a coalition with the Christian Democrats. This kind of left-wing surge is precisely what we have predicted. But the model helps put into perspective how difficult it will be for the left-leaning parties to get a majority. Scholz is single-handedly trying to overcome the long downtrend of the Social Democrats. His party is rising at the expense of the Greens, and the Left, which puts a lid on the total left-wing coalition size. If these three parties all beat the model and slightly surpass their top vote share in recent memory (SPD at 26%, Greens at 11%, and the Left at 12%), they still only have 49% of the vote. While our model is reliant on historical political data, it is a robust predictor for past election results (Chart 6). The average vote share error between the predicted and realized outcomes over from 1953 to 2013 is 1.7 percentage points. The problem with relying on the model is that the Christian Democrats have broken down from their long-term trend in opinion polls. And while Merkel’s approval is strong, she is no longer on the ballot and her hand-picked successor, Armin Laschet, is floundering in the polls (see Chart 3B above). Chart 6Our German Election Quant Model Has Solid Track Record, But Merkel’s High Approval Rating Caused Overestimate In 2017 And May Do So In 2021
German Election: Winds Of Change
German Election: Winds Of Change
In short, the model is probably overrating the Union but it is also calling attention to the extreme difficulty of the left-wing parties forming a majority coalition. Scholz may have to form a coalition with the Free Democrats or pursue another grand coalition. And if the Social Democrats fail to get the largest vote share, German President Frank-Walter Steinmeier may ask Armin Laschet to try to form a government first. Still, Scholz is the most likely chancellor when all is said and done. Election Model Takeaway Our German election model predicts that the Union will receive 32.9% of the popular vote, while the Social Democrats will receive 22.1%. At the same time, the left-leaning parties, specifically the Social Democrats, clearly have the momentum. Therefore the model may be overrating the incumbent party. But it still calls attention to a high level of uncertainty, the likelihood of a messy election outcome, and a tricky period of coalition formation. The Social Democrats will have to pull off a major surprise, outperforming both history and our model, to lead a majority government without the Christian Democrats.5 We still think this is possible. But we will stick with our earlier subjective probabilities: 65% odds that the Christian Democrats take part in the next coalition, 35% odds that they do not. Bottom Line: The chancellorship will go to the Social Democrats but the coalition will constrain the business unfriendly aspects of their agenda. This is positive for Germany’s corporate earnings outlook. Macro Outlook: A Temporary Economic Dip Our election model does not account for the economic backdrop and hence ignores the “pocketbook voter.” Germany is recovering from the pandemic, which is marginally supportive for an otherwise faltering ruling party. However, the economic data is only good enough to suggest that the Union will not utterly collapse. A rise in unemployment, inflation, and the combination of the two (the “Misery Index”) is a tell-tale sign that the incumbent party will suffer a substantial defeat (Chart 7). However the German economy’s loss of momentum is temporary. Growth will re-accelerate in early 2022. The timing is politically inconvenient for the ruling party but positive news for investors. German economic confidence is deteriorating. The Ifo Business Climate survey has rolled over, lowered by a meaningful decline in the Expectations Survey. Additionally, consumer confidence is turning south, despite already being low (Chart 8). Chart 7Spike In German Misery Index A Tell-Tale Sign Of Poor Election For Incumbent Party
Spike In German Misery Index A Tell-Tale Sign Of Poor Election For Incumbent Party
Spike In German Misery Index A Tell-Tale Sign Of Poor Election For Incumbent Party
Chart 8Deteriorating German Confidence
Deteriorating German Confidence
Deteriorating German Confidence
A combination of factors weighs on German confidence: First, global supply chain bottlenecks are hurting growth. The automotive industry, which is paralyzed by a global chip shortage, accounts for about 20% of industrial production, and its output is once again declining after a sharp but short-lived rebound last year (Chart 9). Similarly, inventories of finished goods are collapsing, which is hurting growth today (Chart 9, second panel). Second, the Delta variant of COVID-19 is causing a spike in infections. The rise in cases prevents containment measures from easing as much as expected, while it also hurts the willingness of households to go out and spend their funds (Chart 9, third panel). Third, German real wages are weak. Negotiated wages are only growing at a 1.7% annual rate, and wages and salaries are expanding at 2.1% annually. Meanwhile, German headline CPI runs at 3.9%. The declining purchasing power of German households accentuates their current malaise. Three crucial forces counterbalance these negatives: First, German house prices are growing at a 9.4% annual rate, which is creating a potent, positive wealth effect (Chart 10). Chart 9Germany's Headwinds
Germany's Headwinds
Germany's Headwinds
Chart 10A Strong Wealth Effect
A Strong Wealth Effect
A Strong Wealth Effect
Second, German household credit remains robust. According to the Bundesbank, the strength in household credit mostly reflects the strong demand for mortgages. Historically, a healthy housing sector is an excellent leading indicator of economic vigor. Third, the Chinese credit impulse is too depressed for Beijing’s political security. The recent decline in the credit impulse to -2.4% of GDP reflects a policy decision in the fall of 2020 to trim down the credit expansion. As a result, Chinese economic growth is slowing. For example, both the Caixin Manufacturing and Services PMIs stand below 50, at post-pandemic lows of 49.2 and 46.7, respectively. In July authorities became uncomfortable and cut the Reserve Requirement Ratio as well as interbank rates to free liquidity and stabilize the economy. A boom is not forthcoming, but the drag on global activity will ebb by next year. Including the headwinds and tailwinds to the economy, German activity will slow down for the remainder of the year before improving anew in 2022. Our election case outlined above – that the conservatives will lose the chancellorship and either be excluded from power or greatly diminished in the Bundestag – means that fiscal policy will not be tightened abruptly and will not create a material risk to this outlook. Chart 11Vaccines Work
Vaccines Work
Vaccines Work
Many of the headwinds will dissipate. The Delta-wave of COVID-19 will diminish. Already, Germany’s R0 is tentatively peaking, which normally precedes a drop in daily new cases. Moreover, Germany’s vaccination campaign is progressing, which limits the impact of the current wave on hospitalization and intensive care-unit usage (Chart 11). Inflation will peak in Germany, which will salvage real wages. As European Investment Strategy wrote last Monday,6 European inflation remains concentrated in sectors linked to commodity prices or directly affected by bottlenecks. Instead, trimmed-mean CPI is muted (Chart 12), which implies that underlying inflationary pressures are small, especially as wage gains are still well contained. Moreover, the one-off impact of the end of the German VAT rebate will also pass. Finally, a stabilization and eventual revival of the Chinese credit impulse will put a floor under German exports, industrial production, and capex (Chart 13). For now, the previous decline in the Chinese credit impulse is consistent with slower German output growth for the remainder of 2021. However, next year, the German industrial sector will start to feel the effect of the current efforts to improve Chinese liquidity conditions. Chart 12Narrow European Inflation
Narrow European Inflation
Narrow European Inflation
Bottom Line: The German economy is set to deteriorate for the remainder of 2021. However, as the current wave of COVID-19 infections ebbs, real wages recover, and China’s credit impulse stabilizes, Germany’s economic activity will re-accelerate in 2022, especially if the upcoming election does not generate a meaningful fiscal shock. We do not think it will. Chart 13China: From Headwinds To Tailwind?
China: From Headwinds To Tailwind?
China: From Headwinds To Tailwind?
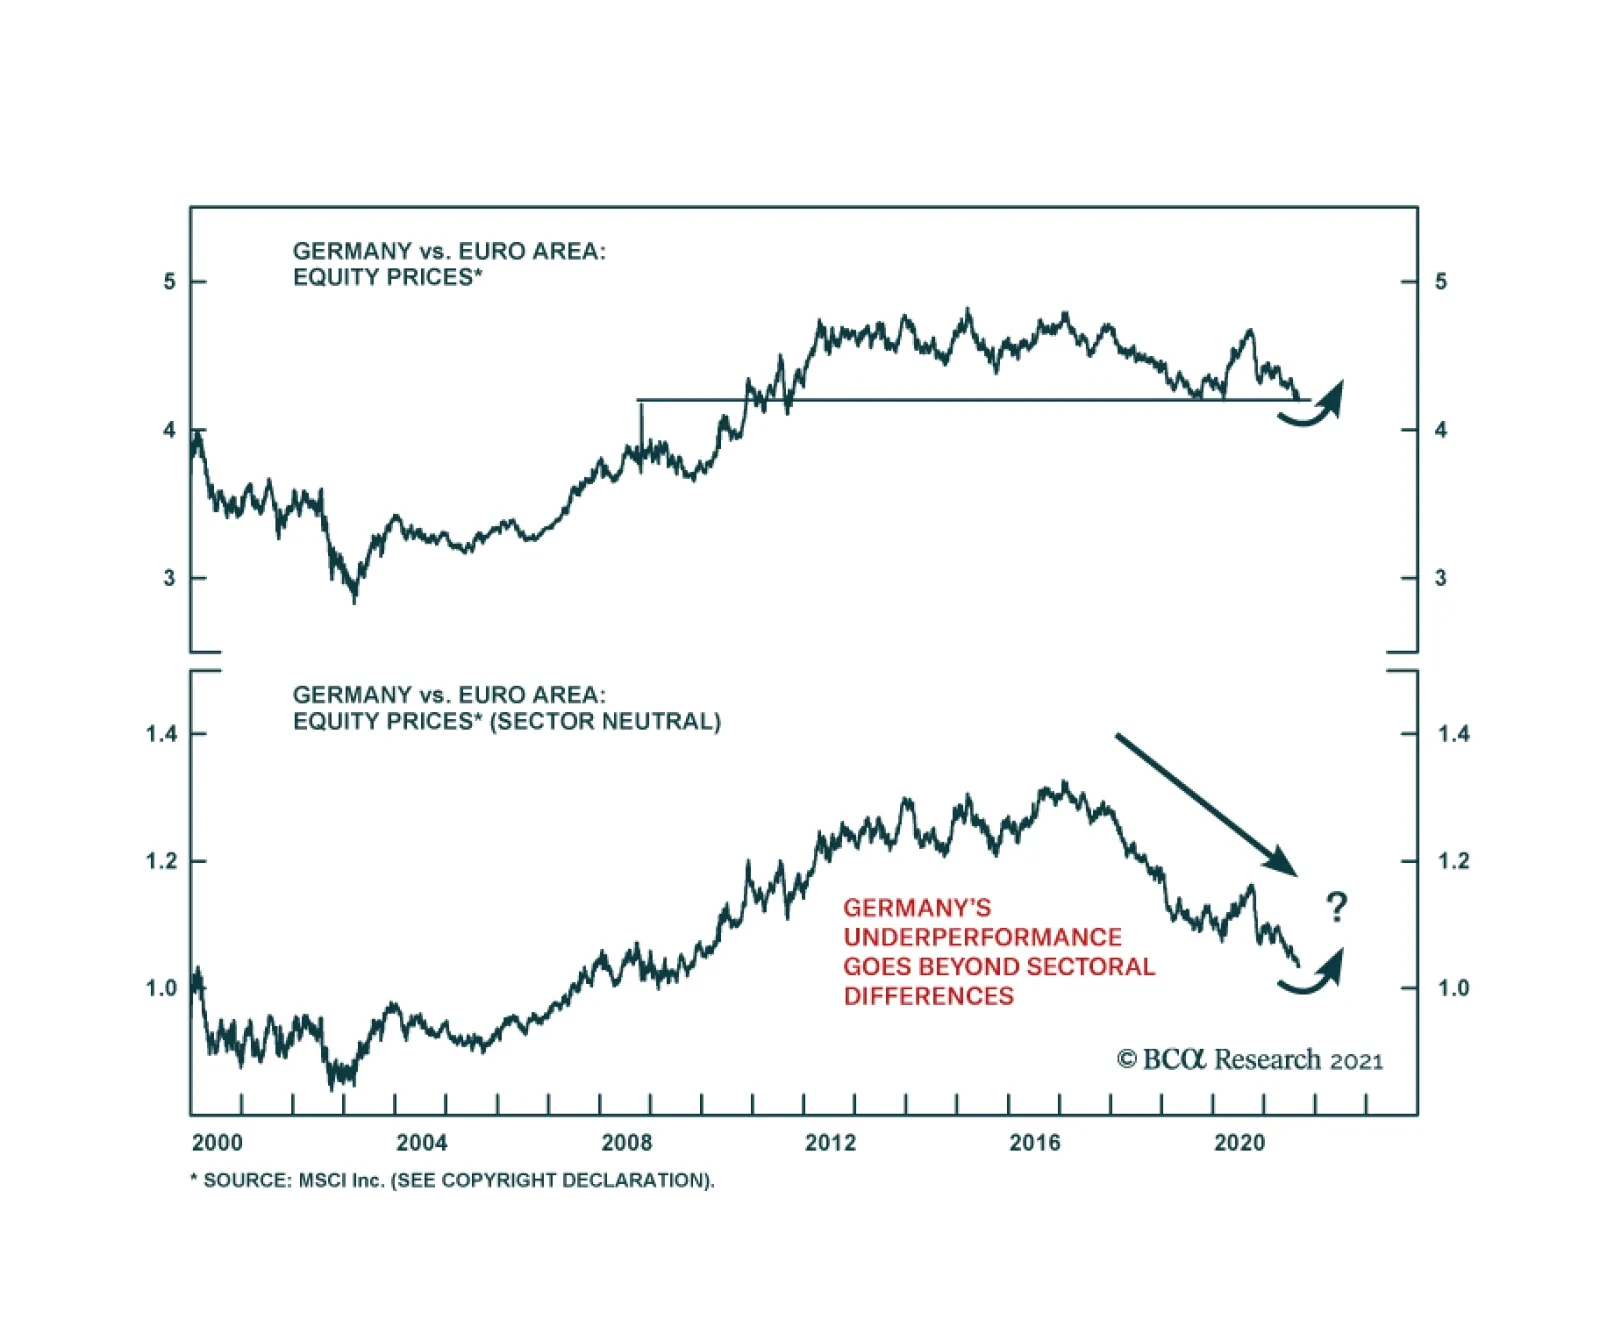
Market Implications: German Stocks To Shine German equities are set to outperform their European counterparts and will significantly beat Bunds over the coming 18 months. During the past 5 months, the German MSCI index has underperformed the rest of the Eurozone by 6.2%. The poor performance of German equities is worse than meets the eye. If we adjust for sectoral differences by building equal sector-weight indexes, Germany has underperformed the Euro Area by 22% since early 2017 (Chart 14). Chart 14Not Delivering The Goods
Not Delivering The Goods
Not Delivering The Goods
This underperformance is long in the tooth and should reverse because of four important dynamics. First, German equities are cheap relative to the European benchmark. As Chart 15 highlights, the relative performance of German stock prices has lagged that of profits. This underperformance is also true once we account for the different sectoral composition of the German market. As a result, Germany is cheap on a forward price-to-earnings, price-to-sales, and price-to-book basis versus the Euro Area. Additionally, analysts embed significantly lower long-term and one-year expected growth rates of earnings in Germany than in the rest of the Eurozone, which depresses the German PEG ratios. Second, German operating metrics do not justify the valuation discount of German equities. The return on equity of German stocks stands at 11.39%, which is similar to that of the Euro Area. Profit margins are also comparable, at 5.91% and 5.74%, respectively. However, German firms utilize their capital more efficiently, and their asset turnover stands at 0.3 times compared to 0.2 times for the Eurozone average. Meanwhile, German non-financial firms are less indebted than their Eurozone competitors, which implies that Germany’s return on assets is greater than that of Europe at large (Chart 16). Chart 15Lagging Prices, Not Earnings
Lagging Prices, Not Earnings
Lagging Prices, Not Earnings
Chart 16Why The Discount?
Why The Discount?
Why The Discount?
Third, the drivers of earnings support a German outperformance. Over the past thirty years, commodity prices led the performance of German stocks relative to that of the rest of the Eurozone (Chart 17). While the near-term outlook for natural resource prices is muddy, BCA’s commodity strategists expect Brent prices to average more than $80/bbl in 2023 and industrial metals to outperform energy over the coming years.7 Additionally, German Services PMI are bottoming compared to that of the Eurozone. Over the past decade, this process preceded periods of outperformance by German stocks (Chart 18). Similarly, the collapse in the Chinese credit impulse relative to the robust domestic economic activity in Europe is well reflected in the underperformance of German shares. The Eurozone’s Service PMI is near all-time highs and unlikely to improve further; however, the Chinese credit impulse should recover in the coming quarters. This phenomenon will help German stocks (Chart 19). Chart 17Commodity Bulls Pull Germany
Commodity Bulls Pull Germany
Commodity Bulls Pull Germany
Chart 18German Vs European Activity Matters
German Vs European Activity Matters
German Vs European Activity Matters
Chart 19German Vs Chinese Activity Matters
German Vs Chinese Activity Matters
German Vs Chinese Activity Matters
The German MSCI index is also oversold. The 52-week rate of change of its performance compared to the rest of the Eurozone plunged to its lowest reading since the introduction of the euro in 1999 (Chart 20). Meanwhile, the 13-week rate of change remains low but has begun to improve (not shown). This combination usually heralds a forthcoming rebound in German relative performance. In relation to equities, German Bunds remain an unappealing investment. Based on historical experience, the current yield of -0.36% offered by German 10-year bonds condemns investors to negative returns over the next five years (Chart 21). Chart 20Oversold!
Oversold!
Oversold!
Chart 21Bounded Bunds' Returns
Bounded Bunds' Returns
Bounded Bunds' Returns
Even if realized inflation ebbs in Germany and Europe, inflation expectations remain low and an eventual return to full employment will force CPI swaps higher, especially if the ECB maintains easy monetary conditions and invites further risk-taking in the Eurozone. The global economic cycle will also move from a friend to a foe for Bunds. As Chart 22 illustrates, the recent deceleration in global export growth was consistent with the fresh uptick in the returns of German paper. However, if Chinese credit flows stabilize by year-end and reaccelerate in 2022 while supply-chain bottlenecks dissipate, global export growth will improve. This should hurt Bund prices, especially as the long-term terminal rate proxy embedded in the German curve remains too low. As a result, not only should Bunds underperform German equities, but the German yield curve will also steepen further relative to that of the US, where the Fed will lift the short-end of the curve faster than the ECB. Chart 22Economic Momentum And Bunds Prices
Economic Momentum And Bunds Prices
Economic Momentum And Bunds Prices
Bottom Line: The underperformance of German equities relative to those of the rest of the Eurozone is well advanced, which makes German stocks a bargain. The current deceleration in global and German growth will not extend beyond 2021, which suggests that German stocks prices should converge toward their earnings outperformance next year. Our political forecast suggests that the odds of an early or aggressive fiscal retrenchment are very low. Additionally, German equities will outperform Bunds, which offer particularly poor prospective returns. Matt Gertken Vice President Geopolitical Strategy mattg@bcaresearch.com Mathieu Savary Senior Vice President Mathieu@bcaresearch.com Guy Russell Research Analyst GuyR@bcaresearch.com Jingnan Liu Research Associate JingnanL@bcaresearch.com Footnotes 1 Note that minority governments are rare and have a bad reputation in Germany, partly as a result of the series of weak governments leading up to the 1932 election and Nazi rule. 2 In addition, while the center-left parties can work with the far-left in the Bundestag, the center-right parties cannot work with the far-right Alternative for Germany. Indeed the slightest imputation of a willingness to work with Alternative for Germany cost Merkel’s first pick for successor, Annegret Kramp-Karrenbauer, her job. 3 See: Norpoth, Helmut & Gschwend, Thomas (2010) The chancellor model: Forecasting German elections, International Journal of Forecasting. 26. 42-53. 4 Our model performs well in back-testing but 2017 was an outlier. It correctly predicted the Union to win the highest share of the popular vote but overestimated that vote by seven percentage points. Our only short-term variable, the chancellor’s approval rate, caused a deviation from long-term voting trends. Our other two variables capture medium and long-term effects, which clearly favored the Union. The implication is that Merkel’s high approval rating today could give a misleading impression about the Christian Democrats’ prospects. 5 If they are forced to rely on the Free Democrats instead, that will also constrain the most anti-business elements of their agenda. 6 Please see BCA Research European Investment Strategy Weekly Report, "The ECB Taper Dilemma", dated September 6, 2021, available at eis.bcareseach.com. 7 Please see BCA Research Commodity & Energy Strategy Weekly Report, "Permian Output Approaches Pre-Covid Peak", dated August 19, 2021, available at ces.bcareseach.com.

Weekly Performance Update For the week ending Thu Sep 09, 2021 The Market Monitor displays the trailing 1-quarter performance of strategies based around the BCA Score. For each region, we construct an equal-weighted, monthly rebalanced portfolio consisting of the top 3 stocks per sector and compare it with the regional benchmark. For each portfolio, we show the weekly performance of individual holdings in the Top Contributors/Detractors table. In addition, the Top Prospects table shows the holdings that currently have the highest BCA Score within the portfolio. For more details, click the region headers below to be redirected to the full historical backtest for the strategy. BCA US Portfolio
Market Monitor (Sep 9, 2021)
Market Monitor (Sep 9, 2021)
Total Weekly Return BCA US Portfolio S&P500 TRI -0.82% -0.95% Top Contributors MRNA:US ESGR:US GOLF:US IT:US CQP:US Weekly Return 43 bps 9 bps 8 bps 4 bps 2 bps Top Detractors CLH:US MMM:US SCCO:US SAFM:US UGI:US Weekly Return -14 bps -14 bps -11 bps -11 bps -10 bps Top Prospects BRK.A:US ESGR:US PFE:US TX:US SC:US BCA Score 96.87% 96.51% 96.24% 95.65% 95.55% BCA Canada Portfolio
Market Monitor (Sep 9, 2021)
Market Monitor (Sep 9, 2021)
Total Weekly Return BCA Canada Portfolio S&P/TSX TRI -0.56% -0.39% Top Contributors TOU:CA ELF:CA AND:CA CFP:CA L:CA Weekly Return 23 bps 19 bps 12 bps 12 bps 6 bps Top Detractors CS:CA PXT:CA TOY:CA CRON:CA LNF:CA Weekly Return -25 bps -17 bps -16 bps -15 bps -12 bps Top Prospects RUS:CA LNF:CA WIR.UN:CA CS:CA PXT:CA BCA Score 99.13% 98.53% 96.83% 95.17% 94.04% BCA UK Portfolio
Market Monitor (Sep 9, 2021)
Market Monitor (Sep 9, 2021)
Total Weekly Return BCA UK Portfolio FTSE 100 TRI -0.73% -1.93% Top Contributors NFC:GB VTC:GB AGRO:GB MXCT:GB NVTK:GB Weekly Return 18 bps 13 bps 12 bps 10 bps 9 bps Top Detractors INCH:GB CCH:GB SVST:GB GLTR:GB KETL:GB Weekly Return -19 bps -17 bps -13 bps -9 bps -9 bps Top Prospects SVST:GB BPCR:GB VVO:GB FDM:GB CKN:GB BCA Score 99.26% 97.45% 96.94% 96.41% 96.39% BCA Eurozone Portfolio
Market Monitor (Sep 9, 2021)
Market Monitor (Sep 9, 2021)
Total Weekly Return BCA EMU Portfolio MSCI EMU TRI -0.08% -1.23% Top Contributors BSL:DE HLAG:DE VETO:FR ALTA:FR SOLV:BE Weekly Return 37 bps 18 bps 10 bps 8 bps 4 bps Top Detractors SON:PT TUB:BE BEKB:BE CAF:FR ALB:ES Weekly Return -12 bps -11 bps -10 bps -10 bps -9 bps Top Prospects STR:AT LOG:ES HLAG:DE IPS:FR EDNR:IT BCA Score 99.25% 98.98% 97.88% 95.40% 94.66% BCA Japan Portfolio
Market Monitor (Sep 9, 2021)
Market Monitor (Sep 9, 2021)
Total Weekly Return BCA Japan Portfolio TOPIX TRI 2.19% 4.10% Top Contributors 9432:JP 4326:JP 4471:JP 7244:JP 9543:JP Weekly Return 20 bps 19 bps 15 bps 15 bps 15 bps Top Detractors 3290:JP 6960:JP 3468:JP 4966:JP 3459:JP Weekly Return -9 bps -4 bps -4 bps -3 bps -2 bps Top Prospects 6960:JP 4694:JP 9436:JP 4544:JP 9882:JP BCA Score 99.86% 99.00% 98.58% 98.48% 98.44% BCA Hong Kong Portfolio
Image
Total Weekly Return BCA Hong Kong Portfolio Hang Seng TRI 2.75% -1.33% Top Contributors 710:HK 2686:HK 6118:HK 1277:HK 836:HK Weekly Return 81 bps 70 bps 29 bps 25 bps 24 bps Top Detractors 1735:HK 2232:HK 590:HK 98:HK 182:HK Weekly Return -25 bps -16 bps -16 bps -12 bps -7 bps Top Prospects 1277:HK 98:HK 691:HK 6868:HK 435:HK BCA Score 100.00% 99.44% 99.15% 98.19% 97.91% BCA Australia Portfolio
Market Monitor (Sep 9, 2021)
Market Monitor (Sep 9, 2021)
Total Weekly Return BCA Australia Portfolio S&P/ASX All Ord. TRI -1.88% -1.22% Top Contributors CAJ:AU SOL:AU BSE:AU YAL:AU AST:AU Weekly Return 26 bps 19 bps 16 bps 7 bps 6 bps Top Detractors SWM:AU OCL:AU HSN:AU SGF:AU CDA:AU Weekly Return -30 bps -28 bps -27 bps -25 bps -21 bps Top Prospects GRR:AU SDG:AU PIC:AU PL8:AU BHP:AU BCA Score 99.73% 99.69% 99.57% 99.42% 99.03%
BCA Research's Emerging Market Strategy service concludes that the Indian bourse's structurally high premium relative to EM will likely continue. With a trailing P/E of 31, and P/Book of 3.9, there is no doubt that Indian stocks are expensive. In terms of…
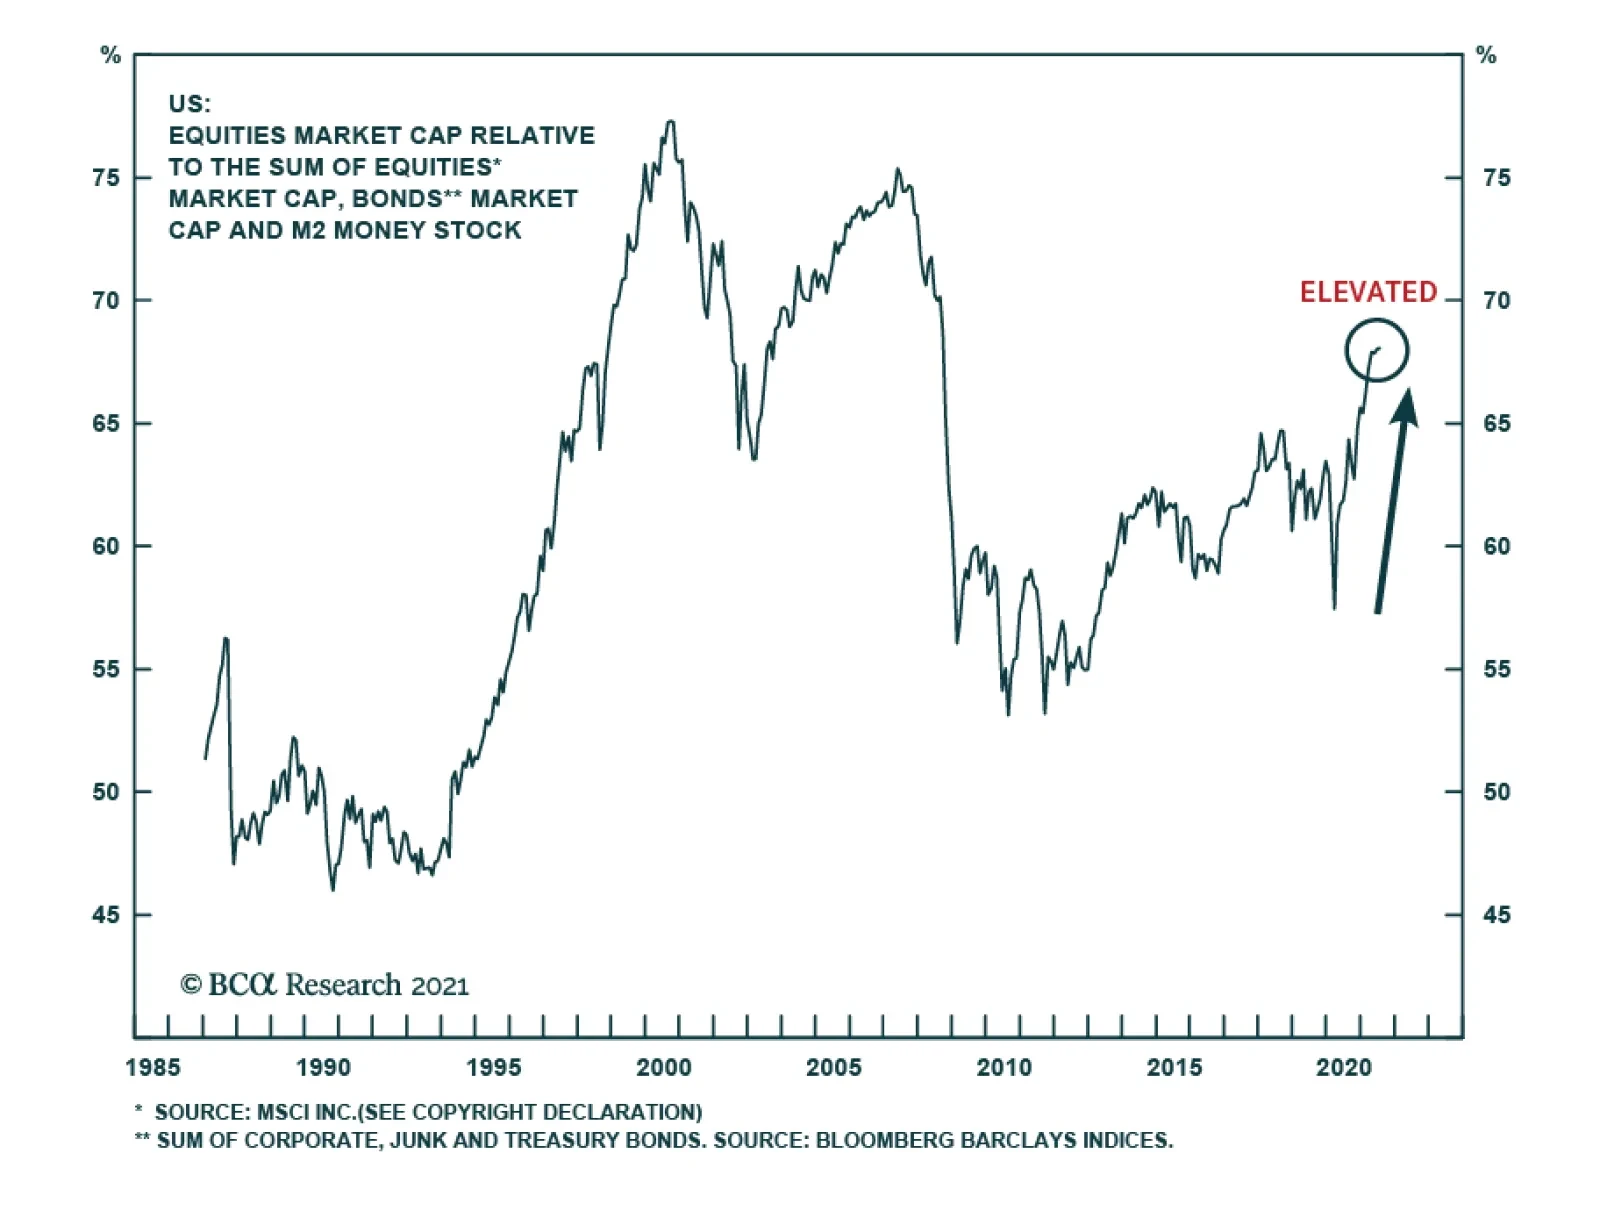
The share of market capitalization of equities within portfolios is elevated by historical standards. The threat now is that this elevated level could trigger a rebalancing of flows away from equities in favor of bonds, especially among institutional…
9 September 2021 at 10:00 EDT Emerging Markets Strategy/Webcast EM/China: See The Forest For The Trees 9 September 2021 at 21:00 EDT Emerging Markets Strategy/Webcast Emerging Asia: See The Forest For The Trees Highlights Structural inflation in India has abated noticeably since the mid-2010s. The cyclical inflation outlook is also benign (Chart 1). As such, the specter of inflation does not pose a material threat to this stock market. Indian stocks’ high valuation is a risk; yet this bourse’s structurally high premium relative to EM will likely continue as India’s earnings growth will stay strong and its volatility low. Investors should stay overweight Indian stocks in an EM equity portfolio, and local currency bonds in an EM domestic bond portfolio. Feature Chart 1India's Cyclical Inflation Outlook Is Benign
Can Inflation Upset The Indian Applecart?
Can Inflation Upset The Indian Applecart?
In a recent Emerging Markets Strategy report we showed that India stands out as the only country in Asia with rather high inflation. Indeed, core CPI in India, at about 6%, is higher than all other major EM and DM countries, save Turkey and Russia. The question is, with the economy re-opening, will Indian inflation rise further and thus derail the rally in Indian equities? Our research indicates that both the structural and cyclical inflation outlook for India remains benign. Our models for headline and core CPI both point to lower inflation in the coming months (Chart 1). As such, inflation is unlikely to pose any major threat to Indian assets in the foreseeable future. Investors should remain overweight Indian stocks in an EM equity portfolio. Fixed-income investors should also continue to overweight Indian local bonds in an EM domestic bond portfolio. Currency traders should favor the rupee versus its EM peers. Inflation Outlook: Structural … The first of the two principal drivers of India’s structural inflation trend is the country’s productivity. The stronger the productivity gains, the more contained has been its structural inflation. The second major driver is broad money supply. The higher the money growth, the steeper have been inflationary pressures – especially during those periods when productivity gains were timid. Top panel of Chart 2 shows that up until the early-2000s, India’s average productivity gains used to be rather low: of the order of 3% annually. That period was also marked by very strong broad money growth: at times, the latter would rise to 20% annually (Chart 2, bottom panel). This growth was due to chronically high fiscal deficits that were monetized, coupled with intermittent surges in bank credit. Chart 2Slower Money Supply Amid Decent Productivity Led To A Structural Decline In Inflation
Can Inflation Upset The Indian Applecart?
Can Inflation Upset The Indian Applecart?
The consequence of persistently low productivity gains amid strong money supply was structurally high inflation, with occasional flare-ups well into double digits (Chart 2). Chart 3Steady Fall In Budget Deficits In Post-GFC Era
Can Inflation Upset The Indian Applecart?
Can Inflation Upset The Indian Applecart?
From the early 2000s, however, that dynamic began to change. A surge in capital spending in infrastructure and other productive capacity propelled India’s productivity trend up by several notches. In the past 15 years, the productivity growth rate has averaged around 6% a year; even though more recently that rate has slowed. In the post-GFC period, both major sources of money creation were stymied. First, successive Indian governments, regardless of political affiliation, adopted a rather tight fiscal policy. They reined in fiscal outlays substantially. Non-interest expenditures of the central government fell from 14% of GDP in 2010 down to 9% by 2019, just before the pandemic (Chart 3, top panel). As a result, during that period, fiscal and primary deficits narrowed significantly: from almost 7% of GDP to 3%, and from almost 4% of GDP to nearly zero, respectively (Chart 3, bottom panel). In addition, a myriad of reasons1 caused commercial bank credit to decelerate materially – from as high as 30% before the GFC to a mere 6% by 2019. The upshot of all this was a secular decline in broad money growth. That eventually led India’s inflationary pressures to decline structurally since the mid-2010s (Chart 2, bottom panel, above). Going forward, those major drivers (both productivity and money growth) will warrant a benign inflation outlook. The country has been continuing its high capital spending for over a decade now (around 30% to 35% of GDP, a rate second only to China). This year, India’s capital spending has already revived. Other corroborating indicators such as imports of capital goods have also recovered robustly. This indicates a new capex cycle is unfolding. Therefore, odds are that the productivity growth rate will stay decent. Prudent fiscal policy, on the other hand, will keep the money growth in check. Chart 4Low Wages Will Help Keep Inflation Subdued
Can Inflation Upset The Indian Applecart?
Can Inflation Upset The Indian Applecart?
Finally, wage pressures in India will also stay muted. In rural areas, both farm and non-farm nominal wages have been growing at a very slow pace; and are now flirting with outright contraction (Chart 4, top panel). Industrial wage expectations have also been tepid over the past several years (Chart 4, bottom panel). The broader picture is unlikely to change in the future as tens of millions of young people continue to join the work force every year. Taken together, these factors point to subdued structural inflation ahead. … And Cyclical The chance that inflation in India will flare up over a cyclical horizon (12 months) is also low: First, one of the major cyclical drivers of inflation in India, the government’s food procurement prices (called Minimum Support Price or MSP) have stayed low for the past several years. The announced MSPs for some of the crops for the 2021-22 agriculture season (July-June) have also shown no marked increase. This will surely help keep the wholesale prices for food in check, which, in turn, will keep a lid on consumer inflation expectations and ultimately on both headline and core consumer inflation (Chart 5). Second, the country’s money growth is also unlikely to witness an immediate, major boom. While the budget deficit has swelled over the past year or so, odds are that the government will revert to the tighter fiscal stance that prevailed over the past decade – as soon as the pandemic is brought under control. Chart 6 shows that government non-interest spending leads core CPI. Reduced expenditure growth will cap inflation. Chart 5Low Food Prices Will Keep A Lid On Inflation Expectations
Can Inflation Upset The Indian Applecart?
Can Inflation Upset The Indian Applecart?
Chart 6Slowing Fiscal Spending Will Cap Core Inflation
Can Inflation Upset The Indian Applecart?
Can Inflation Upset The Indian Applecart?
Chart 7Fuel Price Inflation Is Set To Decelerate
Can Inflation Upset The Indian Applecart?
Can Inflation Upset The Indian Applecart?
The other contributor to money growth, bank credit, is expected to accelerate; but its expansion will not be rapid as banks are still suffering from elevated NPLs. Third, fuel price inflation has likely peaked in India. Last year authorities imposed substantial new taxes on local gasoline and diesel prices, which artificially raised consumer inflation (Chart 7). Since there is little chance of new fuel levies this year and given that crude prices are unlikely to rise much from the current levels (which is EMS’s view), fuel inflation will subside materially next year. And as fuel costs often eventually spill into core inflation, this deceleration will help check the latter as well. Finally, given the massive negative output gap that opened up in the economy during the pandemic-related lockdowns, it will take a while before the economy overheats again. Odds are therefore low that India’s inflation will accelerate much in the coming months. Notably, our cyclical inflation models for both headline and core CPI – built using the drivers discussed above – also vouch for a modest decline in inflation (Chart 1, on page 1). Does Inflation Hurt Stocks? Currently, the Indian economy is not plagued by any major excesses and therefore has no major macro vulnerability. The only potential vulnerability that the economy and stock markets face stem from any possible rise in inflation. Notably, the primary driver of Indian stocks is economic growth and corporate profits. Historically, inflation (CPI) in low- and mid-single digits did not hurt Indian stocks. However, once inflation approached a high-single digit mark (usually 8%), a sell-off in stocks typically occurred. Chart 8 shows that, during India’s high-inflation era (from 1994 to 2013), every time CPI breached the 8% mark (the dotted line in the chart), stocks fell in absolute USD terms, or at the minimum, were weak. Chart 8Indian Stocks Faced Major Headwinds When Headline CPI Approached 8%
Can Inflation Upset The Indian Applecart?
Can Inflation Upset The Indian Applecart?
Chart 9In Recent Years Inflation Has Ceased To Be A Headwind For Indian Stocks
Can Inflation Upset The Indian Applecart?
Can Inflation Upset The Indian Applecart?
Interestingly, the above correlations have changed dramatically since 2014. The top panel of Chart 9 shows that core CPI does not have any steady correlation with stock prices anymore. And core PPI, in fact, has developed a strong positive correlation with stocks (Chart 9, bottom panel) – in complete reversal of the dynamics that prevailed in the previous two decades. The adverse impact of inflation on stock prices is via multiple compression, as rising interest rates lead to equity de-rating. What’s notable is that the multiple compressions do not begin as soon as a rate hike cycle commences. Rather, it takes a meaningful rise in interest rates before it starts to hurt multiples (Chart 10). Given the above, one can expect a material multiple compression only if inflation rises a few notches above the central bank’s target (Chart 11). The odds of that happening now are low. Therefore, policy rates will remain lower for longer, and stock valuations will remain at a higher level than usual. Chart 10Interest Rates Usually Needed To Rise Several Points Before Stock Multiple Compression Began
Can Inflation Upset The Indian Applecart?
Can Inflation Upset The Indian Applecart?
Chart 11India's Inflation Remains Within RBI Target Bands
Can Inflation Upset The Indian Applecart?
Can Inflation Upset The Indian Applecart?
Incidentally, thanks to material rate cuts, real interest rates paid by Indian firms – deflated by both core producer and core consumer prices – have plummeted. Lower real rates benefit the borrowers (i.e., non-financial listed companies) (Chart 12). The bottom line is that, with India’s inflation now being both structurally low (by Indian history) and cyclically tame, it is unlikely to be a cause of any major equity sell-off. Are Indian Equity Valuations Justified? With a trailing P/E of 31, and P/Book of 3.9, there is no doubt that Indian stocks are expensive. Yet, part of the multiple expansion in India, like most other DM countries, has been a direct outcome of a sharply lower policy rate, as discussed above. Incidentally, if one were to look at the cyclically adjusted valuation measures (CAPE), Indian markets appear to be only moderately expensive (Chart 13, top panel). Chart 12Lower Real Rates Boost Firms' Profits And Warrant Higher Stock Prices
Can Inflation Upset The Indian Applecart?
Can Inflation Upset The Indian Applecart?
Chart 13Cyclically-Adjuted P/E Ratio
Can Inflation Upset The Indian Applecart?
Can Inflation Upset The Indian Applecart?
Chart 14Relative Equity Multiples: India vs. EM
Can Inflation Upset The Indian Applecart?
Can Inflation Upset The Indian Applecart?
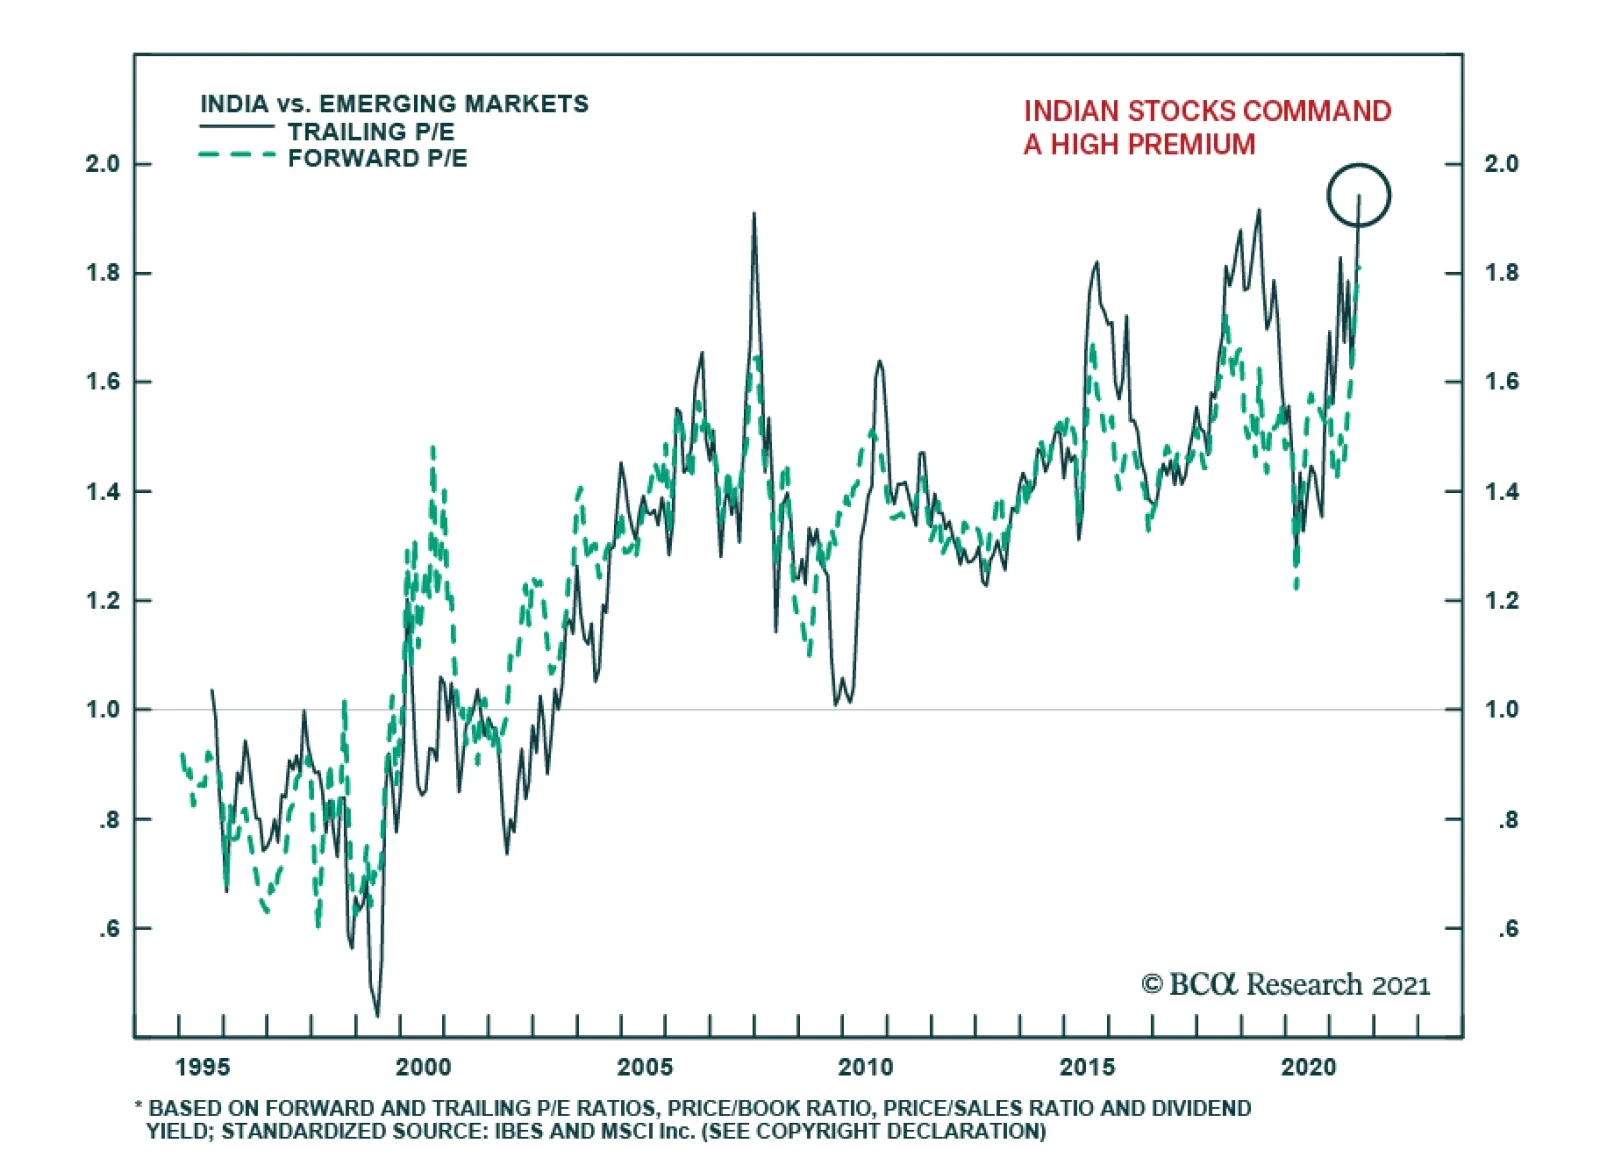
In terms of relative valuation vis-à-vis the rest of the EM, Indian stocks continue to command a high premium: around 90% in the case of P/E and P/Book multiples. (Chart 14). In terms of cyclically adjusted valuation (CAPE) relative to the EM, India also appears to be quite pricey (Chart 13, bottom panel). The bottom line is that Indian stocks are expensive; and that is a risk to this bourse. A pertinent question here is whether India still merits the structurally high premium that it has enjoyed over the years relative to its peers. Our answer is in the affirmative. One reason this bourse has continued to enjoy a high premium, especially since the mid-2000s, is because the growth of Indian corporate earnings has been superior to those of most other EM countries. But more importantly, the volatility of those earnings has been much lower than its peers. These strong, yet less volatile earnings are what investors have been willing to pay a premium for. Going forward, we see both traits remaining intact. Long-term growth in India will likely stay as one of the highest in the EM world. Earnings volatility is also unlikely to change anytime soon. The reason is, first, lower inflation going forward will entail relatively lower interest rate volatility, and therefore, lower business cycle / earnings volatility. Second, India’s currency volatility will also likely stay lower. Part of the reason is the near absence of foreign investors on government bonds in India. This has precluded India from suffering a major currency sell-off during global risk-off episodes – as few bond investors head for the exit. We discussed this and several other issues related to Indian bond markets and the rupee in much greater detail in our last report on India. Taken together, lower volatility in both local currency earnings and the exchange rate entails lower overall volatility for US dollar-denominated earnings. That will help Indian stocks’ premium to stay elevated beyond any short-term fluctuations. Inflation And The Rupee Chart 15The Rupee Strengthens When Relative Inflation In India Versus US Decelerates
Can Inflation Upset The Indian Applecart?
Can Inflation Upset The Indian Applecart?
The impact of inflation on the rupee is nuanced. It’s not the absolute level of India’s CPI or PPI that affects the rupee-dollar exchange rate; it’s the relative inflation between these two economies that does so. Chart 15 shows that the rupee usually strengthens versus the dollar when inflation in India falls relative to that of US (shown in inverted scale in the chart). These relative inflation dynamics could also provide insight into the exchange rate outlook. Chart 16 shows that the rupee is currently 10% cheaper when measured against what would be its “fair value” (Chart 16, bottom panel). The fair value has been derived from a regression analysis of the exchange rate on the manufacturers’ relative producer prices of the two countries. Investment Recommendations Indian stocks have decisively broken out both in absolute terms and relative to their EM counterparts (Chart 17). Notably, the outperformance is not just due to a sell-off in Chinese TMT stocks. It is even more impressive relative to the ‘mainstream EM’ bourses (i.e., EM excluding China, Taiwan and Korea). Given India’s relatively superior structural and cyclical backdrops, this outperformance should continue for a while (Chart 17, bottom two panels). Investors should stay overweight this bourse in an EM equity portfolio. Chart 16The Indian Rupee Is Now About 10% Below Its Fair Value Versus The US Dollar
Can Inflation Upset The Indian Applecart?
Can Inflation Upset The Indian Applecart?
Chart 17Indian Stocks' Breakout Is Decisive And The Relative Outperformance Is Broad-based
Can Inflation Upset The Indian Applecart?
Can Inflation Upset The Indian Applecart?
Chart 18Higher Carry And A Better Currency Outlook Will Lead To Indian Domestic Bonds' Outperformance
Can Inflation Upset The Indian Applecart?
Can Inflation Upset The Indian Applecart?
The medium-term outlook for the rupee is also positive. The currency is cheap and competitive –an added incentive for both foreign direct investors and portfolio investors. Finally, Indian domestic bonds offer value – both relative to their EM peers and the US treasuries. 10-year government bonds yields, at 6.2%, offer an enticing 480 basis points over similar duration US Treasuries. Given the sanguine rupee and inflation outlooks, Indian bonds will likely continue to outperform EM local bonds (Chart 18). Investors should stay on with our recommendation of overweighting India in an EM local currency bond portfolio. Rajeeb Pramanik Senior EM Strategist rajeeb.pramanik@bcaresearch.com Footnotes 1 The reasons include a surge in bank NPLs, lack of bankable projects, a kind of policy paralysis resulting in delay in various regulatory clearances for capital projects etc.