Equities
The US is leading the world in the post-pandemic economic recovery. US real GDP grew at an annualized quarter-on-quarter rate of 6.3% in Q1 while other major economies such as the eurozone and Japanese ones contracted. This growth differential has since…

Highlights Regulatory changes affecting Chinese platform companies are structural – rather than transitory – in nature. These companies might become quasi-SOEs and could be used by the government to achieve its national and geopolitical objectives. China’s regulatory clampdown will produce structurally lower corporate profitability and, thereby, reduce equity valuations for Chinese TMT companies. Chinese policymakers have begun easing monetary and fiscal policies. Money and credit growth will likely bottom in December or so. However, as in H2 2018 and H1 2019, policy will be eased only gradually. During this period EM ex-TMT stocks and industrial metal prices performed poorly. Mainstream EM (countries outside North Asia) will continue suffering from weak growth and rising political volatility, warranting a higher risk premium. The risk-reward tradeoff for EM financial markets is poor. Feature Over the past several days, I have held calls and roundtables with clients located in the EMEA region. In this report, we will share our answers to the most common client questions. Many clients were asking if the selloff in Chinese platform companies is nearing its end or whether much more weakness is to be expected. It is not surprising that with the Hang Seng Tech index down 35% from its February highs, there is great temptation to engage in bottom fishing. So, we start with questions relating to this topic. Chart 1Is This Time Different For Chinese TMT Stocks?
Is This Time Different For Chinese TMT Stocks?
Is This Time Different For Chinese TMT Stocks?
Question: In 2018, the regulatory clampdown on Tencent and other video game companies lasted several months and created a major pullback in their share prices (Chart 1). However, authorities ultimately removed restrictions and these stocks rallied to new highs. Do you expect the same dynamics to emerge this time around? And if not, why? We are witnessing a structural regime shift in the Chinese government’s approach toward platform companies. These changes are much more profound and long lasting than those in 2018. They herald structurally lower corporate profitability and equity multiples for Chinese TMT companies. For these stocks, a bounce from oversold levels is possible over the near term and it could be sharp. However, the rebound will be short-lived, i.e., a cyclical or secular rally is unlikely. Investors – who have not sold – should use this rebound to pare back exposure to Chinese TMT stocks. Chart 2Chinese SOEs: Lackluster Share Price Performance
Chinese SOEs: Lackluster Share Price Performance
Chinese SOEs: Lackluster Share Price Performance
Going forward, these platform companies will be managed in a similar fashion to Chinese state-owned enterprises (SOEs): with the interest of the entire nation in mind, and shareholder interests will take a back seat. China’s SOEs trade at very low multiples and their share prices have been treading water since 2009 (Chart 2). The secular bull market in Chinese TMT share prices is over and more de-rating is likely for the following reasons: Chinese platform/new economy companies possess unique big data that are important to the country’s development. Protecting big data becomes a priority in an era of US-China geopolitical confrontation and amid the elevated risk of cyber attacks. As a result, it is essential for the Chinese government to control companies that possesses big data. Limiting foreign shareholders’ access and decision making in regard to big data is also imperative. We do not believe that Chinese authorities will ever allow these new economy companies to operate as freely as they have in the past. Given platform company importance to both the domestic economy and geopolitical confrontation with the US, we will not be surprised if the government eventually establishes effective control over these platform companies – probably via its affiliated entities. Many of these platform companies are natural monopolies or oligopolies and their profitability should be regulated by authorities according to free market economic textbooks. We discussed this point in the recent report titled Chinese TMT Stocks: A Bad Dream Or A New Reality? Please click on the link to open the report. Going forward, return on equity will be lower than in the past for these stocks, heralding lower valuation multiples. Stocks of many Chinese platform companies trade in the US and are largely owned by US/international (non-Chinese) investors. Neither US nor Chinese authorities want to see shares of Chinese TMT companies trade in the US, albeit for completely different reasons. Chinese authorities want these companies to release little information to their foreign shareholders, especially regarding big data. In turn, the US securities regulator is keen for US investors not to be exposed to the risks of owning Chinese stocks for two main reasons: (1) these companies do not disclose full information and (2) China’s government meddles with the management of these enterprises. Given that authorities from both countries do not support the trading of Chinese stocks in the US, odds are high that the trading of Chinese TMT companies will move from the US to Hong Kong. Moreover, US authorities may recommend US funds avoid owing Chinese stocks. In short, increased government control over Chinese TMT companies and rising geopolitical tensions between the US and the Middle Kingdom may prompt many foreign investors to reduce their exposure to these stocks. This will have negative ramifications on their share prices. Chart 3Little Volatility Spillover From Offshore Into China's Onshore Markets
Little Volatility Spillover From Offshore Into China's Onshore Markets
Little Volatility Spillover From Offshore Into China's Onshore Markets
Question: Don’t you think Chinese authorities may reverse their regulatory clampdown given that Chinese share prices have already dropped a great deal and further weakness could hurt investor and business sentiment? Chinese authorities will not reverse regulatory tightening on platform companies. If investor and business confidence on the mainland is hurt materially, regulators will reduce the intensity of their reforms but will not reverse them. Importantly, the carnage has so far been limited to Chinese offshore financial markets (Chart 3). Neither the onshore equity indexes, nor onshore corporate bonds have sold off much (Chart 3). The majority of platform companies are listed offshore and plunging share prices hurt foreign shareholders more than domestic retail and institutional investors. There is little reason for Chinese policymakers to worry about losses among foreign investors so long as the carnage does not spread to onshore markets. Question: Why would Chinese authorities damage their largest and most successful companies in the new economy sectors? Are they not critical amidst the US-China confrontation? Chinese policymakers understand the importance of platform companies to the country’s domestic growth outlook as well as its geopolitical ambitions. This explains why Chinese authorities seek to establish effective control over decision making in these companies. We elaborated on the strategic importance of big data above. Also, the largest platform companies, such as Alibaba, Tencent and Meituan, have in recent years been acquiring stakes in numerous businesses in Southeast Asia. Beijing might be thinking of using these platform companies to raise its geopolitical influence over other Asian nations and beyond. Many Asian nations will play a prominent role in the US-China confrontation. Whether they side with China or the US will affect the balance of geopolitical power in the region. In this context, having control over soft infrastructure (payment and data systems, among others) in these Asian economies will give Beijing a chance to influence their geopolitical choices, thereby giving China an advantage over the US. Therefore, the Chinese central government might be aiming to establish an effective control over these companies’ strategic decisions. In such a case, shareholder interests will take a back seat in these companies. Question: What about common prosperity initiatives and policies that the Chinese leadership has unveiled in recent weeks? Why now? President Xi will be elected for his third term in the fall of 2022. This constitutes a major political precedent in the Middle Kingdom’s modern history. President Xi wants to secure his support from the bulk of the population. Common prosperity policies entail income and wealth distribution from high-income to middle- and low-income households. Chart 4 and Chart 5 illustrate that there has so far been no equalization of income and wealth distribution. Chart 4China: Income Disparity Has Not Been Narrowing
What Clients Are Asking
What Clients Are Asking
Chart 5Wealth Concentration Remains High In China
Wealth Concentration Remains High In China
Wealth Concentration Remains High In China
It is imperative for President Xi to achieve a meaningful change in income and wealth distribution in the next 12 months before his third term. President Xi’s power stems not from the top 10% of the population but from the remaining (and less wealthy) 90%. Hence, there will be little easing in the push toward common prosperity. If anything, the pace of these initiatives could escalate going forward. As a part of the common prosperity initiatives, companies with excess profitability will be compelled to perform a national duty in the form of financing social programs or providing donations. Large platform companies have already begun making large donations. This trend will intensify in the months ahead. In brief, profits will be distributed away from shareholders of these companies in favor of the general well-being of society. The positive is that low- and middle-income consumer spending in China will be supported by income transfer from companies and wealthy individuals. As a result, investors should favor the companies that sell to low- and middle-income households. Chart 6Chinese Growth Stocks Are Not Yet Cheap
Chinese Growth Stocks Are Not Yet Cheap
Chinese Growth Stocks Are Not Yet Cheap
Going forward, the model of SOEs in China or Russia will be applicable to Chinese platform companies. SOEs in China, Russia and other EM countries often perform national duties at the expense of shareholders. Not surprisingly, their stocks have been trading at much lower multiples than private companies. Presently, Chinese TMT/growth stocks trade at a trailing P/E ratio of 33.5 (Chart 6). We do not expect platform companies’ P/E ratio to drop to the level of SOEs. However, a trailing P/E ratio of 33.5 for China’s TMT companies is still high given: the uncertainty around future business models; a lack of clarity around (still evolving) new regulation; government involvement in their management; the prioritization of national and geopolitical objectives over shareholder interest. Chart 7Mind These Gaps
Mind These Gaps
Mind These Gaps
Question: Isn’t the slowdown in China’s business cycle already well known and priced in related financial markets? Yes, it is well known but we do not think it has been priced in China-exposed plays. There are several market relationships and indicators that lead us to believe so. Both panels in Chart 7 illustrate that industrial metals prices have diverged from the Chinese manufacturing PMI and onshore government bond yields. The latter two variables project the Chinese business cycle. Such a decoupling is unsustainable given that China accounts for 55% of global industrial metal consumption. We continue to expect meaningful downside in industrial metals prices which would hurt EM countries exporting commodities. China’s credit and fiscal spending impulse leads its business cycle by nine months and suggests that economic data will be weakening until Q2 2022 (Chart 8). Finally, net EPS revisions for EM-listed companies remain elevated (Chart 9). Chart 8China's Business Cycle Will Continue Decelerating Well Into Q1 2022
China's Business Cycle Will Continue Decelerating Well Into Q1 2022
China's Business Cycle Will Continue Decelerating Well Into Q1 2022
Chart 9EM EPS Growth Expectations Have Not Yet Been Downgraded
EM EPS Growth Expectations Have Not Yet Been Downgraded
EM EPS Growth Expectations Have Not Yet Been Downgraded
That said, one sentiment indicator that has dropped significantly and is now near its level during previous EM equity lows is the Sentix European investor sentiment index on EM equities (Chart 10). Chart 10European Investor Sentiment On EM Stocks Is Back To Its Previous Lows
European Investor Sentiment On EM Stocks Is Back To Its Previous Lows
European Investor Sentiment On EM Stocks Is Back To Its Previous Lows
Net-net, the risk-reward tradeoff for EM equities and credit markets is not yet attractive. Chinese TMT stocks are vulnerable for reasons discussed above while EM financial markets exposed to China’s old economy are at risk due to decelerating Chinese economic growth. Question: When will authorities in China ease policy? What does it imply for Chinese and EM financial markets? Shouldn’t investors buy China/EM assets now in anticipation of macro policy easing in China? Yes, China has already started easing credit and fiscal policy and will ease more in the coming months. Chart 11 reveals that banks’ excess reserves at the PBOC have turned up and they lead the credit impulse by six months. In turn, the Chinese credit impulse in turn leads EM share price cycles by nine months (Chart 12). Chart 11China's Credit Impulse Will Bottom In Late 2021
China's Credit Impulse Will Bottom In Late 2021
China's Credit Impulse Will Bottom In Late 2021
Chart 12EM Equities Are Not Yet Out Of The Woods
EM Equities Are Not Yet Out Of The Woods
EM Equities Are Not Yet Out Of The Woods
All in all, even though Chinese policymakers have begun easing credit and fiscal policy, financial markets leveraged to the mainland’s old economy could still suffer as growth continues to disappoint in the months to come. Chart 13Chinese Easing In H2 2018 And H1 2019 Did Not Help Much EM Stocks And Metal Prices
Chinese Easing In H2 2018 and H1 2019 Did Not Help Much EM Stocks And Metal Prices
Chinese Easing In H2 2018 and H1 2019 Did Not Help Much EM Stocks And Metal Prices
Importantly, policy easing will be implemented gradually, as in H2 2018 and H1 2019. During this period EM ex-TMT stocks and industrial metal prices performed poorly despite policy easing in China (Chart 13). Question: Given improvements in vaccine availability worldwide, will EM countries close their vaccination gap with developed countries in the coming months? If yes, wouldn’t it allow their economies to catch up, and their financial markets to outperform their DM peers? EM vaccination rates will rise as vaccines become available to developing countries. However, mainstream EM vaccination rates will still remain below those of advanced economies. This gap is due to higher levels of mistrust toward governments in developing countries than in advanced ones. Therefore, the pandemic will continue capping economic activity in mainstream EM. Importantly, the lack of fiscal stimulus, monetary policy tightening and weak banking systems in mainstream EM (i.e., excluding China, Korea and Taiwan) herald weak income and domestic demand growth in these economies. Years of poor income growth and lasting pandemic damage have caused political volatility to flare-up in some countries such as Colombia, Peru, Brazil, South Africa and Malaysia. This trend will likely continue foreshowing a higher risk premium in EM financial markets. Question: What is your inflation outlook for mainstream EM (excluding North Asia)? Will inflation continue to surprise to the upside and will their central banks hike rates enough so that their currencies do not depreciate? We discussed the inflation dynamics and the outlook for local rates for EM in the August 12 report. While commodity price inflation will subside, renewed currency deprecation is the key risk to the inflation outlook in mainstream EM. EM currencies will depreciate because China’s continued slowdown is bearish for EM currencies but bullish for the greenback. The basis is that the US sells little to China while EM are exposed to the Chinese business cycle. Also, domestic demand in mainstream EM will disappoint. That, along with rising political volatility, is negative for their currencies. Finally, high local rates in mainstream EM have often coincided with currency depreciation rather than appreciation. Question: What is the biggest risk in your view? The biggest risk to our view has been and remains TINA (There Is No Alternative). We have strong conviction on fundamentals but very little conviction on fund flows. Given that DM equity and credit markets are expensive and their government bond yields are very depressed, portfolio capital can go into EM financial markets that offer lower valuation than their DM counterparts even though they are not cheap in absolute terms. Our methodology is that fundamentals drive flows in the medium- to-long term. However, with the global financial system flush with liquidity, the importance of fundamentals has declined in recent years. Therefore, we are cognizant that EM markets might not sell off a lot and could bottom at a higher level than warranted by fundamentals. Still, we expect more downside in the coming months because fundamentals are much worse than most investors realize. Chart 14EM Credit Will Continue Underperforming Their US Peers
EM Credit Will Continue Underperforming Their US Peers
EM Credit Will Continue Underperforming Their US Peers
Question: What is your recommended strategy across EM equities, currencies, and fixed-income markets? Global equity portfolios should continue underweighting EM, a recommendation from March 25, 2021. Within the EM equity universe, our overweights are Korea, India, China (preferring onshore to offshore equities), Mexico and Chile. Our underweights are Brazil, Colombia, Peru, South Africa, Turkey, the Philippines and Indonesia. The risk-reward tradeoff for EM currencies remains poor. We continue shorting a basket of BRL, CLP, COP, PEN, ZAR, TRY, PHP, THB and KRW versus the US dollar. Within local markets we overweight Mexico, Russia, Korea, Malaysia, India, China and Chile. Regarding sovereign and corporate credit, we have downgraded EM credit versus US credit on March 25 and this strategy remains intact (Chart 14). The lists of our overweights, underweights and the ones warranting neutral allocation in EM equity, domestic bonds and credit portfolios are presented below and can always be found on the EMS website. Arthur Budaghyan Chief Emerging Markets Strategist arthurb@bcaresearch.com Equities Recommendations Currencies, Credit And Fixed-Income Recommendations
Highlights Our willingness to spend money depends on which ‘mental account’ it occupies. Once windfall income enters our ‘savings mental account’, we will not spend it. Hence, the pandemic’s windfall income receipts will have no sustained impact on spending, or on inflation. This means that US monetary tightening will be later and shallower than the market is pricing. As we learn to live with the pandemic, the massive displacement in spending patterns is normalising. This means that the abnormally high spending on durable goods has a long way to fall. Hence, today we are recommending a new 6-month position: underweight consumer discretionary plays. One easy way of expressing this is to underweight XLY (US consumer discretionary) versus XLP (US consumer staples). Fractal analysis: The US dollar, and base metals versus precious metals. Feature Chart of the WeekNo Tsunami Of Spending Despite Excess Income
No Tsunami Of Spending Despite Excess Income
No Tsunami Of Spending Despite Excess Income
Many people claimed that the war chest of savings that global households accumulated during the pandemic would unleash a tsunami of spending. Well, it didn’t. For example, US consumer spending remains precisely on its pre-pandemic trend (Chart I-1 and Chart I-2). This, despite stimulus checks and other so-called ‘transfer payments’ which boosted aggregate household incomes by trillions of dollars. Indeed, paste over 2020, and you would be forgiven for thinking that there was no pandemic! Chart I-2No Tsunami Of Spending Despite Excess Income
No Tsunami Of Spending Despite Excess Income
No Tsunami Of Spending Despite Excess Income
Of course, households that lost their livelihoods during the pandemic, and thus became ‘liquidity constrained’, did spend the lifeline stimulus payments that they received. Yet in aggregate, households did not spend the excess income received during the pandemic. Moreover, the phenomenon is global – the savings rate in the UK has surged near identically to that in the US (Chart I-3). Chart I-3The Savings Rate Has Surged Everywhere
The Savings Rate Has Surged Everywhere
The Savings Rate Has Surged Everywhere
The excess income built up during the pandemic did not unleash a tsunami of spending. Neither will it unleash a tsunami of future spending. We can say this with high conviction because we have seen the same movie many times before. Previous tranches of stimulus and transfer payments that boosted incomes in 2004, 2008, and 2012 (though admittedly by less than in 2020) had no lasting impact on spending. Whether We Spend Or Save Money Depends On Which ‘Mental Account’ It Occupies Why do windfall income receipts not trigger a tsunami in spending? (Chart I-4) Chart I-4Stimulus Checks Had No Meaningful Impact On Spending
Stimulus Checks Had No Meaningful Impact On Spending
Stimulus Checks Had No Meaningful Impact On Spending
One putative answer comes from Milton Friedman’s Permanent Income Hypothesis. Contrary to the Keynesian belief that absolute income drives spending, Friedman postulated that income comprises a permanent (expected) component and a transitory (unexpected) component. And only the permanent income component drives spending. In the permanent income hypothesis, spending is the result of estimated permanent income rather than a transitory current component. Therefore, for households that are not liquidity constrained, a windfall receipt – like a stimulus payment – will not boost spending if it does not boost estimated permanent income. Nevertheless, this theory does require households to estimate their future permanent incomes, and it is debatable if households can do this. Stimulus and transfer payments that boosted incomes in 2004, 2008, 2012, and 2020 had no lasting impact on spending. We believe that a more real-world answer to how we deal with windfalls comes not from Economics but from the field of Psychology, and the theory known as Mental Accounting Bias. Mental accounting bias states that we segment our money into different accounts, which are sometimes physical, sometimes only mental, and that our willingness to spend money depends on which mental account it occupies. This contrasts with standard economic theory which assumes that money is perfectly fungible, so that a dollar in a current (checking) account is no different to a dollar in a savings account. In practice, money is not fungible, because we attach different emotions to our different mental accounts. A dollar in our current account we will gladly spend, but a dollar in our savings or investment accounts we will not spend. Hence, the moment we move the dollar from our current account into our savings or investment account, our willingness to spend it collapses. This explains why consumption trends have no connection with windfall income receipts once those income receipts end up in our savings mental account. Pulling all of this together, the war chest of savings accumulated during the pandemic is unlikely to change the overall trend in spending. More likely, it will be used to reduce household debt, and thereby constrain the broad money supply. In effect, part of the recent increase in public debt will just end up decreasing private debt, as happened in Japan during the 1990s (Chart I-5). Chart I-5In Japan, Public Debt Ended Up Paying Down Private Debt
In Japan, Public Debt Ended Up Paying Down Private Debt
In Japan, Public Debt Ended Up Paying Down Private Debt
With no permanent boost to spending, the pandemic’s windfall income receipts will have no sustained impact on inflation. As Spending Patterns Normalise, Consumer Discretionary Plays Are Vulnerable While consumer spending remains precisely on its pre-pandemic trend, the sub-components of this spending do not. Specifically, spending on durable goods stands way above its pre-pandemic trend, while spending on services languishes below trend (Chart I-6). Chart I-6The Pandemic Distorted Spending Patterns
The Pandemic Distorted Spending Patterns
The Pandemic Distorted Spending Patterns
This makes perfect sense. Pandemic restrictions on socialising, interacting, and movement meant that leisure, hospitality, in-person shopping, and travel services were unavailable. Therefore, consumers just shifted their firepower to items that could be enjoyed within the pandemic’s confines; namely, durable goods. But now that shift is reversing. In turn, these massive and unprecedented shifts in spending patterns explain the recent evolution of inflation. As booming demand for durable goods created supply bottlenecks, durables prices skyrocketed (Chart I-7). Chart I-7The Pandemic Distorted Prices
The Pandemic Distorted Prices
The Pandemic Distorted Prices
Remarkably though, the 10 percent spike in US durable good price through 2020-21 was the first increase in an otherwise persistently deflationary trend through this millennium (Chart I-8). As such, it was a huge aberration and as Jay Powell pointed out last week in Jackson Hole: Chart I-8The Increase In Durables Prices Was A Huge Aberration
The Increase In Durables Prices Was A Huge Aberration
The Increase In Durables Prices Was A Huge Aberration
“It seems unlikely that durables inflation will continue to contribute importantly over time to overall inflation.” Meanwhile, with services simply unavailable, their prices did not fall, given that the price of something that cannot be bought is a meaningless concept. Moreover, unlike for an unbought durable good, which adds to tomorrow’s supply, an unbought service such as a theatre ticket – whose consumption is time-sensitive – does not add to tomorrow’s supply. Hence, when unavailable services suddenly became available, the initial euphoric demand for limited supply caused these service prices also to surge. But excluding such short-lived euphoria in airfares, car hire, and lodging way from home, services prices remain well-contained. This reinforces our conclusion from the first section. The pandemic’s windfall income receipts will have no sustained impact on inflation. As Jay Powell went on to say: “We have much ground to cover to reach maximum employment, and time will tell whether we have reached 2 percent inflation on a sustainable basis.” All of which means that US monetary tightening will be later and shallower than the market is pricing. Another important investment conclusion is that as we learn to live with the pandemic, the massive displacement in spending patterns is normalising. This means that the abnormally high spending on durable goods has a long way to fall. The abnormally high spending on durables has a long way to fall. Given the very tight connection between spending on durables and the relative performance of the goods dominated consumer discretionary plays in the stock market, this will weigh on consumer discretionary sectors (Chart I-9). Chart I-9As Spending Patterns Normalise, Consumer Discretionary Plays Are Vulnerable
As Spending Patterns Normalise, Consumer Discretionary Plays Are Vulnerable
As Spending Patterns Normalise, Consumer Discretionary Plays Are Vulnerable
Hence, today we are recommending a new 6-month position: underweight consumer discretionary plays. One easy way of expressing this is to underweight XLY (US consumer discretionary) versus XLP (US consumer staples) (Chart I-10). Chart I-10Underweight XLY Versus XLP
Underweight XLY Versus XLP
Underweight XLY Versus XLP
Fractal Analysis Update Fractal analysis suggests that the dollar’s rally since late-Spring could meet near-term resistance, given the incipient fragility on its 65-day fractal structure (Chart I-11). Chart I-11The Dollar's Rally Could Meet Near-Term Resistance
The Dollar's Rally Could Meet Near-Term Resistance
The Dollar's Rally Could Meet Near-Term Resistance
A bigger vulnerability is for the strong and sustained rally in base metals versus precious metals, which is now extremely fragile on its 260-day fractal structure (Chart I-12). We are already successfully playing this through short tin versus platinum, but are adding a new expression: short aluminium versus gold. The profit target and symmetrical stop-loss are set at 13.5 percent. Chart I-12The Massive Rally In Base Metals Versus Precious Metals Is Vulnerable
The Massive Rally In Base Metals Versus Precious Metals Is Vulnerable
The Massive Rally In Base Metals Versus Precious Metals Is Vulnerable
Dhaval Joshi Chief Strategist dhaval@bcaresearch.com Fractal Trading System Fractal Trades 6-Month Recommendations Structural Recommendations Closed Fractal Trades Closed Trades Asset Performance Equity Market Performance Indicators To Watch - Bond Yields Chart II-1Indicators To Watch - Bond Yields ##br##- Euro Area
Indicators To Watch - Bond Yields - Euro Area
Indicators To Watch - Bond Yields - Euro Area
Chart II-2Indicators To Watch - Bond Yields ##br##- Europe Ex Euro Area
Indicators To Watch - Bond Yields - Europe Ex Euro Area
Indicators To Watch - Bond Yields - Europe Ex Euro Area
Chart II-3Indicators To Watch - Bond Yields ##br##- Asia
Indicators To Watch - Bond Yields - Asia
Indicators To Watch - Bond Yields - Asia
Chart II-4Indicators To Watch - Bond Yields ##br##- Other Developed
Indicators To Watch - Bond Yields - Other Developed
Indicators To Watch - Bond Yields - Other Developed
Indicators To Watch - Interest Rate Expectations Chart II-5Indicators To Watch - Interest Rate Expectations
Indicators To Watch - Interest Rate Expectations
Indicators To Watch - Interest Rate Expectations
Chart II-6Indicators To Watch - Interest Rate Expectations
Indicators To Watch - Interest Rate Expectations
Indicators To Watch - Interest Rate Expectations
Chart II-7Indicators To Watch - Interest Rate Expectations
Indicators To Watch - Interest Rate Expectations
Indicators To Watch - Interest Rate Expectations
Chart II-8Indicators To Watch - Interest Rate Expectations
Indicators To Watch - Interest Rate Expectations
Indicators To Watch - Interest Rate Expectations
Highlights China’s credit tightening may have surpassed maximum strength. Monetary policy will remain accommodative and fiscal policy will become more supportive in the rest of the year. However, overall regulatory oversight is still restrictive, limiting the scope of reflationary effects on the economy. There were signs that the “cross-cyclical” approach – a new catchphrase from the July Politburo meeting - emerged even before the start of the pandemic. The current policy backdrop resembles the situation in 2H2018. China’s new “common prosperity” plan, which sets up guidance for long-term policy direction, will likely have cyclical implications. Chinese investable stocks are in oversold territory and will probably rebound in the near term. In the next 6 to 12 months, however, we remain cautious given the lack of a catalyst to revive investor sentiment. Feature Chart 1Chinese Stocks Are Oversold In Absolute Terms
Chinese Stocks Are Oversold In Absolute Terms
Chinese Stocks Are Oversold In Absolute Terms
China’s economic momentum has slowed, while regulatory crackdowns show no signs of dissipating. Meanwhile, Chinese investable stocks in absolute terms have slumped into technically oversold territory (Chart 1). Global investors are looking at fiscal and monetary policy easing for clues to what may be next. A shift in policy direction from restrictive to reflationary will help to shore up market sentiment and the outlook for the economy. Fiscal policy implementation in 1H21 was tighter than budgeted, leaving room for more support in 2H21. The PBoC’s unexpected reserve requirement ratio (RRR) cut in early July may have been a signal that policy tightening has ended. In short, China’s financial tightening has most likely passed its peak strength. Chart 2Valuations Are Almost Back To 2018 Lows
Valuations Are Almost Back To 2018 Lows
Valuations Are Almost Back To 2018 Lows
We have no doubt that China will announce some compensatory measures in the coming months in response to rising downward pressures on the domestic economy. However, we continue to hold the view that the bar for a fresh round of material stimulus is higher today than it was in the past. The policy focus pivoting from a countercyclical to cross-cyclical adjustment, the rising emphasis on common prosperity, and the ongoing regulatory clampdowns in an array of industries, all limit the extent to which authorities can deploy the expected magnitude in infrastructure spending and bank lending. Therefore, we continue to recommend investors remain underweight Chinese stocks versus their global peers – a stance we have maintained since earlier this year – despite cheapened relative valuations in Chinese equities (Chart 2). Shifting To A Cross-Cycle Approach China’s policy shift to a cross-cyclical stance has gained more market attention since the late-July Politburo meeting. However, there were signs that the cross-cyclical approach emerged even before the start of the pandemic. Chart 3Size Of Stimulus Was Already Getting Smaller
Size Of Stimulus Was Already Getting Smaller
Size Of Stimulus Was Already Getting Smaller
During the height of the 2018/19 US-China trade war, policymakers responded to the economic shocks from imposed import tariffs with much more measured stimulus than in previous cycles (Chart 3). President Xi repetitively used the “Long March” analogy during the trade war, warning Chinese citizens to prepare for protracted hardship stemming from conflict with the US.1 The metaphor had important market implications because the attitude was fundamental to how the government handled the cyclical slowdown in 2018/19. Despite aggressive RRR and policy rate cuts in the second half of 2018, authorities maintained tight restrictions on bank lending and local government spending. Consequentially, aggregate credit growth continued to slide through end-2018 (Chart 4). Furthermore, authorities became uneasy about the sharp rise in the rate of credit expansion in Q1 2019. Following a public spat between the Premier Li Keqiang and the central bank, bank lending slowed sharply in the rest of the year. As a result, the improvement in infrastructure investment growth was small and short-lived. Despite an acceleration in local government bond issuance in 2H18 and Q1 2019, infrastructure investment growth remained on a structural downward trend throughout most of 2018 and 2019 (Chart 5). Chart 4China: A Deja Vu Of 2018-2019?
China: A Deja Vu Of 2018-2019?
China: A Deja Vu Of 2018-2019?
Chart 5Improvement In Infrastructure Investment Was Short-Lived In 2019
Improvement In Infrastructure Investment Was Short-Lived In 2019
Improvement In Infrastructure Investment Was Short-Lived In 2019
Chart 6Financial De-Risking Mode Is Still On
Financial De-Risking Mode Is Still On
Financial De-Risking Mode Is Still On
The current policy backdrop resembles the situation in 2H2018: while the central bank has kept interest rates at historically low levels and preemptively cut the RRR rate in July, lending standards remain tight and shadow bank credit continues to shrink (Chart 6). In the past Chinese authorities stimulated substantially following exogenous shocks, but did not stimulate much when business cycle was slowing in an orderly manner. A resurgence of domestic COVID cases and the severe flood in central China in July and August represent exogenous shocks and occured when the economy was losing steam. Hence, there are higher odds authorities will provide some support in response to these exogenous shocks. However, the recurring battle against COVID and lingering tensions with the US have likely prompted Chinese top leadership to extend their cross-cycle strategy. Officials may feel that a modest easing in both monetary and fiscal policies will be sufficient to offset the current economic weakness without overstimulating the economy. Bottom Line: A cross-cycle policy approach means not only responding early to small shocks with piecemeal stimulus to stabilize growth but also limiting the scope of stimulus and preparing for “protracted battles”. The response from Chinese leaders during the trade war with the US in 2018/19 may be a roadmap for policy direction in the next 12 months. Cyclical Implications From “Common Prosperity” President Xi Jinping laid out a plan for “common prosperity”, a guideline for the country’s national policy in the coming decades, at the August 18th Central Committee for Financial and Economic Affairs. Most of the plan’s objectives have 2035 deadlines and will be achieved gradually in multiple phases.2 However, in the next 12 months and leading to the 20th National Party Congress in the fall of 2022, we expect the authorities to accelerate some reform agendas that are consistent with the 14th Five-Year Plan (2021-2025). A key area that may gain momentum is increasing labor income and household consumption share in national output. Both labor compensation and household consumption as a share of GDP improved from 2011 to 2016, but the progress stalled in recent years and further deteriorated last year in the wake of the pandemic (Chart 7). Policy decision makers can reverse the falling share by either boosting income/consumption or lowering the share of capital formation in the national output, or a combination of both. Regulatory tightening in the property market has reduced investment growth in the sector, which accounts for 66% of the country’s total fixed-asset formation (Chart 8). We expect policy restrictions to continue curbing real estate investment in the rest of the year and into 2022, further shrinking the share of capital formation in the aggregate output.3 Chart 7China's Economic Rebalancing Progress Has Stalled In The Past Five Years
China's Economic Rebalancing Progress Has Stalled In The Past Five Years
China's Economic Rebalancing Progress Has Stalled In The Past Five Years
Chart 8Policymakers Are Moving Away From The 'Old Economy' Pillars
Policymakers Are Moving Away From The 'Old Economy' Pillars
Policymakers Are Moving Away From The 'Old Economy' Pillars
Chart 9Recovery In Household Income And Consumption Has Significantly Lagged Other Sectors
Recovery In Household Income And Consumption Has Significantly Lagged Other Sectors
Recovery In Household Income And Consumption Has Significantly Lagged Other Sectors
Recovery in household income and consumption has significantly lagged other sectors in China’s recent economic rebound (Chart 9). In addition to short-term, pandemic-related factors, household consumption has been sluggish due to China’s long-standing imbalanced income distribution. Given that China will be under more pressure to deliver economic progress in 2022, boosting wage growth and consumption will help to facilitate both the nation’s cross-cyclical economic strategy and President Xi’s longer-term reform plan for income and wealth redistribution. If successfully implemented, a rebalancing of labor income and consumption as a share of the national aggregate will have long-term economic benefits. However, for investors with a cyclical time frame, the transition will likely have the following implications on the market: Policymakers will keep a large fiscal budget deficit and increase spending in public services and social welfare, but there will be more pressure on the central government to keep local government debt in check. The increased fiscal burden also means that while the government will provide subsidies for households and key new-economy industries, policy at margin may move away from boosting investment in traditional infrastructure and construction (Chart 10). Chart 10Traditional Infrastructure Investment Will Remain Subdued
Traditional Infrastructure Investment Will Remain Subdued
Traditional Infrastructure Investment Will Remain Subdued
Empirical research shows that lower-income households have a higher marginal propensity to consume.4 Last year China refrained from meaningful stimulus to incentivize consumption. In contrast, the statement from the August 18th meeting indicated the focus is on securing living standards and wages among lower-income households. Common prosperity related policies may boost consumption of staples and some durable goods but will likely discourage splurging in high-end luxury goods and services. Large corporations and high-net-worth individuals will be expected to share social responsibility and the cost of reducing income inequality, either through higher and stricter tax burdens, raising minimum wages for employees, and/or donations. Bottom Line: The “common prosperity” theme will mostly entail long-term policy initiatives, but it may also have some cyclical market repercussions. Investment Recommendations Chart 11Tactical Bounce Gave Way To Cyclical Downturn In Previous Cycles
Tactical Bounce Gave Way To Cyclical Downturn In Previous Cycles
Tactical Bounce Gave Way To Cyclical Downturn In Previous Cycles
We do not rule out the possibility of a tactical (within the next three months) / technical rebound in Chinese stocks. Our August 4th report discussed how prices managed to rebound strongly within 90 days of the policy-triggered market riots in both 2015 and 2018. However, the rallies quickly faded and stocks fell to new lows (Chart 11). Prices bottomed when policy decisively turned reflationary. For now, the risks to Chinese equities are largely to the downside. Although there are some remedial measures to ease monetary and fiscal policies, officials have not sent a clear signal to ease on the regulatory front. Conversely, there are two scenarios that could prompt us to upgrade Chinese stocks to either neutral or overweight in both absolute and relative terms. Chart 12No Clear Signal Chinese Policymakers Will Ease On The Regulatory Front
No Clear Signal Chinese Policymakers Will Ease On The Regulatory Front
No Clear Signal Chinese Policymakers Will Ease On The Regulatory Front
The first scenario is that the economy does not slow further and a modest policy easing is sufficient to stabilize the economic outlook. This may happen if strong global economic growth and demand continue to support China’s export and manufacturing sectors, while domestic household consumption improves. In this case, the downside risks on the overall economy would abate, but the gradual underlying downtrend in China's old economy would be intact. We would need an additional reflationary tailwind, such as a boost from fiscal spending or a reversal of industry policy tightening, to upgrade Chinese stocks to overweight. We have argued in the past that housing appears to be the best candidate; the catalyst is missing at the moment (Chart 12). In the second scenario, Chinese policymakers may determine that the downside risks to growth are unacceptably large given existing slowdowns in the industrial and service sectors, and decide to temporarily reverse course on structural reforms. We will watch for indications of a shift in attitude. For now, we think that China’s leadership has a higher pain threshold than in the past, suggesting that this outcome is not yet probable. Jing Sima China Strategist jings@bcaresearch.com Footnotes 1"Xi Jinping calls for ‘new Long March’ in dramatic sign that China is preparing for protracted trade war", South China Morning Post. 2"Xi stresses promoting common prosperity amid high-quality development, forestalling major financial risks", Xinhua, English.news.cn 3We use fixed-asset investment (FAI) as a proxy for gross fixed capital formation (GFCF) because the National Bureau of Statistics of China does not publish the GFCF breakdown by sectors. GFCF comprises FAI, less the purchase of existing fixed assets, land and some minor items. Historically, the two series have closely tracked each other. 4"The Stimulative Effect of Redistribution", Federal Reserve Bank of San Francisco Market/Sector Recommendations Cyclical Investment Stance
BCA Research's European Investment Strategy service maintains a favorable outlook for European banks over the tactical and cyclical investment horizons. Over a tactical investment horizon, the team recommends European banks relative to US ones as a…
BCA Research's US Equity Strategy service argues that Gen Z presents an untapped investment opportunity. Generation Z is starting to come of age now, with the oldest members hitting 25 this year. Gen Z-ers now outrank Millennials as the majority generation…
Highlights Gen Z Is Coming Of Age And Has Money To Spend Generation Z in the US includes 62 million people born between the 1997 and 2012. With $143B in buying power in the US alone, making up nearly 40% of all consumer sales, Gen Z wields increasing influence over consumer trends. This is the first generation of digital natives—they simply can’t remember the world without the internet. They are the early adopters of the new digital ways to bank, get medical treatments, and learn. Gen Z is joining the workforce and replacing retiring baby boomers. Gen Z Investment Themes Fintech: Gen Z loves seamless connectivity, online banking, and digital wallets. They are also the early adopters of semi-autonomous digital and non-traditional banking and insurance: PayPal (PYPL), Square (SQ), Lemonade (LMND), and Social Finance (Sofi). Investing And Crypto: Gen Z are avid investors: They opened 20% of all new investment accounts in 2020. Crypto is also very popular among the digital natives: Coinbase (COIN), Paypal (PYPL), and Square/Cash App (SQ). Alternative Reality And Online Gaming: Members of Gen Z will become the key gaming demographic in the decade ahead. E-sports betting is also gaining prominence. Two online gaming ETFs capture the theme: GAMR and ESPO. Quality-Over-Price Shoppers: Gen Z was found to be less price-sensitive when buying products, choosing quality over price. Lululemon (LULU) is among the Gen Z’s favorites. Finally, Gen Zers won’t have any qualms about buying a car online: Vroom (VRM). Online Dating: Gen Zers have whole-heartedly accepted online dating: Match (MTCH) and Bumble (BMBL). Pet Ownership: The Gen Z cohort often feels lonely and loves their furry friends: They are more than happy to spend time and money on them: Chewy (CHWY), Trupanion (TRUP), and IDEXX Labs (IDXX). PAWZ is the ETF. Healthy Lifestyle: Gen Z is a “green” generation that deeply cares about the planet, loves outdoors and traveling, with many identifying as vegans. This is also a generation that prizes a healthy lifestyle and working out: Beyond Meat (BYND), Planet Fitness (PLNT), and Yeti (YETI). Generation Sober Chooses Cannabis: Gen Zers perceive hard liquor and tobacco as bad for their health. Curiously, marijuana is perceived as “healthy.” CNBS, YOLO, and THCX are the biggest ETFs in this space. How To Invest In Gen Z Gen Z is a nascent investment theme, so there are no ETFs available in the market yet. We propose investors follow our Gen Z investment themes or replicate fully or partially our Gen Z basket (Table 1). Table 1Gen Z Basket Constituents
Generation Z: The Digital Natives
Generation Z: The Digital Natives
Feature Gen Z Is Coming Of Age And Has Money To Spend Generation Z in the US includes 62 million people born between the years of 1997 and 2012 – a cohort starting to come of age now, with the oldest members hitting 25 this year (Chart 1). Gen Z-ers now outrank Millennials as the majority generation on the planet. With $143B in buying power in the US alone, making up nearly 40% of all consumer sales, Gen Z commands an increasing influence over consumer trends. Chart 1Gen Zers Are Taking Over
Gen Zers Are Taking Over
Gen Zers Are Taking Over
Furthermore, while most Gen Zers are still in high school and college, their parents, who have padded their savings accounts after a series of stimulus checks, are ready to step in and foot the bill, fortifying the financial impact of this new generation. In this report, we have outlined the Gen Z investment themes and most representative stocks. The Gen Z basket is a compilation of these themes and stocks. However, we are not stock-pickers - our selections are for illustration only. Digital Natives This is the first cohort that has grown up with a phone in one hand and a computer mouse in the other. Dubbed “digital natives,” they simply can’t remember a world without the internet. Gen Z, often referred to as “Zoomers” or “Centennials,” are connected nearly every waking hour of the day and are deeply social, even if considerable interaction may take place in cyberspace. The average Gen Z got their first smartphone just before their twelfth birthday, communicates primarily through social media and texts, and spends as much time on their cell phones as their parents on television. Because tech made Gen Z’s personal lives easier, faster, and more efficient, they emphasize customization and optimization as users and consumers. One of the most educated generations, they are more likely to pursue college than earlier generations. Among 18- to 21-year-olds no longer in high school in 2018, 57% were enrolled in two- or four-year college (that number was 52% for Millennials). The last year has also blurred the lines between work and home: Many college graduates have never met their new colleagues in person. Generation Z students had unprecedented exposure and experience using technology to continue their education outside the traditional brick-and-mortar school setting. They are also most likely to adopt new ways to bank, get medical treatments, and learn. Zoomers are future entrepreneurs (72% of high schoolers want to start their own business)1 and evangelists of the gig economy. Demographics & Macro Trends Chart 2 displays US demographic trends. Until 2018, baby boomers dominated the labor force; but, over the past three years, they have passed the baton to Gen Z. Moreover, during the pandemic, the retirements of baby boomers have accelerated. With more Zoomers graduating from high school and college, their proportion in the labor force is rising and their spending patterns are becoming increasingly more prominent in the economy. Gen Z wage data also reveals an interesting trend. Since 2014, median weekly earnings for the coming generation noticeably outpaced one of the departing generations—by 14.5%, to be exact (Chart 3). Chart 2Generational Shifts In The Labor Force
Generational Shifts In The Labor Force
Generational Shifts In The Labor Force
Chart 3They Also Have Money To Spend
They Also Have Money To Spend
They Also Have Money To Spend
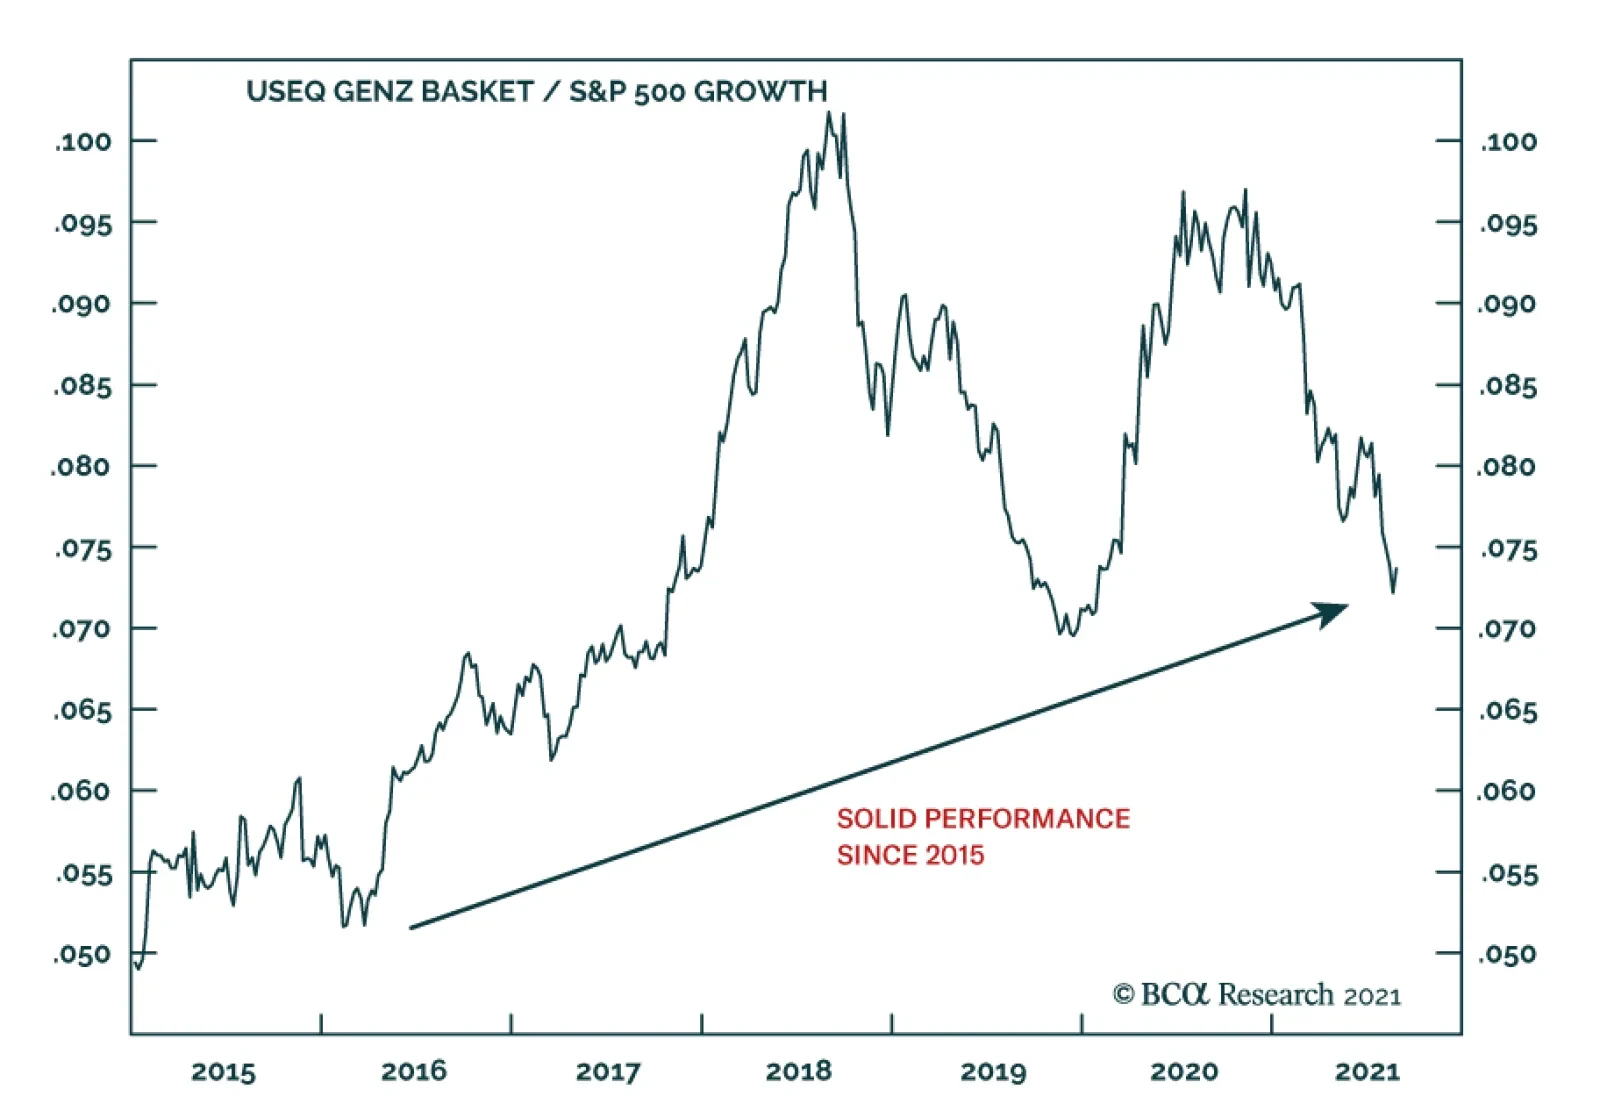
Investment Themes A host of investment themes reflects the retail preferences of Gen Z, collectively called the Gen Z basket. While some of the themes are ubiquitous (most of the US middle class aspire to maintain a healthy lifestyle), it is the quirks specific to Gen Z that we focus on. The oldest Zoomers turned 18 in 2015. Since then, the Gen Z basket has outperformed the S&P 500 Growth index by 46% (Chart 4). A word of caution: As any emerging investment theme, the basket remains volatile. Chart 4Solid Performance Since 2015
Solid Performance Since 2015
Solid Performance Since 2015
Fintech Gen Z is financially minded and risk averse. Many watched parents struggle during the Great Recession. They’re often leery of debt and credit, and thus stick to debit cards. Digital natives expect seamless connectivity, and their finances are no exception. They can't live without their digital wallets and online banking. Generation Z members are early adopters of semi-autonomous digital banking, which deploys digital cognitive agents or AI systems to help with financial decisions. It provides Zoomers with the right degree of personalization and autonomy to make smarter, faster, and better money moves. And, when it comes to money movements, 75% of Zoomers are using peer-to-peer (P2P)2 banking methods, with easy-to-use apps like Zelle and Venmo taking the lead in downloads. Similar fintech trends apply to other financial transactions, like loans and insurance. This theme may be expressed through Paypal (PYPL), Square (SQ), Lemonade (LMND) online insurance, and Social Finance (Sofi)—an online platform for student loan refinancing, private student loans, and a host of other financial products. Interest In Investing And Cryptocurrencies Zoomers are avid investors. They opened 20% of all the new investment accounts in 2020 — impressive, considering that half of the cohort are underage (Chart 5). Crypto is also very popular among digital natives. Last year, Business Insider (BI) released a survey asking if Zoomers are “likely to purchase cryptos in the next six months”. What is telling is that approximately 1/4 of responders indicated that they are likely to purchase crypto, which correlates to the percentage of Zoomers who are currently age 18 or older (Chart 6). We can play the crypto theme in the equity space by investing in Coinbase (COIN), Paypal (PYPL)—which recently started accepting crypto as a payment—and Square/Cash App (SQ). Chart 5Gen Zers Are Avid Investors...
Generation Z: The Digital Natives
Generation Z: The Digital Natives
Chart 6...Including In The Crypto Space
Generation Z: The Digital Natives
Generation Z: The Digital Natives
Alternative Reality And Online Gaming Members of Gen Z will become a key gaming demographic in the decade ahead. 91% of Gen Z males regularly play video games, compared to 84% of Millennials. In a recent study, “From Nerdy to Norm: Gen Z Connects Via Gaming” conducted by Whistle, 68% of Gen Z males agreed that gaming is an important part of their identity. The industry has responded to the mores of this incoming generation by shifting its focus towards highly stylized immersive mobile games, live dealers, and interactive experiences rather than the traditional click-to-spin style slot games. E-sports betting is also getting prominence. We have very little doubt that the proliferation of e-sports will accelerate, especially as Gen Z comes of age. The upcoming 2021 e-sports “world cup” event for just one game already has more than $40,000,000 in prize pool money secured. To express the online gaming theme, we included six stocks in our basket: Online game developers, such as Take Two Interactive (TTWO), Electronic Arts (EA), and Activision Blizzard (ATVI); Zinga (ZNGA), which develops apps for phone games; DraftKings (DKNG), a leader in online sports betting; and finally, Nvidia (NVDA), a graphic chip manufacturer that thrives as a market leader in gaming computing. There are also a couple of online gaming ETFs: GAMR and ESPO. Quality-Over-Price Shoppers As consumers, tech-savvy Zoomers are pragmatic shoppers who rely on social networks to make informed purchasing decisions. They were also found to be less price-sensitive when buying products, choosing quality over price as their top purchasing factor, while sustainability was also highlighted as an important issue. As a result, brick-and-mortar shops with a strong online presence, such as Urban Outfitters (URBN) and Lululemon(LULU) are Gen Z favorites. Vintage clothing has also recently been in vogue among these teens. Companies like Poshmark (POSH) capture this trend. High-end outdoor clothes brands also have a Zoomer following. Canadian Goose (GOOS) is one of them: For many, a “goose” jacket is a winter campus uniform. Lastly, Zoomers won’t have any qualms about buying a car online: Vroom (VRM). Online Dating Gen Z is different from any other generation in their whole-hearted acceptance of online dating. For example, Zoomers represent 40% of all Tinder users. The online dating landscape3 in the US is dominated by just two companies, Match/Tinder (MTCH) and Bumble (BMBL), an app whereby only a female can make initial contact. Pet Ownership Zoomers are lonely – 3 million adolescents had a major depressive episode,4 and there is an increase in anxiety and depression among high schoolers. Many feel isolated as a result of too much screen time. Zoomers are also known to avoid long-term relationships. It is not surprising that this cohort loves their furry friends and is more than happy to spend time and money on them. Since the worst of the pandemic, PAWZ pet care ETF has outperformed the S&P 500 growth index by 24%, while the US pet & vet services CPI series rose by 5.6%, compared to 4.6% for core CPI (Chart 7). While the love of pets is certainly not a unique characteristic of this cohort, it is a significant part of their spending basket. The following stocks capture this trend: PAWZ ETF; Chewy (CHWY), online pet supplies; Trupanion (TRUP), pet insurance; and IDEXX Labs (IDXX), the vet pharma company. Chart 7Pet Ownership Is On The Rise
Pet Ownership Is On The Rise
Pet Ownership Is On The Rise
Healthy Lifestyle Aside from gaming, pet ownership, and online dating, there are some other Gen Z behavioral shifts. This is a “green” generation that deeply cares about the planet, loves outdoors and traveling, and has a soft spot for animals, with many Zoomers identifying as vegans. This generation also prizes a healthy lifestyle and working out. Stocks like Beyond Meat (BYND), makers of meat substitute products; Planet Fitness (PLNT), a gym favored by the Zoomers; and Yeti (YETI), high-end hiking equipment (indeed, this generation chooses quality over price) are the stocks that provide exposure to these new tastes and preferences. Generation Sober Chooses Cannabis Gen Z certainly cares about their health, and most Zoomers perceive hard liquor and tobacco as harmful. Gen Z drinks 20%5 less alcohol than Millennials did at their age. Curiously, marijuana is perceived as “healthy.” BusinessWeek commissioned a survey through the polling firm Morning Consult, which found Zoomers were more than twice as likely to be regular or occasional cannabis users than the national average (Chart 8). They concluded, “It’s always hard to generalize about an entire age group, but early signs suggest it will be a generation of marijuana consumers.” CNBS, YOLO, and THCX are the biggest ETFs in this space. Other Themes Finally, our discussion about Gen Z wouldn’t be complete without mentioning economic digitalization (Amazon, Teladoc, Zoom), proliferation of social media (SNAP, PINS, FB), and the sharing economy (UBER, ABNB, FVRR). Please refer to Table 1 at the beginning of the report for a complete list of Gen Z basket constituents. Chart 8Cannabis Is Not Considered A Drug For Gen Z
Generation Z: The Digital Natives
Generation Z: The Digital Natives
Chart 9Expensive...
Expensive...
Expensive...
Fundamentals And Valuations The Gen Z basket is certainly not cheap, trading at 28x forward earnings and 5.5x sales. This is rich but on par with the S&P 500 Growth index, which trades at 28x and 5.7x respectively (Charts 9 & 10). This basket has strong sales growth and has had a healthy post-COVID recovery bounce (Chart 11 ). Chart 10...But On Par...
...But On Par...
...But On Par...
Chart 11...With The S&P 500 Growth Index
...With The S&P 500 Growth Index
...With The S&P 500 Growth Index
How To Invest In Gen Z Gen Z presents an untapped investment opportunity. We have created our own Gen Z basket, as there is no direct way to play the Gen Z theme: There are no ETFs nor dedicated active funds in this space. While we used our entire basket in our analysis, it should not be viewed as an optimal investment vehicle. Instead, we advise using the basket as a helpful starting point and then filtering through its constituents to choose stocks that better meet one’s investment mandate. We emphasize that we are not stock pickers and that our company selections are mere illustrations of the investment thesis. We recommend investors to initiate a position in Gen Z themes, as they have a tremendous runway and are yet to go through their peak growth phase. Gen Z is a cyclical and structural investment idea and offers prospects for growth. Bottom Line Gen Z is coming of age and, being one of the largest cohorts in the US with $143B in buying power, wields increasing influence over consumer trends. The Gen Z investment thesis captures a host of nascent themes that reflect new generational preferences and spending patterns, such as fintech and online gaming, and a keen interest in investing and crypto, among others. Our Gen Z basket of stocks captures these investment themes, which are yet to go through their peak growth phase and provides investors with an opportunity to profit from them over short- and long-term investment horizons. Irene Tunkel Chief Strategist, US Equity Strategy irene.tunkel@bcaresearch.com Arseniy Urazov Senior Analyst ArseniyU@bcaresearch.com Footnotes 1 Sean McDowell, "6 Trends Among Gen Z in 2016" (Nov 23, 2016) 2 https://www.pymnts.com/news/payments-innovation/2020/why-digital-payments-innovation-sticks-to-gen-z/ 3 https://www.statista.com/statistics/426066/tinder-age-distribution/ 4 Susanna Schrobsdorff, “The Kids Are Not All Right,” Time (Nov 7, 2016): 47. 5 https://www.businessinsider.com/millennials-gen-z-drag-down-beer-sales-2018-2 Recommended Allocation
Highlights We are reviewing our recommendations. We are also introducing recommendation tables to monitor these positions. Overall, our main recommendations have generated alpha and have a positive batting average. Feature The end of the month of August offers an opportunity to review the positions recommended in this publication. We introduce three tables corresponding to three investment horizons—tactical, cyclical, and structural—which summarize our main views. Each table is subdivided by asset class, namely equities, fixed income, and currencies. The tables can be found on page 12 and 13 and will be available at the end of future strategy reports. Tactical Recommendations Short Equity Leaders / Long Laggards This position is down 1.4% since inception. The idea behind this bet was that the easy money in the market had been made, and investors needed to become more discerning, although the big-picture economic backdrop continued to favor a pro-cyclical, pro-risk bias in a portfolio. To achieve this goal, we opted to buy cyclicals sectors that had lagged the broad market and to sell the ones that had already overtaken their pre-COVID highs, in the hope of creating a portfolio hedge. Practically, this meant buying sectors such as Industrials, Banks and Energy, while selling sectors such as Capital goods, Autos and Consumer services (Chart 1). This position has not worked out well as yields fell. Chart 1Leaders vs Laggards
The Road So Far
The Road So Far
UK Mid-Cap And Small-Cap To Outperform This position is up 3.4% since inception. We initially favored the more domestically-oriented mid- and small-cap indices in the UK as a bet on the re-opening trade, following the lead taken by the UK in the global vaccination campaign. A faster re-opening would not only boost the ability of smaller domestic firms to generate cash flows, it would also elevate the pound, which would hurt the profit translation of the multinational dominating the UK large-cap indices. By mid-May, we opted to move small cap back to neutral, as the positive story was well discounted and we expected the GBP to correct, which would help large-cap stocks. Favor European Banks Relative To US Ones This position is up 4.1% since inception. It is mainly a value trade. The European economy has lagged behind that of the US, and European yields remain well below US ones. As a result, European financials have greatly underperformed their US counterparts. However, this performance differential has left European banks trading at an enormous discount relative to their US peers. Hence, as continental European economies were catching up to the US on the vaccination front, we expected European banks to regain some ground. This trade has further to go, as valuation differentials remain excessive, especially since European banks are not as risky as they once were. Underweight / Short Norway As Hedge To Swedish Stocks This position is down 1% since inception. We have a cyclical overweight on the Swedish equity market (see page 9), which is extremely sensitive to the global industrial cycle. Thus, we were concerned by the potential near-term impact of the Chinese credit slowdown on this position. Selling Norway remains an appropriate hedge, because this market massively overweight materials stocks, which are even more exposed to the Chinese credit cycle than industrials are. Positive European Small-Cap Stocks This position is up 0.2% since inception. This was a bet on the economic re-opening taking place in the wake of the accelerating pace of vaccination in Europe. However, the weakness in the Euro since May has caused the large-cap European stocks to perform almost as well as their more-domestically focused counterparts. Neutral Stance On Cyclicals Relative To Defensives Chart 2The Cause Of Our Cautious Tactical Stance
The Cause Of Our Cautious Tactical Stance
The Cause Of Our Cautious Tactical Stance
This trade is up 2.3% since inception. While we like cyclical plays on an eighteen to twenty-four months basis, we became concerned this spring about a tactical pullback. Globally, cyclical stocks had become extremely expensive and overbought relative to defensive sectors (Chart 2). Moreover, the rapid deceleration of the Chinese credit impulse pointed toward a period of negative economic surprises and was historically consistent with a period of underperformance of cyclical names. Now that China is stepping off the brake pedal, this trade is becoming long in the tooth. Neutral Stance On Europe Relative To The Rest of The World This trade is down 0.3% since its inception. This position is a corollary to the neutral view on cyclicals, as European equities possess a high beta. This bet did not pan out; European equities did underperform US stocks, but weaknesses in China and EM undid this benefit. Favoring Industrials Over Materials This trade is up 0.6% since inception. Industrial equities are less exposed to the Chinese credit slowdown than materials, but are more direct beneficiaries of the large infrastructure spending packages being rolled out across advanced economies. Industrials are also a direct bet on a capex recovery, which we expect to intensify over the next two years as companies address supply side issues. The tactical element of this trade may soon dissipate as China’s policy tightening ends, which would warrant booking profits. However, the industrials versus materials theme remains attractive as a cyclical bets on capex. Financials Over Other Cyclicals This trade is down 1.6% since inception. This was another trade aiming to keep some cyclical exposure on the book (long financials), while diminishing the exposure to the Chinese credit slowdown. The fall in yields and the weakness in the euro prevented this trade from working out. We now close this position. Long / Short Basket Based On Combined Mechanical Valuation Indicator This trade is flat since inception. This market-neutral trade uses the methodology developed in our May 31st Special Report in which we introduced our Combined Mechanical Valuation Indicator (CMVI). We bought the most undervalued sectors and sold the most overvalued. We will look to rebalance this portfolio in the coming months. Short Euro Area Energy Stocks / Long UK Energy Stocks Chart 3UK Energy Stocks As A Bargain
UK Energy Stocks As A Bargain
UK Energy Stocks As A Bargain
This trade is up 7.5% since inception. This market neutral trade was fully based on the results from our CMVI (Chart 3). We are taking profits today. Short Consumer Discretionary / Long Telecommunication In Europe This trade is up 10.6% since inception. It is our favored way to express our tactical worries toward cyclical equities and the resulting preference for defensive stocks. Moreover, this trade is attractive from a valuation perspective, as the CMVI gap between discretionary and telecommunication equities is at a record high despite the higher RoE offered by telecom equities (Chart 4). Short Tech / Long Healthcare In Europe This trade is up 9.3% since inception. It is a low-octane version of the short discretionary / long telecommunications position. While it is a short cyclicals / long defensive trade, it does not have the long value / short growth overlay as its higher-octane cousin. However, it is also supported by attractive valuation differentials (Chart 5). Chart 4An Extreme Version Of Short Cyclicals / Long Defensives...
An Extreme Version Of Short Cyclicals / Long Defensives...
An Extreme Version Of Short Cyclicals / Long Defensives...
Chart 5...and A Lower Octane Expression
...and A Lower Octane Expression
...and A Lower Octane Expression
Favor Spain Over France This trade is down 2% since inception. Based on sectoral composition, the Spanish market is more defensive than that of France, which was an appealing characteristic considering our tactical worries for cyclical bets. Moreover, Spanish equities were more attractively priced. However, the Spanish economy has proven less resilient to the Delta variant than that of France. As a result, Spanish financials, which represent a large share of the national benchmark, have suffered. Underweight French Consumer Discretionary Equities Relative To Global Peers This trade is up 0.6% since inception. French discretionary stocks, led by beauty and luxury names, remain attractive structural plays. However, they have become expensive and risk temporarily underperforming their foreign competitors. Buy Swiss Equities / Sell Eurozone Defensive This trade is up 0.5% since inception. Due to their sectoral bias toward consumer staples and healthcare, Swiss equities are extremely defensive. However, they often outperform their Euro Area counterparts when Swiss yields rise relative to those of Germany. We do expect such widening to take place over the coming months. The ECB will continue to expand its balance sheet, which will force the SNB to become increasingly active about putting a floor under EUR/CHF. Historically, these processes boost Swiss stocks relative to Eurozone defensives. Buy European Momentum Stocks / Sell European Growth Stocks Chart 6The Recovery In Momentum Stocks Can Run Further
The Recovery In Momentum Stocks Can Run Further
The Recovery In Momentum Stocks Can Run Further
This trade is up 1.7% since inception. In Europe, momentum stocks are exceptionally oversold relative to growth stocks (Chart 6). As yields stabilize, momentum stocks are well placed to outperform growth equities. Moreover, this trade is a careful attempt to begin to move away from our defensive tactical stance as China backs away from policy tightening. More Value Left In European IG This trade is up 0.9% so far. European IG bonds have low spreads, but their breakeven spreads may narrow further as policy remains extremely accommodative and European growth continues to recover, even in the face of the Delta variant. In this context, we see the modest yield pick-up offered by these products as attractive, especially compared to the meagre yields generated by European safe-haven securities. Despite the modest success of the overall recommendation, the country implication did not work out as well. Overweight Italian And Spanish Bonds In Balance Portfolios This trade is up 0.2% since inception. Italian and Spanish government bonds are expensive in absolute terms, but compare well relative to French, Dutch, or German bonds. In a backdrop in which the ECB continues to purchase these instruments, where the NGEU funds create an embryo of fiscal risk-sharing within the EU and where growth is recovering, risk premia in the European periphery have room to decline further. Buy European Steepeners And US Flatteners As A Box Trade Chart 7Buy European Steepeners and US Flatteners
Buy European Steepeners and US Flatteners
Buy European Steepeners and US Flatteners
This trade is up 63 bps since inception. The ECB will lag behind the Fed, but market pricing already reflects this future. Meanwhile, the terminal policy rate proxy embedded in the EONIA and US OIS curves overstates how high the neutral rate is in the US compared to that of Europe (Chart 7). Thus, as the Fed begins to remove accommodation in the US, the US yield curve should flatten compared to that of Europe. Favor The GBP Over The EUR This trade is up 0.6% since inception. The pound is cheaper than the euro, and the domestic UK economy is well supported by the more advanced re-opening process. This combination will continue to hurt EUR/GBP. Sell EUR/NOK This trade is down 2.6% since inception. The NOK is cheaper than the EUR, and the Norges Bank will lead DM central banks in raising interest rates. Moreover, higher oil prices create a positive term of trade shock in favor of Norway. However, this trade has not worked out so far. Among G-10 currencies, the NOK (along with the SEK) is the most sensitive to the USD’s fluctuations. The rebound in the Greenback since March has therefore hurt this position significantly. Cyclical Recommendations Overweight Stocks Vs Bonds This position is up 7% since inception. European equities follow the global business cycle; while we warned a slowdown would take shape, growth is slated to remain above trend for the foreseeable future. Consequently, while we may adjust tactical positioning to take advantage of these gyrations in growth relative to expectations, our core cyclical view remains to overweight stocks within European balanced portfolios. Overweight Bank Equities Chart 8Euro Area Banks Are Not As Risky Anymore
Euro Area Banks Are Not As Risky Anymore
Euro Area Banks Are Not As Risky Anymore
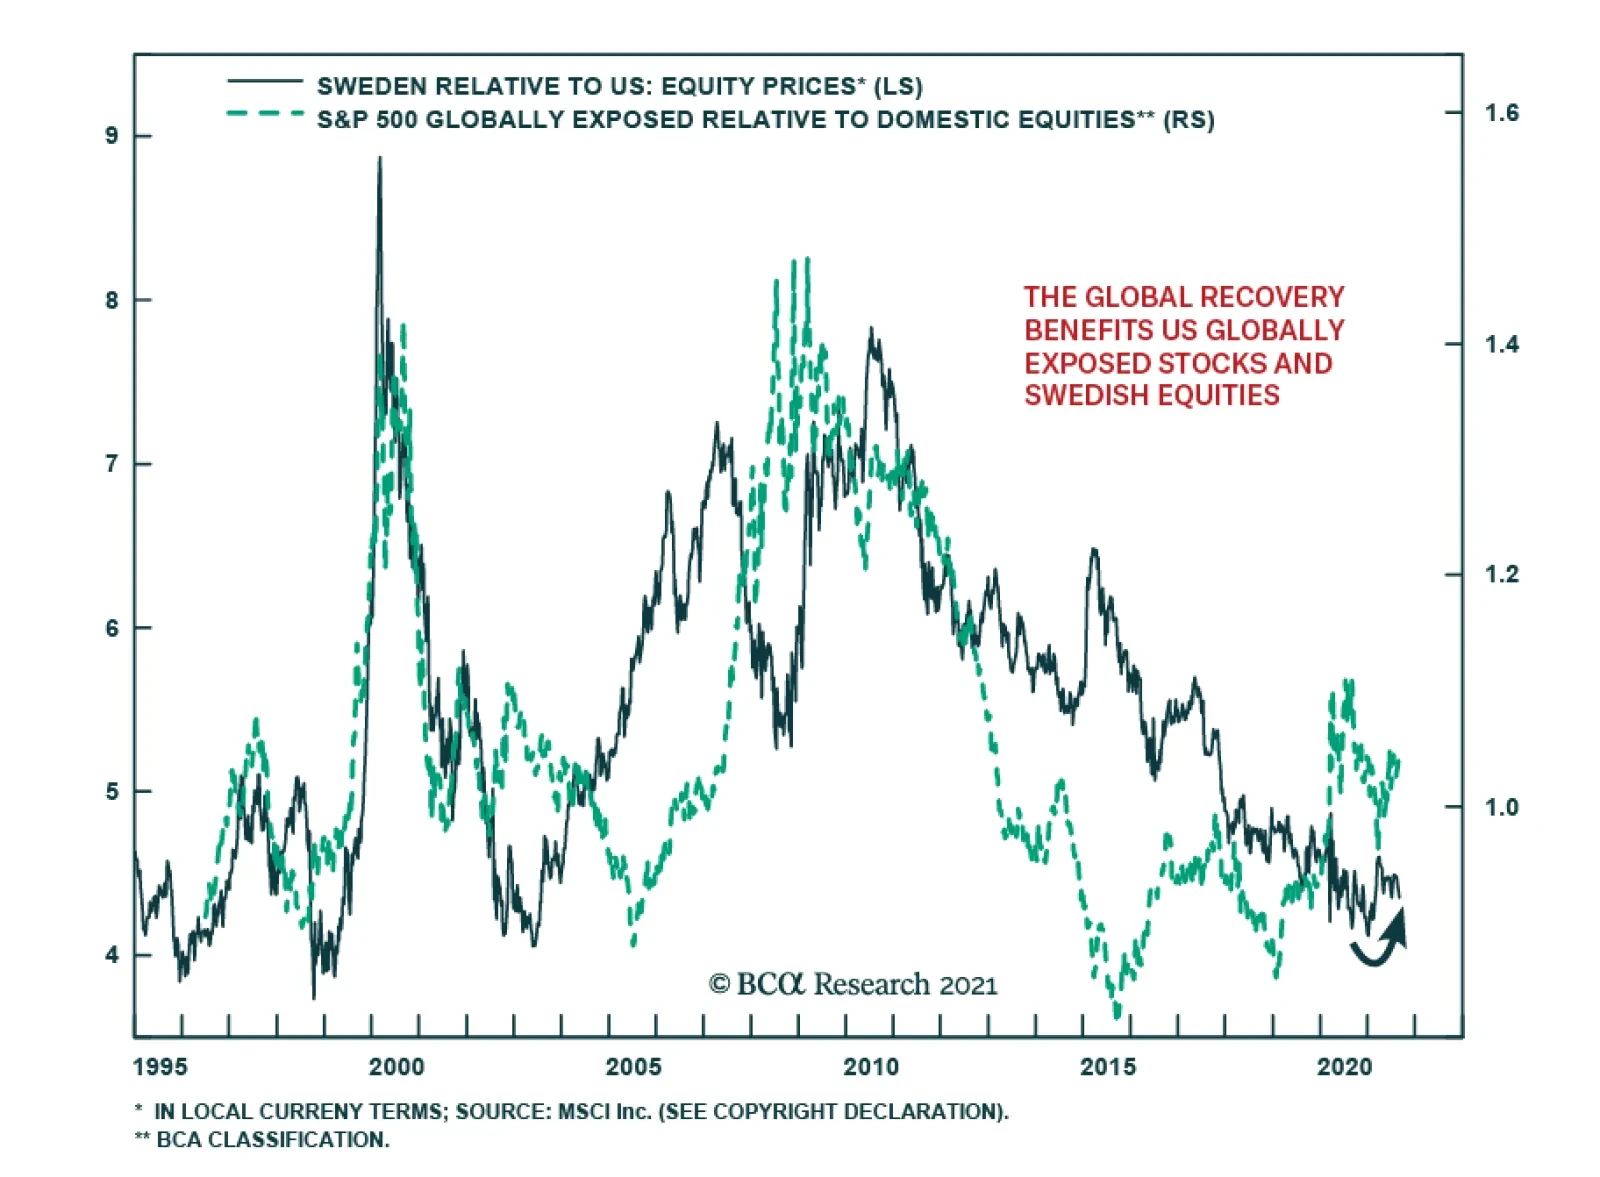
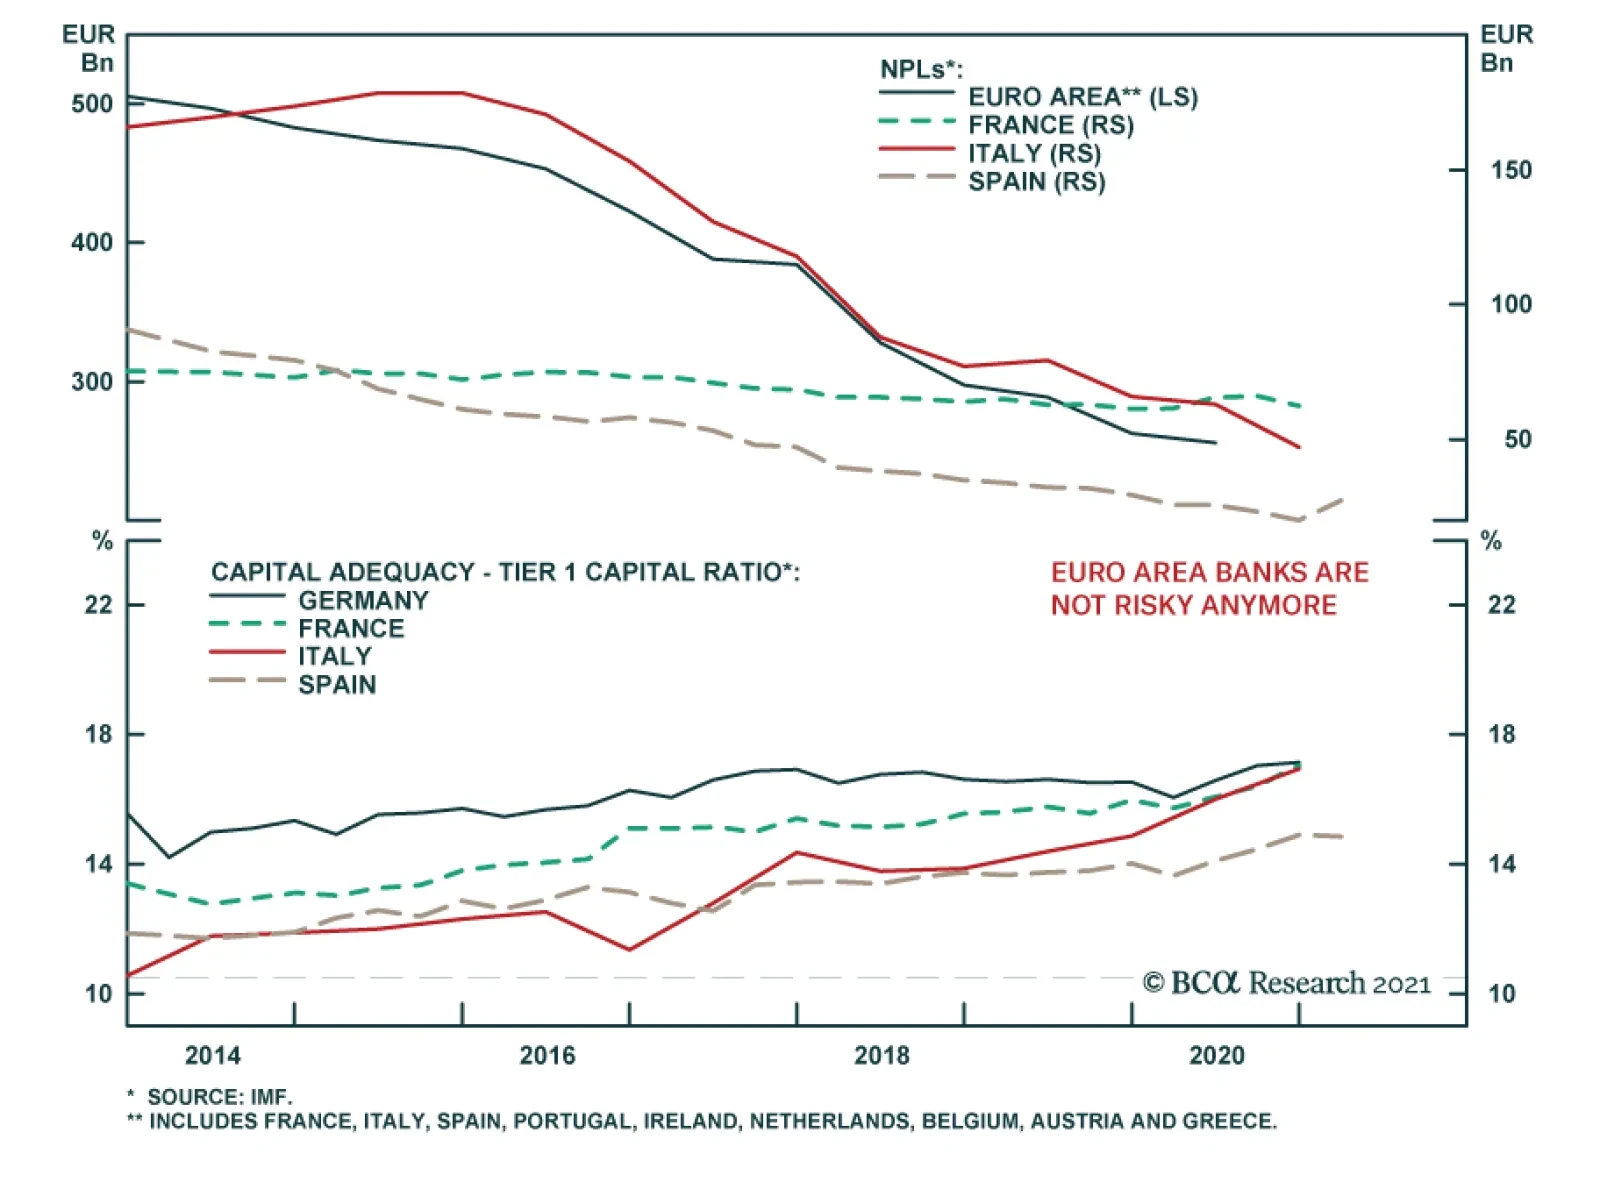
This position is up 2.4% since inception. We have espoused the near-term decline in yields, but our big picture cyclical view remains that yields have more upside globally. An environment in which yields increase is one in which bank profit margins expand, which will in turn boost the relative return of cheap financial equities. Even though the long-term growth rate of bank cash flows warrants a discount, these firms’ valuations also reflect the perception that they carry elevated risks. However, if European NPLs have greatly improved, capital buffers have expanded significantly (Chart 8), and the ECB is unwilling to precipitate a crisis as it did ten years ago. In this context, the risk premia embedded in European bank valuations have room to decrease, which will boost the relative performance of these equities. Bullish German Equities (Absolute) This position is up 3.9% since inception. German stocks are a direct bet on the global economy, as a result of their heavy weighting in industrials and consumer discretionary stocks. Moreover, the German economy continues to fare well, boosted by a cheap euro and a low policy rate. Finally, we expect German fiscal policy to remain accommodative after the upcoming federal election weakens the power of the CDU. This combination will allow German stocks to generate further upside over the coming years. Favor Swedish Equites Over Eurozone And US Benchmarks Since inception, this position is up 0.9% on its European leg and is up 0.3% on its US leg. Sweden is a particularly appealing market despite its demanding valuations. The Swedish benchmark overweighs industrials and financials, two of our favorite sectors for the coming eighteen months. Moreover, the Swedish corporate sector’s operating metrics are robust, with wide profit margins, elevated RoEs, and comparatively healthy levels of leverage. Finally, the SEK is one of our favored currencies on a twenty-four-month basis, because it has a strong beta to the USD, which BCA expects to depreciate on a cyclical time frame. Buying Sweden versus the Eurozone has worked out, but selling the US market has not, because yields experienced a countertrend decline. Once global yields begin to rise anew and Chinese credit growth begins to recover, Swedish equities should also beat their US peers. Long Swedish Industrials / Short Eurozone And US Industrials Chart 9Favor Swedish Industrials
Favor Swedish Industrials
Favor Swedish Industrials
This position is up 3% on its European leg and 8.5% on its US one. This market neutral position narrows in on the very reason to favor Swedish equities: industrials. As is the case for the overall market, Swedish industrials offer stronger operating metrics than their counterparts in both the Eurozone and the US (Chart 9). Additionally, the early positioning of Sweden in global supply chains adds some operating leverage to these firms, which gives them an advantage in an environment of continued inventory rebuilding, infrastructure spending, and capex plans around the world. Underweight German Bunds Within European Fixed-Income Portfolios German bund yields have declined 15bps since inception. German Bunds suffer from their extremely demanding valuations versus other European fixed-income securities. As long as global and European growth remains above trend, German yields should underperform other European fixed-income assets, even if the ECB stands pat for the foreseeable future (which would force greater spread compression across European markets). Weakness In EUR/USD Creates Long-Term Buying Opportunities Earlier this spring, we expected the dollar to experience a counter-trend bounce as a result of skewed positioning and the potential for a decline in global growth surprises. However, BCA’s cyclical view calls for a weaker USD because of the US balance of payments deficit, the greater tolerance of the Fed for higher inflation, and the overvaluation of the Greenback. Based on these diverging forces, we continue to recommend investors use the current episode of weakness in EUR/USD as an opportunity to garner more exposure to the euro. Short EUR/SEK This position is down 0.6% since inception. The SEK is even more sensitive to the dollar’s gyration than the euro. Moreover, beyond some near-term disappointment in global economic activity, we expect global growth to remain generally robust over the coming eighteen months. This combination will allow the SEK to appreciate versus the EUR, especially when Sweden’s domestic economic activity and asset markets are stronger than that of the Eurozone. Structural Recommendations A Structural Underweight On European Financial Chart 10Too Much Capital
Too Much Capital
Too Much Capital
This long-term position is at odds with our near-term optimism about the sector. However, Europe has an excessively large capital stock, which, relative to GDP, dwarves that of the US or China (Chart 10). This phenomenon hurts rate of returns across the region and will remain a long-term structural handicap for the financial industry. Hence, investors with long investment horizons should use the expected rebound in European financials over the next year or two to diminish further their exposure to that sector. Norwegian Equities Remain Challenged As Long-Term Holdings Norwegian stocks overweight the financials, materials, and energy sectors. While materials face a bright future as electricity becomes an even more important component of the global energy mix, financials and energy face deep structural headwinds. Moreover, the krone faces its own structural challenges (see below). This combination augurs poorly for the long-term rates of return of Norwegian stocks. Overweight French Industrials Relative To German Ones This position is a bet on the continuation of the reform efforts of the French economy. BCA expects Emmanuel Macron to win a second mandate next year, which should result in additional reforms to the French economy. As a result, the French unit labor costs should remain contained relative to those of Germany. This process will help the profit margins of French industrial firms relative to that of their competitors across the Rhine. Overweight French Tech Equities Relative To European Ones French tech stocks will benefit from the greater R&D subsidies and budgets promoted by the French government. The Euro Will Underperform Pro-Cyclical European Currencies The Swedish krona and the British pound are particularly attractive versus the euro on a long-term basis. They benefit not only from their cheaper valuations, but also from the fact that the Riksbank and the Bank of England will tighten policy considerably ahead of the ECB. Additionally, the SEK and the GBP are now both more pro-cyclical than the euro. The Norwegian Krone Faces Structural Challenges The NOK is cheap and may even benefit in the coming month from its historical pro-cyclicality. However, Norway suffers from declining productivity relative to that of its trading partners, which creates a strong long-term handicap for its currency. As a result, long-term investors should withdraw from the NOK. Mathieu Savary, Chief European Strategist Mathieu@bcaresearch.com Tactical Recommendations
The Road So Far
The Road So Far
Cyclical Recommendations
The Road So Far
The Road So Far
Structural Recommendations
The Road So Far
The Road So Far
Currency Performance Fixed Income Performance Equity Performance
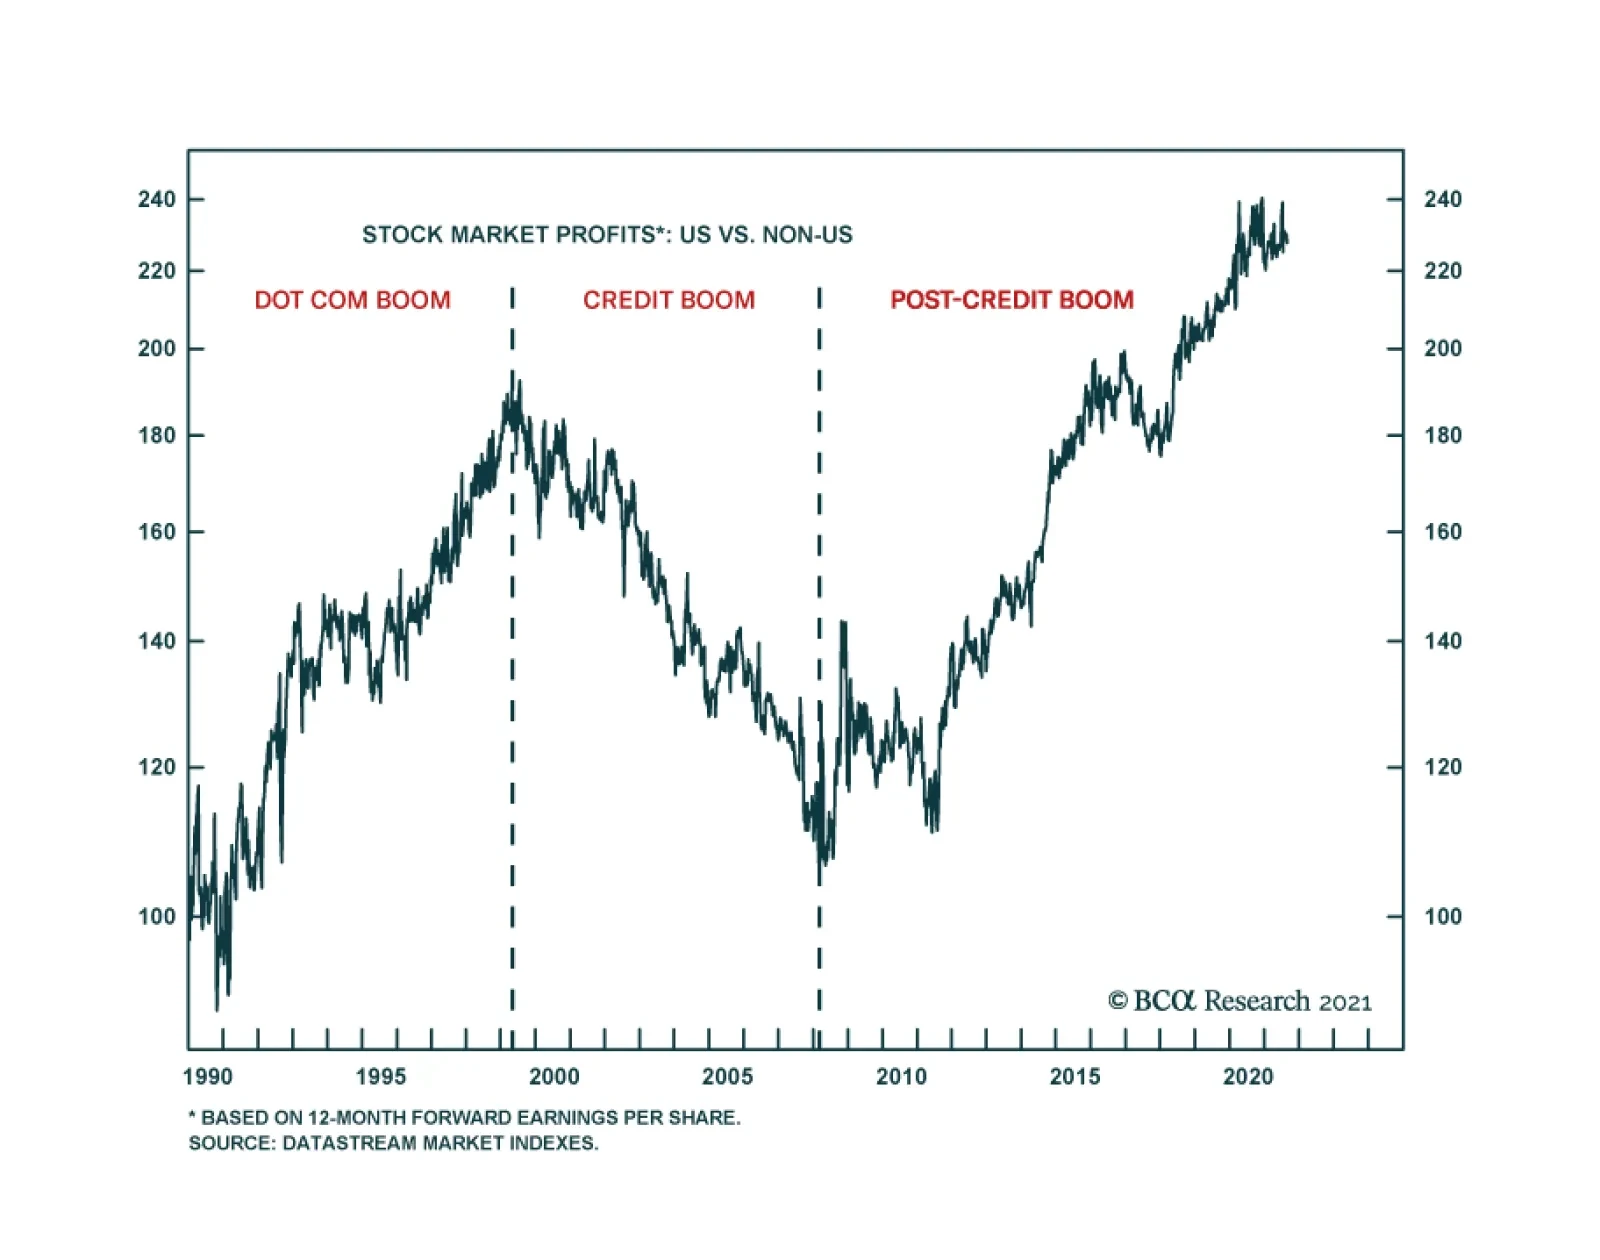
Since 1990, there have been three distinct phases for investors: the dot com boom; the credit boom; and the post-credit boom. The first phase was the 1990s build-up to the dot com boom. This phase clearly favoured growth sectors, and thereby the US stock…
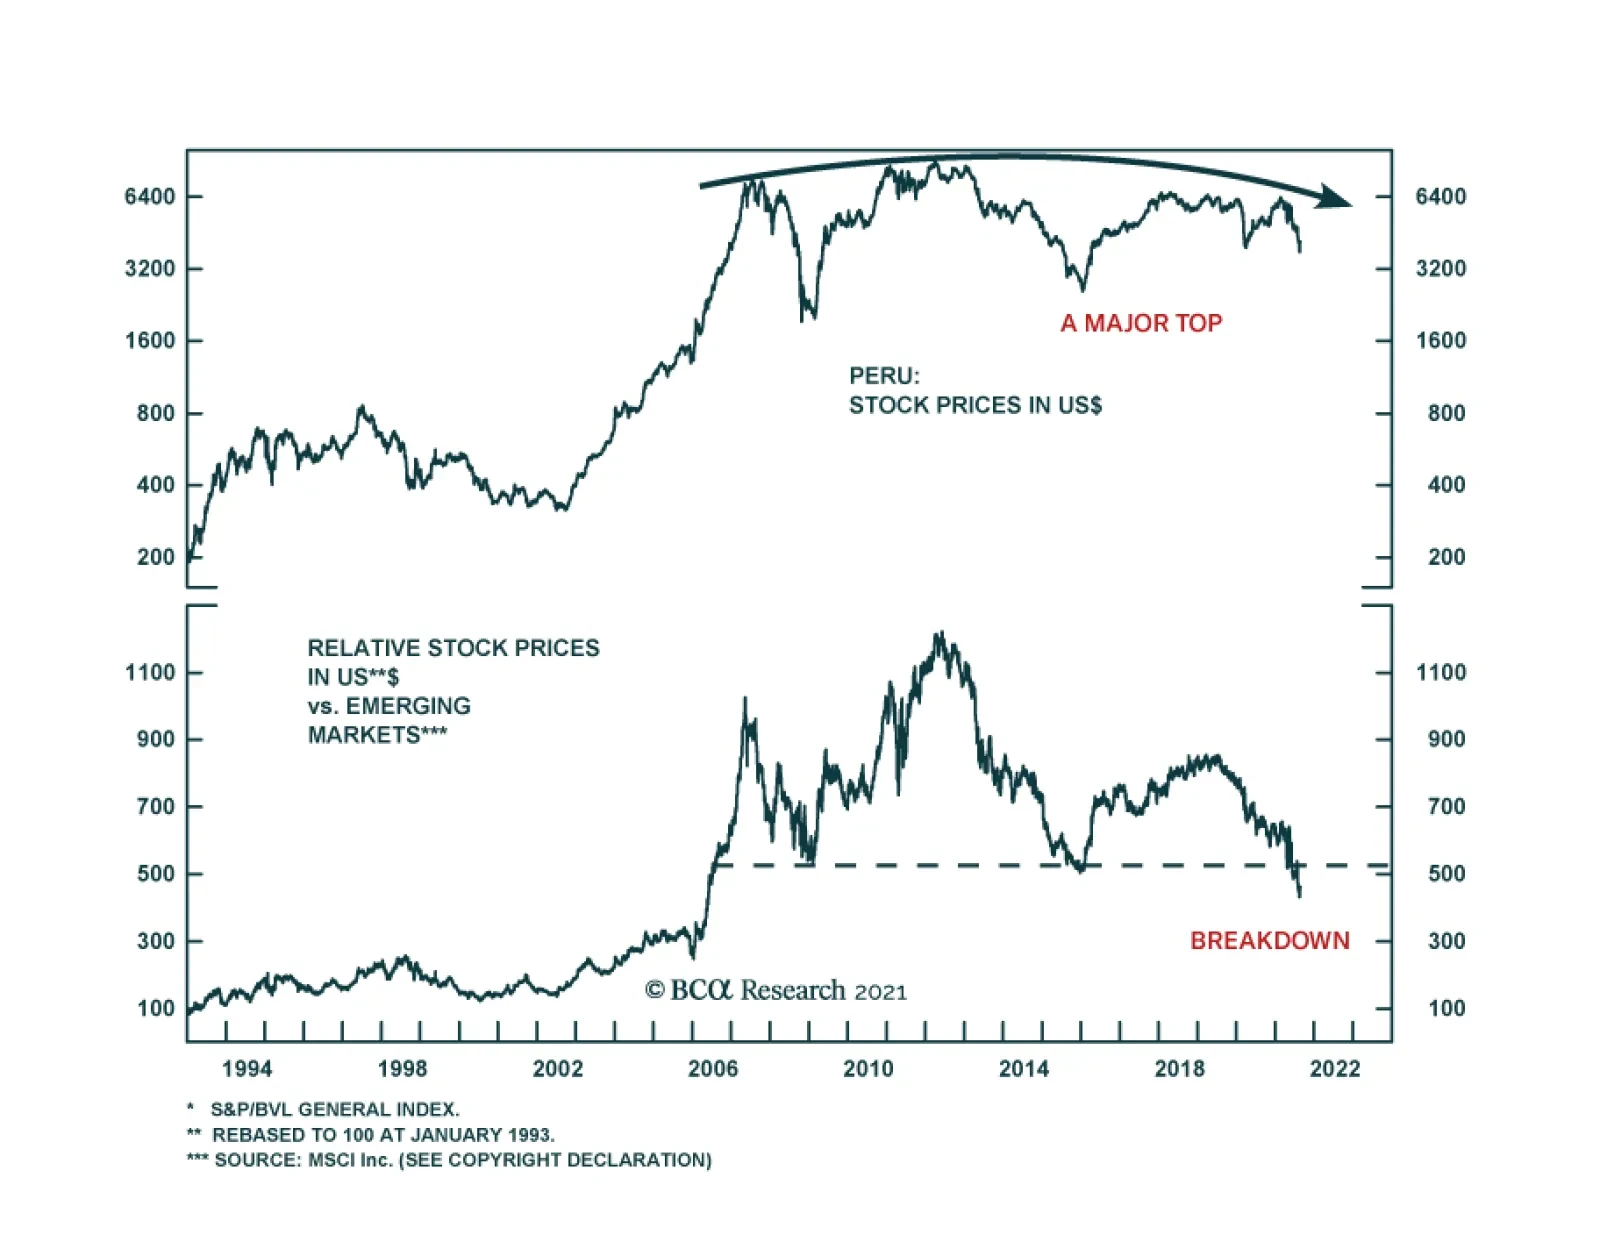
Peru's financial assets have plummeted due to the election of left-wing president Pedro Castillo. Some investors may be tempted to bottom fish in these markets due to their lower valuations and oversold conditions. However, political volatility has not yet…