Equities
Peru's financial assets have plummeted due to the election of left-wing president Pedro Castillo. Some investors may be tempted to bottom fish in these markets due to their lower valuations and oversold conditions. However, political volatility has not yet…

Weekly Performance Update For the week ending Thu Aug 26, 2021 The Market Monitor displays the trailing 1-quarter performance of strategies based around the BCA Score. For each region, we construct an equal-weighted, monthly rebalanced portfolio consisting of the top 3 stocks per sector and compare it with the regional benchmark. For each portfolio, we show the weekly performance of individual holdings in the Top Contributors/Detractors table. In addition, the Top Prospects table shows the holdings that currently have the highest BCA Score within the portfolio. For more details, click the region headers below to be redirected to the full historical backtest for the strategy. BCA US Portfolio
Market Monitor (Aug 26, 2021)
Market Monitor (Aug 26, 2021)
Total Weekly Return BCA US Portfolio S&P500 TRI 0.70% 1.48% Top Contributors R:US TX:US DELL:US EOG:US GOOG.L:US Weekly Return 26 bps 18 bps 17 bps 13 bps 13 bps Top Detractors ESGR:US HSY:US SIM:US JNJ:US BMY:US Weekly Return -11 bps -9 bps -8 bps -7 bps -7 bps Top Prospects TX:US ESGR:US SC:US MPLX:US ANAT:US BCA Score 98.12% 96.97% 95.88% 95.60% 95.34% BCA Canada Portfolio
Market Monitor (Aug 26, 2021)
Market Monitor (Aug 26, 2021)
Total Weekly Return BCA Canada Portfolio S&P/TSX TRI 2.25% 1.46% Top Contributors AND:CA CS:CA WFG:CA TOU:CA POU:CA Weekly Return 33 bps 29 bps 26 bps 25 bps 23 bps Top Detractors GIB.A:CA TD:CA ELF:CA WIR.UN:CA ACO.X:CA Weekly Return -8 bps -7 bps -6 bps -4 bps -3 bps Top Prospects RUS:CA PXT:CA WIR.UN:CA ELF:CA LNF:CA BCA Score 98.73% 97.46% 95.98% 94.53% 93.89% BCA UK Portfolio
Market Monitor (Aug 26, 2021)
Market Monitor (Aug 26, 2021)
Total Weekly Return BCA UK Portfolio FTSE 100 TRI 0.99% 1.02% Top Contributors SFOR:GB TUNE:GB DOTD:GB 888:GB VVO:GB Weekly Return 30 bps 24 bps 15 bps 11 bps 11 bps Top Detractors NVTK:GB REDD:GB MXCT:GB SSE:GB TEP:GB Weekly Return -12 bps -9 bps -6 bps -4 bps -3 bps Top Prospects SVST:GB VVO:GB NLMK:GB POLR:GB ROSN:GB BCA Score 98.47% 96.82% 96.10% 96.01% 95.91% BCA Eurozone Portfolio
Market Monitor (Aug 26, 2021)
Market Monitor (Aug 26, 2021)
Total Weekly Return BCA EMU Portfolio MSCI EMU TRI 0.64% 0.87% Top Contributors ALESK:FR SES:IT CEM:IT TFI:FR NESTE:FI Weekly Return 21 bps 16 bps 14 bps 13 bps 13 bps Top Detractors ROVI:ES HLAG:DE ALTA:FR JMT:PT FDJ:FR Weekly Return -47 bps -24 bps -18 bps -6 bps -3 bps Top Prospects HLAG:DE STR:AT SOLV:BE IPS:FR FDJ:FR BCA Score 99.21% 98.86% 96.89% 95.35% 95.26% BCA Japan Portfolio
Market Monitor (Aug 26, 2021)
Market Monitor (Aug 26, 2021)
Total Weekly Return BCA Japan Portfolio TOPIX TRI 2.14% 2.01% Top Contributors 6960:JP 2124:JP 8097:JP 3291:JP 9509:JP Weekly Return 23 bps 21 bps 20 bps 18 bps 14 bps Top Detractors 4966:JP 3459:JP 8977:JP 7970:JP 1835:JP Weekly Return -3 bps -2 bps -1 bps -1 bps -0 bps Top Prospects 6960:JP 9436:JP 5930:JP 2208:JP 4694:JP BCA Score 99.56% 99.05% 98.57% 98.39% 98.27% BCA Hong Kong Portfolio
Image
Total Weekly Return BCA Hong Kong Portfolio Hang Seng TRI 1.10% 0.54% Top Contributors 6118:HK 856:HK 1381:HK 86:HK 1088:HK Weekly Return 68 bps 23 bps 21 bps 20 bps 17 bps Top Detractors 215:HK 973:HK 1866:HK 2232:HK 874:HK Weekly Return -21 bps -15 bps -14 bps -12 bps -12 bps Top Prospects 1277:HK 691:HK 98:HK 316:HK 590:HK BCA Score 99.99% 99.55% 98.30% 98.22% 98.06% BCA Australia Portfolio
Market Monitor (Aug 26, 2021)
Market Monitor (Aug 26, 2021)
Total Weekly Return BCA Australia Portfolio S&P/ASX All Ord. TRI 0.12% 0.60% Top Contributors 360:AU BLX:AU PSQ:AU MAQ:AU CAJ:AU Weekly Return 49 bps 38 bps 26 bps 20 bps 17 bps Top Detractors JLG:AU YAL:AU EZL:AU MGX:AU APA:AU Weekly Return -50 bps -48 bps -22 bps -19 bps -17 bps Top Prospects GRR:AU PIC:AU BFG:AU CAJ:AU BLX:AU BCA Score 99.83% 99.48% 97.67% 97.60% 94.99%

The S&P 500 has just hit its 50th all-time high this week, while the 10% pullback, widely anticipated by the professional investors, is yet to materialize. To be sure, the last pullback of such magnitude took place nearly a year ago, in October of 2020. In March of this year, US equities attempted a correction but mastered only a 5% dip. And last week, a confluence of scares, such as a spike in Delta variant infections, troubling stories on the US withdrawal from Afghanistan, and Fed minutes indicating that tapering is just around the corner, has resulted in a meager 3% retreat from the peak. There are a lot of new retail investors in the US markets, and the “buy the dip mentality” is prevalent. Indeed, compared to history, since 2020, the drawdowns are getting shallower and shallower. What does this mean? With institutional equity allocations at all times high, it is retail equity inflows that are propelling the markets to the new highs. What’s next? The driver of equity returns has shifted from multiple expansion to earnings growth (see recent Sector Insight report). We expect companies to continue deliver strong earnings that surpass analysts’ expectations, driving the US equities higher. As for the dips - there is still a lot of retail money sitting on the sidelines, ready to step in, shrugging off bad news, smoothing out equity volatility, and stabilizing equity markets. Bottom Line: We are constructive on the prospects of the broad equity market.
“Buy The Dip” Mentality
“Buy The Dip” Mentality
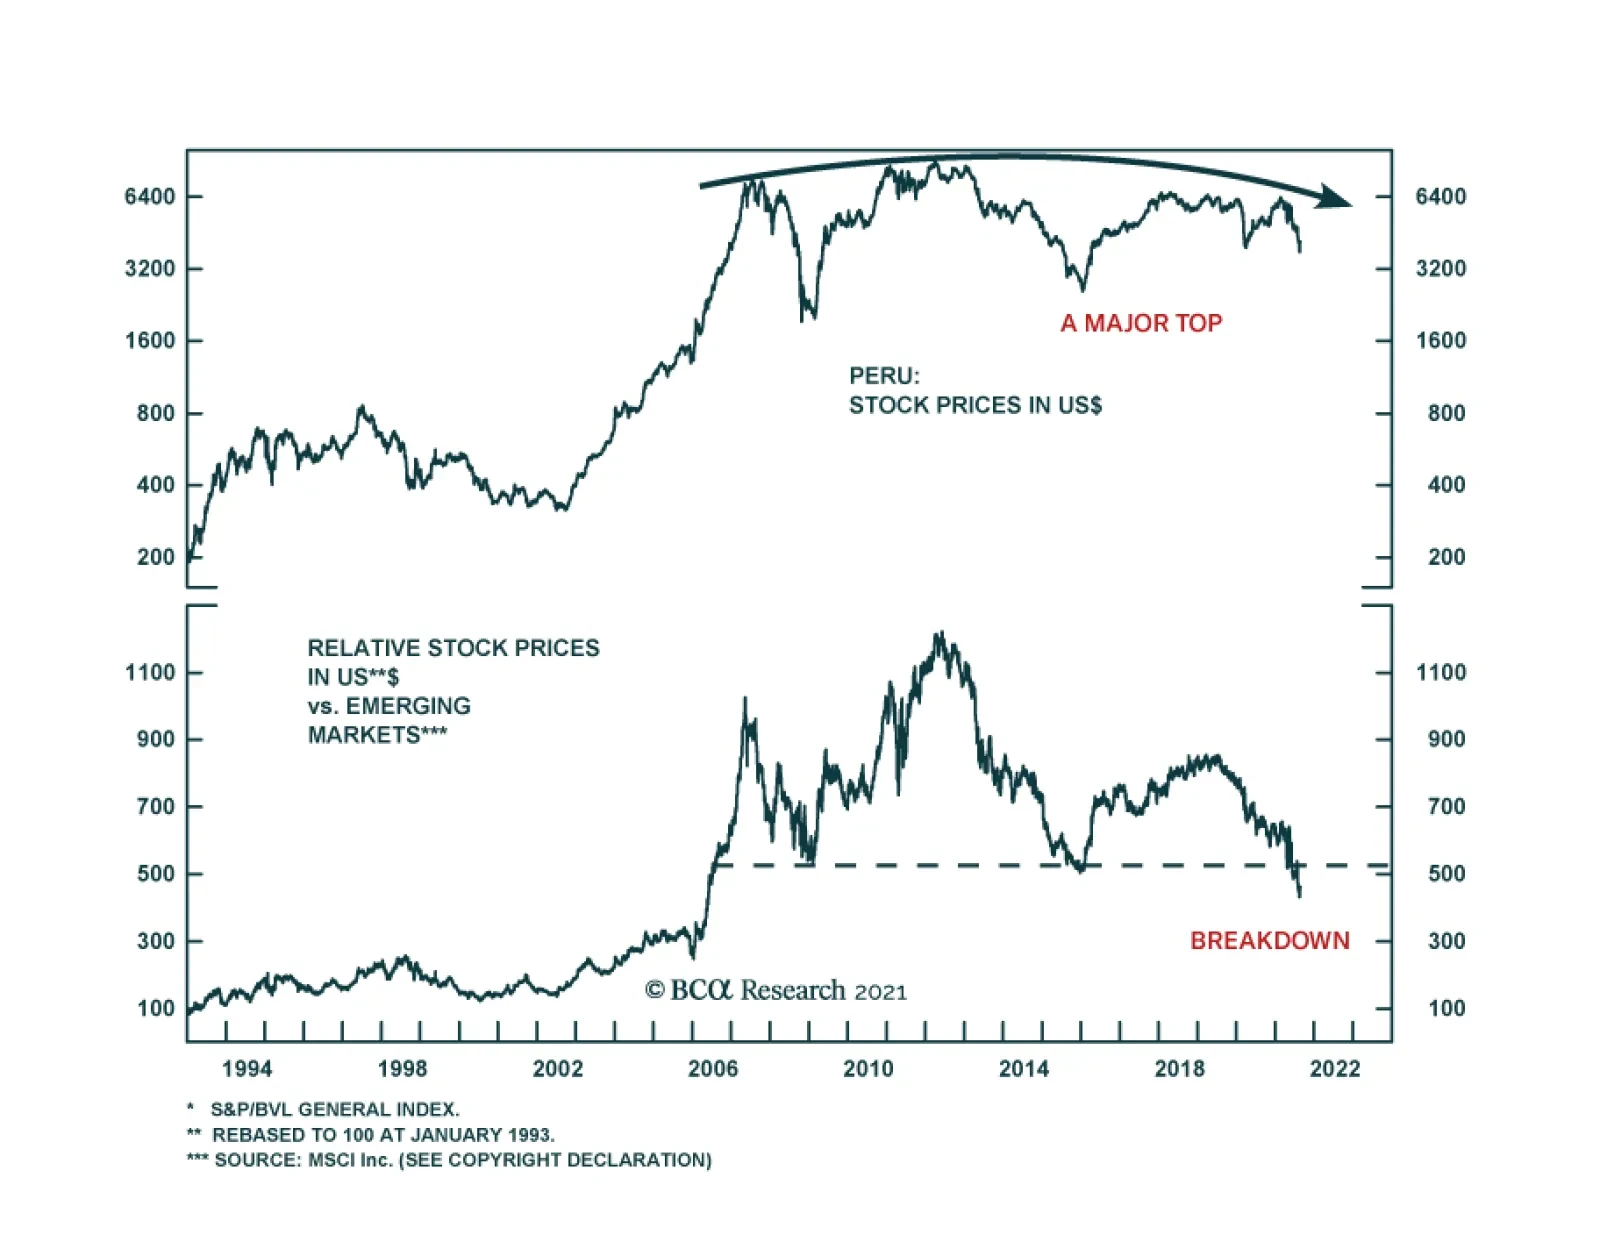
This week I have been holding client calls and roundtables with clients located in the EMEA region. In next week’s report we will share our answers to the most common client questions. In the meantime, this week we are sending you a report about Peru that discusses the political situation and the outlook for the nation’s financial markets. Best regards, Arthur Budaghyan Highlights Do not bottom fish in Peruvian financial markets. Political volatility has not yet reached its apex. Clashes between the government and congress are inevitable. Either president Pedro Castillo will be impeached and massive protest will follow, or his party’s radical leftist agenda will be at least partially legislated. Neither scenario bodes well for Peru’s financial markets. Capital outflows and lower metal prices pose a threat to the exchange rate. Go short the sol versus the US dollar. Dedicated EM equity and fixed-income managers should continue underweighting Peru in their respective portfolios. Feature Chart 1Peru: Absolute And Relative Equity Performance
Peru: Approaching A Boiling Point
Peru: Approaching A Boiling Point
Peru’s financial assets have plummeted due to the election of left-wing president Pedro Castillo. Some investors may be tempted to bottom fish in these markets due to their lower valuations and oversold conditions (Chart 1, top panel). Some may attempt to draw parallels with Brazil’s 2002 election of Lula da Silva which initially triggered a selloff in Brazilian financial markets followed by a substantial rally during the president’s two terms in office. Will that be the case with Peruvian markets? We do not think so. Unlike twenty years ago in Brazil, Peru is currently facing a much worse political and economic outlook. Overall, the political volatility as well as deteriorating macro fundamentals warrant a higher risk premium on Peruvian assets. Thus, we recommend investors underweight Peru within EM equity, local, and sovereign fixed-income portfolios (Chart 1, bottom panel). A Political Showdown Is Looming One could argue that Peruvian financial markets have hit a floor and that much of the bad news has already been priced. Another argument is that Castillo will not be able to pass sweeping socio-economic reforms because of strong opposition from congress. In our opinion, Peru has yet to reach peak political tensions, which may very well end with a bang. Given this heightened political uncertainty, investors should brace themselves for a rocky ride. We identify two main risks plaguing Peruvian politics. First, the unsustainable ideological divide within Castillo’s proposed cabinet between far-left militants and the pragmatic center-left. Second, the looming clash between a government that wants to upend the country’s socioeconomic system and a notoriously harsh congress keen on making the president’s job unbearable. Intra-Government Dichotomy The ideological divide in Castillo’s government is extreme. On one side is the Marxist-Leninist wing, headed by Free Peru’s party leader, Vladimir Cerrón, and prime minister candidate, Guido Bellido. On the other side is the left-to-center members, headed by Pedro Francke, the minister of finance candidate. The more extremist Marxist-Leninist camp constitutes the majority, while moderates are a minority. Critically, the Marxist-Leninist radicals will make few concessions to the moderate ministers, as the former believe they have a mandate from the people to upend the country’s socio-economic system. Nevertheless, the policies supported by the general public are more nuanced than that. According to a national Ipsos survey from August, 85% of respondents believe president Castillo should govern with technocrats in his governments’ key positions. Only 11% support him making the ideology of his party the centerpiece of his policies and promoting (radical) members of his party. This shows how Castillo’s victory was more of a national referendum against Fujimori and the corrupt political elites than support for a radical socialist government. We elaborated on this topic in our previous report on Peru. The wide ideological divide between the party and a few moderate members of the cabinet in key positions will make governing extremely difficult. Cracks are already beginning to form. Bellido and Francke hold different views on the role of the state in the economy. Bellido, on the one hand, has stated he supports state-owned companies in commodity-extracting sectors (particularly natural gas and hydroelectricity) and the drafting of a new constitution to give the state greater ownership of mining contracts. Francke, on the other hand, wants to reinstate fiscal spending caps and is less harsh with multinational companies, favoring an increase only in mining taxes. Furthermore, there is significant uncertainty around the government’s official fiscal plan, as Francke has avoided giving clear figures on fiscal expenditures and social programs. To make matters worse, there is growing concern that it is party leader Cerrón who is de facto in charge, and that he has an enormous influence on Castillo. Cerrón is unpopular among voters as a result of his criminal allegations, close ties to the Cuban regime, and often apologetic stance toward the Maoist terrorist group, Shining Path. Although he intended to run as the presidential candidate for Free Peru, he was banned from the election because of ongoing criminal accusations, which is why he handpicked Castillo as his replacement. Without a doubt, he intends to be heavily involved in government decision-making. According to the same Ipsos poll we cited earlier, 61% of Peruvians believe Cerrón is either de facto in charge of the government or holds considerable sway over Castillo. The biggest risk to financial markets will be the eventual dismissal or resignation of finance minister Francke. This may happen as he eventually realizes that the radicals will concede very little. This would also lead to a resignation of orthodox central bank governor Julio Velarde, who Francke has been able to convince to remain in his post. These two resignations would result in another riot in Peruvian markets, as the investment and business communities fully lose confidence in Castillo’s government. An Inevitable Clash Between The Government And Congress Being president in Peru is a notoriously difficult job due to the large sway that congress has on legislation and governing. The outcome of this constant confrontation between the president and congress has been five different presidents in the past five years alone. Critically, this tension has never been higher. The government and congress hold diametrically opposed views on the broad vision and strategy for the nation and how the economy should be managed. On the one hand, congress is mainly composed of traditional centrist parties and the opposition holds a majority—Castillo’s coalition has only about 39% of the seats. On the other hand, the government has just been elected on a far-left reformist platform. In essence, both the government and congress have incentives and the determination to be as obstructive as possible for each other. As tensions ramp up and confrontation becomes inevitable, the risks of unrest and clashes between supporters of Castillo and congress will rise. Table 1Peru: Voters Support More Moderate Politicians
Peru: Approaching A Boiling Point
Peru: Approaching A Boiling Point
In congress’s point of view, they have a mandate to serve as an opposing force to Castillo’s radicalism: There is some validity to this claim. The opposition holds a majority, and congress president Maricarmen Alva is by far more popular than the leaders of the Free Peru party like Cerrón and Bellido (Table 1). Given that Castillo’s ideology is a threat to the nation’s current socio-economic model and, thereby, to the political establishment, the majority in congress would prefer to block all radical legislation, including the appointments of controversial cabinet members. In addition, they will use all manner of accusations and alleged linkages between cabinet members and Shining Path to impeach Castillo. Congress needs only 87 votes, which means they need to convince only eight members from the governing alliance to impeach Castillo. In turn, the government argues it was elected to upend the country’s status quo and confront the unpopular political elites: Critically, the president has the ability to dissolve congress after two votes of no confidence, thereby putting pressure on congress to abide by the government’s radical proposals. This latter point and the fact that congress has little popular support provide leverage for the government over congress. Given the fact that current congressional members cannot be reelected, they might be more careful about how they maneuver, so that they do not provoke Castillo to dissolve congress. There are, therefore, two extreme possible outcomes. On one hand, congress may impeach the president, triggering a social revolt from Castillo’s hardline supporters against congress. On the other hand, congressional members may allow the passing of a leftist legislative agenda in order to maintain their seats, which would gravely reduce corporate profitability and productivity in Peru. Both scenarios would result in a collapse of investor and business confidence, leading to more capital flight and a riot in Peruvian financial markets. Bottom Line: Political volatility in Peru has not yet reached its apex. Clashes between the government and congress are inevitable, as well as among key cabinet members. Such elevated political volatility warrants a higher risk premium on Peruvian assets. Return Of Macro Instability Peru enjoyed a period of relative macro stability from the early 2000s until recently. Its currency, local interest rates, and sovereign spreads have fluctuated less than those in other Latin American countries. However, the nation’s economy and financial markets have entered a period of heightened volatility. Both domestic and external macro factors have turned into headwinds for the Peruvian economy and financial markets. Chart 2Peru: Business Confidence Will Continue Plummeting
Peru: Approaching A Boiling Point
Peru: Approaching A Boiling Point
Domestically, the economic recovery has been uninspiring, and multiple indicators point to growth disappointments ahead: Business confidence took another serious hit with the election of Castillo and ensuing uncertainty (Chart 2). Imminent political volatility will further depress business confidence, and, consequently, capital expenditures and hiring in the coming months. This will curb household income growth and consumer spending. Peru remains one of the world’s deadliest COVID-19 hotspots (Chart 3, top panel). In addition, vaccination rates are the lowest among major Latin American economies (Chart 3, bottom panel). As the more infectious Delta variant becomes dominant, there will not be enough immunity to hold back new cases. Consequently, either the government will introduce lockdowns or people will voluntarily limit their activities, thereby inhibiting the nascent economic recovery. The unemployment rate remains far above its pre-pandemic level (Chart 4). Thus, household income remains very depressed. The latter does not bode well for debtors’ ability to service debt. Chart 3Peru: The Government Has Grossly Mismanaged The Pandemic
Peru: Approaching A Boiling Point
Peru: Approaching A Boiling Point
Chart 4Peru: Labor Market Has Not Fully Recovered
Peru: Approaching A Boiling Point
Peru: Approaching A Boiling Point
As a result, loan delinquencies will rise anew, weighing on banks’ appetite to lend. Notably, local currency loans to the private sector will contract (Chart 5). Chart 5Peru: Prepare For A Credit Slump
Peru: Approaching A Boiling Point
Peru: Approaching A Boiling Point
Commercial banking profitability is also vulnerable, as president Castillo aims to strengthen the state bank (Banco de la Nación) by expanding its operations and undercutting private banking fees. Given financials of the bourse’s market cap, poor banking profitability is a major risk to this stock market. Unrelenting currency depreciation—see below for a more detailed analysis of the exchange rate—will prompt the central bank to hike rates further. This will not only weigh on new credit demand, but also augment loan delinquencies in the banking system. As a result, banks will become very risk averse and shrink their balance sheets. A credit crunch will ensue. Even though fiscal spending will be increased, it is unlikely to propel economic growth. The basis is that fiscal primary spending accounted for less than 15% of GDP before the pandemic and is now 17% due to the pandemic distortion (Chart 6). In the meantime, consumer spending constitutes 63% of GDP, capital spending 21%, and exports 25%. Externally, deteriorating balance of payments dynamics will weigh down on the currency: Peruvian assets tend to move with the country’s trade balance and global metal prices. The fact that Peruvian stock prices have plummeted in the face of rising industrial and precious metal prices supports a bearish thesis on this bourse (Chart 7). Chart 6Peru: Fiscal Expenditures Have Risen Due To The Pandemic
Peru: Approaching A Boiling Point
Peru: Approaching A Boiling Point
Chart 7Rising Metal Prices Have Failed To Boost Peruvian Stocks
Peru: Approaching A Boiling Point
Peru: Approaching A Boiling Point
Chart 8China's Slowdown Portends A Fall In Commodities
Peru: Approaching A Boiling Point
Peru: Approaching A Boiling Point
Export revenue will contract as a result of a decline in commodity prices brought on by China’s slowing “old economy” (Chart 8). Precious and industrial metals together account for 66% of Peru’s merchandise exports. A meaningful decline in metal prices will erode the trade surplus and weigh on the exchange rate. Furthermore, Peru is already experiencing capital flight. Potential anti-market policies from this government could trigger more capital exodus. The capital account deficit will widen as both FDI and portfolio inflows fall due to the negative commodity outlook as well as political uncertainty (Chart 9). Foreigners still hold 45% of local currency bonds, and they will reduce their holdings (Chart 10). Chart 9Peru: FDI Inflows Will Decline
Peru: Approaching A Boiling Point
Peru: Approaching A Boiling Point
Chart 10Peruvian Domestic Bonds: Will Banks Make Up For Foreign Investor Retrenchment?
Peru: Approaching A Boiling Point
Peru: Approaching A Boiling Point
Chart 11Peru: The Dollarization Rate Has Room To Rise
Peru: Approaching A Boiling Point
Peru: Approaching A Boiling Point
Currency depreciation will also be reinforced by locals converting their sol deposits into foreign currency. The dollarization rate—the ratio of foreign currency banking deposits to total deposits—will rise (Chart 11). A weakening currency will also lead to higher inflation expectations, to which the central bank will respond by raising rates. The monetary authorities already hiked the policy rate by 25 basis points this month due to higher-than-expected inflation and a rapidly depreciating currency. As Peru’s exchange rate continues to weaken, the central bank might also sell foreign currency reserves to prevent large fluctuations in the value of the currency. This foreign exchange intervention will, in turn, shrink banking system local currency liquidity and lift interbank rates (Chart 12). Chart 12FX Reserve Sales Will Shrink Banking Liquidity And Lift Interbank Rates
Peru: Approaching A Boiling Point
Peru: Approaching A Boiling Point
In short, the central bank has enough international reserves to stabilize the exchange rate, but this will come at the cost of tighter liquidity and higher interest rates. The latter will only reinforce sluggish growth in domestic demand. Bottom Line: Heightened political volatility and lower metal prices are working against the Peruvian economy and its financial markets. Peru is experiencing large capital flight, which will exacerbate currency depreciation. Investment Recommendations Keep an underweight allocation to the Peruvian bourse within an EM equity portfolio. We recommend currency traders go short the Peruvian sol versus the US dollar. While the sol has already depreciated considerably, the domestic and external headwinds entail more downside. For fixed-income investors, we maintain an underweight allocation to Peruvian sovereign credit in an EM credit portfolio. The basis for this position is that the nation’s fiscal policy may undergo a major shift, entailing larger fiscal spending and wider budget deficits. We are downgrading local bonds from neutral to underweight in an EM domestic bond portfolio. Critically, the share of foreign ownership of Peruvian local fixed income remains one of the highest in the EM universe—it has only fallen from around 55% to 45% of domestic fixed-income instruments in the past six months (Chart 10 on page 9). Thus, there is a major risk that foreign investors will sell domestic bonds as the currency depreciates further, which will weigh down on local bonds. Juan Egaña Research Analyst juane@bcaresearch.com Footnotes
Highlights The decline in the US and UK July services PMIs underscores that pandemic control measures are not the only manner by which COVID-19 impacts the services sector of the economy. A slowdown in Q3 growth in advanced economies from the Delta surge is now all but inevitable. The fact that highly-vaccinated advanced economies have experienced a sharp rise in new cases due to the Delta variant underscores that true herd immunity, as envisioned for most of the pandemic, will likely prove elusive. Consequently, investors need to shift their framework from the idea of herd immunity to that of “NAHRI”: the non-accelerating hospitalization rate of immunity. The vaccination rate is the most obvious indicator of progress towards NAHRI, but immunity from previous infections is also an important contributor. Reasonable estimates of unreported COVID-19 infections suggest that investors have good reason to believe that the US and most other major advanced economies will be above NAHRI, or at least very close to it, at some point in Q4. On a 6-12 month time horizon, economic growth in advanced economies, as well as the trend in financial markets, is not likely to be driven by the Delta variant of COVID-19. Extremely easy monetary policy, pent up savings, and robust revenue growth will support economic growth and the trend in stock prices – despite the fact that analyst earnings expectations are clearly too high. The recent underperformance of China-sensitive assets has been driven by a regulatory crackdown by Chinese authorities on new economy companies, which reflects new socio-political and economic shifts. Chinese stocks are now oversold and could bounce in the near-term, but we would still recommend favoring developed market equities within a global ex-US equity allocation until Chinese policy turns reflationary. Investors should continue to favor stocks versus bonds in a multi-asset portfolio over the coming year, with the proviso that the impact from the Delta variant is likely to cause a near-term growth disappointment. High single-digit earnings growth, coupled with some pressure on multiples, continues to point to mid-single-digit returns from US equities. Within a global equity allocation, we would recommend that investors favor global ex-US stocks, whose outperformance is not dependent on that of EM. Value versus growth, and small caps versus large, will likely benefit from an uptrend in long-maturity bond yields. We recommend that investors favor short USD positions, in response to a likely downtrend in the dollar over the coming year. Feature Chart I-1Meaningful Vaccination Progress Continues Everywhere Except Africa
Meaningful Vaccination Progress Continues Everywhere Except Africa
Meaningful Vaccination Progress Continues Everywhere Except Africa
Over the past month, the Delta variant-driven phase of the pandemic has continued to worsen in several advanced economies, arrayed against a continual improvement in the immunity of the world’s population. Chart I-1 highlights that, outside of Africa, the share of the population that is fully vaccinated against COVID-19 is rising at a robust pace of roughly 10 percentage points per month. But in advanced economies with elevated rates of vaccination compared to the rest of the world, new confirmed cases of COVID-19 accelerated in August, driven in most cases by the Delta variant. Chart I-2 highlights that in the UK, the epicenter of the Delta surge, new cases have begun to rise again after having peaked in late July. UK hospitalizations remain low relative to what has occurred since the onset of the pandemic (panel 2 of Chart I-2), but the US has experienced a more significant rise due to its comparatively low vaccination rate. In addition, reflecting a disparity in vaccination rates within the US that we have highlighted, has a strong political dimension.1 Chart I-3 illustrates that ICU capacity utilization (relative to peak staffed ICU beds) has risen sharply in red states, back above its all-time high. ICU usage in blue states is also rising, but it remains 10 percentage points below its prior peak. Chart I-2UK Hospitalizations Remain Stable, Despite Elevated Case Counts
UK Hospitalizations Remain Stable, Despite Elevated Case Counts
UK Hospitalizations Remain Stable, Despite Elevated Case Counts
Chart I-3Lowly Vaccinated US States Are Suffering The Most From Delta
Lowly Vaccinated US States Are Suffering The Most From Delta
Lowly Vaccinated US States Are Suffering The Most From Delta
When discussing the pandemic and its economic impact in past Bank Credit Analyst reports, we have emphasized the importance of hospitalizations as the core driver of policymaker decisions about pandemic control measures. In turn, we have focused on control measures as an important driver of economic activity because these measures clearly impede households’ ability to consume many services. Chart I-4Surging Cases Impact Services Activity, Even Without Pandemic Control Measures
Surging Cases Impact Services Activity, Even Without Pandemic Control Measures
Surging Cases Impact Services Activity, Even Without Pandemic Control Measures
But Chart I-4 underscores that control measures are not the only manner by which the pandemic impacts the services sector of the economy. The chart highlights that the Markit services PMI has fallen sharply in July and August in both the US and UK economies, two countries that have few or no pandemic control measures still in place. This is strong evidence that fear and general risk aversion among some consumers is affecting services spending. Given that hospitalizations have remained relatively well controlled in the UK, this also suggests that the impact on consumer sentiment is emerging mostly from new case counts rather than from published hospitalization rates. Chart I-5 highlights that the University of Michigan's Index of Consumer Sentiment fell sharply in August to essentially a 10-year low, providing further evidence that a slowdown in Q3 growth in advanced economies from the Delta surge is now all but inevitable. Chart I-6 highlights that this has not yet been reflected in consensus expectations for growth, suggesting that near-term growth disappointments are likely. Chart I-5A Q3 Growth Slowdown Is Now All But Inevitable...
A Q3 Growth Slowdown Is Now All But Inevitable...
A Q3 Growth Slowdown Is Now All But Inevitable...
Chart I-6...Which Is Not Currently Reflected In Consensus Expectations For Growth
...Which Is Not Currently Reflected In Consensus Expectations For Growth
...Which Is Not Currently Reflected In Consensus Expectations For Growth
Shifting Focus From Herd Immunity To NAHRI The fact that highly vaccinated advanced economies have experienced a sharp rise in new cases due to Delta underscores that true herd immunity, as envisioned for most of the pandemic, will likely prove elusive. This point was underscored earlier this month in public comments by the head of the Oxford Vaccine Group,2 who noted that even relatively small rates of transmission from “breakthrough cases” of vaccinated individuals means that anyone who is unvaccinated will likely be exposed to COVID-19 at some point over the coming months or years. From an economic standpoint, this may not be problematic if the spread of the disease among the unvaccinated is slow, as it would allow hospitals time to process COVID patients without risking an overrun of the system (and thus would likely not necessitate a response from policymakers). But the lack of an achievable herd immunity is clearly a risk if community transmission of the Delta variant is high among unvaccinated individuals, even in a scenario where overall vaccination rates are elevated. Consequently, investors need to shift their framework from the idea of herd immunity to that of “NAHRI”: the non-accelerating hospitalization rate of immunity. This concept is borrowed from the idea of NAIRU (the non-accelerating inflation rate of unemployment), and signifies the point at which sufficient immunity has been reached in a country – either through vaccination or past infection – that results in a stable pace of COVID-19 hospitalizations in the absence of any pandemic control measures or precautionary behavior on the part of consumers. Once NAHRI is reached with no control measures and a pre-pandemic rate of interpersonal contact, the pandemic will be effectively over. Chart I-7The US Vaccination Rate Has Picked Up Modestly
The US Vaccination Rate Has Picked Up Modestly
The US Vaccination Rate Has Picked Up Modestly
One clear difficulty with this perspective is that NAHRI is unknown, making it challenging to determine how close a given economy is to a stable pace of COVID-related hospitalization. The experience of the UK over the past month, with an elevated case count yet stable hospitalizations, may suggest that they are close or approaching a stable-hospitalization immunity rate, although investors will still need to watch the UK closely over the coming weeks to confirm if this is the case. The vaccination rate is the most obvious indicator of progress toward NAHRI, and on this front the US has further to go. Chart I-7 highlights that while the pace of first doses administered in the US has risen over the past two months in response to the Delta wave, it will still take until the end of October or early November for the US to reach levels that have been attained by other advanced economies. The introduction of widespread vaccination mandates, as well as the incentive effects of vaccination passports, might raise this rate over the coming weeks. This is even more likely given the FDA's full approval of the Pfizer/BioNTech vaccine this week. But; immunity from previous infections will also contribute to reaching NAHRI, which raises the question of how many unreported COVID-19 infections have occurred since the onset of the pandemic. This is especially important given recent evidence that a previous COVID-19 infection among those who are unvaccinated appears to provide as much protection against the Delta variant as double-dose vaccination does for those without a previous infection (Chart I-8). Chart I-8A Previous COVID-19 Infection Appears To Offer Strong Protection Against The Delta Variant
September 2021
September 2021
In the US, the Center for Disease Control estimates that from February 2020 to May 2021 only 1 in 4.2 COVID-19 infections were reported, suggesting that there were approximately 120 million total infections during that period. That would be quite positive for the economic outlook if accurate, as it would imply that the true immunity rate in the US is probably much closer to NAHRI than the vaccination rate would imply. However, it is also possible that the Center's estimate is too high, which is what some surveys of Americans seem to suggest. In mid-to-late February, a Pew Research survey reported that 25% of US adults had either tested positive for COVID-19, tested positive for antibodies against the SARS-COV-2 virus, or were confident that they already contracted the virus. This compares with 8.5% of the US population with a confirmed case of COVID-19 at that time, suggesting that the true ratio of reported cases to total infections is closer to 1:3. Chart I-9 highlights what the true US immunity rate might look like compared with the published vaccination rate based on different estimates of unreported infections. The chart highlights that a 1:3 ratio of reported cases to total infections implies an additional 10 percentage points of immunity, which would bring US first-dose vaccination rates in line with those of other DM countries. When combined with a slow but still ongoing rise in first doses administered, as well as emergency use eligibility of children under 12 years old targeted by the end of September, investors have good reason to believe that the US and most other major advanced economies will be above NAHRI, or at least very close to it, at some point in Q4. Chart I-9The True US Immunity Rate May Be A Lot Higher Than The Vaccination Rate Would Suggest
September 2021
September 2021
A Permanent Shift In Consumer Behavior? The inability to reach true herd immunity, combined with the recent slowdown in services activity in response to a surge in cases from the Delta variant, raises the issue of whether altered consumer behavior will persist beyond the next few months. Chart I-10A Positive Sign That The Delta Wave May Be Abating
A Positive Sign That The Delta Wave May Be Abating
A Positive Sign That The Delta Wave May Be Abating
In our view, the answer is: probably not. First, Chart I-10 makes the simple point that the transmission rate is already falling in advanced economies, suggesting that fears of a complete explosion in new cases beyond previous highs are unfounded. Second, the behavior of consumers over the past two months has been reasonable, but is unlikely to continue once nations begin to approach NAHRI. The Delta variant is still relatively new, and its higher transmissibility, as well as its seemingly higher hospitalization rate for those who are unvaccinated, has understandably given some consumers pause over the past few months (even those who are vaccinated). This is likely especially true among adults with young children in their household, given that they are not currently able to receive a vaccine and given a significant rise in pediatric cases that has occurred in some countries. But the reality is that the world will have to live with the existence of COVID-19 permanently, which consumers, investors, and policymakers will all soon come to accept and normalize. It will become endemic, and receiving annual booster shots against the disease may become a permanent ritual for people around the world. In advanced economies, once most or all individuals who wish to be vaccinated have had the chance to receive their shot, it seems unlikely that periodic waves of rising cases among the unvaccinated will be seen as a threat to individual health, especially if the increase in hospitalizations is limited and the viability of the health care system is not under threat. Beyond Delta: The Economy And Financial Markets In A Year’s Time On a 6-12 month time horizon, economic growth in advanced economies, as well as the trend in financial markets, is not likely to be driven by the Delta variant of COVID-19. Instead, the cyclical investment outlook will continue to depend on the factors that we have discussed in several previous reports: Extremely Easy Monetary Policy: Chart I-11 illustrates the 10-year US Treasury yield relative to trend nominal GDP growth. The chart highlights that long-maturity US government bond yields have not been this low relative to trend growth since the late-1970s, which will continue to support domestic demand even if growth moderates over the coming year. Excess Savings: A waning growth impulse from fiscal policy will likely weigh on real goods spending, which is roughly 10 percent higher than its pre-pandemic trend (Chart I-12). But services spending, which accounts for about 70% of overall consumer spending, is still 5% below its pre-COVID trend and will be supported by the deployment of a significant amount of excess savings that have accumulated over the course of the pandemic. Some of these excess savings have probably been deployed to pay down debt, but a sizeable portion likely remains to support services spending. Chart I-13 highlights that the gap in spending is fairly broad-based across different services categories, underscoring that a recovery in services spending is not overly-dependent on the return of a particular type of consumer spending behavior. Chart I-11US Monetary Policy Is Extraordinarily Easy
US Monetary Policy Is Extraordinarily Easy
US Monetary Policy Is Extraordinarily Easy
Chart I-12Pent-Up Savings Will Support Services Spending
Pent-Up Savings Will Support Services Spending
Pent-Up Savings Will Support Services Spending
Robust Revenue Growth: The equity market is likely to be supported by strong revenue growth over the coming year, even if it modestly disappoints current expectations. Chart I-14 presents bottom-up analysts’ expectations for S&P 500 sales per share growth over the coming year, alongside a proxy for nominal growth expectations (12-month forward expectations for real GDP growth plus 2 percentage points). The chart highlights that, while expectations for sales growth are modestly above what our proxy would suggest, nominal growth expectations are the strongest they have been in over a decade. Chart I-13Missing Services Spending Is Broad- Based Across Spending Categories
September 2021
September 2021
Chart I-14S&P 500 Revenue Growth Is Likely To Be Strong Over The Coming Year...
S&P 500 Revenue Growth Is Likely To Be Strong Over The Coming Year...
S&P 500 Revenue Growth Is Likely To Be Strong Over The Coming Year...
On the latter point, while revenue growth will likely support the equity market, expectations for earnings are now clearly too high. Chart I-15 highlights that bottom-up analysts are calling for 18% earnings growth over the coming year – after what has already been a very impressive earnings recovery – and for profit margins to expand by a full percentage point from what is already a new high. Chart I-16 presents a long-term perspective on corporate profit margins, highlighting how stretched they have become even relative to the uptrend of the past three decades. Chart I-15...Even Though Earnings Expectations Are Clearly Too High
...Even Though Earnings Expectations Are Clearly Too High
...Even Though Earnings Expectations Are Clearly Too High
Chart I-16US Profit Margins Are Very Elevated, Even Given The Past Three Decade's Uptrend
US Profit Margins Are Very Elevated, Even Given The Past Three Decade's Uptrend
US Profit Margins Are Very Elevated, Even Given The Past Three Decade's Uptrend
Chart I-17 highlights that earnings expectations usually disappoint, given the perennial optimism of bottom-up analyst expectations. The chart shows that they historically disappoint on the order of 5 percentage points, but that a 10 percentage point miss would not be so uncommon. Thus, EPS growth that is in line with the revenue growth proxy shown in Chart I-14 will not likely weigh on investor sentiment. China And EM Stocks As a final point about the macro and cyclical investment outlook, Chart I-18 highlights that our Market-Based China Growth Indicator has fallen below the boom/bust line for the first time since the middle of last year. We highlighted in last month’s report that China would not likely provide the global economy with a growth impulse until Chinese policy turns reflationary, and financial assets that are sensitive to Chinese economic growth are now flashing a warning sign. We therefore continue to believe that a normalization in services spending in advanced economies remains the likely impulse for global growth over the coming year. Chart I-17A 10% Earnings Miss Over The Coming Year Would Not Be Unprecedented
A 10% Earnings Miss Over The Coming Year Would Not Be Unprecedented
A 10% Earnings Miss Over The Coming Year Would Not Be Unprecedented
Chart I-18Chinese Growth Proxies Are Performing Poorly
Chinese Growth Proxies Are Performing Poorly
Chinese Growth Proxies Are Performing Poorly
However, at least a part of the recent underperformance of China-sensitive assets has been driven by the spectacular underperformance of broadly-defined tech stocks in China since late-May (Chart I-19). The selloff in Chinese tech stocks has been triggered by a regulatory crackdown by Chinese authorities on new economy companies, which reflects new socio-political and economic shifts in China – which are thus not likely to be transitory. Still, Chinese stocks are now oversold even in absolute terms (Chart I-20), raising the question of whether EM stocks overall are due for a bounce. Chart I-19Some Of The Recent EM Underperformance Reflects The Chinese Regulatory Crackdown
Some Of The Recent EM Underperformance Reflects The Chinese Regulatory Crackdown
Some Of The Recent EM Underperformance Reflects The Chinese Regulatory Crackdown
Chart I-20Chinese Stocks Are Oversold In Absolute Terms
Chinese Stocks Are Oversold In Absolute Terms
Chinese Stocks Are Oversold In Absolute Terms
In the short term, the answer is yes, but over a 6-12 month time horizon we would still recommend favoring developed market equities within a global ex-US equity allocation. First, while policy from China may eventually act as a catalyst for EM equities, BCA’s China strategists do not believe that Chinese policymakers have yet reached the “pain point” that would signal regulatory and monetary policy easing. Second, China and EM more generally is comparatively tech heavy, and thus will face headwinds on a relative basis if value outperforms growth over the coming year (as we expect). Chart I-21EM Stocks Do Not Offer A Compelling Value Catalyst Versus DM Ex-US
EM Stocks Do Not Offer A Compelling Value Catalyst Versus DM Ex-US
EM Stocks Do Not Offer A Compelling Value Catalyst Versus DM Ex-US
Third, Chart I-21 highlights that EM stocks offer no compelling value proposition relative to DM ex-US equities. EM stocks are modestly cheap on a 12-month forward P/E basis (trading at a 13% discount), but this has been true historically – with the exception of a brief period from mid-2007 to mid-2008. Relative to the past decade, EM valuation is at roughly average levels versus global ex-US stocks, suggesting that Chinese policy and sector performance trends are likely to be the key drivers for EM performance relative to non-US equities. Investment Conclusions Chart I-22Favor DM Ex-US Vs. US, And Value Vs. Growth, Over The Coming Year
Favor DM Ex-US Vs. US, And Value Vs. Growth, Over The Coming Year
Favor DM Ex-US Vs. US, And Value Vs. Growth, Over The Coming Year
In Section 2 of this month’s report, we explain why the Fed’s maximum employment criterion is likely to be reached earlier than investors and the Fed itself expects. This suggests that equity multiples may come under pressure over the coming year as long-maturity government bond yields rise. However, we noted above that earnings are likely to grow at a high single-digit pace, and that this is likely to support the uptrend in US stock prices as developed economies approach or surpass the non-accelerating hospitalization rate of immunity from COVID-19 and the world continues to move toward to a post-pandemic state. In combination with our expectation of rising government bond yields, investors should thus continue to favor stocks versus bonds in a multi-asset portfolio over the coming year, with the proviso that the impact from Delta is likely to cause a near-term growth disappointment. On a 12-month time horizon, high single-digit earnings growth coupled with some pressure on multiples continues to point to mid-single-digit returns from US equities. Within a global equity allocation, we would recommend that investors favor global ex-US stocks. The outperformance of the latter is not dependent on the outperformance of emerging markets, as Chart I-22 highlights that DM ex-US equities now trade at close to a 30% discount relative to their US counterparts – an extreme reading that partially reflects the extraordinary discount of global value versus growth stocks (panel 2). The trend in value versus growth is strongly correlated with the trend in financials versus broadly-defined technology stocks, and rising long-maturity bond yields favor the earnings of the former and weigh on the multiples of latter. Chart I-23 highlights that global small cap stocks may also outperform over the coming year, given their fairly strong correlation with long-maturity bond yields since the start of the pandemic. Finally, as we have noted in previous reports, the US dollar is a reliably counter-cyclical currency over 12-month periods. The recent bounce in the US dollar in the face of rising stock prices has deviated from this relationship, but only modestly so (Chart I-24). A similar deviation occurred in Q1 of this year, and was resolved with the dollar, not stock prices, moving lower. Consequently, we recommend that investors favor short USD positions, in response to a likely downtrend in the dollar over the coming year. Chart I-23Small Cap Stocks Will Likely Outperform If Long-Maturity Bond Yields Rise
Small Cap Stocks Will Likely Outperform If Long-Maturity Bond Yields Rise
Small Cap Stocks Will Likely Outperform If Long-Maturity Bond Yields Rise
Chart I-24A Pro-Risk Investment Stance Argues For A Dollar Downtrend
A Pro-Risk Investment Stance Argues For A Dollar Downtrend
A Pro-Risk Investment Stance Argues For A Dollar Downtrend
Jonathan LaBerge, CFA Vice President The Bank Credit Analyst August 26, 2021 Next Report: September 30, 2021 II. The Return To Maximum Employment: It May Be Faster Than You Think When defining maximum employment, many investors focus on the state of the labor market that prevailed as of February 2020. However, the US labor market was beyond maximum employment levels at the onset of the COVID-19 pandemic, suggesting that the Fed is likely to raise interest rates before the unemployment rate falls back to 3.5%. This assumes that the Fed deems the ongoing recovery in the labor market to be “broad-based and inclusive,” given revisions to the FOMC’s Statement on Longer-Run Goals and Monetary Policy Strategy last August. The extraordinary nature of the COVID-19 pandemic has indeed had an outsized impact on some demographic segments of the labor market, but most of these effects already have or are likely to be reversed as the overall unemployment rate continues to fall. A permanent decline in the participation rate, relative to pre-pandemic levels, is likely given ongoing demographic trends. Even if the recent behavioral impact of retirements is overdone, the demographic impact of retirement on the participation rate suggests that the Federal Reserve may hit its maximum employment objective by next summer, barring a long-lasting impact on US economic activity from the Delta variant of COVID-19. In a 2H 2022 rate hike scenario, the fair value of the 10-year Treasury yield will be 2.2%-2.3% next year, which the market is not priced for. This underscores that investors should maintain a short duration position within a fixed-income portfolio, and that equity investors should favor value over growth stocks on a 12-month time horizon. The cyclical outlook for monetary policy in the US rests heavily, if not exclusively, on the length of time needed to return to maximum employment. In this report, we argue that a complete return to the state of the labor market as of February 2020 is probably not required for the Fed’s maximum employment objective to be met, because the jobs market was likely beyond maximum employment at that time. In addition, we highlight that the broad-based and inclusive nature of the Fed's maximum employment objective is objective will not delay the first Fed rate hike beyond what the trajectory of the unemployment rate would suggest, as the odds of a persistent negative impact on demographic segments of the labor market no longer seem meaningful. In fact, the one partial exception that we can identify – retirement – argues for an earlier return to maximum employment. We conclude by noting that a first Fed rate hike is possible by the middle of next year, barring a long-lasting impact on US economic activity from the Delta variant of COVID-19 or if the Fed’s inflation liftoff criteria are no longer met. Normalized levels of inflation expectations, as well as reasonable estimates of a closed output gap over the coming year, suggest that inflation itself will remain liftoff-consistent barring a significant shock to growth or a major disinflationary/deflationary supply-side event. A 2022 rate hike is not currently reflected in market pricing, underscoring that investors should remain short duration within a fixed-income portfolio. Equity investors should expect a meaningful rise in stock market volatility as long-maturity yields rise over the coming year, and should favor value over growth stocks once fears of the likely impact of the Delta variant on near-term economic growth abate. Defining “Maximum Employment” Chart II-1Last Cycle, Rates Began To Rise Before Maximum Employment Was Reached
Last Cycle, Rates Began To Rise Before Maximum Employment Was Reached
Last Cycle, Rates Began To Rise Before Maximum Employment Was Reached
Last September, the Fed’s official shift to an average inflation targeting regime represented a significant break from how the Fed conducted monetary policy in the past. The shift replaced what was previously a “symmetric” 2% inflation target with the goal of achieving inflation that averages 2% over time, meaning that monetary policy is no longer strictly forward-looking. According to the Fed's previous framework, monetary policy should start to tighten before the economy reaches its full employment level, in anticipation that further declines in the unemployment rate will likely lead to accelerating inflation. For example, during the last economic cycle, the Fed began to raise interest rates in December 2015, when the unemployment rate stood at 5% (Chart II-1). But the Fed's new regime implies that the onset of tightening should begin later, the criteria for which was explicitly laid out in the September 2020 FOMC statement: “The Committee decided to keep the target range for the federal funds rate at 0 to 1/4 percent and expects it will be appropriate to maintain this target range until labor market conditions have reached levels consistent with the Committee's assessments of maximum employment and inflation has risen to 2 percent and is on track to moderately exceed 2 percent for some time.” In addition, while the Fed’s statutory mandate from Congress has always included the pursuit of maximum employment as an objective of monetary policy, revisions to the FOMC’s Statement on Longer-Run Goals and Monetary Policy Strategy last August explicitly noted that the maximum level of employment is a “broad-based and inclusive goal.” This has left many investors questioning when the Fed’s maximum employment criterion will be reached, with some market participants believing that a complete return to the state of the labor market that prevailed as of February 2020 will be required before the Fed lifts interest rates. But there are three arguments suggesting that the US labor market was beyond maximum employment levels at the onset of the COVID-19 pandemic: 1. Chart II-2 highlights that the February 2020 unemployment rate ranked at the 5th percentile of its post-WWII history, and was at its lowest level since the late-1960s. While it is true that the unemployment rate would have been higher for most of the last economic expansion based on December 2007 age-adjusted participation rates, Chart II-3 highlights that this effect had waned by the end of 2019. This underscores that the pre-pandemic unemployment rate likely reflected very low labor market slack. Chart II-2The US Labor Market Was Likely Beyond Maximum Employment Levels Prior To The Pandemic
September 2021
September 2021
2. The February 2020 unemployment rate stood at 3.5%, which is at the very low end of the Fed’s NAIRU estimates, and meaningfully below the CBO’S long- and short-term NAIRU projections (Chart II-4). Given that NAIRU estimates signify the level of unemployment that is consistent with a steady inflation rate, this implies that 3.5% is likely below the “maximum employment” unemployment rate. Chart II-3The Part Rate Had Mostly Normalized Just Prior To COVID-19
The Part Rate Had Mostly Normalized Just Prior To COVID-19
The Part Rate Had Mostly Normalized Just Prior To COVID-19
Chart II-4A 3.5% Unemployment Rate Is Likely Below NAIRU
A 3.5% Unemployment Rate Is Likely Below NAIRU
A 3.5% Unemployment Rate Is Likely Below NAIRU
Chart II-5Wage Growth Accelerated In Response To A Sub-4% Unemployment Rate
Wage Growth Accelerated In Response To A Sub 4% Unemployment Rate
Wage Growth Accelerated In Response To A Sub 4% Unemployment Rate
3. The pre-pandemic trend in wage growth also supports the notion that the labor market was past maximum employment levels at that time. Chart II-5 highlights that average hourly earnings and the Atlanta Fed’s median wage growth tracker were both accelerating in 2018/2019, and Chart II-6 highlights that real average hourly earnings growth of production and nonsupervisory employees was close to its 90th percentile historically at the end of 2019. This underscores that the Fed is likely to raise interest rates before the unemployment rate falls back to 3.5%, assuming that the ongoing recovery in the labor market is deemed by the Fed to be “broad-based and inclusive.” Chart II-6Real Average Hourly Earnings Growth Was At Its 90th Percentile Historically Prior To COVID-19
September 2021
September 2021
Breadth, Inclusivity, And Participation Chart II-7The "She-cession" Is Over
The "She-cession" Is Over
The "She-cession" Is Over
The extraordinary nature of the COVID-19 pandemic has indeed had an outsized impact on some demographic segments of the labor market, but most of these effects have already reversed or are likely to as the overall unemployment rate continues to fall. And as we highlight below, the one partial exception that we can identify – retirement – in fact argues for an earlier return to maximum employment. We focus our demographic segment analysis on four main categories: 1. employment by gender; 2. race; 3. wage level and education; and 4. the impact on labor force participation from retirement. Gender Chart II-7 highlights the impact of the pandemic on the US labor market by gender. In 2020, the impact of the pandemic fell disproportionately on women. The unemployment rate rose close to 13 percentage points for women from February to April of last year, versus a 10 percentage point rise for men. In addition, the recovery in the participation rate last year was less robust for women, who disproportionately cited family responsibilities as the basis for not participating in the labor force. However, Chart II-7 also highlights that the disproportionate labor market impact of the pandemic on women is now over, with the female unemployment rate closer to its pre-pandemic level than for men, with a similar recovery in the participation rate. The difference in wage growth, relative to February 2020 levels, is also now smaller for women than for men. Thus, barring the development of a new divergence over the coming year, there is no longer any basis for the Federal Reserve to distinguish between men and women in the labor market recovery. Chart II-8Black Unemployment And Labor Force Participation Has Mostly Normalized
Black Unemployment And Labor Force Participation Has Mostly Normalized
Black Unemployment And Labor Force Participation Has Mostly Normalized
Race Chart II-8 highlights the impact of the pandemic on the US labor market by race. In this case, it is clear that a disproportionately negative effect on Black employment persisted for longer than it did for women. But it is also clear that the Black unemployment rate is now roughly the same magnitude above its February 2020 level as is the case for the overall unemployment rate. In June, the Black labor force participation rate had actually recovered more than the overall participation rate, although it did decline meaningfully in July. The Black labor force participation rate has shown itself to be highly volatile since the onset of the pandemic, and we doubt that the July reading marks a decoupling from the overall participation rate. It is also true that median non-white wage growth has decelerated significantly more than median white wage growth during the pandemic, but this has occurred from a very elevated starting point. Median non-white wage growth was growing a full percentage point above median white wage growth just prior to the pandemic, compared with a half a percentage point below today. This deceleration has likely occurred as a lagged impact from the larger rise in Black unemployment noted above, which has now dissipated – suggesting that nonwhite wage growth is not likely to meaningfully lag over the coming year. Two additional points highlight that Black unemployment, labor force participation, and wages are likely to be highly correlated with overall labor market trends over the coming year. First, Chart II-9 highlights that in 2019 Black workers were underrepresented in management / professional and natural resources / construction / maintenance occupations, and overrepresented in service and production / transportation / material moving occupations. Given that services spending remains below its pre-pandemic trend, it is likely that the Black unemployment rate will continue to decline as the gap in leisure and hospitality and other services employment closes further relative to pre-pandemic levels. Chart II-9Black Unemployment Will Fall As Services Spending Recovers
September 2021
September 2021
Second, Table II-1 highlights that Black survey respondents to the Census Bureau’s Household Pulse Survey located in New York and California are reporting lower and only modestly higher levels, respectively, of lost employment income than is the case for Black workers in the US overall. Given that services employment in these two states, particularly New York, are the most likely to be negatively impacted by persistent “work-from-home” effects, Table II-1 suggests that Black services employment is not likely to lag gains in overall services employment. Wage Level And Education Chart II-10 highlights wage growth for those with a high school diploma or less, for low-skilled workers, and for those in the lowest average wage quartile, and Charts II-11A & II-11B highlight the impact of the pandemic on the unemployment and participation rates by education. Table II-1No Evidence Of A Negative “Work-From- Home” Effect On Black Unemployment
September 2021
September 2021
Chart II-10Wage Growth By Education And Skill Level Is Largely Unchanged
Wage Growth By Education And Skill Level Is Largely Unchanged
Wage Growth By Education And Skill Level Is Largely Unchanged
Chart II-11AThe Least Educated Workers Still Need To See More Job Gains…
The Least Educated Workers Still Need To See More Job Gains...
The Least Educated Workers Still Need To See More Job Gains...
Chart II-11B…But This Will Occur As Services Spending Improves
...But This Will Occur As Services Spending Improves
...But This Will Occur As Services Spending Improves
On the wage front, Chart II-10 makes it clear that there are no major negative differences between those with limited education, limited skills, or limited pay and the overall trend in wage growth relative to pre-pandemic levels. Reflecting a shortage of workers in some services industries, wages for 1st quartile wage earners and low-skilled workers are accelerating, and are poised to reach their highest level since 2008. On the employment and participation front, Charts II-11A & B show that the job market recovery has been less pronounced for high school graduates and those with less than a high school diploma. But, we believe – with high conviction – that this reflects the industry composition of the existing employment gap, which skews heavily towards service and leisure & hospitality. These jobs tend to require less formal education and training, and to offer less pay. Given this, and similar to the case for Black employment, low education employment growth is unlikely to meaningfully diverge from the trend in overall services employment over the coming year. The Impact Of Retirement On Labor Force Participation Chart II-12Most Of The Pandemic Decline In Labor Force Participation Has Occurred Due To Retirement
...But This Will Occur As Services Spending Improves
...But This Will Occur As Services Spending Improves
Chart II-12 presents a breakdown of the change in overall labor force participation from Q4 2019 to Q2 2021 by nonparticipation category. The chart is based off the Atlanta Fed’s Labor Force Participation Dynamics dataset, and employs some Bank Credit Analyst estimates to seasonally adjust the impact of some categories in the first half of this year and to align it with the actual change in the published monthly seasonally-adjusted participation rate. The chart underscores that, while family responsibilities and those who are not in the labor force but who want a job (the shadow labor force) have been important contributors to the decline in labor force participation since the onset of the pandemic, retirement has been the single most important factor driving the participation rate lower. This sharp drop in labor force participation from retirement likely reflects the decision of some older workers to bring forward their retirement date by a year or two, although a recent study from the Kansas City Fed suggests that the non-demographic component of the recent surge in retirements has mainly been driven by a decline in the number of retirees rejoining the labor force.3 But demographic effects are important, and Chart II-13 highlights that the participation rate has fallen at a rate of roughly 30 basis points per year on average since 2008, reflecting the aging of the population. Chart II-13 is consistent with the age-adjusted participation rate that we showed in Chart II-3 above, and underscores that, even though the recent decline in the participation rate due to retirement is overdone, a permanent decline relative to pre-pandemic levels is likely the result of ongoing demographic trends. In our view, the Federal Reserve is unlikely to regard a demographically-driven decline in the overall participation rate as evidence that the labor market recovery has fallen short of the Fed’s maximum employment objective. It is possible that a return of the working age participation rate to its pre-pandemic level will be viewed as a condition for maximum employment, but Chart II-14 highlights that progress on this front is already more advanced. Chart II-13A Full Recovery To The Pre-Pandemic Labor Force Participation Rate Is Unlikely
A Full Recovery To The Pre-Pandemic Labor Force Participation Rate Is Unlikely
A Full Recovery To The Pre-Pandemic Labor Force Participation Rate Is Unlikely
Chart II-14The Working Age Participation Rate Has Recovered More Than The Overall Part Rate
The Working Age Participation Rate Has Recovered More Than The Overall Part Rate
The Working Age Participation Rate Has Recovered More Than The Overall Part Rate
A lower overall participation rate results in a faster decline in the unemployment rate for any given level of employment growth. Given that there are minimal-to-no remaining labor market divergences along other demographic dimensions of the labor market that aren’t simply correlated with the overall unemployment rate, the implication of a permanently lower participation rate is that the Federal Reserve is likely to hit its maximum employment objective earlier than market participants, and the Fed itself, are currently expecting. Timing The Return To Maximum Employment, And The First Fed Rate Hike Table II-2 presents the average monthly nonfarm payroll growth that will be required to reach a 3.8% unemployment rate, a level that Fed Vice Chair Richard Clarida recently affirmed would in his view likely constitute maximum employment.4 The values shown in the table assume the trend participation rate shown in Chart II-13 above, as well as a recent average of monthly population growth. Table II-2The Return To Maximum Employment May Be Faster Than You Think
September 2021
September 2021
The table highlights that the unemployment rate is likely to fall to 3.8% following the creation of roughly 4.3 million additional jobs. If the monthly change in nonfarm payrolls continues to grow at its average over the past 3 months, this threshold will be met in January 2022 – essentially a full year before the Fed and market participants expect interest rates to begin to rise. Based instead on a simple linear trend of nonfarm payrolls since late last year, the unemployment rate is likely to fall to 3.8% by sometime next summer. As we highlighted above, the Fed has been explicit that its conditions for raising the funds rate are the following: Labor market conditions have reached levels consistent with the Committee's assessments of maximum employment Inflation has risen to 2 percent Inflation is on track to moderately exceed 2 percent for some time. Currently, the second and third conditions for liftoff are present, suggesting that a first rate hike is possible by the middle of next year, barring a long-lasting impact on US economic activity from the Delta variant of COVID-19. We agree that inflation will slow significantly from its current pace over the coming year as pandemic-induced supply-side factors wane, which some investors have noted may put the Fed’s inflation criteria back into play. But we doubt that the Fed will narrowly focus on the year-over-year growth rate in the core PCE deflator – which will be strongly influenced by base effects next year from this year’s comparatively elevated price level – when judging its second and third liftoff criteria. Instead, the Fed is likely to focus on the prevailing “run rate” of inflation that excludes prices experiencing any disinflationary effects of supply-chain normalization. Chart II-15 illustrates one important reason that the Fed’s inflation criteria will remain “checked” over the coming year. The chart shows that the pandemic, especially last year’s fiscal response to it, has “normalized” important measures of inflation expectations (based on an interval of 2004 to today). We noted in a report earlier this year that inflation is determined by both the degree of economic slack and inflation expectations, a framework that the Fed and many economists refer to as the “modern-day Phillips Curve.”5 Chart II-15The Fed’s Inflation Liftoff Criteria Are Likely To Stay “Checked”
The Fed's Inflation Liftoff Criterion Are Likely To Stay "Checked"
The Fed's Inflation Liftoff Criterion Are Likely To Stay "Checked"
Many investors feel that the Phillips Curve has failed to predict weak inflation over the past decade, but we noted in our report that this perception is due to a singular focus on the economic slack component of the modern-day version of the curve – to the exclusion of inflation expectations – and a failure to consider the lasting impact of sustained periods of a negative output gap on those expectations. Chart II-16A Closed Output Gap Will Support Liftoff-Consistent Inflation
A Closed Output Gap Will Support Liftoff-Consistent Inflation
A Closed Output Gap Will Support Liftoff-Consistent Inflation
Chart II-16 highlights that both market and Fed economic projections imply a positive output gap within the next 12 months, suggesting that inflation itself will remain liftoff-consistent barring a significant shock to growth or a major disinflationary/deflationary supply-side event. Declines in the prices of goods that have surged as a result of the disruption of global supply chains could potentially lower inflation expectations over the coming year, but our sense is that this is only likely in a scenario in which the prices of these goods fall below their pre-pandemic levels (which we do not currently expect). Investment Implications There are three key investment implications of a potentially faster return to maximum employment than is currently anticipated by investors and the Fed. First, Chart II-17 highlights that the market is not priced for a first Fed rate hike by next summer, and Table II-3 highlights that a sizeable majority of respondents to the New York Fed’s Survey of Primary Dealers do not expect a single rate hike in 2022. Chart II-18 highlights that the fair value of the 10-year Treasury yield a year from today is 2.2%-2.3% in a 2H 2022 rate hike scenario, underscoring that a short duration stance is warranted within a fixed-income portfolio over the coming year – barring a long-lasting impact on economic activity from the Delta variant of COVID-19. Chart II-17The Market Is Not Fully Priced For A Quick Return To Maximum Employment
The Market Is Not Fully Priced For A Quick Return To Maximum Employment
The Market Is Not Fully Priced For A Quick Return To Maximum Employment
Table II-3Market Participant Surveys Show No Hike Expectations Next Year
September 2021
September 2021
Chart II-18Investors Should Maintain A Short-Duration Fixed-Income Stance
Investors Should Maintain A Short-Duration Fixed-Income Stance
Investors Should Maintain A Short-Duration Fixed-Income Stance
Second, while a 2.2%-2.3% 10-year Treasury yield would not necessarily be negative for stock prices on a sustained basis, Chart II-19 shows that it would bring the equity risk premium (ERP) within its 2002-2007 range. The level of the 10-year yield that is consistent with that range has fallen relative to pre-pandemic levels and is now clearly below the trend rate of economic growth, due to a significant run-up in equity market multiples. This underscores that stocks are the most dependent on T.I.N.A., “There Is No Alternative,” than at any other point since the global financial crisis. It is unclear what ERP investors will require to contend with the myriad risks to the longer-term economic outlook, many of which are political or geopolitical in nature and which did not exist in the early 2000s. Chart II-19Now, Stocks Are Increasingly Dependent On Low Bond Yields
Now, Stocks Are Increasingly Dependent On Low Bond Yields
Now, Stocks Are Increasingly Dependent On Low Bond Yields
Consequently, there are meaningful odds that equities will experience a “digestion phase” at some point over the coming year as long-maturity bond yields rise – potentially trading flat-to-down in absolute terms for several weeks or months. It is also possible that stocks will experience a more malicious sell-off, if it turns out that equity investors require a structurally higher risk premium than what prevailed prior to the global financial crisis. This is not our base case view. We continue to recommend an overweight stance toward equities in a multi-asset portfolio. But it is a risk that warrants monitoring over the coming year. Finally, rising bond yields clearly favor value over growth stocks on a 12-month time horizon. In the US, the sizeable recent bounce in growth stocks has occurred alongside a renewed decline in the 10-year Treasury yield, which itself has been driven by renewed fears about the economic impact of the Delta variant. Thus, growth stocks may remain well bid relative to value in the very near term. But on a 12-month time horizon, value stocks are likely to outperform their growth peers, as long duration tech sector valuation comes under pressure and financial sector earnings benefit from higher interest rates. Jonathan LaBerge, CFA Vice President The Bank Credit Analyst III. Indicators And Reference Charts BCA’s equity indicators highlight that the “easy” money from expectations of an eventual end to the pandemic have already been made. Our technical, valuation, and sentiment indicators are very extended, highlighting that investors should expect positive but modest returns from stocks over the coming 6-12 months. Our monetary indicator has retreated below the boom/bust line, although this mostly reflects the use of producer prices to deflate money growth. In nominal terms, the supply of money continues to grow. Still, the retreat in the indicator over the past year highlights that the monetary policy stance is likely to shift in a tighter direction over the coming year. Forward equity earnings are pricing in a substantial further rise in earnings per share, and there is no meaningful sign of waning forward earnings momentum. Bottom-up analyst earnings expectations are now almost certainly too high, but stocks are likely to be supported by robust revenue growth over the coming year. Within a global equity portfolio, global ex-US equities have underperformed alongside cyclical sectors, banks, and value stocks more generally. On a 12-month time horizon, we would recommend that investors position for the underperformance of financial assets that are negatively correlated with long-maturity government bond yields. But investors more focused on the near term, we would note the potential for further underperformance of cyclical sectors, value stocks, international equities, and most global ex-US currencies versus the US dollar. The US 10-Year Treasury yield has fallen sharply since mid-March, but may be in the process of bottoming. This decline was initially caused by waning growth momentum, but has since morphed into concern about the impact of the delta variant of SARS-COV-2 and the implications for US monetary policy. 10-year Treasury yields are well below the fair value implied by a late-2022 rate hike scenario, underscoring that the recent decline in long-maturity yields is overdone. The extreme rise in some commodity prices over the past several months has eased. Lumber prices have almost fully normalized, whereas the 3-month rate of change in industrial metals prices is now close to zero. An eventual slowdown in US goods spending, coupled with eventual supply-chain normalization and the absence of a significant reflationary impulse from Chinese policy, will likely weigh on commodity prices at some point over the coming 6-12 months. US and global LEIs remain very elevated, but are starting to roll over. Our global LEI diffusion index has declined very significantly, but this likely reflects the outsized impact of a few emerging market countries (whose vaccination progress is still lagging). Still-strong leading and coincident indicators underscore that the global demand for goods is robust, and that output is below pre-pandemic levels in most economies because of very weak services spending. The latter will recover significantly at some point over the coming year, as social distancing and other pandemic control measures disappear. EQUITIES: Chart III-1US Equity Indicators
US Equity Indicators
US Equity Indicators
Chart III-2Willingness To Pay For Risk
Willingness To Pay For Risk
Willingness To Pay For Risk
Chart III-3US Equity Sentiment Indicators
US Equity Sentiment Indicators
US Equity Sentiment Indicators
Chart III-4US Stock Market Breadth
US Stock Market Breadth
US Stock Market Breadth
Chart III-5US Stock Market Valuation
US Stock Market Valuation
US Stock Market Valuation
Chart III-6US Earnings
US Earnings
US Earnings
Chart III-7Global Stock Market And Earnings: Relative Performance
Global Stock Market And Earnings: Relative Performance
Global Stock Market And Earnings: Relative Performance
Chart III-8Global Stock Market And Earnings: Relative Performance
Global Stock Market And Earnings: Relative Performance
Global Stock Market And Earnings: Relative Performance
FIXED INCOME: Chart III-9US Treasurys And Valuations
US Treasurys And Valuations
US Treasurys And Valuations
Chart III-10Yield Curve Slopes
Yield Curve Slopes
Yield Curve Slopes
Chart III-11Selected US Bond Yields
Selected US Bond Yields
Selected US Bond Yields
Chart III-1210-Year Treasury Yield Components
10-Year Treasury Yield Components
10-Year Treasury Yield Components
Chart III-13US Corporate Bonds And Health Monitor
US Corporate Bonds And Health Monitor
US Corporate Bonds And Health Monitor
Chart III-14Global Bonds: Developed Markets
Global Bonds: Developed Markets
Global Bonds: Developed Markets
Chart III-15Global Bonds: Emerging Markets
Global Bonds: Emerging Markets
Global Bonds: Emerging Markets
CURRENCIES: Chart III-16US Dollar And PPP
US Dollar And PPP
US Dollar And PPP
Chart III-17US Dollar And Indicator
US Dollar And Indicator
US Dollar And Indicator
Chart III-18US Dollar Fundamentals
US Dollar Fundamentals
US Dollar Fundamentals
Chart III-19Japanese Yen Technicals
Japanese Yen Technicals
Japanese Yen Technicals
Chart III-20Euro Technicals
Euro Technicals
Euro Technicals
Chart III-21Euro/Yen Technicals
Euro/Yen Technicals
Euro/Yen Technicals
Chart III-22Euro/Pound Technicals
Euro/Pound Technicals
Euro/Pound Technicals
COMMODITIES: Chart III-23Broad Commodity Indicators
Broad Commodity Indicators
Broad Commodity Indicators
Chart III-24Commodity Prices
Commodity Prices
Commodity Prices
Chart III-25Commodity Prices
Commodity Prices
Commodity Prices
Chart III-26Commodity Sentiment
Commodity Sentiment
Commodity Sentiment
Chart III-27Speculative Positioning
Speculative Positioning
Speculative Positioning
ECONOMY: Chart III-28US And Global Macro Backdrop
US And Global Macro Backdrop
US And Global Macro Backdrop
Chart III-29US Macro Snapshot
US Macro Snapshot
US Macro Snapshot
Chart III-30US Growth Outlook
US Growth Outlook
US Growth Outlook
Chart III-31US Cyclical Spending
US Cyclical Spending
US Cyclical Spending
Chart III-32US Labor Market
US Labor Market
US Labor Market
Chart III-33US Consumption
US Consumption
US Consumption
Chart III-34US Housing
US Housing
US Housing
Chart III-35US Debt And Deleveraging
US Debt And Deleveraging
US Debt And Deleveraging
Chart III-36US Financial Conditions
US Financial Conditions
US Financial Conditions
Chart III-37Global Economic Snapshot: Europe
Global Economic Snapshot: Europe
Global Economic Snapshot: Europe
Chart III-38Global Economic Snapshot: China
Global Economic Snapshot: China
Global Economic Snapshot: China
Jonathan LaBerge, CFA Vice President The Bank Credit Analyst Footnotes 1 Please see The Bank Credit Analyst "July 2021," dated June 24, 2021, available at bca.bcaresearch.com 2 “Herd immunity a ‘mythical’ goal that will never be reached, says Oxford vaccine head”, The Telegraph, August 10, 2021. 3 What Has Driven the Recent Increase in Retirements? by Jun Nie and Shu-Kuei X. Yang, Federal Reserve Bank of Kansas City Economic Bulletin, August 11, 2021. 4 Outlooks, Outcomes, and Prospects for U.S. Monetary Policy, by Fed Vice Chair Richard H. Clarida, At the Peterson Institute for International Economics, Washington, D.C. (via webcast), August 4, 2021 5 Please see The Bank Credit Analyst Special Report "The Modern-Day Phillips Curve, Future Inflation, And What To Do About It," dated 18 December, 2020, available at bca.bcaresearch.com
Highlights The post-pandemic investment phase is just a continuation of the post-credit boom investment phase. This is because the pandemic has just accelerated the pre-existing shifts to a more remote way of working, shopping and interacting as well as the de-carbonisation of the economy. Combined with no new credit boom, these ongoing trends will structurally weigh on the profits of old economy sectors, consumer prices, and bond yields. At the same time, these trends are a continuing structural tailwind for the profits in those sectors that facilitate the shift to a more digital and cleaner world. Our high-conviction recommendation is to stay structurally overweight growth sectors versus old economy sectors… …and to stay structurally overweight the US stock market versus the non-US stock market. Fractal analysis: PLN/USD, Hungary versus Emerging Markets, and sugar versus soybeans. Feature Chart of the WeekUS And Non-US Profits Go Their Starkly Separate Ways
US And Non-US Profits Go Their Starkly Separate Ways
US And Non-US Profits Go Their Starkly Separate Ways
Many people use the US stock market as a proxy for the world stock market. Intuitively, this makes sense, because the US stock market is the largest in the world, and the S&P 500 and Dow Jones Industrials are well-known indexes that we can monitor in real time. In contrast, world equity indexes such as the MSCI All Country World are less familiar and do not move in real time. Yet to use the US stock market as a proxy for the world stock market is a mistake. Although the US comprises makes up half of the world stock market capitalisation, the other half is so different – the non-US yan to the US yin – that the US cannot represent the world. As we will now illustrate. US Profits Have Doubled While Non-US Profits Have Shrunk Over the past ten years, US and non-US stock market profits have gone their starkly separate ways. While US profits have nearly doubled, non-US profits languish 10 percent below where they were in 2011! (Chart of the Week) While US profits have nearly doubled, non-US profits languish 10 percent below where they were in 2011. Of course, in any comparison of this sort, a key issue is the starting point. In this first part of our analysis, we are defining the starting point as the point at which profits had recouped all their global financial crisis losses. For both US and non-US profits this point was in March 2011 (Chart I-2 and Chart I-3). Chart I-2Comparing Profit Growth Since The Full Recovery From The Financial Crisis
Comparing Profit Growth Since The Full Recovery From The Financial Crisis
Comparing Profit Growth Since The Full Recovery From The Financial Crisis
Chart I-3Comparing Valuation Expansion Since The Full Recovery From The Financial Crisis
Comparing Valuation Expansion Since The Full Recovery From The Financial Crisis
Comparing Valuation Expansion Since The Full Recovery From The Financial Crisis
Because the issue of the starting point of the analysis is contentious, we will look at a much earlier starting point later in the report. But first, here are the decompositions of the US and non-US stock market moves from March 2011. US stock market profits are up 93 percent, while the multiple paid for those profits (valuation) is up 75 percent. Compounding to a total price gain of 235 percent (Chart I-4). Chart I-4US Profits Up 93 Percent, Valuation Up 75 Percent
US Profits Up 93 Percent, Valuation Up 75 Percent
US Profits Up 93 Percent, Valuation Up 75 Percent
Non-US stock market profits are down -9 percent, while the multiple paid for those profits is up 38 percent. Compounding to a total price gain of a measly 25 percent (Chart I-5). Chart I-5Non-US Profits Down -9 Percent, Valuation Up 38 Percent
Non-US Profits Down -9 Percent, Valuation Up 38 Percent
Non-US Profits Down -9 Percent, Valuation Up 38 Percent
The aggregate world stock market profits are up 24 percent, while the multiple paid for those profits is up 57 percent. Compounding to a total price gain of 94 percent (Chart I-6). Chart I-6World Profits Up 24 Percent, Valuation Up 57 Percent
World Profits Up 24 Percent, Valuation Up 57 Percent
World Profits Up 24 Percent, Valuation Up 57 Percent
The Post-Credit Boom Phase Favours The US Over The Non-US Stock Market In the post-credit boom phase, several important features of stock market performance are worth highlighting. In absolute terms, valuation expansion has lifted US stocks by twice as much as non-US stocks, 75 percent versus 38 percent. Yet even the 75 percent expansion in the US stock market valuation has played second fiddle to the 93 percent expansion in US stock market profits. Absent valuation expansion, non-US stocks would stand lower today than in 2011. But for non-US stocks, whose structural profit growth has been non-existent, valuation expansion has been the only instrument for structural gains. Indeed, absent valuation expansion, non-US stocks would stand lower today than in 2011. And absent valuation expansion at a world level, the world stock market would lose three quarters of its ten-year gain. What can explain the startling performance differential between US and non-US stocks on both profit and valuation expansions? As we have argued before, most of the difference does not come from the underlying (US versus non-US) economies, but instead comes from the company and sector compositions of the stock markets. The US stock market is heavily over-weighted to global growth companies and sectors – such as technology and healthcare (Chart I-7) – which, by definition, have experienced structural growth in their profits. In contrast, the non-US stock market is heavily over-weighted to global old economy companies and sectors – such as financials, energy, and resources (Chart I-8) – whose profits have stagnated, or entered structural downtrends (Chart I-9). Chart I-7The US Stock Market Is Heavily Over-Weighted To Growth Sectors
The US Stock Market Is Heavily Over-Weighted To Growth Sectors
The US Stock Market Is Heavily Over-Weighted To Growth Sectors
Chart I-8The Non-US Stock Market Is Heavily Over-Weighted To Old Economy Sectors
The Non-US Stock Market Is Heavily Over-Weighted To Old Economy Sectors
The Non-US Stock Market Is Heavily Over-Weighted To Old Economy Sectors
Chart I-9Old Economy Sector Profits Have Gone Nowhere
Old Economy Sector Profits Have Gone Nowhere
Old Economy Sector Profits Have Gone Nowhere
At the same time, when bond yields decline, companies whose profits are growing (and time-weighted into the distant future) see a greater increase in their net present values. Hence, companies in the global growth sectors have experienced a larger valuation expansion than those in the old economy sectors. In this way, the US stock market has outperformed the non-US stock market on both profit growth and valuation expansion. The key question is, will these post-credit boom trends continue? The answer depends on whether the post-pandemic world marks a new phase for investment, or whether it is just a continuation of the post-credit boom phase. The Post-Pandemic Phase Is A Continuation Of The Post-Credit Boom Phase Let’s now address the issue of the starting point of our analysis by panning out to 1990. This bigger picture from 1990 shows three distinct phases for investors (Chart I-10 and Chart I-11). Chart I-10Since 1990, There Have Been Three Distinct Investment Phases
Since 1990, There Have Been Three Distinct Investment Phases
Since 1990, There Have Been Three Distinct Investment Phases
Chart I-11The Post-Pandemic Investment Phase Is A Continuation Of The Post-Credit Boom Phase
The Post-Pandemic Investment Phase Is A Continuation Of The Post-Credit Boom Phase
The Post-Pandemic Investment Phase Is A Continuation Of The Post-Credit Boom Phase
The first phase was the 1990s build-up to the dot com boom. This phase clearly favoured growth sectors, and thereby the US stock market versus the non-US stock market. The second phase was the early 2000s credit boom. This phase clearly favoured sectors that facilitated the credit boom or benefited from its spending – notably, the old economy sectors of financials, energy, and resources. Thereby it favoured the non-US stock market versus the US stock market. The third and most recent phase is the post-credit boom phase. This phase has flipped the leadership back to growth sectors as the absence of structural credit growth has stifled financials as well as the capital-intensive old economy sectors that had previously benefited from the credit boom. Additionally, the structural disinflation that has comes from weak credit growth has dragged down bond yields and – as already discussed – given a much bigger boost to growth sector valuations. Since 1990, there have been three distinct phases for investors: the dot com boom; the credit boom; and the post-credit boom. Now we come to the key question. Did 2020 mark the end of the post-credit boom phase and the start of a new ‘post-pandemic’ phase? On the evidence so far, the answer is an emphatic no. Crucially, there is no new credit boom. A still highly indebted private sector is neither willing nor able to borrow. And although public sector debt surged during the pandemic, governments are now keen to temper or rein in deficits. In any case, Japan teaches us that government borrowing – which is bond rather than bank financed – does nothing for the banks or the broader financial sector. An equally important question is, has the pandemic reversed the societal and economic trends of the post-credit boom phase? The answer is no. Quite the contrary, the pandemic has accelerated the pre-existing shifts to a more remote way of working, shopping and interacting as well as the de-carbonisation of the economy. Combined with no new credit boom, these ongoing trends are structurally disinflationary for the profits of old economy sectors as well as for consumer prices. Thereby, they will continue to weigh on bond yields. At the same time, the trends are a continuing structural tailwind for the profits in those sectors that facilitate and enable the shift to a more digital and cleaner world. While we are open to the evolving evidence, the post-pandemic investment phase seems an extension of the post-credit boom phase. This means that structurally, there is no reason to flip out of growth sectors back to old economy sectors. It also means that structurally, there is no reason to switch from US to non-US stocks. Fractal Analysis Update This week’s fractal analysis highlights three potential countertrend moves based on fragile fractal structures. First, the recent rally in the US dollar could meet near-term resistance given its weakening 65-day fractal structure. A good way of playing this would be long PLN/USD (Chart I-12). Chart I-12PLN/USD Could Rebound
PLN/USD Could Rebound
PLN/USD Could Rebound
Second, the strong outperformance of Hungary versus Emerging Markets – largely driven by one stock, OTP Bank – has become a crowded trade based on its 130-day fractal structure. This would suggest underweighting Hungary versus the Emerging Markets index (Chart I-13). Chart I-13Underweight Hungary Versus EM
Underweight Hungary Versus EM
Underweight Hungary Versus EM
Finally, the sugar price has skyrocketed as extreme weather has disrupted output in the world’s top producer, Brazil. Given that supply bottlenecks ultimately ease, a recommended trade would be to short sugar versus soybeans, using ICE versus CBOT futures contracts (Chart I-14). Set the profit target and symmetrical stop-loss at 8 percent. Chart I-14Short Sugar Versus Soybeans
Short Sugar Versus Soybeans
Short Sugar Versus Soybeans
Dhaval Joshi Chief Strategist dhaval@bcaresearch.com Fractal Trading System Fractal Trades 6-Month Recommendations Structural Recommendations Closed Fractal Trades Closed Trades Asset Performance Equity Market Performance Indicators To Watch - Bond Yields Indicators To Watch - Bond Yields ##br##- Euro Area
Indicators To Watch - Bond Yields - Euro Area
Indicators To Watch - Bond Yields - Euro Area
Indicators To Watch - Bond Yields ##br##- Europe Ex Euro Area
Indicators To Watch - Bond Yields - Europe Ex Euro Area
Indicators To Watch - Bond Yields - Europe Ex Euro Area
Indicators To Watch - Bond Yields ##br##- Asia
Indicators To Watch - Bond Yields - Asia
Indicators To Watch - Bond Yields - Asia
Indicators To Watch - Bond Yields ##br##- Other Developed
Indicators To Watch - Bond Yields - Other Developed
Indicators To Watch - Bond Yields - Other Developed
Indicators To Watch - Interest Rate Expectations Indicators To Watch - Interest Rate Expectations
Indicators To Watch - Interest Rate Expectations
Indicators To Watch - Interest Rate Expectations
Indicators To Watch - Interest Rate Expectations
Indicators To Watch - Interest Rate Expectations
Indicators To Watch - Interest Rate Expectations
Indicators To Watch - Interest Rate Expectations
Indicators To Watch - Interest Rate Expectations
Indicators To Watch - Interest Rate Expectations
Indicators To Watch - Interest Rate Expectations
Indicators To Watch - Interest Rate Expectations
Indicators To Watch - Interest Rate Expectations
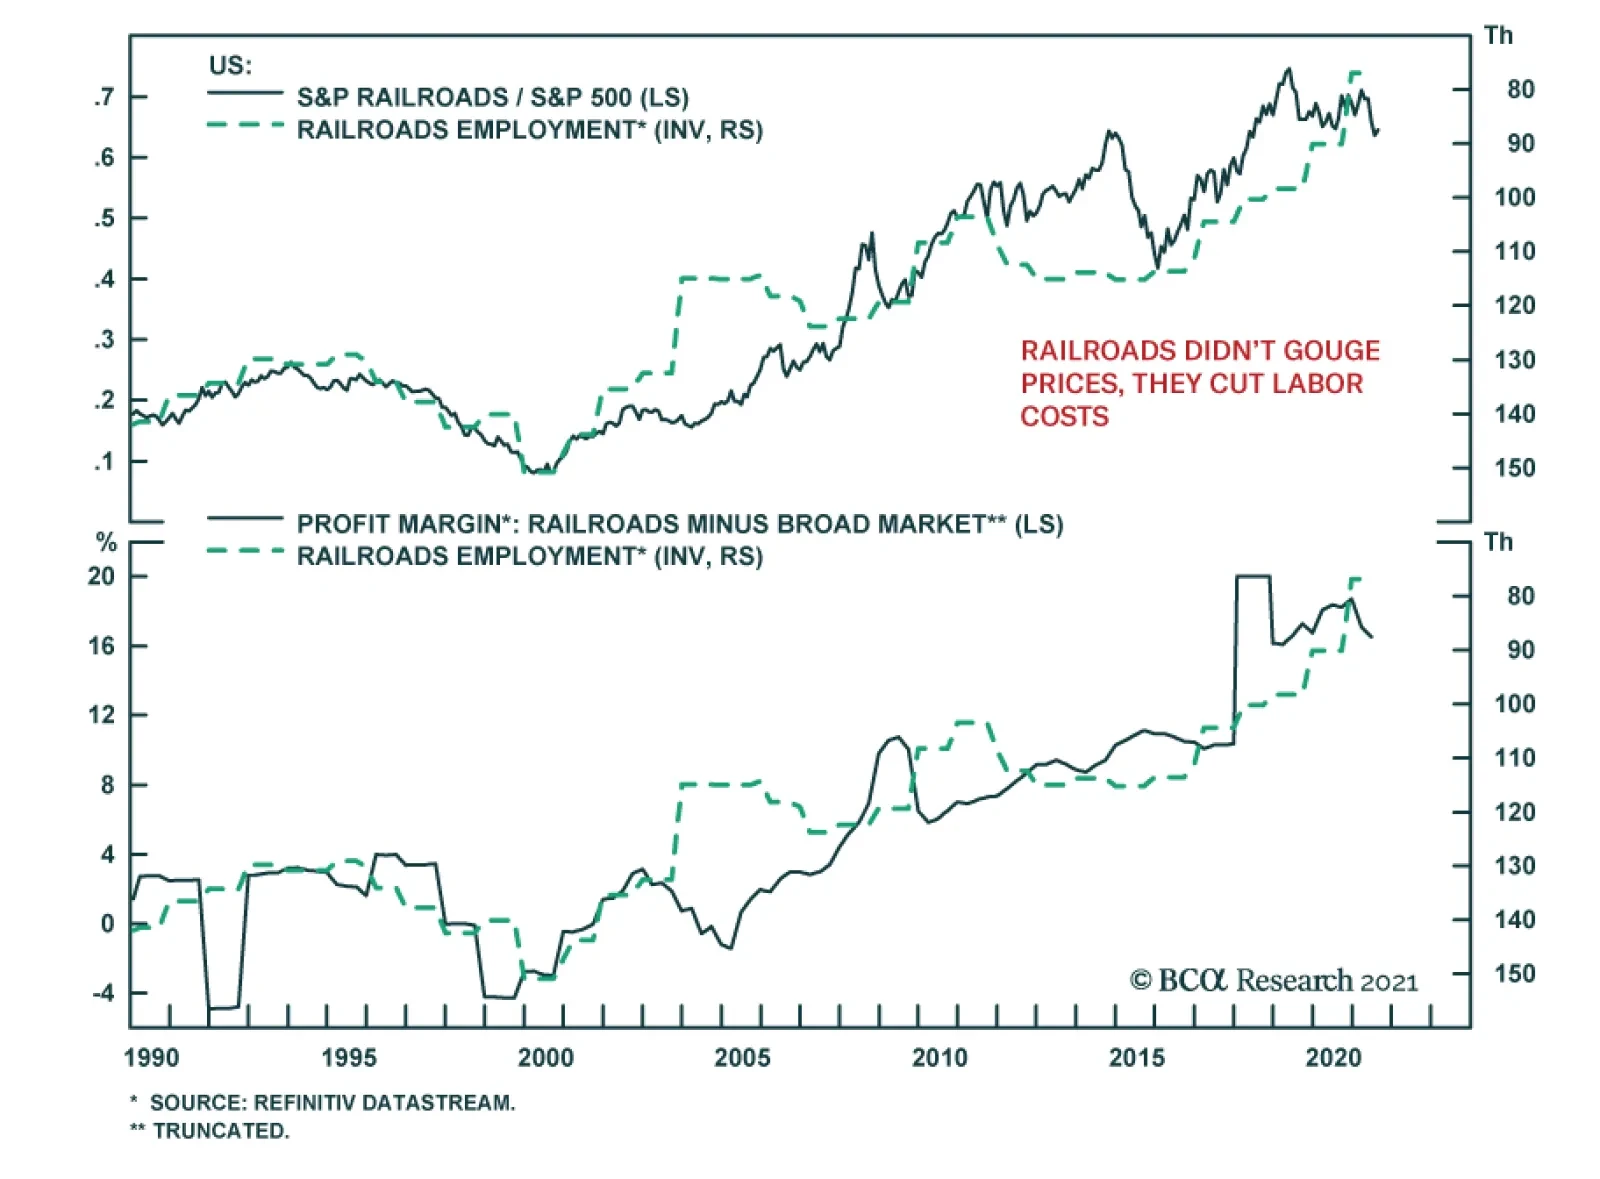
BCA Research's US Equity Strategy and US Political Strategy services conclude that the overall regulatory risk to the S&P 500 railroads sector is overstated while the macro tailwinds are strong. First, the administration's goal is to fight against…
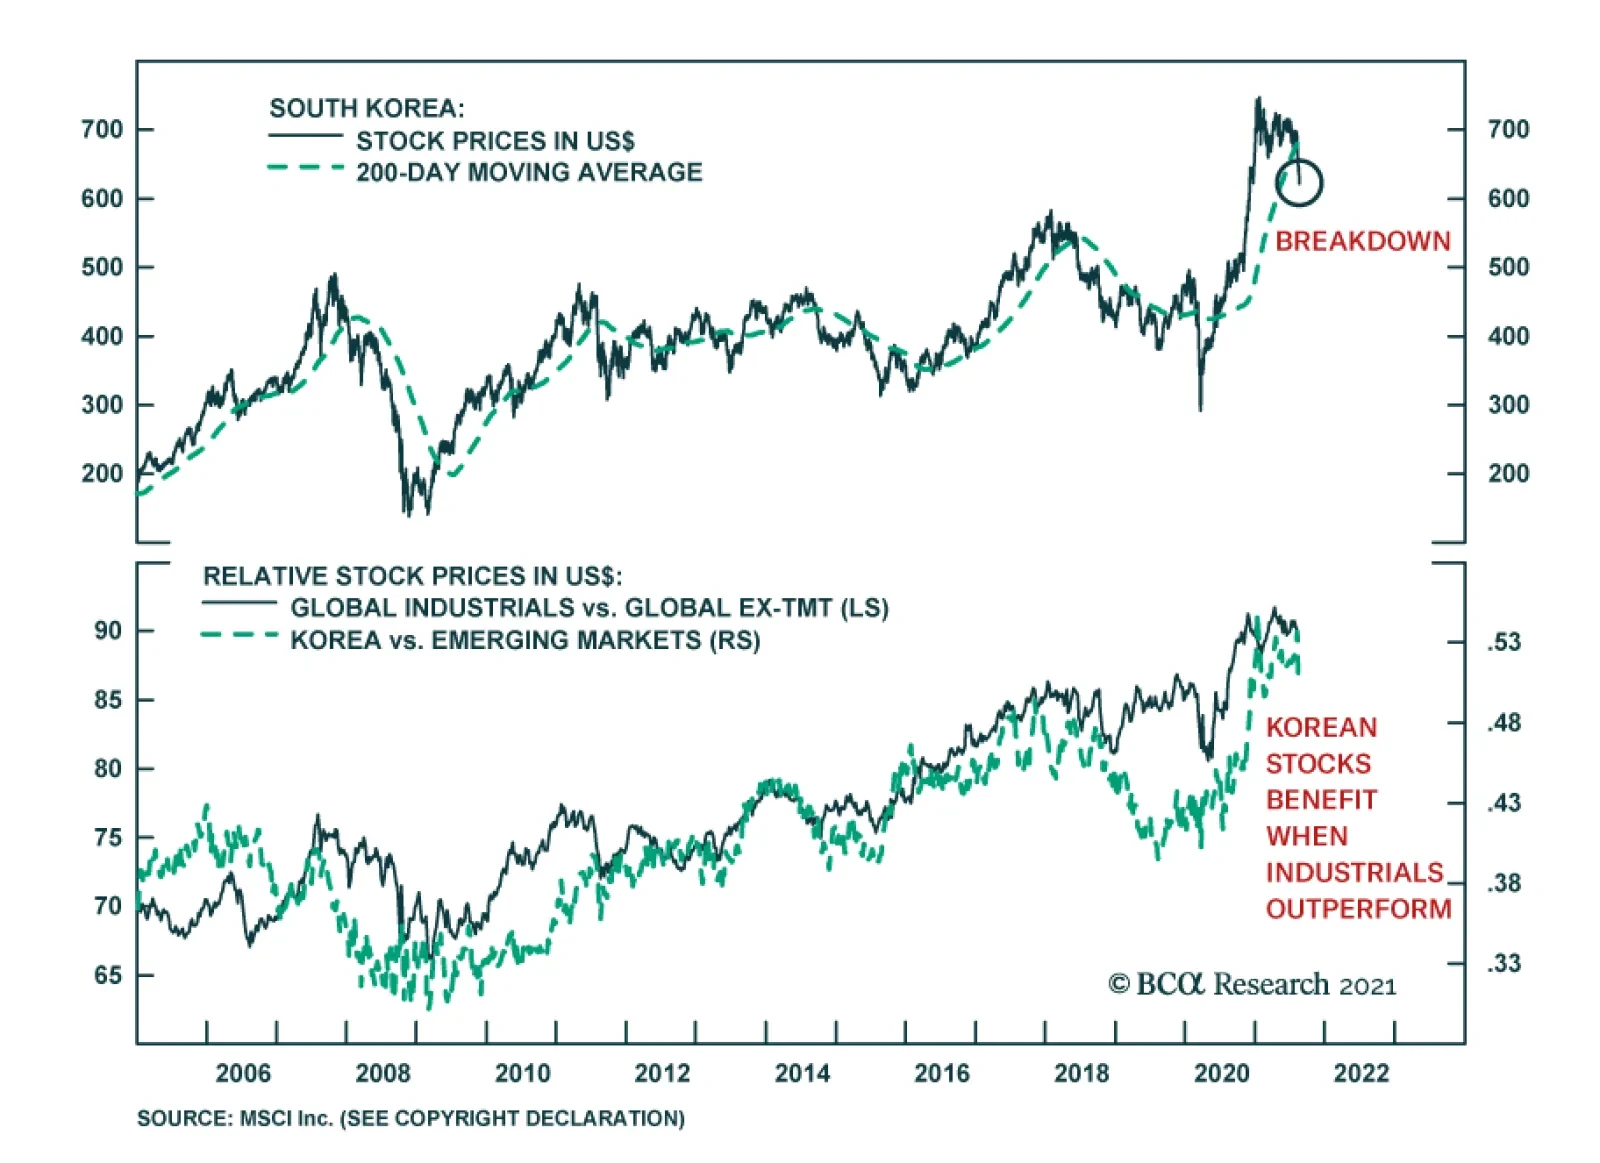
The performance of Korean stocks has deteriorated since the beginning of August and the MSCI Korea equity index (in USD) recently broke down decisively below its 200-day moving average. Further weakness cannot be ruled out over the near-term. A surge in…
Highlights China’s new plan for “common prosperity” is a long-term strategic plan to bulk up the middle class that will strengthen China – if it is implemented successfully. The record on implementing reforms is mixed. Large budget deficits to provide subsidies for households and key industries are inevitable. But fiscal reforms will be more difficult. Implementation will proceed gradually and some provinces will move faster than others. Cyclically, the common prosperity plan will not be allowed to interfere with the post-pandemic economic recovery. Beijing will have to ease monetary and fiscal policy to secure the recovery. But large debt levels create a limit on the ability to push through key reforms. Macro policy easing is beneficial for the rest of the world but Chinese investors must deal with a rise in uncertainty and an anti-business turn in the policy environment. Beijing has centralized political power to move rapidly on reforms. However, centralization creates new structural problems while antagonizing foreign nations. Feature Chinese President Xi Jinping laid out a plan on August 18 for “common prosperity” in China that will help guide national policy over the coming decades. The plan seeks to reduce social and economic imbalances and hence strengthen China and reinforce the Communist Party’s rule. The plan confirms our top key view for the year – China’s confluence of internal and external risks – as well as our long-running theme that Chinese domestic political risk is greater than it looks because of underlying problems like inequality and weak governance. The market has woken up to these views and themes (Chart 1). Now Beijing is turning to address these problems, which is positive if it follows through. But investors will have to cope with new policies and laws that reverse the pro-business context of recent decades. In this report we review the new plan and its implications in the context of overall Chinese economic policy. The chief investment takeaway is that while China will push forward various reforms, Beijing cannot afford to self-inflict an economic collapse. Monetary and fiscal policy will ease over the coming 12 months. As such China policy tightening will not short-circuit the global recovery. However, Chinese corporate earnings and the renminbi will not benefit from the country’s anti-business turn. Chart 1Market Wakes Up To China's Political Risk
Market Wakes Up To China's Political Risk
Market Wakes Up To China's Political Risk
What Is In The Common Prosperity Plan? The first thing to understand about Beijing’s new plan for “common prosperity” is that it is aspirational: it contains few specific targets or concrete policies. It builds on existing policy goals set for 2049, the hundredth anniversary of the People’s Republic. Implementation will be gradual. The plan is consistent with the Xi administration’s previous emphasis on improving the country’s quality of life and tackling systemic risks. It takes aim at social immobility, income and wealth inequality, poor public services, a weak social safety net, and other problems that did not receive enough attention during China’s rapid growth phase over the past forty years. Left unattended, China’s socioeconomic imbalances could fester and eventually destabilize the regime. From the beginning, the Xi administration has tackled the most pressing popular concerns to try to rebuild the party’s legitimacy, increase public support, and avoid crises. Crackdowns on pollution and excessive debt are prime examples. China does indeed suffer from high income inequality and low social mobility, as we have highlighted in key reports. It is comparable to the United States as well as Italy, Argentina, and Chile, all of which have suffered from significant social and political upheaval in recent memory (Chart 2). By contrast, Japan, Germany, and Australia have been relatively politically stable. Chart 2China Risks Social Unrest Like The Americas
China Spreads The Wealth Around
China Spreads The Wealth Around
Table 1 summarizes the common prosperity plan. The key takeaways are the long 2049 deadline, the emphasis on “mixed ownership” in the corporate sphere (retaining a big role for state control and state-owned enterprises but attracting private capital), the redistribution of household income (reform the tax code), the establishment of property rights, the censorship of media/discourse, and the need to reduce rural disparity. The most important point of all is that Beijing intends to grow the size and wellbeing of the middle class – the foundation of a country’s strength. Table 1China’s “Common Prosperity” Plan For 2049
China Spreads The Wealth Around
China Spreads The Wealth Around
Coastal China today has reached Taiwanese and Korean levels of per capita income and has slightly exceeded their levels of wealth inequality (Chart 3). These countries witnessed social unrest and regime change in the 1980s due to such problems. The urban-rural gap is even more problematic in China due to its large rural population and territory. The Chinese public is expected to become more demanding as it evolves. Hence Beijing is pledging to redistribute wealth, grow the middle class, speed up income growth among the poorest, reduce rural disparities, expand access to elderly care, medicine, and housing, and establish a better legal framework for business. These goals are positive in principle, especially for household sentiment, social stability, and political support for the administration. But they also entail a higher tax/wage/regulation environment for business and corporate earnings. The question for investors centers on implementation. Chart 3China's Wealth Disparities Outstrip Comparable Neighbors
China's Wealth Disparities Outstrip Comparable Neighbors
China's Wealth Disparities Outstrip Comparable Neighbors
What About Vested Interests? Table 1 above shows that the super-committee that issued the common prosperity plan also addressed China’s ongoing battle against financial risk. The financial policy statement was neither new nor surprising but it highlights something important: “preventing risks” will have to be balanced with “ensuring stable growth.” This balancing of reform and growth is essential to Chinese government and will guide the implementation of the common prosperity plan just as it has guided President Xi’s crackdown on shadow banking. This is an especially pertinent point today, as Beijing runs the risk of overtightening monetary, fiscal, and regulatory policies. While Beijing’s vision of a better regulated, more heavily taxed, and higher-wage society should not be underrated, reform initiatives will be delayed if they threaten to derail the post-pandemic recovery. Time and again the Xi administration has ruled against a rapid, resolute, and disruptive approach to reform, such as the “assault phase of reform” spearheaded by Premier Zhu Rongji in the late 1990s. In the plan’s own words: “achieving common prosperity will be a long-term, arduous, and complicated task and it should be achieved in a gradual and progressive manner.” Having said that, the pattern of reform has been a vigorous launch, a market riot, and then backtracking or delay. This means markets face more volatility first before things settle down. An initial volley of policy actions should be expected between now and spring of 2023, when the National People’s Congress solidifies the plans of the twentieth National Party Congress in fall 2022. As with the ongoing regulatory crackdown on Big Tech, the market may experience a technical rebound but the political assessment suggests government pressure will be sustained for at least the next 12 months. We do not recommend bottom feeding in Chinese equities. Will the reforms be effective over time? When the Xi administration took power in 2012-13, it issued a visionary policy document calling for wide-ranging reforms to China’s economy (“Decision on Several Major Questions About Deepening Reform”).1 Over the past decade these reforms have had mixed success. Rhodium Group maintains a reform tracker to monitor progress – the results are lackluster (Table 2). Some core principles, such as the claim that China would make market forces “decisive” in allocating resources, have been totally reversed. Table 2China’s Progress On Reforms Over Past Decade
China Spreads The Wealth Around
China Spreads The Wealth Around
While China’s government model is absolutist, there are still social and economic limits on what the government can achieve. Beijing cannot raise a nationwide property tax, estate tax, and capital gains tax overnight just to reduce inequality. In fact, the long saga of the property tax tells a very different story. Beijing is limited in how it can tax the bubbling property sector because Chinese households store their wealth in houses and because any sustained price deflation would lead to a national debt crisis. Officials have pledged to advance a nationwide property tax in the past three five-year plans with little progress. A serious effort to impose the tax in 2014 was only implemented in two provinces, notably Shanghai’s tax on second or third homes owned by the same household.2 The common prosperity plan entails that the government will revive the property tax but the rollout will still be gradual and step-by-step reform. The tax will focus on major urban areas, not minor ones where population decline could weigh on prices. The government work report in early 2023 will be a key watchpoint for where and when the property tax will be levied but there can be little doubt that it will gradually be levied for top-tier cities. Other aspects of the common prosperity plan will be implemented with provincial trial runs. It all begins with a “demonstration zone,” namely Zhejiang province, a wealthy coastal state where President Xi Jinping once served as party secretary and first army secretary. Zhejiang is expected to make some progress by 2025 and achieve most the goals by 2035 (in keeping with Xi’s 2035 strategic vision). The Zhejiang plan includes concrete numerical targets and as such sheds light on the broader national plan and how other provinces will implement it. The most important target is the desire to have 80% of the population earn an annual disposable income of CNY 100,000-500,000 ($15,400-77,000). The labor share of output should be greater than 50%, compared to a national average of 35%-40%. The urbanization rate should hit 75%, up from 72%. Urban incomes should be capped at just short of twice that of rural income. Enrollment rates in higher education will go up, life expectancy should reach above 80 years, pollution should be further controlled, and the unemployment rate should stay below 5.5%. A host of other goals, ranging from technology to fertility and the social safety net, are shown in Table 3. Table 3China: Zhejiang Province As Bellwether For “Common Prosperity” Plan
China Spreads The Wealth Around
China Spreads The Wealth Around
Some of the plan’s intentions will be undermined by Chinese governance. It is difficult to improve social fairness and property rights in the context of autocracy because the central and local governments create distortions and cannot be held to account for their own mistakes and abuses. The immediate political context of the common prosperity plan should not be missed: the president is outlining a bright future to justify the fact that he will not step down from power as earlier term limits required in fall 2022. The president’s 2035 vision implies an important strategic window in which to accomplish ambitious goals but the lack of checks and balances suggests that the next 14 years could be very similar to the last 10 years, in which arbitrary and absolutist decisions govern policy. The problem is highlighted by China’s recent 10-point plan on government under rule of law, which is undercut by the arbitrary actions of regulators in the tech crackdown (see Appendix). In other words, while social stability may improve in many ways, the shift away from consensus rule, toward rule of a single person, will increase policy uncertainty and create new governance problems at the same time that could produce greater instability over the long run. Having said all that, it is essential to acknowledge that a comprehensive plan to grow the middle class and expand the social safety net could be very positive for China if implemented. A Global Social Justice Race? If investors are thinking that the Xi administration’s calls for “social fairness and justice” and big new investments in “elderly care, medical security, and housing supply” resemble those of US President Joe Biden in his American Families Plan, then they are right. But while the US is already at historic levels of social division after failing to deal with inequality, China is attempting to learn from the US’s problems and rebalance society before polarization, factionalization, and social unrest occur. The Communist Party tends to take major action in response to American crises. Beijing’s crackdown on extremism and domestic terrorism in the early 2000s followed from the September 11 attacks. Its crackdown on local government debt and shadow banking stemmed from the 2008 financial crisis. And its crackdown on Big Tech, social media, and inequality today responds to the rise of populism in the US and Europe. The fact that deindustrialization has led to political crises in the developed world, and that social media companies can both exacerbate social unrest and silence a sitting president, is not lost on the Chinese administration. Unfortunately, China’s approach will probably escalate conflict with the West. First, Beijing is coupling its new social agenda with an aggressive campaign of military modernization and technological acquisition. It is doubling down on advanced manufacturing as its future economic model. The liberal democracies will not only be forced to defend their own political systems and governance models but will also be pressured into more hawkish stances on foreign, trade, and defense policy toward China. So far China is still attractive to foreign investors but the combination of socialist policy, import substitution, and foreign protectionism should put a cap on investment flows over time (Chart 4). What is the net effect of social largesse at home and great power competition abroad? Larger budget deficits. Fiscal expansionism is the key mechanism for the US and China to reboot their economies, reduce social pressures, secure supply chains, and compete with other each other. And expansionary fiscal policies will boost inflation expectations on the margin. One thing is clear: China’s regime will be imperiled if instead of common prosperity and “national rejuvenation” it gets economic collapse. Beijing is already seeing capital outflows reminiscent of the crisis period in 2014-15 when aggressive reforms triggered a collapse in risk appetite and a stock market crash (Chart 5). The implication is that monetary and fiscal easing will accompany the reform agenda. Chart 4China's New Policies Will Deter Foreign Investment
China's New Policies Will Deter Foreign Investment
China's New Policies Will Deter Foreign Investment
Chart 5Capital Flight And Capital Controls A Risk If Implementation Aggressive
Capital Flight And Capital Controls A Risk If Implementation Aggressive
Capital Flight And Capital Controls A Risk If Implementation Aggressive
That would be marginally positive for global growth and EM countries that export to China. Investors in China, however, will have to deal with greater policy uncertainty as China attempts to redistribute wealth while waging a cold war abroad. Investment Takeaways None of Beijing’s social goals can be met if overall growth and job creation slow too much. Reforms are constantly subject to the ultimate constraint of maintaining overall stability. Already in 2021 Beijing is verging on excessive monetary and fiscal policy tightening (Chart 6). The Politburo signaled in July that it would take its foot off the brakes but policy uncertainty is still wreaking havoc in the equity market and overall animal spirits are downbeat. We expect policy to ease over the coming year to ensure stability ahead of the twentieth national party congress. This would be marginally good news for global growth, contingent on the effects of the global pandemic. Of course we cannot deny that more bad news for global risk assets may be necessary in the very near term to prompt the policy easing that we expect. Policymakers will backtrack on various policies when the market revolts or when the risk of debt-deflation rears its ugly head. Corporate and even household debt have expanded so much in recent years that Chinese policymakers have their hands tied when they try to push reforms too aggressively (Chart 7). A Japanese-style combination of a shrinking and graying population could create a feedback loop with debt deleveraging in the event of a sharp drop in asset prices. On the whole we maintain a pessimistic outlook on Chinese currency and assets. Chart 6China Runs Risk Of Overtightening Policy
China Runs Risk Of Overtightening Policy
China Runs Risk Of Overtightening Policy
Chart 7Debt Trap Must Be Avoided - Monetary/ Fiscal Policy Will Stay Accommodative
Debt Trap Must Be Avoided - Monetary/ Fiscal Policy Will Stay Accommodative
Debt Trap Must Be Avoided - Monetary/ Fiscal Policy Will Stay Accommodative
Matt Gertken Vice President Geopolitical Strategist mattg@bcaresearch.com Appendix Table A1China: 10-Point Guidelines On Government Under Rule Of Law (2021-25)
China Spreads The Wealth Around
China Spreads The Wealth Around
Footnotes 1 See Arthur R. Kroeber, “Xi Jinping’s Ambitious Agenda for Economic Reform in China,” Brookings, November 17, 2013, brookings.edu. 2 Chongqing’s property tax only affects luxury houses. Shenzhen and Hainan are the next pilot projects.
Dear Client, I will be on vacation next week. In lieu of our regular report, we will be sending you a Special Report written by my colleagues Chester Ntonifor, BCA Research’s Chief Foreign Exchange Strategist, and Matt Gertken, Chief Geopolitical Strategist. Their report discusses the threat to the dollar’s reserve status over the next decade. This week, Matt published a timely report entitled “Afghanistan? Watch Iran And China,” examining the global macro significance of the US withdrawal from Afghanistan. I trust you will find both reports insightful. Best regards, Peter Berezin, Chief Global Strategist Highlights Over the next 12 months, US inflation will decline fast enough to allow the Federal Reserve to maintain its accommodative monetary stance, but not as fast as investors are expecting. A number of structural forces were becoming inflationary even before the pandemic began. The pandemic will only buttress the tide. Even if the virus is eventually vanquished, the pandemic could prop up inflation by permanently reducing labor supply, hastening the retreat from globalization, and keeping fiscal policy looser than it otherwise would have been. Fixed-income investors should maintain a short duration stance. We expect the US 10-year Treasury yield to rebound to about 1.8% by early next year. Long-term bond yields in the other major economies will also rise, although not as much as in the US. In and of itself, higher inflation is not necessarily bad for equities. What makes higher inflation toxic for stocks is when it forces central banks to raise rates to punitive levels. Fortunately, such an outcome is still a few years away, justifying an overweight equity position for now. Upside Risks To Inflation In our July 23rd report, we argued that investors were asking the wrong question about inflation. Rather than asking whether higher inflation is transitory, they should be asking whether inflation will decline faster or slower than what the market is discounting. Chart 1Investors Expect Inflation To Fall Rapidly From Current Levels
Transitory At First: The Pandemic’s Long-Term Impact On Inflation
Transitory At First: The Pandemic’s Long-Term Impact On Inflation
Chart 1 shows that investors expect inflation to fall rapidly from current levels and to remain subdued thereafter. The widely followed 5-year/5-year forward TIPS breakeven inflation rate currently stands at 2.12%, below the Fed’s comfort zone of 2.3%-to-2.5% (Chart 2).1 Chart 2Below-Target Inflation Expectations And A Low R* Have Restrained Bond Yields
Below-Target Inflation Expectations And A Low R* Have Restrained Bond Yields
Below-Target Inflation Expectations And A Low R* Have Restrained Bond Yields
Downbeat long-term inflation expectations and the market’s perception that the neutral rate of interest is very low are the two main reasons why bond yields are so depressed. QE programs have also dampened yields, although not nearly as much as widely believed. Chart 3Outside Of A Few Pandemic-Related Sectors, The CPI Has Yet To Return To Trend
Outside Of A Few Pandemic-Related Sectors, The CPI Has Yet To Return To Trend
Outside Of A Few Pandemic-Related Sectors, The CPI Has Yet To Return To Trend
In our report, we contended that US inflation would come down fast enough over the next few quarters to allow the Federal Reserve to maintain its accommodative monetary stance, but not as fast as investors are expecting. On the one hand, the evidence clearly shows that most of the recent increase in US inflation has been driven by just a few pandemic-related sectors (Chart 3). On the other hand, high levels of excess household savings, the need for firms to expand capacity and rebuild inventories, and continued policy support will boost output and prices. The Long-Term Inflationary Consequences Of The Pandemic We also argued that a variety of structural forces, including the exodus of baby boomers from the labor market, a retreat from globalization, and increasing social unrest, would drive up inflation over the long haul. A key question is how the pandemic will shape these structural forces going forward. As we discuss below, there are three main overlapping channels through which the pandemic could have a lasting impact on inflation: Labor market scarring: Even if the virus is eventually vanquished, the pandemic could still permanently reduce the labor supply. Widespread worker shortages would fuel inflation. Deglobalization: Globalization has historically been a deflationary force. The pandemic could accelerate the retreat from globalization by prompting firms to bring more production back home, while exacerbating geopolitical tensions. Fiscal policy: Big budget deficits could persist in the post-pandemic period. Debt-saddled governments may turn to inflation to erode their debt burdens. Let us assess these three channels in turn. Channel #1: Labor Market Scarring Despite July’s blockbuster employment report, there are still nearly 4% fewer Americans employed than was the case in January 2020. Yet, US businesses are struggling to hire workers (Chart 4). Nationwide, the job openings rate stands at a record 6.5%, up from 4.5% on the eve of the pandemic (Chart 5). Chart 4US Companies Are Facing A Labor Shortage
US Companies Are Facing A Labor Shortage
US Companies Are Facing A Labor Shortage
Chart 5There Are Plenty Of Jobs Available
There Are Plenty Of Jobs Available
There Are Plenty Of Jobs Available
Generous unemployment benefits, less immigration, and the reluctance of many workers to expose themselves to the virus have all helped to reduce labor supply. A marked shift in the composition of spending has increased the demand for workers in some sectors while reducing demand in other sectors (Chart 6). Since labor is not perfectly fungible across sectors, this has caused overall unemployment to rise. Chart 6Which Sectors Have Gained And Which Have Lost Jobs Since The Pandemic?
Transitory At First: The Pandemic’s Long-Term Impact On Inflation
Transitory At First: The Pandemic’s Long-Term Impact On Inflation
Looking out, labor supply should increase as emergency unemployment benefits expire, immigration picks up, and more people are vaccinated. The mismatch of workers across sectors should also diminish as goods and services spending rebalances. Nevertheless, there is considerable uncertainty over how quickly all this will happen. According to Indeed, an online job posting site, unemployed workers cited having a “financial cushion” as the most popular reason for not looking for a job in July (Chart 7). Given that American households are sitting on $2.4 trillion in excess savings, it may take some time for this cushion to deflate (Chart 8). Chart 7Americans Are Not Desperate To Find Work
Transitory At First: The Pandemic’s Long-Term Impact On Inflation
Transitory At First: The Pandemic’s Long-Term Impact On Inflation
Chart 8A Lot Of Excess Savings
A Lot Of Excess Savings
A Lot Of Excess Savings
Chart 9No Jab, No Job
Transitory At First: The Pandemic’s Long-Term Impact On Inflation
Transitory At First: The Pandemic’s Long-Term Impact On Inflation
Wider vaccine mandates could also impact labor market participation. A host of major companies, ranging from Google to Citigroup, are requiring their employees to be inoculated before returning to the office (Chart 9). The Pentagon has laid out a plan endorsed by President Biden obliging members of the military to get the COVID-19 vaccine. Earlier this week, the Las Vegas Raiders became the first NFL team to require fans to produce proof of vaccination to gain entry to home games. On the one hand, vaccine mandates could encourage more people to get the jab, which should help curb the pandemic and boost employment in the service sector. While the numbers have improved in recent weeks, only 57% of Americans between the ages of 18 and 64 are fully vaccinated (Chart 10). On the other hand, some people might opt for unemployment over a vaccine. According to a recent YouGov poll, about half of all unvaccinated Americans believe that the government is using COVID-19 vaccines to microchip the population (Chart 11). The threat of losing one’s job is unlikely to sway many of them. Chart 10Many Workers Remain Unvaccinated
Transitory At First: The Pandemic’s Long-Term Impact On Inflation
Transitory At First: The Pandemic’s Long-Term Impact On Inflation
Chart 11One In Five Americans Believes The US Government Is Using The Covid-19 Vaccine To Microchip The Population
Transitory At First: The Pandemic’s Long-Term Impact On Inflation
Transitory At First: The Pandemic’s Long-Term Impact On Inflation
Pandemic-induced shifts in work-life preferences could also reduce labor supply. According to Ipsos, a polling firm, most employees would prefer to work remotely at least part of the time, with 25% indicating they do not want to return to their workplace at all (Chart 12). The same poll found that 30% of workers would consider looking for another job if their employer required them to work away from home full time (Chart 13). Chart 12Let’s Chat Around The Water Cooler On Tuesdays And Wednesdays
Transitory At First: The Pandemic’s Long-Term Impact On Inflation
Transitory At First: The Pandemic’s Long-Term Impact On Inflation
Chart 13What Is The Opposite Of A “One Size Fits All” Work Environment?
Transitory At First: The Pandemic’s Long-Term Impact On Inflation
Transitory At First: The Pandemic’s Long-Term Impact On Inflation
Chart 14Number Of Retired People Jumped During The Pandemic
Number Of Retired People Jumped During The Pandemic
Number Of Retired People Jumped During The Pandemic
If remote working boosted productivity, as some have claimed, this would not be such a bad thing. However, it is far from clear that this is the case. A recent University of Chicago study of 10,000 skilled professionals from an Asian IT company revealed that work-from-home policies decreased productivity by 8%-to-19%. Early retirement has also reduced labor supply. The share of retirees in the US population rose by 1.3 percentage points between February 2020 and July 2021, with most of the increase occurring early in the pandemic (Chart 14). Based on pre-pandemic demographic trends, the retirement rate should have risen by only 0.5 percentage points over this period. The good news, as discussed in a recent study by the Kansas City Fed, is that most of the increase in the retirement rate was driven by fewer people transitioning from retirement back into employment. The share of people transitioning from employment to retirement did not change much (Chart 15). This led the authors to conclude that “More retirees may rejoin the workforce as health risks fade, but the retirement share is unlikely to return to a normal level for some time.” Chart 15Increased Retirees: A Closer Look
Transitory At First: The Pandemic’s Long-Term Impact On Inflation
Transitory At First: The Pandemic’s Long-Term Impact On Inflation
Bottom Line: Labor supply will recover as the pandemic recedes. Nevertheless, the available pool of workers will likely be lower in the post-pandemic period than it would have otherwise been. A shortage of workers will prop up wage growth, helping to fuel inflation. Channel #2: Deglobalization Globalization was on the back foot even before the pandemic began. Having steadily increased between 1991 and 2008, the ratio of global trade-to-output was basically flat during the 2010s (Chart 16). Ironically, the pandemic has revived global trade by shifting the composition of spending away from non-tradable services towards tradable goods. This shift in spending is the key reason why shipping costs have soared in recent months (Chart 17). Chart 16Globalization Plateaued Over A Decade Ago
Globalization Plateaued Over A Decade Ago
Globalization Plateaued Over A Decade Ago
Chart 17Shipping Costs Have Soared In Recent Months
Shipping Costs Have Soared In Recent Months
Shipping Costs Have Soared In Recent Months
The rebound in trade will not endure. Already, we are seeing companies moving production back home to establish greater control over their supply chains. The pandemic has exacerbated geopolitical tensions between China and the US. Recriminations about how the pandemic began and what China could have done to stop it will not go away anytime soon. Trade bloomed during Pax Britannica, when Great Britain ruled the waves, and then again during Pax Americana, when the US controlled the commanding heights. As BCA’s geopolitical team has long stressed, the shift to a multi-polar world is likely to restrain globalization.2 Historically, globalization has been a deflationary force. Trade has allowed countries such as the US that consistently run current account deficits to satiate excess demand for goods with imports, thereby forestalling inflation. Trade has also raised productivity by allowing countries to specialize in those areas in which they have a comparative advantage, while providing a mechanism to diffuse technological know-how around the world. Standard trade theory predicts that less-skilled workers in developed economies will suffer a relative decline in wages in response to rising trade with developing countries. A number of studies have documented that this is precisely what happened after China entered the global trading system.3 Poor workers tend to spend more of their paychecks than either rich workers or the owners of capital. To the extent that deglobalization shifts the balance of economic power back towards blue-collar workers in advanced economies, this will raise overall aggregate demand. Against the backdrop of muted productivity growth, inflation could increase as a consequence. Bottom Line: Globalization is deflationary, while deglobalization is inflationary. The pandemic is likely to reinforce the trend towards deglobalization. Channel #3: Fiscal Policy There was once a time when governments trembled in fear of the bond vigilantes. Those days are long gone. After briefly rising to 4% in June 2009, the US 10-year Treasury yield trended lower over the subsequent decade, even though unemployment fell and government debt rose. The pandemic sent the bond vigilantes scurrying for cover. Negative real yields allowed governments to run budget deficits of previously unimagined proportions during the pandemic. Budget deficits will decline over the next few years, but the aversion to deficit spending will not return. Not anytime soon at least. The IMF expects the cyclically-adjusted primary budget deficit in advanced economies to average 2.6% of GDP between 2022 and 2026, up from 1% of GDP in the 2014-19 period (Chart 18). Even that is probably too conservative, since the IMF’s projections do not include pending legislation such as President Biden’s $550 billion infrastructure package and $3.5 trillion reconciliation budget bill. Chart 18Fiscal Policy: Tighter But Not Tight
Transitory At First: The Pandemic’s Long-Term Impact On Inflation
Transitory At First: The Pandemic’s Long-Term Impact On Inflation
If the growth rate of the economy exceeds the interest rate on government debt, then governments with high debt-to-GDP ratios could run larger budget deficits than governments with low ratios, while still achieving a stable debt-to-GDP ratio over time.4 The problem is that these same governments would face an exponential increase in debt-servicing costs if interest rates were to rise above the growth rate of the economy. This is not a risk for any major developed economy at the moment but could become an issue as spare capacity recedes. At that point, central banks could face political pressure to keep rates low, even if their economies are overheating. The result could be higher inflation. Higher inflation, in turn, would boost nominal GDP growth, putting downward pressure on debt-to-GDP ratios. Bottom Line: While budget deficits will come down over the next few years, governments in developed economies will still maintain looser fiscal policies than before the pandemic. High debt levels could incentivize policymakers to permit higher inflation. Investment Conclusions US inflation will decline over the next 12 months, but not as quickly as markets are discounting. A number of structural forces were becoming inflationary even before the pandemic began. The pandemic will only reinforce the inflationary tide. Fixed-income investors should maintain a short duration stance. We expect the US 10-year Treasury yield to rebound to about 1.8% by early next year as the Delta variant wave fades. Long-term bond yields in the other major economies will also rise, although not as much as in the US. In and of itself, higher inflation is not necessarily bad for equities. What makes higher inflation toxic for stocks is when it forces central banks to raise rates to punitive levels. Fortunately, such an outcome is still a few years away, justifying an overweight equity position for now. The second quarter earnings season was a strong one. Back on July 2nd, analysts expected S&P 500 companies to generate about $45 in EPS in Q2. In the end, they generated at least $52. Analysts expect earnings to decline in absolute terms in Q3 and remain below Q2 levels until the second quarter of next year, when they are projected to grow by a meagre 3.5% year-over-year (Table 1). Table 1US Earnings Estimates Have Upside
Transitory At First: The Pandemic’s Long-Term Impact On Inflation
Transitory At First: The Pandemic’s Long-Term Impact On Inflation
Earnings estimates usually drift lower over time (Chart 19). BCA’s US equity strategists think there is scope for earnings estimates for the second half of this year to rise materially from current levels. This should support US stocks. Along the same lines, above-trend global growth and attractive valuations should buoy stock markets outside the US. Chart 19Analysts Have Been Revising Up Earnings Estimates This Year
Analysts Have Been Revising Up Earnings Estimates This Year
Analysts Have Been Revising Up Earnings Estimates This Year
Peter Berezin Chief Global Strategist peterb@bcaresearch.com Footnotes 1 The Federal Reserve targets an average inflation rate of 2% for the personal consumption expenditures (PCE) index. The TIPS breakeven is based on the CPI index. Due to compositional differences between the two indices, CPI inflation has historically averaged 30-to-50 basis points higher than PCE inflation. This is why the Fed effectively targets a CPI inflation rate of about 2.3%-to-2.5%. 2 Please see Geopolitical Strategy Weekly Report “Hypo-Globalization (A GeoRisk Update),” dated July 30, 2021; and Special Report, “The Apex Of Globalization - All Downhill From Here,” dated November 12, 2014. 3 For example, economists Katharine Abraham and Melissa Kearney have estimated that increased competition from Chinese imports cost the US economy 2.65 million jobs between 1999 and 2016, almost double the 1.4 million jobs lost to automation. Similarly, David Autor and his colleagues found that increased trade with China has led to large job losses for blue-collar workers in the US manufacturing sector. 4 The steady-state debt-to-GDP ratio can be expressed as p/(r-g), where r is the interest rate, g is trend GDP growth, and p is the primary (i.e., non-interest) budget balance. Thus, for example, if the government wanted to achieve a stable debt-to-GDP ratio of 50% and r-g is -2%, it would need to run a primary budget deficit of 0.5*0.02=1% of GDP. However, if the government targeted a stable debt-to-GDP ratio of 200%, it could run a primary budget deficit of 2*0.02=4% of GDP. See Box 1 in our February 22, 2019 report for a derivation of this debt sustainability equation. Global Investment Strategy View Matrix
Transitory At First: The Pandemic’s Long-Term Impact On Inflation
Transitory At First: The Pandemic’s Long-Term Impact On Inflation
Special Trade Recommendations
Transitory At First: The Pandemic’s Long-Term Impact On Inflation
Transitory At First: The Pandemic’s Long-Term Impact On Inflation
Current MacroQuant Model Scores
Transitory At First: The Pandemic’s Long-Term Impact On Inflation
Transitory At First: The Pandemic’s Long-Term Impact On Inflation