Equities

Highlights A critical aspect of the diffusion of global geopolitical power – “multipolarity” – is the structural rise of India. India will gain influence in the coming five years as a growing importer of goods, services, oil, and capital. Trade with China is a positive factor in Sino-Indian relations but it will not be enough to offset the build-up of strategic tensions. Indo-Russian relations will also wane. India’s slow transition to green energy will give it greater sway in the Middle East but will not remove its vulnerability if the region destabilizes anew over Iran. Sino-Indian tensions have already affected capital flows, with the US building on its position as a major foreign investor. Feature Chart 1Sino-Pak Alliance’s Geopolitical Power Is Thrice That Of India
The Future Of India’s Power: Trade, Guns, Capital, And Oil
The Future Of India’s Power: Trade, Guns, Capital, And Oil
India’s geopolitical power pales in comparison to that of the China-Pakistan alliance (Chart 1). India is traditionally an independent and “non-aligned” power that has managed conflicts with its neighbors by influencing either Russia or America to display a pro-India tilt. This strategy has held India in good stead as it helps create the illusion of a “balance of power” in the South Asian region. Structural changes are now afoot: Sino-Pakistani assertiveness toward India continues. But in a break from the past India’s Modi-led Bhartiya Janata Party (BJP) has been constrained to adopt a far more assertive stance itself. Russo-Indian relations face new headwinds. Russia has been a close historical partner of India. But Russia under President Vladimir Putin has courted closer ties with China, while the US has tried to warm up with India since President Bush. Under Presidents Trump and Biden, the US is taking a more confrontational approach to Russia and China and will continue to court India. Against this backdrop the key question is this: In a multipolar world, how will India’s relations with the Great Powers evolve over the next five years? Will the alliances of the early 2000s stay the same or will they change? And if they change, what will it mean for global investors? In this special report we provide a helicopter view of India’s relations with key countries. We do so by examining India’s trade and capital flows with the world. A country’s power to a large extent is a function not only of its population and military strength but also of the business interests it represents. India today is the second largest arms importer globally (guns), fifth largest recipient of global FDI flows (capital) and third largest importer of energy (oil). Looking at the trajectory of these business relations, we quantify the magnitude and sources of India’s geopolitical power over the next five years and its investment implications. Trade: India’s Imports Not Enough To Offset China Tensions “The 11th Law of Power - Learn to Keep People Dependent on You. To maintain your independence, you must always be needed and wanted. The more you are relied on, the more freedom you have.” – Robert Greene, The 48 Laws of Power1 A small and closed economy in the 1980s, India today is large and open. Since India lacked industrial capabilities, and was energy-deficient to start with, its import needs grew manifold over this period. India’s current account deficit has increased by nine times from 1980 to 2019. The magnitude of India’s appetite for imports is such that its current account deficit is the fifth largest in the world today (Chart 2). Chart 2India Is The Fifth Largest Importer Of Goods And Services
The Future Of India’s Power: Trade, Guns, Capital, And Oil
The Future Of India’s Power: Trade, Guns, Capital, And Oil
Given its lack of domestic energy and industrial capabilities, India’s role as a client of the world will only become more pronounced as it grows. In fact, India appears all set to become the third largest importer of goods and services globally over the next five years (Chart 3). Chart 3India Will Become The Third Largest Net Importer, After US And UK, By 2026
The Future Of India’s Power: Trade, Guns, Capital, And Oil
The Future Of India’s Power: Trade, Guns, Capital, And Oil
Global history suggests that the client is king. The rise and fall of empires have been driven by the strength of their economies and militaries. Great powers import lots of goods and resources – and tend to export arms. The UK’s geopolitical decline over the nineteenth century, and America’s rise over the twentieth, were linked to their respective status as importers within the global economy. India’s rise as a large global importer will prove to be a key source of diplomatic leverage over the next five years. For example, India’s high appetite for imports from China will give India much-needed leverage in bilateral relations. Also, India’s slow transition to green energy continued reliance on oil will strengthen its bargaining power vis-à-vis oil producers. But these trends also bring challenges. Structurally, Sino-Indian tensions are rising and trade will not be enough to prevent them. Meanwhile dependency on the volatile Middle East is a geopolitical vulnerability. China: India’s Growing Might As A Consumer Increases Leverage Vis-à-Vis China China’s rising assertiveness in South Asia and India’s own inclination to adopt an assertive foreign policy stance will lead to structurally higher geopolitical tensions in the region. So, is a full-blooded confrontation between the two nigh? No. First, Sino-Indian wars have always been constrained by geography: they are separated by the Himalayas, which help to keep their territorial disputes contained, driving them toward proxy battles rather than direct and total war. Second, India, Pakistan, and China are nuclear-armed powers which means that war is constrained by the principle of mutually assured destruction. This principle is not absolute – world history is filled with tragedy. There are huge structural tensions lurking in the combination of China’s Eurasian strategy and growing Sino-Indian naval competition that will keep Sino-Indian geopolitical risks elevated. Nevertheless, the bar to a large-scale war remains high. In the meantime, India’s growing might as a consumer could act as a much-needed deterrent to conflict. The last two decades saw America’s share in Chinese exports decline from a peak of 21% to 17% today. With US-China relations expected to remain fraught under Biden and with the US looking to revive its strategic anchor in the Pacific and shore up its domestic manufacturing strength, China’s trade relations with America will continue to deteriorate regardless of which party holds the White House. Against such a backdrop, China will try to build stronger trading ties with countries like India whose share in China’s exports has been growing (Chart 4). After excluding Hong Kong, India today is the eighth-largest exporting destination for China. While it only accounts for 3% of China’s exports, this ratio is comparable to that of larger exporting partners like Vietnam (4% share in China’s exports), South Korea (4%), Germany (3%), Netherlands (3%), and the UK (3%). In other words, China’s need for India is underrated and growing. There are two problems with Sino-Indian trade going forward. First, the strategic tensions mentioned above could prevent trade ties from improving. Over the past decade, Sino-Indian maritime and territorial disputes have escalated while Sino-Indian trade has merely grown in line with that of other emerging markets (Chart 5). China’s rising import dependency has led it to develop both a navy and an overland Eurasian strategy. The Eurasian strategy threatens India’s security in border areas of South Asia, while India’s own naval rise and alliances heighten China’s maritime supply insecurity. These trends may or may not prevent trade from living up to its potential, but they could result in strategic conflict regardless. Chart 4Amongst Top Chinese Export Clients, India’s Importance Has Increased
The Future Of India’s Power: Trade, Guns, Capital, And Oil
The Future Of India’s Power: Trade, Guns, Capital, And Oil
Chart 5India’s Imports From China Have Broadly Grown In Line With Peers
India's Imports From China Have Broadly Grown In Line With Peers
India's Imports From China Have Broadly Grown In Line With Peers
Second, the trade relationship itself is imbalanced. India imports heavily from China but sells little into China. China is responsible for more than a third of India’s trade deficit. At the same time, India increasingly shares the western world’s concern about network security in a world where cheap Chinese hardware could become integral to the digital economy. If Sino-Indian diplomacy cannot redress trade imbalances, then trade will generate new geopolitical tensions rather than resolve other ones. One should expect China to court India in the context of rising American and western strategic pressure. Yet China has failed to do so. Why? Because China’s economic transition – falling export orientation and declining potential GDP – is motivating a rise in nationalism and an assertive foreign policy. Meanwhile India’s own economic difficulties – the need to create jobs for a growing population – are generating an opposing wave of nationalism. Thus, while Sino-Indian trade will discourage conflict on the margin, it may not be enough to prevent it over the long run. Oil: As India Lags On Green Transition, Its Significance As An Oil Consumer Will Rise Whilst renewable energy’s share of India’s energy mix is expected to grow, the pace will be slow. Moreover, India’s increased reliance on green energy sources over the next decade will come at the expense of coal and not oil (Chart 6). Consequently, India’s reliance on oil for its energy needs is expected to stay meaningful. Chart 6India’s Reliance On Oil Will Persist For The Next Decade And Beyond
The Future Of India’s Power: Trade, Guns, Capital, And Oil
The Future Of India’s Power: Trade, Guns, Capital, And Oil
Chart 7India’s Importance As An Oil Client Has Been Rising
The Future Of India’s Power: Trade, Guns, Capital, And Oil
The Future Of India’s Power: Trade, Guns, Capital, And Oil
The International Energy Agency (IEA) forecasts that India’s net dependence on imported oil for its overall oil needs will increase from 75% today to above 90% by 2040. But India’s relative importance as an oil client will also grow as most large oil consumers will be able to transition to green energy faster than India. In fact, data pertaining to the last decade confirms that this trend is already underway. India’s share of the global oil trade has been rising (Chart 7). In particular, India has taken advantage of Iraq’s rise as a producer after the second Gulf War and has marginally increased imports from Saudi Arabia (Chart 8). Chart 8India’s Importance As A Client Has Been Rising For Top Oil Exporters
The Future Of India’s Power: Trade, Guns, Capital, And Oil
The Future Of India’s Power: Trade, Guns, Capital, And Oil
Iran is the country most likely to gain from this dynamic in the coming years – if the US and Iran strike a deal to curb Iran’s nuclear program in exchange for the US lifting economic sanctions. India has maintained stable imports from the Middle East over the past decade despite nominally eliminating imports of oil from Iran (Chart 9). Chart 9India Has Maintained Stable Imports From The Middle East
The Future Of India’s Power: Trade, Guns, Capital, And Oil
The Future Of India’s Power: Trade, Guns, Capital, And Oil
However, while India will have greater bargaining power between OPEC and non-OPEC suppliers, dependency on the unstable Middle East is always a geopolitical liability. If the US and Iran fail to arrive at a deal, a regional conflict is likely, in which case India’s slow green transition and vulnerability to supply disruptions will become a costly liability. Bottom Line: India’s growing importance to both Chinese manufacturers and global oil producers will give it leverage in trade negotiations. However, ultimately, national security will trump economics when it comes to China, while India will remain extremely vulnerable to instability in the Middle East. Guns: Indo-Russian Relations Weaken “When the war broke out [between India & Pakistan in 1971], the Soviet Union cast aside all pretentions of neutrality and non-partisanship… the Russians were in no hurry to terminate the fighting since their interest was better served by the continuation of hostilities leading to an India victory … The factors that decisively determined the outcome of the war were: first, Soviet military assistance to India; secondly the USSR’s role in the UN Security council; and thirdly, Russia strategy to prevent a direct Chinese intervention in the war.” – Zubeida Mustafa, "The USSR and the Indo-Pakistan War"2 The true origins of Russia’s pro-India tilt can be traced back to 1971. The former Soviet Union’s support for India played a critical role in helping India win the Indo-Pakistan war of 1971. Half a century later the Indo-Russia relationship persists, but its intensity has declined and will continue declining over the next few years. We see three reasons: America’s withdrawal from Iraq and Afghanistan will allow the US to focus more intently on its rivalry with China and Russia – a dynamic that is reinforcing China’s and Russia’s move closer together. Meanwhile India’s relationship with the US continues to improve. The China-Pakistan alliance continues to strengthen. Beyond cooperation on China’s ambitious Belt and Road Initiative, Pakistan shares a deep relationship with China based on defense and trade (Chart 10). Hence India is distrustful of closer Russo-Chinese relations. In light of this strategic re-alignment, Russia may see value in developing a closer defense relationship with China. Trading relations between Russia and India are minimal even today. Hence unlike in the case of China, there exists no backstop on weakening of Russo-Indian relations. Less than 1.5% of India’s merchandise imports come from Russia and less than 1% of India’s exports go to Russia. Russia’s share of Indian oil imports has grown in recent years but only to 1.4% of total. Meanwhile the US share of India’s imports has catapulted to 5.7% since the US became an exporter. Any removal of Iran sanctions will come at the cost of other Middle Eastern exporters, not these two alternatives to the risky Persian Gulf, but Russia’s share is still small. Now the backbone of Indo-Russia relations has been their arms trade. However, India’s reliance on Russia for arms could decline over the next five years. India today is Russia’s largest arms client accounting for 23% of its arms sales (Chart 10). However, second in line is China which accounts for 18% of Russia’s arms sales. Given that Russia’s share in global arms exports has been declining (Chart 11), Russia will be keen to reverse or at least halt this trend. Russia can do so most easily by selling more arms to India or to China. Even as China appears to be increasingly focused on developing indigenous arms production capabilities, for reasons of strategy, China appears like a better client for Russia to bank on for the next decade. After all, in 1989, when western countries imposed an arms embargo against China in response to events at Tiananmen Square, Russia became the prime supplier of arms to China. Chart 10India Is A Key Client For Russia, As Is China
The Future Of India’s Power: Trade, Guns, Capital, And Oil
The Future Of India’s Power: Trade, Guns, Capital, And Oil
By contrast, for reasons of strategy India appears like a less promising client to bank on for Russia. India’s import demand for arms has been declining while China’s demand is increasing (Chart 12). India under the Modi-led Bhartiya Janata Party (BJP) has been reducing its reliance on imported arms. Last month, for example, the Indian Ministry of Defense (MoD) said that it has set aside 64% of the defense capital budget for acquisitions from domestic companies.3 This is an increase of 6% over last year, which was the first time such a distinction between domestic and foreign defense expenditure was made. Whilst it will take years for India to develop its domestic arms production capabilities, India’s inward tilt is worrying for traditional suppliers like Russia. Chart 11Among Top Arms Exporters, Russia Is Losing Market Share
The Future Of India’s Power: Trade, Guns, Capital, And Oil
The Future Of India’s Power: Trade, Guns, Capital, And Oil
Chart 12India’s Appetite For Arms Imports Is Falling
The Future Of India’s Power: Trade, Guns, Capital, And Oil
The Future Of India’s Power: Trade, Guns, Capital, And Oil
Moreover, Russia is aware that the situation is rife for US-India arms trade to strengthen given that India is starting to display a pro-US tilt. Groundwork for a sound defense relationship with India has already been laid out by the US as evinced by: Foundational agreements: India and the US signed the Communications, Compatibility, and Security Agreement (COMCASA) in 2018 and the Basic Exchange and Cooperation Agreement (BECA) in 2020. Sanction exemptions: The US had applied sanctions on Turkey under the Countering America's Adversaries Through Sanctions Act (CAATSA) for Ankara’s purchase of Russia’s S-400 missile defense system in 2020. The US has threatened India with CAATSA sanctions for buying S-400 missile defense systems from Russia but has not applied these sanctions to India (at least not yet). Not applying CAATSA sanctions to India allows the US to strengthen its strategic relations with India that can help further the American goal of creating a counter to China in Asia. Bottom Line: India-Russia relations will remain amicable, but this relationship is bound to fade over the next five years as the US counters China and Russia. Limited backstops exist for Indo-Russia ties. Economic ties between India and Russia are minimal, as India is cutting back on arms imports and only marginally increasing oil imports. Capital: China Investment Down, US Investment Up “America has no permanent friends or enemies, only interests.” – Henry Kissinger, Former US Secretary of State India’s economic growth rates could be higher if it did not have to deal with the paradox of plentiful savings alongside capital scarcity. Even as Indian households are known to be thrifty, only a limited portion of their savings is available for being borrowed by small firms. Almost a quarter of bank deposits are blocked in government securities. More than a third of adjusted net bank credit must be made available for government-directed lending. With what is left, banks prefer lending the residual funds to large top-rated corporates. It is against this backdrop that foreign direct investment (FDI) flows provide much needed succor to Indian corporates, particularly capital-guzzling start-ups. FDI inflows into India have become a key source of funding for Indian corporates over the last decade with annual FDI flows often exceeding new bank credit. Correspondingly, for FDI investors, India provides the promise of high returns on investment in an emerging market that offers political stability. India emerged as the fifth largest FDI destination globally in 2020. Amongst suppliers of FDI into India (excluding tax havens like Cayman Islands), the US and China have been top contributors. Whilst China has been a leading investor into the Indian start-up space, geopolitical tensions have translated into regulatory barriers that prevent Chinese funds from investing in India. Separately, as Indo-US relations improve, the symbiotic relationship between capital-rich US funds and capital-hungry Indian start-ups should strengthen. In fact, in 2020 itself, Chinese private equity (PE) and venture capital (VC) investments into India shrank whilst American investments into India doubled, according to Venture Intelligence (Chart 13). Distinct from Chinese funds’ restrained ability to invest in Indian firms, Indian tech start-ups could potentially benefit from reduced global investor appetite in Chinese tech stocks owing to China’s regulatory crackdown and breakup with the United States. China’s foreign policy assertiveness and domestic policy uncertainty may lead to a reallocation of FDI flows away from China and into India. China (including Hong Kong) has been a top host country for FDI, attracting 4x times more funds than India (Chart 14). However, India’s ability to absorb these reallocated funds over the next five years will be a function of sectoral competencies. For instance, India’s information and communications technology (ICT) sector appears best positioned to benefit from this trend. But the same may not be the case for sectors like manufacturing that traditionally attract large FDI flows in China yet are relatively underdeveloped in India. On the goods’ front, given that India’s comparative advantage lies in the production of capital-light, labor-light and medium-tech intensive products, pharmaceuticals and chemicals could be two other industries that attract FDI flows in India. Chart 13Chinese PE/VC Investments Into India In 2020 Slowed Significantly
The Future Of India’s Power: Trade, Guns, Capital, And Oil
The Future Of India’s Power: Trade, Guns, Capital, And Oil
Chart 14China Has Been A Top Host Country For FDI, Attracting 4x More Flows Than India
The Future Of India’s Power: Trade, Guns, Capital, And Oil
The Future Of India’s Power: Trade, Guns, Capital, And Oil
Bottom Line: Whilst trade between India and China has not been affected much by geopolitical tensions, capital flows have been. Given that the US historically has been a top FDI contributor in India, and given improving Indo-US relations, FDI investment into India from the US appears set to rise steadily over the next five years, particularly into the ICT sector. Investment Conclusions China-India geopolitical tensions are here to stay and will be a recurring feature of South Asia’s geopolitical landscape. However, a growing trade relationship could discourage conflict, especially if it becomes more balanced. It may not be enough to prevent conflict forever but it is an important constraint to acknowledge. India’s current account deficit will remain vulnerable to swings in oil prices, but it may be able to manage its energy bill better as its bargaining power relative to oil suppliers improves. The problem then will become energy insecurity, particularly if the US and Iran fail to normalize relations. As India and Russia explore new alignments with USA and China respectively, the historic Indo-Russia relationship will weaken. It will not collapse entirely because Russia provides a small but growing alternative to Mideast oil. US-India business interests may deepen as India considers joint ventures with American arms manufacturers and American funds court India’s capital-hungry information and communications technology sector. Against this backdrop we reiterate our constructive strategic view on India. However, for the next 12 months, we remain worried about near-term geopolitical and macro headwinds that India must confront. Ritika Mankar, CFA Editor/Strategist ritika.mankar@bcaresearch.com Footnotes 1 (Viking Press, 1998). 2 Mustafa, Zubeida. "The USSR and the Indo-Pakistan War, 1971" Pakistan Horizon 25, No. 1 (1972): 45-52. 3 Ajai Shukla, "Local procurement for defence to see 6% hike this year: Govt to Parliament" Business Standard, July 2021.

Weekly Performance Update For the week ending Thu Aug 12, 2021 The Market Monitor displays the trailing 1-quarter performance of strategies based around the BCA Score. For each region, we construct an equal-weighted, monthly rebalanced portfolio consisting of the top 3 stocks per sector and compare it with the regional benchmark. For each portfolio, we show the weekly performance of individual holdings in the Top Contributors/Detractors table. In addition, the Top Prospects table shows the holdings that currently have the highest BCA Score within the portfolio. For more details, click the region headers below to be redirected to the full historical backtest for the strategy. BCA US Portfolio
Market Monitor (Aug 12, 2021)
Market Monitor (Aug 12, 2021)
Total Weekly Return BCA US Portfolio S&P500 TRI 1.92% 0.77% Top Contributors ANAT:US TX:US COKE:US MPLX:US R:US Weekly Return 43 bps 32 bps 16 bps 13 bps 11 bps Top Detractors MAA:US BMY:US EOG:US IQV:US EXR:US Weekly Return -8 bps -7 bps -4 bps -3 bps -2 bps Top Prospects TX:US ESGR:US SC:US IT:US MPLX:US BCA Score 97.76% 97.12% 96.66% 93.62% 93.56% BCA Canada Portfolio
Market Monitor (Aug 12, 2021)
Market Monitor (Aug 12, 2021)
Total Weekly Return BCA Canada Portfolio S&P/TSX TRI 1.45% 0.77% Top Contributors WIR.UN:CA ATZ:CA WSP:CA LNF:CA WFG:CA Weekly Return 49 bps 30 bps 21 bps 13 bps 13 bps Top Detractors CRON:CA DCBO:CA TOU:CA ONEX:CA EMP.A:CA Weekly Return -32 bps -10 bps -6 bps -5 bps -4 bps Top Prospects RUS:CA PXT:CA TOU:CA CS:CA ELF:CA BCA Score 97.10% 96.65% 95.68% 95.64% 95.54% BCA UK Portfolio
Market Monitor (Aug 12, 2021)
Market Monitor (Aug 12, 2021)
Total Weekly Return BCA UK Portfolio FTSE 100 TRI 1.71% 1.39% Top Contributors MXCT:GB AAF:GB DEC:GB 888:GB SSE:GB Weekly Return 40 bps 21 bps 17 bps 16 bps 16 bps Top Detractors DATA:GB NLMK:GB SVST:GB SRE:GB GROW:GB Weekly Return -14 bps -12 bps -10 bps -6 bps -4 bps Top Prospects SVST:GB VVO:GB NLMK:GB TUNE:GB CTH:GB BCA Score 99.30% 98.26% 96.72% 95.21% 94.84% BCA Eurozone Portfolio
Market Monitor (Aug 12, 2021)
Market Monitor (Aug 12, 2021)
Total Weekly Return BCA EMU Portfolio MSCI EMU TRI 1.54% 1.45% Top Contributors HLAG:DE ARTO:FR TESB:BE ROTH:FR STR:AT Weekly Return 35 bps 22 bps 17 bps 13 bps 11 bps Top Detractors ALESK:FR LOUP:FR NESTE:FI MBH3:DE EDNR:IT Weekly Return -27 bps -7 bps -3 bps -1 bps 0 bps Top Prospects FDJ:FR STR:AT SOLV:BE IPS:FR EDNR:IT BCA Score 97.99% 97.67% 97.18% 96.81% 96.17% BCA Japan Portfolio
Market Monitor (Aug 12, 2021)
Market Monitor (Aug 12, 2021)
Total Weekly Return BCA Japan Portfolio TOPIX TRI 1.04% 1.27% Top Contributors 4694:JP 1419:JP 9543:JP 7958:JP 3291:JP Weekly Return 37 bps 18 bps 14 bps 14 bps 11 bps Top Detractors 5021:JP 3468:JP 8977:JP 8097:JP 3132:JP Weekly Return -16 bps -12 bps -5 bps -4 bps -4 bps Top Prospects 6960:JP 9436:JP 4966:JP 2208:JP 5930:JP BCA Score 99.88% 99.82% 99.68% 99.61% 99.27% BCA Hong Kong Portfolio
Image
Total Weekly Return BCA Hong Kong Portfolio Hang Seng TRI 0.34% 1.19% Top Contributors 1866:HK 316:HK 857:HK 1277:HK 98:HK Weekly Return 45 bps 19 bps 18 bps 15 bps 15 bps Top Detractors 6118:HK 990:HK 148:HK 691:HK 973:HK Weekly Return -49 bps -28 bps -14 bps -12 bps -10 bps Top Prospects 1277:HK 691:HK 215:HK 2877:HK 98:HK BCA Score 99.99% 98.52% 98.13% 96.98% 96.82% BCA Australia Portfolio
Market Monitor (Aug 12, 2021)
Market Monitor (Aug 12, 2021)
Total Weekly Return BCA Australia Portfolio S&P/ASX All Ord. TRI 1.29% 1.12% Top Contributors YAL:AU NHC:AU JLG:AU CAJ:AU ARF:AU Weekly Return 66 bps 27 bps 25 bps 21 bps 18 bps Top Detractors REA:AU PSQ:AU AQZ:AU EZL:AU AX1:AU Weekly Return -31 bps -24 bps -21 bps -19 bps -11 bps Top Prospects MGX:AU GRR:AU MHJ:AU ARF:AU PIC:AU BCA Score 99.63% 99.45% 97.40% 96.12% 96.06%
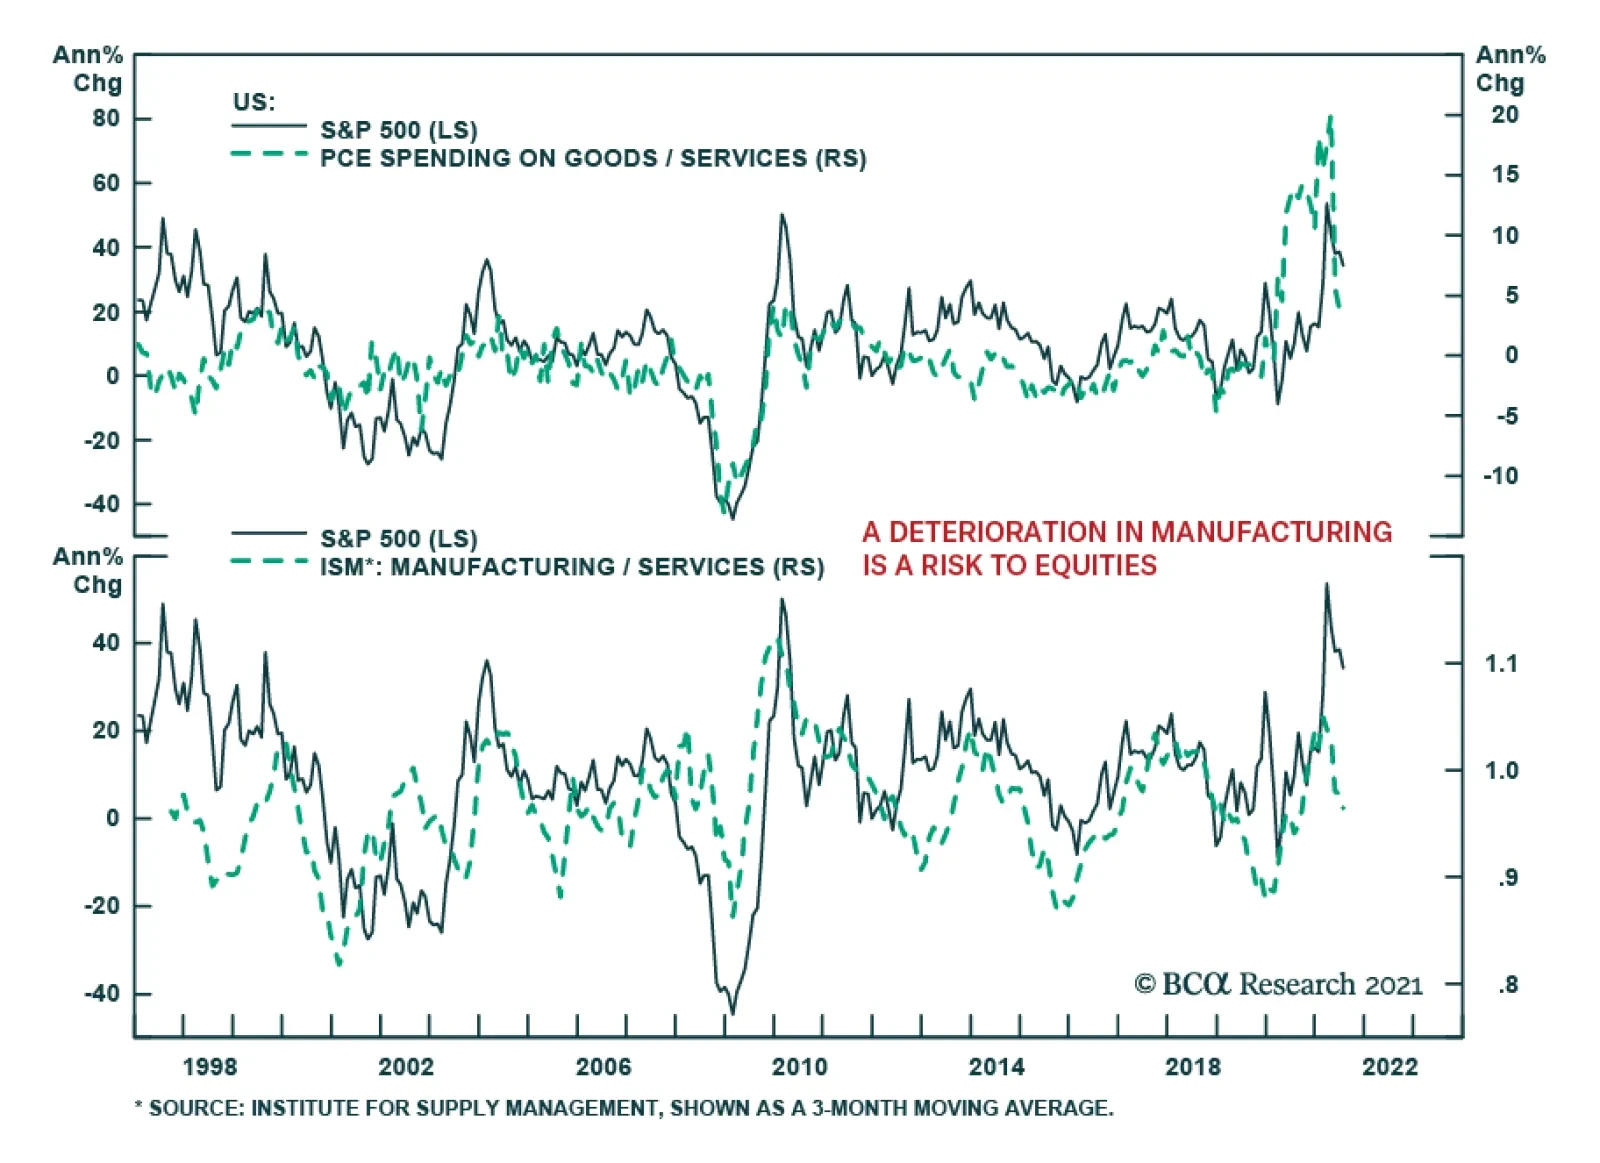
The chart above highlights that US equities benefit whenever spending on goods outpaces services spending. Similarly, US equities gain whenever the manufacturing ISM is accelerating relative to the services ISM. These relationships are intuitive. American…
Highlights Since 2008, the 10-year T-bond yield has struggled to exceed the earnings yield on technology stocks minus a constant of 2.5 percent. Based on the current technology earnings yield of 3.8 percent, and the 10-year T-bond yield at 1.3 percent, stock markets are on the edge of rationality. But at the limit, the elastic can briefly stretch by around 0.5 percent before it eventually snaps back. Hence, the 10-year T-bond yield could make a brief trip to 1.8 percent before reversing. The labour market participation rate for African Americans dropped sharply in July to 2.3 percent below its pre-pandemic benchmark level. The weakest performing demographic group could set the employment condition for the Fed’s lift-off, making it later than the market is pricing. The next shock will drive down the T-bond yield to its ultimate low, and the stock market’s valuation to its ultimate high. Fractal analysis: NOK/GBP, Hong Kong versus the world, and Netherlands versus New Zealand. Feature Chart of the WeekSince 2008, The 10-Year T-Bond Yield Has Struggled to Exceed the Earnings Yield On Tech (Minus A Constant Of 2.5 Percent)
Since 2008, The 10-Year T-Bond Yield Has Struggled to Exceed the Earnings Yield On Tech (Minus A Constant Of 2.5 Percent)
Since 2008, The 10-Year T-Bond Yield Has Struggled to Exceed the Earnings Yield On Tech (Minus A Constant Of 2.5 Percent)
Since 2008, a remarkable financial relationship has held true. The 10-year T-bond yield has struggled to exceed the earnings yield on technology stocks minus a constant of 2.5 percent. The 10-year T-bond yield has struggled to exceed the earnings yield on technology stocks minus a constant of 2.5 percent. T-bond yield ≤ technology forward earnings yield – 2.5% (Chart I-1). The upshot is that whenever, as now, the yields on tech and other high-flying growth stocks have become depressed – which is to say highly valued – the upper limit to the bond yield has been established not by the economy, but by the financial markets. On the occasions that the bond yield has attempted to breach its stock market-set upper limit, it has unleashed a self-correcting sequence of events. It has pulled up the tech sector earnings yield, which is to say pulled down the tech sector’s valuation and price. Then, to contain and reverse this sharp sell-off, the bond yield has quickly unwound its short-lived spike. Stock Markets Are On The Edge Of Rationality Earlier this year in The Rational Bubble Is Turning Irrational we highlighted that the T-bond yield was at its stock market-set upper limit. And in the subsequent six months, the markets have behaved exactly as predicted. First, tech stocks declined sharply through February-March. Then, bond yields declined sharply through May-July, allowing tech stocks to claw back their declines and then reach new highs. Indeed, since mid-February, the T-bond yield and tech stocks have moved as a near-perfect mirror image (Chart I-2). Chart I-2The T-Bond Yield And Tech Stocks Have Moved As A Near-Perfect Mirror Image
The T-Bond Yield And Tech Stocks Have Moved As A Near-Perfect Mirror Image
The T-Bond Yield And Tech Stocks Have Moved As A Near-Perfect Mirror Image
In the long run, a depressed earnings yield relative to the bond yield – which is to say a high valuation – can normalise as earnings go up. But in the short term, the adjustment must come from either the equity price declining or the bond yield declining. Or some combination of the two. With the tech earnings yield now at 3.8 percent – and assuming the post-GFC 2.5 percent minimum gap still holds true – it would set the upper limit of the 10-year T-bond yield at 1.3 percent, close to where it is trading today. Still, at the limit, the elastic can briefly stretch before it eventually snaps back. Over the last thirteen years, the maximum stretch has been around 0.5 percent. This means that, based on the current earnings yield of the tech sector, the 10-year T-bond yield could make a brief trip to 1.8 percent before reversing. For equity investors, a higher T-bond yield would support the value versus growth trade. But given that it would be a brief trip, the opportunity would not be cyclical (12-month) but merely tactical (3-month), as has been the case over the past ten years. Since 2012, cyclical opportunities to overweight value versus growth have been virtually non-existent, but there have been several good tactical opportunities (Chart I-3 and Chart I-4). Chart I-3Cyclical Opportunities To Overweight Value Versus Growth Have Been Virtually Non-Existent...
Cyclical Opportunities To Overweight Value Versus Growth Have Been Virtually Non-Existent...
Cyclical Opportunities To Overweight Value Versus Growth Have Been Virtually Non-Existent...
Chart I-4...But There Have Been Several Good Tactical Opportunities
...But There Have Been Several Good Tactical Opportunities
...But There Have Been Several Good Tactical Opportunities
We await a fractal signal that T-bonds are overbought to initiate this tactical trade. Stay tuned. The Truth About The Jobs Recovery At first glance, last week’s US employment report appeared strong. The unemployment rate continued its plunge from 14.8 percent in April 2020 to 5.4 percent in July 2021, constituting the fastest jobs recovery of all time. But the first glance doesn’t tell the true story. Unlike in previous recessions, the number of workers put on furlough or ‘temporary layoff’ surged and then plunged as the pandemic let rip and then was brought under control. Hence, to get the true story of the jobs recovery, we must strip out the furloughed workers and focus on the unemployment rate based on those ‘not on temporary layoff’ (Chart I-5). Chart I-5To Get The True Story Of The Jobs Recovery, Focus On Those 'Not On Temporary Layoff'
To Get The True Story Of The Jobs Recovery, Focus On Those 'Not On Temporary Layoff'
To Get The True Story Of The Jobs Recovery, Focus On Those 'Not On Temporary Layoff'
Based on this truer measure of labour market slack, the pace of the current recovery in jobs looks remarkably like the recoveries that followed previous downturns in 1974/75, the early 1980s, the early 1990s, dot com bust, and the GFC. The true story is that the US is little more than a third of the way on the journey to full employment (Chart I-6). Chart I-6The Pace Of The Current Jobs Recovery Looks Remarkably Like Previous Recoveries
The Pace Of The Current Jobs Recovery Looks Remarkably Like Previous Recoveries
The Pace Of The Current Jobs Recovery Looks Remarkably Like Previous Recoveries
This is significant, because unlike in previous recoveries, the Federal Reserve is now explicitly targeting full employment before it lifts the policy interest rate. Furthermore, the employment recovery must be broad and inclusive of minority demographic groups, which adds further conditionality for the Fed. While the market is focussing on the aggregate employment market, it is the weakest performing demographic group that could set the condition for the Fed’s lift-off. On this note, the labour market participation rate for African Americans dropped sharply in July to 2.3 percent below its pre-pandemic benchmark level (Chart I-7). This raises an interesting point. While the market is focussing on the aggregate employment market, it is the weakest performing demographic group that could set the condition for lift-off, if the Fed stays true to its promise of inclusivity. Which would push back lift-off to later than the market is pricing. Chart I-7The Labour Market Participation Rate For African Americans Dropped Sharply In July
The Labour Market Participation Rate For African Americans Dropped Sharply In July
The Labour Market Participation Rate For African Americans Dropped Sharply In July
Shocks Do Not Have A Cycle According to the recovery in jobs then, we are still ‘early cycle.’ Some people argue that early cycle implies that a recession is a distant prospect, that stocks only underperform in a recession, and therefore that the bull market in stocks has further to run. The investment conclusion is right, but the reasoning is wrong, on two counts. First, nobody can predict the precise timing of recessions or shocks. Second, recessions or shocks do not have a ‘cycle.’ Shocks can come in quickfire succession such as the back-to-back GFC in 2008 and the euro debt crisis which started in 2010, or the back-to-back votes for Brexit and Trump in 2016 (Chart I-8). Chart I-8Shocks Do Not Have A Cycle
Shocks Do Not Have A Cycle
Shocks Do Not Have A Cycle
Yet, while we cannot predict the precise timing of shocks, The Shock Theory Of Bond Yields tells us that we can predict their statistical distribution very accurately. The upshot is that in any 5-year period, the probability of (at least) one shock is an extremely high 81 percent, and in any 10-year period, it is a near-certain 96 percent. Given the tight feedback from bond yields to stocks and then back to bond yields, we can say with high conviction that the next shock will drive down the T-bond yield to its ultimate low. This will happen directly from a deflationary shock, or indirectly from an initially inflationary shock that drives up bond yields through the upper limit set by stock valuations. The resulting sharp correction in stocks will then cause bond yields to reverse to the ultimate low. The next shock will drive down the T-bond yield to its ultimate low, and the stock market’s valuation to its ultimate high. In turn, the ultimate low in the T-bond yield will mark the ultimate high in the stock market’s valuation, and the end of the structural bull market in stocks. Until then, long-term investors should own stocks. Fractal Analysis Update This week’s fractal analysis highlights three recent price moves that are at risk of reversal because of fragile fractal structures. First, the recent sell-off in NOK/GBP has become fragile on its 65-day fractal structure implying a likelihood of a countertrend move based on similar recent signals (Chart I-9). Chart I-9NOK/GBP Is Oversold
NOK/GBP Is Oversold
NOK/GBP Is Oversold
Second, the sell-off following China’s aggressive crackdown on its technology and private education sectors has created fragility in Hong Kong’s relative performance on its composite 65-day/130-day fractal dimension. Assuming the worst of the policy crackdown is over, this would imply a countertrend reversal based on similar signals over the past decade. The recommended trade is long Hong Kong versus developed world (MSCI indexes), setting the profit target and symmetrical stop-loss at 4 percent (Chart I-10). Chart I-10Hong Kong Versus The World Is Oversold
Hong Kong Versus The World Is Oversold
Hong Kong Versus The World Is Oversold
Finally, the massive outperformance of tech-heavy Netherlands versus healthcare and utility-heavy New Zealand has reached the limit of fragility on its 260-day fractal structure that signalled major turning points in 2011, 2015, 2016, and 2018 (Chart I-11). Hence the recommended trade is short Netherlands versus New Zealand, setting the profit target and symmetrical stop-loss at 13 percent. Chart I-11Netherlands Versus New Zealand Is Overbought
Netherlands Versus New Zealand Is Overbought
Netherlands Versus New Zealand Is Overbought
Dhaval Joshi Chief Strategist dhaval@bcaresearch.com Fractal Trading System Fractal Trades 6-Month Recommendations Structural Recommendations Closed Fractal Trades Closed Trades Asset Performance Equity Market Performance Indicators To Watch - Bond Yields Chart II-1Indicators To Watch - Bond Yields ##br##- Euro Area
Indicators To Watch - Bond Yields - Euro Area
Indicators To Watch - Bond Yields - Euro Area
Chart II-2Indicators To Watch - Bond Yields ##br##- Europe Ex Euro Area
Indicators To Watch - Bond Yields - Europe Ex Euro Area
Indicators To Watch - Bond Yields - Europe Ex Euro Area
Chart II-3Indicators To Watch - Bond Yields ##br##- Asia
Indicators To Watch - Bond Yields - Asia
Indicators To Watch - Bond Yields - Asia
Chart II-4Indicators To Watch - Bond Yields ##br##- Other Developed
Indicators To Watch - Bond Yields - Other Developed
Indicators To Watch - Bond Yields - Other Developed
Indicators To Watch - Interest Rate Expectations Chart II-5Indicators To Watch - Interest Rate Expectations
Indicators To Watch - Interest Rate Expectations
Indicators To Watch - Interest Rate Expectations
Chart II-6Indicators To Watch - Interest Rate Expectations
Indicators To Watch - Interest Rate Expectations
Indicators To Watch - Interest Rate Expectations
Chart II-7Indicators To Watch - Interest Rate Expectations
Indicators To Watch - Interest Rate Expectations
Indicators To Watch - Interest Rate Expectations
Chart II-8Indicators To Watch - Interest Rate Expectations
Indicators To Watch - Interest Rate Expectations
Indicators To Watch - Interest Rate Expectations
Our Colleagues at BCA Research’s Equity Analyzer recently used their new Equity Analyzer macro sensitivities tool to combine their bottom-up quantitative framework with our Fixed Income strategists’ top-down theme to identify stocks that will benefit as the…
Highlights The greatest legislative battle of the Biden presidency will unfold between now and the end of the year. Biden’s bipartisan infrastructure deal is likely to pass the Senate soon but will have to cross several hurdles before passage in the House of Representatives. We maintain our 80% subjective odds that it will pass one way or another. Assuming the infrastructure bill does not fall apart, we will upgrade the odds that Biden’s budget reconciliation bill will pass this fall from 50% to 65%. The latter comprises a nominal $3.5 trillion in social spending and tax hikes that will be watered down and revised heavily by the time it passes, which may take until Christmas. Uncertainty about passage will cause volatility to rise in financial markets. Democrats left the debt ceiling out of their fiscal 2022 budget resolution, which ostensibly means they cannot raise the debt limit via a simple majority but will need 10 Republican senators to join. A bruising standoff will ensue that will add to volatility. Ultimately Republicans will comply as they cannot afford to be held responsible for a default on the national debt. The party is currently unpopular and tarred with accusations of insurrection. If Biden succeeds in passing both bills, US fiscal policy will be frozen in place through at least 2025, though endogenous disinflationary fears will largely be dispelled. Feature The biggest domestic political battle of the Joe Biden presidency is likely to occur between now and Christmas. With a one-seat de facto majority in the Senate, and a four-seat majority in the House, Biden is barely capable of passing his two outstanding legislative proposals. The first of these is the $550 billion bipartisan infrastructure deal, which we have given an 80% subjective chance of passing and which passed the Senate on a 69-30 vote margin as we went to press. The second is the $3.5 trillion partisan reconciliation package, based on the remainder of Biden’s American Jobs and Families Plan, which we have given a 50% chance of passage. We will upgrade these odds to 65% if bipartisan infrastructure does not fall through in the House. Next year will be consumed by campaigning for the 2022 midterms so it will be hard to pass any major legislation with such thin majorities (though bipartisan anti-trust legislation could pass and poses a risk to the equity market). The midterms are likely – though not guaranteed – to result in Republicans taking at least the House. The result will be gridlock in which only the rare bipartisan bill can pass. In other words, after Christmas, Biden’s domestic legislative capability and hence US fiscal policy will likely be frozen in place through 2025. In this report we provide a road map for the budget battle that will define the Biden presidency. Buy The Dip … Unless New Variants Change The Game First, a brief word regarding the COVID-19 pandemic. The Delta variant is ramping up, particularly in states where vaccination rates have lagged and social restrictions are minimal (Chart 1). The new lambda variant is also causing concerns that vaccines may be inadequate. Equity markets could easily suffer more downside in the near term but US-dedicated investors should consider the following: Scientists have created one vaccine for COVID-19 and can create others. There has been a concrete reduction in uncertainty since November 2020. Vaccination rates will never be perfect – many people smoke cigarettes and refuse to wear seat belts! – but greater infection rates and hospitalizations are leading to improvements in vaccination coverage. While new lockdowns are not impossible, the public will only support them as a last resort. Not only is the White House still officially opposed to new lockdowns but also the authority to impose lockdowns rests with governors. If hospital systems are crashing then even Republican governors will endorse new social restrictions. Otherwise, restrictions will not be draconian unless a much more virulent variant emerges (one that is more deadly or that has a worse impact on children). Monetary and fiscal stimulus will ramp up if a new variant is more deadly or the economy otherwise starts to slide back. In the US, additional fiscal stimulus will come faster than in other countries because new short-term measures can easily be tacked onto major bills that are already coming down the pike. Chart 1Stay Constructive Amid Delta Jitters
The Defining Budget Battle Of The Biden Presidency
The Defining Budget Battle Of The Biden Presidency
Might the White House leverage a renewed sense of crisis to get its main fiscal bills passed? We can see that. The last thing Biden needs is a sluggish recovery to translate into congressional gridlock in the 2022 midterms – the bane of the Obama administration. Rather, the goal is to harness the sense of crisis to pass stimulus. Biden’s approval rating is falling, as is the norm with modern presidents. However, it is still “above water” (net positive) and still sufficient to get his legislative initiatives across the line. Biden’s forthcoming bills will reinforce economic recovery and sentiment (Chart 2) Chart 2Biden’s Approval Comes Down To Earth
The Defining Budget Battle Of The Biden Presidency
The Defining Budget Battle Of The Biden Presidency
What if a variant evades vaccination? Especially if it is more deadly and/or more harmful to children? That would be a game changer and would cause at least a market correction. Still, investors would want to buy the dip given what they know today relative to what they knew in early 2020 (and given that they bought the dip in March 2020 even not knowing what they know today). Bipartisan Structural Reform Our second key view for 2021 – “bipartisan structural reform” – is coming to fruition with the Senate’s 69-30 vote passage of the American Infrastructure and Jobs Act as we go to press. Major bipartisan deals are rare in highly polarized America but we have given an 80% subjective chance of passage to this bill. Passage in the Senate reinforces that view, though the odds of final passage remain the same as there will be hurdles in the House. We include infrastructure as a “structural reform” because of its ability to increase the productivity of an economy. The bill contains funding for traditional infrastructure, like roads, bridges, and ports, as well as non-traditional infrastructure such as subsidies for electric vehicles and high-speed internet (Table 1). Table 1What’s In The Bipartisan Infrastructure Deal?
The Defining Budget Battle Of The Biden Presidency
The Defining Budget Battle Of The Biden Presidency
Table 2 shows the 19 Republican senators who voted in favor of this bipartisan deal, along with their ideological ranking and state support rates. This tally provides a nine-seat buffer in case the House version of the bill requires another Senate vote. It also provides a measure of the support that might be brought to bear for bipartisan causes later, such as funding the government, suspending the debt ceiling, or passing bills on popular issues (such as regulating Big Tech) in 2022-24. All Democrats voted in unison for the bill. Table 2Republican Senators Who Voted For Biden’s Bipartisan Infrastructure Bill
The Defining Budget Battle Of The Biden Presidency
The Defining Budget Battle Of The Biden Presidency
Our high confidence on infrastructure spending stems both from its popular support (Chart 3) and from the fact that even if bipartisanship fails, there remains a partisan option: budget reconciliation. This is still true today. The bipartisan infrastructure bill could still die in the House, given Speaker Nancy Pelosi’s determination to make its passage contingent on the success of the larger reconciliation bill, which is anathema to Republicans. But if it dies, Democrats would take up the key provisions in the reconciliation bill – and the odds of that bill passing would go up, not down, since Democrats would need to close ranks to clinch a legislative victory ahead of the midterms. Chart 3Popular Support For Bipartisan Infrastructure Deal
The Defining Budget Battle Of The Biden Presidency
The Defining Budget Battle Of The Biden Presidency
Thus the real risk is not that infrastructure spending will fail but that its success will reduce the political capital needed to pass the more controversial reconciliation bill, which we discuss below. Over the short and medium term, this bipartisan infrastructure deal emblematizes the sea change in US fiscal policy – the shift against austerity – and thus serves to dispel fears of disinflation. At the same time, the deal epitomizes America’s long-term fiscal predicament. Democrats only want to increase spending while Republicans only want to decrease taxes. The former will not make budget cuts while the latter will not hike taxes. The result, inevitably, is higher budget deficits. This is precisely what occurred with the latest agreement: tax measures to pay for new infrastructure spending are mostly chimerical – the Congressional Budget Office (CBO) estimates that only $200 billion of the new spending will be offset with new revenue. The other $350 billion will add directly to deficits and debt. The difference is small but the political signal is notable. Chart 4 highlights the increase in the deficit likely to occur, with the CBO’s more realistic assessment delineated from the nominal bill. From a macro point of view, the takeaway is that the US economy faces a stark withdrawal of government support in 2022 but this bill slightly cushions the blow. Continued recovery will depend on consumers and businesses (which look to be in good shape). Beginning in 2025 deficits will start to rise again and hence the overall picture is one in which US government support for the economy has taken a step up for the decade. Chart 4Bipartisan Deal Not Paid For = Fiscal Stimulus
The Defining Budget Battle Of The Biden Presidency
The Defining Budget Battle Of The Biden Presidency
Side note: Chart 4 is worrisome for President Biden if his reconciliation bill fails, as it points to fiscal drag through 2024, the election year. Bottom Line: We still see an 80% chance that Biden’s infrastructure proposals will pass, as the Democrats have a backup plan if the bipartisan deal somehow collapses in the House. Biden’s Greatest Legislative Battle Up till now we have assigned 50% odds of passage to the subsequent part of the Biden agenda, the American Families Plan, which covers social spending and tax hikes (corporate and individual). If bipartisan infrastructure passes promptly, we would upgrade the reconciliation bill’s odds of passing to 65%. The reason is twofold: first, reconciliation only requires a simple majority consisting of all 50 Senate Democrats plus the vice president; second, hesitant moderate senators ultimately will be forced to recognize that sinking the bill would render the Biden presidency defunct and fan the flames of populist rebellion on both sides of the political spectrum. And yet, since Biden cannot spare a single vote, conviction levels cannot be high. Therefore 65% seems appropriate. On August 9 Senate Democrats presented a $3.5 trillion budget resolution that will form the basis of the reconciliation bill this fall. The bill contains a wish list of spending priorities, as outlined in Table 3. Most of these are familiar from last month when the Senate Budget Committee first put forward its framework. The hang-up stems from House Speaker Pelosi. Knowing that infrastructure’s passage will suck away political capital from social spending, Pelosi is attempting to link the two bills. If the Senate fails to pass the reconciliation bill, the House will not pass the infrastructure bill. This gambit will create a big increase in uncertainty this fall as the legislative battle heats up. Republicans cannot support the infrastructure bill if it is directly tied to the Democrats’ “Nanny State” debt blowout, which will be the basis for their campaign against Democrats in future. They need plausible deniability. If Pelosi insists on linking the two bills, Republican support will evaporate. True, Democrats would then proceed to partisan reconciliation – but they would need to sacrifice other agenda items, such as subsidies for green tech, college, health care, and manufacturing (see Table 3 above). Table 3Senate Democratic FY22 Budget Resolution (July 2021)
The Defining Budget Battle Of The Biden Presidency
The Defining Budget Battle Of The Biden Presidency
Biden and the Senate are now united on the infrastructure bill. Biden and Democrats in marginal seats need a legislative victory ahead of the midterms – and a bipartisan victory on a popular policy like infrastructure is critical. A bird in the hand is worth two in the bush. Therefore, Pelosi will probably have to concede, after gaining assurances from moderate Senate Democrats that they will not sink reconciliation. Moderate Democrats, in turn, will need to see the reconciliation bill watered down, both on spending and taxes. Table 4 shows both bills together, as Biden’s “Build Back Better” agenda, with a baseline net deficit impact. Budget deficit scenarios are then updated in Chart 5. Once again what stands out is the large fiscal drag in 2022, the fiscal thrust for the remainder of the decade, and (in this case) minimal fiscal drag for 2024. Table 4Face Value Impact Of Biden’s Spending Proposals Before Congress (Baseline)
The Defining Budget Battle Of The Biden Presidency
The Defining Budget Battle Of The Biden Presidency
Chart 5Deficit Scenarios For Bipartisan Infrastructure Deal And Reconciliation Bill
The Defining Budget Battle Of The Biden Presidency
The Defining Budget Battle Of The Biden Presidency
This is true even if tax hikes fail to make it into the final reconciliation bill. We still maintain that the corporate tax rate will rise above Senator Joe Manchin’s ideal 25% rate (if not all the way to Biden’s 28%) while individual tax rates will return to pre-Trump levels. It is not clear if capital gains tax hikes will make the final cut. Most likely some tax hikes will occur but they will fall short of Biden’s plan, producing, at most, a one percentage point increase in the budget deficit relative to the Congressional Budget Office’s baseline estimate (Chart 6). Chart 6What Happens If Tax Hikes Fail To Pass Congress?
The Defining Budget Battle Of The Biden Presidency
The Defining Budget Battle Of The Biden Presidency
In Table 5 we update our various legislative scenarios, each consisting of different mixes of spending and tax hikes. We assume that the size of the bipartisan infrastructure deal will not be reduced in the House; that the revenue offsets of that deal will be $200 billion maximum; that moderate Senate Democrats will have greater success in watering down tax hikes than spending programs; and that the government overestimates its ability to collect revenue through tougher tax enforcement. Finally we assume that Senate Democrats’ spending proposals will not be cut – an extremely generous assumption that will not hold up in practice. Table 5Legislative Scenarios For Bipartisan Infrastructure Deal And FY22 Reconciliation Bill
The Defining Budget Battle Of The Biden Presidency
The Defining Budget Battle Of The Biden Presidency
Each legislative scenario’s impact on the deficit is shown in Table 6. The result is a wide range of deficit impacts, from the baseline of $588 billion to Scenario 6, with $2.59 trillion (zero tax offsets). The more realistic range is from $1 trillion to $2.3 trillion (i.e. all scenarios except the baseline and Scenario 5). Within this range the result depends on the moderate senators’ negotiation skills. Conservatively, the impact will range from $1-$1.5 trillion (Scenarios 1, 2, 4), with moderate senators preventing a $2 trillion price tag as politically impracticable (e.g. Scenario 3). Table 6Scoring Of Legislative Scenarios For Bipartisan Infrastructure Deal And FY22 Reconciliation Bill
The Defining Budget Battle Of The Biden Presidency
The Defining Budget Battle Of The Biden Presidency
There are two other aspects of Biden’s massive legislative battle this fall: regular government budget appropriations and the debt ceiling. Government appropriations are supposed to be passed by the end of the fiscal year, September 30, but often run over and likely will this time. Republicans will not support regular spending increases given that Democrats will ram through a partisan spending blowout. Therefore Congress will have to settle for a continuing resolution (a stop-gap measure) that keeps spending levels the same. Otherwise a government shutdown will occur. A shutdown is possible but would weigh heavily on Republicans’ public image, which is already at a low point in recent memory following the scandals of the Trump presidency. That is not all – there is also the debt ceiling (limit on national debt). Democrats made a major gambit by not including a suspension or increase of the debt ceiling in their fiscal 2022 budget resolution. If they had included it, then they could have raised the debt ceiling on their own with a simple majority when they passed their reconciliation bill. Instead they are attempting to make Republicans share the blame. Republicans, however, will mount an aggressive resistance, as they do not want to be seen as authorizing the debt increase necessary to accommodate the Democrats’ “socialist” spending spree. The “X date,” when the Treasury Department runs out of the ability to use extraordinary measures to make payments due on US debt, is expected sometime in October or November, though Treasury Secretary Janet Yellen warns it could come sooner and will try to pressure lawmakers. After this date the US would technically default on national debt obligations, triggering financial turmoil and potentially a global crisis. A debt ceiling showdown is virtually inevitable and volatility will rise – but ultimately a default will be averted, as we outlined in a recent report. First, Democrats still have the ability to revise the budget resolution so as to include a debt ceiling suspension in their final reconciliation bill. While Republicans could arguably block this attempt via a filibuster in the Budget Committee, they would have no interest in doing so (they could abstain and thus keep their hands clean of any debt ceiling increase). Second, Republicans can be forced to agree to a suspension of the debt ceiling when they fund the government, since it is necessary to do so anyway to fund their own infrastructure deal. Suspending the debt ceiling is not the same as raising it. New battles would be set up for later, in 2022 and beyond. But Republicans do not have the political ability to force a default on the public debt of the United States in the same year that Democrats accuse them of raising an insurrection against its Congress. Bottom Line: This fall will see the great legislative battle of the Biden presidency. Infrastructure spending has an 80% chance of passing. Pelosi will not be able to withstand Biden and the Senate in passing this deal separately from the more partisan reconciliation bill. If it passes, then Biden’s reconciliation bill will rise from 50% to 65% odds of passage. The latter will be watered down to a net deficit impact of $1-$1.5 trillion to secure the votes of moderate Senate Democrats, who ultimately will not betray their party to neuter Biden’s presidency. Thin margins in the House and Senate do not permit higher odds of passage or a high level of confidence. Investment Takeaways Political polarization has fallen sharply (Chart 7). This is connected to our view that the Republican Party is split, while Biden’s key initiative (infrastructure) has bipartisan support. However, Biden’s bipartisanship has resulted in a larger loss of Democratic support than a gain of Republican support (Chart 7, bottom panel). And the upcoming reconciliation bill will reignite Republican opposition. Moreover, polarization will remain at historically elevated levels, even to the point of generating domestic terrorist attacks, as we have argued. Biden’s approval rating has fallen but not enough to sink his legislative proposals. The overall economy is strong judging by both consumer confidence (Chart 8) and capital spending (Chart 9). Any soft patch in the economy in the near term will assist Biden in his legislative battles. Passage of either or both major bills will boost his approval rating, potentially ameliorating the Democrats’ challenging situation in the 2022 midterms. Chart 7Bipartisan Biden Lowers Polarization As Dems Waver
Bipartisan Biden Lowers Polarization As Dems Waver
Bipartisan Biden Lowers Polarization As Dems Waver
Chart 8US Consumer Confidence Soars
US Consumer Confidence Soars
US Consumer Confidence Soars
Chart 9US Capital Spending At Peak Levels
US Capital Spending At Peak Levels
US Capital Spending At Peak Levels
Still, we expect investors to “buy the rumor and sell the news” of Biden’s upcoming stimulus bills. After the Senate passes the reconciliation measure, investors will have to look forward to the combined impact of tax hikes, the Fed’s tapering of asset purchases and eventual rate hikes, and the various troubles with global growth and geopolitical risk. Until that time, investors must weigh the risks of the COVID-19 variants against actions by both American and Chinese policymakers to dispel deflationary tail risks. Thus for now we are sticking with our key trades of the year: value stocks, materials, and infrastructure plays (Chart 10). After Biden wins his big legislative battles, we will reassess. Matt Gertken Vice President Geopolitical Strategy mattg@bcaresearch.com Jesse Anak Kuri Associate Editor jesse.Kuri@bcaresearch.com Chart 10Buy Rumor, Sell News On Biden Plan
Buy Rumor, Sell News On Biden Plan
Buy Rumor, Sell News On Biden Plan
Appendix Table A1USPS Trade Table
The Defining Budget Battle Of The Biden Presidency
The Defining Budget Battle Of The Biden Presidency
Table A2Political Risk Matrix
The Defining Budget Battle Of The Biden Presidency
The Defining Budget Battle Of The Biden Presidency
Chart A1Presidential Election Model
The Defining Budget Battle Of The Biden Presidency
The Defining Budget Battle Of The Biden Presidency
Chart A2Senate Election Model
The Defining Budget Battle Of The Biden Presidency
The Defining Budget Battle Of The Biden Presidency
Table A3Political Capital Index
The Defining Budget Battle Of The Biden Presidency
The Defining Budget Battle Of The Biden Presidency
Table A4APolitical Capital: White House And Congress
The Defining Budget Battle Of The Biden Presidency
The Defining Budget Battle Of The Biden Presidency
Table A4BPolitical Capital: Household And Business Sentiment
The Defining Budget Battle Of The Biden Presidency
The Defining Budget Battle Of The Biden Presidency
Table A4CPolitical Capital: The Economy And Markets
The Defining Budget Battle Of The Biden Presidency
The Defining Budget Battle Of The Biden Presidency
Footnotes
In this Sector Insight report, we come back to the issue of “how much inflation is too much” for equities. The short answer is – equities don’t mind inflation as long as the Fed does not mind it either. Chart 1 shows historical analysis of forward SPX returns (both real and nominal) using different inflation ranges as a starting point. Empirically, CPI prints of below 3% do not weigh on market performance. However, once inflation rises above the 3-4% range, it causes a notable slowdown in returns, and above the 4% mark, it results into negative expected forward returns. Chart 2 is a scatterplot of trailing PE multiples vs core CPI prints. This chart confirms our initial conclusion that an inflation sweet spot for the equity market is around 2-3% core CPI range: this is the range where equity multiples expand the most. It is also clear from the chart that any higher core CPI values become a headwind for equities. The implication is that the negative forward expected return that we showed on Chart 1 comes from the multiple contraction. Chart 1Moderate Inflation Does Not Have An Adverse Effect On The Performance Of Equities
How Much Is Too Much?
How Much Is Too Much?
Chart 2High Levels Of Inflation Are Associated With Multiple Contraction
How Much Is Too Much?
How Much Is Too Much?
Equities are a real asset, and rising inflation does not have a negative effect on the earnings, as most companies are able to pass cost increases to their customers, and strong earnings growth translates into robust equity returns. Inflation is a concern for equity investors only from one angle: higher inflation may provoke the Fed to raise rates, and higher rates do have an adverse effect on the performance of equities. Bottom Line: Our view remains that inflation surge was transitory, but we do believe that the inflation will stay elevated for a while. Yet, if it does not exceed the 3% mark, there will be no negative repercussions for equities if the Fed stays patient.
Dear client, In addition to this abridged Strategy Report, we are sending a report written by Arthur Budaghyan, Chief Strategist of BCA’s Emerging Market Investment service. Arthur shares his thoughts on the future of Chinese TMT stocks, a subject we trust you will find insightful and beneficial. Jing Sima China Strategist Highlights Wealth and income inequality may be the most important contributors to rising populism in the past three decades. China has its share of increasing populism; reducing income inequality and improving social welfare are core principles of President Xi’s reform agenda. July’s economic data continues to indicate a softening in China’s economy. However, the magnitude of the slowdown is within policymakers’ pain threshold while the economy remains supported by strong external demand. For now, stay underweight in Chinese stocks within a global equity portfolio. Policy stance has yet to turn reflationary. Feature Populism Takes Root BCA's China Investment Strategy has argued that China is accelerating the pace of its structural reforms; addressing income inequality is at the core of the current administration’s reform agenda. Wealth and income inequality may be the most important structural cause of rising global populism and political polarization (Chart 1). The severity of income inequality in China is illustrated in Chart 2. It is noteworthy that China, whose political and economic ideology is based on creating a classless society, has found itself not far behind the US in terms of a widening wealth and income gap. Chart 1Populism Has Been On The Rise Globally For The Past 30 Years
Populism Finds Fertile Ground In China
Populism Finds Fertile Ground In China
Chart 2The Great Gatsby Curve Paints A Not-So-Great Equality Picture Of China
Populism Finds Fertile Ground In China
Populism Finds Fertile Ground In China
The relationship between inequality and intergenerational income mobility is captured in the "Great Gatsby Curve" – a concept based on a research paper by economist Miles Corak and later introduced by Alan Krueger, the late professor and Chairman of the Council Economic Advisers, during his speech at the Center for American Progress in 2012.1 The US has experienced a sharp rise in wealth and income inequality since the 1980s. On the eve of the Global Financial Crisis, income inequality in the US was as sharp as it had been since the time of "The Great Gatsby” novel set in the 1920s. After three decades of rapid industrialization and economic expansion, China also faces the challenge of escalating income inequality and discontent among middle-class households. Populism, defined as political stances that emphasize the idea of "the people", often benefits middle-class households, but not big business or corporate earnings (“the elite”). An increase in populist governments is usually positively correlated with rising number of antitrust investigations, since populist leaders tend to pander to popular outcries against big corporations by limiting or breaking up the corporations. In the US, the rise of Reaganism/neoliberalism in the 1980s led to a big drop in antitrust cases – a trend that was sustained for nearly three decades as the free-market Washington Consensus pushed against antitrust and other populist stances (Chart 3). However, the tide turned in 2016 when the US elected a populist president for first time, and antitrust threats started reemerging (Chart 4). Chart 3Antitrust Reinforcement In The US Has Been On A Secular Decline In The Past Two Decades…
Populism Finds Fertile Ground In China
Populism Finds Fertile Ground In China
Chart 4...But Antitrust Noise Is Getting Louder In The US (And Lately In China)
...But Antitrust Noise Is Getting Louder In The US (And Lately In China)
...But Antitrust Noise Is Getting Louder In The US (And Lately In China)
Both China and the US have transitioned towards larger government involvement in the economy. More restrictions on private enterprise and a greater redistribution of wealth will be forthcoming. In the US, there has been a shift towards a larger share of labor compensation versus capital in the country’s national income (Chart 5). In China, the “dual circulation” economic goal set by the 14th Five Year Plan, coupled with an economic divorce between the Middle Kingdom and the US, requires that China expands its domestic market. However, that expansion is constrained by its relatively low labor share (Chart 6). The external and internal challenges are fertile ground for rising and sustaining populism. Thus, reforms that promote the bargaining power of workers at the expense of corporate earnings will likely become a secular trend in China. Chart 5Labor Makes A Comeback Versus Capital In The US...
Labor Makes A Comeback Versus Capital In The US...
Labor Makes A Comeback Versus Capital In The US...
Chart 6...And In China Too
...And In China Too
...And In China Too
Checking In On The Data China’s economic data continues to soften as evidenced by a slew of new numbers published last weekend. On the growth front, the contraction in the volume of imports in the past two months reflects the sagging domestic economy, despite elevated commodity prices supporting the value of total imports (Chart 7). Global demand for Chinese goods, on the other hand, remains strong compared with the historical norm, and continues to offset weaknesses in China’s old economy sectors. Meanwhile, Chinese producers face persistent inflationary pressures stemming from elevated global commodity prices and a broken price transmission to pass on inflation to domestic consumers (Chart 8). Instead of stimulating demand in the near term, Chinese policymakers will likely address supply-side issues by releasing strategic reserves and curbing raw material exports, and relaxing domestic production restrictions. Chart 7Strong External Demand Continues To Offset Domestic Economic Weaknesses
Strong External Demand Continues To Offset Domestic Economic Weaknesses
Strong External Demand Continues To Offset Domestic Economic Weaknesses
Chart 8Inflationary Pressures On Producers Remains Elevated
Inflationary Pressures On Producers Remains Elevated
Inflationary Pressures On Producers Remains Elevated
We expect that Beijing will need greater economic pain before it decides to stimulate the economy more substantially. Monetary conditions have eased since earlier this year on the back of rising inflation, falling real interest rates and recently a breather in the RMB’s ascent (Chart 9). Nonetheless, as we noted in a previous report, a decisive rebound in the rate of credit expansion requires clear easing signals from China’s top leadership for local governments and corporates to ramp up leverage again. The July Politburo meeting pledged more fiscal support for the economy this year. Meanwhile, policymakers have intensified their tough regulatory stances on private-sector businesses and oversight on the public-sector’s balance sheet. Hence, the current policy backdrop does not suggest any imminent or meaningful reflationary measures. Chart 9A Meaningful Rebound In Credit Growth Requires More Than Monetary Easing
A Meaningful Rebound In Credit Growth Requires More Than Monetary Easing
A Meaningful Rebound In Credit Growth Requires More Than Monetary Easing
Chart 10War Against Delta-Variant Remains A Risk
War Against Delta-Variant Remains A Risk
War Against Delta-Variant Remains A Risk
The COVID-19 Delta-variant remains the biggest risk to our view. The mutated virus has spread to 14 provinces in China and triggered the strictest pandemic-control measures since Q1 last year. The drag on the service sector’s activities and employment will be substantial if measures are maintained for more than a month (Chart 10). In this case, the leadership may need to step in with policy supports to stabilize the economy and sentiment. For now, the pullback of stimulus and ongoing regulatory tightening since Q4 last year continue to dominate China’s financial assets. Thus, investors should maintain an underweight allocation to Chinese equities within a global equity portfolio. Jing Sima China Strategist jings@bcaresearch.com Footnotes 1Krueger, Alan (12 January 2012). "The Rise and Consequences of Inequality in the United States" (PDF). Market/Sector Recommendations Cyclical Investment Stance
Highlights Chinese authorities’ regulatory crackdown on new economy companies reflects new socio-political and economic shifts in China. Hence, this regulatory crackdown is not transitory. Investors in Chinese TMT/new economy stocks are facing uncertainty on multiple fronts which warrants lower valuation multiples. These companies will experience weaker profit growth and lower profitability relative to the past due to disruptions to their business models. Elsewhere, widening credit spreads among Chinese property developers reflects the property market’s poor outlook. In turn, shrinking Chinese construction heralds weaker demand for commodities and manufacturing goods. This poses a material risk to raw material prices and, consequently, EM in general. Feature Chart 1Chinese Growth/TMT Share Prices And P/E Ratio
Chinese Growth/TMT Share Prices And P/E Ratio
Chinese Growth/TMT Share Prices And P/E Ratio
The Chinese MSCI Investable Growth stock index is down by 35% from its February peak (Chart 1, top panel). Such a drawdown in the previous market leaders has produced a temptation to buy. The enticement is especially strong given that US FAANGM stocks are hitting new all-time highs. Is the latest crash in Chinese new economy/growth/TMT stocks a bad dream that will soon end, or does it mark a new reality for these companies? In our opinion, Chinese authorities’ regulatory crackdown on new economy companies reflects new socio-political and economic shifts in China. Hence, this regulatory crackdown is not transitory but is a part of China’s ongoing transformation. In brief, these companies are facing a new reality. What’s more, their outlook is very uncertain and equity valuations are not low enough to offset potential risks related to owning these stocks. Overall, investors should not start bottom fishing in Chinese stocks in general and Chinese TMT stocks in particular. Uncertainty = Lower Equity Multiples Immense uncertainty surrounds the outlook for Chinese TMT share prices. Even though China’s growth stocks have been de-rated, their trailing P/E ratio remains at 36.5 (Chart 1, bottom panel). Table 1A Snapshot Of Drawdown And Valuations
Chinese TMT Stocks: A Bad Dream Or A New Reality?
Chinese TMT Stocks: A Bad Dream Or A New Reality?
Table 1 shows the drawdowns and trailing P/E ratios for TMT/new economy/growth indexes as well as their largest constituencies: Alibaba, Tencent and Meituan. These equity multiples are still high given the uncertainty these companies are facing. By extension, investors in Chinese TMT/new economy stocks are also facing uncertainty on multiple fronts: Regulatory crackdowns mean that the business models of many of these companies will have to undergo substantial changes. Corporations may need to overhaul their product lines or abandon existing products/markets and find new niches and introduce new offerings. It is impossible to know what the long-term revenue and profit growth rates of these companies will be so that they can be properly valued. Such heightened uncertainty about the long-term outlook warrants a higher equity risk premium and, hence, lower equity multiples. President Xi Jinping’s long-term objective is to reduce income equality and achieve more equal wealth distribution. There will therefore be little tolerance for excessive profitability of individual companies. Chart 2 illustrates the large income gap between the top 10% and bottom 50% of the population. In turn, the mean-to-median wealth ratio points to a large and rising wealth gap – a higher ratio reflects greater wealth concentration among rich households (Chart 3). Chart 2China: Income Disparity Has Not Been Narrowing
Wealth Concertation Remains High In China
Wealth Concertation Remains High In China
Chart 3Wealth Concentration Remains High In China
Wealth Concertation Remains High In China
Wealth Concertation Remains High In China
President Xi’s goal is to appease the broader population, not shareholders or businesses. Top authorities have been using phrases such as “disorderly expansion of capital” since last fall. This language marked a major shift in government policies regarding market power and dominance of private companies. Investors should take note that they are now dealing with a new investment regime in China. For some time, we have argued that China’s regulatory tightening on private platform companies would aim to limit their monopolistic or oligopolistic power and ration their profitability. As a result, we alleged that these new economy companies would end up being regulated like utilities or become quasi-government entities. Consequently, their profitability would decline to close to that of utilities or SOEs. Yet, utility stocks or SOEs in China command much lower equity multiples than those at which platform companies’ stocks have been trading. Even as of today, the trailing P/E ratio on the China MSCI Growth Investable index is 36.5. Meanwhile, global utility stocks command a trailing P/E ratio of 19. It is hard to know where the P/E ratios of these Chinese TMT stocks will settle, but our hunch is that their multiple compression is not over yet. Regulatory clampdowns will not only curtail their revenues and pricing power but also increase their costs. These companies will need to spend money to comply with the new regulatory regime. They will, for instance, be expected to take on more in the way of social responsibilities, as SOEs in China have been doing. This and other measures will eat into their profit margins and will lower the return on capital. Finally, many Chinese TMT companies that have their ADRs listed in the US have been caught in the crossfire of the “big data war” between the US and China. On the one hand, US authorities want to oblige these Chinese issuers to comply with US regulations in terms of information and risks disclosure. On the other hand, Chinese authorities are reluctant to allow more data/information disclosure by their dominant platform companies to foreign investors. Given that the US-China confrontation is likely to escalate on many fronts going forward, odds are low that there will be a lasting solution to this conflict around US-traded Chinese equities. Authorities in the Middle Kingdom are not very sensitive to the fact that foreign shareholders are losing money in Chinese offshore trading stocks. Unless the crash in offshore stocks spills into the domestic financial markets and the economy, their willingness to compromise will be limited. In turn, the US will not “encourage” American investors to invest more in Chinese stocks where its regulatory authority and influence is weak. Overall, such high uncertainty regarding offshore Chinese stocks in general and the ones trading in the US in particular warrants a higher equity risk premium and lower equity multiples. Despite these negatives, there is a silver lining: China’s new economy segments have been and will continue expanding at a rapid pace. Chinese authorities are genuinely interested in supporting new economy sectors which could help boost productivity and be growth engines as the growth contribution from construction/infrastructure/manufacturing diminishes. The challenge for investors is to find companies that benefit from the continued expansion of new economy sectors, and acquire their stocks at reasonable multiples to secure limited drawdowns during market selloffs. Bottom Line: Chinese growth stocks/TMT share prices – on the index level – remain at risk of further de-rating/multiple compression. These companies also face potentially weaker profit growth and lower profitability compared to the past due to disruptions to their business models and/or higher costs of doing business. A Breakdown In Chinese Property Stocks And Bonds Is Flying Under The Radar Chart 4Property Stocks And Bond Prices Have Crashed
Property Stocks And Bond Prices Have Crashed
Property Stocks And Bond Prices Have Crashed
While Chinese TMT stocks are at the center of the global investment community’s interest, there has been a breakdown in mainland real estate share prices and a spike in property companies’ offshore credit spreads (Chart 4). The rising cost of capital imply that real estate developers will curtail their new property launches and construction. In addition, authorities will not ease regulatory tightening in the property market in general and property companies in particular. The objective is to halt the rise in property prices so that the continuous increase in personal income brings down the household income-to-property price ratio. The latter is extremely high in China making housing unaffordable for average Chinese. Authorities are very sensitive to the issue of housing unaffordability. Not only are property developers under pressure from tightening but also authorities are curbing demand for housing. In particular, two weeks ago the PBoC ordered banks in Shanghai to raise the rate of mortgage loans for first-time homebuyers to 5% from 4.65% and for people who are buying second homes to 5.7% from 5.25%. This measure might be extended to other tier-1 cities if house prices do not stop rising. As a result of the clampdown on property developers and move to restrain investment/speculative demand for housing, construction activity will shrink. The top panel of Chart 5 illustrates that the level of aggregate building construction starts has turned down. Residential property sales are decelerating and starts are contracting (Chart 5, bottom panel). Bottom Line: Property construction in China will start shrinking in the coming months. This will spill into other industrial/manufacturing sectors that supply construction and produce durable consumer goods. Chinese industrial output is set to decelerate materially as is predicted by a relapse in the nation’s manufacturing PMI’s new and backlog orders (Chart 6). This poses a material risk to raw material prices and, consequently, to EM in general. Chart 5Chinese Property Construction Is Set To Contract
Chinese Property Construction Is Set To Contract
Chinese Property Construction Is Set To Contract
Chart 6China's Manufacturing To Decelerate
China's Manufacturing To Decelerate
China's Manufacturing To Decelerate
Investment Conclusions From a short-term perspective, Chinese growth stocks are oversold, however this is not true from a long-term perspective. As shown in the top panel of Chart 1 above, the Chinese MSCI Investable Growth Stock Index is only back to its June 2020 levels. In fact, the parabolic rise in Chinese TMT stocks in late 2020 and early 2021 reflected investor euphoria that typically occurs at the end of a major bull market. Hence, the February peak in these equities could mark a major top. If so, these stocks are unlikely to embark on a sustainable bull market any time soon. For now, investors should fade rebounds in Chinese TMT stocks. We have been overweight Chinese stocks within an EM equity portfolio but this has been a bad call. However, among Chinese stocks we have recommended the following strategy since March 4th of this year: long A shares/short Investable stocks. The basis has been that we foresaw more downside risks in TMT stocks than onshore equities indexes (Chart 7). This recommendation is up by 15.5% since then and investors should maintain this strategy. Chart 7Stay Long Chinese A-Shares / Short Offshore Trading Stocks
Stay Long Chinese A-Shares / Short Offshore Trading Stocks
Stay Long Chinese A-Shares / Short Offshore Trading Stocks
Chinese equities are oversold relative to the EM index, and we are reluctant to downgrade them now. We are also waiting for our view of the continued US dollar rebound and lower commodities prices to play out before we downgrade Chinese equities. Other EM bourses typically underperform when the US dollar rallies and commodities sell off markedly. As we argued in last week’s report, the weakness in EM equities has not been limited to Chinese TMT stocks. EM ex-TMT share prices have also rolled over, which is consistent with rising EM corporate bond yields (Chart 8). Chart 8Rising EM Corporate Bond Yields Herald Lower EM ex-TMT Share Prices
Rising EM Corporate Bond Yields Herald Lower EM ex-TMT Share Prices
Rising EM Corporate Bond Yields Herald Lower EM ex-TMT Share Prices
Although most of the rise in EM corporate bond yields/spreads can be attributed to Chinese property companies, their widening credit spreads reflect the mainland property market’s poor outlook. In turn, shrinking Chinese construction heralds weaker demand for commodities and manufacturing goods. Notably, Chart 9 reveals that there has been a widening gap between a declining Chinese manufacturing PMI and resilient industrial metals prices. Odds are that commodity prices will recouple with China’s manufacturing PMI to the downside. Chart 9An Unsustainable Divergence: Beware Of Risks To Commodity Prices
An Unsustainable Divergence: Beware Of Risks To Commodity Prices
An Unsustainable Divergence: Beware Of Risks To Commodity Prices
We continue to recommend underweighting EM versus DM for global equity and credit portfolios, a strategy we initiated on March 25, 2021. We also recommend shorting a basket of EM currencies versus the US dollar and maintaining a cautious stance on commodity prices. The full list of our country recommendations for equity, fixed-income and currency investors is available at the end of this report. Arthur Budaghyan Chief Emerging Markets Strategist arthurb@bcaresearch.com
Within a global equity portfolio, the most important allocation decision for investors to make is usually whether to favor US or global ex-US equities. But within an allocation to the latter, there is also the question of whether investors should overweight…