Equities
Since 2007, US growth stocks have outperformed value by more than 350%. This marked a significant shift versus the prior seven years during which US value stocks outperformed growth by nearly 50%. Moreover, the episodes during which value outperformed growth…

Foreword Today we are publishing a charts-only report focused on the S&P 500 and its sectors. Many of the charts are self-explanatory; to some we have added a short commentary. As with the styles Chart Pack, published a month ago, the sector charts cover macro, valuations, fundamentals, technicals, and the uses of cash. Our goal is to equip you with all the data you need to underpin sector allocation decisions. We also include performance, valuations, and earnings growth expectations tables for all the styles, sectors, industry groups, and industries (GICS 1, 2 and 3). We hope you will find this publication useful. We plan to update it monthly, alternating sector and style coverage. Overarching Investment Themes Macro Economic surprise index is flagging while Q2-21 earnings surprises are unprecedented. Much of the good economic news has been priced in and the Citigroup Economic Surprise Index is hovering around zero (Chart 1A). Most of the economic indicators have turned, confirming that the surge in growth has run its course and the macroeconomic environment is normalizing. Covid-19 fears are resurfacing: The spread of the Delta variant is unlikely to trigger another lockdown, but consumers may curtail their activities out of fear of infection, adversely affecting demand for goods and services. However, for now, we are sanguine about this risk. Investors expect inflation to roll over: Investors’ inflation fears are dissipating, attested by the falling 5Y/5Y inflation breakevens (Chart 1B). Indeed, it appears that the debate on the persistence of inflation has been won by the “inflation is transitory” camp. Yet, we won’t be surprised if inflation surprises on the upside (no pun intended). Chart 1AGood Economic News Has Been Priced In
Good Economic News Has Been Priced In
Good Economic News Has Been Priced In
Chart 1BMost Investors Are Now Convinced That Inflation Will Be Transitory
Most Investors Are Now Convinced That Inflation Will Be Transitory
Most Investors Are Now Convinced That Inflation Will Be Transitory
Labor shortages are starting to dissipate: On the labor front, companies are still struggling to fill job openings. However, there are signs that the labor market is healing, with more and more workers interested in returning to the labor force (Chart 2). Inventories will be replenished, spurring investment: Post-pandemic economic recovery is still plagued by the mismatch between supply and demand. Supply-chain disruptions and shortages fail to meet pent-up demand of consumers eager to spend “helicopter drop cash” and accumulated savings. As a result, inventories have been drawn down, chipping away 1.1% from GDP growth. In fact, they are at all-time lows: Non-farm inventories to final sales have dropped lower than they were during the GFC (Chart 3). Low inventories will have to be replenished, resulting in further gains in investment and providing a boost to industrial activity going forward. Chart 2More Workers Are Interested In Returning To The Labor Force
US Equity Chart Pack
US Equity Chart Pack
Demand for services will continue to exceed demand for goods: Last, but not least, consumers have money to spend but are shifting away from goods and toward services and experiences. Consumer expenditure on goods is above trend and has recently turned down, while spending on services is still below pre-pandemic levels, and rebound is still running its course (Chart 4). Chart 3Inventories Are At All Time Low
Inventories Are At All Time Low
Inventories Are At All Time Low
Chart 4Real Spending On Services Is At PrePandemic Levels: Room For Further Rebound
Real Spending On Services Is At PrePandemic Levels: Room For Further Rebound
Real Spending On Services Is At PrePandemic Levels: Room For Further Rebound
Valuations And Profitability The US stock market remains expensive: The S&P 500 is trading more than two standard deviations above the long-term average. However, there are pockets of reasonably priced, albeit unloved, stocks within the S&P 500: Telecom (11x forward earnings), Health Care (17x), Energy (14x), and Financials (14x). Earnings continue to crush expectations: While equities are expensive, they are redeemed by the strong showing of earnings and sales growth reported for Q2-2021. The scale of earnings beats relative to analyst expectations is spectacular: Running at nearly 20%, or more than two standard deviations above the historical average (Chart 5). Chart 5Earnings Surprises Are Unprecedented
US Equity Chart Pack
US Equity Chart Pack
Earnings growth is normalizing: Earnings have increased 90% over the lackluster Q2, 2020. Compared to Q2-2019 as a baseline quarter, earnings are up 22%, pointing to normalization going forward. Earnings growth will become a tailwind for the outperformance of equities into the balance of the year and will help the S&P 500 to grow into its big valuation “shoes”. Margins are expanding despite inflation: Many sectors are able to grow earnings and recover margins despite increases in costs of raw materials and labor, thanks to their strong pricing power, i.e., ability to pass on higher input costs to their customers (Chart 6A). Sectors with the highest pricing power are: Communications Services, Consumer Discretionary, Industrials, Energy and Materials. They are the best inflation hedges. Chart 6ACompanies' Profitability Is Improving To Pre-Pandemic Levels
Companies' Profitability Is Improving To Pre-Pandemic Levels
Companies' Profitability Is Improving To Pre-Pandemic Levels
Uses Of Cash Cash to be disbursed to shareholders: Share buybacks and other shareholder-friendly activities are on the rise again and are expected to gain steam this year and next. This is supported both by strong earnings growth, healthy balance sheets, and regulatory headwinds to any potential M&A activity due to the anti-trust stance of the current administration Capex is about to make a comeback: Capex is still lagging across most sectors. A pickup in capex will signal that the post-pandemic recovery is firmly on track, and companies are comfortable investing in future growth. However, there are early signs that that is about to change. Philly Fed survey shows that over 40% of respondents are planning to increase their capex expenditure (Chart 6B). Chart 6BCapex Increases Are On The Way
Capex Increases Are On The Way
Capex Increases Are On The Way
Investment Implications Overweight sectors and industry groups exposed to consumer services spending (airlines, hotels, leisure) and be selective about consumer goods and retailing industry groups: Real PCE for goods has turned down toward the trend line. Exceptions are areas of the market with well-publicized shortages such as Autos and Parts. Overweight Industrials – US manufacturing has limited capacity, onshoring is a new trend, inventories need to be replenished, and capex intentions are on the rise. Overweight Health Care – growth slowdown favors this defensive sector, which also benefits from a backlog of demand for medical procedures and services. Reflation trade is out of the picture, now that inflation fears have abated and the Delta variant preoccupies investors. For that, we still favor Growth over Value. Yet, we watch this allocation closely, to time rotation once Covid-19 fears dissipate, rates pick up and inflation surprises on the upside. With valuations high, and forward returns expectations lackluster, we favor sectors likely to delivery healthy cash yield: Financials, Health Care, Energy, and Technology. Irene Tunkel Chief Strategist, US Equity Strategy irene.tunkel@bcaresearch.com S&P 500 Chart 7Macroeconomic Backdrop And Earnings Surprise
Macroeconomic Backdrop And Earnings Surprise
Macroeconomic Backdrop And Earnings Surprise
Chart 8Profitability
Profitability
Profitability
Chart 9Valuations And Technicals
Valuations And Technicals
Valuations And Technicals
Chart 10Uses Of Cash
Uses Of Cash
Uses Of Cash
Communication Services Chart 11Macroeconomic Backdrop
Macroeconomic Backdrop
Macroeconomic Backdrop
Chart 12Profitability
Profitability
Profitability
Chart 13Valuations And Technicals
Valuations And Technicals
Valuations And Technicals
Chart 14Uses Of Cash
Uses Of Cash
Uses Of Cash
Consumer Discretionary Chart 15Macroeconomic Backdrop
Macroeconomic Backdrop
Macroeconomic Backdrop
Chart 16Profitability
Profitability
Profitability
Chart 17Valuations And Technicals
Valuations And Technicals
Valuations And Technicals
Chart 18Uses Of Cash
Uses Of Cash
Uses Of Cash
Consumer Staples Chart 19Macroeconomic Backdrop
Macroeconomic Backdrop
Macroeconomic Backdrop
Chart 20Profitability
Profitability
Profitability
Chart 21Valuations And Technicals
Valuations And Technicals
Valuations And Technicals
Chart 22Uses Of Cash
Uses Of Cash
Uses Of Cash
Energy Chart 23Macroeconomic Backdrop
Macroeconomic Backdrop
Macroeconomic Backdrop
Chart 24Profitability
Profitability
Profitability
Chart 25Valuations And Technicals
Valuations And Technicals
Valuations And Technicals
Chart 26Uses Of Cash
Uses Of Cash
Uses Of Cash
Financials Chart 27Macroeconomic Backdrop
Macroeconomic Backdrop
Macroeconomic Backdrop
Chart 28Profitability
Profitability
Profitability
Chart 29Valuations And Technicals
Valuations And Technicals
Valuations And Technicals
Chart 30Uses Of Cash
Uses Of Cash
Uses Of Cash
Health Care Chart 31Health Care: Sector vs Industry Groups
Health Care: Sector vs Industry Groups
Health Care: Sector vs Industry Groups
Chart 32Profitability
Profitability
Profitability
Chart 33Valuations And Technicals
Valuations And Technicals
Valuations And Technicals
Chart 34Uses Of Cash
Uses Of Cash
Uses Of Cash
Industrials Chart 35Macroeconomic Backdrop
Macroeconomic Backdrop
Macroeconomic Backdrop
Chart 36Profitability
Profitability
Profitability
Chart 37Valuations And Technicals
Valuations And Technicals
Valuations And Technicals
Chart 38Uses Of Cash
Uses Of Cash
Uses Of Cash
Information Technology Chart 39Macroeconomic Backdrop
Macroeconomic Backdrop
Macroeconomic Backdrop
Chart 40Profitability
Profitability
Profitability
Chart 41Valuations And Technicals
Valuations And Technicals
Valuations And Technicals
Chart 42Uses Of Cash
Uses Of Cash
Uses Of Cash
Materials Chart 43Macroeconomic Backdrop
Macroeconomic Backdrop
Macroeconomic Backdrop
Chart 44Profitability
Profitability
Profitability
Chart 45Valuations And Technicals
Valuations And Technicals
Valuations And Technicals
Chart 46Uses Of Cash
Uses Of Cash
Uses Of Cash
Real Estate Chart 47Macroeconomic Backdrop
Macroeconomic Backdrop
Macroeconomic Backdrop
Chart 48Profitability
Profitability
Profitability
Chart 49Valuations And Technicals
Valuations And Technicals
Valuations And Technicals
Chart 50Uses Of Cash
Uses Of Cash
Uses Of Cash
Utilities Chart 51Macroeconomic Backdrop
Macroeconomic Backdrop
Macroeconomic Backdrop
Chart 52Profitability
Profitability
Profitability
Chart 53Valuations And Technicals
Valuations And Technicals
Valuations And Technicals
Chart 54Uses Of Cash
Uses Of Cash
Uses Of Cash
Table 1Performance
US Equity Chart Pack
US Equity Chart Pack
Table 2Valuations And Forward Earnings Growth
US Equity Chart Pack
US Equity Chart Pack
Recommended Allocation Footnotes
Highlights Economy – A range of economic and fundamental indicators are at such high levels that deceleration is inevitable: US growth will peak any day if it hasn’t done so already. Markets – Financial markets typically pay closer heed to direction than level: All else equal, we prefer direction to level as well, but levels are likely to remain elevated for a while even as deceleration takes hold, and investors should take that into account when assessing the outlook. Strategy – Remain overweight equities and credit in multi-asset portfolios: Risk assets are likely to continue to generate positive excess returns over Treasuries and cash despite moderating growth. Feature COVID-19’s arrival ushered in a wave of extremes in monetary and fiscal policy measures, economic data and financial markets. Everywhere investors look, data series are at unusually outlying levels. Inflation pressures are more intense than they have been in decades, as measured by consumer price indexes and a range of business surveys. Household net worth has advanced at its fastest-ever five-quarter pace despite the record setback that began the pandemic, S&P 500 earnings growth has demolished analyst expectations over the last five quarters, the federal government has injected a head-spinning amount of fiscal stimulus into the economy and the Fed has done all it seemingly could to cushion the pandemic’s economic blow. Much of the growth has resulted from Herculean stimulus measures that cannot be maintained on a rate-of-change basis. The slowdown in fiscal and monetary thrust implies that economic growth, along with several other series that are viewed as significant financial market drivers, will soon peak if they haven’t already. The looming deceleration has kindled a recurring debate among BCA researchers: What matters most for financial markets, level or direction? The answer to the most challenging questions in markets and economics is often “it depends,” and that’s the way we view the level-versus-direction debate. We’d position a portfolio based on direction if key series were just breaking above or below trend levels with robust momentum, but it’s a more nuanced decision when they are slowing from exceedingly high levels and a modestly decelerating pace should have them still sitting well above trend this time next year. Our view, then, is that the interaction between level and direction will drive markets going forward. Given that we have cited a range of levels in support of our bullish stance, however, it is prudent to ask how good might be too good for reliably mean-reverting series. We therefore examine the empirical record of how S&P 500 returns have interacted with the level and direction of the unemployment rate, earnings-per-share growth, and interest rates. We conclude that the humble level matters as well as the more celebrated rate of change and that deceleration will not spell the end of the equity bull market. The Unemployment Rate We used the unemployment rate as a proxy for the impact of macroeconomic changes on S&P 500 returns. While the unemployment rate is quite variable from month to month, it tends to follow a clear pattern over longer periods of time, rising very rapidly to cyclical peaks before meandering its way to cyclical troughs. Over the series’ 73-year history, there have been eleven complete rising phases and it is currently in its eleventh declining phase (Chart 1). Owing to unemployment’s established pattern – it takes the elevator up and the stairs down, flipping equity indexes’ pattern on its head – the eleven rising phases have spanned 30% of the nearly 900 months while the falling phases currently total 70% of them. Chart 1Unemployment Takes The Elevator Up And The Stairs Down
Unemployment Takes The Elevator Up And The Stairs Down
Unemployment Takes The Elevator Up And The Stairs Down
A simple compilation of one-month forward S&P 500 returns based on the level of the unemployment rate has a clear theme – stocks do well when the rate is at least one standard deviation above the mean (about 7.4% or higher) and poorly when it is one or more standard deviations below it (about 4.2% or lower) (Chart 2, left side). A compilation based on the month-to-month direction of the unemployment rate – up, down or unchanged – also favors rising unemployment, though it is unclear what investors should conclude from the fact that rising and falling both outperform unchanged (Chart 2, right side). Chart 2The S&P 500 Is Sensitive To Anticipated Turns In Unemployment
Level Or Direction?
Level Or Direction?
We think the analysis is much improved if the unemployment rate is combined with its direction as indicated by the cycle phase. The interaction of level and phase provides more information than the simple message that high unemployment is good for equities and low unemployment is bad. Applying the rising or falling unemployment rate phase to the ranges shown in Chart 2, we find that direction matters quite a lot within four of the five ranges, where the annualized return differs by thirteen to sixteen percentage points based on the underlying trend (Table 1). Table 1Level And Direction Tell The Most Compelling Story
Level Or Direction?
Level Or Direction?
Equities are just coming off their bottom, on balance, when the unemployment rate exceeds a standard deviation above its mean and is still rising. Direction is everything when the rate is below its mean (5.8%). When it’s falling, there’s plenty of money to be made in an expanding economy before the Fed has designs on removing the punch bowl, though once the rate is a standard deviation below the mean (4.2% or lower), the equity top is near. Once the unemployment rate rises off the bottom, even though it’s still at an unusually low level, the equity tide has already begun to go out. Losses are in store until the rate gets back above the mean, signaling future improvement. Chart 3Up, Up And Away
Up, Up And Away
Up, Up And Away
It is important to recognize that we can only demarcate the unemployment rate’s phases in retrospect. There is no telling with certainty in real time how far a nascent trend will go. We do expect, however, in line with every FOMC voter, that the unemployment rate is likely to approach the vicinity of last cycle’s lows before the current phase ends. If that expectation is realized, there is a stretch of downward movement ahead (a good chunk of the 1.7% standard deviation, though July claimed 50 basis points of it) that has empirically been quite favorable for the S&P 500. The speed with which it covers the ground from here to 4% or below is unknown. Given the tremendous pent-up demand for labor, as evidenced by a record high job openings rate (Chart 3), the unemployment rate may come down much faster than it normally does. The level-and-direction analysis makes it clear that 5.9% and falling has provided an auspicious backdrop for equity investors, and the Fed’s more relaxed reaction function may allow the economy to run a little hotter than it normally would once unemployment falls below its natural rate. All in all, the empirical record of the relationship between the unemployment rate and equities suggests that stocks have room to run while the labor market improves. Earnings The unemployment rate may not be too low for equities to continue to rally, but is earnings growth too good for stocks’ own good? It doesn’t appear to be, given the historical interaction between forward one-quarter S&P 500 performance and the speed and acceleration of growth in trailing four-quarter earnings. We use trailing earnings because they exhibit extended trends that highly variable sequential changes in single-quarter data do not. Since 1948, trailing four-quarter operating earnings have experienced eleven complete double-digit declines from cycle peaks and eleven complete earnings growth phases, while beginning a new growth phase in the first quarter (Chart 4). Chart 4Steady Growth With Occasional Hiccups
Steady Growth With Occasional Hiccups
Steady Growth With Occasional Hiccups
The chart shows that four-quarter earnings have grown in a pattern that features extended growth phases punctuated by concentrated declines that are occasionally severe. This pattern is the mirror image of the unemployment rate’s and S&P 500 earnings have been in a growth phase three out of every four quarters on the way to an annualized growth rate of 6.4%. Since P/E multiples are a mean-reverting series, stocks need to grow earnings to rise over time, but there is little difference in lagged S&P 500 returns when earnings are in growth or contraction mode (Chart 5). The disparity widens within each broad phase when we considered the growth rates – deceleration has been better for stock prices than acceleration within expansion phases, while a slowing rate of decline has been a tremendous catalyst when earnings are in a contraction phase. Chart 5More Money Is Made From Terrible To Bad Than From Good To Great
Level Or Direction?
Level Or Direction?
To explore S&P 500 index performance during acceleration and deceleration phases within growth ranges, we repeated the unemployment rate analysis. The return disparities for different earnings ranges were not nearly as clear cut as they were for different unemployment ranges, but acceleration was good for near-term equity returns in the middle of the earnings growth distribution, while deceleration trumped acceleration at growth rates plus or minus three quarters of a standard deviation from the mean (Table 2). Table 2Headed Out Of The Earnings Sweet Spot
Level Or Direction?
Level Or Direction?
The muddled empirical record does not point to a clear path for S&P 500 returns over the next few quarters. We assign a very low probability to a recession over the next year, virtually ensuring that the growth phase that began last quarter will continue. If actual earnings turn out to be somewhat close to the current consensus expectation, however, all subsequent quarters in this growth phase will be decelerating, and deceleration within growth phases (Table 2, circled three outcomes) has previously yielded below-average price returns. Trailing four-quarter earnings growth appears sustainable over the next year, however, and history is hardly sounding an alarm. Interest Rates We have already examined the relationship between moves in real 10-year Treasury yields and equity performance in a dedicated Special Report.1 The executive summary is that the level of real rates has exerted a greater influence on S&P 500 returns than their direction. The empirical evidence suggests that stocks generally outperform when real rates are rising, though they hit a wall once the real 10-yield exceeds estimated potential real GDP growth. They also underperform at the other extreme, as extremely negative real rates tend to be associated with dire economic conditions, but potentially frightening weakness is not a feature of today’s negative real-rate backdrop. Per the potential-GDP-rule-of-thumb, the nominal 10-year Treasury yield that would begin to crimp economic activity is around 4.5-5%, assuming potential GDP growth of 1.75-2% and annual inflation with a central tendency near 3%. It is very difficult to see the 10-year yield exceeding one-half of that threshold level in the next twelve months. Though a yield backup to 2% or above over the next year would likely have significant implications for relative returns within the S&P 500, we do not think it would spell the end of the equity rally. The bottom line, then, is that we do not believe that interest rates are at a level that makes equities especially vulnerable. Price-earnings multiples may well contract if real rates rise in line with our expectations, but we expect that earnings and earnings estimates would rise enough to offset the de-rating pressure. Investment Implications Mean reversion is a bedrock investment concept, and it helps explain why the level of variables that impact equity returns can be deceiving. When key variables reach extremes, the potential of an abrupt reversal increases. Financial markets are additionally forward discounting mechanisms and the rate of change – a variable’s “second derivative” – may offer more insight into its future path than its existing position. It is easy to see why investors typically favor direction over level when looking ahead. Level does not always take a back seat to direction, however, and we think a consideration of how level and direction interact is important when assessing the current landscape. Economic growth will surely slow from double or triple its long-run trend level, earnings will surely stop beating estimates by three or four times the maximum magnitude of the previous 32 quarters, nonfarm payrolls won’t expand by 900,000 every single month (though they may for much of the rest of this year) and a range of other variables won’t keep setting records. But deceleration from record highs will not necessarily spell the end of the rallies in risk assets. While important variables remain at elevated levels, equities and credit are likely to continue to generate excess returns. Extraordinary monetary and fiscal accommodation, combined with remarkably swift and successful action to blunt the threat of COVID-19, have carried financial markets for the last year-plus and we don’t think they’re finished yet. Doug Peta, CFA Chief US Investment Strategist dougp@bcaresearch.com Footnotes 1 Please see the September 24, 2018 US Investment Strategy Special Report, "When Will Higher Rates Hurt Stocks?", available at usis.bcaresearch.com.
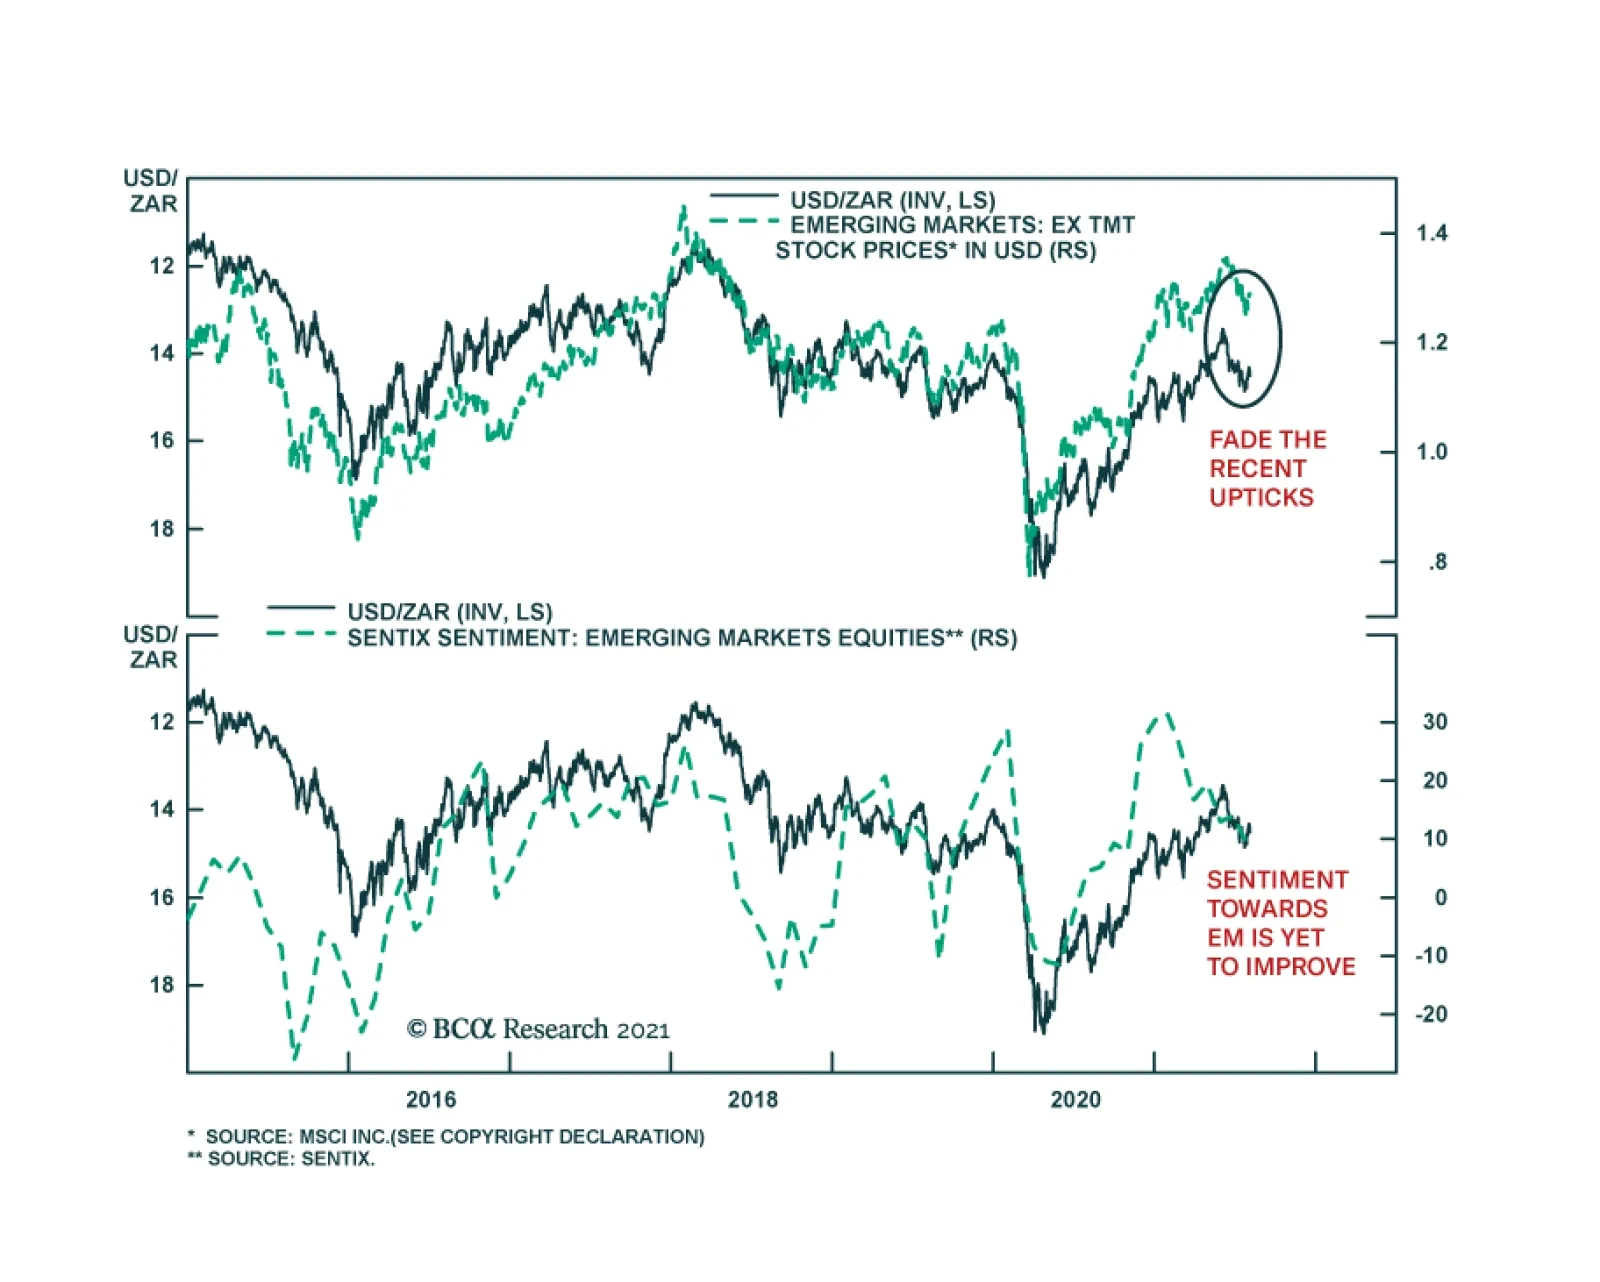
After surging earlier this year, the South African rand has been depreciating against the US dollar since the beginning of June. However, over the past two weeks, the ZAR has been strengthening vis-à-vis the greenback. The ZAR’s latest move coincides with a…
Highlights Investors have grown enamored with online retailers (AMZN), payment processing companies (V, MA, PYPL, SQ), and social media companies (FB, SNAP). All three sectors are likely to experience headwinds over the next 12 months as life returns to normal following the pandemic. Looking further out, market saturation, increased competition, and heightened regulation all pose risks to these sectors. Internet companies in general, and social media firms in particular, will face increased scrutiny not just for their monopolistic practices, but for the mental harm they are causing young people. Just like cigarettes are heavily regulated due to their addictive qualities, the same could happen to social media. We think there is a 50/50 chance that governments will start restricting social media usage only to adults over the age of 18 by the end of the decade, a move that could decimate the sector. Global Growth Will Remain Above Trend Investors are worried about growth again. Globally, the number of Covid cases is on the rise due to the proliferation of the Delta variant (Chart 1). The ISM manufacturing index dropped to 59.5 in July, down from a high of 64.7 in March. Both of China’s manufacturing PMIs have fallen, with the new orders component of the Caixin index dipping below the 50 line. The European PMIs have also come off their highs (Chart 2). Chart 1Number Of Covid Cases On The Rise Globally Due To The Delta Variant
These Three High-Flying Equity Sectors Could Come Crashing Back Down To Earth
These Three High-Flying Equity Sectors Could Come Crashing Back Down To Earth
Chart 2Manufacturing PMIs Are Off Their Highs
Manufacturing PMIs Are Off Their Highs
Manufacturing PMIs Are Off Their Highs
Growth concerns have registered in financial markets (Chart 3). After climbing to 1.74% in March, the US 10-year Treasury yield has fallen back to 1.22%. Cyclical equity sectors have underperformed defensives. Growth-sensitive currencies such as the Swedish krona and the Australian dollar have weakened. We are more upbeat about global growth prospects than the consensus. As the experience of the UK demonstrates, there is little will to impose lockdowns in countries with ample access to vaccines. Strict social distancing restrictions remain a fact of life in countries lacking adequate vaccine supplies. However, the situation should improve later this year as vaccine production increases (Chart 4). Chart 3Financial Markets Trim Growth Expectations
Financial Markets Trim Growth Expectations
Financial Markets Trim Growth Expectations
Chart 4Over 10 Billion Vaccine Doses Will Be Produced This Year
These Three High-Flying Equity Sectors Could Come Crashing Back Down To Earth
These Three High-Flying Equity Sectors Could Come Crashing Back Down To Earth
Households in developed economies are sitting on US$5 trillion in excess savings, half of which reside in the United States (Chart 5). Inventories are at record low levels, which should support production over the coming quarters (Chart 6). Chart 5Households Flush With Excess Savings
Households Flush With Excess Savings
Households Flush With Excess Savings
Chart 6Record Low Inventories Will Provide A Boost To Production
Record Low Inventories Will Provide A Boost To Production
Record Low Inventories Will Provide A Boost To Production
Chinese policy should turn more stimulative, as the recent cut to bank reserve requirements foreshadows. With credit growth back down to 2018 lows, policymakers can afford to give the economy some juice. The 6-month credit impulse has already turned up (Chart 7). From Goods To Services While global growth should remain well above trend for the next 12 months, the composition of that growth will shift in ways that could meaningfully affect equities. As Chart 8 illustrates, aggregate US consumption has returned to its pre-pandemic trend. However, spending on goods is 11% above trend while spending on services is still 6% below trend. Chart 7Chinese Policy Is Turning More Stimulative
Chinese Policy Is Turning More Stimulative
Chinese Policy Is Turning More Stimulative
Chart 8The Divergence Between Goods And Services Spending
The Divergence Between Goods And Services Spending
The Divergence Between Goods And Services Spending
Households typically cut spending on durable goods during recessions, while services serve as the ballast for the economy. The opposite happened during the pandemic. As the global economy recovers, goods spending will slow while services spending will stay robust. This is critical for online retailers such as Amazon, which derive the bulk of their e-commerce revenue from selling goods. Even after its disappointing Q2 earnings report, analysts still expect Amazon to grow e-commerce sales by 17% in 2022 (Chart 9). Such a goal may be difficult to achieve, given that core US retail sales currently stand 13% above their trendline (Chart 10). Chart 9AAnalysts’ Great Expectations May Be Dashed (I)
These Three High-Flying Equity Sectors Could Come Crashing Back Down To Earth
These Three High-Flying Equity Sectors Could Come Crashing Back Down To Earth
Chart 9BAnalysts’ Great Expectations May Be Dashed (II)
These Three High-Flying Equity Sectors Could Come Crashing Back Down To Earth
These Three High-Flying Equity Sectors Could Come Crashing Back Down To Earth
Chart 10AUS Retail Spending Is Well Above Trend (I)
US Retail Spending Is Well Above Trend (I)
US Retail Spending Is Well Above Trend (I)
Chart 10BUS Retail Spending Is Well Above Trend (II)
US Retail Spending Is Well Above Trend (II)
US Retail Spending Is Well Above Trend (II)
Chart 11Screen Time Is Moderating
These Three High-Flying Equity Sectors Could Come Crashing Back Down To Earth
These Three High-Flying Equity Sectors Could Come Crashing Back Down To Earth
If e-commerce spending slows, shares of payment processing companies could disappoint. Likewise, social media companies could suffer as people start going out more often. After spiking during the height of the pandemic, growth in data usage has returned to normal (Chart 11). Long-Term Risks Looking beyond the post-pandemic recovery, all three equity sectors face structural challenges that are not being fully discounted by investors. The first is market saturation. Close to three-quarters of US households have Amazon Prime accounts. Slightly over half have a Netflix account. Nearly 70% have a Facebook account. Google commands 92% of the internet search market. Together, Google and Facebook generate about 60% of all online advertising revenue. Competition is another challenge. Companies such as Amazon, Facebook, and Google dominate their respective markets. As they look for further growth, they will invariably invade each other’s turf. The result might benefit consumers, but it is unlikely to help the bottom line if it means more competitive pressures. Moreover, it is not just competition from within the tech industry that may disrupt incumbent firms. Consider payment processors. Like most other central banks, the Fed is planning to launch its own digital currency. Widely available, free-to-use Central Bank Digital Currencies (CBDCs) could thwart the ability of Visa and MasterCard to skim 2%-to-3% off of every transaction. Regulatory Pressures In recent years, tech companies have faced increased scrutiny over their alleged monopolistic practices. In contrast to Chinese tech firms, which have fallen under the thumb of the authorities, US companies have been able to evade harsh measures. Just last month, a US federal court judge dismissed a case filed by more than 40 state attorneys general arguing that Facebook’s acquisitions of Instagram and WhatsApp had harmed competition. In the past, evidence that companies were setting prices well above marginal costs could be used to build a case for anti-trust enforcement. Such cases are more difficult to argue today because so many online services are given away for free. Nevertheless, governments are likely to become more adept in pursuing regulatory actions. Rather than focusing simply on pricing policies, regulators are increasingly looking at the ways big tech companies use vendor data in the case of Amazon and user data in the case of Facebook and Google to maintain market dominance. Public contempt for tech companies is fueling a political backlash. According to a Gallup poll conducted earlier this year, only 34% of Americans held a favorable view of tech companies such as Amazon, Facebook, and Google, down from 46% in 2019; 45% had an unfavorable opinion, up from 33% in 2019. The shift in public sentiment over the past two years has been entirely driven by Independent and Republican voters, many of whom feel that tech companies are unfairly censoring their opinions (Table 1). The same poll revealed that the majority of Americans – including the majority of Republicans – now favor increased regulation of tech companies. Table 1American Views On Big Tech
These Three High-Flying Equity Sectors Could Come Crashing Back Down To Earth
These Three High-Flying Equity Sectors Could Come Crashing Back Down To Earth
A Drug Worse Than Nicotine? Social media companies are among the most loathed within the tech sector. A Pew Research Center study conducted last year revealed that more than six times as many Americans had a negative opinion of social media as a positive one (Chart 12). The public’s disdain for social media is increasingly going beyond traditional concerns over privacy. As psychologists Jonathan Haidt and Jean Twenge recently argued in the New York Times, there is growing evidence that the pervasive use of social media is harming the mental health of the nation’s youth. The share of students reporting high levels of loneliness has more than doubled in both the US and abroad over the past decade (Chart 13). Chart 12Social Media Increasingly Vilified
These Three High-Flying Equity Sectors Could Come Crashing Back Down To Earth
These Three High-Flying Equity Sectors Could Come Crashing Back Down To Earth
Chart 13Alone In The Crowd
These Three High-Flying Equity Sectors Could Come Crashing Back Down To Earth
These Three High-Flying Equity Sectors Could Come Crashing Back Down To Earth
In 2019, the last year for which comprehensive data is available, nearly a quarter of girls between the ages of 12 and 17 reported experiencing a major depressive episode over the prior year, up from 12% in 2011 (Chart 14). Academic studies have shown that adolescents who use Facebook and Instagram frequently feel greater anxiety and unease than those who do not. Just like cigarettes are heavily regulated due to their addictive qualities, the same could happen to social media. Facebook and most other social media companies already restrict access to those under the age of 13, although enforcement is generally spotty. We assign a 50/50 chance that governments start restricting social media usage only to adults over the age of 18 by the end of the decade, a move that could decimate the sector. Priced For Perfection The seven companies in the three high-flying sectors mentioned in this report trade at 91-times forward earnings compared to the S&P 500’s aggregate multiple of 22. They also trade at an average price-to-sales ratio of 16 compared to 3.2 for the broader market (Chart 15). Chart 14The Rise In Depression Rates Coincided With Increased Social Media Usage
These Three High-Flying Equity Sectors Could Come Crashing Back Down To Earth
These Three High-Flying Equity Sectors Could Come Crashing Back Down To Earth
Chart 15Trading At A High Multiple To Sales
These Three High-Flying Equity Sectors Could Come Crashing Back Down To Earth
These Three High-Flying Equity Sectors Could Come Crashing Back Down To Earth
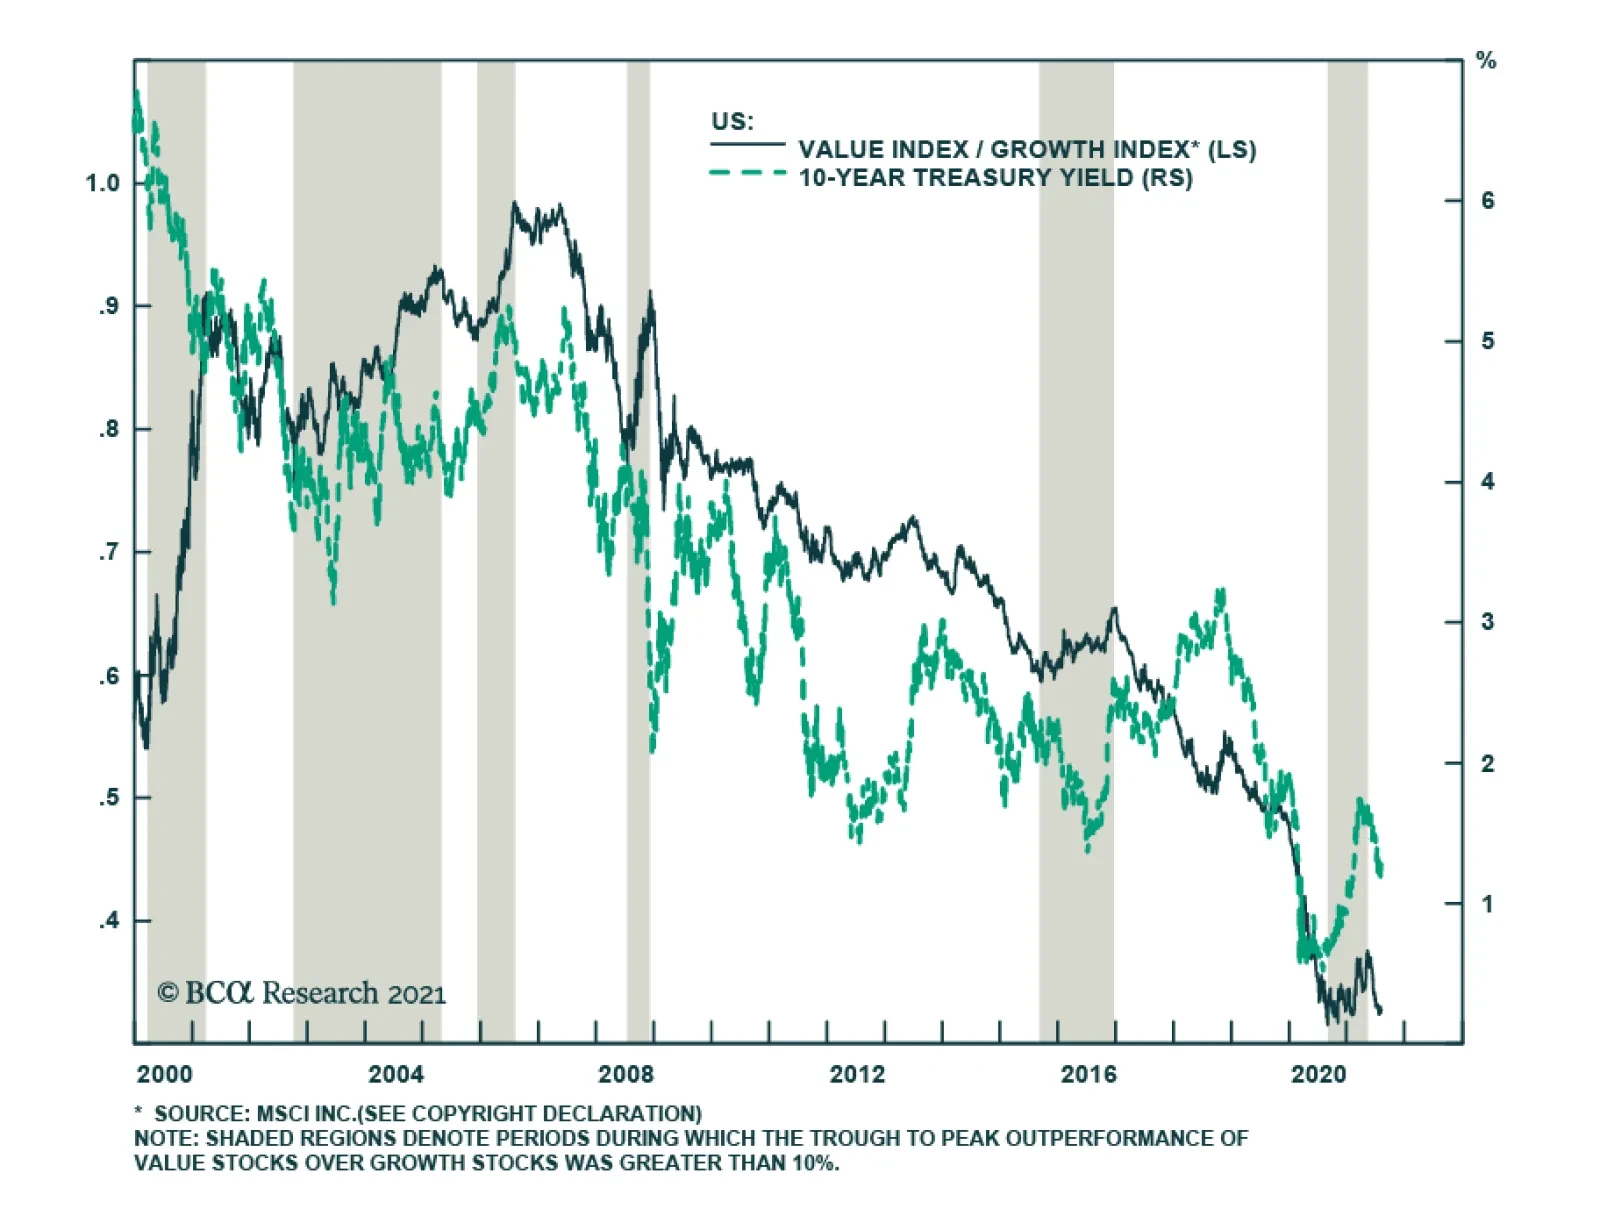
Such valuations can be justified only if these companies grow earnings-per-share by nearly 30% per year over the next five years, as analysts currently expect (Chart 16). However, as noted above, that may be too high a hurdle to clear. Higher bond yields represent another threat to valuations. Growth stocks are much more sensitive to changes in discount rates than value stocks. Chart 17show that tech stocks have generally outperformed the S&P 500 over the past four years whenever bond yields were falling. We expect bond yields to rebound over the coming months, with the 10-year yield rising to 1.8% by early next year. Tech is likely to lag the market in that environment. Chart 16Long-Term Growth Estimates May Be Too Optimistic For These High-Fliers
These Three High-Flying Equity Sectors Could Come Crashing Back Down To Earth
These Three High-Flying Equity Sectors Could Come Crashing Back Down To Earth
Chart 17Higher Bond Yields Could Hurt Tech Stocks
Higher Bond Yields Could Hurt Tech Stocks
Higher Bond Yields Could Hurt Tech Stocks
Trade Update Our long EM equity trade got stopped out last Tuesday before recouping some of its losses in subsequent days. We continue to expect EM stocks to bounce back later this year. That said, in keeping with this report, we see more upside for “traditional” EM sectors such as banks, industrials, energy, and materials than for EM tech (especially Chinese tech). Peter Berezin Chief Global Strategist pberezin@bcaresearch.com Global Investment Strategy View Matrix
These Three High-Flying Equity Sectors Could Come Crashing Back Down To Earth
These Three High-Flying Equity Sectors Could Come Crashing Back Down To Earth
Special Trade Recommendations
Image
Current MacroQuant Model Scores
These Three High-Flying Equity Sectors Could Come Crashing Back Down To Earth
These Three High-Flying Equity Sectors Could Come Crashing Back Down To Earth
Beats Remain Strong
Beats Remain Strong
With two thirds of the S&P 500 companies reported Q2-2021 earnings, it becomes abundantly clear that the US experienced a rigorous economic revival in the second quarter of this year. Combination of loose fiscal and monetary policy, economic reopening, pent up demand and well-to-do US consumer and global growth acceleration are just some of the factors underpinning robust top- and bottom-line growth. Analysts keep revising their forward estimates higher, not lower as earnings season was rolling on – a rather unusual phenomenon (see chart). Zooming into the sector data is also instructive. On the earnings’ front, the Consumer Discretionary and the Financials sectors are leading the market surprise factor higher with 31% and 25% growth respectively. 96% of the technology companies and 95% of the financial companies have beaten the analyst targets, suggesting that expectations were rather low despite the upgrades. In comparison, 78% and 73% of companies beating expectation in the Materials and Energy sectors, look measly. At the same time, Materials are the clear cyclical laggards with a surprise factor of 7%. These results are consistent with our equity investment themes: China slowdown: Underweight Materials as demand for metals is waning Consumers flush with cash: Overweight the Consumer Discretionary sector Rate stabilization: Overweight growth sectors and underweight value (growth sectors, such as Technology and Communications Services are ahead of the value sectors, such as Materials, Energy and Utilities) Economic growth peaking at the end of Q2-2021: Financials outperforming as geared to economic growth acceleration.
Beats Remain Strong
Beats Remain Strong
Bottom Line: With more than 2/3 of S&P 500 reported, the earnings season will likely finish on a high note.
Highlights China’s July Politburo meeting signaled that policy is unlikely to be overtightened. The Biden administration is likely to pass a bipartisan infrastructure deal – as well as a large spending bill by Christmas. Geopolitical risk in the Middle East will rise as Iran’s new hawkish president stakes out an aggressive position. US-Iran talks just got longer and more complicated. Europe’s relatively low political risk is still a boon for regional assets. However, Russia could still deal negative surprises given its restive domestic politics. Japan will see a rise in political turmoil after the Olympic games but national policy is firmly set on the path that Shinzo Abe blazed. Stay long yen as a tactical hedge. Feature Chart 1Rising Hospitalizations Cause Near-Term Jitters, But UK Rolling Over?
China’s Khodorkovsky Moment? And Other Questions From Clients
China’s Khodorkovsky Moment? And Other Questions From Clients
Our key view of 2021, that China would verge on overtightening policy but would retreat from such a mistake to preserve its economic recovery, looks to be confirmed after the Politburo’s July meeting opened the way for easier policy in the coming months. Meanwhile the Biden administration is likely to secure a bipartisan infrastructure package and push through a large expansion of the social safety net, further securing the American recovery. Growth and stimulus have peaked in both the US and China but these government actions should keep growth supported at a reasonable level and dispel disinflationary fears. This backdrop should support our pro-cyclical, reflationary trade recommendations in the second half of the year. Jitters continue over COVID-19 variants but new cases have tentatively peaked in the UK, US vaccinations are picking up, and death rates are a lot lower now than they were last year, that is, prior to widescale vaccination (Chart 1). This week we are taking a pause to address some of the very good client questions we have received in recent weeks, ranging from our key views of the year to our outstanding investment recommendations. We hope you find the answers insightful. Will Biden’s Infrastructure Bill Disappoint? Ten Republicans are now slated to join 50 Democrats in the Senate to pass a $1 trillion infrastructure bill that consists of $550 billion in new spending over a ten-year period (Table 1). The deal is not certain to pass and it is ostensibly smaller than Biden’s proposal. But Democrats still have the ability to pass a mammoth spending bill this fall. So the bipartisan bill should not be seen as a disappointment with regard to US fiscal policy or projections. The Republicans appear to have the votes for this bipartisan deal. Traditional infrastructure – including broadband internet – has large popular support, especially when not coupled with tax hikes, as is the case here. Both Biden and Trump ran on a ticket of big infra spending. However, political polarization is still at historic peaks so it is possible the deal could collapse despite the strong signs in the media that it will pass. Going forward, the sense of crisis will dissipate and Republicans will take a more oppositional stance. The Democratic Congress will pass President Joe Biden’s signature reconciliation bill this fall, another dollop of massive spending, without a single Republican vote (Chart 2). After that, fiscal policy will probably be frozen in place through at least 2025. Campaigning will begin for the 2022 midterm elections, which makes major new legislation unlikely in 2022, and congressional gridlock is the likely result of the midterm. Republicans will revert to belt tightening until they gain full control of government or a new global crisis erupts. Table 1Bipartisan Infrastructure Bill Likely To Pass
China’s Khodorkovsky Moment? And Other Questions From Clients
China’s Khodorkovsky Moment? And Other Questions From Clients
Chart 2Reconciliation Bill Also Likely To Pass
China’s Khodorkovsky Moment? And Other Questions From Clients
China’s Khodorkovsky Moment? And Other Questions From Clients
Chart 3Biden Cannot Spare A Single Vote In Senate
China’s Khodorkovsky Moment? And Other Questions From Clients
China’s Khodorkovsky Moment? And Other Questions From Clients
Hence the legislative battle over the reconciliation bill this fall will be the biggest domestic battle of the Biden presidency. The 2021 budget reconciliation bill, based on a $3.5 trillion budget resolution agreed by Democrats in July, will incorporate parts of the American Jobs Plan that did not pass via bipartisan vote (such as $436 billion in green energy subsidies), plus a large expansion of social welfare, the American Families Plan. This bill will likely pass by Christmas but Democrats have only a one-seat margin in the Senate, which means our conviction level must be medium, or subjectively about 65%. The process will be rocky and uncertain (Chart 3). Moderate Democratic senators will ultimately vote with their party because if they do not they will effectively sink the Biden presidency and fan the flames of populist rebellion. US budget deficit projections in Chart 4 show the current status quo, plus scenarios in which we add the bipartisan infra deal, the reconciliation bill, and the reconciliation bill sans tax hikes. The only significant surprise would be if the reconciliation bill passed shorn of tax hikes, which would reduce the fiscal drag by 1% of GDP next year and in coming years. Chart 4APassing Both A Bipartisan Infrastructure Bill And A Reconciliation Bill Cannot Avoid Fiscal Cliff In 2022 …
China’s Khodorkovsky Moment? And Other Questions From Clients
China’s Khodorkovsky Moment? And Other Questions From Clients
Chart 4B… The Only Major Fiscal Surprise Would Come If Tax Hikes Were Excluded From This Fall’s Reconciliation Bill
China’s Khodorkovsky Moment? And Other Questions From Clients
China’s Khodorkovsky Moment? And Other Questions From Clients
Chart 5Biden Stimulus Overshadowed By China Policy Tightening ... But China Is Now Marginally Easing
Biden Stimulus Overshadowed By China Policy Tightening ... But China Is Now Marginally Easing
Biden Stimulus Overshadowed By China Policy Tightening ... But China Is Now Marginally Easing
There are two implications. First, government support for the economy has taken a significant step up as a result of the pandemic and election in 2020. There is no fiscal austerity, unlike in 2011-16. Second, a fiscal cliff looms in 2022 regardless of whether Biden’s reconciliation bill passes, although the private economy should continue to recover on the back of vaccines and strong consumer sentiment. This is a temporary problem given the first point. Monetary policy has a better chance of normalizing at some point if fiscal policy delivers as expected. But the Federal Reserve will still be exceedingly careful about resuming rate hikes. President Biden could well announce that he will replace Chairman Powell in the coming months, delivering a marginally dovish surprise (otherwise Biden runs the risk that Powell will be too hawkish in 2022-23). Inflation will abate in the short run but remain a risk over the long run. Essentially the outlook for US equities is still positive for H2 but clouds are forming on the horizon due to peak fiscal stimulus, tax hikes in the reconciliation bill, eventual Fed rate hikes (conceivably 2022, likely 2023), and the fact that US and Chinese growth has peaked while global growth is soon to peak as well. All of these factors point toward a transition phase in global financial markets until economies find stable growth in the post-pandemic, post-stimulus era. Investors will buy the rumor and sell the news of Biden’s multi-trillion reconciliation bill in H2. The bill is largely priced out at the moment due to China’s policy tightening (Chart 5). The next section of this report suggests that China’s policy will ease on the margin over the coming 12 months. Bottom Line: US fiscal policy is delivering, not disappointing. Congress is likely to pass a large reconciliation bill by Christmas, despite no buffer in the Senate, because Democratic Senators know that the Biden presidency hangs in the balance. China’s Khodorkovsky Moment? Many clients have asked whether China’s crackdown on private business, from tech to education, is the country’s “Khodorkovsky moment,” i.e. the point at which Beijing converts into a full, autocratic regime where private enterprise is permanently impaired because it is subject to arbitrary seizure and control of the state. The answer is yes, with caveats. Yes, China’s government is taking a more aggressive, nationalist, and illiberal stance that will permanently impair private business and investor sentiment. But no, this process did not begin overnight and will not proceed in a straight line. There is a cyclical aspect that different investors will have to approach differently. First a reminder of the original Khodorkovsky moment. After the Soviet Union’s collapse, extremely wealthy oligarchs emerged who benefited from the privatization of state assets. When President Putin began to reassert the primacy of the state, he arbitrarily imprisoned Khodorkovsky and dismantled his corporate energy empire, Yukos, giving the spoils to state-owned companies. Russia is a petro state so Putin’s control of the energy sector would be critical for government revenues and strategic resurgence, especially at the dawn of a commodity boom. Both the RUB-USD and Russian equity relative performance performed mostly in line with global crude oil prices, as befits Russia’s economy, even though there was a powerful (geo)political risk premium injected during these two decades due to Russia’s centralization of power and clash with the West (Chart 6). Investors could tactically play the rallies after Khodorkovsky but the general trend depended on the commodity cycle and the secular rise of geopolitical risk. Chart 6Russia's 'Khodorkovsky Moment' Was A Geopolitical Turning Point...But Russian Assets Benefited From Oil Bull Market For A While Longer
Russia's 'Khodorkovsky Moment' Was A Geopolitical Turning Point...But Russian Assets Benefited From Oil Bull Market For A While Longer
Russia's 'Khodorkovsky Moment' Was A Geopolitical Turning Point...But Russian Assets Benefited From Oil Bull Market For A While Longer
President Xi Jinping is a strongman and hardliner, like Putin, but his mission is to prevent Communist China from collapsing like the Soviet Union, rather than to revive it from its ashes. To that end he must reassert the state while trying to sustain the country’s current high level of economic competitiveness. Since China is a complex economy, not a petro state, this requires the state-backed pursuit of science, technology, competitiveness, and productivity to avoid collapse. Therefore Beijing wants to control but not smother the tech companies. Hence there is a cyclical factor to China’s regulatory crackdown. A crackdown on President Xi Jinping’s potential rivals or powerful figures was always very likely to occur ahead of the Communist Party’s five-year personnel reshuffle in 2022, as we argued prior to tech exec Jack Ma’s disappearance. Sackings of high-level figures have happened around every five-year leadership rotation. Similarly a crackdown on the media was expected. True, the pre-party congress crackdowns are different this time around as they are targeted at the private sector, innovative businesses, tech, and social media. Nevertheless, as in the past, a policy easing phase will follow the tightening phase so as to preserve the economy and the mobilization of private capital for strategic purposes. The critical cyclical factor for global investors is China’s monetary and credit impulse. For example, the crackdown on the financial sector ahead of the national party congress in 2017 caused a global manufacturing slowdown because it tightened credit for the entire Chinese economy, reducing imports from abroad. One reason Chinese markets sold off so heavily this spring and summer, was that macroeconomic indicators began decelerating, leaving nothing for investors to sink their teeth into except communism. The latest Politburo meeting suggests that monetary, fiscal, and regulatory policy is likely to get easier, or at least stay just as easy, going forward (Table 2). Once again, the month of July has proved an inflection point in central economic policy. Financial markets can now look forward to a cyclical easing in regulation combined with easing in monetary and fiscal policy over the next 12-24 months. Table 2China’s Politburo Prepares To Ease Policy, Secure Recovery
China’s Khodorkovsky Moment? And Other Questions From Clients
China’s Khodorkovsky Moment? And Other Questions From Clients
Despite all of the above, for global investors with a lengthy time horizon, the government’s crackdown points to a secular rise of Communist and Big Government interventionism into the economy, with negative ramifications for China’s private sector, economic freedoms, and attractiveness as a destination for foreign investment. The arbitrary and absolutist nature of its advances will be anathema to long-term global capital. Also, social media, unlike other tech firms, pose potential sociopolitical risks and may not boost productivity much, whereas the government wants to promote new manufacturing, materials, energy, electric vehicles, medicine, and other tradable goods. So while Beijing cannot afford to crush the tech sector, it can afford to crush some social media firms. Chart 7China's Crackdown On Private Sector Reinforces Past Decade's Turn Away From Liberal Reform
China's Crackdown On Private Sector Reinforces Past Decade's Turn Away From Liberal Reform
China's Crackdown On Private Sector Reinforces Past Decade's Turn Away From Liberal Reform
China’s equity market profile looks conspicuously like Russia’s at the time of Khodorkovsky’s arrest (Chart 7). Chinese renminbi has underperformed the dollar on a multi-year basis since Xi Jinping’s rise to power, in line with falling export prices and slowing economic growth, as a result of economic structural change and the administration’s rolling back Deng Xiaoping’s liberal reform era. We expect a cyclical rebound to occur but we do not recommend playing it. Instead we recommend other cyclical plays as China eases policy, particularly in European equities and US-linked emerging markets like Mexico. Bottom Line: The twentieth national party congress in 2022 is a critical political event that is motivating a cyclical crackdown on potential rivals to Communist Party power. Chinese equities will temporarily bounce back, especially with a better prospect for monetary and fiscal easing. But over the long run global investors should stay focused on the secular decline of China’s economic freedoms and hence productivity. What Happened To The US-Iran Deal? Our second key view for 2021 was the US strategic rotation from the Middle East and South Asia to Asia Pacific. This rotation is visible in the Biden administration’s attempt to withdraw from Iraq and Afghanistan while rejoining the 2015 nuclear deal with Iran. However, Biden here faces challenges that will become very high profile in the coming months. The Biden administration failed to rejoin the 2015 deal under the outgoing leadership of the reformist President Hassan Rouhani. This means a new and much more difficult negotiation process will now begin that could last through Biden’s term or beyond. On August 5, President Ebrahim Raisi will take office with an aggressive flourish. The US is already blaming Iran for an act of sabotage in the Persian Gulf that killed one Romanian and one Briton. Raisi will need to establish that he is not a toady, will not cower before the West. The new Israeli government of Prime Minister Naftali Bennett also needs to demonstrate that despite the fall of his hawkish predecessor Benjamin Netanyahu, Jerusalem is willing and able to uphold Israel’s red lines against Iranian nuclear weaponization and regional terrorism. Hence both Iran and its regional rivals, including Saudi Arabia, will rattle sabers and underscore their red lines. The Persian Gulf and Strait of Hormuz will be subject to threats and attacks in the coming months that could escalate dramatically, posing a risk of oil supply disruptions. Given that the Iranians ultimately do want a deal with the Americans, the pressure should be low-to-medium level and persistent, hence inflationary, as opposed to say a lengthy shutdown of the Strait of Hormuz that would cause a giant spike in prices that ultimately kills global demand. Short term, the US attempt to reduce its commitments in Iraq and Afghanistan will invite US enemies to harass or embarrass the Biden administration. The Taliban is likely to retake control of Afghanistan. The US exit will resemble Saigon in 1975. This will be a black eye for the Biden administration. But public opinion and US grand strategy will urge Biden to be rid of the war. So any delays, or a decision to retain low-key sustained troop presence, will not change the big picture of US withdrawal. Long term, Biden needs to pivot to Asia, while President Raisi is ultimately subject to the Supreme Leader Ali Khamenei, who wants to secure Iran’s domestic stability and his own eventual leadership succession. Rejoining the 2015 nuclear deal leads to sanctions relief, without requiring total abandonment of a nuclear program that could someday be weaponized, so Iran will ultimately agree. The problem will then become the regional rise of Iranian power and the balancing act that the US will have to maintain with its allies to keep Iran contained. Bottom Line: The risk to oil prices lies to the upside until a US-Iran deal comes together. The US and Iran still have a shared interest in rejoining the 2015 deal but the time frame is now delayed for months if not years. We still expect a US-Iran deal eventually but previously we had anticipated a rapid deal that would put downward pressure on oil prices in the second half of the year. What Comes After Biden’s White Flag On Nord Stream II? Our third key view for 2021 highlighted Europe’s positive geopolitical and macro backdrop. This view is correct so far, especially given that China’s policymakers are now more likely to ease policy going forward. But Russia could still upset the view. Italy has been the weak link in European integration over the past decade (excluding the UK). So the national unity coalition that has taken shape under Prime Minister Mario Draghi exemplifies the way in which political risks were overrated. Italy is now the government that has benefited the most from the overall COVID crisis in public opinion (Chart 8). The same chart shows that the German government also improved its public standing, although mostly because outgoing Chancellor Angela Merkel is exiting on a high note. Her Christian Democrat-led coalition has not seen a comparable increase in support. The Greens should outperform their opinion polling in the federal election on September 26. But the same polling suggests that the Greens will be constrained within a ruling coalition (Chart 9). The result will be larger spending without the ability to raise taxes substantially. Markets will cheer a fiscally dovish and pro-European ruling coalition. Chart 8European Political Risk Limited, But Rising, Post-COVID
China’s Khodorkovsky Moment? And Other Questions From Clients
China’s Khodorkovsky Moment? And Other Questions From Clients
The chief risk to this view of low EU political risk comes from Russia. Russia is a state in long-term decline due to the remorseless fall in fertility and productivity. The result has been foreign policy aggression as President Putin attempts to fortify the country’s strategic position and frontiers ahead of an even bleaker future. Chart 9German Election Polls Point To Gridlock?
German Election Polls Point To Gridlock?
German Election Polls Point To Gridlock?
Now domestic political unrest has grown after a decade of policy austerity and the COVID-19 pandemic. Elections for the Duma will be held on September 19 and will serve as the proximate cause for Russia’s next round of unrest and police repression. Foreign aggressiveness may be used to distract the population from the pandemic and poor economy. We have argued that there would not be a diplomatic reset for the US and Russia on par with the reset of 2009-11. We stand by this view but so far it is facing challenges. Putin did not re-invade Ukraine this spring and Biden did not impose tough sanctions canceling the construction of the Nord Stream II gas pipeline to Germany. Russia is tentatively cooperating on the US’s talks with Iran and withdrawal from Afghanistan. The US gave Germany and Russia a free point by condoning the NordStream II. Now the US will expect Germany to take a tough diplomatic line on Russian and Chinese aggression, while expecting Russia to give the US some goodwill in return. They may not deliver. The makeup of the new German coalition will have some impact on its foreign policy trajectory in the coming years. But the last thing that any German government wants is to be thrust into a new cold war that divides the country down the middle. Exports make up 36% of German output, and exports to the Russian and Chinese spheres account for a substantial share of total exports (Chart 10). The US administration prioritizes multilateralism above transactional benefits so the Germans will not suffer any blowback from the Americans for remaining engaged with Russia and China, at least not anytime soon. Russia, on the other hand, may feel a need to seize the moment and make strategic gains in its region, despite Biden’s diplomatic overtures. If the US wraps up its forever wars, Russia’s window of opportunity closes. So Russia may be forced to act sooner rather than later, whether in suppressing domestic dissent, intimidating or attacking its neighbors, or hacking into US digital networks. In the aftermath of the German and Russian elections, we will reassess the risk from Russia. But our strong conviction is that neither Russian nor American strategy have changed and therefore new conflicts are looming. Therefore we prefer developed market European equities and we do not recommend investors take part in the Russian equity rally. Chart 10Germany Opposes New Cold War With Russia Or China
China’s Khodorkovsky Moment? And Other Questions From Clients
China’s Khodorkovsky Moment? And Other Questions From Clients
Bottom Line: German and European equities should benefit from global vaccination, Biden’s fiscal and foreign policies, and China’s marginal policy easing (Chart 11). Eastern European emerging markets and Russian assets are riskier than they appear because of latent geopolitical tensions that could explode around the time of important elections in September. Chart 11Geopolitical Tailwinds To European Equities
Geopolitical Tailwinds To European Equities
Geopolitical Tailwinds To European Equities
What Comes After The Olympics In Japan? Japan is returning to an era of “revolving door” prime ministers. Prime Minister Yoshihide Suga’s sole purpose was to tie up the loose ends of the Shinzo Abe administration, namely by overseeing the Olympics. After the games end, he will struggle to retain leadership of the Liberal Democratic Party. He will be blamed for spread of Delta variant even if the Olympics were not a major factor. If he somehow retains the party’s helm, the October general election will still be an underwhelming performance by the Liberal Democrats, which will sow the seeds of his downfall within a short time (Chart 12). Suga will need to launch a new fiscal spending package, possibly as an election gimmick, and his party has the strength in the Diet to push it through quickly, which will be favorable for the economy. For the elections the problem is not the Liberal Democrats’ popularity, which is still leagues above the nearest competitor, but rather low enthusiasm and backlash over COVID. Abe’s retirement, and the eventual fall of Abe’s hand-picked deputy, does not entail the loss of Abenomics. The Bank of Japan will retain its ultra-dovish cast at least until Haruhiko Kuroda steps down in 2023. The changes that occurred in Japan from 2008-12 exemplified Japan’s existence as an “earthquake society” that undergoes drastic national changes suddenly and rapidly. The paradigm shift will not be reversed. The drivers were the Great Recession, the LDP’s brief stint in the political wilderness, the Tohoku earthquake and Fukushima nuclear crisis, and the rise of China. The BoJ became ultra-dovish and unorthodox, the LDP became more proactive both at home and abroad. The deflationary economic backdrop and Chinese nationalism are still a powerful impetus for these trends to continue – as highlighted by increasingly alarming rhetoric by Japanese officials, including now Shinzo Abe himself, regarding the Chinese military threat to Taiwan. In other words, Suga’s lack of leadership will not stand even if he somehow stays prime minister into 2022. The Liberal Democrats have several potential leaders waiting in the wings and one of these will emerge, whether Yuriko Koike, Shigeru Ishiba, or Shinjiro Koizumi, or someone else. The popular and geopolitical pressures will force the Liberal Democrats and various institutions to continue providing accommodation to the economy and bulking up the nation’s defenses. This will require the BoJ to stay easier for longer and possibly to roll out new unorthodox policies, as with yield curve control in the 2010s. Japan has some of the highest real rates in the G10 as a result of very low inflation expectations and a deeply negative output gap (Chart 13). Abenomics was bearing fruit, prior to COVID-19, so it will be justified to stay the course given that deflation has reemerged as a threat once again. Chart 12Japan: Back To Revolving Door Of Prime Ministers
China’s Khodorkovsky Moment? And Other Questions From Clients
China’s Khodorkovsky Moment? And Other Questions From Clients
Chart 13Japan To Keep Fighting Deflation Post-Abe
Japan To Keep Fighting Deflation Post-Abe
Japan To Keep Fighting Deflation Post-Abe
Bottom Line: The political and geopolitical backdrop for Japan is clear. The government and BoJ will have to do whatever it takes to stay the course on Abenomics even in the wake of Abe and Suga. Prime ministers will come and go in rapid succession, like in past eras of political turmoil, but the trajectory of national policy is set. We would favor JGBs relative to more high-beta government bonds like American and Canadian. Given deflation, looming Japanese political turmoil, and the secular rise in geopolitical risk, we continue to recommend holding the yen. These views conform with those of BCA’s fixed income and forex strategists. Investment Takeaways China’s policymakers are backing away from the risk of overtightening policy this year. Policy should ease on the margin going forward. Our number one key forecast for 2021 is tentatively confirmed. Base metals are still overextended but global reflation trades should be able to grind higher. The US fiscal spending orgy will continue through the end of the year via Biden’s reconciliation bill, which we expect to pass. Proactive DM fiscal policy will continue to dispel disinflationary fears. Sparks will fly in the Middle East. The US-Iran negotiations will now be long and drawn out with occasional shows of force that highlight the tail risk of war. We expect geopolitics to add a risk premium to oil prices at least until the two countries can rejoin the 2015 nuclear deal. Germany’s Green Party will surprise to the upside in elections, highlighting Europe’s low level of geopolitical risk. China policy easing is positive for European assets. Russia’s outward aggressiveness is the key risk. Matt Gertken Vice President Geopolitical Strategy mattg@bcaresearch.com

Weekly Performance Update For the week ending Thu Aug 05, 2021 The Market Monitor displays the trailing 1-quarter performance of strategies based around the BCA Score. For each region, we construct an equal-weighted, monthly rebalanced portfolio consisting of the top 3 stocks per sector and compare it with the regional benchmark. For each portfolio, we show the weekly performance of individual holdings in the Top Contributors/Detractors table. In addition, the Top Prospects table shows the holdings that currently have the highest BCA Score within the portfolio. For more details, click the region headers below to be redirected to the full historical backtest for the strategy. BCA US Portfolio
Market Monitor (Aug 5, 2021)
Market Monitor (Aug 5, 2021)
Total Weekly Return BCA US Portfolio S&P500 TRI 0.16% 0.24% Top Contributors IT:US ANAT:US IPG:US TX:US DELL:US Weekly Return 37 bps 17 bps 13 bps 7 bps 5 bps Top Detractors EOG:US SCCO:US EPD:US COKE:US GPC:US Weekly Return -12 bps -12 bps -11 bps -10 bps -9 bps Top Prospects TX:US SC:US ESGR:US SIM:US MPLX:US BCA Score 98.74% 97.90% 97.72% 95.28% 95.08% BCA Canada Portfolio
Market Monitor (Aug 5, 2021)
Market Monitor (Aug 5, 2021)
Total Weekly Return BCA Canada Portfolio S&P/TSX TRI -0.66% 0.34% Top Contributors DCBO:CA CSU:CA LNF:CA RUS:CA L:CA Weekly Return 23 bps 13 bps 12 bps 10 bps 6 bps Top Detractors POU:CA CS:CA PXT:CA QBR.A:CA TOU:CA Weekly Return -30 bps -27 bps -18 bps -17 bps -15 bps Top Prospects CS:CA ELF:CA CFP:CA TOU:CA PXT:CA BCA Score 99.08% 97.59% 97.07% 95.45% 94.41% BCA UK Portfolio
Market Monitor (Aug 5, 2021)
Market Monitor (Aug 5, 2021)
Total Weekly Return BCA UK Portfolio FTSE 100 TRI 1.51% 0.71% Top Contributors MXCT:GB EMG:GB SXS:GB GROW:GB DOTD:GB Weekly Return 27 bps 24 bps 21 bps 20 bps 19 bps Top Detractors BAKK:GB DRX:GB RIO:GB DEC:GB RMG:GB Weekly Return -23 bps -14 bps -12 bps -7 bps -5 bps Top Prospects SVST:GB VVO:GB NLMK:GB POLR:GB CTH:GB BCA Score 99.35% 98.65% 96.88% 96.06% 95.95% BCA Eurozone Portfolio
Market Monitor (Aug 5, 2021)
Market Monitor (Aug 5, 2021)
Total Weekly Return BCA EMU Portfolio MSCI EMU TRI 1.14% 1.26% Top Contributors HLAG:DE ERF:FR ARTO:FR ALESK:FR VGP:BE Weekly Return 48 bps 40 bps 28 bps 19 bps 14 bps Top Detractors FDJ:FR FLUX:BE TFI:FR ROTH:FR STR:AT Weekly Return -16 bps -13 bps -10 bps -8 bps -7 bps Top Prospects STR:AT FDJ:FR IPS:FR EDNR:IT TFI:FR BCA Score 98.58% 98.38% 98.08% 97.05% 96.87% BCA Japan Portfolio
Market Monitor (Aug 5, 2021)
Market Monitor (Aug 5, 2021)
Total Weekly Return BCA Japan Portfolio TOPIX TRI -1.12% 0.08% Top Contributors 4694:JP 5021:JP 8595:JP 7716:JP 8630:JP Weekly Return 20 bps 15 bps 8 bps 8 bps 7 bps Top Detractors 1419:JP 3459:JP 2208:JP 9945:JP 2124:JP Weekly Return -40 bps -25 bps -24 bps -15 bps -11 bps Top Prospects 9436:JP 6960:JP 2208:JP 5930:JP 4966:JP BCA Score 99.88% 99.75% 99.73% 99.55% 99.02% BCA Hong Kong Portfolio
Image
Total Weekly Return BCA Hong Kong Portfolio Hang Seng TRI 1.06% -0.42% Top Contributors 316:HK 6118:HK 691:HK 973:HK 98:HK Weekly Return 48 bps 33 bps 20 bps 15 bps 12 bps Top Detractors 1083:HK 3799:HK 990:HK 148:HK 590:HK Weekly Return -16 bps -14 bps -12 bps -10 bps -5 bps Top Prospects 1277:HK 98:HK 215:HK 691:HK 2877:HK BCA Score 99.96% 98.79% 98.24% 97.99% 97.44% BCA Australia Portfolio
Market Monitor (Aug 5, 2021)
Market Monitor (Aug 5, 2021)
Total Weekly Return BCA Australia Portfolio S&P/ASX All Ord. TRI 0.19% 1.10% Top Contributors MAQ:AU OCL:AU JLG:AU BLX:AU EZL:AU Weekly Return 36 bps 26 bps 20 bps 19 bps 16 bps Top Detractors GRR:AU MGX:AU MHJ:AU MAU:AU IDX:AU Weekly Return -61 bps -34 bps -26 bps -22 bps -14 bps Top Prospects MGX:AU GRR:AU MHJ:AU BFG:AU EZL:AU BCA Score 99.48% 99.45% 99.25% 97.33% 96.44%
In yesterday’s Sector Insight report we looked at the implications of the termination of the US national eviction ban. However, just as we went to print, the news has hit the tape that the CDC announced a new 60-day eviction moratorium in the areas with high levels of COVID-19 infections. These areas, covered by the eviction ban, account for 80% of the US counties and 90% of the US population. De facto, this moratorium is national, just as the one before. While there are doubts about the legitimacy of this new law, it will take a while to dispute it in courts. Also, while time will tell if there are extensions of this eviction ban, for now, all the benefits of ending the moratorium that we outlined in the previous report, are on hold.
Highlights Advances in tennis, swimming and the high jump came from challenging the ‘best practices’, and finding better ways of doing these things. The pandemic has challenged the best practices on how we should work, do business, and shop, catalysing better ways of doing these things. The productivity boom could be a super-boom because the current disruption is not in just one sector but across the entire economy. A productivity super-boom means that the economy will take longer to reabsorb the unemployed, and that structural inflation will stay depressed. This means that interest rate hikes will be much later and much shallower than the market is pricing. For equity investors, a productivity super-boom plus the market’s overestimation of Fed rate hikes structurally favours growth sectors versus value sectors. Thereby, it also structurally favours the S&P500 versus the Eurostoxx50. Fractal analysis: stocks versus bonds remains fragile, and the rally in tin is very fragile. Feature Chart of the WeekThe Pandemic Has Catalysed A Productivity Boom
The Pandemic Has Catalysed A Productivity Boom
The Pandemic Has Catalysed A Productivity Boom
“I believe that the (Fosbury) flop was a natural style and I was just the first to find it” – Dick Fosbury, on how he revolutionised the high jump Watching the Tokyo Olympics, the flurry of new world records reassures us that human athletic productivity continues to advance. It does so in three ways: better biology, better technology, and better ways of doing the same thing. Better biology comes from advances in nutrition and healthcare – at least, for those that embrace the advances. Better technology means better equipment. For example, more ergonomic bikes, sharkskin-like swimwear that minimises water resistance, and running shoes that re-channel energy back into the legs. Albeit this raises the contentious issue that technological advances are giving some athletes an unfair and unnatural advantage. Case in point, World Athletics (and the Tokyo Olympics) have banned prototype versions of Nike’s Vaporfly running shoe that was used by Eliud Kipchoge to run the first sub-two hour marathon. The banned prototype shoe, containing triple carbon plates inside thick ultra-compressed foam, is claimed to improve running economy by up to four percent. But if technological advances are giving some athletes an advantage, it follows that they must also be giving some firms and economies an advantage. While this is unfair in sporting competition, it is fair in economic competition. An important implication is that firms and economies that embrace disruptive technologies and innovations – such as working from home – are likely to generate superior long-term productivity growth than firms and economies that do not. Productivity Growth Comes From Finding Better Ways Of Doing The Same Thing Yet, looking at the longer-term ‘productivity growth’ in sport, many of the greatest advances have come not from better biology or better technology, but just from finding better ways of doing the same thing. Tennis, swimming, and athletics provide three excellent examples of such innovation. A tennis ball weighs just 50 grams, so anybody can hit a tennis ball hard. The difficult part is hitting the ball hard and landing it within the 78 foot court. In the 1970s, Bjorn Borg revolutionised tennis by hitting with aggressive topspin on both the forehand and backhand as well as the serve. Meaning that rather than having to approach the net as was the ‘best practice’, Borg could win matches from the baseline. All it required was a different way of holding the racket and using his arms (Figure I-1). Figure I-1Challenging The Best Practice In Tennis Boosted Its Productivity
What The Olympics Teaches Us About Productivity Growth
What The Olympics Teaches Us About Productivity Growth
Borg’s revolution has a fascinating backstory. Borg’s father, a table tennis champion, won a tennis racket in a table tennis tournament and gave it to the 9-year old Bjorn. Familiar with table tennis and now armed with a tennis racket, the young Borg’s revolution was to play tennis as if it were table tennis – with its trademark topspin on both wings as well as the serve – albeit on a much bigger ‘table.’ And with a racket that was far too heavy for him that he held with both hands. (He eventually switched to a one-handed forehand but kept his two-handed backhand.) Go back a hundred years, and swimming experienced a similar revolution. Until the 1870s, the best practice for European swimmers was the highly inefficient breaststroke. But in 1873, John Arthur Trudgen emulated the technique used by Native Americans whereby the arms moved in a crawl. Later, the Australian Fred Cavill also emulated the Natives’ flutter kick, and thus made mainstream the front crawl, which has significantly increased swimming speed, or swimming ‘productivity.’ All it required was a different way of moving our arms and legs. But probably the greatest example of athletic innovation came in the 1968 Mexico Olympics, when Dick Fosbury turned the standard high jumping technique on its head – or, more precisely, on its back – to win the gold medal and smash the world record. Prior to the 1968 Games, the best practice high jump technique had been the ‘straddle’ which involved jumping forward, twisting the body to navigate the bar, and then landing on your feet. Fosbury changed all that forever. He jumped backwards off the wrong foot, arched his back over the bar, and landed on his back (Figure I-2). Figure I-2Challenging The Best Practice In The High Jump Boosted Its Productivity
What The Olympics Teaches Us About Productivity Growth
What The Olympics Teaches Us About Productivity Growth
Just like the tennis topspin and swimming’s front crawl, high jump’s ‘Fosbury flop’ has become the mainstream technique in the sport, taking performance and ‘productivity’ literally to new highs. And just like the tennis topspin and swimming’s front crawl, all it required was a different way of using our existing resources – in this case, jumping backwards rather than forwards. Yet in the case of the innovative Fosbury flop, something else also played an important role – a new environment. Until the 1960s, high jumpers cleared the bar and landed on sawdust, sand, or thin mats. Hence, any innovation in high jump techniques was constrained by having to land on your feet. This changed when Fosbury’s high school became one of the first to install deep foam matting for high jump landing. The Fosbury flop could not have been innovated before the introduction of deep foam matting, because jumping backwards and landing on your back depended on the existence of a soft foam mat for a safe landing. The crucial lesson is that a new environment gives us a chance to challenge beliefs on ‘how things should be done’, a chance to discover new ways of doing the same thing differently, and better. To challenge beliefs on how things should be done, what bigger change in the environment can there be than a global pandemic? The Pandemic Has Catalysed Better Ways Of Doing The Same Thing Just like athletic productivity growth, economic productivity growth comes from better biology (which improves both our physical and intellectual capacity), better technology, and finding better ways of doing the same thing. Of these three drivers, the first two are continuous processes but the third, finding better ways of doing the same thing, gets a massive boost from disruptive changes in the environment such as recessions (Chart of the Week and Chart I-2). Chart I-2Productivity Surges After Recessions
Productivity Surges After Recessions
Productivity Surges After Recessions
In this regard, any technology that is required already generally exists, but the recession is the necessary catalyst for its wholesale adoption. For example, the mass manufacturing of autos already existed well before the Great Depression, but the Depression was the catalyst for its wholesale adoption. Likewise, word processors existed well before the dot com bust, but the 2000 recession was what finally killed the office typing pool. In the same way, the technology for online shopping and remote meetings has been around for years, but it is the pandemic that has catalysed its wholesale adoption (Chart I-3). Chart I-3The Pandemic Has Accelerated The Shift To Online
What The Olympics Teaches Us About Productivity Growth
What The Olympics Teaches Us About Productivity Growth
As Fosbury said, he was just the first to find a more natural style of high jumping, yet it required a change of environment to challenge the best practice. Similarly, it has taken a global pandemic for us to challenge the best practice on how we should work, do business, shop, and interact (Chart I-4). Chart I-4The Pandemic Has Accelerated The Shift To Online
What The Olympics Teaches Us About Productivity Growth
What The Olympics Teaches Us About Productivity Growth
It is sub-optimal to work in the office or to shop in-person all the time. It is also sub-optimal to do these things remotely all the time. The optimal way is some hybrid of in-person and remote interactions, which will clearly differ for each person. But the pandemic has given us the opportunity to find this more natural and better way, and thereby to give our productivity a massive boost (Chart I-5). Chart I-5The Pandemic Has Challenged The Best Practice On How To Work
What The Olympics Teaches Us About Productivity Growth
What The Olympics Teaches Us About Productivity Growth
The productivity boom could be a super-boom because the current disruption has forced us all to find better ways of doing things. This differentiates the current episode from previous post-recession periods where transformations were focussed in one sector. For example, the 80s recession reshaped manufacturing, the dot com bust changed the technology sector, and the 2008 recession transformed the financial sector. By comparison, the current transformation is penetrating the entire economy. The Investment Conclusion A productivity super-boom carries two important implications for policymakers. It will take longer for the economy to reabsorb the unemployed, and it will keep structural inflation depressed. This means that interest rate hikes will be much later and much shallower than the market is pricing (Chart I-6 and Chart I-7). Chart I-6Rate Hikes Will Be Later Than The Market Is Pricing
Rate Hikes Will Be Later Than The Market Is Pricing
Rate Hikes Will Be Later Than The Market Is Pricing
Chart I-7Rate Hikes Will Be Shallower Than The Market Is Pricing
Rate Hikes Will Be Shallower Than The Market Is Pricing
Rate Hikes Will Be Shallower Than The Market Is Pricing
The investment conclusion is to buy any of the US interest rate futures that expire from December 2022 out to June 2024. The earlier contracts have the higher probabilities of expiring in profit while the later contracts have the greater potential upside. An alternative expression is to buy the 30-year T-bond, or to go long the 30-year T-bond versus the 30-year German bund. For equity investors, a productivity super-boom plus the market’s overestimation of Fed rate hikes structurally favours growth sectors versus value sectors. Thereby, it also structurally favours the S&P500 versus the Eurostoxx50. Fractal Analysis Update Global stocks versus bonds (MSCI All Country World versus 30-year T-bond) continue to exhibit the fragility on the 260-day fractal structure that started in mid-March. Since then, and consistent with this fragility, global stocks have underperformed bonds by 6 percent (Chart I-8). Chart I-8Stocks Versus Bonds Remains Fractally Fragile
Stocks Versus Bonds Remains Fractally Fragile
Stocks Versus Bonds Remains Fractally Fragile
But fragility on a 260-day fractal structure implies elevated risk of a reversal through at least the following six months. On this basis, our recommendation is to remain, at most, neutral to global stocks versus bonds through the summer. Among recent trades, short corn versus wheat, and short marine transportation versus market achieved their profit targets of 12 percent and 16.5 percent respectively, but short Austria versus Chile, and short lead versus platinum hit their stop-losses of 7 percent and 6.4 percent respectively. The 6-month win ratio stands at a very pleasing 71 percent. This week’s recommended trade is to reinitiate the stopped-out metals pair-trade in a modified expression – short tin versus platinum – given the very fragile 130-day and 260-day fractal structure (Chart I-9). Set the profit target and symmetrical stop-loss at 16.5 percent. Chart I-9Tin Is Fractally Fragile
Tin Is Fractally Fragile
Tin Is Fractally Fragile
Dhaval Joshi Chief Strategist dhaval@bcaresearch.com Fractal Trading System Fractal Trades 6-Month Recommendations Structural Recommendations Closed Fractal Trades Closed Trades Asset Performance Equity Market Performance Indicators To Watch - Bond Yields Chart II-1Indicators To Watch - Bond Yields ##br##- Euro Area
Indicators To Watch - Bond Yields - Euro Area
Indicators To Watch - Bond Yields - Euro Area
Chart II-2Indicators To Watch - Bond Yields ##br##- Europe Ex Euro Area
Indicators To Watch - Bond Yields - Europe Ex Euro Area
Indicators To Watch - Bond Yields - Europe Ex Euro Area
Chart II-3Indicators To Watch - Bond Yields ##br##- Asia
Indicators To Watch - Bond Yields - Asia
Indicators To Watch - Bond Yields - Asia
Chart II-4Indicators To Watch - Bond Yields ##br##- Other Developed
Indicators To Watch - Bond Yields - Other Developed
Indicators To Watch - Bond Yields - Other Developed
Indicators To Watch - Interest Rate Expectations Chart II-5Indicators To Watch - Interest Rate Expectations
Indicators To Watch - Interest Rate Expectations
Indicators To Watch - Interest Rate Expectations
Chart II-6Indicators To Watch - Interest Rate Expectations
Indicators To Watch - Interest Rate Expectations
Indicators To Watch - Interest Rate Expectations
Chart II-7Indicators To Watch - Interest Rate Expectations
Indicators To Watch - Interest Rate Expectations
Indicators To Watch - Interest Rate Expectations
Chart II-8Indicators To Watch - Interest Rate Expectations
Indicators To Watch - Interest Rate Expectations
Indicators To Watch - Interest Rate Expectations